Embed Size (px)
Citation preview

Two Complementary EVM Cost-Risk Models – Part 2
1. Use of EVM Trend Tool (EVMTT) to Forecast Cost Risks with 4 Case Study Examples
2. Integrated Cost-Risk Model (ICRM)Utilizing ACEIT
for9 Sep 15 SoCal ICEAA Workshop
David R. GrahamConsultant
Salient Federal Solutions & Galorath Federal SystemsCarlsbad, CA
Outline
• EVMTT Acknowledgements
• Basic Objectives of EVMTT Analysis
• Research Nature of 4 Case Studies
• Dr. Roy Smoker (MCR) 2011 Paper Main Points
• 2 Case Study Results (other 2 are in backup)
• Conclusions
• Integrated Cost-Risk Model Utilizing ACEIT
Use of EVM Trends to Forecast Cost Risks
Dr. Roy Smoker*MCR [email protected]
(Other Charts Added by David R. Graham)
Original Presentation at2011 ISPA/SCEA Conference, Albuquerque, NM
(C)2011 MCR, LLC
*Roy E. Smoker (2011): Use of Earned Value Management Trends to Forecast CostRisks, Journal of Cost Analysis and Parametrics, 4:1, 31-51

EVM Trend Tool (EVMTT)
• Programmed gratis in Excel by Michael Butterworth, now retired from TASC, for SoCal SCEA/ISPA (now SoCal ICEAA)– Based on Dr. Smoker’s paper
• Available for use at no charge
• MCR has approved its use by any program only requests that they be given credit for the approach and that any program using the EVM Trend Tool asks them for permission to use it– Contact MCR CEO Neil Albert [email protected]
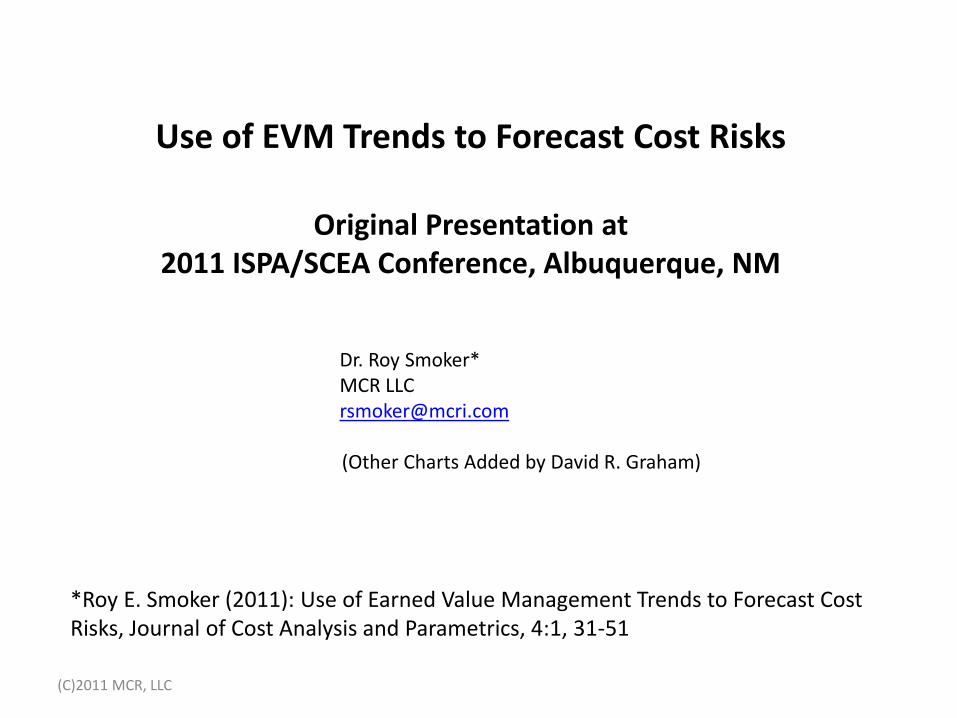
Basic Objectives of EVMTT Analysis
• Utilize rate-of-growth in BCWSCUM , BCWPCUM , BAC & LRE in monthly linear regression projections
• Utilize the rate of BAC growth on – BAC projections at month of analysis & at completion
– %-Complete based on more conservative estimate of end-of-contract BAC
– Early projection of completion date
• Linear regression & Earned Schedule approaches
• Identify a contrast between EVMTT results & contractor positions for further action e.g., apply ACEIT Integrated Cost-Risk Model (ICRM)
• Provide a 25,000 foot view of program performance– Needs complementary, WBS-level view e.g., ICRM, to identify lower-level cost-
risk impacts that may be getting hidden at program level
5
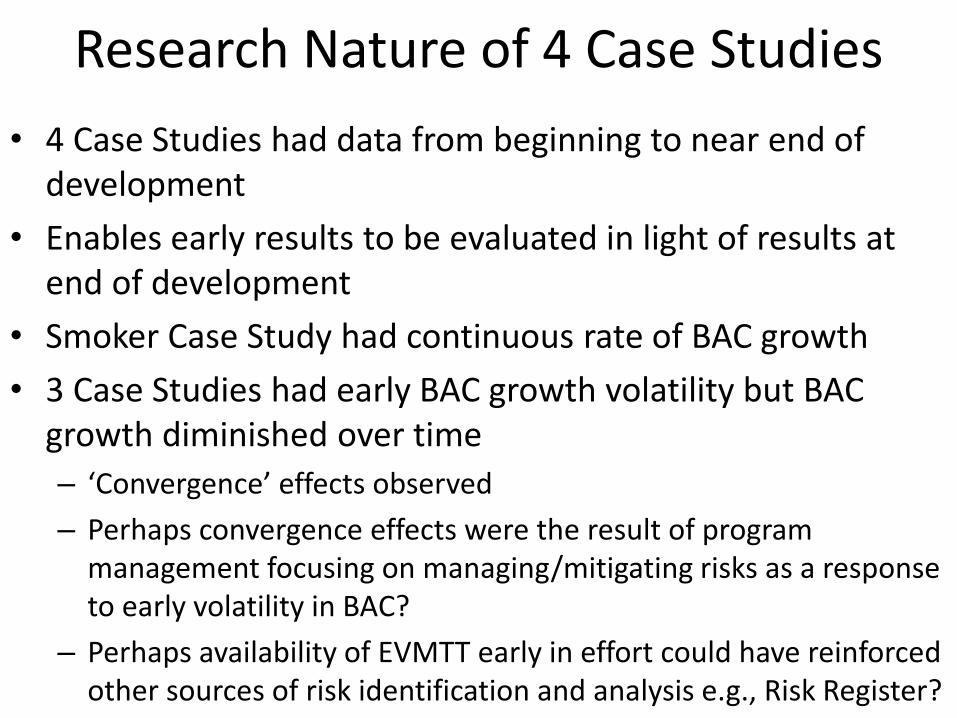
Research Nature of 4 Case Studies
• 4 Case Studies had data from beginning to near end of development
• Enables early results to be evaluated in light of results at end of development
• Smoker Case Study had continuous rate of BAC growth
• 3 Case Studies had early BAC growth volatility but BAC growth diminished over time
– ‘Convergence’ effects observed
– Perhaps convergence effects were the result of program management focusing on managing/mitigating risks as a response to early volatility in BAC?
– Perhaps availability of EVMTT early in effort could have reinforced other sources of risk identification and analysis e.g., Risk Register?
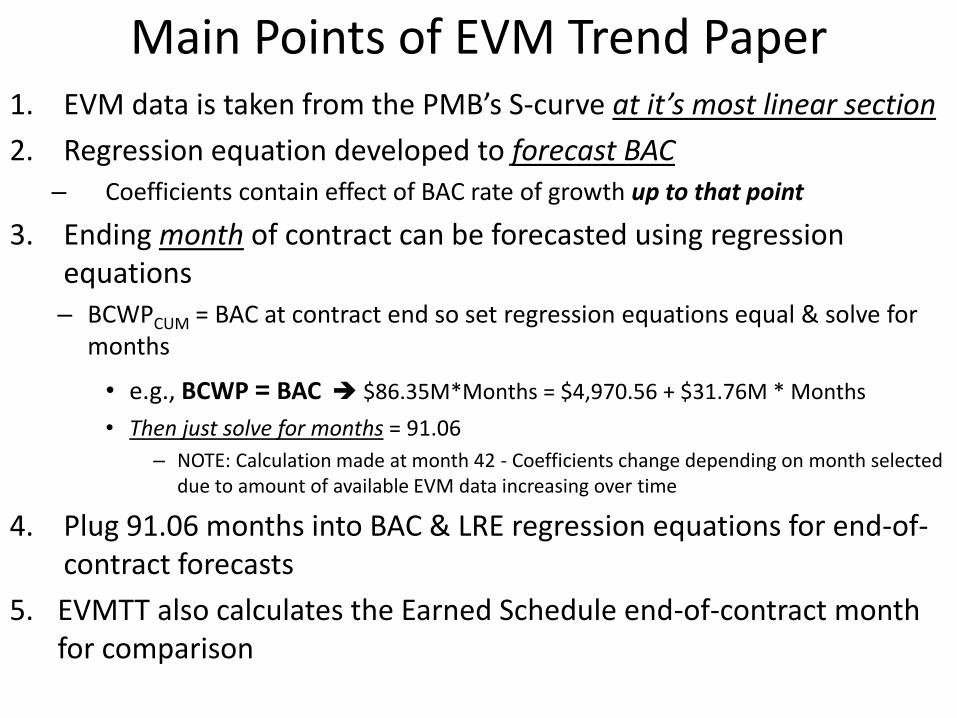
Main Points of EVM Trend Paper1. EVM data is taken from the PMB’s S-curve at it’s most linear section
2. Regression equation developed to forecast BAC– Coefficients contain effect of BAC rate of growth up to that point
3. Ending month of contract can be forecasted using regression equations– BCWPCUM = BAC at contract end so set regression equations equal & solve for
months
• e.g., BCWP = BAC $86.35M*Months = $4,970.56 + $31.76M * Months
• Then just solve for months = 91.06
– NOTE: Calculation made at month 42 - Coefficients change depending on month selected due to amount of available EVM data increasing over time
4. Plug 91.06 months into BAC & LRE regression equations for end-of-contract forecasts
5. EVMTT also calculates the Earned Schedule end-of-contract month for comparison
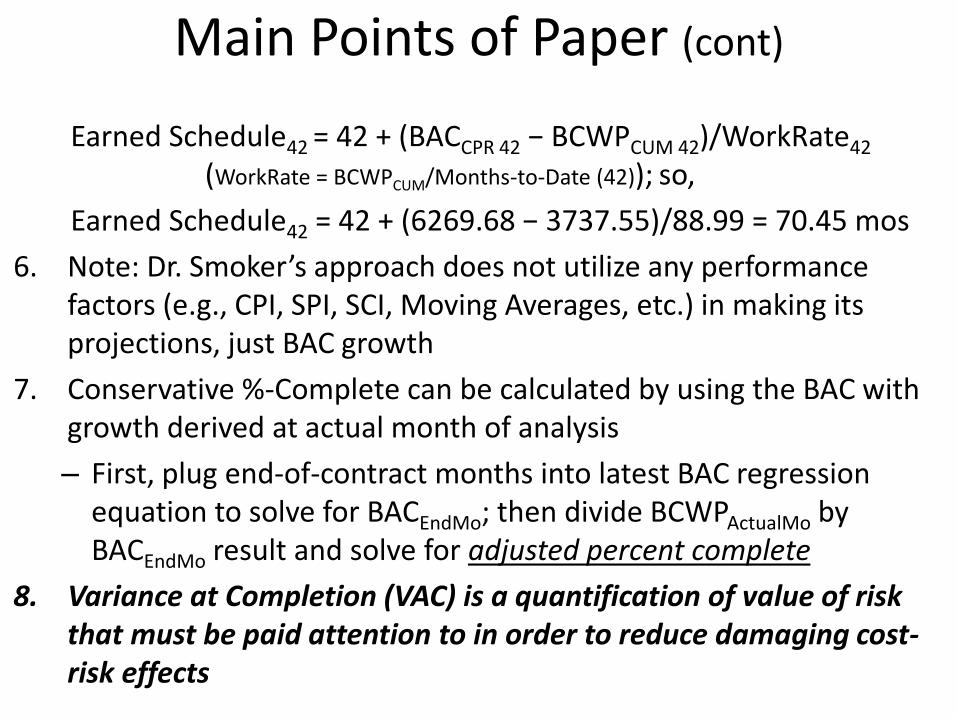
Main Points of Paper (cont)
Earned Schedule42 = 42 + (BACCPR 42 − BCWPCUM 42)/WorkRate42
(WorkRate = BCWPCUM/Months-to-Date (42)); so,
Earned Schedule42 = 42 + (6269.68 − 3737.55)/88.99 = 70.45 mos
6. Note: Dr. Smoker’s approach does not utilize any performance factors (e.g., CPI, SPI, SCI, Moving Averages, etc.) in making its projections, just BAC growth
7. Conservative %-Complete can be calculated by using the BAC with growth derived at actual month of analysis
– First, plug end-of-contract months into latest BAC regression equation to solve for BACEndMo; then divide BCWPActualMo by BACEndMo result and solve for adjusted percent complete
8. Variance at Completion (VAC) is a quantification of value of risk that must be paid attention to in order to reduce damaging cost-risk effects
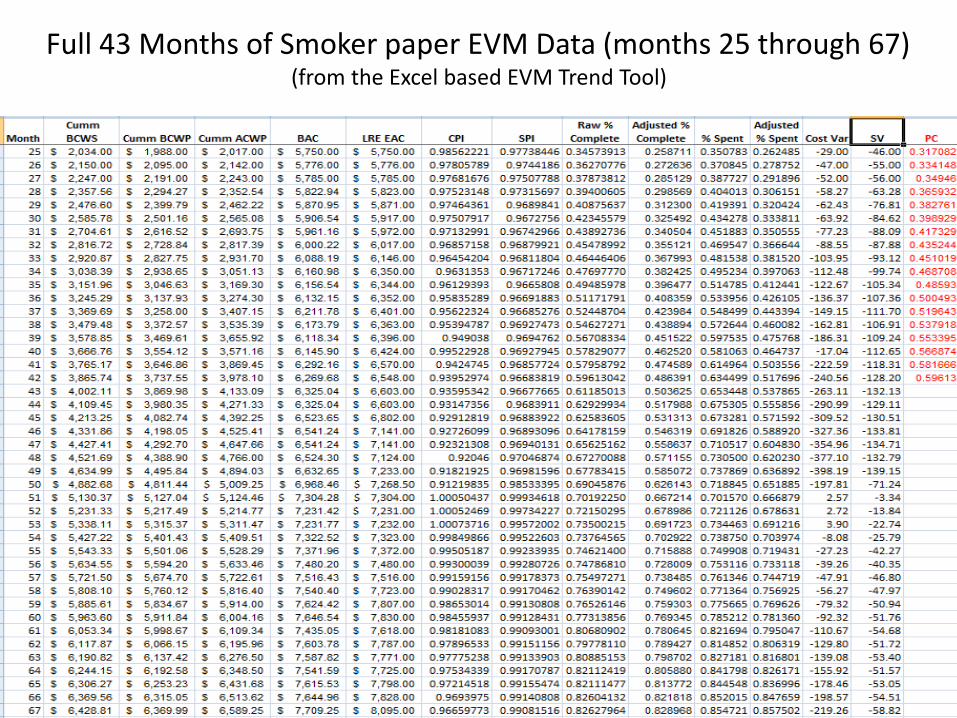
Full 43 Months of Smoker paper EVM Data (months 25 through 67)(from the Excel based EVM Trend Tool)
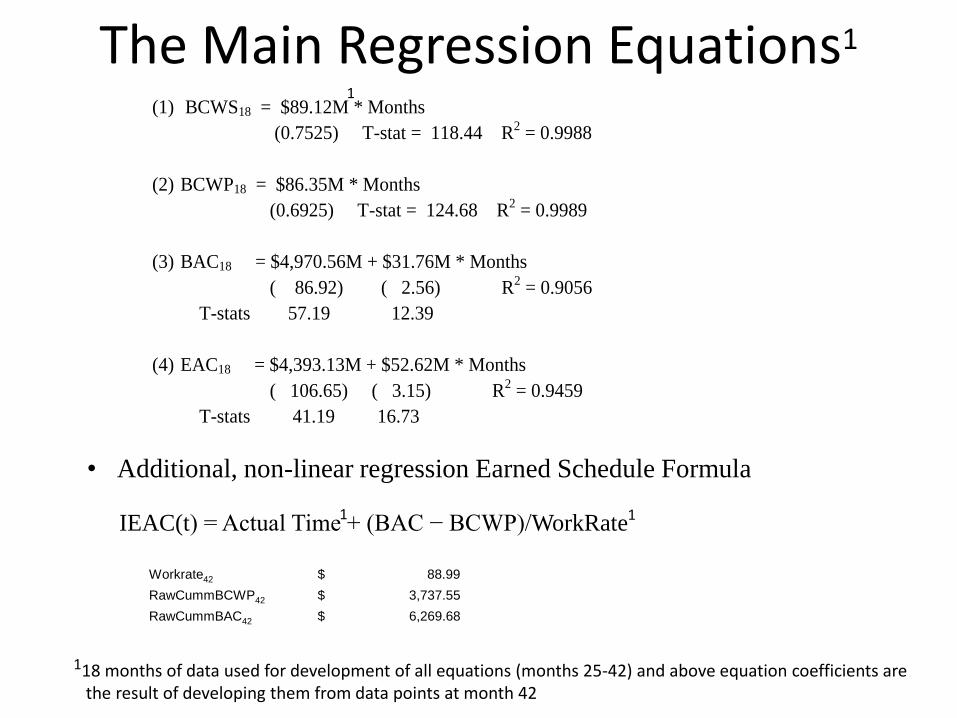
The Main Regression Equations1
(1) BCWS18 = $89.12M * Months
(0.7525) T-stat = 118.44 R2 = 0.9988
(2) BCWP18 = $86.35M * Months
(0.6925) T-stat = 124.68 R2 = 0.9989
(3) BAC18 = $4,970.56M + $31.76M * Months
( 86.92) ( 2.56) R2 = 0.9056
T-stats 57.19 12.39
(4) EAC18 = $4,393.13M + $52.62M * Months
( 106.65) ( 3.15) R2 = 0.9459
T-stats 41.19 16.73
1
118 months of data used for development of all equations (months 25-42) and above equation coefficients arethe result of developing them from data points at month 42
IEAC(t) = Actual Time + (BAC − BCWP)/WorkRate
Workrate42 $ 88.99
RawCummBCWP42 $ 3,737.55
RawCummBAC42 $ 6,269.68
11
• Additional, non-linear regression Earned Schedule Formula
VAC as a Measure of Risk
• Risk is measured in EVM terms as any deviation from the original baseline – That is, risk is anything that results in a variance
• Therefore, VAC is the basic measure of risk encountered by the end of the contract effort– Whether the risk is rooted in opportunity with a positive
variance
– Or, is rooted in issues related to planning of scope, estimating, scheduling, or technical criteria that are identified during testing and generally associated with a negative variance
(C)2011 MCR, LLC
11
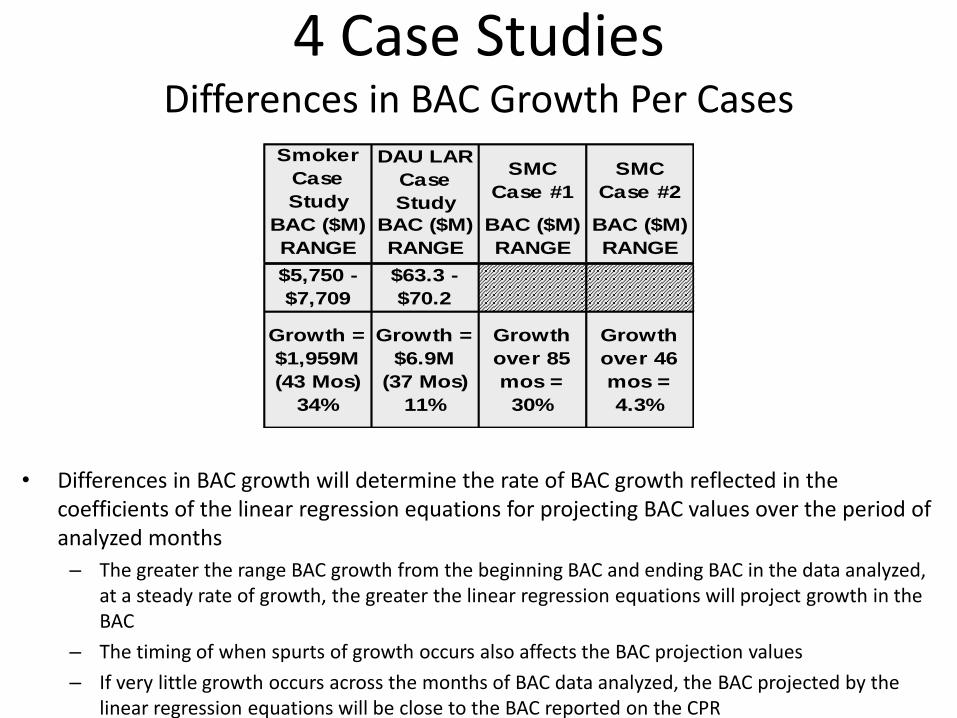
4 Case StudiesDifferences in BAC Growth Per Cases
• Differences in BAC growth will determine the rate of BAC growth reflected in the coefficients of the linear regression equations for projecting BAC values over the period of analyzed months
– The greater the range BAC growth from the beginning BAC and ending BAC in the data analyzed, at a steady rate of growth, the greater the linear regression equations will project growth in the BAC
– The timing of when spurts of growth occurs also affects the BAC projection values
– If very little growth occurs across the months of BAC data analyzed, the BAC projected by the linear regression equations will be close to the BAC reported on the CPR
Smoker
Case
Study
DAU LAR
Case
Study
SMC
Case #1
SMC
Case #2
BAC ($M)
RANGE
BAC ($M)
RANGE
BAC ($M)
RANGE
BAC ($M)
RANGE
$5,750 -
$7,709
$63.3 -
$70.2
Growth =
$1,959M
(43 Mos)
34%
Growth =
$6.9M
(37 Mos)
11%
Growth
over 85
mos =
30%
Growth
over 46
mos =
4.3%
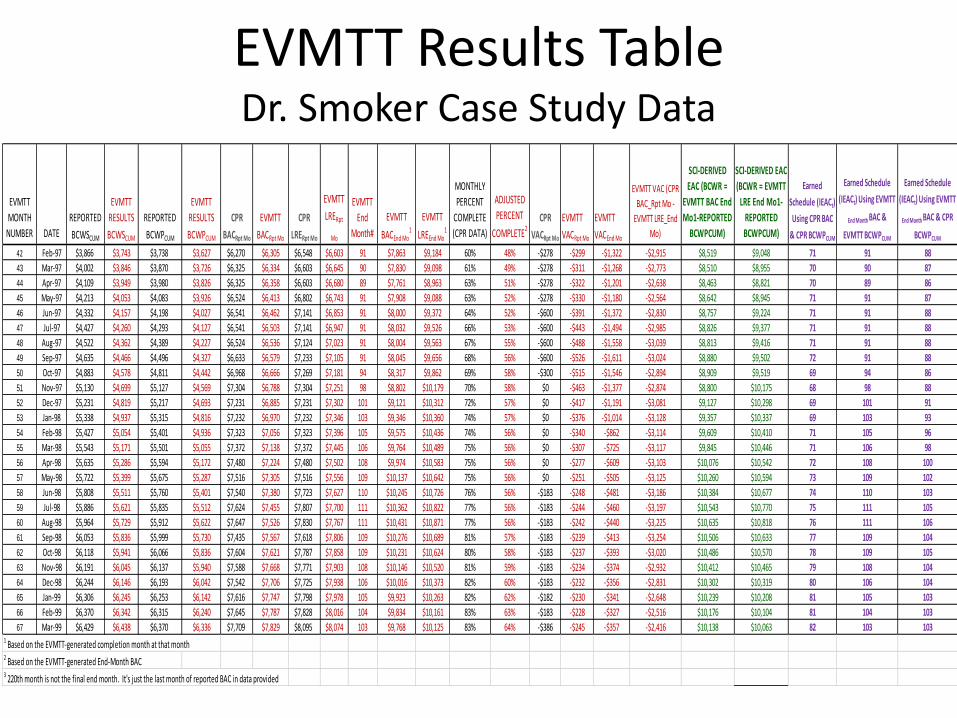
EVMTT Results TableDr. Smoker Case Study Data
EVMTT
MONTH
NUMBER DATE
REPORTED
BCWSCUM
EVMTT
RESULTS
BCWSCUM
REPORTED
BCWPCUM
EVMTT
RESULTS
BCWPCUM
CPR
BACRpt Mo
EVMTT
BACRpt Mo
CPR
LRERpt Mo
EVMTT
LRERpt
Mo
EVMTT
End
Month#
EVMTT
BACEnd Mo1
EVMTT
LREEnd Mo1
MONTHLY
PERCENT
COMPLETE
(CPR DATA)
ADJUSTED
PERCENT
COMPLETE2CPR
VACRpt Mo
EVMTT
VACRpt Mo
EVMTT
VACEnd Mo
EVMTT VAC (CPR
BAC_Rpt Mo -
EVMTT LRE_End
Mo)
SCI-DERIVED
EAC (BCWR =
EVMTT BAC End
Mo1-REPORTED
BCWPCUM)
SCI-DERIVED EAC
(BCWR = EVMTT
LRE End Mo1-
REPORTED
BCWPCUM)
Earned
Schedule (IEACt)
Using CPR BAC
& CPR BCWPCUM
Earned Schedule
(IEACt) Using EVMTT
End Month BAC &
EVMTT BCWPCUM
Earned Schedule
(IEACt) Using EVMTT
End Month BAC & CPR
BCWPCUM
42 Feb-97 $3,866 $3,743 $3,738 $3,627 $6,270 $6,305 $6,548 $6,603 91 $7,863 $9,184 60% 48% -$278 -$299 -$1,322 -$2,915 $8,519 $9,048 71 91 88
43 Mar-97 $4,002 $3,846 $3,870 $3,726 $6,325 $6,334 $6,603 $6,645 90 $7,830 $9,098 61% 49% -$278 -$311 -$1,268 -$2,773 $8,510 $8,955 70 90 87
44 Apr-97 $4,109 $3,949 $3,980 $3,826 $6,325 $6,358 $6,603 $6,680 89 $7,761 $8,963 63% 51% -$278 -$322 -$1,201 -$2,638 $8,463 $8,821 70 89 86
45 May-97 $4,213 $4,053 $4,083 $3,926 $6,524 $6,413 $6,802 $6,743 91 $7,908 $9,088 63% 52% -$278 -$330 -$1,180 -$2,564 $8,642 $8,945 71 91 87
46 Jun-97 $4,332 $4,157 $4,198 $4,027 $6,541 $6,462 $7,141 $6,853 91 $8,000 $9,372 64% 52% -$600 -$391 -$1,372 -$2,830 $8,757 $9,224 71 91 88
47 Jul-97 $4,427 $4,260 $4,293 $4,127 $6,541 $6,503 $7,141 $6,947 91 $8,032 $9,526 66% 53% -$600 -$443 -$1,494 -$2,985 $8,826 $9,377 71 91 88
48 Aug-97 $4,522 $4,362 $4,389 $4,227 $6,524 $6,536 $7,124 $7,023 91 $8,004 $9,563 67% 55% -$600 -$488 -$1,558 -$3,039 $8,813 $9,416 71 91 88
49 Sep-97 $4,635 $4,466 $4,496 $4,327 $6,633 $6,579 $7,233 $7,105 91 $8,045 $9,656 68% 56% -$600 -$526 -$1,611 -$3,024 $8,880 $9,502 72 91 88
50 Oct-97 $4,883 $4,578 $4,811 $4,442 $6,968 $6,666 $7,269 $7,181 94 $8,317 $9,862 69% 58% -$300 -$515 -$1,546 -$2,894 $8,909 $9,519 69 94 86
51 Nov-97 $5,130 $4,699 $5,127 $4,569 $7,304 $6,788 $7,304 $7,251 98 $8,802 $10,179 70% 58% $0 -$463 -$1,377 -$2,874 $8,800 $10,175 68 98 88
52 Dec-97 $5,231 $4,819 $5,217 $4,693 $7,231 $6,885 $7,231 $7,302 101 $9,121 $10,312 72% 57% $0 -$417 -$1,191 -$3,081 $9,127 $10,298 69 101 91
53 Jan-98 $5,338 $4,937 $5,315 $4,816 $7,232 $6,970 $7,232 $7,346 103 $9,346 $10,360 74% 57% $0 -$376 -$1,014 -$3,128 $9,357 $10,337 69 103 93
54 Feb-98 $5,427 $5,054 $5,401 $4,936 $7,323 $7,056 $7,323 $7,396 105 $9,575 $10,436 74% 56% $0 -$340 -$862 -$3,114 $9,609 $10,410 71 105 96
55 Mar-98 $5,543 $5,171 $5,501 $5,055 $7,372 $7,138 $7,372 $7,445 106 $9,764 $10,489 75% 56% $0 -$307 -$725 -$3,117 $9,845 $10,446 71 106 98
56 Apr-98 $5,635 $5,286 $5,594 $5,172 $7,480 $7,224 $7,480 $7,502 108 $9,974 $10,583 75% 56% $0 -$277 -$609 -$3,103 $10,076 $10,542 72 108 100
57 May-98 $5,722 $5,399 $5,675 $5,287 $7,516 $7,305 $7,516 $7,556 109 $10,137 $10,642 75% 56% $0 -$251 -$505 -$3,125 $10,260 $10,594 73 109 102
58 Jun-98 $5,808 $5,511 $5,760 $5,401 $7,540 $7,380 $7,723 $7,627 110 $10,245 $10,726 76% 56% -$183 -$248 -$481 -$3,186 $10,384 $10,677 74 110 103
59 Jul-98 $5,886 $5,621 $5,835 $5,512 $7,624 $7,455 $7,807 $7,700 111 $10,362 $10,822 77% 56% -$183 -$244 -$460 -$3,197 $10,543 $10,770 75 111 105
60 Aug-98 $5,964 $5,729 $5,912 $5,622 $7,647 $7,526 $7,830 $7,767 111 $10,431 $10,871 77% 56% -$183 -$242 -$440 -$3,225 $10,635 $10,818 76 111 106
61 Sep-98 $6,053 $5,836 $5,999 $5,730 $7,435 $7,567 $7,618 $7,806 109 $10,276 $10,689 81% 57% -$183 -$239 -$413 -$3,254 $10,506 $10,633 77 109 104
62 Oct-98 $6,118 $5,941 $6,066 $5,836 $7,604 $7,621 $7,787 $7,858 109 $10,231 $10,624 80% 58% -$183 -$237 -$393 -$3,020 $10,486 $10,570 78 109 105
63 Nov-98 $6,191 $6,045 $6,137 $5,940 $7,588 $7,668 $7,771 $7,903 108 $10,146 $10,520 81% 59% -$183 -$234 -$374 -$2,932 $10,412 $10,465 79 108 104
64 Dec-98 $6,244 $6,146 $6,193 $6,042 $7,542 $7,706 $7,725 $7,938 106 $10,016 $10,373 82% 60% -$183 -$232 -$356 -$2,831 $10,302 $10,319 80 106 104
65 Jan-99 $6,306 $6,245 $6,253 $6,142 $7,616 $7,747 $7,798 $7,978 105 $9,923 $10,263 82% 62% -$182 -$230 -$341 -$2,648 $10,239 $10,208 81 105 103
66 Feb-99 $6,370 $6,342 $6,315 $6,240 $7,645 $7,787 $7,828 $8,016 104 $9,834 $10,161 83% 63% -$183 -$228 -$327 -$2,516 $10,176 $10,104 81 104 103
67 Mar-99 $6,429 $6,438 $6,370 $6,336 $7,709 $7,829 $8,095 $8,074 103 $9,768 $10,125 83% 64% -$386 -$245 -$357 -$2,416 $10,138 $10,063 82 103 1031 Based on the EVMTT-generated completion month at that month2 Based on the EVMTT-generated End-Month BAC3 220th month is not the final end month. It's just the last month of reported BAC in data provided
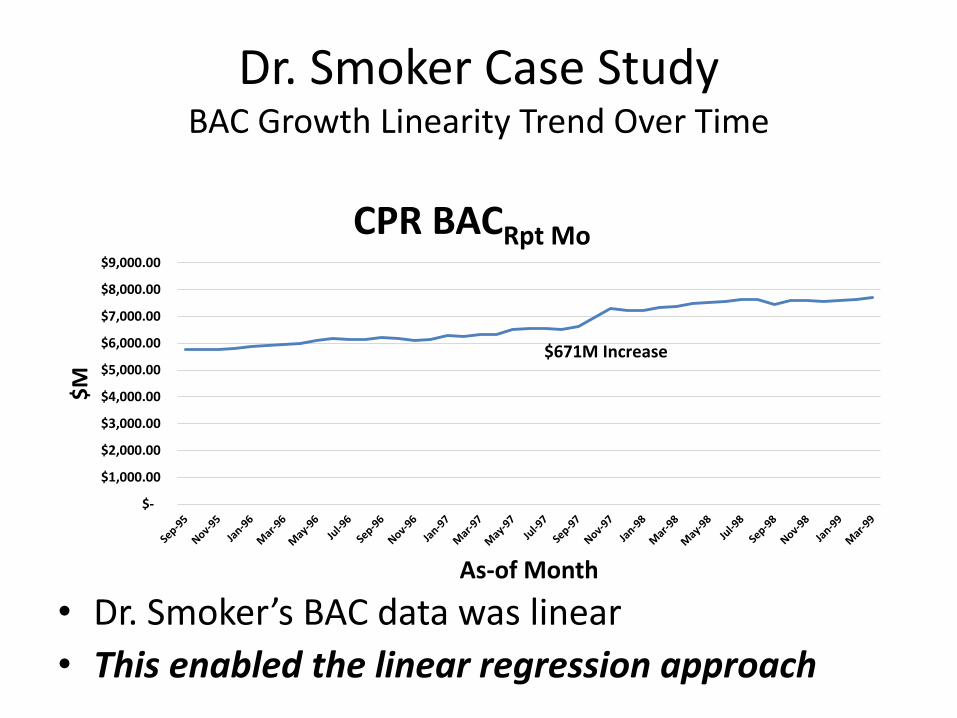
Dr. Smoker Case StudyBAC Growth Linearity Trend Over Time
• Dr. Smoker’s BAC data was linear
• This enabled the linear regression approach
$-
$1,000.00
$2,000.00
$3,000.00
$4,000.00
$5,000.00
$6,000.00
$7,000.00
$8,000.00
$9,000.00
$M
As-of Month
CPR BACRpt Mo
$671M Increase
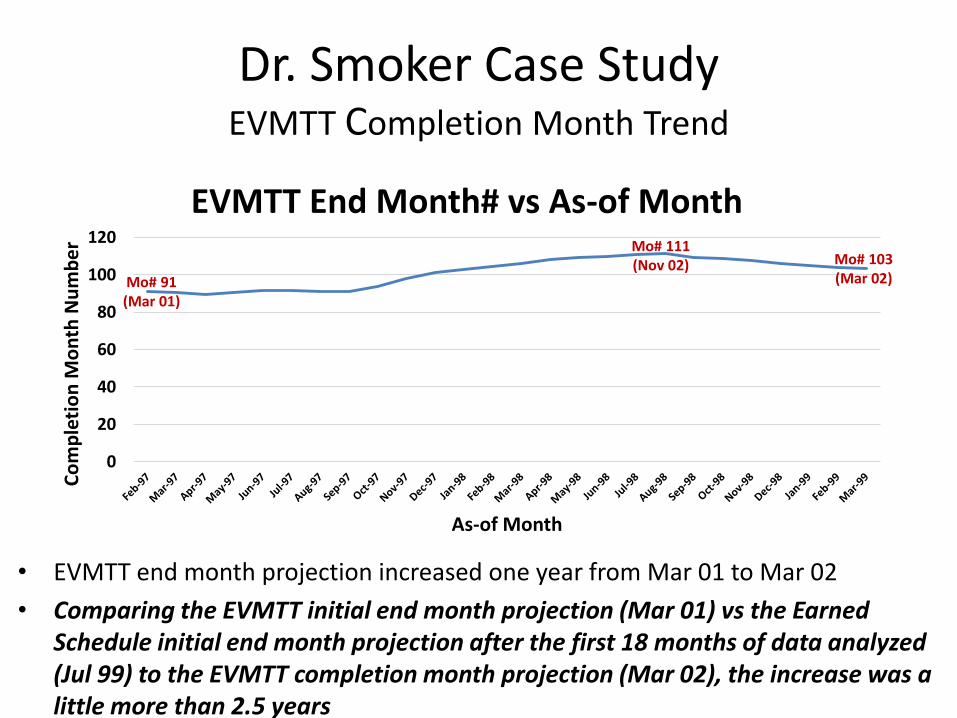
Dr. Smoker Case StudyEVMTT Completion Month Trend
• EVMTT end month projection increased one year from Mar 01 to Mar 02
• Comparing the EVMTT initial end month projection (Mar 01) vs the Earned Schedule initial end month projection after the first 18 months of data analyzed (Jul 99) to the EVMTT completion month projection (Mar 02), the increase was a little more than 2.5 years
0
20
40
60
80
100
120
Co
mp
leti
on
Mo
nth
Nu
mb
er
As-of Month
EVMTT End Month# vs As-of Month
Mo# 91(Mar 01)
Mo# 111(Nov 02) Mo# 103
(Mar 02)
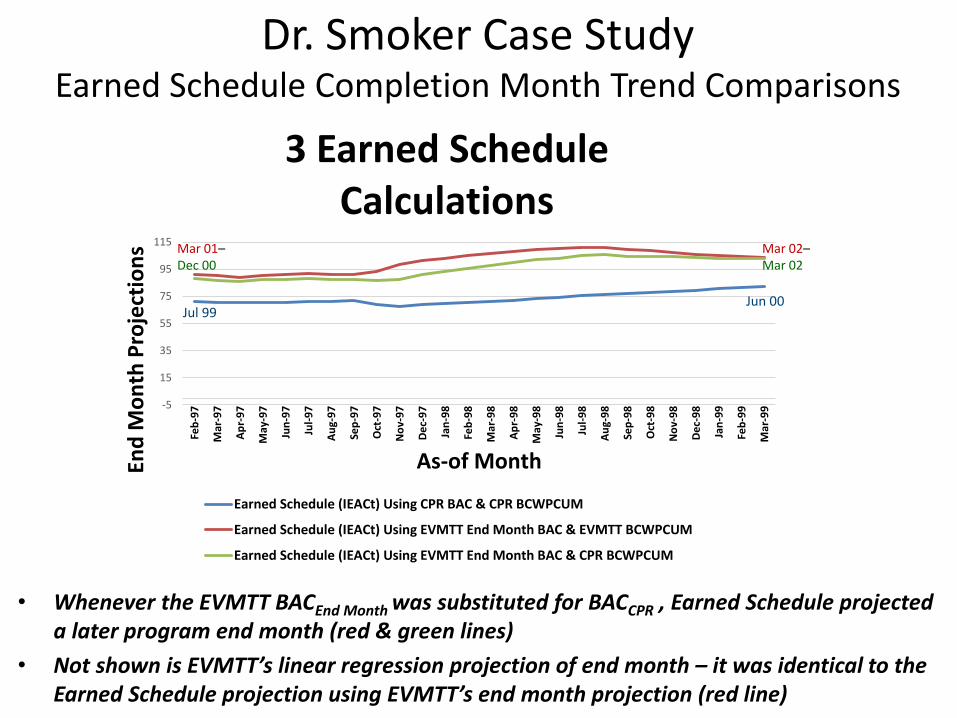
Dr. Smoker Case StudyEarned Schedule Completion Month Trend Comparisons
• Whenever the EVMTT BACEnd Month was substituted for BACCPR , Earned Schedule projected a later program end month (red & green lines)
• Not shown is EVMTT’s linear regression projection of end month – it was identical to the Earned Schedule projection using EVMTT’s end month projection (red line)
-5
15
35
55
75
95
115
Feb
-97
Mar
-97
Ap
r-9
7
May
-97
Jun
-97
Jul-
97
Au
g-9
7
Sep
-97
Oct
-97
No
v-9
7
De
c-9
7
Jan
-98
Feb
-98
Mar
-98
Ap
r-9
8
May
-98
Jun
-98
Jul-
98
Au
g-9
8
Sep
-98
Oct
-98
No
v-9
8
De
c-9
8
Jan
-99
Feb
-99
Mar
-99
End
Mo
nth
Pro
ject
ion
s
As-of Month
3 Earned Schedule Calculations
Earned Schedule (IEACt) Using CPR BAC & CPR BCWPCUM
Earned Schedule (IEACt) Using EVMTT End Month BAC & EVMTT BCWPCUM
Earned Schedule (IEACt) Using EVMTT End Month BAC & CPR BCWPCUM
Mar 01–Dec 00
Jul 99Jun 00
Mar 02–Mar 02
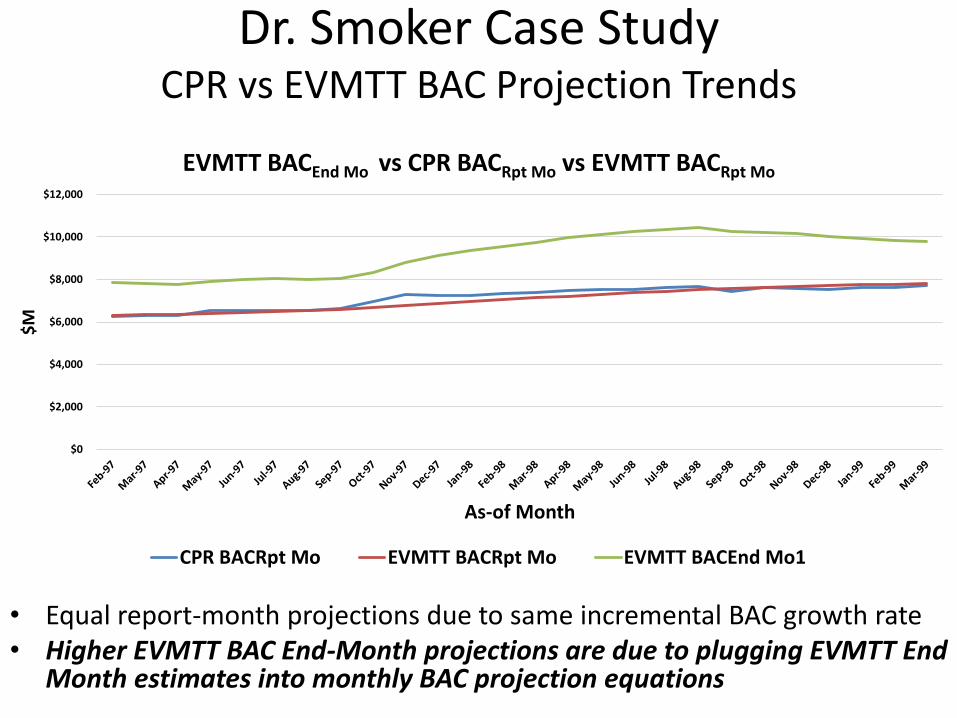
Dr. Smoker Case StudyCPR vs EVMTT BAC Projection Trends
• Equal report-month projections due to same incremental BAC growth rate• Higher EVMTT BAC End-Month projections are due to plugging EVMTT End
Month estimates into monthly BAC projection equations
$0
$2,000
$4,000
$6,000
$8,000
$10,000
$12,000
$M
As-of Month
EVMTT BACEnd Mo vs CPR BACRpt Mo vs EVMTT BACRpt Mo
CPR BACRpt Mo EVMTT BACRpt Mo EVMTT BACEnd Mo1
Dr. Smoker Case Study%-Complete Comparisons
• Monthly %-Complete = BCWPCUM /BACCPR = 83% in Mar 99• Adjusted %-Complete = BCWPCUM /BACEVMTT_End Month 64% in Mar 99
0%
10%
20%
30%
40%
50%
60%
70%
80%
90%
%-C
om
ple
te
As-of Month
MONTHLY %-COMPLETE vs ADJUSTED %-COMPLETE
MONTHLY PERCENT COMPLETE (CPR DATA) ADJUSTED PERCENT COMPLETE2
Dr. Smoker Case StudyCPR LRE vs EVMTT LRE vs SCI EAC
• EVMTT LRE_End Mo & SCI-Derived EAC converge due to increasing BAC rate of growth trend even though EVM performance increased
• From the FY05 President’s Budget, final program development cost projected to be = $12.8B to occur in MAR 09
$0
$2,000
$4,000
$6,000
$8,000
$10,000
$12,000
$M
As-of Month
EVMTT LREEnd Mo vs SCI-DERIVED EAC vs CPR LRERpt Mo
CPR LRERpt Mo EVMTT LREEnd Mo1 SCI-DERIVED EAC (BCWR = EVMTT BAC End Mo1-REPORTED BCWPCUM)
$8.1B
$10.1B
SMC Example #1:BAC Growth Linearity Trend Over Time
• Graph indicates non-linearity in BAC growth until about Sep 2010
• Therefore, linear regression analysis only appropriate after Sep 2010
• BAC rate-of-growth very modest post-Sep 2010
May
-08
Au
g-0
8
No
v-0
8
Feb
-09
May
-09
Au
g-0
9
No
v-0
9
Feb
-10
May
-10
Au
g-1
0
No
v-1
0
Feb
-11
May
-11
Au
g-1
1
No
v-1
1
Feb
-12
May
-12
Au
g-1
2
No
v-1
2
Feb
-13
May
-13
Au
g-1
3
No
v-1
3
Feb
-14
May
-14
Au
g-1
4
No
v-1
4
Feb
-15
May
-15
$M
MONTHS
BAC vs MONTHS
SMC #1 EVMTT Completion Month Trend
• As the months increase from left to right on the X-axis one month at a time, it represents an additional month’s EVM data added to the database upon which the EVMTT’s calculations are based
• In Feb 12 the projection for completion was Jan 20; the changes in the BAC stabilized in Mar 14 where the completion month projection became Apr 16 until the last month
• If EVMTT had been available in Feb 12, the initial end month projection of Jan 20 would have motivated program management to investigate why; perhaps other indications of risk were available (e.g., Risk Register) and did motivate the PM
• Contract schedule end of development is Mar 16; current contract PoP is through Sep 18 (EVM data does not support that so reconciling difference requires further action - e.g., ICRM)
0
20
40
60
80
100
120
140
160
Feb
-12
Mar
-12
Ap
r-1
2
May
-12
Jun
-12
Jul-
12
Au
g-1
2
Sep
-12
Oct
-12
No
v-1
2
De
c-1
2
Jan
-13
Feb
-13
Mar
-13
Ap
r-1
3
May
-13
Jun
-13
Jul-
13
Au
g-1
3
Sep
-13
Oct
-13
No
v-1
3
De
c-1
3
Jan
-14
Feb
-14
Mar
-14
Ap
r-1
4
May
-14
Jun
-14
Jul-
14
Au
g-1
4
Sep
-14
Oct
-14
No
v-1
4
De
c-1
4
Jan
-15
Feb
-15
Mar
-15
Ap
r-1
5
End
Mo
nth
Nu
mb
er
As-of Month
EVMTT End Month# by As-of Month
Apr 16 Apr 16
Jan 20
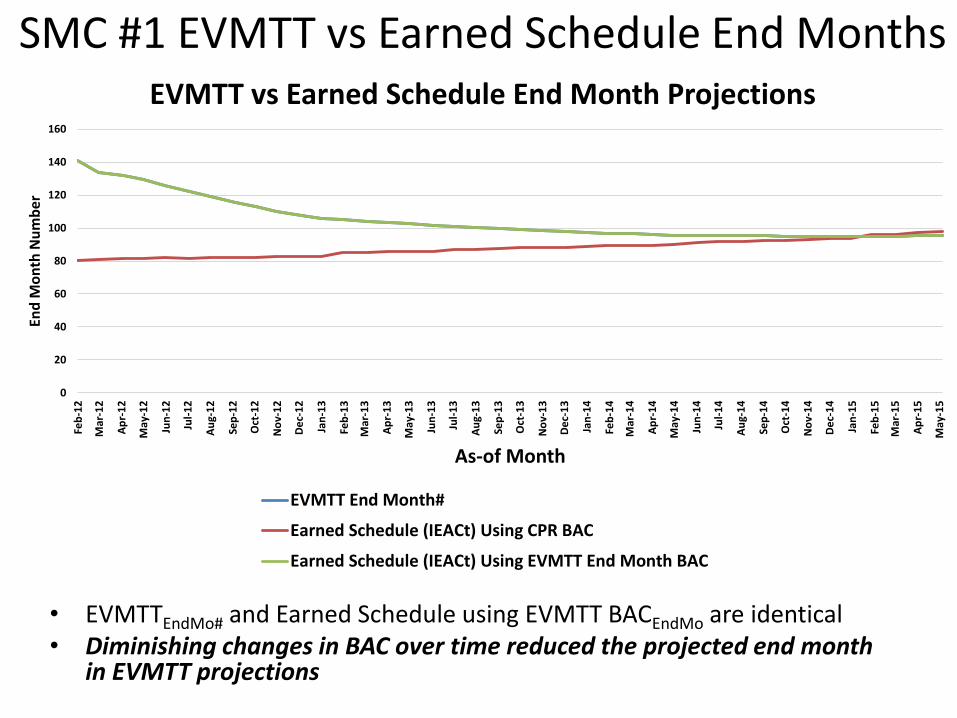
SMC #1 EVMTT vs Earned Schedule End Months
• EVMTTEndMo# and Earned Schedule using EVMTT BACEndMo are identical• Diminishing changes in BAC over time reduced the projected end month
in EVMTT projections
0
20
40
60
80
100
120
140
160
Feb
-12
Mar
-12
Ap
r-1
2
May
-12
Jun
-12
Jul-
12
Au
g-1
2
Sep
-12
Oct
-12
No
v-1
2
De
c-1
2
Jan
-13
Feb
-13
Mar
-13
Ap
r-1
3
May
-13
Jun
-13
Jul-
13
Au
g-1
3
Sep
-13
Oct
-13
No
v-1
3
De
c-1
3
Jan
-14
Feb
-14
Mar
-14
Ap
r-1
4
May
-14
Jun
-14
Jul-
14
Au
g-1
4
Sep
-14
Oct
-14
No
v-1
4
De
c-1
4
Jan
-15
Feb
-15
Mar
-15
Ap
r-1
5
May
-15
End
Mo
nth
Nu
mb
er
As-of Month
EVMTT vs Earned Schedule End Month Projections
EVMTT End Month#
Earned Schedule (IEACt) Using CPR BAC
Earned Schedule (IEACt) Using EVMTT End Month BAC
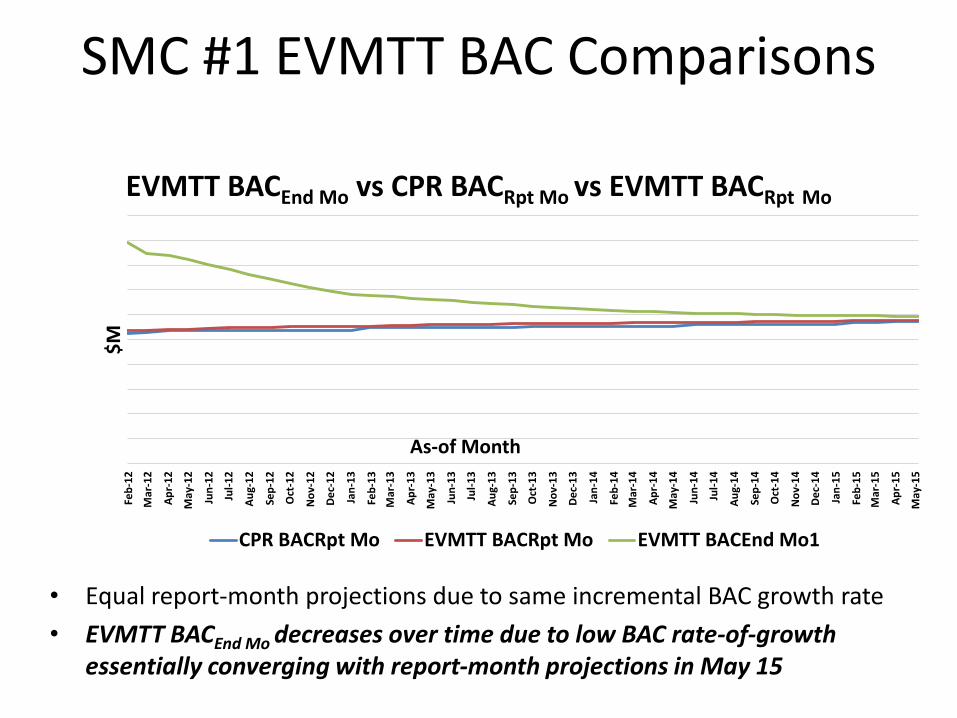
SMC #1 EVMTT BAC Comparisons
• Equal report-month projections due to same incremental BAC growth rate
• EVMTT BACEnd Mo decreases over time due to low BAC rate-of-growth essentially converging with report-month projections in May 15
Feb
-12
Mar
-12
Ap
r-1
2
May
-12
Jun
-12
Jul-
12
Au
g-1
2
Sep
-12
Oct
-12
No
v-1
2
De
c-1
2
Jan
-13
Feb
-13
Mar
-13
Ap
r-1
3
May
-13
Jun
-13
Jul-
13
Au
g-1
3
Sep
-13
Oct
-13
No
v-1
3
De
c-1
3
Jan
-14
Feb
-14
Mar
-14
Ap
r-1
4
May
-14
Jun
-14
Jul-
14
Au
g-1
4
Sep
-14
Oct
-14
No
v-1
4
De
c-1
4
Jan
-15
Feb
-15
Mar
-15
Ap
r-1
5
May
-15
$M
As-of Month
EVMTT BACEnd Mo vs CPR BACRpt Mo vs EVMTT BACRpt Mo
CPR BACRpt Mo EVMTT BACRpt Mo EVMTT BACEnd Mo1
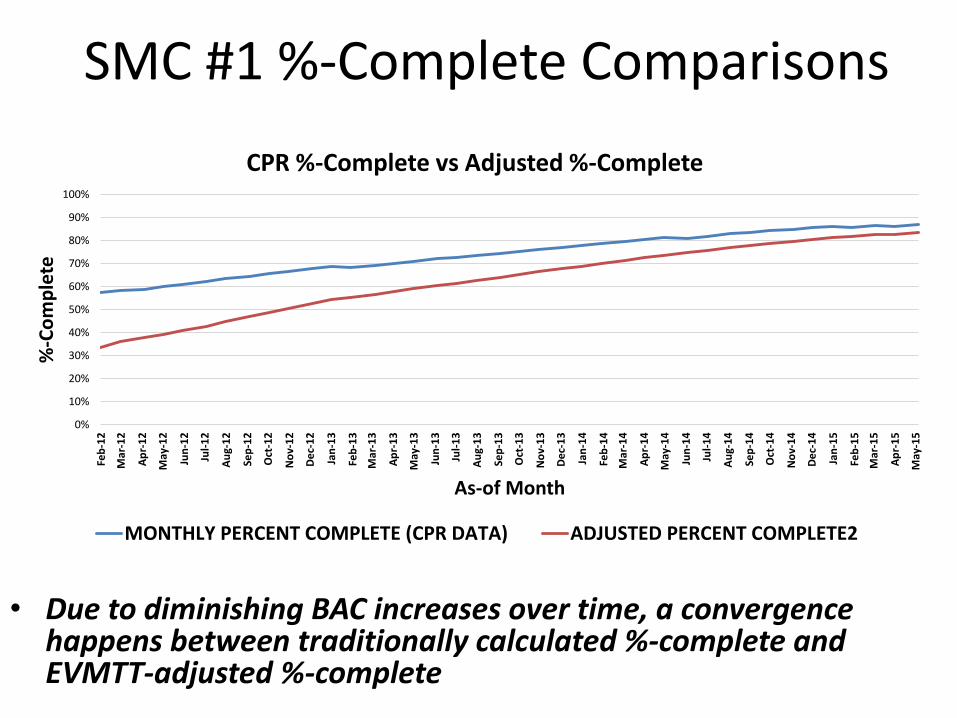
SMC #1 %-Complete Comparisons
• Due to diminishing BAC increases over time, a convergence happens between traditionally calculated %-complete and EVMTT-adjusted %-complete
0%
10%
20%
30%
40%
50%
60%
70%
80%
90%
100%
Feb
-12
Mar
-12
Ap
r-1
2
May
-12
Jun
-12
Jul-
12
Au
g-1
2
Sep
-12
Oct
-12
No
v-1
2
De
c-1
2
Jan
-13
Feb
-13
Mar
-13
Ap
r-1
3
May
-13
Jun
-13
Jul-
13
Au
g-1
3
Sep
-13
Oct
-13
No
v-1
3
De
c-1
3
Jan
-14
Feb
-14
Mar
-14
Ap
r-1
4
May
-14
Jun
-14
Jul-
14
Au
g-1
4
Sep
-14
Oct
-14
No
v-1
4
De
c-1
4
Jan
-15
Feb
-15
Mar
-15
Ap
r-1
5
May
-15
%-C
om
ple
te
As-of Month
CPR %-Complete vs Adjusted %-Complete
MONTHLY PERCENT COMPLETE (CPR DATA) ADJUSTED PERCENT COMPLETE2
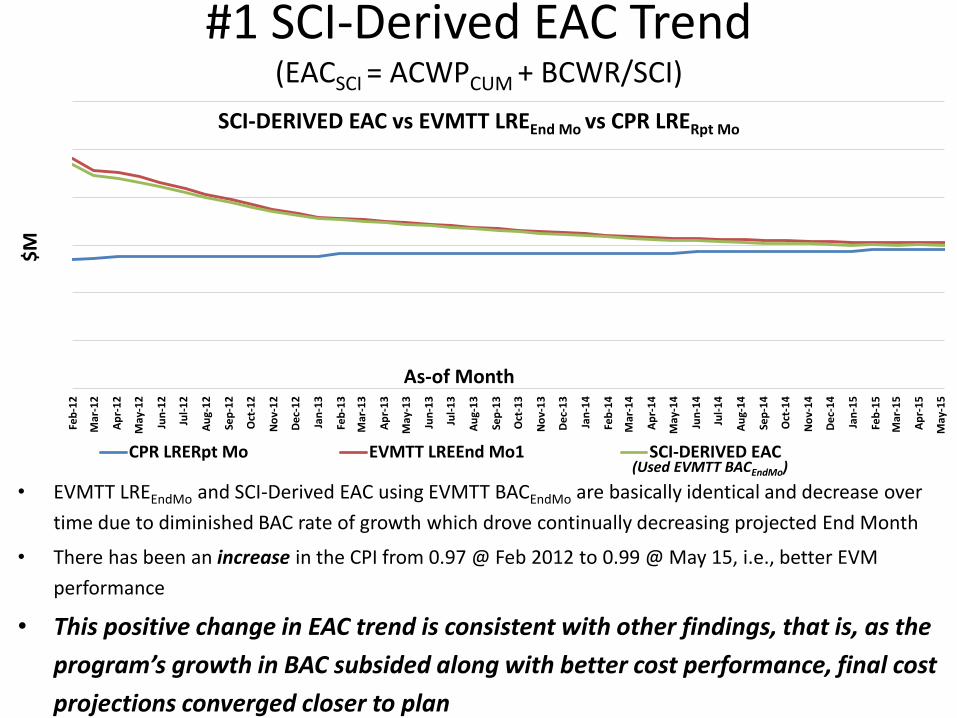
#1 SCI-Derived EAC Trend(EACSCI = ACWPCUM + BCWR/SCI)
• EVMTT LREEndMo and SCI-Derived EAC using EVMTT BACEndMo are basically identical and decrease over
time due to diminished BAC rate of growth which drove continually decreasing projected End Month
• There has been an increase in the CPI from 0.97 @ Feb 2012 to 0.99 @ May 15, i.e., better EVM
performance
• This positive change in EAC trend is consistent with other findings, that is, as the
program’s growth in BAC subsided along with better cost performance, final cost
projections converged closer to plan
Feb
-12
Mar
-12
Ap
r-1
2
May
-12
Jun
-12
Jul-
12
Au
g-1
2
Sep
-12
Oct
-12
No
v-1
2
De
c-1
2
Jan
-13
Feb
-13
Mar
-13
Ap
r-1
3
May
-13
Jun
-13
Jul-
13
Au
g-1
3
Sep
-13
Oct
-13
No
v-1
3
De
c-1
3
Jan
-14
Feb
-14
Mar
-14
Ap
r-1
4
May
-14
Jun
-14
Jul-
14
Au
g-1
4
Sep
-14
Oct
-14
No
v-1
4
De
c-1
4
Jan
-15
Feb
-15
Mar
-15
Ap
r-1
5
May
-15
$M
As-of Month
SCI-DERIVED EAC vs EVMTT LREEnd Mo vs CPR LRERpt Mo
CPR LRERpt Mo EVMTT LREEnd Mo1 SCI-DERIVED EAC(Used EVMTT BACEndMo)
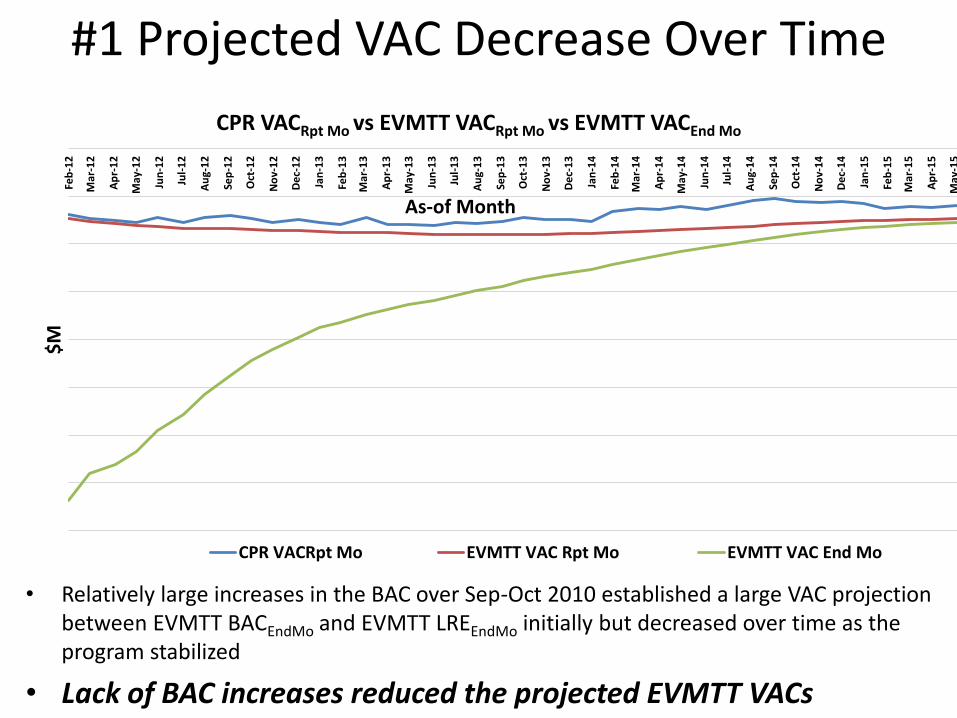
#1 Projected VAC Decrease Over Time
• Relatively large increases in the BAC over Sep-Oct 2010 established a large VAC projection between EVMTT BACEndMo and EVMTT LREEndMo initially but decreased over time as the program stabilized
• Lack of BAC increases reduced the projected EVMTT VACs
Feb
-12
Mar
-12
Ap
r-1
2
May
-12
Jun
-12
Jul-
12
Au
g-1
2
Sep
-12
Oct
-12
No
v-1
2
De
c-1
2
Jan
-13
Feb
-13
Mar
-13
Ap
r-1
3
May
-13
Jun
-13
Jul-
13
Au
g-1
3
Sep
-13
Oct
-13
No
v-1
3
De
c-1
3
Jan
-14
Feb
-14
Mar
-14
Ap
r-1
4
May
-14
Jun
-14
Jul-
14
Au
g-1
4
Sep
-14
Oct
-14
No
v-1
4
De
c-1
4
Jan
-15
Feb
-15
Mar
-15
Ap
r-1
5
May
-15
$M
As-of Month
CPR VACRpt Mo vs EVMTT VACRpt Mo vs EVMTT VACEnd Mo
CPR VACRpt Mo EVMTT VAC Rpt Mo EVMTT VAC End Mo
Conclusions
• Dr. Smoker case study EVMTT results projected steadily increasing end months and increasing EACs due to ever-increasing BAC
– Actually understated both but would have given PMs early warning to identify risks for mitigation
• SMC Example #1 had minimal BAC increases over time so EVMTT results converged to planned outcomes
– However, contractor proposed end-month projections conflicted with EVM data performance
– A further investigation is warranted into what is driving the contractors to propose extended schedules that are unjustified by current EVM data analysis
– Recommend an application of a WBS element-level risk and cost-risk analysis using the ACEIT-based Integrated Cost-Risk Model (ICRM)
What ICRM in ACEIT Brings
• In latest ACEIT versions ICRM capability is enabled with the new Probability of Occurrence column
• Assume EVM analysts are not proficient ACEIT users but can work with cost estimators proficient in ACEIT in
– Identifying probabilistic PF-driven WBS-level EACs
– Producing WBS-level Risk Register-driven cost-risk distributions
• Integration of both probabilistic WBS EVM performance factor-based WBS-level EACs and WBS Risk Register likelihood-based distributions
What ICRM Brings (cont)
• Statistically sums probabilistic WBS EVM performance factor-based WBS-level EACs and WBS Risk Register likelihood-based distributions through monte carlo simulations in ACEIT producing an overall EAC cost-risk distribution
• Enables prioritization
– By WBS elements most cost-impacted by risks, and
– By risks causing the most significant cost impacts
• These results provide the basis for an ongoing meaningful dialogue that is not happening today between the EVM analysts, technical risk management teams, cost estimators, schedule analysts, project officers and, ultimately, the program managers based on cost impacts caused by risks
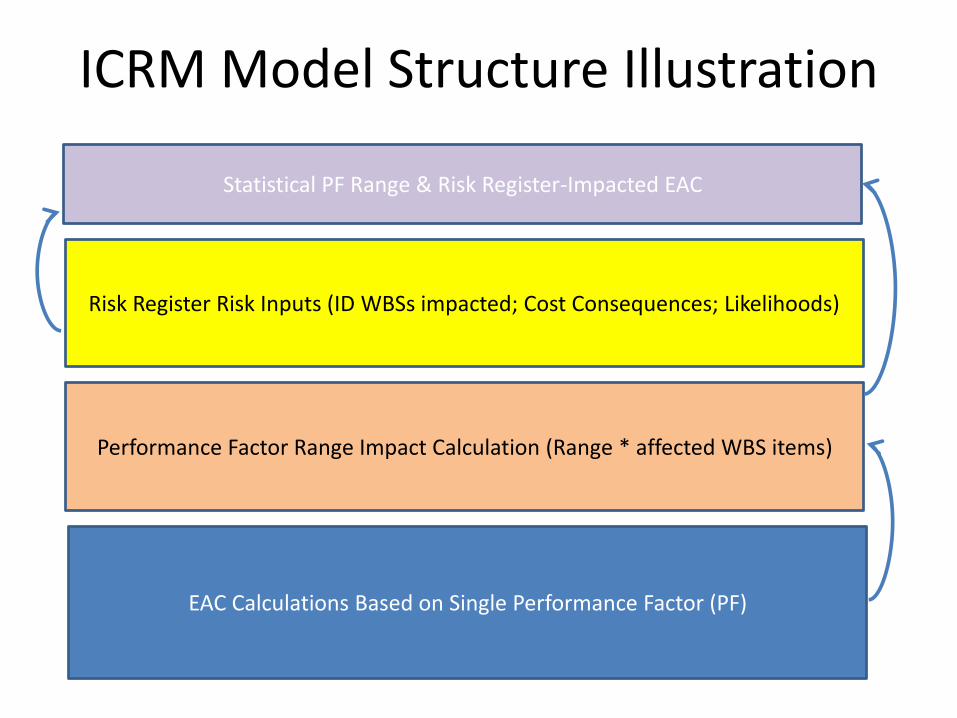
ICRM Model Structure Illustration
EAC Calculations Based on Single Performance Factor (PF)
Statistical PF Range & Risk Register-Impacted EAC
Risk Register Risk Inputs (ID WBSs impacted; Cost Consequences; Likelihoods)
Performance Factor Range Impact Calculation (Range * affected WBS items)
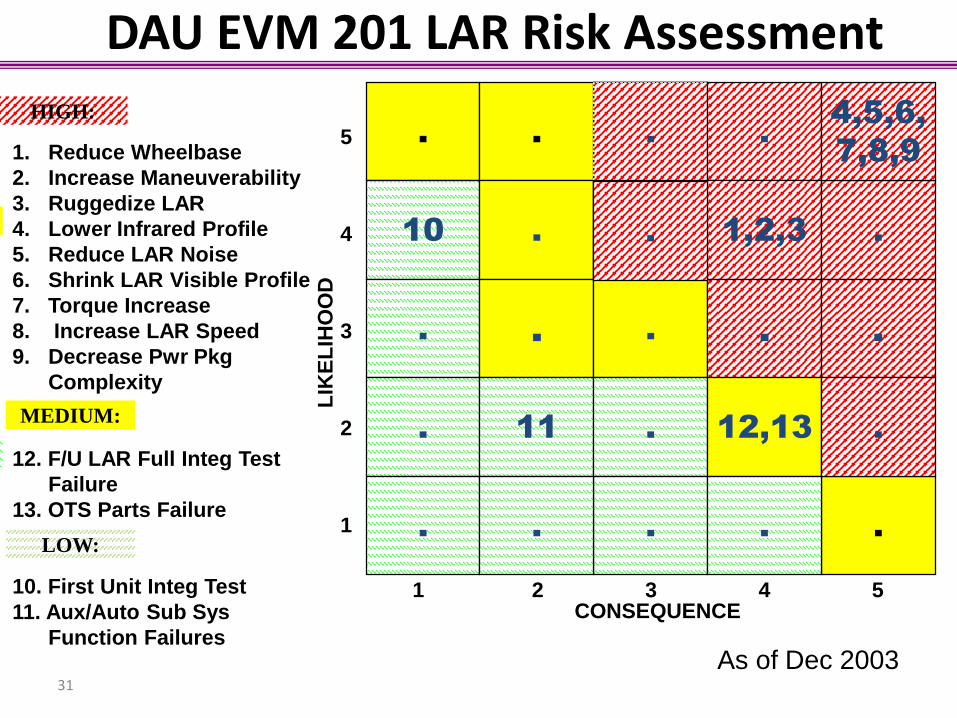
31
HIGH:
1. Reduce Wheelbase
2. Increase Maneuverability
3. Ruggedize LAR
4. Lower Infrared Profile
5. Reduce LAR Noise
6. Shrink LAR Visible Profile
7. Torque Increase
8. Increase LAR Speed
9. Decrease Pwr Pkg
Complexity
12. F/U LAR Full Integ Test
Failure
13. OTS Parts Failure
10. First Unit Integ Test
11. Aux/Auto Sub Sys
Function Failures
DAU EVM 201 LAR Risk Assessment
.
10
.
.
.
.
.
4, 5
.
.
.
11 .
.
.
.
1,2,3
.
12,13
.
.
.
.
4,5,6,
7,8,9
.
1 2 3 4 5
5
4
3
2
1
CONSEQUENCE
LIK
EL
IHO
OD
As of Dec 2003
.
LOW:
MEDIUM:
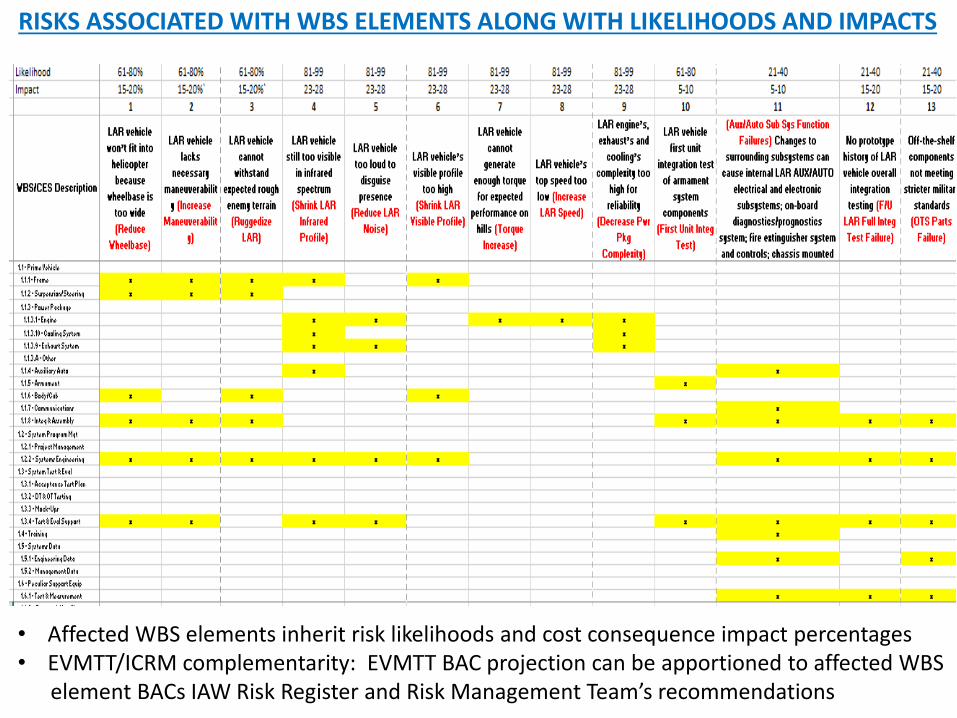
RISKS ASSOCIATED WITH WBS ELEMENTS ALONG WITH LIKELIHOODS AND IMPACTS
• Affected WBS elements inherit risk likelihoods and cost consequence impact percentages• EVMTT/ICRM complementarity: EVMTT BAC projection can be apportioned to affected WBS
element BACs IAW Risk Register and Risk Management Team’s recommendations

BACKUP
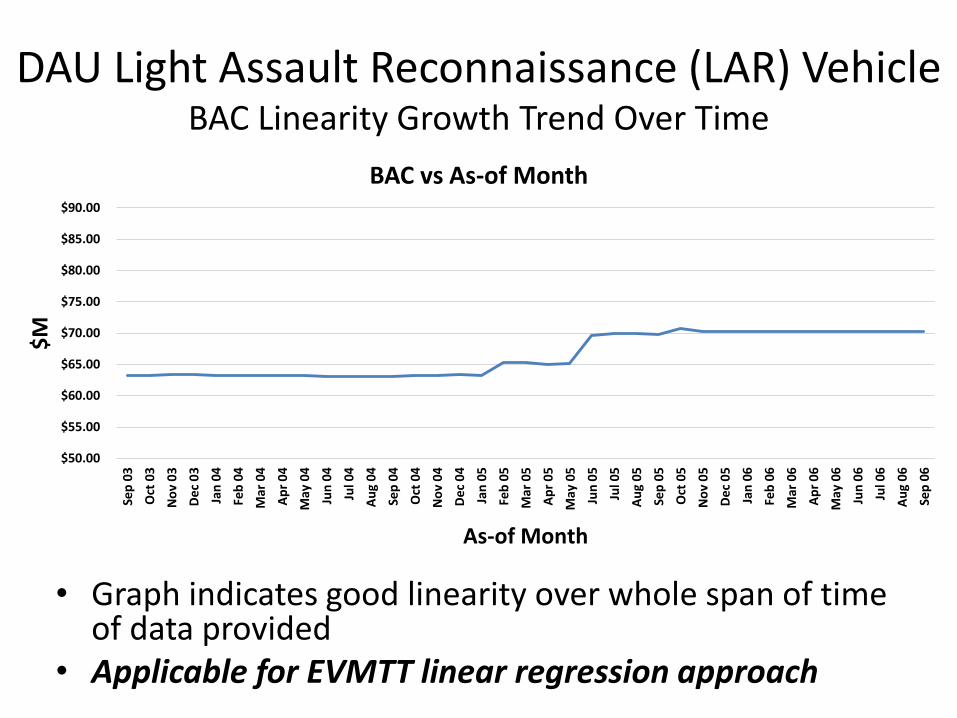
DAU Light Assault Reconnaissance (LAR) VehicleBAC Linearity Growth Trend Over Time
• Graph indicates good linearity over whole span of time of data provided
• Applicable for EVMTT linear regression approach
$50.00
$55.00
$60.00
$65.00
$70.00
$75.00
$80.00
$85.00
$90.00
Sep
03
Oct
03
No
v 0
3
Dec
03
Jan
04
Feb
04
Mar
04
Ap
r 0
4
May
04
Ju
n 0
4
Ju
l 04
Au
g 0
4
Sep
04
Oct
04
No
v 0
4
Dec
04
Jan
05
Feb
05
Mar
05
Ap
r 0
5
May
05
Ju
n 0
5
Ju
l 05
Au
g 0
5
Sep
05
Oct
05
No
v 0
5
Dec
05
Jan
06
Feb
06
Mar
06
Ap
r 0
6
May
06
Ju
n 0
6
Ju
l 06
Au
g 0
6
Sep
06
$M
As-of Month
BAC vs As-of Month
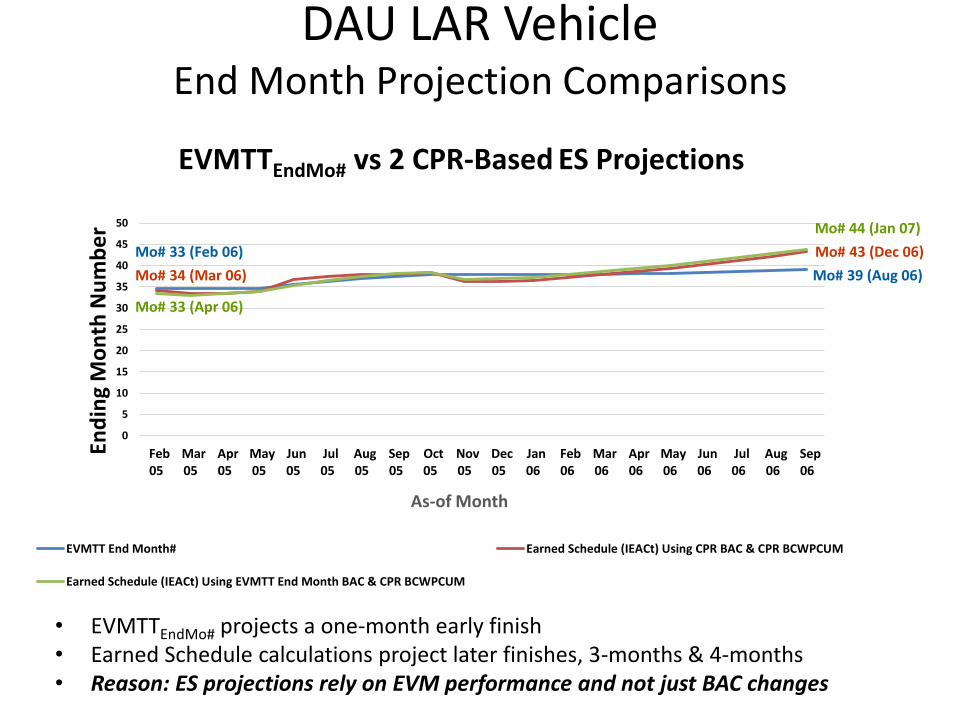
DAU LAR VehicleEnd Month Projection Comparisons
• EVMTTEndMo# projects a one-month early finish• Earned Schedule calculations project later finishes, 3-months & 4-months• Reason: ES projections rely on EVM performance and not just BAC changes
0
5
10
15
20
25
30
35
40
45
50
Feb05
Mar05
Apr05
May05
Jun05
Jul05
Aug05
Sep05
Oct05
Nov05
Dec05
Jan06
Feb06
Mar06
Apr06
May06
Jun06
Jul06
Aug06
Sep06
End
ing
Mo
nth
Nu
mb
er
As-of Month
EVMTTEndMo# vs 2 CPR-Based ES Projections
EVMTT End Month# Earned Schedule (IEACt) Using CPR BAC & CPR BCWPCUM
Earned Schedule (IEACt) Using EVMTT End Month BAC & CPR BCWPCUM
Mo# 33 (Apr 06)
Mo# 34 (Mar 06)
Mo# 33 (Feb 06)
Mo# 39 (Aug 06)
Mo# 43 (Dec 06)
Mo# 44 (Jan 07)
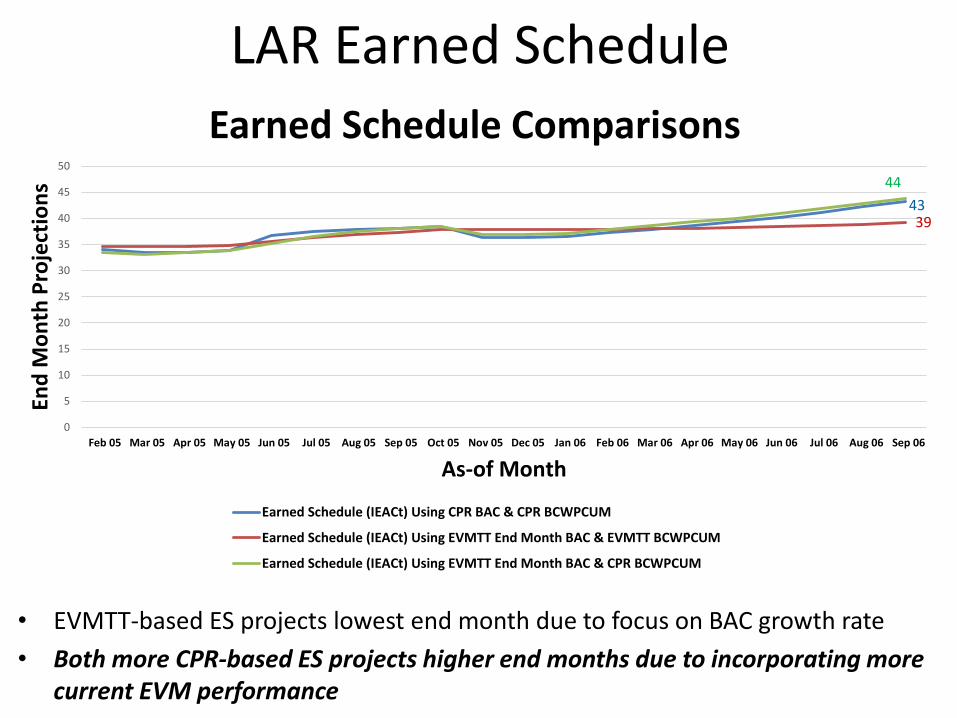
LAR Earned Schedule
• EVMTT-based ES projects lowest end month due to focus on BAC growth rate
• Both more CPR-based ES projects higher end months due to incorporating more current EVM performance
0
5
10
15
20
25
30
35
40
45
50
Feb 05 Mar 05 Apr 05 May 05 Jun 05 Jul 05 Aug 05 Sep 05 Oct 05 Nov 05 Dec 05 Jan 06 Feb 06 Mar 06 Apr 06 May 06 Jun 06 Jul 06 Aug 06 Sep 06
End
Mo
nth
Pro
ject
ion
s
As-of Month
Earned Schedule Comparisons
Earned Schedule (IEACt) Using CPR BAC & CPR BCWPCUM
Earned Schedule (IEACt) Using EVMTT End Month BAC & EVMTT BCWPCUM
Earned Schedule (IEACt) Using EVMTT End Month BAC & CPR BCWPCUM
3943
44
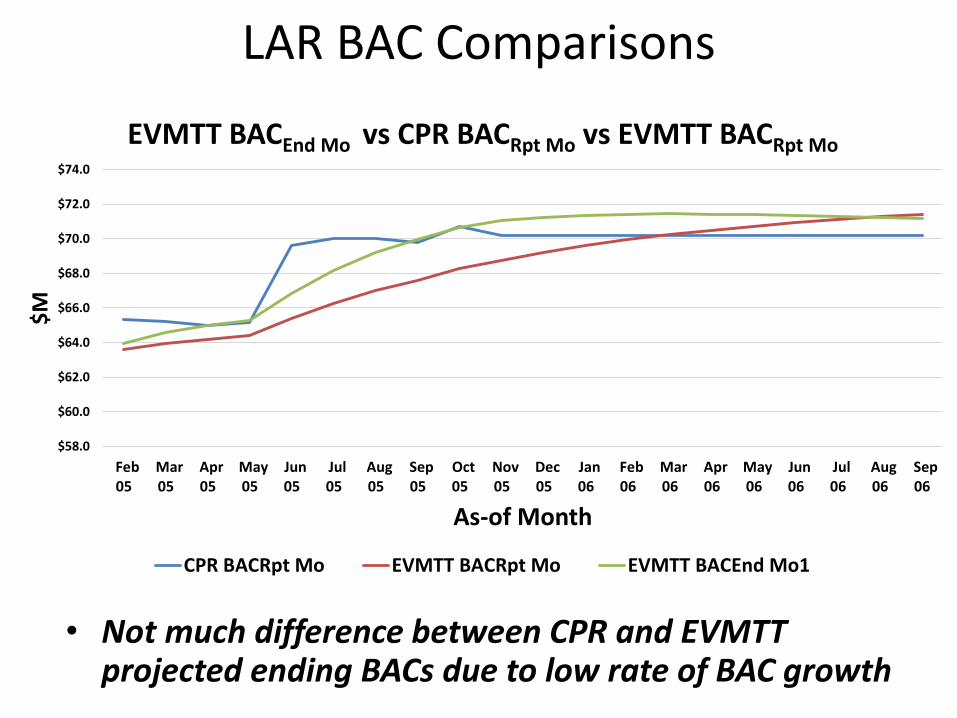
LAR BAC Comparisons
• Not much difference between CPR and EVMTT projected ending BACs due to low rate of BAC growth
$58.0
$60.0
$62.0
$64.0
$66.0
$68.0
$70.0
$72.0
$74.0
Feb05
Mar05
Apr05
May05
Jun05
Jul05
Aug05
Sep05
Oct05
Nov05
Dec05
Jan06
Feb06
Mar06
Apr06
May06
Jun06
Jul06
Aug06
Sep06
$M
As-of Month
EVMTT BACEnd Mo vs CPR BACRpt Mo vs EVMTT BACRpt Mo
CPR BACRpt Mo EVMTT BACRpt Mo EVMTT BACEnd Mo1
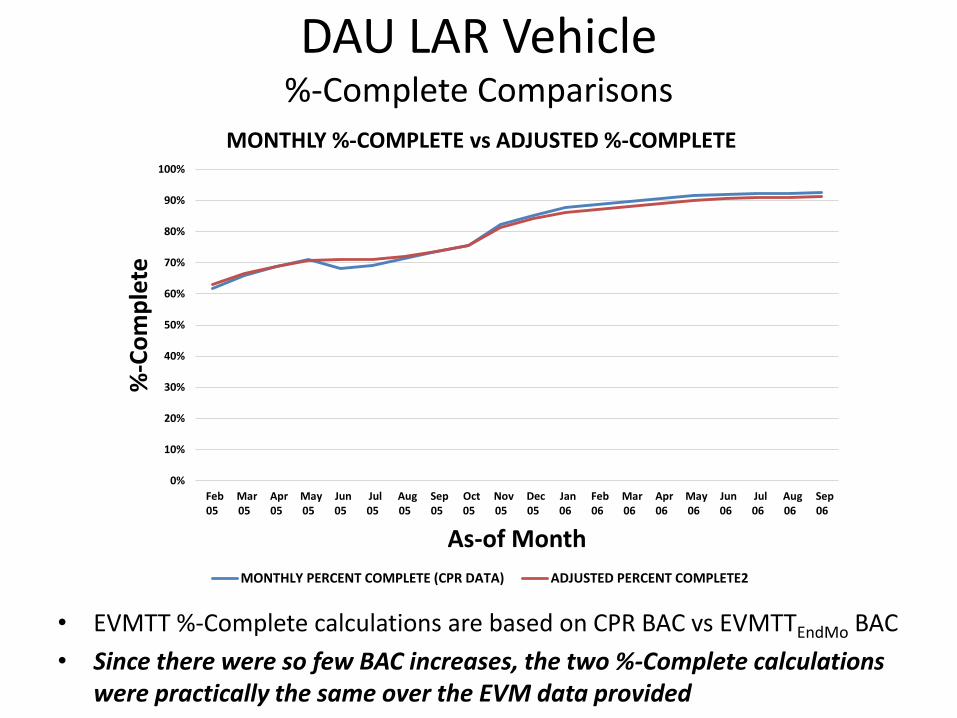
DAU LAR Vehicle%-Complete Comparisons
• EVMTT %-Complete calculations are based on CPR BAC vs EVMTTEndMo BAC
• Since there were so few BAC increases, the two %-Complete calculations were practically the same over the EVM data provided
0%
10%
20%
30%
40%
50%
60%
70%
80%
90%
100%
Feb05
Mar05
Apr05
May05
Jun05
Jul05
Aug05
Sep05
Oct05
Nov05
Dec05
Jan06
Feb06
Mar06
Apr06
May06
Jun06
Jul06
Aug06
Sep06
%-C
om
ple
te
As-of Month
MONTHLY %-COMPLETE vs ADJUSTED %-COMPLETE
MONTHLY PERCENT COMPLETE (CPR DATA) ADJUSTED PERCENT COMPLETE2
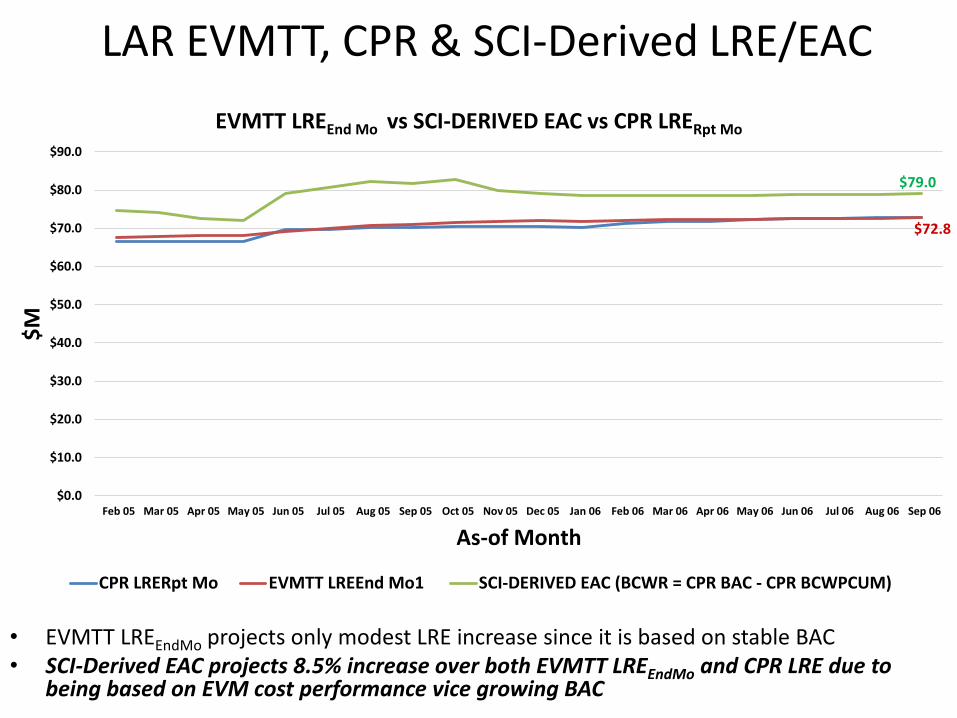
LAR EVMTT, CPR & SCI-Derived LRE/EAC
• EVMTT LREEndMo projects only modest LRE increase since it is based on stable BAC• SCI-Derived EAC projects 8.5% increase over both EVMTT LREEndMo and CPR LRE due to
being based on EVM cost performance vice growing BAC
$0.0
$10.0
$20.0
$30.0
$40.0
$50.0
$60.0
$70.0
$80.0
$90.0
Feb 05 Mar 05 Apr 05 May 05 Jun 05 Jul 05 Aug 05 Sep 05 Oct 05 Nov 05 Dec 05 Jan 06 Feb 06 Mar 06 Apr 06 May 06 Jun 06 Jul 06 Aug 06 Sep 06
$M
As-of Month
EVMTT LREEnd Mo vs SCI-DERIVED EAC vs CPR LRERpt Mo
CPR LRERpt Mo EVMTT LREEnd Mo1 SCI-DERIVED EAC (BCWR = CPR BAC - CPR BCWPCUM)
$79.0
$72.8
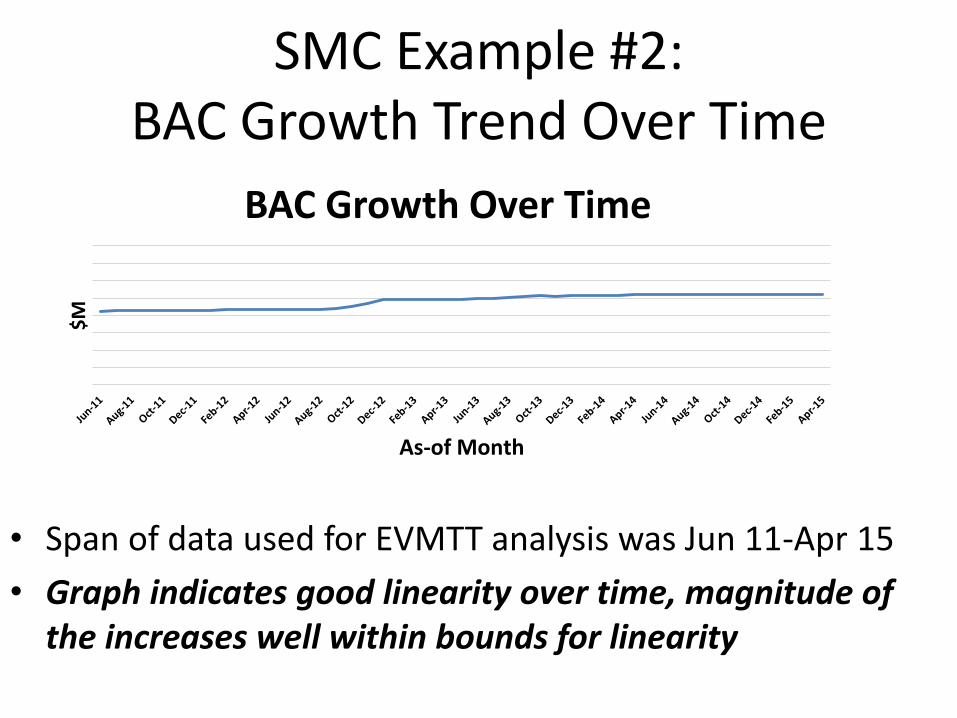
SMC Example #2:BAC Growth Trend Over Time
• Span of data used for EVMTT analysis was Jun 11-Apr 15
• Graph indicates good linearity over time, magnitude of the increases well within bounds for linearity
$M
As-of Month
BAC Growth Over Time
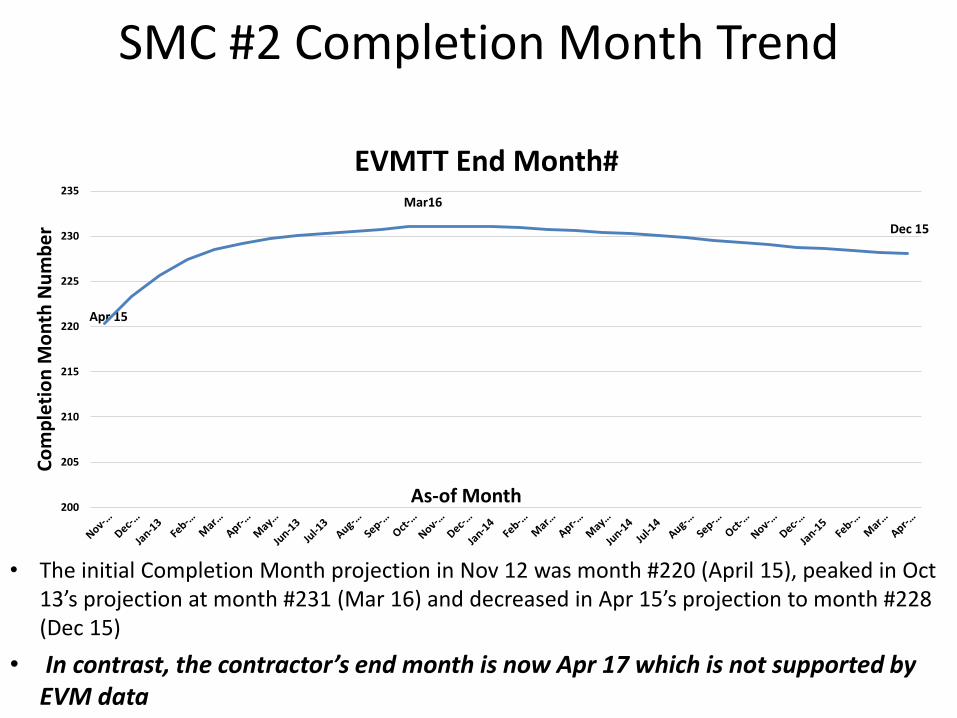
SMC #2 Completion Month Trend
• The initial Completion Month projection in Nov 12 was month #220 (April 15), peaked in Oct 13’s projection at month #231 (Mar 16) and decreased in Apr 15’s projection to month #228 (Dec 15)
• In contrast, the contractor’s end month is now Apr 17 which is not supported by EVM data
Apr 15
Mar16
Dec 15
200
205
210
215
220
225
230
235
Co
mp
leti
on
Mo
nth
Nu
mb
er
As-of Month
EVMTT End Month#
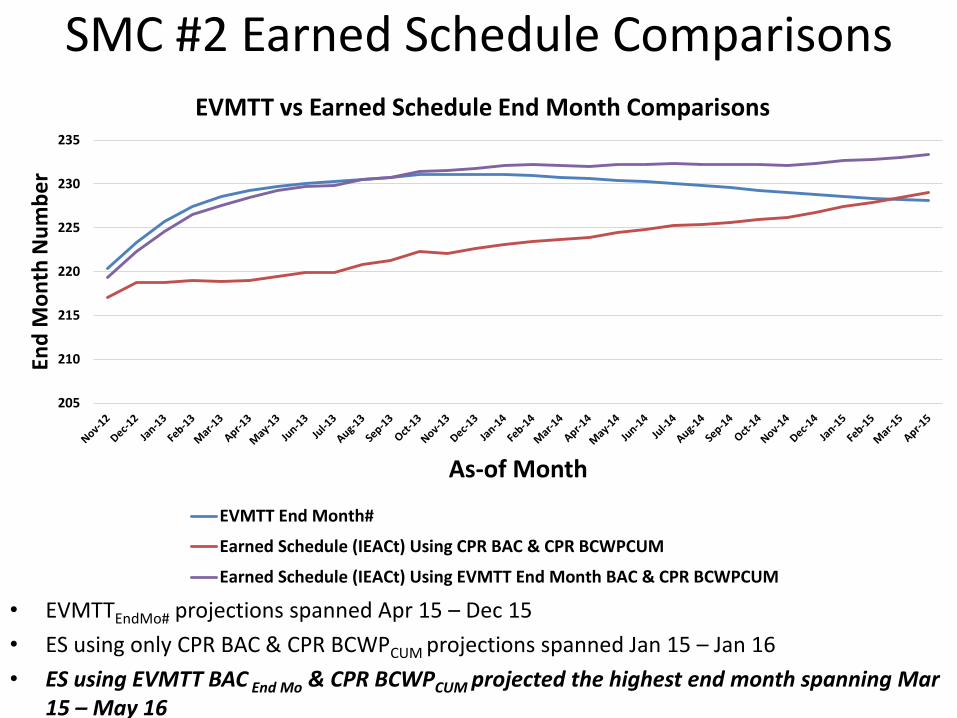
SMC #2 Earned Schedule Comparisons
• EVMTTEndMo# projections spanned Apr 15 – Dec 15
• ES using only CPR BAC & CPR BCWPCUM projections spanned Jan 15 – Jan 16
• ES using EVMTT BAC End Mo & CPR BCWPCUM projected the highest end month spanning Mar 15 – May 16
205
210
215
220
225
230
235
End
Mo
nth
Nu
mb
er
As-of Month
EVMTT vs Earned Schedule End Month Comparisons
EVMTT End Month#
Earned Schedule (IEACt) Using CPR BAC & CPR BCWPCUM
Earned Schedule (IEACt) Using EVMTT End Month BAC & CPR BCWPCUM
SMC #2 BAC Comparisons
• Despite initial jump in BAC in EVMTT End Month BAC, over time a lack of BAC growth allowed the EVMTT projection to converge near the level of CPR reported BAC
$M
As-of Month
CPR vs EVMTT BAC Comparisons
CPR BACRpt Mo EVMTT BACRpt Mo EVMTT BACEnd Mo1
SMC #2 %-Complete Comparisons
• Early BAC increase volatility which gave way to convergence over time
0%
10%
20%
30%
40%
50%
60%
70%
80%
90%
100%
Feb
-12
Mar
-12
Ap
r-1
2
May
-12
Jun
-12
Jul-
12
Au
g-1
2
Sep
-12
Oct
-12
No
v-1
2
Dec
-12
Jan
-13
Feb
-13
Mar
-13
Ap
r-1
3
May
-13
Jun
-13
Jul-
13
Au
g-1
3
Sep
-13
Oct
-13
No
v-1
3
Dec
-13
Jan
-14
Feb
-14
Mar
-14
Ap
r-1
4
May
-14
Jun
-14
Jul-
14
Au
g-1
4
Sep
-14
Oct
-14
No
v-1
4
Dec
-14
Jan
-15
Feb
-15
Mar
-15
Ap
r-1
5
May
-15
%-C
om
ple
te
As-of Month
CPR %-Complete vs Adjusted %-Complete
MONTHLY PERCENT COMPLETE (CPR DATA) ADJUSTED PERCENT COMPLETE2
SMC #2 SCI-Derived EAC Trend
• There has been a decrease in the CPI from 0.98 @ Nov 12 to 0.95 @ Apr 15
• EVMTT LREEndMo and SCI-Derived EAC using EVMTT BACEndMo as well as the CPR
LRE and SCI-Derived EAC have increased over time thus indicating potential
problems
$M
As-of Month
LREs vs SCI-EACs
CPR LRERpt Mo EVMTT LREEnd Mo1
SCI-DERIVED EAC (BCWR = CPR BAC - CPR BCWPCUM) SCI-DERIVED EAC (BCWR = EVMTT BACEnd Mo - CPR BCWPCUM)
SMC #2 Projected VAC Decrease Over Time
• There has been a negative trend observed in the CPR monthly Variance at Completion (VAC) along with a corresponding EVMTT VAC projections
• This is direct EVMTT evidence of some growing problems and is consistent with the contractor’s latest completion month estimate
$M
As-of Month
Report Month vs End Month VAC Comparisons
CPR VACRpt Mo EVMTT VACRpt Mo EVMTT VACEnd Mo
Conclusions DAU LAR & SMC Case Study #2
• DAU LAR case study data had minimal BAC increases so EVMTT-based results showed minimal differences with CPR-based reports
– However, when EVM performance-based methods were used, end month and EAC projections were higher
• SMC Example #2 also had minimal BAC increases over time but decreasing cost performance trends showed up in ever increasingly negative VACs– Plus, the contractor is proposing end month projections beyond what
would be expected


![OFDM error floor based EVM estimation Error Floor Based EVM Estimation.pdfAWGN source producing the same BER (and EVM) degradation. [1]: The resulting EVM(BER) curves were verified](https://img.pdfslide.us/doc/110x75/5f2e7bc463c3260b31328bb2/ofdm-error-floor-based-evm-estimation-error-floor-based-evm-awgn-source-producing.jpg)