Embed Size (px)
Citation preview
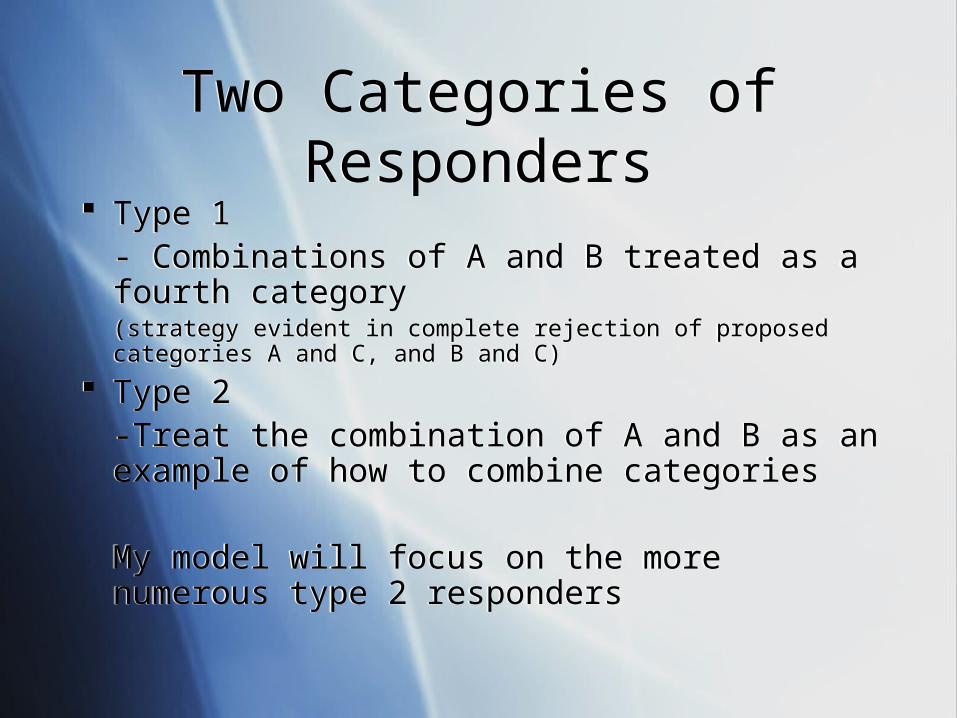
Two Categories of RespondersTwo Categories of Responders Type 1
- Combinations of A and B treated as a fourth category (strategy evident in complete rejection of proposed categories A and C, and B and C)
Type 2-Treat the combination of A and B as an example of how to combine categories
My model will focus on the more numerous type 2 responders
Type 1- Combinations of A and B treated as a fourth category (strategy evident in complete rejection of proposed categories A and C, and B and C)
Type 2-Treat the combination of A and B as an example of how to combine categories
My model will focus on the more numerous type 2 responders
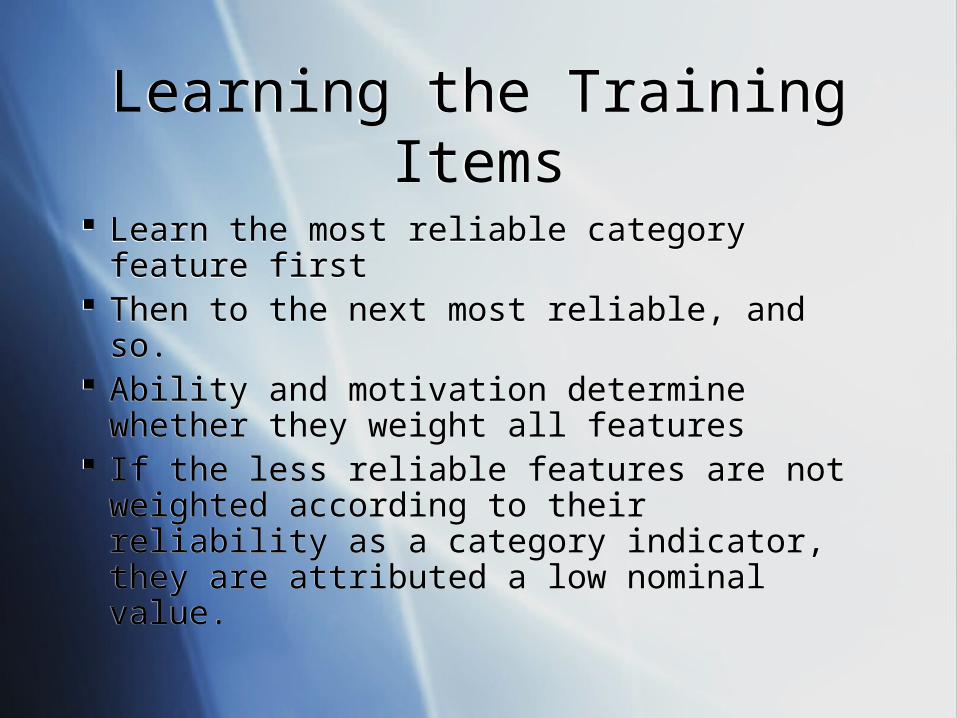
Learning the Training ItemsLearning the Training Items
Learn the most reliable category feature first Then to the next most reliable, and so. Ability and motivation determine whether
they weight all features If the less reliable features are not weighted
according to their reliability as a category indicator, they are attributed a low nominal value.
Learn the most reliable category feature first Then to the next most reliable, and so. Ability and motivation determine whether
they weight all features If the less reliable features are not weighted
according to their reliability as a category indicator, they are attributed a low nominal value.
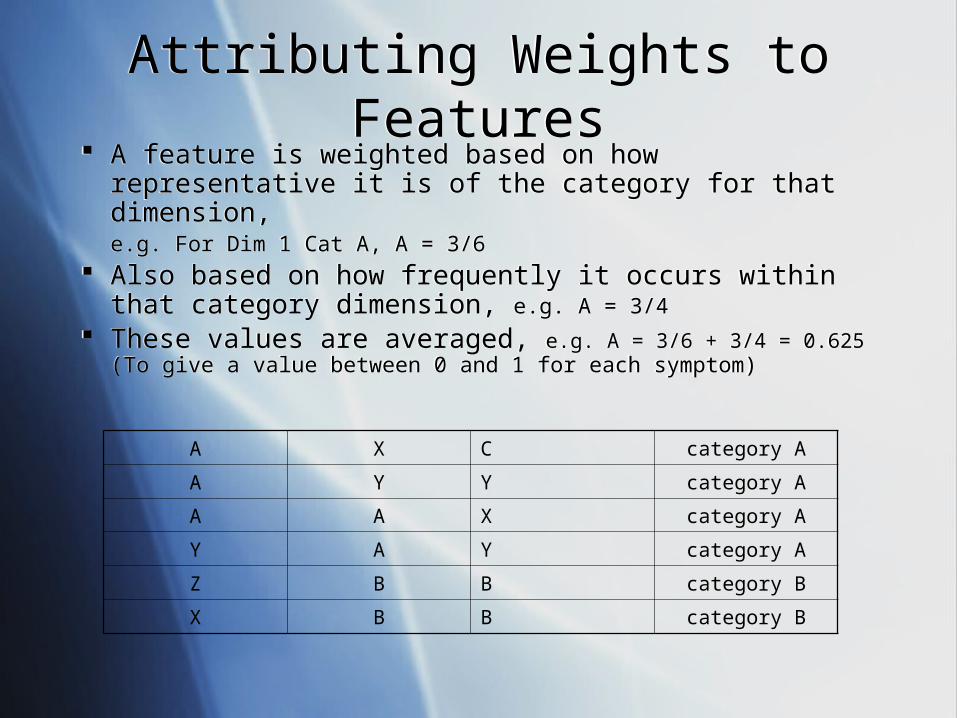
Attributing Weights to FeaturesAttributing Weights to Features A feature is weighted based on how representative it is of
the category for that dimension, e.g. For Dim 1 Cat A, A = 3/6
Also based on how frequently it occurs within that category dimension, e.g. A = 3/4
These values are averaged, e.g. A = 3/6 + 3/4 = 0.625 (To give a value between 0 and 1 for each symptom)
A feature is weighted based on how representative it is of the category for that dimension, e.g. For Dim 1 Cat A, A = 3/6
Also based on how frequently it occurs within that category dimension, e.g. A = 3/4
These values are averaged, e.g. A = 3/6 + 3/4 = 0.625 (To give a value between 0 and 1 for each symptom)
A X C category A
A Y Y category A
A A X category A
Y A Y category A
Z B B category B
X B B category B
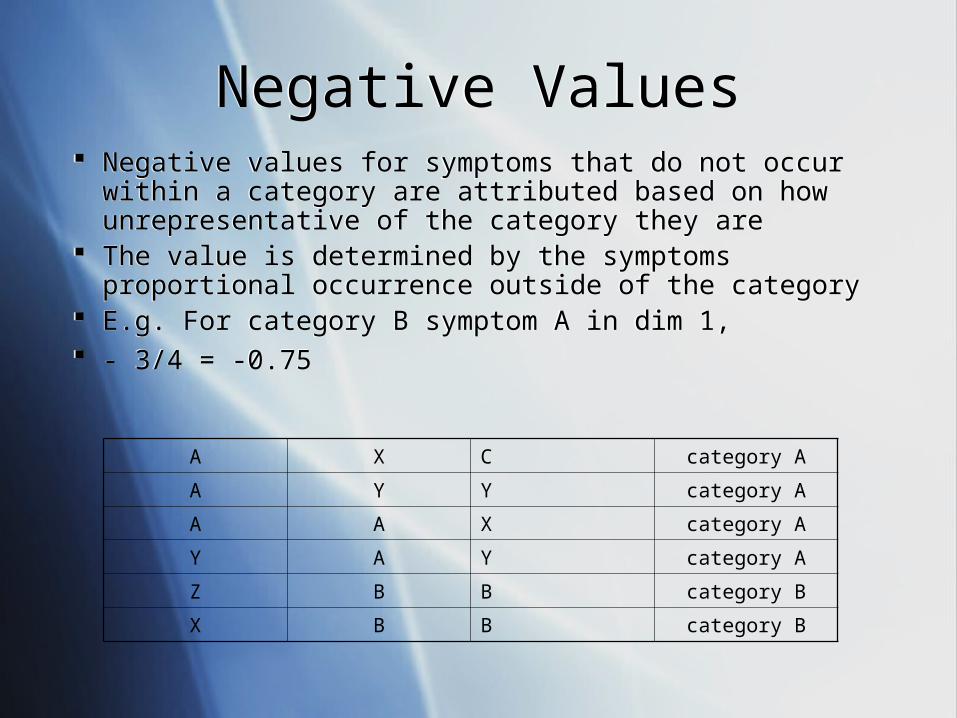
Negative ValuesNegative Values Negative values for symptoms that do not occur within a
category are attributed based on how unrepresentative of the category they are
The value is determined by the symptoms proportional occurrence outside of the category
E.g. For category B symptom A in dim 1, - 3/4 = -0.75
Negative values for symptoms that do not occur within a category are attributed based on how unrepresentative of the category they are
The value is determined by the symptoms proportional occurrence outside of the category
E.g. For category B symptom A in dim 1, - 3/4 = -0.75
A X C category A
A Y Y category A
A A X category A
Y A Y category A
Z B B category B
X B B category B
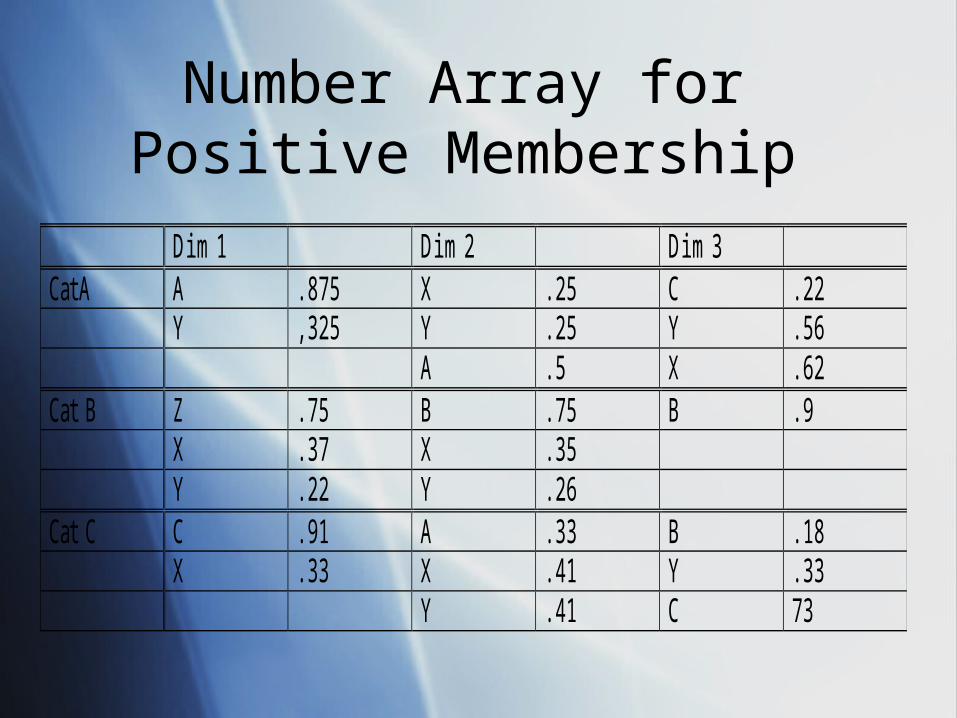
Dim 1 Dim 2 Dim 3 Cat A A .875 X .25 C .22 Y ,325 Y .25 Y .56 A .5 X .62 Cat B Z .75 B .75 B .9 X .37 X .35 Y .22 Y .26 Cat C C .91 A .33 B .18 X .33 X .41 Y .33 Y .41 C 73
Number Array for Positive Membership

Evaluating the Training ItemsEvaluating the Training Items
Based on the symptom values we can calculate how well these values categorize the training items
We can later use the averages and standard deviations of these values to help determine the membership scores for test items
Based on the symptom values we can calculate how well these values categorize the training items
We can later use the averages and standard deviations of these values to help determine the membership scores for test items
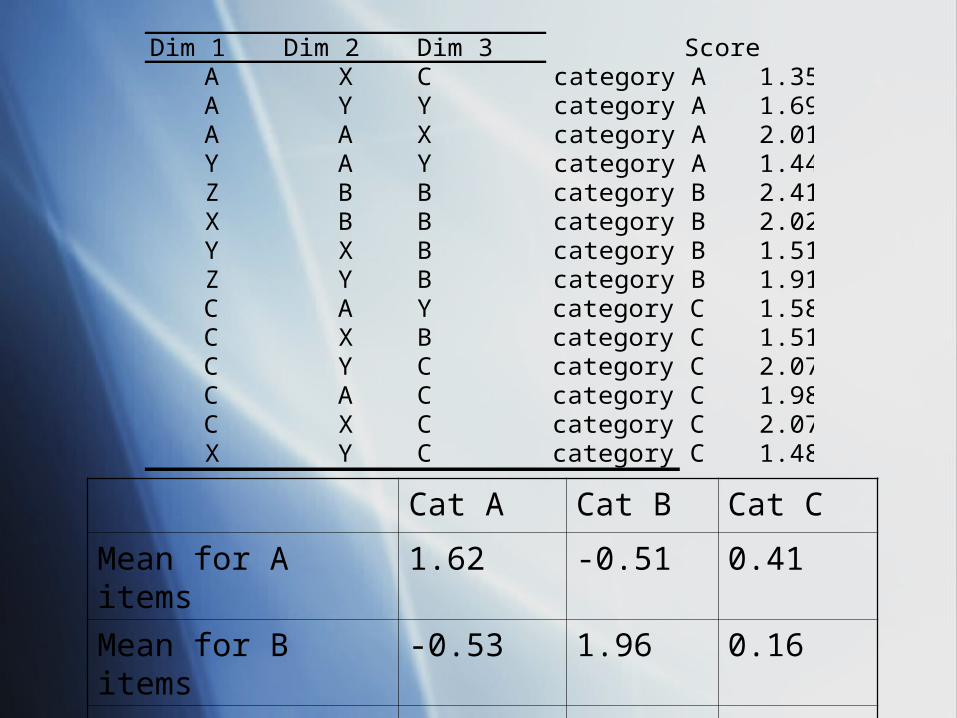
Dim 1 Dim 2 Dim 3 ScoreA X C category A 1.35A Y Y category A 1.69A A X category A 2.01Y A Y category A 1.44Z B B category B 2.41X B B category B 2.02Y X B category B 1.51Z Y B category B 1.91C A Y category C 1.58C X B category C 1.51C Y C category C 2.07C A C category C 1.98C X C category C 2.07X Y C category C 1.48
Cat A Cat B Cat C
Mean for A items 1.62 -0.51 0.41
Mean for B items -0.53 1.96 0.16
Mean for C items 0.04 -0.51 1.78

QuickTime™ and a decompressor
are needed to see this picture.
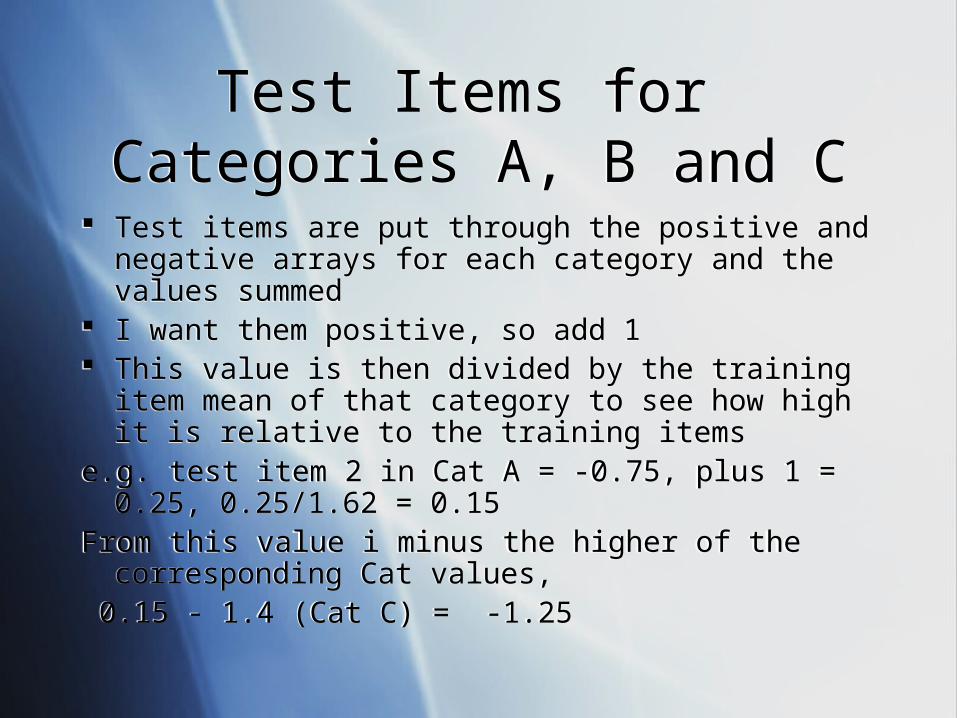
Test Items for Categories A, B and C
Test Items for Categories A, B and C
Test items are put through the positive and negative arrays for each category and the values summed
I want them positive, so add 1 This value is then divided by the training item mean of that
category to see how high it is relative to the training itemse.g. test item 2 in Cat A = -0.75, plus 1 = 0.25, 0.25/1.62 =
0.15From this value i minus the higher of the corresponding Cat
values, 0.15 - 1.4 (Cat C) = -1.25

QuickTime™ and a decompressor
are needed to see this picture.

QuickTime™ and a decompressor
are needed to see this picture.
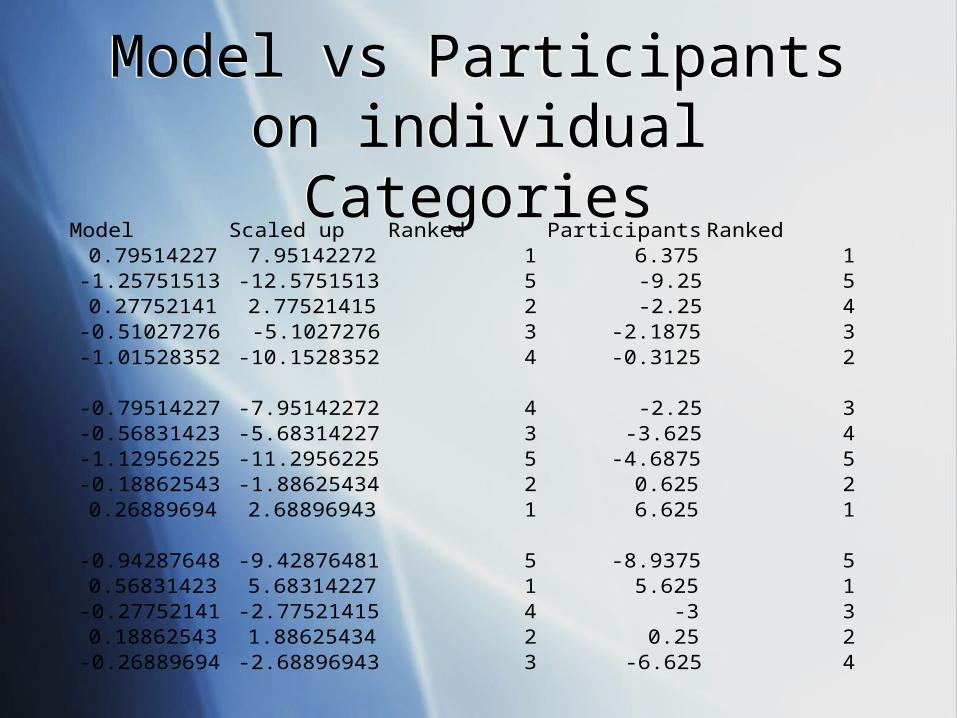
Model vs Participantson individual Categories
Model vs Participantson individual Categories
Model Scaled up Ranked Participants Ranked0.79514227 7.95142272 1 6.375 1
-1.25751513 -12.5751513 5 -9.25 50.27752141 2.77521415 2 -2.25 4
-0.51027276 -5.1027276 3 -2.1875 3-1.01528352 -10.1528352 4 -0.3125 2
-0.79514227 -7.95142272 4 -2.25 3-0.56831423 -5.68314227 3 -3.625 4-1.12956225 -11.2956225 5 -4.6875 5-0.18862543 -1.88625434 2 0.625 20.26889694 2.68896943 1 6.625 1
-0.94287648 -9.42876481 5 -8.9375 50.56831423 5.68314227 1 5.625 1
-0.27752141 -2.77521415 4 -3 30.18862543 1.88625434 2 0.25 2
-0.26889694 -2.68896943 3 -6.625 4
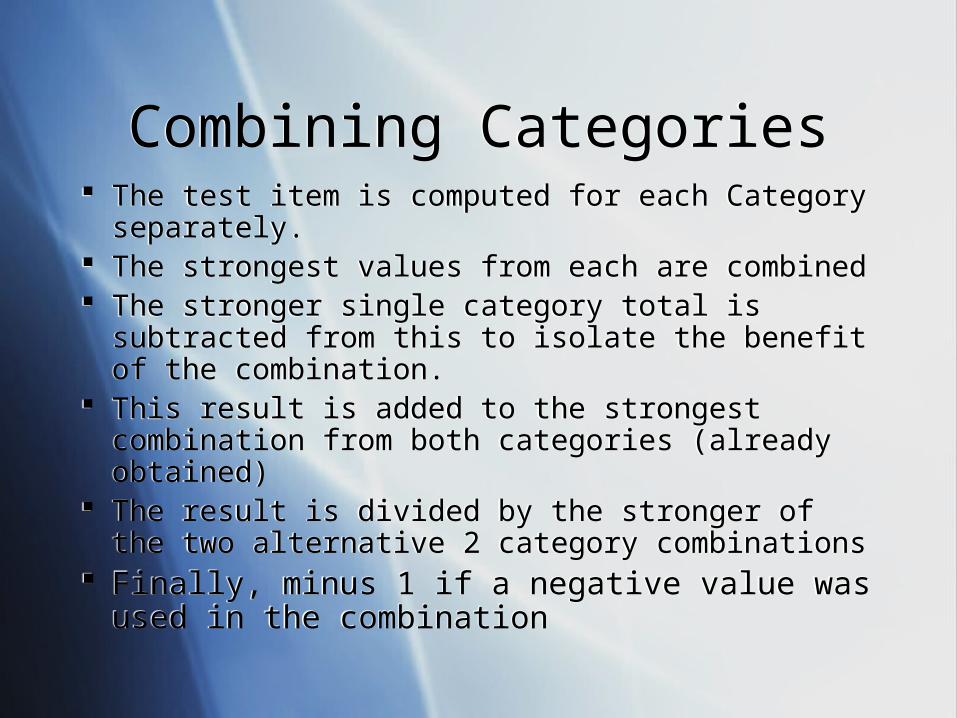
Combining CategoriesCombining Categories The test item is computed for each Category
separately. The strongest values from each are combined The stronger single category total is subtracted from
this to isolate the benefit of the combination. This result is added to the strongest combination from
both categories (already obtained) The result is divided by the stronger of the two
alternative 2 category combinations Finally, minus 1 if a negative value was used in
the combination
The test item is computed for each Category separately.
The strongest values from each are combined The stronger single category total is subtracted from
this to isolate the benefit of the combination. This result is added to the strongest combination from
both categories (already obtained) The result is divided by the stronger of the two
alternative 2 category combinations Finally, minus 1 if a negative value was used in
the combination
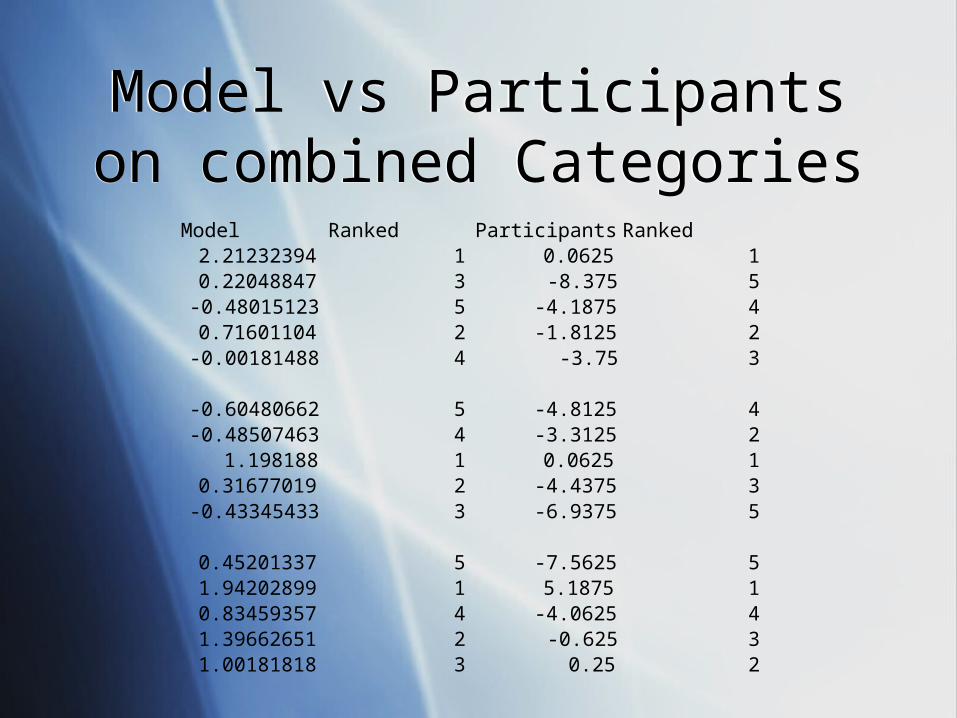
Model vs Participantson combined Categories
Model vs Participantson combined Categories
Model Ranked Participants Ranked2.21232394 1 0.0625 10.22048847 3 -8.375 5
-0.48015123 5 -4.1875 40.71601104 2 -1.8125 2
-0.00181488 4 -3.75 3
-0.60480662 5 -4.8125 4-0.48507463 4 -3.3125 2
1.198188 1 0.0625 10.31677019 2 -4.4375 3
-0.43345433 3 -6.9375 5
0.45201337 5 -7.5625 51.94202899 1 5.1875 10.83459357 4 -4.0625 41.39662651 2 -0.625 31.00181818 3 0.25 2