Embed Size (px)
Citation preview

A world leader in IP commerce
Patents ● Copyright ● Trademarks ● Trade
Secrets ● Designs ● Know how ● Technology ● Research collaborations
www.ipexchange.global
Twitter: @BirgitteBIC

1990 2000 2010 1948 1968 1988 2008
Investment in UK intangibles is exceeding
tangibles
Intangible contributions to the economy
today are exceeding tangible assets
(US example)
Trends in intangible investment and contribution
Intangibles Tangibles Financial burst
£ billion %
50
150
100
2
4
6
8
10
12
14

What are intangible assets? (OECD classification)
• Software
• Databases
• Big Data
Computerised information
• Scientific and non-scientific R&D
• Copyrights, designs, trademarks, patents (IPR)
• Creative and inventive activities
Innovative property
• Branding and reputation (advertising)
• Firm specific human capital (training)
• Business process investments
• Networks
Economic competencies

Stone Age
Bronze Age
Iron Age
1760-1830: Early mechanisation
Water power
1830-1890: Steam
Steel
Railway
1890-1940: Electrical
engineering
Chemistry
1940-1985: Mass
production
Petrochemicals
Oil
1985-2020: Software
New media
Internet
Big Data
2020-2040: Health & life sciences
Sustainability
Low carbon
Waves of economic progress towards the intangible economy
Rate
of
Econom
ic A
ctivity
Unknown
future
Artificial
intelligence Virtual reality
© Big Innovation Centre

THE GLOBAL ADDRESSABLE IP EXCHANGE MARKET IS HUGE BUT THERE ARE IP HOT-SPOTS
Dominant countries are: • China, Japan, India & Republic of Korea • USA and Canada • Brazil • Germany & France
Patent Utility Model Trademark Industrial Design
Geographical
region Applications
Share of
total (%) Applications
Share of total
(%) Applications
Share of
total (%) Applications
Share
of total
(%)
Africa 14,900 0.6 175 0.02 207,017 2.8 17,300 1.5
Asia 1,607,500 60.0 893,276 94.1 3,855,689 51.8 764,600 67.2
Europe 346,200 12.9 49,640 5.2 1,982,973 26.6 290,000 25.5
Latin America &
the Caribbean 64,100 2.4 4,282 0.5 626,168 8.4 15,600 1.4
North America 614,300 22.9 617,439 8.3 41,100 3.6
Oceania 33,900 1.3 1,523 0.2 160,108 2.1 9,800 0.9
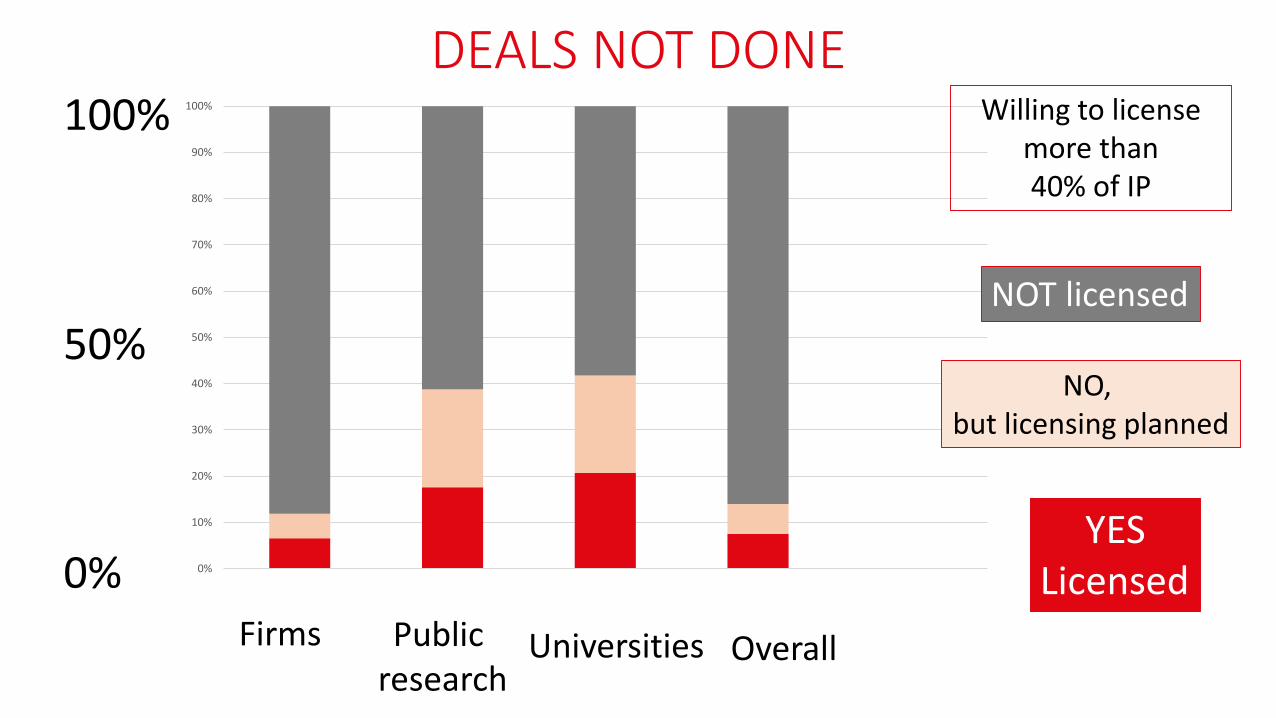
DEALS NOT DONE
0%
10%
20%
30%
40%
50%
60%
70%
80%
90%
100%
Firms Public Research Organizations Universities Total of all organizations
Yes No, but licensing planned No
Firms Public research
Universities Overall
YES Licensed
NO, but licensing planned
NOT licensed
0%
100%
50%
Willing to license more than 40% of IP

Stage 1: Unlicensed IP
40.2% of unlicensed IP has an identifiable seller and buyer
Stage 2: Negotiation
50.1% of those start negotiations
Stage 3: Agreement
56.3% of those reach an agreement
11 % probability of a successful transaction
DEALS NOT DONE even when seller and buyers are identified

SEARCH:
No ‘marketplace’ for sellers and buyers to meet
IP tends to be traded in a ponderous bespoke
manner
CONTRACT NEGOTIATION:
Too many parties at the table - internal decision
makers, lawyers, brokers…
Long process - bureaucracy and paperwork
TRANSPARENCY:
Unclear deal terms and trust of potential traders
No single market for IP - Lack of agreed standard,
norms & rules
A SIGN OF MARKET FAILURE !

0.00%
5.00%
10.00%
15.00%
20.00%
25.00%
Average Brokerage Commissions
UK top 16 IP agents have combined revenue of £400m & profit of £100m
PATENTS 25%
Residential real estate
5.3%
Large and small capitalization equities: < 1%
Source: ITG, Real Trends, CDC Group IAM (Intellectual Asset Management) magazine March/April 2014
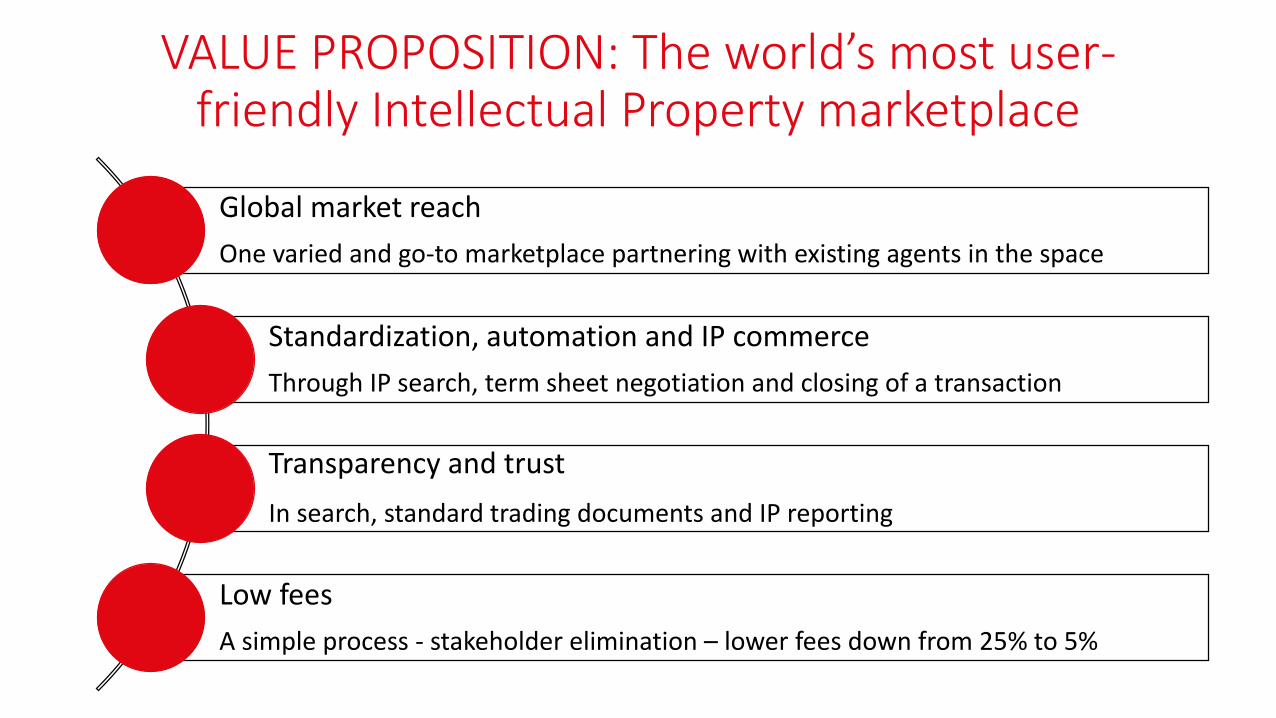
VALUE PROPOSITION: The world’s most user-friendly Intellectual Property marketplace
Global market reach
One varied and go-to marketplace partnering with existing agents in the space
Standardization, automation and IP commerce
Through IP search, term sheet negotiation and closing of a transaction
Transparency and trust
In search, standard trading documents and IP reporting
Low fees
A simple process - stakeholder elimination – lower fees down from 25% to 5%
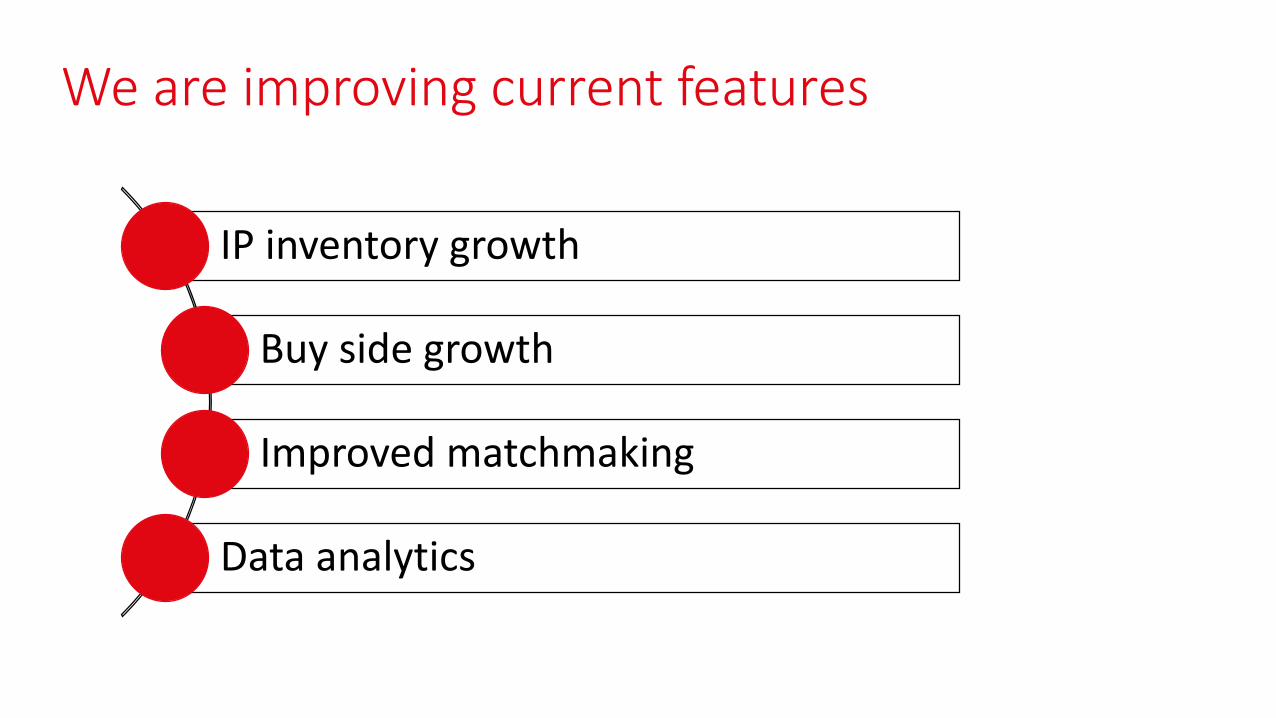
IP inventory growth
Buy side growth
Improved matchmaking
Data analytics
We are improving current features
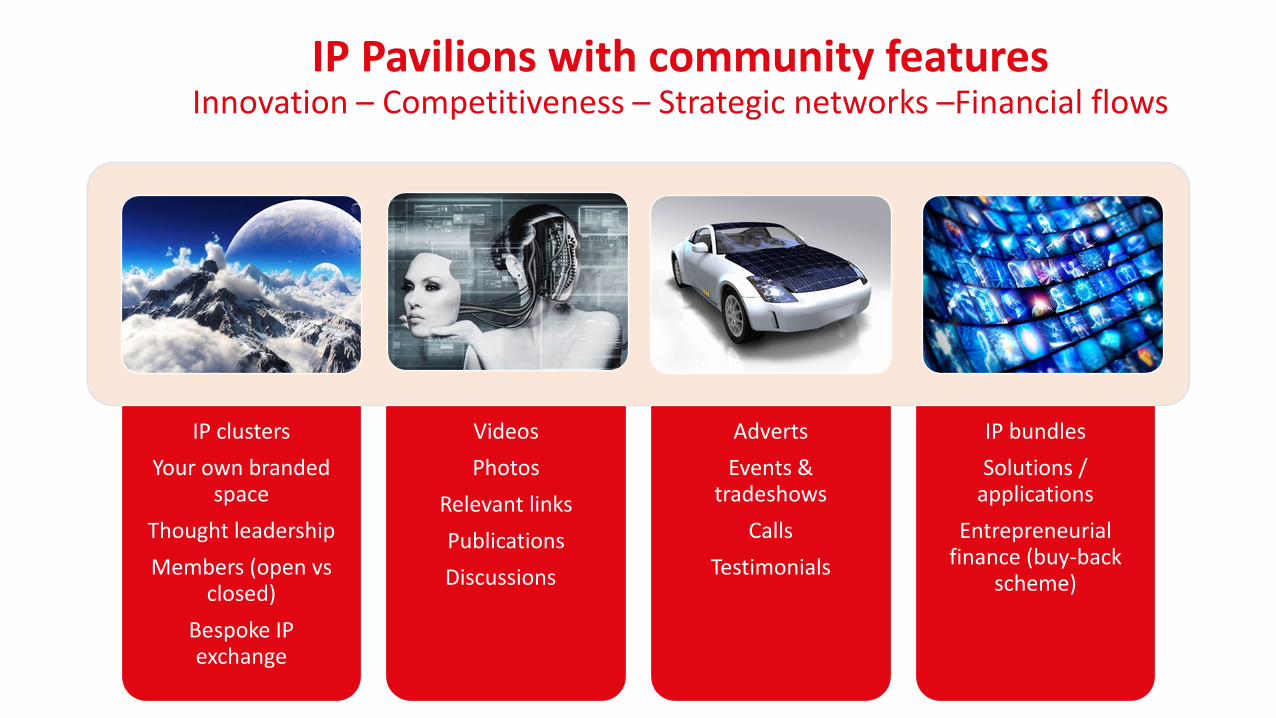
IP clusters
Your own branded space
Thought leadership
Members (open vs closed)
Bespoke IP exchange
Videos
Photos
Relevant links
Publications
Discussions
Adverts
Events & tradeshows
Calls
Testimonials
IP bundles
Solutions / applications
Entrepreneurial finance (buy-back
scheme)
IP Pavilions with community features Innovation – Competitiveness – Strategic networks –Financial flows

A STANDARDIZED IP REPORT
For:
Inventory management
Investment
Recapture value
ARTIFICIAL INTELLIGENCE (AI)
Machine learning
Natural Language Processing
Why investment is needed? New features: Virtual reality, reporting and data analytics

AGENTS IN OUR SPACE
TYPE OF IP AGENTS
Licensing Agents
(e.g. real-estate agents in renting markets)
Company Portals
IP Brokers
(e.g. real-estate agents in buying–selling markets)
IP Auction Houses
(e.g. Christies auction house)
Clearinghouses, Bulletin Boards, and Innovation Portals
(e.g. the Gumtree of patents)
Analytics Software and Services Firms
(e.g. software tools to help valuing patents)
University Technology Transfer Intermediaries
(e.g. brokers but focusing on universities)
IP Trading Platforms/IP Transaction on agreed new rules.
(e.g. NASDAQ of IP)
Government Sponsored
(e.g. IP services and aiming to establish connections)
In contrast INTELLECTUAL PROPERTY
EXCHANGE do:
Not experiment with new models
to monetize patents
Use an automated and
standardized process for IP trade
Trade a whole variety of IP from
low to high value
Operate cross sector, cross
institution type, and globally
Develop IP communities

Key assets
COMPANY SPECIFIC:
• Registered company INTELLECTUAL PROPERTY EXCHANGE LIMITED (Company No. 09597427)
• Registered trademark: UK00003113470
• Web domain: www.ipexchange.global
SOFTWARE PLATFORM SPECIFIC:
• No technology risk - a robust, secure and scalable cloud architecture
• Proprietary software enabled database architecture for classifying and searching on IP (including assets transferred from Montreal Medical International)
• Proprietary software enabled database architecture for peer to peer IP transactions: buyer, selling, licensing (exclusive or non exclusive), IP pricing (fixed, negotiated)
• Proprietary IP user licenses: IP browser , buyer, seller licenses for trading IP (working with Olswang)
• Proprietary standardized and customizable IP transaction contracts for selling and licensing IP, including Patents, Copyright, Trademarks, Trade Secrets, Designs, Technology, Ideas, Research collaborations)
• Critical mass of users and 8000 units of IP across 600 categories: More than 100 class universities plus a handful of companies

WHAT:
• 10 000 IP postings
• 700 organizations / users
• 600 IP categories (strong in medical, pharma, chemistry, engineering, communications, high tech)
Examples: IP from a 150 world class universities plus a dozen companies
For example:
• Johns Hopkins, Columbia, Rockefeller University (USA)
• McGill University (Canada)
• Inserm-Transfert (France)
• Yissum – Hebrew University (Israel)
• Parque Scientifico Technologico Pando (Uruguay)
• CONICET (Argentina)
• Misr El Kheir Foundation (Egypt)
• King’s College London (UK)
• Merck KGaA
• BASF
• Johnson & Johnson
• National Research Council of Canada
• Canadian Space Agency
WHO: Have on-boarded IP or cross-linked with (or about to) existing platforms: • Malaysia PatentMall • Australian SourceIP • Danish IP market place • UK Copyright Hub of the Digital Catapult • Global Tech IP in China • A major science park in China • Similar organizations across central Europe,
United States and Israel

Three types of investors for IP EXCHANGE
Venture Capitalist Strategic investor to share business
model
Big user of IP Exchange
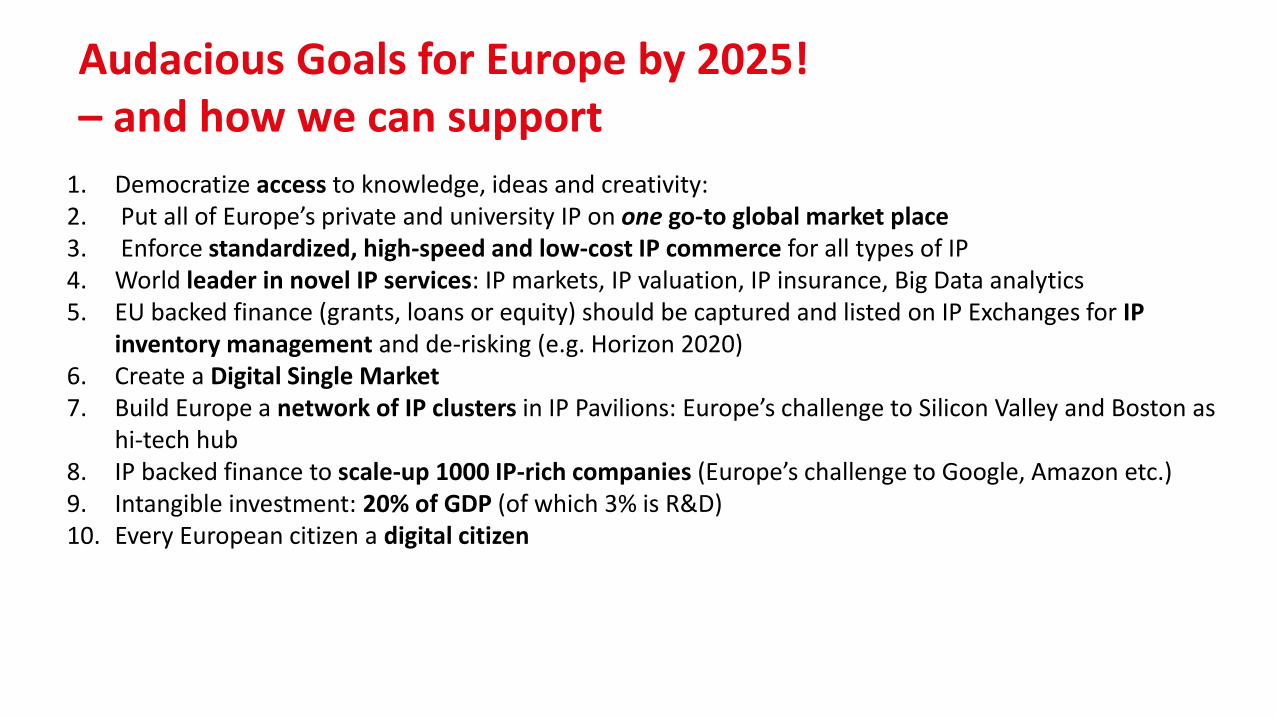
Audacious Goals for Europe by 2025! – and how we can support
1. Democratize access to knowledge, ideas and creativity: 2. Put all of Europe’s private and university IP on one go-to global market place 3. Enforce standardized, high-speed and low-cost IP commerce for all types of IP 4. World leader in novel IP services: IP markets, IP valuation, IP insurance, Big Data analytics 5. EU backed finance (grants, loans or equity) should be captured and listed on IP Exchanges for IP
inventory management and de-risking (e.g. Horizon 2020) 6. Create a Digital Single Market 7. Build Europe a network of IP clusters in IP Pavilions: Europe’s challenge to Silicon Valley and Boston as
hi-tech hub 8. IP backed finance to scale-up 1000 IP-rich companies (Europe’s challenge to Google, Amazon etc.) 9. Intangible investment: 20% of GDP (of which 3% is R&D) 10. Every European citizen a digital citizen

BIRGITTE ANDERSEN [email protected]
Ergon House, Horseferry Road, London SW1P 2AL
Telephone +44 (0)20 3713 4036 | [email protected] | Twitter @BigInnovCentre