Embed Size (px)
Citation preview
Twenty-Years of Radiation Measurements inLow Earth Orbit: What Have We Learned?
M.J. GolightlyNASA Johnson Space Center
M.D. Weyland, A.S. Johnson, and E.SemonesNASA Johnson Space Center/Lockheed-Martin
Radiation Measurements During MannedMissions—What Can We Learn?
• Efforts under way to improve and/or develop new trappedradiation models‹ NASA’s “Living With a Star” (LWS) program‹ USAF Phillips Lab‹ ESA’s TREND program
• On-going trapped radiation modeling activity include empirical,semi-empirical, and physics-based approaches
• Space missions being planned to answer important trappedradiation belt science questions‹ NASA’s LWS “Geospace Mission” effort
• Until new data sets available, modelers and theoreticianscontinuously looking for existing data
• What can be learned from radiation measurements during thepast 20 years of Shuttle, Mir, and ISS missions to improve theunderstanding or models of the trapped radiation environment
Trapped Radiation Belt Monitoring DuringManned Space Flight--Synopsis
• Since the advent of manned space flight 40 years ago, scientists and healthphysicists have monitored the local low-Earth orbit (LEO) space radiationenvironment inside and outside the spacecraft in order to understand andquantify the exposure received by human crews
• First 25 years, monitoring typically performed with simple omni-directional,integrating passive radiation absorbed dose detectors similar to those used forradiation protection monitoring of radiation protection workers.
• Past 15 years, more advanced active instruments have been introduced whichprovide time-resolved measurements, some information about the physicalproperties of the radiation, and in some cases improved directionalityinformation.
• Measurement periods in a particular LEO region range from relative“snapshots” of just a few days to 1.5 solar cycles.
• These measurements comprise an important database of the LEO spaceradiation environment‹ Covering nearly 9,000 days in orbit‹ More than three solar cycles‹ 200-600 km‹ Magnetic latitudes up to approximately 75°.
Trapped Radiation Belt Monitoring DuringManned Space Flight—What Can We Learn?
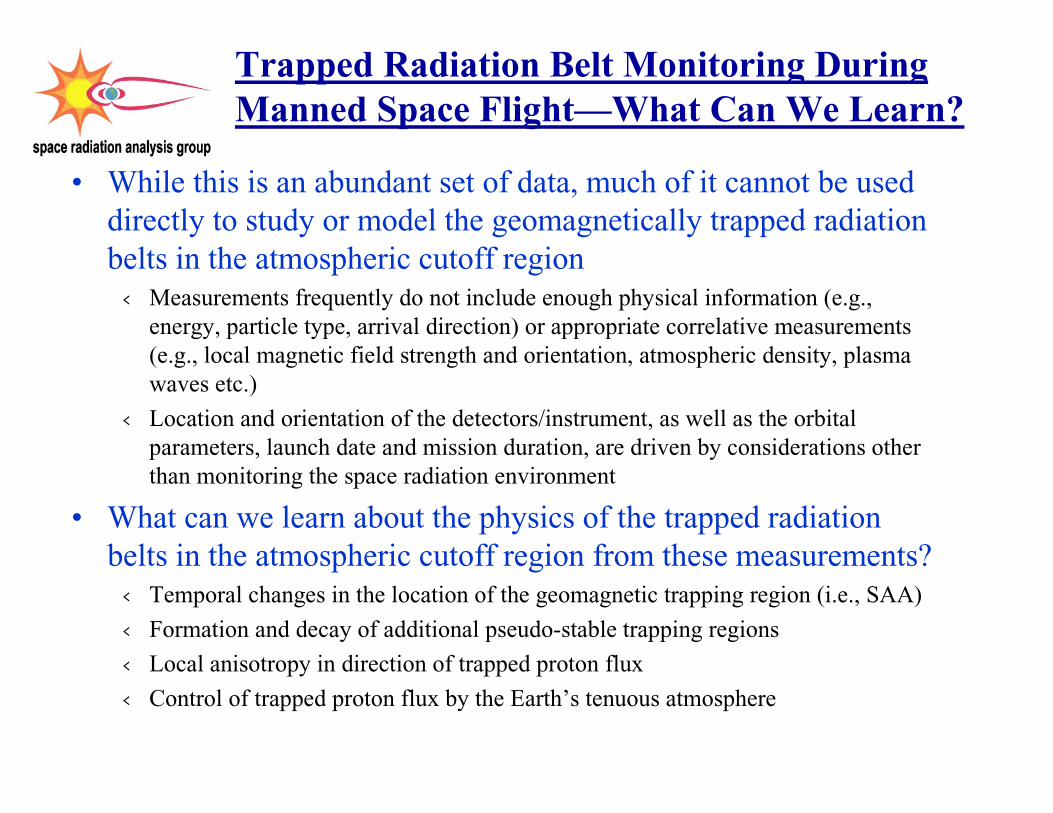
• While this is an abundant set of data, much of it cannot be useddirectly to study or model the geomagnetically trapped radiationbelts in the atmospheric cutoff region‹ Measurements frequently do not include enough physical information (e.g.,
energy, particle type, arrival direction) or appropriate correlative measurements(e.g., local magnetic field strength and orientation, atmospheric density, plasmawaves etc.)
‹ Location and orientation of the detectors/instrument, as well as the orbitalparameters, launch date and mission duration, are driven by considerations otherthan monitoring the space radiation environment
• What can we learn about the physics of the trapped radiationbelts in the atmospheric cutoff region from these measurements?‹ Temporal changes in the location of the geomagnetic trapping region (i.e., SAA)
‹ Formation and decay of additional pseudo-stable trapping regions
‹ Local anisotropy in direction of trapped proton flux
‹ Control of trapped proton flux by the Earth’s tenuous atmosphere
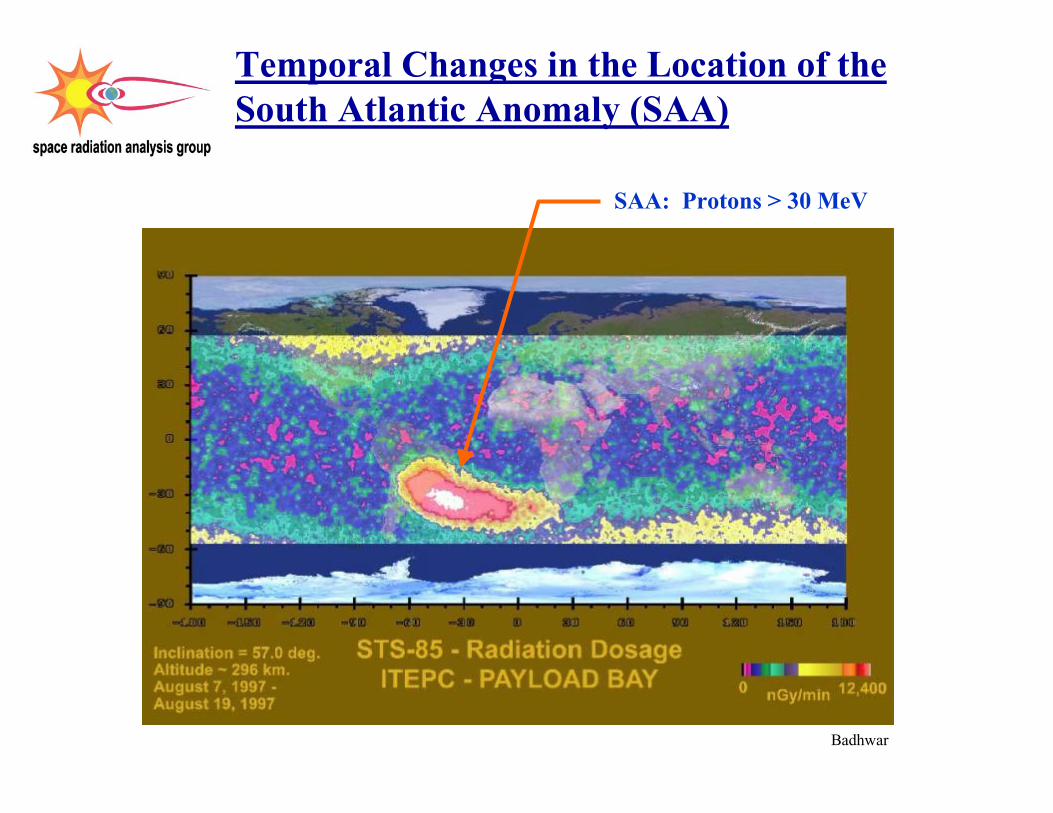
Temporal Changes in the Location of theSouth Atlantic Anomaly (SAA)
SAA: Protons > 30 MeV
Badhwar
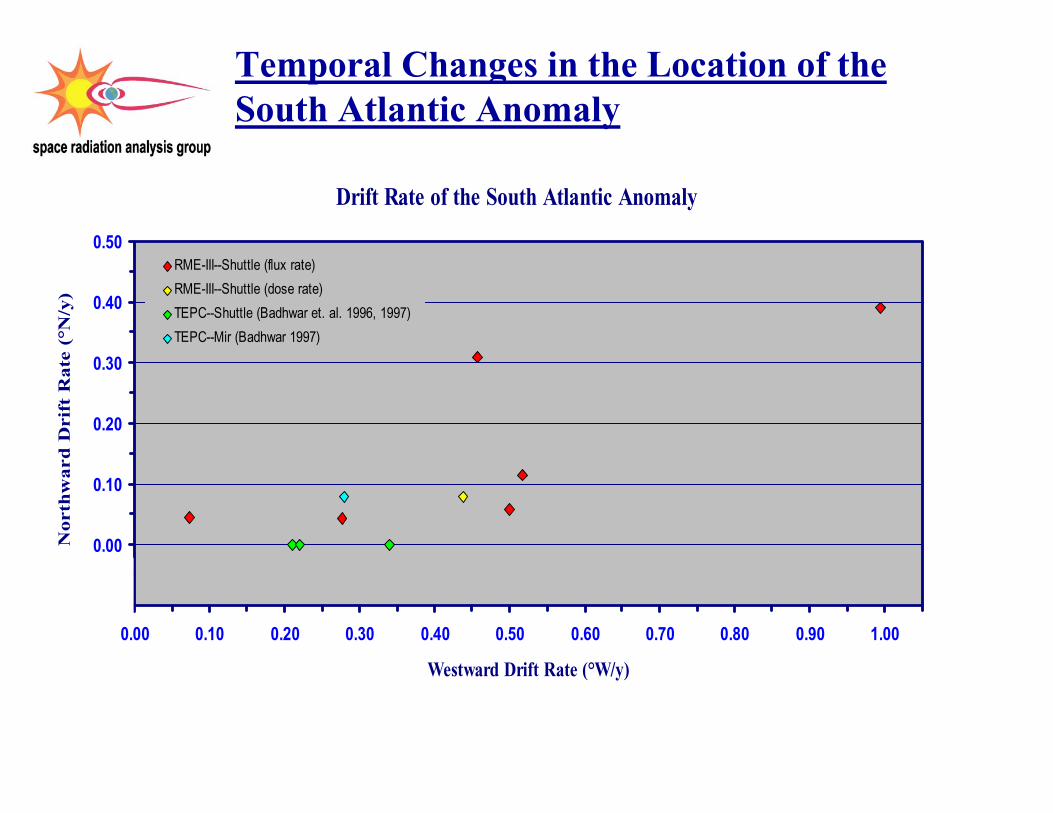
Temporal Changes in the Location of theSouth Atlantic Anomaly
Drift Rate of the South Atlantic Anomaly
-0.10
0.00
0.10
0.20
0.30
0.40
0.50
0.00 0.10 0.20 0.30 0.40 0.50 0.60 0.70 0.80 0.90 1.00
Westward Drift Rate (°W/y)
Nort
hw
ard
Dri
ftR
ate
(°N
/y)
RME-III--Shuttle (flux rate)
RME-III--Shuttle (dose rate)
TEPC--Shuttle (Badhwar et. al. 1996, 1997)
TEPC--Mir (Badhwar 1997)
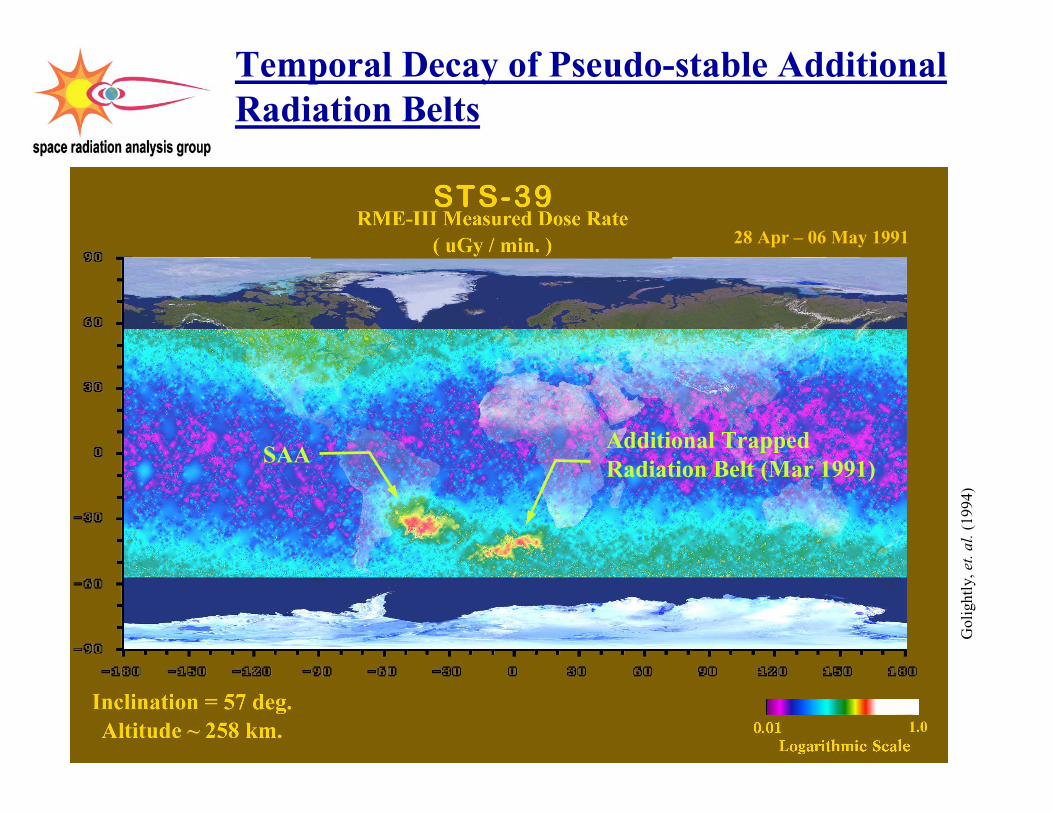
Temporal Decay of Pseudo-stable AdditionalRadiation Belts
SAAAdditional TrappedRadiation Belt (Mar 1991)
Gol
ight
ly,e
t.al
.(19
94)
28 Apr – 06 May 1991
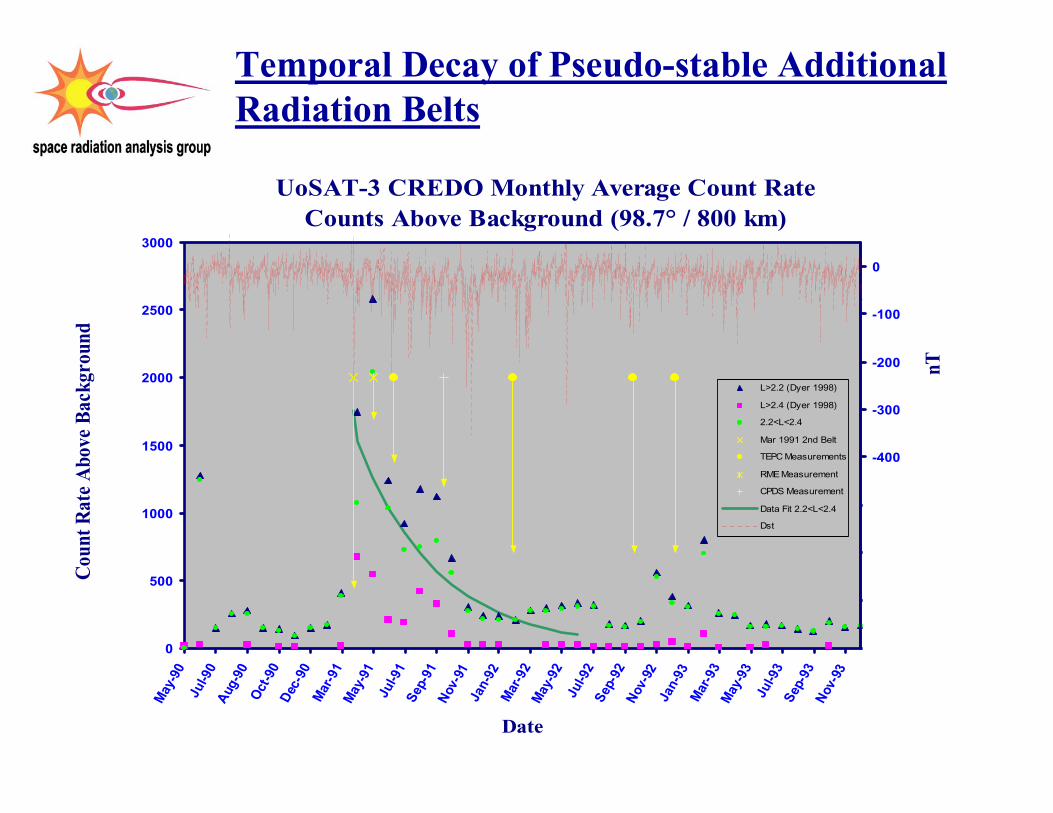
Temporal Decay of Pseudo-stable AdditionalRadiation Belts
UoSAT-3 CREDO Monthly Average Count RateCounts Above Background (98.7° / 800 km)
0
500
1000
1500
2000
2500
3000
May
-90
Jul-9
0A
ug-9
0O
ct-9
0D
ec-9
0M
ar-9
1M
ay-9
1Ju
l-91
Sep-
91N
ov-9
1Ja
n-92
Mar
-92
May
-92
Jul-9
2Se
p-92
Nov
-92
Jan-
93M
ar-9
3M
ay-9
3Ju
l-93
Sep-
93N
ov-9
3
Date
Cou
ntR
ate
Abo
veB
ackg
roun
d
-800
-700
-600
-500
-400
-300
-200
-100
0
nT
L>2.2 (Dyer 1998)
L>2.4 (Dyer 1998)
2.2<L<2.4
Mar 1991 2nd Belt
TEPC Measurements
RME Measurement
CPDS Measurement
Data Fit 2.2<L<2.4
Dst
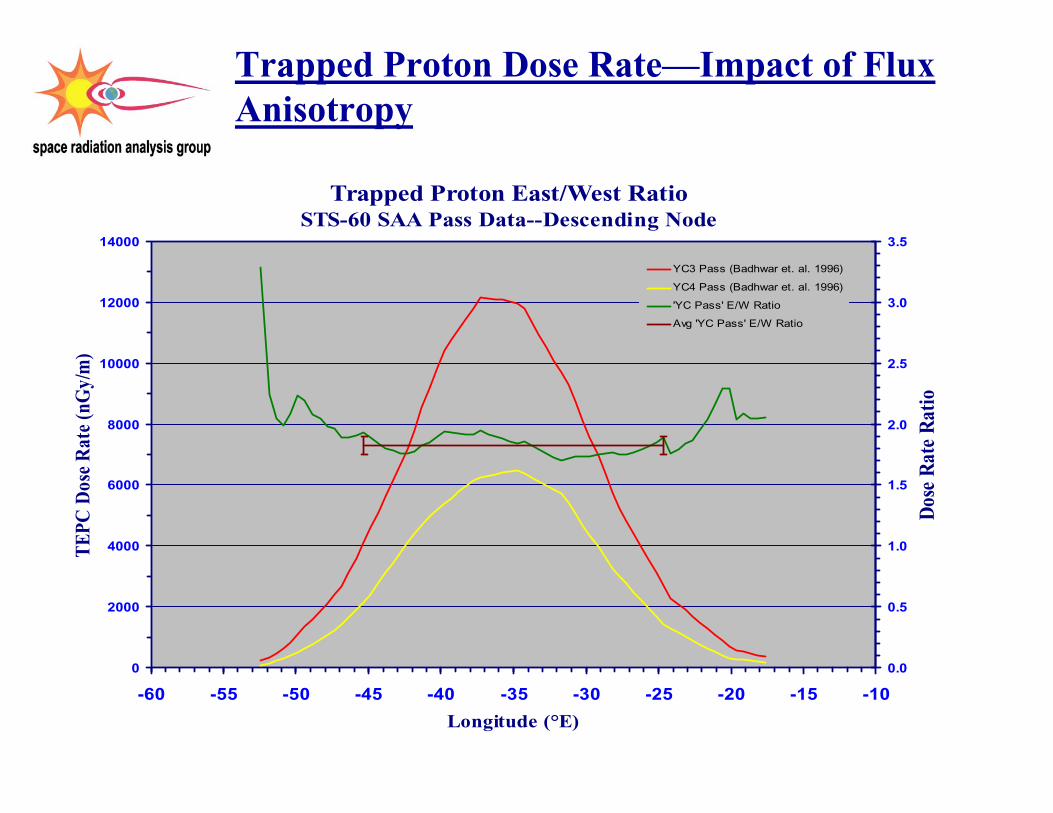
Trapped Proton Dose Rate—Impact of FluxAnisotropy
Trapped Proton East/West RatioSTS-60 SAA Pass Data--Descending Node
0
2000
4000
6000
8000
10000
12000
14000
-60 -55 -50 -45 -40 -35 -30 -25 -20 -15 -10
Longitude (°E)
TE
PCD
ose
Rat
e(n
Gy/
m)
0.0
0.5
1.0
1.5
2.0
2.5
3.0
3.5
Dos
eR
ate
Rat
io
YC3 Pass (Badhwar et. al. 1996)
YC4 Pass (Badhwar et. al. 1996)
'YC Pass' E/W Ratio
Avg 'YC Pass' E/W Ratio
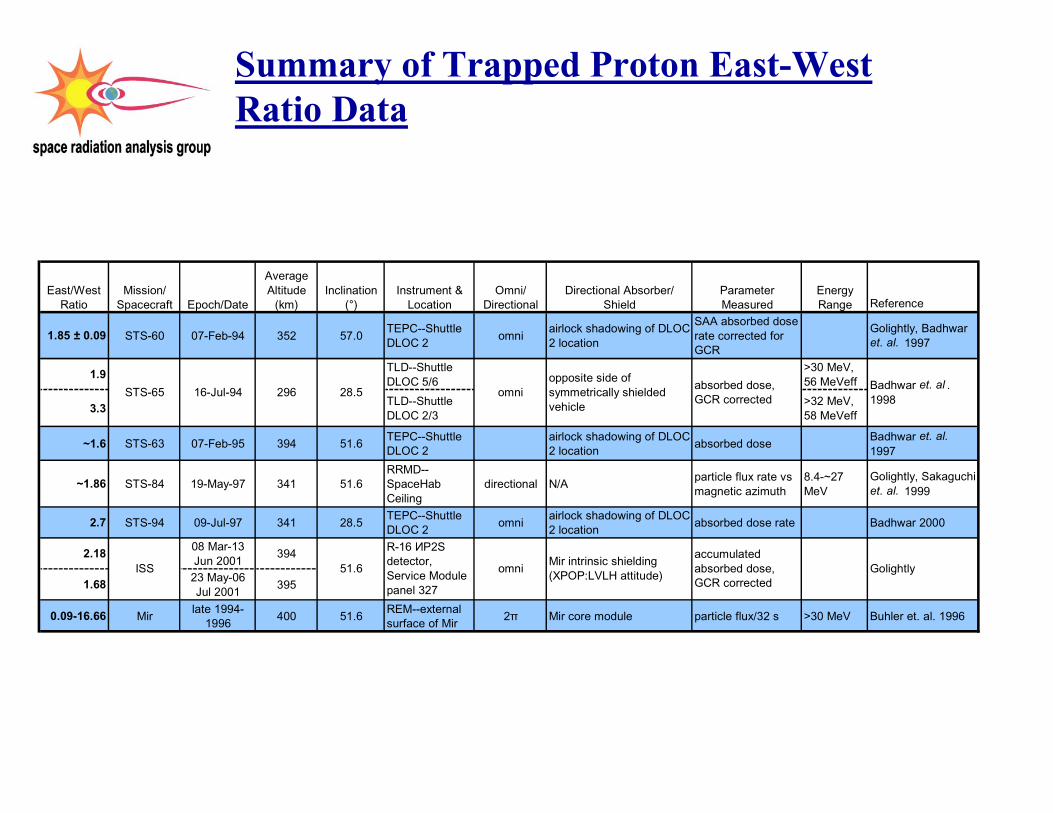
Summary of Trapped Proton East-WestRatio Data
Reference
1.85 ± 0.09 STS-60 07-Feb-94 352 57.0TEPC--ShuttleDLOC 2
omniairlock shadowing of DLOC2 location
SAA absorbed doserate corrected forGCR
Golightly, Badhwaret. al. 1997
1.9TLD--ShuttleDLOC 5/6
>30 MeV,56 MeVeff
3.3TLD--ShuttleDLOC 2/3
>32 MeV,58 MeVeff
~1.6 STS-63 07-Feb-95 394 51.6TEPC--ShuttleDLOC 2
airlock shadowing of DLOC2 location
absorbed doseBadhwar et. al.1997
~1.86 STS-84 19-May-97 341 51.6RRMD--SpaceHabCeiling
directional N/Aparticle flux rate vsmagnetic azimuth
8.4-~27MeV
Golightly, Sakaguchiet. al. 1999
2.7 STS-94 09-Jul-97 341 28.5TEPC--ShuttleDLOC 2
omniairlock shadowing of DLOC2 location
absorbed dose rate Badhwar 2000
2.1808 Mar-13Jun 2001
394
1.6823 May-06Jul 2001
395
0.09-16.66 Mirlate 1994-
1996400 51.6
REM--externalsurface of Mir
2π Mir core module particle flux/32 s >30 MeV Buhler et. al. 1996
Badhwar et. al .1998
ISS Golightly
296 28.5STS-65 16-Jul-94
51.6
opposite side ofsymmetrically shieldedvehicle
absorbed dose,GCR corrected
omni
R-16 ИР2Sdetector,Service Modulepanel 327
Mir intrinsic shielding(XPOP:LVLH attitude)
omniaccumulatedabsorbed dose,GCR corrected
EnergyRange
Directional Absorber/Shield
Omni/Directional
ParameterMeasured
East/WestRatio
Mission/Spacecraft Epoch/Date
Instrument &Location
AverageAltitude
(km)Inclination
(°)
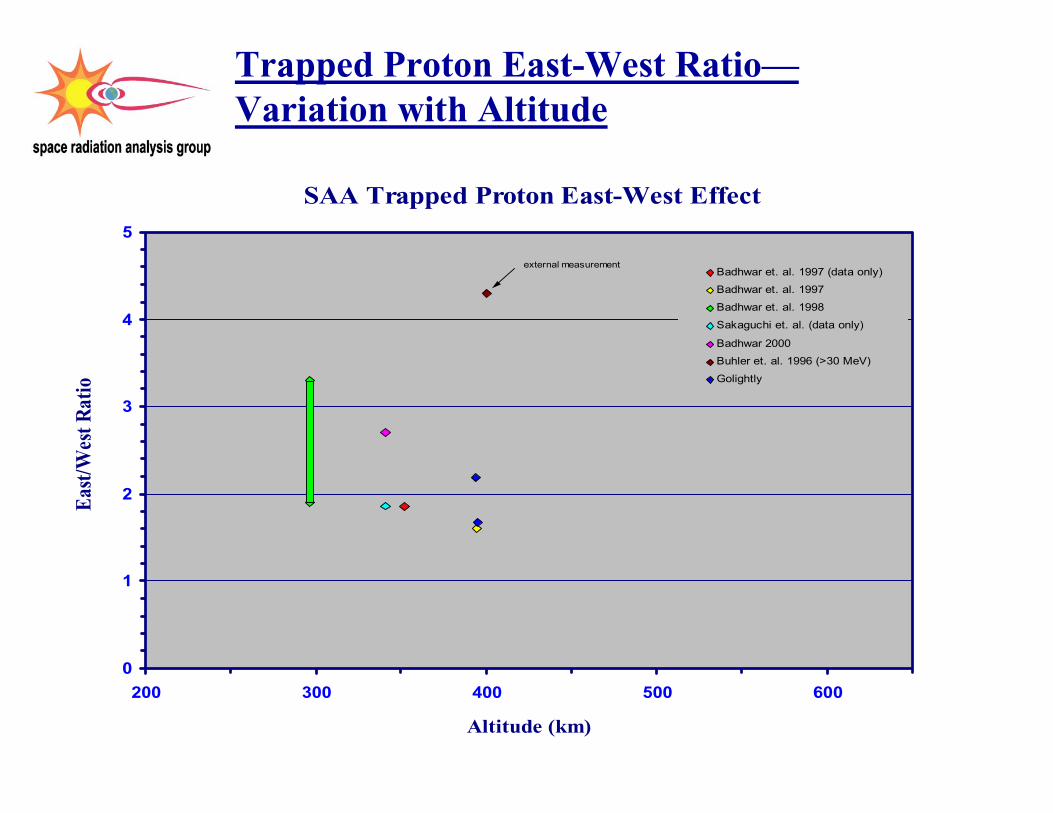
Trapped Proton East-West Ratio—Variation with Altitude
SAA Trapped Proton East-West Effect
0
1
2
3
4
5
200 300 400 500 600
Altitude (km)
Eas
t/Wes
tRat
io
Badhwar et. al. 1997 (data only)
Badhwar et. al. 1997
Badhwar et. al. 1998
Sakaguchi et. al. (data only)
Badhwar 2000
Buhler et. al. 1996 (>30 MeV)
Golightly
external measurement
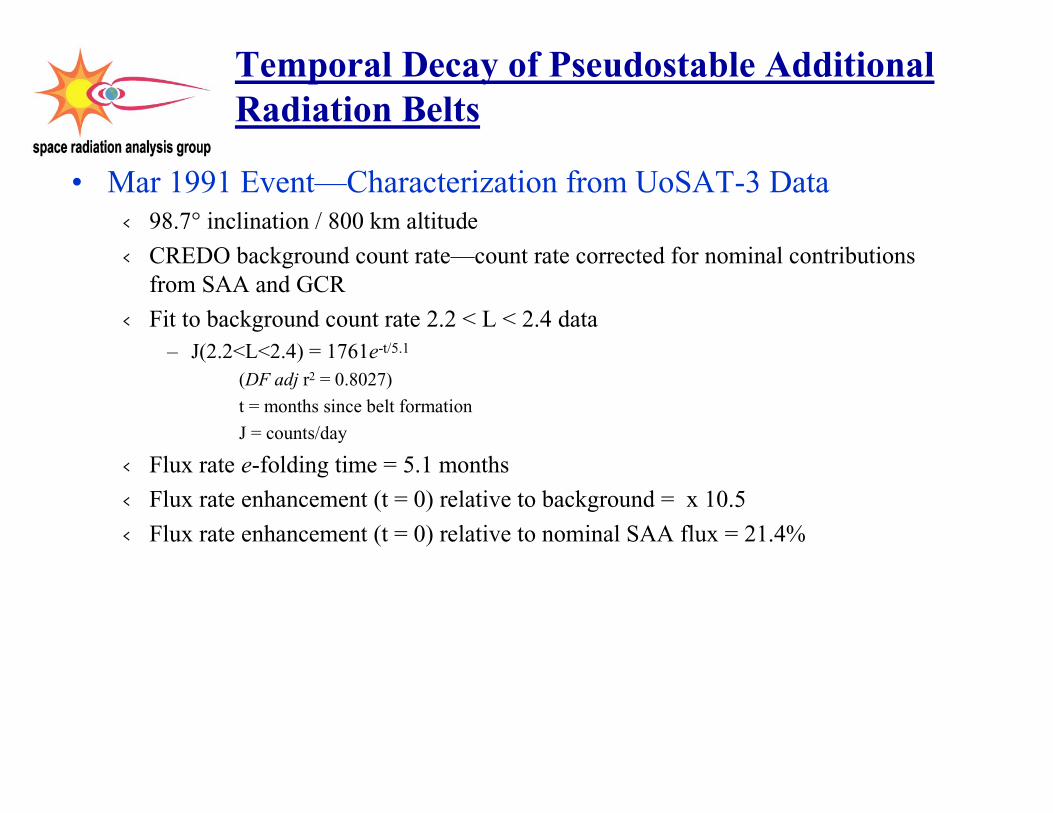
Temporal Decay of Pseudostable AdditionalRadiation Belts
• Mar 1991 Event—Characterization from UoSAT-3 Data‹ 98.7° inclination / 800 km altitude
‹ CREDO background count rate—count rate corrected for nominal contributionsfrom SAA and GCR
‹ Fit to background count rate 2.2 < L < 2.4 data– J(2.2<L<2.4) = 1761e-t/5.1
(DF adj r2 = 0.8027)
t = months since belt formation
J = counts/day
‹ Flux rate e-folding time = 5.1 months
‹ Flux rate enhancement (t = 0) relative to background = x 10.5
‹ Flux rate enhancement (t = 0) relative to nominal SAA flux = 21.4%
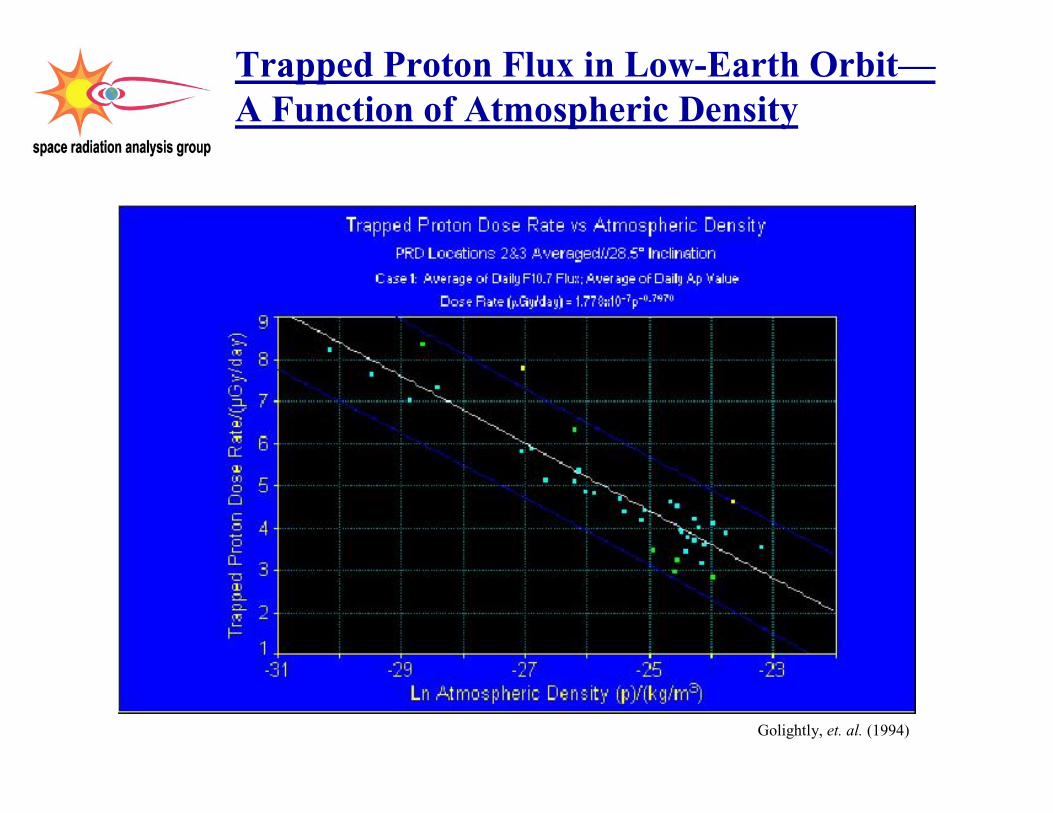
Trapped Proton Flux in Low-Earth Orbit—A Function of Atmospheric Density
Golightly, et. al. (1994)
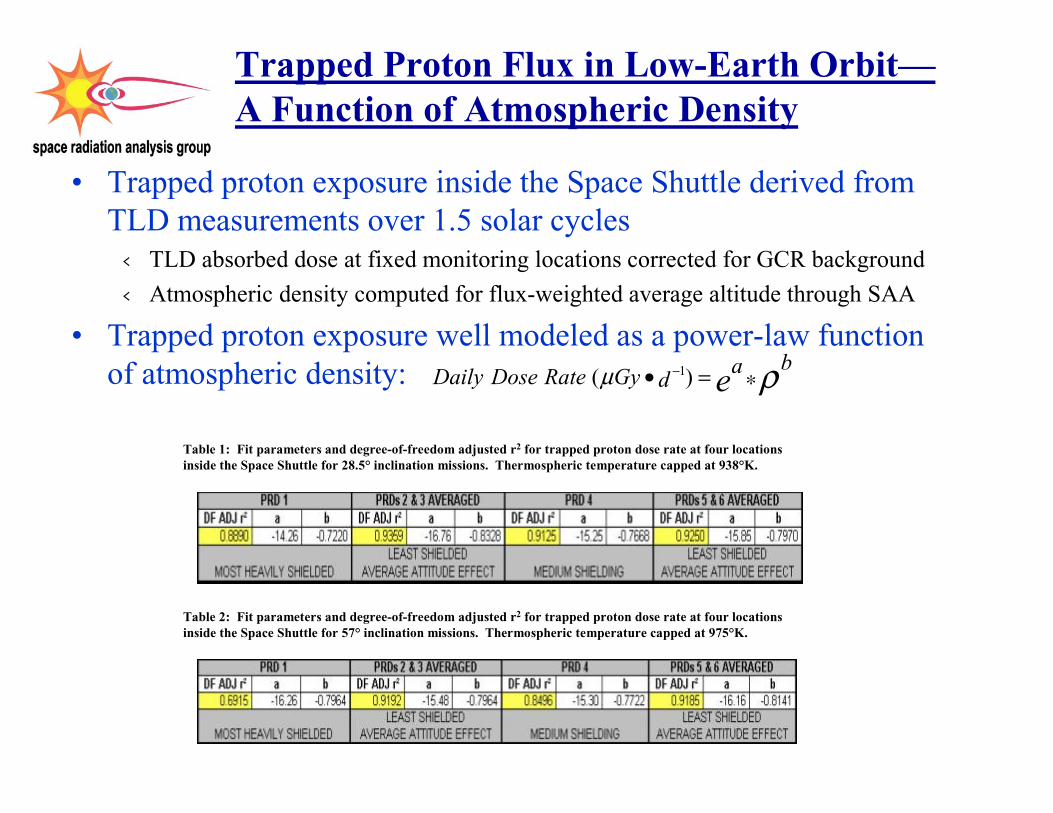
Trapped Proton Flux in Low-Earth Orbit—A Function of Atmospheric Density
• Trapped proton exposure inside the Space Shuttle derived fromTLD measurements over 1.5 solar cycles‹ TLD absorbed dose at fixed monitoring locations corrected for GCR background
‹ Atmospheric density computed for flux-weighted average altitude through SAA
• Trapped proton exposure well modeled as a power-law functionof atmospheric density:
Table 1: Fit parameters and degree-of-freedom adjusted r2 for trapped proton dose rate at four locationsinside the Space Shuttle for 28.5° inclination missions. Thermospheric temperature capped at 938°K.
Table 2: Fit parameters and degree-of-freedom adjusted r2 for trapped proton dose rate at four locationsinside the Space Shuttle for 57° inclination missions. Thermospheric temperature capped at 975°K.
ρµ ∗=• − badGyRateDoseDaily e)( 1
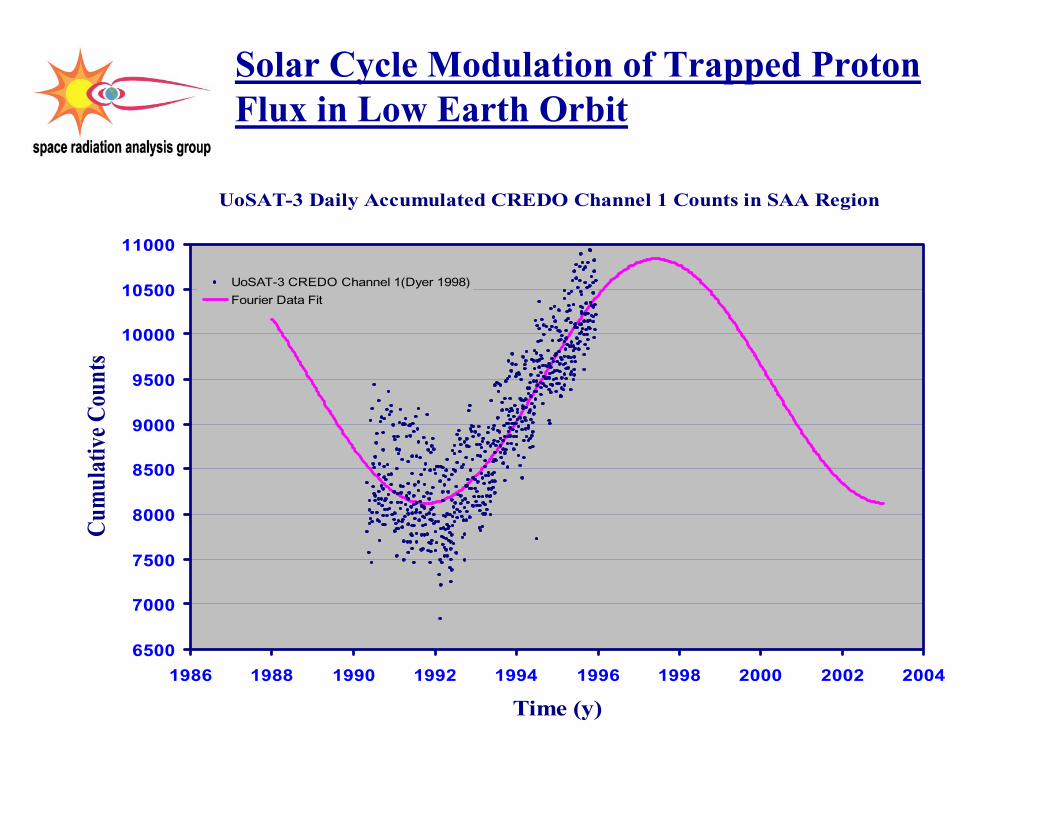
Solar Cycle Modulation of Trapped ProtonFlux in Low Earth Orbit
UoSAT-3 Daily Accumulated CREDO Channel 1 Counts in SAA Region
6500
7000
7500
8000
8500
9000
9500
10000
10500
11000
1986 1988 1990 1992 1994 1996 1998 2000 2002 2004
Time (y)
Cum
ulat
ive
Cou
nts
UoSAT-3 CREDO Channel 1(Dyer 1998)
Fourier Data Fit
Solar Cycle Modulation of Trapped ProtonFlux in Low Earth Orbit
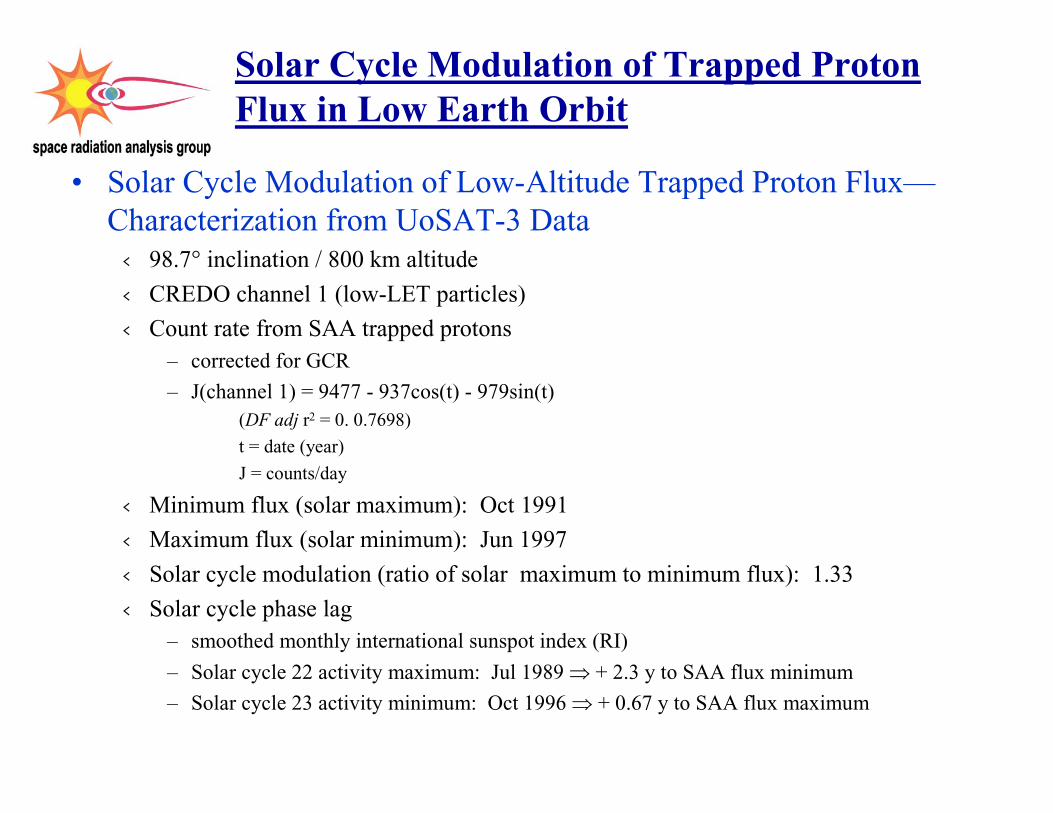
• Solar Cycle Modulation of Low-Altitude Trapped Proton Flux—Characterization from UoSAT-3 Data‹ 98.7° inclination / 800 km altitude
‹ CREDO channel 1 (low-LET particles)
‹ Count rate from SAA trapped protons– corrected for GCR
– J(channel 1) = 9477 - 937cos(t) - 979sin(t)(DF adj r2 = 0. 0.7698)
t = date (year)
J = counts/day
‹ Minimum flux (solar maximum): Oct 1991
‹ Maximum flux (solar minimum): Jun 1997
‹ Solar cycle modulation (ratio of solar maximum to minimum flux): 1.33
‹ Solar cycle phase lag– smoothed monthly international sunspot index (RI)
– Solar cycle 22 activity maximum: Jul 1989 � + 2.3 y to SAA flux minimum
– Solar cycle 23 activity minimum: Oct 1996 � + 0.67 y to SAA flux maximum
Altitude/(km)200 300 400 500
0
2
4
6
8
10
12
14
16
18
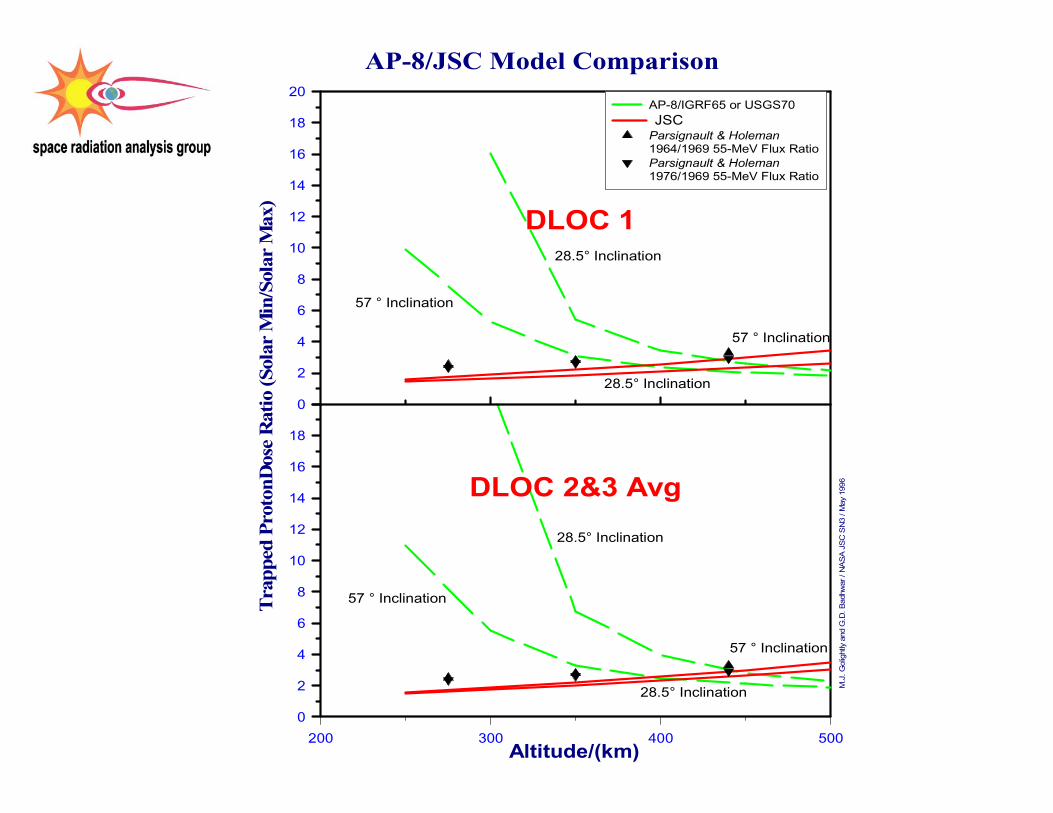
DLOC 2&3 Avg
M.J
.Gol
ight
lyan
dG
.D.B
adhw
ar/N
AS
AJS
CS
N3
/May
1996
28.5° Inclination
57 ° Inclination
28.5° Inclination
57 ° Inclination
AP-8/JSC Model Comparison
Tra
pped
Pro
tonD
ose
Rat
io(S
olar
Min
/Sol
arM
ax)
0
2
4
6
8
10
12
14
16
18
20AP-8/IGRF65 or USGS70JSC
Parsignault & Holeman1964/1969 55-MeV Flux RatioParsignault & Holeman1976/1969 55-MeV Flux Ratio
DLOC 1
57 ° Inclination
57 ° Inclination
28.5° Inclination
28.5° Inclination
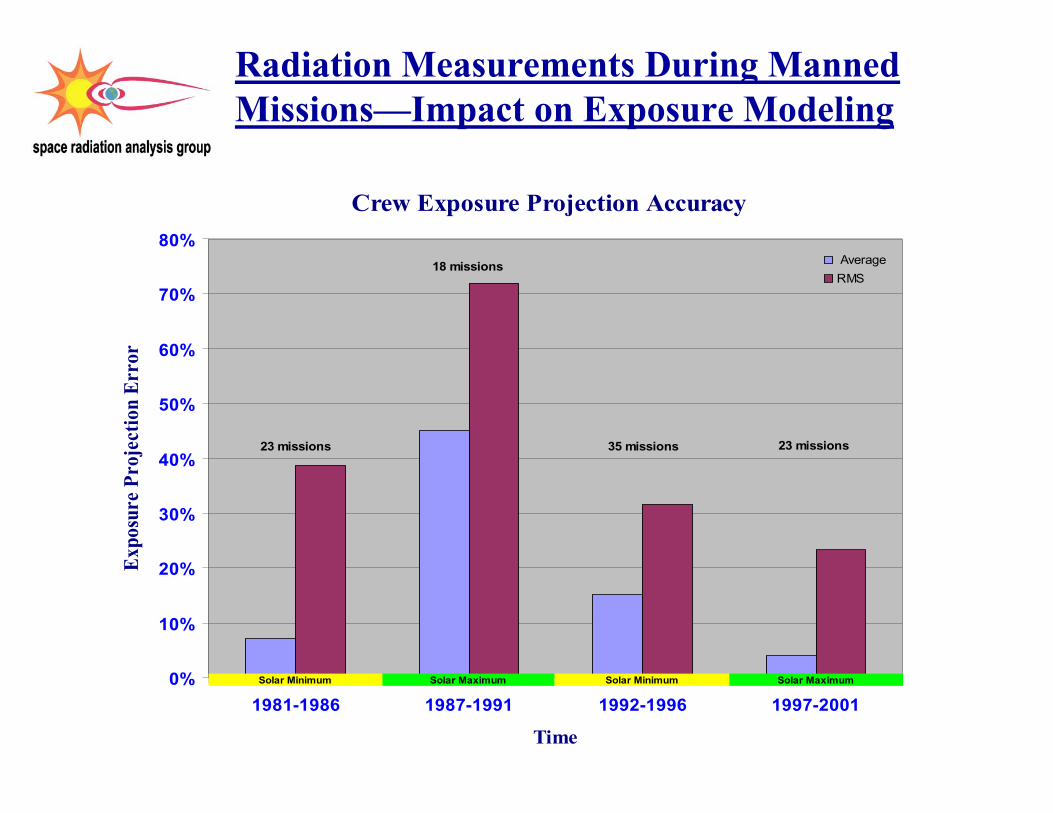
Radiation Measurements During MannedMissions—Impact on Exposure Modeling
Crew Exposure Projection Accuracy
0%
10%
20%
30%
40%
50%
60%
70%
80%
1981-1986 1987-1991 1992-1996 1997-2001
Time
Exp
osur
eP
roje
ctio
nE
rror
Average
RMS
23 missions 23 missions35 missions
18 missions
Solar MaximumSolar Minimum Solar MaximumSolar Minimum
Radiation Measurements During MannedMissions—What Have We Learned?
• The location of the South Atlantic Anomaly is drifting in the geocentriccoordinate system‹ approximately 0.33°/y westward drift
‹ evidence for a 0.07°/y northward drift component
• Observation of the formation and decay of a pseudo-stable additional radiationbelt following the March 1991 solar particle event and geomagnetic storm‹ estimated decay e-folding time of approximately 5 months
• Observation of a local geomagnetic east-west trapped proton exposureanisotropy‹ altitude-dependent east-west flux ratio
‹ estimated to be in the range of 1.6-3.3
• Trapped proton exposure in low-Earth orbit can be reasonably modeled as apower-law function of atmospheric density in the SAA region‹ best correlations obtained when the exospheric temperature dependence saturates at 938-
975ºK
• Actual modulation of trapped proton exposure in LEO is less than predictedby the AP8 model.

Acknowledgements
• Omar Baltaji
• Lorraine Benevides
• Mark Bowman
• Dr. Les Braby
• Terry Byers
• Bernard Cash
• Dr. Tom Conroy
• Alan Dickey
• Robert Dunn
• Joel Flanders
• Frank Gibbons
• Alva Hardy
• Ken Hardy
• Dr. William Quam,
• Dr. Vladislav Petrov (IBMP),
• Robert Richmond
• Fadi Riman.
Many more individuals than can be listed here have contributed over the past 2decades to the success of radiation measurements aboard U.S. manned spacemissions. Among the more deserving of recognition include
References
1. Badhwar, G.D. and D.E. Robbins. "Decay Rate of the Second Radiation Belt." Adv.Space Res., 17(2), (1996) pp. (2)151-58.
2. Badhwar, G.D., M.J. Golightly, A. Konradi, et. al. “In-Flight Radiation Measurements onSTS-60.” Rad. Meas., 26(1), (1996) pp. 17-34.
3. Badhwar, G.D. “Drift Rate of the South Atlantic Anomaly.” J. Geophys. Res., 102(A2),(01 Feb 1997) pp. 2343-49.
4. Badhwar, G.D., W. Atwell, B. Cash et. al. “Intercomparison of Radiation Measurementson STS-63.” Rad. Meas., 26(6), 1997 pp. 901-16.
5. Badhwar, G.D., V. Dudkin, T. Doke et. al. “Radiation Measurements on the Flight ofIML-2.” Adv. Space Res., 22(4), (1998) pp. 485-94.
6. Badhwar, G.D. “Radiation Measurements in Low Earth Orbit: U.S. and RussianResults.” Health Phys., 79(5), (Nov. 2000) pp. 507-14.
7. Buhler, P., A. Zehnder, L. Desorgher, W. Hajdas. "Simple Instruments for ContinuousMeasurements of Trapped Particles." Eds. W. Burke and T.-D. Guyenne:Environment Modeling for Space-Based Applications Symposium Proceedings (ESASP-392), (Dec 1996) pp. 87-92.
8. Doke, T., T. Hayashi, S. Nagaoka et. al. “Estimation of Dose Equivalent in STS-47 by aCombination of TLDs and CR-39.” Rad. Meas., 24(1), (1995) pp. 75-82.
9. Dyer, C. "Space Radiation Environment Dosimetry." DERA/CIS/CIS2/TR980481, (14Oct 1998) p. 36.
10. Golightly, M.J., A.C. Hardy and K. Hardy. “Results of Time-Resolved RadiationExposure Measurements Made During U.S. Shuttle Missions with a Tissue EquivalentProportional Counter.” Adv. Space Res., 14(10), (1994a) pp. (10)923-26.
References (cont.)
11. Golightly, M.J., K. Hardy and W. Quam. “Radiation Dosimetry Measurements DuringU.S. Space Shuttle Missions with the RME-III.” Rad. Meas., 23(1), (1994b) pp.25-42.
12. Golightly, M.J., G.D. Badhwar, M.J. Dunlap and S.H. Patel. “Solar-Cycle Modulation ofthe Trapped Proton Radiation Exposure Inside the Space Shuttle.” In: K.S.Balasubramaniam, S.L. Keil and R.N. Smartt, eds. Solar Drivers of Interplanetary andTerrestrial Disturbances, Astronomical Society of the Pacific Conference Series, 95,(San Francisco, CA: Astronomical Society of the Pacific © 1996), pp. 505-17.
13. Sakaguchi, T., T. Doke, N. Hasebe, et. al. “Measurement of the Directional Distributionof Incident Particles in the Shuttle-Mir Mission Orbit.” J. Geophys. Res., 104(A10), (01Oct 1999) pp. 22,793-99.
14. Underwood, C.I., M.K. Oldfield, C.S. Dyer, and A.J. Sims. "Long-Term Trends in theLEO Radiation Environment as Measured by Radiation Monitors On-Board ThreeUoSAT Micro-Satellites." In: Eds. A. Hilgers and T.-D. Guyenne. EnvironmentModeling for Space-Based Applications, ESTEC, Noordwijk, NL, 18-20 September1996. ESA SP-392 (Noordwijk, The Netherlands: ESA Publications Division © 1996),pp. 37-44.