Embed Size (px)
Citation preview
Bull World Health Organ 2011;89:788–797 | doi:10.2471/BLT.11.089730
Research
788
Twenty-year trends in the prevalence of disability in ChinaXiaoying Zheng,a Gong Chen,a Xinming Song,a Jufen Liu,b Lijing Yan,c Wei Du,a Lihua Pang,a Lei Zhang,a Jilei Wu,a Bingzi Zhanga & Jun Zhangd
IntroductionDisability is common in both developed and developing coun-tries.1 An estimated 650 million people worldwide live with some form of disability.2 The way that disability is conceived has changed substantially in recent years, the current focus being on three areas of impairment: bodily functions and structures, activities and participation.2 In this study, dis-ability is defined as one or more abnormalities in anatomical structure or the loss of a particular organ or function (either physical or psychological) affecting a person’s ability to carry out a normal activity and to participate fully in study, work, and community and social life. In the United States of America, about 50 million adults suffer from various forms of disability, including hearing loss, visual impairment, cognitive impair-ment and limited mobility.3 In China, about 85 million people have a disability or another condition that affects their daily lives and social activities.4 Furthermore, disability can lead to limited access to education, health care and rehabilitation services, to the detriment of the disabled people, their families and local communities, health-care systems and social security systems.1,5 Therefore, specific strategies, policy initiatives and sustainable programmes are needed to improve the health status of the disabled population.
Several studies have explored trends in disability among different populations. According to prevalence estimates, in the United States 51.2 million people aged 6 years or older (18.1% of the age group) reported having a disability in 2002, compared with 54.4 million (18.7%) in 2005.6 Freedman et al.7 systematically reviewed cross-sectional and cohort studies and reported a general decrease in the age-adjusted prevalence of
disability in the population aged 65 years of age or older in the United States. A similar decrease in disability prevalence was reported for Spain’s population aged 65 years or older.8 In terms of life expectancy, the Netherlands reported an increase in the number of years lived with minor disabilities9 and Japan reported a decrease in the number of years lived with severe disabilities.10 These mixed findings may be attributable to dif-ferent indicators, disability contexts and study populations.11
In China, two large-scale nationally representative house-hold surveys were conducted from 1 April to 30 May in 1987 and 2006.12,13 The resulting figures have been used in epide-miological studies to conduct specific analyses of different types of disabilities,14–21 rural/urban disparities in disability prevalence4 and disability-free life expectancy.22 Using differ-ent survey series, Phillips et al.23 described the prevalence of mental disorders in four provinces, and Chou and Leung24 evaluated self-reported disability among the elderly in Hong Kong Special Administrative Region. These studies have primarily provided a demographic profile of people with dis-ability in China. However, there is no scientific evidence of the magnitude of the problem of disability across the entire nation that will allow for complex survey designs and age-adjusted analysis of trends in disability prevalence nationwide.
China has undergone rapid social, economic, political, in-stitutional and demographic transitions. Thus, understanding the magnitude of the burden of disability and its trends over time is essential for improving the health of the population and enhancing the lives of people with disabilities.
In this study, our primary objective was to assess changes in the prevalence of disability in China during the 20-year period from 1987 through 2006. We also aimed to investigate
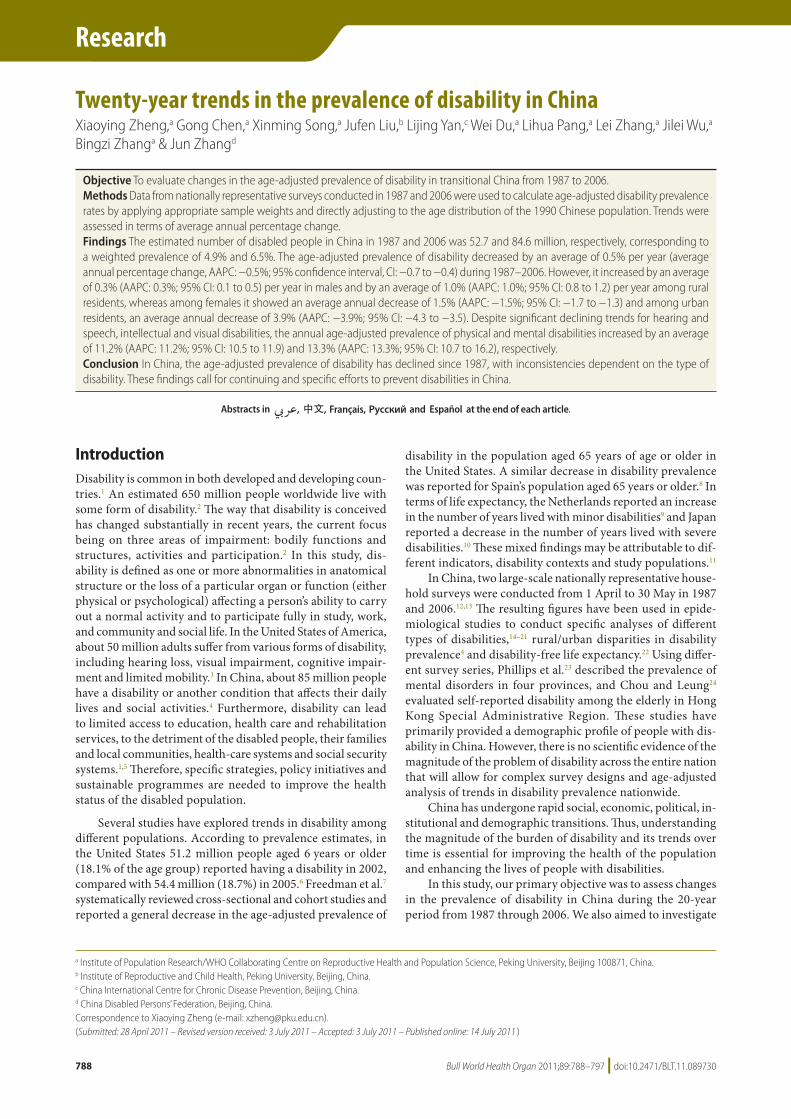
Objective To evaluate changes in the age-adjusted prevalence of disability in transitional China from 1987 to 2006.Methods Data from nationally representative surveys conducted in 1987 and 2006 were used to calculate age-adjusted disability prevalence rates by applying appropriate sample weights and directly adjusting to the age distribution of the 1990 Chinese population. Trends were assessed in terms of average annual percentage change.Findings The estimated number of disabled people in China in 1987 and 2006 was 52.7 and 84.6 million, respectively, corresponding to a weighted prevalence of 4.9% and 6.5%. The age-adjusted prevalence of disability decreased by an average of 0.5% per year (average annual percentage change, AAPC: −0.5%; 95% confidence interval, CI: −0.7 to −0.4) during 1987–2006. However, it increased by an average of 0.3% (AAPC: 0.3%; 95% CI: 0.1 to 0.5) per year in males and by an average of 1.0% (AAPC: 1.0%; 95% CI: 0.8 to 1.2) per year among rural residents, whereas among females it showed an average annual decrease of 1.5% (AAPC: −1.5%; 95% CI: −1.7 to −1.3) and among urban residents, an average annual decrease of 3.9% (AAPC: −3.9%; 95% CI: −4.3 to −3.5). Despite significant declining trends for hearing and speech, intellectual and visual disabilities, the annual age-adjusted prevalence of physical and mental disabilities increased by an average of 11.2% (AAPC: 11.2%; 95% CI: 10.5 to 11.9) and 13.3% (AAPC: 13.3%; 95% CI: 10.7 to 16.2), respectively.Conclusion In China, the age-adjusted prevalence of disability has declined since 1987, with inconsistencies dependent on the type of disability. These findings call for continuing and specific efforts to prevent disabilities in China.
a Institute of Population Research/WHO Collaborating Centre on Reproductive Health and Population Science, Peking University, Beijing 100871, China.b Institute of Reproductive and Child Health, Peking University, Beijing, China.c China International Centre for Chronic Disease Prevention, Beijing, China.d China Disabled Persons’ Federation, Beijing, China.Correspondence to Xiaoying Zheng (e-mail: [email protected]).(Submitted: 28 April 2011 – Revised version received: 3 July 2011 – Accepted: 3 July 2011 – Published online: 14 July 2011 )
Research

Bull World Health Organ 2011;89:788–797 | doi:10.2471/BLT.11.089730 789
ResearchDisability prevalence trends in ChinaXiaoying Zheng et al.
any changes in the leading causes of dis-ability that may have occurred over that time and that could potentially explain the changes in overall prevalence. Since 80% of all those who are disabled live in developing countries,25 most of which are going through an epidemiologic and sociodemographic transition, the findings from this study may be broadly reflective of disability trends in the de-veloping world at large.
MethodsData source
We obtained data from the 1987 and 2006 national surveys of the non-in-stitutionalized population of China.12,13 Both surveys used multistage, stratified random cluster sampling, with probabil-ity proportional to size, to derive nation-ally representative samples. The surveys were approved by the State Council and conducted in all province-level admin-istrative regions of mainland China by the Leading Group of China National Sample Survey on Disability and the Na-tional Bureau of Statistics. Within each region, sampling strata were defined based on subordinate administrative areas, local geographical characteristics or local gross domestic product, where
appropriate, to allow for anticipated regional variability. Within each stra-tum, a four-stage sampling strategy was followed involving four natural admin-istrative units (i.e. county, town, village and community), and sampling was conducted with probability proportional to cluster size. The sampling interval (i.e. the total population divided by the number of units at each stage) used the most up-to-date population and address information from the Ministry of Civil Affairs and Public Security in Beijing. Both surveys excluded the institutional-ized population and together comprised a total of 424 counties (3169 communi-ties) in 1987 and 734 (5964) in 2006.12,13 The final sample size was 1 579 316 in 1987 and 2 526 145 in 2006, figures representing 1.5 and 1.9 per 1000 non-institutionalized inhabitants of China, respectively. All survey respondents provided consent to participate to the Chinese government.
The survey protocol and survey questions were reviewed by leading national and international experts, and the sampling scheme was reviewed by experts from the Division of Statistics of the United Nations.12,13 A standardized protocol was adopted in both years to ensure the comparability of the survey
results. Two pilot studies were con-ducted in different provinces before each survey. Strict quality control measures were implemented at every step during each survey, from the drafting of the sampling frame through field sampling, from the filling out of the questionnaires to the checking of the returned forms, and from data input to the checking of data quality.12,13
Measures
In both 1987 and 2006, trained field interviewers used a structured question-naire to inquire about visual, hearing and speech disability, physical or intel-lectual disability and mental disability (Table 1). Those who responded “yes” to any of the corresponding questions and all children aged 6 years or less were referred to different designated physi-cians for further disability screening and confirmation. A designated physician performed medical examinations and followed diagnostic manuals to make the final diagnosis and assess the severity of the disability, if any, and to confirm its primary causes. Respondents with mul-tiple positive answers were examined by multiple specialists (a separate doctor for each disability). The primary causes of each disability were recorded.
Table 1. Study definitions for different disability types and their corresponding survey questions
Disability type
Survey question Definition
Visual Do you or your family members have visual problems?
Visual disability refers to poor vision or constriction of the visual field in both eyes from any cause and is not correctable. It consists of two categories: blindness and weak vision.
Hearing and speech
Do you or your family members have hearing or speech problems?
Hearing disability refers to permanent hearing loss of varying degrees from any cause or the inability to hear at all or to hear clearly any nearby sound or voice. These deficits affect daily life and social activities.Speech disability refers to any type of language disorder. Because successful treatment takes more than 1 year and the disability is generally present for more than 2 years, the patient cannot take part in normal language exchanges, which undermines his or her daily life and participation in social activities.
Physical Do you or your family members have any difficulty walking, standing, squatting, climbing the stairs, grasping, washing and rinsing, or dressing?
Physical disability refers to a loss of motor function of varying degrees or to limitations in movements or activities resulting from deformed limbs or body paralysis (palsy) or from deformity caused by damage to the structure or function of those body parts involved in mobility.
Intellectual Do you or your family members have any difficulty studying?
Intellectual disability refers to lower than normal intellectual ability and is accompanied by adaptive behaviour disorders. This kind of disability results from impairment of the structure and functions of the nervous system, limits individual activity and participation, and requires all-round, extensive, limited, or intermittent support.
Mental Are you or your family members forgetful? Or do you have difficulty concentrating? Or can you not control your moods? Or do you have strange behaviour that is out of the ordinary? Or are you addicted to alcohol or drugs?
Mental disability refers to psychiatric disorders lasting more than 1 year that manifest as cognitive, affective, and behaviour disorders affecting the daily life and social participation of the patient.

Bull World Health Organ 2011;89:788–797 | doi:10.2471/BLT.11.089730790
ResearchDisability prevalence trends in China Xiaoying Zheng et al.
Statistical analyses
All data were entered into a custom-designed database and analysed using SAS Version 9.2 (SAS Institute, Cary, USA). Allowing for the complex sam-pling design, we constructed sample weights using standard weighting proce-dures.26 For each cause we calculated the weighted proportion of its contribution to a particular disability, and we ranked the proportions thus obtained to de-termine the five leading causes of each disability. We also calculated separately a given cause’s contribution to different disabilities. We used the SURVEYFREQ procedure27 to estimate the weighted prevalence of disability of various types, with 95% confidence intervals (CIs), for the overall population and for different population segments.
Allowing for changes in the age structure of the population over time, we calculated the age-adjusted prevalence of disability through direct standard-ization using the 1990 census-derived Chinese population as the standard.28 We estimated the annual change in age-standardized prevalence and its associated 95% CIs using the two-point percentage change annualized estima-tor (PCAE), which is based on the first and last rate only, not the intervening rates, but is robust whether the annual
change in rate is linear or not.29 A PCAE-associated P-value < 0.05 was considered indicative of statistical significance.30
ResultsThe 1987 and 2006 surveys were nation-ally representative. Compared with the 1987 study population, the 2006 study population included more adults aged 18–64 (65.7% versus 57.8%), more seniors aged 65 years or older (9.9% versus 5.7%), more males (50.7% versus 50.5%) and more urban residents (33.5% versus 15.6%).
In both surveys most disability oc-curred among rural residents (Table 2). Hearing and speech disabilities were predominant in both years and ac-counted for 44.5% of all disability in 1987 and for 38.0% in 2006 (Table 2).
Table 2 shows that in 1987 the crude number of disabled people was highest in the population aged 18–44 years. Al-most 20 years later, the largest estimated number of disabled people had shifted from this group to that of people aged 65–74 years (12.9 million versus 18.8 million, respectively). Despite this, an estimated 17.0 million people aged 18–44 years had a disability in 2006 (Fig. 1). The weighted prevalence of disability increased with age in 1987, and this monotonic pattern persisted
in 2006 among people 7 years of age or older (Fig. 1).
Between 1987 and 2006, the esti-mated number of disabled people rose from 52.7 million to 84.6 million. This corresponds to a weighted prevalence of 4.9% in 1987 and 6.5% in 2006 (Table 3). The overall age-adjusted prevalence of disability decreased significantly, by an annual average of 0.5% over the 20-year period (Table 3). It increased signifi-cantly for males and rural residents but decreased significantly for females and urban residents and in the areas of visual disability, hearing and speech disability, intellectual disability, physical disability and mental disability (Table 3).
The 20-year upward or downward trend in the prevalence of visual, hear-ing and speech, physical and intellectual disability did not vary by sex or place of residence (urban versus rural) (Table 4). The prevalence of mental disability in-creased significantly over time among males, females and rural residents but not among urban residents (Table 4).
Fig. 2 shows changes in the five leading causes of disability over time. For example, some medical conditions, such as pyogenic infection and menin-gitis, contributed less to their associated disabilities in 2006 than in 1987. Instead, new emerging medical causes of dis-ability became more prevalent in 2006.
Table 2. Characteristics of disabled people, by sex, residence and type of disability, China, 1987 and 2006
Characteristic Malesa Femalesa
1987 (n = 38 701) No. (%)
2006 (n = 83 342) No. (%)
1987 (n = 38 662) No. (%)
2006 (n = 78 137) No. (%)
Age group (years)0–6 1 903 (4.9) 1 917 (2.3) 1 619 (4.2) 1 298 (1.7)7–17 6 497 (16.8) 3 840 (4.6) 5 061 (13.1) 2 797 (3.6)18–44 10 236 (26.5) 18 787 (22.5) 8 725 (22.6) 13 824 (17.7)45–54 3 884 (10.0) 11 870 (14.2) 3 668 (9.5) 9 451 (12.1)55–64 5 564 (14.4) 13 380 (16.1) 5 524 (14.3) 11 914 (15.3)65–74 6 302 (16.3) 17 953 (21.5) 7 156 (18.5) 17 831 (22.8)75–84 3 772 (9.8) 13 226 (15.9) 5 728 (14.8) 16 351 (20.9)85+ 543 (1.4) 2 369 (2.8) 1 181 (3.1) 4 671 (6.0)ResidenceRural 32 823 (84.8) 60 316 (72.4) 32 567 (84.2) 56 380 (72.2)Urban 5 878 (15.2) 23 026 (27.6) 6 095 (15.8) 21 757 (27.8)Disability typea
Visual 5 950 (15.4) 12 980 (15.6) 9 995 (25.9) 19 541 (25.0)Hearing and speech 17 402 (45.0) 32 987 (39.6) 17 028 (44.0) 28 305 (36.2)Physical 8 344 (21.6) 32 279 (38.7) 6 109 (15.8) 26 894 (34.4)Intellectual 10 474 (27.1) 10 604 (12.7) 9 536 (24.7) 8 614 (11.0)Mental 1 774 (4.6) 7 405 (8.9) 2 126 (5.5) 8 523 (10.9)
a Percentages may add up to less than 100 because of rounding or to more than 100 because an individual can have several disabilities.

Bull World Health Organ 2011;89:788–797 | doi:10.2471/BLT.11.089730 791
ResearchDisability prevalence trends in ChinaXiaoying Zheng et al.
Osteoarthritis and workplace injury, for example, became greater contributors to physical disability, and asphyxia to intellectual disability.
DiscussionThis study demonstrates that many people suffer disabilities, and their numbers will increase because of the rapid changes occurring in everyday life in China. Although the prevalence of disability in China (6.5%) is much lower than in countries such as the United States (18.7%), more people with disabilities would probably be identified in China if national surveys measured disability in terms of the activities of daily living and instrumental activities
of daily living, instead of the more nar-rowly defined impairments confirmed by a physician examination. The cur-rent findings could be only the tip of the iceberg; hidden beneath the surface could be millions of other lives affected by disability in China.
The weighted prevalence of disabil-ity increased over 20 years in China, as it did in the United States.6 This finding could be attributable primarily to the increase in the life expectancy of the disabled population over time.4,9,10,22 Af-ter controlling for such an ageing effect, we found that the adjusted prevalence of disability has decreased significantly over time in China. This finding is consistent with the decreasing trend observed in people aged 65 years and
over in the United States7 and Spain8 and fills a knowledge gap in the existing literature on China.
Trends in disability in different population segments have been studied widely. The present study identified an increase in the age-adjusted prevalence of disability among males and an op-posite trend among females in China. Such a disparity in disability by sex is not in line with previous findings.6–8 Af-ter systematically reviewing published studies that assessed disability trends among Americans aged either 65 years or older or 70 years or older, Freedman et al.7 indicated that the evidence for such disparity by gender and race was limited and mixed. Sagardui-Villamor et al.8 observed a greater reduction in disability prevalence among males aged 65 and over than among females in the same age group in Spain. Brault6 used United States census data to report that more females (prevalence: 20.1%) than males (prevalence: 17.3%) had some form of disability in 2005, whereas the 2006 survey in China showed a weighted prevalence of disability of 6.6% in males and 6.4% in females. Using life expectancy indicators for 2004, Hashimoto et al.10 reported more years without disability among females (73.0 years) than among males (69.7 years) in Japan. This similarity between Japan and China, both of which differ from the United States, suggests that the sex disparity in disability could be the result of cultural influences.
Fig. 1. Estimated number of disabled people and weighted prevalence of disability, by age group, China, 1987–2006
45–54
5.1
11.0
18–44
12.9
17.0
7–17
7.9
3.4
20.0
Age group (years)
Estim
ated
num
ber (
mill
ion)
0–6
1987 (%)1987 (No.) 2006 (No.) 2006 (%)
2.41.7
55–64
7.5
13.2
65–74
9.2
18.8
75–84
6.5
15.8
85+
1.2
3.7
70.0
60.0
50.0
40.0
30.0
20.0
10.0
0.0
18.016.014.012.010.08.06.04.02.00.0
Weighted prevalence (%
)
Table 3. People with disability, prevalence of disability (weighted and age-standardized) and average annual percentage change in prevalence, by sex, residence and disability type, China, 1987–2006
Characteristic People with disability (millions)
Weighted prevalence (%)
Age-standardized prevalence (%)
AAPC (95% CI)
1987 2006 1987 2006 1987 2006
SexMale 26.3 43.6 4.9 6.6 4.9 5.0 0.3 (0.1 to 0.5)Female 26.4 41.0 5.0 6.4 4.7 4.3 −1.5 (−1.7 to −1.3)ResidenceRural 44.4 63.5 4.9 7.0 4.9 5.2 1.0 (0.8 to 1.2) Urban 8.3 21.1 5.0 5.2 4.7 3.7 −3.9 (−4.3 to −3.5)Disability typea
Visual 11.0 17.2 1.0 1.3 1.0 0.8 −3.7 (−4.4 to −2.9)Hearing and speech 23.5 32.6 2.2 2.5 2.2 1.6 −4.6 (−4.9 to −4.2)Physical 9.6 30.3 0.9 2.3 0.9 1.7 11.2 (10.5 to 11.9)Intellectual 13.7 10.0 1.3 0.8 1.2 0.8 −7.1 (−7.8 to −6.5)Mental 2.6 8.4 0.2 0.6 0.3 0.5 13.3 (10.7 to 16.2)Total 52.7 84.6 4.9 6.5 4.8 4.7 −0.5 (−0.7 to −0.4)
AAPC, average annual percentage change; CI, confidence interval.a The numbers of people with each disability may not add up to the total given because multiple disabilities in a single individual were counted separately.

Bull World Health Organ 2011;89:788–797 | doi:10.2471/BLT.11.089730792
ResearchDisability prevalence trends in China Xiaoying Zheng et al.
Furthermore, Whitson et al.31 analysed cross-sectional data from 5888 com-munity-dwelling people and suggested that sex-based causal differences (e.g. a higher prevalence of obesity in women) might explain 12.9% of the disparity in disability between the sexes. Similarly, it is possible that the dissimilar distri-bution of causal factors in males and females in the present study explains the observed disparity by sex. Nevertheless, such observed disparity highlights the need for further investigation among different population segments.
This study revealed that both physi-cal and mental disabilities have increased significantly in China over the past two decades, whereas disabilities in vision, hearing and speech as well as intellectual disabilities have decreased significantly. This finding is consistent with those of previous descriptive Chinese stud-ies.15,18–21,23 In a study that examined the epidemiological distribution of physical disability, Luan and Liu21 reported that its prevalence varied among different re-gions in China. In describing the epide-miological profile of disability associated
with mental disorders in four provinces of China, Phillips et al.23 indicated that this problem is being overlooked and suggested an urgent analysis of the situation. Like these studies, the current one enriches the literature by providing data on the magnitude of the change in the burden of different disabilities over time. Because mental disability is more prevalent among socioeconomically disadvantaged populations32 and physi-cal disability is more prevalent among rural populations,21 the current findings alert experts to the importance of taking actions specifically designed for each target population to relieve the burden of disability in the community.
This study also demonstrates chang-es over time in the leading causes of disability in China. The fact that fewer infectious and genetic diseases were causes of disability in 2006 than in 1987 may point to improvements in public health in China during the 20-year period. For example, polio vaccina-tion schemes33 may have contributed to a reduction in poliomyelitis, which causes physical disability. However, the finding of increasing trends in physical disability may further imply that the success of public health efforts such as polio vaccination could be outweighed by new challenges stemming from rapid modernization, industrialization and urbanization in transitional China, such as workplace injuries and other types of injuries.34 In 2004, about half a million industrial fatalities occurred in China, a figure representing one fourth of the fatalities worldwide.35 Therefore, it is not surprising that workplace injuries have become a leading cause of disability. Since the 1980s, large numbers of rural residents in China have migrated to cities to look for jobs.36 These migrant workers are at high risk of suffering workplace injuries that may result in disability or loss of life owing to a lack of labour force experience and to high financial stress.37 Once migrant workers are disabled due to workplace injury, they are more likely to move back to their rural homes because they become socioeconomically disadvantaged.36 Since increasing disability in the rural population goes hand in hand with a higher risk of physical disability,21 we speculate that injuries to migrant work-ers may be more or less attributable to the observed increase in disability in the rural population in China. However, we do not have sufficient data to confirm
Table 4. Age-standardized prevalence and average annual percentage change (AAPC) in prevalence of various types of disability, by sex and residence, China, 1987–2006
Characteristic by disability type Age-standardized prevalence (%)
AAPC (95% CI)
1987 2006
VisualSex Male 0.8 0.7 −2.2 (−3.5 to −0.9) Female 1.2 0.9 −4.7 (−5.6 to −3.8)Residence Rural 1.0 0.9 −1.7 (−2.7 to −0.7) Urban 1.0 0.6 −8.2 (−10.2 to −6.0)Hearing and speechSex Male 2.3 1.8 −4.0 (−4.5 to −3.5) Female 2.0 1.4 −5.8 (−6.3 to −5.2)Residence Rural 2.2 1.8 −3.3 (−3.7 to −2.8) Urban 2.1 1.3 −7.7 (−8.7 to −6.7)PhysicalSex Male 1.1 2.0 10.5 (9.6 to 11.3) Female 0.8 1.5 11.0 (9.9 to 12.3)Residence Rural 0.9 1.9 13.3 (12.3 to 14.3) Urban 0.9 1.5 8.9 (6.6 to11.3)IntellectualSex Male 1.3 0.9 −5.9 (−6.8 to −5.1) Female 1.2 0.7 −8.6 (−9.6 to −7.6)Residence Rural 1.2 0.9 −4.7 (−5.5 to −3.8) Urban 1.2 0.5 −13.6 (−15.5 to −11.7)MentalSex Male 0.2 0.5 16.5 (12.0 to 21.7) Female 0.3 0.6 12.2 (9.1 to 15.7)Residence Rural 0.2 0.6 20.1 (15.7 to 25.1) Urban 0.3 0.4 4.9 (−1.3 to 12.7)
CI, confidence interval.

Bull World Health Organ 2011;89:788–797 | doi:10.2471/BLT.11.089730 793
ResearchDisability prevalence trends in ChinaXiaoying Zheng et al.
Fig. 2. Leading classified causes of each type of disability and corresponding weighted proportion, China, 1987 and 2006
60
Visual disability
Perc
enta
ge
Cataracts0
50
10
20
40
30
56.6
Keratopathy
11.7
Trachoma
10.4
Refractiveerror
9.7
Retinopathy
5.8
1987
60
Visual disability
Perc
enta
ge
Cataracts0
50
10
20
40
30
45.9
Retinopathy
14.1
Keratopathy
10.3
Refractiveerror
7.2
Glaucoma
6.6
2006
60
Hearing and speech disability
Perc
enta
ge
Prebycusis0
50
10
20
40
30
45.2
Tympanitis
14.3
Fever
7.0
Medicinepoisoning
3.7
Geneticdiseases
2.2
60
Hearing and speech disability
Perc
enta
ge
Presbycusis0
50
10
20
40
30
48.1
Tympanitis
10.6
Hearingdisorder
5.2
Systemicdiseasesa
4.3
Medicinepoisoning
3.5
60
Physical disability
Perc
enta
ge
Unclassifiedinjury
0
50
10
20
40
3020.7
Vasculardisease
16.6
Poliomyelitis
12.8
Pyogenicinfection
6.1
Congenitalabnormalities
5.3
60
Physical disability
Perc
enta
ge
Cerebro-vasculardisease
0
50
10
20
40
3020.1
Osteo-arthritisa
18.5
Unclassifiedinjury
17.1
Poliomyelitis
7.3
Workplaceinjury
5.5
60
Intellectual disability
Perc
enta
ge
Geneticdiseases
0
50
10
20
40
30
14.2
Encephalitisand
meningitis
7.5
Malnutrition
4.7
Social-psychological
factors
3.6
Braindiseases
3.3
60
Intellectual disability
Perc
enta
ge
Braindiseases
0
50
10
20
40
30 28.9
Geneticdiseases
13.3
Convulsivedisordersa
5.8
Asphyxia
3.2
Social-psychological
factors
3.2
60
Mental disability
Perc
enta
ge
Schizo-phrenia
0
50
10
20
40
30
57.5
Dementia
12.6
Epilepsy
6.9
Affectivepsychosis
5.7
Unclassifiedorganic
mental disorder
2.3
60
Mental disability
Perc
enta
ge
Schizo-phrenia
0
50
10
20
40
30
48.2
Dementia
12.7
Epilepsy
8.6
Unclassifiedorganic
mental disorder
7.7
Mooddisorder
5.7
a New classified causes introduced into the 2006 survey.
Bull World Health Organ 2011;89:788–797 | doi:10.2471/BLT.11.089730794
ResearchDisability prevalence trends in China Xiaoying Zheng et al.
this speculation. Future research may help to determine whether workplace injuries have a greater impact on the rural than on the urban population. Nevertheless, the changes in causality found in this study underline the impor-tance of continuing public-health efforts and developing specific programmes to eliminate various causes of disability.
The reported time trends in disability and the epidemiological transition to dif-ferent new causal factors for various dis-abilities are expected to occur in settings in transition where health-care system reform, rapid economic growth and population ageing are taking place, as they are in China. The current findings may trigger actions to improve prevention and treatment efforts worldwide, especially in developing countries in transition. Fur-thermore, the findings point to the need to combat emerging challenges in addi-tion to securing the success of population-wide measures such as polio vaccination. For example, occupational disability in China may be reduced through sustained commitment and initiatives to improve workplace safety within a framework of primary prevention (e.g. job training and safety education), secondary prevention (e.g. workplace hazard identification and prompt emergency response) and tertiary prevention (e.g. pharmacological treat-ment to delay complications).
The definition of disability and its operational measurement vary greatly among studies.7–10,23,24 In studies that rely on self-reported disability, uncon-trolled factors such as different levels of participation in disability education and intervention programmes may influence reporting behaviour. Because the cur-rent study used medical confirmation instead of self-reporting, its findings are probably robust against this possibility. Moreover, this study was based on two
representative nationwide population-based surveys with large sample sizes and standardized quality control mea-sures, resulting in reliable prevalence estimates with small sampling errors.2,13 Although the 1987 survey used the International classification of impair-ments, disabilities, and handicaps38 and the 2006 survey used the International classification of functioning, disability and health39 to classify disability, both surveys employed the Chinese word canji,12,13 meaning both handicap38 and disability,39 which is consistent with the definition used in this study. A detailed comparison of the methods used in these two surveys is available elsewhere.22
Many factors could have contrib-uted to the observed changes in the prevalence of disability, including a reduction in risk factors and changes in the availability of social security programmes among different popula-tions, since such programmes provide people with the opportunity to get ap-propriate treatment and avoid disabling outcomes.40 For example, the fact that fewer rural than urban residents are covered by social security programmes because of the hukou (population regis-tration) system4,36 may have resulted in the urban–rural disparity in the preva-lence of disability observed in this study. However, the use of cross-sectional data limited our ability to investigate the pos-sible underlying causes of the observed trends. Survey data included extensive demographic information but lacked details on exposure, such as access to medical care. Thus, to control for ex-posure instead of person–time we used population-level exposure, a somewhat more robust approach given that dra-matic changes have taken place across the entire nation. The significant change
in the overall prevalence of disability in China may therefore reflect the social, economic and environmental changes taking place in the country.
ConclusionAlthough overal l prevalence has dropped, the absolute number of dis-abled people continues to increase in China. There are disparities in rates of disability among certain population segments and new causes of disabil-ity are emerging. Thus, the health-care system, the community and individuals themselves are faced with an increased burden of disability and new challenges. Sustained efforts should be made to improve the prevention and treatment of disabilities in China and throughout the world. ■
AcknowledgementsWe thank the provincial and municipal federations of disabled people for their support in data collection and manage-ment, and Iris Chi and Marilyn Flynn for their helpful comments and assistance.
Funding: Support for this study was obtained from: key National Project (973) of Study on the Mechanisms of Interaction between Environment and Genetics of Birth Defects in China (No. 2007CB5119001); key State funds for so-cial science project (Research on Measur-ing Disability Prevention in China, No. 09&ZD072); National Baby Health Pro-motion Programme (No. FP2000NO13); Education Ministry Key Programme (No. 02185); National Yang Zi Scholar Programme, and projects 211 and 985 of Peking University (No. 20020903).
Competing interests: None declared.
ملخصاتجاهات انتشار العجز يف الصني خالل عرشين سنة
يف للعمر وفقًا املصحح العجز انتشار يف التغريات تقييم الغرض الفرتة االنتقالية للصني من عام 1987 حتى 2006.
الطريقة استخدمت املعطيات املتحصل عليها من مسحني وطنيني انتشار معدالت حلساب 2006 و 1987 عامي يف أجريا ممثلني مالئمة عينة أوزان تطبيق طريق عن بالعمر املصحح العجز .1990 عام يف الصني سكان عمر لتوزيع املبارش والتصحيح التغري نسبة متوسط حيث من االجتاهات هذه تقييم وجرى
السنوي.املوجودات يف عام 1987، بلغ العدد التقديري للعاجزين يف الصني 52.7 مليون شخص، ويف عام 2006 بلغ 84.6 مليون شخص،
ومها يوازيان انتشارين موزونني قدرمها %4.9 و %6.5. وانخفض )املتوسط سنويًا 0.5% بمتوسط بالعمر املصحح العجز انتشار :95% الثقة فاصلة %0.5-؛ املئوية: النسبة يف للتغري السنوي بمتوسط زاد أنه إال .2006-1987 خالل )-0.4 إىل -0.7فاصلة %0.3؛ املئوية: النسبة يف للتغري السنوي )املتوسط 0.3% 1.0% وبمتوسط الذكور يف سنويًا )0.5 إىل 0.1 :95% الثقة الثقة فاصلة %1.0؛ املئوية: النسبة يف للتغري السنوي )املتوسط انخفض الريف، يف حني بني سكان 1.2( سنويًا إىل 0.8 :95%للتغري السنوي )املتوسط 1.5% قدره بمتوسط سنوي النساء بني يف النسبة املئوية: 1.5-؛ فاصلة الثقة %95: 1.7- إىل 1.3%-(،

Bull World Health Organ 2011;89:788–797 | doi:10.2471/BLT.11.089730 795
ResearchDisability prevalence trends in ChinaXiaoying Zheng et al.
وانخفض بني سكان احلرض بمتوسط سنوي قدره %3.9 )املتوسط السنوي للتغري يف النسبة املئوية: %3.9-؛ فاصلة الثقة 95%: 4.3- إىل 3.5-(. وبالرغم من اجتاهات االنخفاض امللحوظة يف العجز االنتشار معدال فإن والبرصي، والفكري والكالمي، السمعي، ازدادا قد النفيس والعجز البدين للعجز بالعمر املصحح السنوي النسبة يف للتغري السنوي )املتوسط 11.2% بمتوسط بالرتتيب 11.9( ومتوسط إىل 10.5 :95% الثقة فاصلة %11.2؛ املئوية:
%13.3 )املتوسط السنوي للتغري يف النسبة املئوية: %13.3؛ فاصلة الثقة %95: 10.7 إىل 16.2(.
للعجز املصحح االنتشار معدل انخفض الصني، يف االستنتاج العجز. نوع عىل اعتامدًا وذلك ثبات غري نحو عىل ،1987 منذ وتستدعي هذه النتائج مواصلة اجلهود اخلاصة املبذولة ملنع العجز
يف الصني.
摘要中国残疾患病率二十年趋势目的 旨在评估从1987到2006年中国过渡期间年龄调整残疾患病率的变化。方法 利用1987和2006年进行的全国代表性调查中所得的数据来计算年龄调整残疾患病率,计算过程中运用了适当的抽样权重并直接对数据进行了调整以适应1990年中国人口的年龄分布。依据平均年百分比变化评估了变化趋势。 结果 1987和2006年中国残疾人的预计数量分别为5270万和8460万,对应的加权患病率分别为4.9%和6.5%。1987到2006年间,年龄调整残疾患病率每年平均下降0.5%(平均年百分比变化:0.5%;95%可信区间:0.7-0.4)。然而,此比例在男性群体中每年平均增加0.3%(平均年百分比变化:0.3%;95%可信区间:0.1-0.5)并且此比例在农村居民中每年平均增加1.0%(平均年百分比变
化:1.0%;95%可信区间:0.8-1.2),而在女性群体和城市居民中,此比例每年分别平均下降1.5%(平均年百分比变化:1.5%;95%可信区间:1.7-1.3)和3.9%(平均年百分比变化:3.9%;95%可信区间:4.3-3.5)。尽管听力残疾和语言障碍、智力障碍和视觉残疾呈明显下降趋势,肢体残疾和精神障碍的年龄调整患病率仍分别以平均每年11.2%(平均年百分比变化:11.2%;95%可信区间:10.5-11.9)和13.3%(平均年百分比变化:13.3%;95%可信区间:10.7-16.2)的比例增加。结论 1987年以来中国的年龄调整残疾患病率总体已经下降,然而因残疾类别不同得出的结果也不一致。研究结果呼吁仍需进一步努力以预防中国的残疾。
Résumé
Des tendances de vingt ans dans la prévalence de l’invalidité en ChineObjectif Evaluer les changements dans la prévalence de l’invalidité en fonction de l’âge dans la Chine en transition de 1987 à 2006.Méthode Des données provenant d’études représentatives sur le plan national menées en 1987 et en 2006 ont été utilisées pour calculer le taux de prévalence de l’invalidité en fonction de l’âge, en appliquant des échantillons appropriés et en ajustant directement la répartition de l’âge de la population chinoise en 1990. Les tendances ont été évaluées en termes de modification du pourcentage annuel moyen.Résultats On a estimé à respectivement 52,7 millions et 84,6 millions le nombre de personnes invalides en Chine en 1987 et en 2006, ce qui correspond à une prévalence pondérée de 4,9% et de 6,5%. La prévalence de l’invalidité en fonction de l’âge a diminué d’en moyenne 0,5% par an (modification du pourcentage annuel moyen, MPAM: 0,5%; intervalle de confiance à 95%, IC: −0,7 à −0,4) entre 1987 et 2006. Il a toutefois augmenté d’en moyenne 0,3% (MPAM: 0,3%; IC 95%: 0,1 à 0,5)
par an chez les hommes et d’en moyenne 1%; IC 95%: 0,8 à 1,2) par an parmi les résidents ruraux, alors qu’il présentait, parmi les femmes une diminution annuelle moyenne de 1,5% (MPAM: 1,5%; IC 95%: −1,7 à −1,3) et parmi les résidents urbains, une diminution annuelle moyenne de 3,9% (MPAM: −4,3 à −3,5). En dépit de tendances déclinantes significatives pour l’audition et la parole et pour les incapacités intellectuelles et visuelles, la prévalence annuelle en fonction de l’âge des invalidités physiques et mentales a augmenté d’en moyenne 11,2% (MPAM: 11,2%; IC 95%: 10,5 à 11,9) et 13,3% (MPAM: 13,3%; IC 95%: 10,7 à 16,2), respectivement.Conclusion En Chine, la prévalence de l’invalidité en fonction de l’âge a décliné depuis 1987, avec des incohérences en fonction du type d’invalidité. Ces conclusions invitent à poursuivre des efforts ciblés en vue de prévenir les invalidités en Chine.
Резюме
Тенденции в области распространенности инвалидности в Китае за 20-летний периодЦель Оценить динамику показателя распространенности инвалидности, скорректированного с учетом возраста, в Китае в переходный период, с 1987 по 2006 год.Методы Для расчета коэффициентов распространенности инвалидности, скорректированных с учетом возраста с применением соответствующих весовых коэффициентов и непосредственной корректировкой по возрастному распределению населения Китая 1990 года, использовались данные национально репрезентативных обследований, проведенных в 1987 и 2006 годах. Оценивались тенденции среднегодовых процентных изменений.
Результаты По оценкам, численность инвалидов в Китае в 1987 и 2006 годах составляла, соответственно, 52,7 и 84,6 млн чел., что корреспондировало со взвешенными коэффициентами распространенности 4,9 и 6,5%. В течение 1987–2006 годов распространенность инвалидности, скорректированная с учетом возраста, снижалась в среднем на 0,5% в год (среднегодовое процентное изменение, СГПИ: −0,5%; 95% доверительный интервал, ДИ: от −0,7 до −0,4). Вместе с тем она возрастала в среднем на 0,3% (СГПИ: 0,3%; 95% ДИ: от 0,1 до 0,5) в год у мужчин и в среднем на 1,0% (СГПИ: 1,0%; 95% ДИ: от 0.8 до 1,2) в год у сельских жителей, тогда как среди женщин наблюдалось среднегодовое

Bull World Health Organ 2011;89:788–797 | doi:10.2471/BLT.11.089730796
ResearchDisability prevalence trends in China Xiaoying Zheng et al.
снижение на 1,5% (СГПИ: −1,5%; 95% ДИ: от −1.7 до −1,3), а среди городских жителей – среднегодовое снижение на 3,9% (СГПИ: −3,9%; 95% ДИ: от −4.3 до −3,5). Несмотря на значительные понижательные тенденции в численности инвалидов с дефектами слуха, речи, зрения и нарушением умственных способностей, ежегодная распространенность инвалидности вследствие соматических и психических заболеваний, скорректированная с учетом возраста, выросла в среднем на 11,2 (СГПИ: 11,2; 95%
ДИ: от 10.5 до 11,9) и 13.3% (СГПИ: 13,3%; 95% ДИ: от 10,7 до 16,2).Вывод В Китае с 1987 года распространенность инвалидности, скорректированная с учетом возраста, в целом снизилась, хотя в зависимости от типа инвалидности наблюдались противоречивые тенденции. В свете этих результатов необходимы последовательные и целенаправленные усилия по предупреждению инвалидности в Китае.
Resumen
Tendencias de la prevalencia de discapacidad en China a lo largo de veinte añosObjetivo Evaluar los cambios en la prevalencia de discapacidad ajustada por edad en la China de la transición desde 1987 hasta 2006.Métodos Se utilizaron datos de sondeos representativos a nivel nacional realizados en 1987 y 2006 para calcular las tasas de prevalencia de discapacidad ajustada por edad mediante la aplicación de los tamaños de muestra adecuados y mediante el ajuste directo de la distribución por edades de la población china en 1990. Las tendencias se evaluaron en función del porcentaje promedio anual de cambio.Hallazgos El número estimado de personas discapacitadas en China en 1987 y 2006 era de 52,7 y 84,6 millones, respectivamente, lo que a su vez se corresponde con una prevalencia ponderada del 4,9% y del 6,5%. En promedio, la prevalencia de discapacidad ajustada por edad se redujo en un 0,5% al año (porcentaje promedio anual de cambio, PPAC: −0,5%; intervalo de confianza del 95%, IC: de −0,7 a −0,4) de 1987 a 2006. No obstante, en promedio ha presentado un incremento del 0,3% (PPAC: 0,3%; IC del 95%: de 0,1 a 0,5) al año en varones y el promedio ha sido
del 1,0% (PPAC: 1,0%; IC del 95%: de 0,8 a 1,2) al año en residentes en áreas rurales, mientras que en mujeres se observó una reducción anual media del 1,5% (PPAC: −1.5%; CI del 95%: de −1,7 a −1,3) y en residentes en áreas urbanas la reducción anual media observada fue del 3,9% (PPAC: −3,9%; CI del 95%: de −4,3 a −3,5). A pesar de que las tendencias muestran un descenso significativo de las discapacidades auditivas, del habla, intelectuales y visuales, la prevalencia de discapacidad anual ajustada por edad de las discapacidades físicas y mentales aumentó, en promedio, el 11,2% (PPAC: 11,2%; IC del 95%: de 10,5 a 11,9) y 13,3% (PPAC: 13,3%; IC del 95%: de 10,7 a 16,2), respectivamente.Conclusión En China, la prevalencia de discapacidad ajustada por edad ha disminuido desde 1987, si bien se encuentran ciertas contradicciones entre los tipos de discapacidad. Estos resultados destacan la necesidad de contar con iniciativas continuas y concretas para prevenir las discapacidades en China.
References1. Lubitz J, Beebe J, Baker C. Longevity and Medicare expenditures. N
Engl J Med 1995;332:999–1003. doi:10.1056/NEJM199504133321506 PMID:7885430
2. World report on disability [Internet]. Geneva: World Health Organization; 2011. Available from: http://www.who.int/disabilities/world_report/en/index.html [accessed 8 March 2011].
3. Disability and health state chartbook, 2006: profiles of health for adults with disabilities. Atlanta: Centers for Disease Control and Prevention; 2006.
4. Peng X, Song S, Sullivan S, Qiu J, Wang W. Ageing, the urban-rural gap and disability trends: 19 years of experience in China - 1987 to 2006. PLoS ONE 2010;5:e12129. doi:10.1371/journal.pone.0012129 PMID:20730089
5. Lubitz J, Cai L, Kramarow E, Lentzner H. Health, life expectancy, and health care spending among the elderly. N Engl J Med 2003;349:1048–55. doi:10.1056/NEJMsa020614 PMID:12968089
6. Brault M. Americans with disabilities: 2005, current population reports. Washington: US Census Bureau; 2008.
7. Freedman VA, Martin LG, Schoeni RF. Recent trends in disability and functioning among older adults in the United States: a systematic review. JAMA 2002;288:3137–46. doi:10.1001/jama.288.24.3137 PMID:12495394
8. Sagardui-Villamor J, Guallar-Castillón P, García-Ferruelo M, Banegas JR, Rodríguez-Artalejo F. Trends in disability and disability-free life expectancy among elderly people in Spain: 1986–1999. J Gerontol A Biol Sci Med Sci 2005;60:1028–34. doi:10.1093/gerona/60.8.1028 PMID:16127108
9. Perenboom RJ, Van Herten LM, Boshuizen HC, Van Den Bos GA. Trends in disability-free life expectancy. Disabil Rehabil 2004;26:377–86. doi:10.1080/0963828032000174098 PMID:15204474
10. Hashimoto S, Kawado M, Seko R, Murakami Y, Hayashi M, Kato M et al. Trends in disability-free life expectancy in Japan, 1995–2004. J Epidemiol 2010;20:308–12. doi:10.2188/jea.JE20090190 PMID:20530916
11. Crimmins EM. Trends in the health of the elderly. Annu Rev Public Health 2004;25:79–98. doi:10.1146/annurev.publhealth.25.102802.124401 PMID:15015913
12. Communiqué on major statistics of China national sample survey on disability. Beijing: Leading Group of the Second China National Sample Survey on Disability & National Bureau of Statistics of the People’s Republic of China; 1987.
13. Communiqué on major statistics of the second China national sample survey on disability. Beijing: Leading Group of the Second China National Sample Survey on Disability & National Bureau of Statistics of the People’s Republic of China; 2006.
14. Li A, Li L. Study on hearing and speech disability in China. Chin J Rehabil Med. 1994;10:96.Chinese.
15. Li A, Li L, Qian Y. Analysis of factors causing visual disability and its preventive measures in China. Zhonghua Yu Fang Yi Xue Za Zhi 1995;29:225–7. PMID:7587664
16. Li AL, Li LM, Qian YP. Preliminary analysis of factors causing mental retardation in China. Zhonghua Yu Fang Yi Xue Za Zhi 1994;28:284–6. PMID:7842893
17. Li A, Qian Y. Study on causes of functional disability and prevention in China. Chin J Publ Health 1995;12:348–9. Chinese.
18. Ming G, Jixiang M. Demography of people with disabilities in China. Int J Rehabil Res 1993;16:299–301. doi:10.1097/00004356-199312000-00005 PMID:8175232
19. Zheng XY, Zhang L, Chen G, Pei LJ, Song XM. Prevalence of visual, hearing, speech, physical, intellectual and mental disabilities in China, 2006. Zhonghua Liu Xing Bing Xue Za Zhi 2008;29:634–8. Chinese. PMID:19031749
20. Tian B, Zhang Y, Qiu Z. Comparison and analysis of data obtained in two national sampling surveys of disability. Chin J Speci Edu 2007;8:54–6. Chinese.
21. Luan C, Liu M. Comparison of prevalence of physical disabilities in year 2006 and 1987, in China. Zhonghua Liu Xing Bing Xue Za Zhi 2008;29:639–42. PMID:19031750
22. Liu J, Chen G, Song X, Chi I, Zheng X. Trends in disability-free life expectancy among Chinese older adults. J Aging Health 2009;21:266–85.

Bull World Health Organ 2011;89:788–797 | doi:10.2471/BLT.11.089730 797
ResearchDisability prevalence trends in ChinaXiaoying Zheng et al.
doi:10.1177/0898264308328978 PMID:1910403323. Phillips MR, Zhang J, Shi Q, Song Z, Ding Z, Pang S et al. Prevalence,
treatment, and associated disability of mental disorders in four provinces in China during 2001–05: an epidemiological survey. Lancet 2009;373:2041–53. doi:10.1016/S0140-6736(09)60660-7 PMID:19524780
24. Chou KL, Leung JC. Disability trends in Hong Kong community-dwelling Chinese older adults: 1996, 2000, and 2004. J Aging Health 2008;20:385–404. doi:10.1177/0898264308315852 PMID:18378722
25. Access to rehab ilitation for the 600 million people living with disabilities [Internet]. Geneva: World Health Organization; 2003. Available from: http://www.who.int/mediacentre/notes/2003/np24/en [accessed 5 July 2011].
26. Korn E, Graubard B. Analysis of health surveys. New York: Wiley; 1999.27. SAS statistical software, version 9.2. Cary: SAS Institute; 2002.28. China, State Population Census Office. National Bureau of Statistics
population statistics yearbook: China 1990 census data. Beijing: China Statistics Press; 1993.
29. Fay MP, Tiwari RC, Feuer EJ, Zou Z. Estimating average annual percent change for disease rates without assuming constant change. Biometrics 2006;62:847–54. doi:10.1111/j.1541-0420.2006.00528.x PMID:16984328
30. Agresti A. An introduction to categorical data analysis. New York: Wiley; 1996.31. Whitson HE, Landerman LR, Newman AB, Fried LP, Pieper CF, Cohen HJ.
Chronic medical conditions and the sex-based disparity in disability: the Cardiovascular Health Study. J Gerontol A Biol Sci Med Sci 2010;65A:1325–31. doi:10.1093/gerona/glq139 PMID:20675619
32. Cantor-Graae E, Selten JP. Schizophrenia and migration: a meta-analysis and review. Am J Psychiatry 2005;162:12–24. doi:10.1176/appi.ajp.162.1.12 PMID:15625195
33. Centers for Disease Control and Prevention. Progress toward poliomyelitis eradication – People’s Republic of China, 1990-1996. MMWR Wkly Rep 1996;45:1076–9.
34. Wang SY, Li YH, Chi GB, Xiao SY, Ozanne-Smith J, Stevenson M et al. Injury-related fatalities in China: an under-recognised public-health problem. Lancet 2008;372:1765–73. doi:10.1016/S0140-6736(08)61367-7 PMID:18930527
35. Takara J. Introductory report: decent work, safe work. Presented at the XVIIth World Congress on Safety and Health at Work, Orlando, United States of America, 18-22 September 2005.
36. Chan KW, Zhang L. The “hukou” system and rural-urban migration in China: processes and changes. China Q 1999;160:818–55. doi:10.1017/S0305741000001351 PMID:20101805
37. Hu X. Xing HY. Research on health status of migration workers and health policy. Zhejiang University; 2008. Chinese.
38. International classification of impairments, disabilities, and handicaps. Geneva: World Health Organization; 1980.
39. International classification of functioning, disability and health. Geneva: World Health Organization; 2001.
40. Fries JF. Reducing disability in older age. JAMA 2002;288:3164–6. doi:10.1001/jama.288.24.3164 PMID:12495399