Embed Size (px)
Citation preview

Package ‘twang’October 25, 2021
Version 2.5
Date 2021-10-20
Title Toolkit for Weighting and Analysis of Nonequivalent Groups
Author Matthew Cefalu <[email protected]>, Greg Ridgeway, Dan McCaffrey, An-drew Morral, Beth Ann Griffin, and Lane Burgette
Maintainer Matthew Cefalu <[email protected]>
Depends R (>= 2.10)
Imports gbm (>= 1.5-3), survey, xtable, lattice, latticeExtra,MatrixModels, data.table, ggplot2, xgboost
Suggests knitr
Description Provides functions for propensity scoreestimating and weighting, nonresponse weighting, and diagnosisof the weights.
License GPL-3 | file LICENSE
Encoding UTF-8
NeedsCompilation yes
Repository CRAN
VignetteBuilder knitr
RoxygenNote 7.1.1
Date/Publication 2021-10-25 12:50:02 UTC
R topics documented:twang-package . . . . . . . . . . . . . . . . . . . . . . . . . . . . . . . . . . . . . . . 2AOD . . . . . . . . . . . . . . . . . . . . . . . . . . . . . . . . . . . . . . . . . . . . . 3bal.stat . . . . . . . . . . . . . . . . . . . . . . . . . . . . . . . . . . . . . . . . . . . . 3bal.table . . . . . . . . . . . . . . . . . . . . . . . . . . . . . . . . . . . . . . . . . . . 5boxplot.mnps . . . . . . . . . . . . . . . . . . . . . . . . . . . . . . . . . . . . . . . . 6boxplot.ps . . . . . . . . . . . . . . . . . . . . . . . . . . . . . . . . . . . . . . . . . . 8desc.wts . . . . . . . . . . . . . . . . . . . . . . . . . . . . . . . . . . . . . . . . . . . 9displayPlots . . . . . . . . . . . . . . . . . . . . . . . . . . . . . . . . . . . . . . . . . 10
1

2 twang-package
dx.wts . . . . . . . . . . . . . . . . . . . . . . . . . . . . . . . . . . . . . . . . . . . . 11egsingle . . . . . . . . . . . . . . . . . . . . . . . . . . . . . . . . . . . . . . . . . . . 12get.weights . . . . . . . . . . . . . . . . . . . . . . . . . . . . . . . . . . . . . . . . . 13get.weights.num . . . . . . . . . . . . . . . . . . . . . . . . . . . . . . . . . . . . . . . 14get.weights.unstab . . . . . . . . . . . . . . . . . . . . . . . . . . . . . . . . . . . . . . 14iptw . . . . . . . . . . . . . . . . . . . . . . . . . . . . . . . . . . . . . . . . . . . . . 15iptwExLong . . . . . . . . . . . . . . . . . . . . . . . . . . . . . . . . . . . . . . . . . 18iptwExWide . . . . . . . . . . . . . . . . . . . . . . . . . . . . . . . . . . . . . . . . . 18lalonde . . . . . . . . . . . . . . . . . . . . . . . . . . . . . . . . . . . . . . . . . . . . 19lindner . . . . . . . . . . . . . . . . . . . . . . . . . . . . . . . . . . . . . . . . . . . . 20means.table . . . . . . . . . . . . . . . . . . . . . . . . . . . . . . . . . . . . . . . . . 21mnIptwExLong . . . . . . . . . . . . . . . . . . . . . . . . . . . . . . . . . . . . . . . 21mnIptwExWide . . . . . . . . . . . . . . . . . . . . . . . . . . . . . . . . . . . . . . . 22mnps . . . . . . . . . . . . . . . . . . . . . . . . . . . . . . . . . . . . . . . . . . . . . 23plot.dxwts . . . . . . . . . . . . . . . . . . . . . . . . . . . . . . . . . . . . . . . . . . 26plot.iptw . . . . . . . . . . . . . . . . . . . . . . . . . . . . . . . . . . . . . . . . . . . 26plot.mniptw . . . . . . . . . . . . . . . . . . . . . . . . . . . . . . . . . . . . . . . . . 28plot.mnps . . . . . . . . . . . . . . . . . . . . . . . . . . . . . . . . . . . . . . . . . . 29plot.ps . . . . . . . . . . . . . . . . . . . . . . . . . . . . . . . . . . . . . . . . . . . . 31print.dxwts . . . . . . . . . . . . . . . . . . . . . . . . . . . . . . . . . . . . . . . . . 32print.iptw . . . . . . . . . . . . . . . . . . . . . . . . . . . . . . . . . . . . . . . . . . 32print.mniptw . . . . . . . . . . . . . . . . . . . . . . . . . . . . . . . . . . . . . . . . . 33print.mnps . . . . . . . . . . . . . . . . . . . . . . . . . . . . . . . . . . . . . . . . . . 33print.ps . . . . . . . . . . . . . . . . . . . . . . . . . . . . . . . . . . . . . . . . . . . 34print.summary.iptw . . . . . . . . . . . . . . . . . . . . . . . . . . . . . . . . . . . . . 34print.summary.mniptw . . . . . . . . . . . . . . . . . . . . . . . . . . . . . . . . . . . 35print.summary.mnps . . . . . . . . . . . . . . . . . . . . . . . . . . . . . . . . . . . . 35print.summary.ps . . . . . . . . . . . . . . . . . . . . . . . . . . . . . . . . . . . . . . 36ps . . . . . . . . . . . . . . . . . . . . . . . . . . . . . . . . . . . . . . . . . . . . . . 36raceprofiling . . . . . . . . . . . . . . . . . . . . . . . . . . . . . . . . . . . . . . . . . 40sensitivity . . . . . . . . . . . . . . . . . . . . . . . . . . . . . . . . . . . . . . . . . . 41stop.methods . . . . . . . . . . . . . . . . . . . . . . . . . . . . . . . . . . . . . . . . 41summary.iptw . . . . . . . . . . . . . . . . . . . . . . . . . . . . . . . . . . . . . . . . 42summary.mniptw . . . . . . . . . . . . . . . . . . . . . . . . . . . . . . . . . . . . . . 43summary.mnps . . . . . . . . . . . . . . . . . . . . . . . . . . . . . . . . . . . . . . . 43summary.ps . . . . . . . . . . . . . . . . . . . . . . . . . . . . . . . . . . . . . . . . . 44
Index 45
twang-package twang: Toolkit for Weighting and Analysis of Nonequivalent Groups
Description
Provides functions for propensity score estimating and weighting, nonresponse weighting, and di-agnosis of the weights.

AOD 3
AOD Subset of Alcohol and Other Drug treatment data
Description
A small subset of the data from McCaffrey et al. (2013).
Usage
data(AOD)
Format
A data frame with 600 observations on the following 10 variables.
treat Treatment that each study subject received. Either community, metcbt5, or scy.
suf12 outcome variable, substance use frequency at 12 month follow-up
illact covariate, illicit activities scale
crimjust covariate, criminal justice involvement
subprob covariate, substance use problem scale
subdep covariate, substance use dependence scale
white 1 if non-Hispanic white, 0 otherwise
References
McCaffrey, DF, BA Griffin, D Almirall, ME Slaughter, R Ramchand and LF Burgette (2013). Atutorial on propensity score estimation for multiple treatments using generalized boosted models.Statistics in Medicine.
bal.stat Calculate weighted balance statistics
Description
‘bal.stat‘ compares the treatment and control subjects by means, standard deviations, effect size,and KS statistics

4 bal.stat
Usage
bal.stat(data,vars = NULL,treat.var,w.all,sampw,get.means = TRUE,get.ks = TRUE,na.action = "level",estimand,multinom,fillNAs = FALSE
)
Arguments
data A data frame containing the data
vars A vector of character strings with the names of the variables on which the func-tion will assess the balance
treat.var The name of the treatment variable
w.all Oobservation weights (e.g. propensity score weights, sampling weights, or both)
sampw Sampling weights. These are passed in addition to ‘w.all‘ because the "un-weighted" results shoud be adjusted for sample weights (though not propensityscore weights).
get.means logical. If ‘TRUE‘ then ‘bal.stat‘ will compute means and variances
get.ks logical. If ‘TRUE‘ then ‘bal.stat‘ will compute KS statistics
na.action A character string indicating how ‘bal.stat‘ should handle missing values. Cur-rent options are "level", "exclude", or "lowest"
estimand Either "ATT" or "ATE"
multinom logical. ‘TRUE‘ if used for multinomial propensity scores.
fillNAs logical. If ‘TRUE‘, fills in zeros for missing values.
Details
‘bal.stat‘ calls auxiliary functions for each variable and assembles the results in a table.
Value
‘get.means‘ and ‘get.ks‘ manipulate the inclusion of certain columns in the returned result.
References
Dan McCaffrey, G. Ridgeway, Andrew Morral (2004). "Propensity Score Estimation with BoostedRegression for Evaluating Adolescent Substance Abuse Treatment", *Psychological Methods* 9(4):403-425.
bal.table 5
See Also
The example for [ps] contains an example of the use of [bal.table]
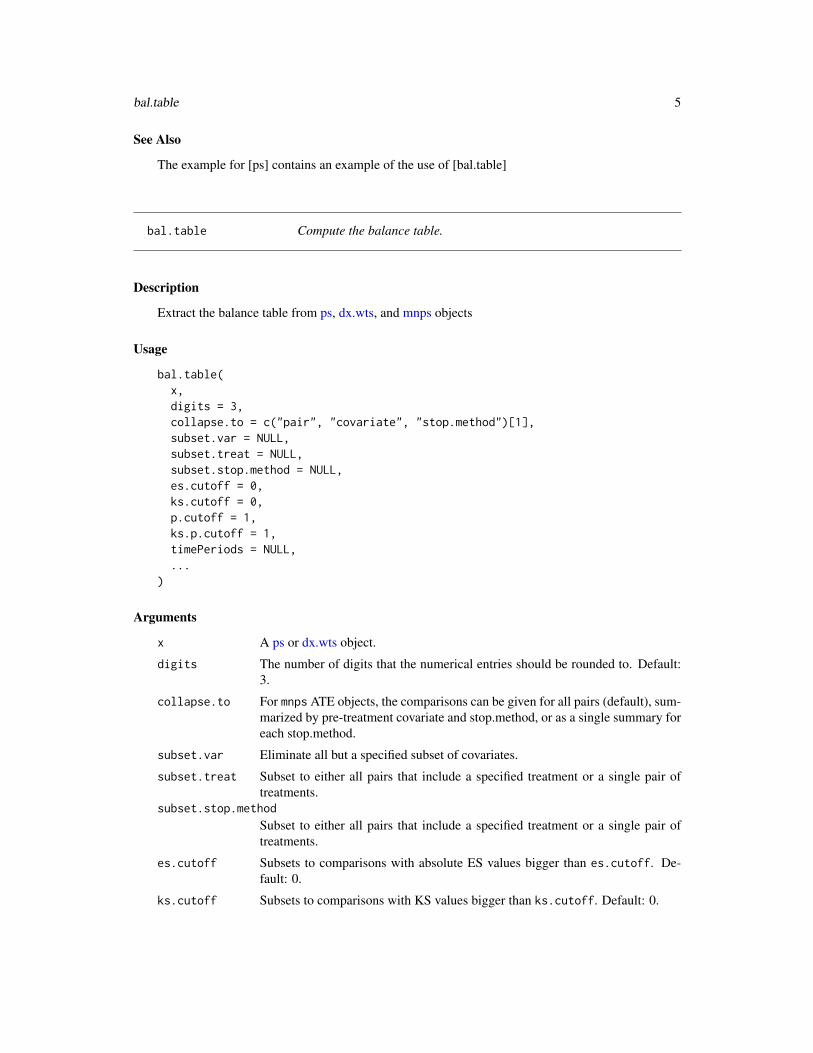
bal.table Compute the balance table.
Description
Extract the balance table from ps, dx.wts, and mnps objects
Usage
bal.table(x,digits = 3,collapse.to = c("pair", "covariate", "stop.method")[1],subset.var = NULL,subset.treat = NULL,subset.stop.method = NULL,es.cutoff = 0,ks.cutoff = 0,p.cutoff = 1,ks.p.cutoff = 1,timePeriods = NULL,...
)
Arguments
x A ps or dx.wts object.
digits The number of digits that the numerical entries should be rounded to. Default:3.
collapse.to For mnps ATE objects, the comparisons can be given for all pairs (default), sum-marized by pre-treatment covariate and stop.method, or as a single summary foreach stop.method.
subset.var Eliminate all but a specified subset of covariates.
subset.treat Subset to either all pairs that include a specified treatment or a single pair oftreatments.
subset.stop.method
Subset to either all pairs that include a specified treatment or a single pair oftreatments.
es.cutoff Subsets to comparisons with absolute ES values bigger than es.cutoff. De-fault: 0.
ks.cutoff Subsets to comparisons with KS values bigger than ks.cutoff. Default: 0.

6 boxplot.mnps
p.cutoff Subsets to comparisons with t- or chi-squared p-values no bigger than p.cutoff.Default: 1.
ks.p.cutoff Subsets to comparisons with t- or chi-squared p-values no bigger than p.cutoff.Default: 1.
timePeriods Used to subset times for iptw fits.
... Additional arugments.
Details
bal.table is a generic function for extracting balance tables from ps and dx.wts objects. Theseobjects usually have several sets of candidate weights, one for an unweighted analysis and perhapsseveral stop.methods. bal.table will return a table for each set of weights combined into a list.Each list component will be named as given in the x, usually the name of the stop.method. Thebalance table labeled “unw” indicates the unweighted analysis.
Value
Returns a data frame containing the balance information.
• tx.mn The mean of the treatment group.
• tx.sd The standard deviation of the treatment group.
• ct.mn The mean of the control group.
• ct.sd The standard deviation of the control group.
• std.eff.sz The standardized effect size, (tx.mn-ct.mn)/tx.sd. If tx.sd is small or 0, the stan-dardized effect size can be large or INF. Therefore, standardized effect sizes greater than 500are set to NA.
• stat The t-statistic for numeric variables and the chi-square statistic for continuous variables.
• p The p-value for the test associated with stat ks The KS statistic.
• ks.pval The KS p-value computed using the analytic approximation, which does not neces-sarily work well with a lot of ties.
boxplot.mnps Boxplot for ‘mnps‘ objects
Description
This function produces a collection of diagnostic plots for mnps objects.

boxplot.mnps 7
Usage
## S3 method for class 'mnps'boxplot(x,stop.method = NULL,color = TRUE,figureRows = NULL,singlePlot = NULL,multiPage = FALSE,time = NULL,print = TRUE,...
)
Arguments
x A ‘ps‘ object
stop.method Only 1 ‘stop.method‘ can be presented at a time for ‘mnps‘ objects. Use anumeric indicator of which ‘stop.method‘ (among those specified when fittingthe ‘mnps‘ object) should be used.
color If ‘FALSE‘, a grayscale figure will be returned.
figureRows The number of rows in the figure. Defaults to the number of panels.
singlePlot If multiple sets of boxplots are produced, ‘singlePlot‘ can be used to select onlyone. For example, ‘singlePlot = 2‘ would return only the second set of boxplots.
multiPage When multiple frames of a figure are produced, ‘multiPage = TRUE‘ will printeach frame on a different page. This is intended for situations where the graphi-cal output is being saved to a file.
time For use with iptw fits.
print If ‘FALSE‘, the figure is returned but not printed.
... Additional arguments that are passed to boxplot function, which may bepassedto the underlying ‘lattice‘ package plotting functions.
Details
This function produces lattice-style graphics of diagnostic plots.
References
Dan McCaffrey, G. Ridgeway, Andrew Morral (2004). "Propensity Score Estimation with BoostedRegression for Evaluating Adolescent Substance Abuse Treatment", *Psychological Methods* 9(4):403-425.
See Also
[mnps]

8 boxplot.ps
boxplot.ps Boxplot for ‘ps‘ objects
Description
This function produces a collection of diagnostic plots for ps objects.
Usage
## S3 method for class 'ps'boxplot(x, subset = NULL, color = TRUE, time = NULL, ...)
Arguments
x A ‘ps‘ object
subset If multiple ‘stop.method‘ rules were used in the ‘ps()‘ call, ‘subset‘ restrictsthe plots of a subset of the stopping rules that were employed. This argumentexpects a subset of the integers from 1 to k, if k ‘stop.method‘s were used.
color If ‘FALSE‘, a grayscale figure will be returned.
time For use with iptw fits.
... Additional arguments that are passed to boxplot function, which may bepassedto the underlying ‘lattice‘ package plotting functions.
Details
This function produces lattice-style graphics of diagnostic plots.
References
Dan McCaffrey, G. Ridgeway, Andrew Morral (2004). "Propensity Score Estimation with BoostedRegression for Evaluating Adolescent Substance Abuse Treatment", *Psychological Methods* 9(4):403-425.
See Also
[ps]

desc.wts 9
desc.wts Diagnosis of weights
Description
desc.wts assesses the quality of a set of weights on balancing a treatment and control group.
Usage
desc.wts(data,w,sampw = sampw,vars = NULL,treat.var,tp,na.action = "level",perm.test.iters=0,verbose=TRUE,alerts.stack,estimand, multinom = FALSE, fillNAs = FALSE)
Arguments
data a data frame containing the dataset
w a vector of weights equal to nrow(data)
sampw sampling weights, if provided
vars a vector of variable names corresponding to data
treat.var the name of the treatment variable
tp a title for the method “type" used to create the weights, used to label the results
na.action a string indicating the method for handling missing dataperm.test.iters
an non-negative integer giving the number of iterations of the permutation testfor the KS statistic. If perm.test.iters=0 then the function returns an analyticapproximation to the p-value. This argument is ignored is x is a ps object.Setting perm.test.iters=200 will yield precision to within 3% if the true p-value is 0.05. Use perm.test.iters=500 to be within 2%
verbose if TRUE, lots of information will be printed to monitor the the progress of thefitting
alerts.stack an object for collecting warnings issued during the analyses
estimand the estimand of interest: either "ATT" or "ATE"
multinom Indicator that weights are from a propsensity score analysis with 3 or more treat-ment groups.
fillNAs If TRUE fills NAs with zeros.

10 displayPlots
Details
desc.wts calls bal.stat to assess covariate balance. If perm.test.iters>0 it will call bal.statmultiple times to compute Monte Carlo p-values for the KS statistics and the maximum KS statistic.It assembles the results into a list object, which usually becomes the desc component of ps objectsthat ps returns.
Value
See the description of the desc component of the ps object that ps returns
See Also
ps
displayPlots Display plots
Description
Display plots
Usage
displayPlots(ptList, figureRows, singlePlot, multiPage, bxpt = FALSE)
Arguments
ptList A list of plots to display.
figureRows The number of rows in the figure.
singlePlot An integer indicating the index of the plot to display.
multiPage Whether to display plots on multiple pages.
bxpt Whether to display boxplots. Default: ‘FALSE‘.

dx.wts 11
dx.wts Compute diagnostics assessing covariates balance.
Description
dx.wts takes a ps object or a set of propensity scores and computes diagnostics assessing covariatesbalance.
Usage
dx.wts(x,data,estimand,vars = NULL,treat.var,x.as.weights = TRUE,sampw = NULL,perm.test.iters = 0
)
Arguments
x A data frame, matrix, or vector of propensity score weights or a ps object. x canalso be a data frame, matrix, or vector of propensity scores if x.as.weights=FALSE.
data A data frame.
estimand The estimand of interest: either "ATT" or "ATE".
vars A vector of character strings naming variables in data on which to assess bal-ance.
treat.var A character string indicating which variable in data contains the 0/1 treatmentgroup indicator.
x.as.weights TRUE or FALSE indicating whether x specifies propensity score weights or propen-sity scores. Ignored if x is a ps object. Default: TRUE.
sampw Optional sampling weights. If x is a ps object, then the sampling weights shouldhave been passed to ps and not specified here. dx.wts will issue a warning if xis a ps object and sampw is also specified.
perm.test.iters
A non-negative integer giving the number of iterations of the permutation test forthe KS statistic. If perm.test.iters=0, then the function returns an analyticapproximation to the p-value. This argument is ignored is x is a ps object.Setting perm.test.iters=200 will yield precision to within 3% if the true p-value is 0.05. Use perm.test.iters=500 to be within 2%.

12 egsingle
Details
Creates a balance table that compares unweighted and weighted means and standard deviations,computes effect sizes, and KS statistics to assess the ability of the propensity scores to balance thetreatment and control groups.
Value
Returns a list containing
• treat The vector of 0/1 treatment assignment indicators.
See Also
ps
egsingle US Sustaining Effects study
Description
A subset of the mathematics scores from the U.S. Sustaining Effects Study. The subset consists ofinformation on 1721 students from 60 schools. This dataset is available in the mlmRev package.
Usage
data(egsingle)
Format
A data frame with 7230 observations on the following 12 variables.
schoolid a factor of school identifiers
childid a factor of student identifiers
year a numeric vector indicating the year of the test
grade a numeric vector indicating the student’s grade
math a numeric vector of test scores on the IRT scale score metric
retained a factor with levels 0 1 indicating if the student has been retained in a grade.
female a factor with levels Female Male
black a factor with levels 0 1 indicating if the student is Black
hispanic a factor with levels 0 1 indicating if the student is Hispanic
size a numeric vector indicating the number of students enrolled in the school
lowinc a numeric vector giving the percentage of low-income students in the school
mobility a numeric vector

get.weights 13
Source
Reproduced from themlmRev package for use in the section on nonresponse weighting in the twangpackage vignette. These data are distributed with the HLM software package (Bryk, Raudenbush,and Congdon, 1996). Conversion to the R format is described in Doran and Lockwood (2006).
References
Doran, H.C. and J.R. Lockwood (2006). “Fitting value-added models in R,” Journal of Educationaland Behavioral Statistics, 31(1)
get.weights Extract propensity score weights.
Description
Extracts propensity score weights from a ps or mnps object.
Usage
get.weights(ps1, stop.method = NULL, estimand = NULL, withSampW = TRUE)
Arguments
ps1 A ps or mnps object.
stop.method Indicates which set of weights to retrieve from the ps object.
estimand Indicates whether the weights are for the average treatment effect on the treated(ATT) or the average treatment effect on the population (ATE). By default,get.weights will use the estimand used to fit the ps object.
withSampW Whether to return weights with sample weights multiplied in, if they were pro-vided in the original ps or mnps call. Default: TRUE.
Details
Weights for ATT are 1 for the treatment cases and p/(1-p) for the control cases. Weights for ATEare 1/p for the treatment cases and 1/(1-p) for the control cases.
Value
Returns a vector of weights.
See Also
ps, mnps
14 get.weights.unstab
get.weights.num Get numerators to stabilize propensity score weights for ‘iptw‘ fits.
Description
Forms numerators to stabilize weights for an iptw object.
Usage
get.weights.num(iptw, fitList)
Arguments
iptw An ‘iptw“ object.
fitList A list containing objects with an associated "fitted" function.
Value
Returns numerator of stabilized weights to be used in conjunction with ‘get.weights.unstab‘
See Also
[iptw]
get.weights.unstab Extract unstabilized propensity score weights for ‘iptw‘ fits
Description
Extracts propensity score weights from an ‘iptw‘ or ‘mniptw‘ object.
Usage
get.weights.unstab(x, stop.method = NULL, withSampW = TRUE)
Arguments
x An ‘iptw‘ or ‘mniptw‘ object.
stop.method The twop method used for the fit of interest.
withSampW Returns weights with sample weights multiplied in, if they were provided in theoriginal ‘iptw‘ call. Default: ‘TRUE‘.
Details
Weights are the reciprocal of the product of the probability of receiving the treatment received.
iptw 15
Value
Returns a data.frame of weights.
See Also
[iptw]
iptw Inverse probability of treatment weighting for marginal structuralmodels.
Description
iptw calculates propensity scores for sequential treatments using gradient boosted logistic regres-sion and diagnoses the resulting propensity scores using a variety of methods
Usage
iptw(formula,data,timeInvariant = NULL,cumulative = TRUE,timeIndicators = NULL,ID = NULL,priorTreatment = TRUE,n.trees = 10000,interaction.depth = 3,shrinkage = 0.01,bag.fraction = 1,n.minobsinnode = 10,perm.test.iters = 0,print.level = 2,verbose = TRUE,stop.method = c("es.max"),sampw = NULL,version = "gbm",ks.exact = NULL,n.keep = 1,n.grid = 25,...
)

16 iptw
Arguments
formula Either a single formula (long format) or a list with formulas.
data The dataset, includes treatment assignment as well as covariates.
timeInvariant An optional formula (with no left-hand variable) specifying time-invariant charar-acteristics.
cumulative If TRUE, the time t model includes time-varying characteristics from times 1through t-1. Default: TRUE.
timeIndicators For long format fits, a vector of times for each observation.
ID For long format fits, a vector of numeric identifiers for unique analytic units.
priorTreatment For long format fits, includes treatment levels from previous times if TRUE. Thisargument is ignored for wide format fits. Default: TRUE.
n.trees Number of gbm iterations passed on to gbm.interaction.depth
A positive integer denoting the tree depth used in gradient boosting. Default: 3.
shrinkage A numeric value between 0 and 1 denoting the learning rate. See gbm for moredetails. Default: 0.01.
bag.fraction A numeric value between 0 and 1 denoting the fraction of the observations ran-domly selected in each iteration of the gradient boosting algorithm to proposethe next tree. See gbm for more details. Default: 1.0.
n.minobsinnode An integer specifying the minimum number of observations in the terminalnodes of the trees used in the gradient boosting. See gbm for more details. De-fault: 10.
perm.test.iters
A non-negative integer giving the number of iterations of the permutation testfor the KS statistic. If perm.test.iters=0 then the function returns an analyticapproximation to the p-value. Setting perm.test.iters=200 will yield preci-sion to within 3% if the true p-value is 0.05. Use perm.test.iters=500 to bewithin 2%. Default: 0.
print.level The amount of detail to print to the screen. Default: 2.
verbose If TRUE, lots of information will be printed to monitor the the progress of thefitting. Default: TRUE.
stop.method A method or methods of measuring and summarizing balance across pretreat-ment variables. Current options are ks.mean, ks.max, es.mean, and es.max.ks refers to the Kolmogorov-Smirnov statistic and es refers to standardized ef-fect size. These are summarized across the pretreatment variables by either themaximum (.max) or the mean (.mean). Default: c("es.max").
sampw Optional sampling weights.
version "gbm", "xgboost", or "legacy", indicating which version of the twang packageto use.
• "gbm" uses gradient boosting from the gbm package.• "xgboost" uses gradient boosting from the xgboost package.• "legacy" uses the prior implementation of the ps function.

iptw 17
Default: "gbm".
ks.exact NULL or a logical indicating whether the Kolmogorov-Smirnov p-value should bebased on an approximation of exact distribution from an unweighted two-sampleKolmogorov-Smirnov test. If NULL, the approximation based on the exact dis-tribution is computed if the product of the effective sample sizes is less than10,000. Otherwise, an approximation based on the asymptotic distribution isused. **Warning:** setting ks.exact = TRUE will add substantial computationtime for larger sample sizes. Default: NULL.
n.keep A numeric variable indicating the algorithm should only consider every n.keep-th iteration of the propensity score model and optimize balance over this setinstead of all iterations. Default: 1.
n.grid A numeric variable that sets the grid size for an initial search of the regionmost likely to minimize the stop.method. A value of n.grid=50 uses a 50point grid from 1:n.trees. It finds the minimum, say at grid point 35. It thenlooks for the actual minimum between grid points 34 and 36. If specified withn.keep>1, n.grid corresponds to a grid of points on the kept iterations as de-fined by ‘n.keep. Default: 25.
... Additional arguments that are passed to ps function.
Details
For user more comfortable with the options of xgboost], the options for iptw controlling the be-havior of the gradient boosting algorithm can be specified using the xgboost naming scheme. Thisincludes nrounds, max_depth, eta, and subsample. In addition, the list of parameters passed toxgboost can be specified with params.
Value
Returns an object of class iptw, a list containing
• psList A list of ps objects with length equal to the number of time periods.
• estimand The specified estimand.
• stop.methods The stopping rules used to optimize iptw balance.
• nFits The number of ps objects (i.e., the number of distinct time points).
• uniqueTimes The unique times in the specified model.
See Also
ps, mnps, gbm, xgboost, plot, bal.table

18 iptwExWide
iptwExLong Example data for iptw function (long version)
Description
These data are simulated to demonstrate the iptw function in the "long" data format.
Usage
data(lindner)
Format
A list with a covariate matrix and outcomes.
covariates Time-invariant covariates are gender and age. The time-varying covariate is use. Thereatment indicator is given by tx. An individual level identifier is given in ID, and the timeperiod is time.
outcome Vector of post-treatment outcomes.
iptwExWide Example data for iptw function (wide version)
Description
These data are simulated to demonstrate the iptw function in the "wide" data format.
Usage
data(lindner)
Format
A list with a covariate matrix and outcomes.
gender Gender.age Age.use0 Baseline substance use.use1 Use following first time period treatment.use2 Use following second time period treatment.tx1 Treatment indicator (first time period).tx2 Treatment indicator (second time period).tx3 Treatment indicator (third time period).covariates Time-invariant covariates are gender and age. The time-varying covariate is use. The
reatment indicator is given by tx. An individual level identifier is given in ID, and the timeperiod is time.
outcome Post-treatment outcomes.

lalonde 19
lalonde Lalonde’s National Supported Work Demonstration data
Description
One of the datasets used by Dehejia and Wahba in their paper "Causal Effects in Non-ExperimentalStudies: Reevaluating the Evaluation of Training Programs." Also used as an example dataset in theMatchIt package.
Usage
data(lalonde)
Format
A data frame with 614 observations on the following 10 variables.
treat 1 if treated in the National Supported Work Demonstration, 0 if from the Current PopulationSurvey
age age
educ years of education
black 1 if black, 0 otherwise
hispan 1 if Hispanic, 0 otherwise
married 1 if married, 0 otherwise
nodegree 1 if no degree, 0 otherwise
re74 earnings in 1974 (pretreatment)
re75 earnings in 1975 (pretreatment)
re78 earnings in 1978 (outcome)
Source
http://www.columbia.edu/~rd247/nswdata.html http://cran.r-project.org/src/contrib/Descriptions/MatchIt.html
References
Lalonde, R. (1986). Evaluating the econometric evaluations of training programs with experimentaldata. American Economic Review 76: 604-620.
Dehejia, R.H. and Wahba, S. (1999). Causal Effects in Nonexperimental Studies: Re-Evaluating theEvaluation of Training Programs. Journal of the American Statistical Association 94: 1053-1062.

20 lindner
lindner Lindner Center data on 996 PCI patients analyzed by Kereiakes et al.(2000)
Description
These data are adapted from the lindner dataset in the USPS package. The description comes fromthat package, except for the variable sixMonthSurvive, which is a recode of lifepres
Data from an observational study of 996 patients receiving an initial Percutaneous Coronary Inter-vention (PCI) at Ohio Heart Health, Christ Hospital, Cincinnati in 1997 and followed for at least6 months by the staff of the Lindner Center. The patients thought to be more severely diseasedwere assigned to treatment with abciximab (an expensive, high-molecular-weight IIb/IIIa cascadeblocker); in fact, only 298 (29.9 percent) of patients received usual-care-alone with their initial PCI.
Usage
data(lindner)
Format
A data frame of 10 variables collected on 996 patients; no NAs.
lifepres Mean life years preserved due to survival for at least 6 months following PCI; numericvalue of either 11.4 or 0.
cardbill Cardiac related costs incurred within 6 months of patient’s initial PCI; numeric value in1998 dollars; costs were truncated by death for the 26 patients with lifepres == 0.
abcix Numeric treatment selection indicator; 0 implies usual PCI care alone; 1 implies usual PCIcare deliberately augmented by either planned or rescue treatment with abciximab.
stent Coronary stent deployment; numeric, with 1 meaning YES and 0 meaning NO.
height Height in centimeters; numeric integer from 108 to 196.
female Female gender; numeric, with 1 meaning YES and 0 meaning NO.
diabetic Diabetes mellitus diagnosis; numeric, with 1 meaning YES and 0 meaning NO.
acutemi Acute myocardial infarction within the previous 7 days; numeric, with 1 meaning YESand 0 meaning NO.
ejecfrac Left ejection fraction; numeric value from 0 percent to 90 percent.
ves1proc Number of vessels involved in the patient’s initial PCI procedure; numeric integer from0 to 5.
sixMonthSurvive Survival at six months — a recoded version of lifepres.
References
Kereiakes DJ, Obenchain RL, Barber BL, et al. Abciximab provides cost effective survival advan-tage in high volume interventional practice. Am Heart J 2000; 140: 603-610.
Obenchain RL. (2009) USPSinR.pdf ../R\_HOME/library/USPS 40 pages.

means.table 21
means.table Extract table of means from an‘mnps‘ object
Description
Extracts table of means from an mnps object.
Usage
means.table(mnps, stop.method = 1, includeSD = FALSE, digits = NULL)
Arguments
mnps An ‘mnps‘ object.
stop.method Indicates which set of weights to retrieve from the ‘ps‘ object. Either the nameof the stop.method used, or a natural number with 1, for example, . indicatingthe first stop.method specified.
includeSD Indicates whether standard deviations as well as means are to be displayed. Bydefault, they are not displayed.
digits If not ‘NULL‘, results will be rounded to the specified number of digits.
Details
Displays a table with weighted and unweighted means and standardized effect sizes, and – if re-quested – standard deviations.
Value
‘A table of means, standardized effect sizes, and perhaps standard deviations, by treatment group.
See Also
[mnps]
mnIptwExLong Example data for iptw function (long version, more than two treat-ments).
Description
These data are simulated to demonstrate the iptw function in the "long" data format.
Usage
data(lindner)

22 mnIptwExWide
Format
A list with a covariate matrix and outcomes.
covariates Time-invariant covariates are gender and age. The time-varying covariate is use. Thereatment indicator is given by tx. An individual level identifier is given in ID, and the timeperiod is time.
outcome Vector of post-treatment outcomes.
mnIptwExWide Example data for iptw function (wide version, more than two treat-ments)
Description
These data are simulated to demonstrate the iptw function in the "wide" data format.
Usage
data(lindner)
Format
A list with a covariate matrix and outcomes.
gender Gender.
age Age.
use0 Baseline substance use.
use1 Use following first time period treatment.
use2 Use following second time period treatment.
tx1 Treatment indicator (first time period).
tx2 Treatment indicator (second time period).
tx3 Treatment indicator (third time period).
covariates Time-invariant covariates are gender and age. The time-varying covariate is use. Thereatment indicator is given by tx. An individual level identifier is given in ID, and the timeperiod is time.
outcome Post-treatment outcomes.

mnps 23
mnps Propensity score estimation for multiple treatments
Description
mnps calculates propensity scores for more than two treatment groups using gradient boosted logis-tic regression, and diagnoses the resulting propensity scores using a variety of methods.
Usage
mnps(formula,data,n.trees = 10000,interaction.depth = 3,shrinkage = 0.01,bag.fraction = 1,n.minobsinnode = 10,perm.test.iters = 0,print.level = 2,verbose = TRUE,estimand = "ATE",stop.method = c("es.max"),sampw = NULL,version = "gbm",ks.exact = NULL,n.keep = 1,n.grid = 25,treatATT = NULL,...
)
Arguments
formula A formula for the propensity score model with the treatment indicator on the leftside of the formula and the potential confounding variables on the right side.
data The dataset, includes treatment assignment as well as covariates.
n.trees Number of gbm iterations passed on to gbm. Default: 10000.interaction.depth
A positive integer denoting the tree depth used in gradient boosting. Default: 3.
shrinkage A numeric value between 0 and 1 denoting the learning rate. See gbm for moredetails. Default: 0.01.
bag.fraction A numeric value between 0 and 1 denoting the fraction of the observations ran-domly selected in each iteration of the gradient boosting algorithm to proposethe next tree. See gbm for more details. Default: 1.0.

24 mnps
n.minobsinnode An integer specifying the minimum number of observations in the terminalnodes of the trees used in the gradient boosting. See gbm for more details. De-fault: 10.
perm.test.iters
A non-negative integer giving the number of iterations of the permutation testfor the KS statistic. If perm.test.iters=0 then the function returns an analyticapproximation to the p-value. Setting perm.test.iters=200 will yield preci-sion to within 3% if the true p-value is 0.05. Use perm.test.iters=500 to bewithin 2%. Default: 0.
print.level The amount of detail to print to the screen. Default: 2.
verbose If TRUE, lots of information will be printed to monitor the the progress of thefitting. Default: TRUE.
estimand "ATE" (average treatment effect) or "ATT" (average treatment effect on the treated): the causal effect of interest. ATE estimates the change in the outcome if thetreatment were applied to the entire population versus if the control were ap-plied to the entire population. ATT estimates the analogous effect, averagingonly over the treated population. Default: "ATE".
stop.method A method or methods of measuring and summarizing balance across pretreat-ment variables. Current options are ks.mean, ks.max, es.mean, and es.max.ks refers to the Kolmogorov-Smirnov statistic and es refers to standardized ef-fect size. These are summarized across the pretreatment variables by either themaximum (.max) or the mean (.mean). Default: c("es.mean").
sampw Optional sampling weights.
version "gbm", "xgboost", or "legacy", indicating which version of the twang packageto use.
• "gbm" uses gradient boosting from the gbm package.• "xgboost" uses gradient boosting from the xgboost package.• "legacy" uses the prior implementation of the ps function.
Default: "gbm".
ks.exact NULL or a logical indicating whether the Kolmogorov-Smirnov p-value should bebased on an approximation of exact distribution from an unweighted two-sampleKolmogorov-Smirnov test. If NULL, the approximation based on the exact dis-tribution is computed if the product of the effective sample sizes is less than10,000. Otherwise, an approximation based on the asymptotic distribution isused. **Warning:** setting ks.exact = TRUE will add substantial computationtime for larger sample sizes. Default: NULL.
n.keep A numeric variable indicating the algorithm should only consider every n.keep-th iteration of the propensity score model and optimize balance over this setinstead of all iterations. Default: 1.
n.grid A numeric variable that sets the grid size for an initial search of the regionmost likely to minimize the stop.method. A value of n.grid=50 uses a 50point grid from 1:n.trees. It finds the minimum, say at grid point 35. It thenlooks for the actual minimum between grid points 34 and 36. If specified withn.keep>1, n.grid corresponds to a grid of points on the kept iterations as de-fined by n.keep. Default: 25.

mnps 25
treatATT If the estimand is specified to be ATT, this argument is used to specify whichtreatment condition is considered ’the treated’. It must be one of the levels ofthe treatment variable. It is ignored for ATE analyses.
... Additional arguments that are passed to ps function.
Details
For user more comfortable with the options of xgboost, the options for mnps controlling the be-havior of the gradient boosting algorithm can be specified using the xgboost naming scheme. Thisincludes nrounds, max_depth, eta, and subsample. In addition, the list of parameters passed toxgboost can be specified with params.
Note that unlike earlier versions of twang, the plotting functions are no longer included in the mnpsfunction. See plot for details of the plots.
Value
Returns an object of class mnps, which consists of the following.
• psList A list of ps objects with length equal to the number of time periods.
• nFits The number of ps objects (i.e., the number of distinct time points).
• estimand The specified estimand.
• treatATT For ATT fits, the treatment category that is considered "the treated".
• treatLev The levels of the treatment variable.
• levExceptTreatAtt The levels of the treatment variable, excluding the treatATT level.
• data The data used to fit the model.
• treatVar The vector of treatment indicators.
• stopMethods The stopping rules specified in the call to mnps.
• sampw Sampling weights provided to mnps, if any.
Author(s)
Lane Burgette ‘<[email protected]>‘, Beth Ann Griffin ‘<[email protected]>‘, Dan Mc- Caffrey‘<[email protected]>‘
References
Dan McCaffrey, G. Ridgeway, Andrew Morral (2004). "Propensity Score Estimation with BoostedRegression for Evaluating Adolescent Substance Abuse Treatment", *Psychological Methods* 9(4):403-425.
See Also
ps, gbm, xgboost, plot, bal.table

26 plot.iptw
plot.dxwts Plot dxwts
Description
Plot dxwts
Usage
## S3 method for class 'dxwts'plot(x, plots = "es", ...)
Arguments
x An dxwts object.
plots An indicator of which type of plot is desired. The options are
• "optimize" or 1 A plot of the balance criteria as a function of the GBMiteration.
• "boxplot" or 2 Boxplots of the propensity scores for the treatment and con-trol cases
• "es" or 3 Plots of the standardized effect size of the pre-treatment variablesbefore and after reweighing
• "t" or 4 Plots of the p-values from t-statistics comparing means of treatedand control subjects for pretreatment variables, before and after weighting.
• "ks" or 5 Plots of the p-values from Kolmogorov-Smirnov statistics compar-ing distributions of pretreatment variables of treated and control subjects,before and after weighting.
... Additional arguments.
plot.iptw Plots for iptw objects
Description
This function produces a collection of diagnostic plots for iptw objects.
Usage
## S3 method for class 'iptw'plot(x,plots = "optimize",subset = NULL,color = TRUE,

plot.iptw 27
timePeriods = NULL,multiPage = FALSE,figureRows = NULL,hline = c(0.1, 0.5, 0.8),...
)
Arguments
x An iptw object.
plots An indicator of which type of plot is desired. The options are
• "optimize" or 1 A plot of the balance criteria as a function of the GBMiteration.
• "boxplot" or 2 Boxplots of the propensity scores for the treatment and con-trol cases
• "es" or 3 Plots of the standardized effect size of the pre-treatment variablesbefore and after reweighing
• "t" or 4 Plots of the p-values from t-statistics comparing means of treatedand control subjects for pretreatment variables, before and after weighting.
• "ks" or 5 Plots of the p-values from Kolmogorov-Smirnov statistics compar-ing distributions of pretreatment variables of treated and control subjects,before and after weighting.
subset Used to restrict which of the stop.methods will be used in the figure. Forexample subset = c(1,3) would indicate that the first and third stop.methods(in alphabetical order of those specified in the original call to iptw) should beincluded in the figure.
color If color = FALSE, figures will be gray scale. Default: TRUE.
timePeriods The number of distinct time points. If NULL, this is assumed to be the number ofps objects (i.e., the number of distinct time points).
multiPage When multiple frames of a figure are produced, multiPage = TRUE will printeach frame on a different page. This is intended for situations where the graphi-cal output is being saved to a file. Default: FALSE.
figureRows The figure rows, passed to displayPlots. Default: NULL.
hline Arguments passed to panel.abline.
... Additional arguments.
Details
This function produces lattice-style graphics of diagnostic plots.
References
Dan McCaffrey, G. Ridgeway, Andrew Morral (2004). "Propensity Score Estimation with BoostedRegression for Evaluating Adolescent Substance Abuse Treatment", Psychological Methods 9(4):403-425.

28 plot.mniptw
See Also
iptw
plot.mniptw Plot mniptw
Description
Plot mniptw
Usage
## S3 method for class 'mniptw'plot(x,plots = "optimize",pairwiseMax = TRUE,figureRows = NULL,color = TRUE,subset = NULL,treatments = NULL,singlePlot = NULL,multiPage = FALSE,timePeriods = NULL,hline = c(0.1, 0.5, 0.8),...
)
Arguments
x An iptw object.
plots An indicator of which type of plot is desired. The options are
• "optimize" or 1 A plot of the balance criteria as a function of the GBMiteration.
• "boxplot" or 2 Boxplots of the propensity scores for the treatment and con-trol cases
• "es" or 3 Plots of the standardized effect size of the pre-treatment variablesbefore and after reweighing
• "t" or 4 Plots of the p-values from t-statistics comparing means of treatedand control subjects for pretreatment variables, before and after weighting.
• "ks" or 5 Plots of the p-values from Kolmogorov-Smirnov statistics compar-ing distributions of pretreatment variables of treated and control subjects,before and after weighting.
pairwiseMax If FALSE, the plots for the underlying ps fits will be returned. Otherwise, pair-wise maxima will be returned.

plot.mnps 29
figureRows The figure rows, passed to displayPlots. Default: NULL.color If color = FALSE, figures will be gray scale. Default: TRUE.subset Used to restrict which of the stop.methods will be used in the figure. For
example subset = c(1,3) would indicate that the first and third stop.methods(in alphabetical order of those specified in the original call to iptw) should beincluded in the figure.
treatments Only applicable when pairwiseMax is FALSE and plots 3, 4, and 5. If left atNULL, panels for all treatment pairs are created. If one level of the treatmentvariable is specified, plots comparing that treatment to all others are produced.If two levels are specified, a comparison for that single pair is produced.
singlePlot For Plot calls that produce multiple plots, specifying an integer value of singlePlotwill return only the corresponding plot. E.g., specifying singlePlot = 2 willreturn the second plot.
multiPage When multiple frames of a figure are produced, multiPage = TRUE will printeach frame on a different page. This is intended for situations where the graphi-cal output is being saved to a file. Default: FALSE.
timePeriods The number of distinct time points. If NULL, this is assumed to be the number ofps objects (i.e., the number of distinct time points).
hline Arguments passed to panel.abline.... Additional arguments.
plot.mnps Plots for mnps objects
Description
This function produces a collection of diagnostic plots for mnps objects.
Usage
## S3 method for class 'mnps'plot(x,plots = "optimize",pairwiseMax = TRUE,figureRows = NULL,color = TRUE,subset = NULL,treatments = NULL,singlePlot = NULL,multiPage = FALSE,time = NULL,print = TRUE,hline = c(0.1, 0.5, 0.8),...
)

30 plot.mnps
Arguments
x An mnps object.
plots An indicator of which type of plot is desired. The options are
• "optimize" or 1 A plot of the balance criteria as a function of the GBMiteration.
• "boxplot" or 2 Boxplots of the propensity scores for the treatment and con-trol cases
• "es" or 3 Plots of the standardized effect size of the pre-treatment variablesbefore and after reweighing
• "t" or 4 Plots of the p-values from t-statistics comparing means of treatedand control subjects for pretreatment variables, before and after weighting.
• "ks" or 5 Plots of the p-values from Kolmogorov-Smirnov statistics compar-ing distributions of pretreatment variables of treated and control subjects,before and after weighting.
pairwiseMax If FALSE, the plots for the underlying ps fits will be returned. Otherwise, pair-wise maxima will be returned.
figureRows The number of rows of figures that should be used. If left as NULL, twang triesto find a reasonable value.
color If color = FALSE, figures will be gray scale. Default: TRUE.
subset Used to restrict which of the stop.methods will be used in the figure. Forexample subset = c(1,3) would indicate that the first and third stop.methods(in alphabetical order of those specified in the original call to mnps) should beincluded in the figure.
treatments Only applicable when pairwiseMax is FALSE and plots 3, 4, and 5. If left atNULL, panels for all treatment pairs are created. If one level of the treatmentvariable is specified, plots comparing that treatment to all others are produced.If two levels are specified, a comparison for that single pair is produced.
singlePlot For Plot calls that produce multiple plots, specifying an integer value of singlePlotwill return only the corresponding plot. E.g., specifying singlePlot = 2 willreturn the second plot.
multiPage When multiple frames of a figure are produced, multiPage = TRUE will printeach frame on a different page. This is intended for situations where the graphi-cal output is being saved to a file.
time For use with iptw.
print If FALSE, the figure is returned but not printed. Default: TRUE.
hline Arguments passed to panel.abline.
... Additional arguments.
Details
This function produces lattice-style graphics of diagnostic plots.
plot.ps 31
References
Dan McCaffrey, G. Ridgeway, Andrew Morral (2004). "Propensity Score Estimation with BoostedRegression for Evaluating Adolescent Substance Abuse Treatment", Psychological Methods 9(4):403-425.
See Also
mnps
plot.ps Plots for ps objects
Description
This function produces a collection of diagnostic plots for ps objects.
Usage
## S3 method for class 'ps'plot(x, plots = "optimize", subset = NULL, color = TRUE, ...)
Arguments
x A ps object.
plots An indicator of which type of plot is desired. The options are
• "optimize" or 1 A plot of the balance criteria as a function of the GBMiteration.
• "boxplot" or 2 Boxplots of the propensity scores for the treatment and con-trol cases
• "es" or 3 Plots of the standardized effect size of the pre-treatment variablesbefore and after reweighing
• "t" or 4 Plots of the p-values from t-statistics comparing means of treatedand control subjects for pretreatment variables, before and after weighting.
• "ks" or 5 Plots of the p-values from Kolmogorov-Smirnov statistics compar-ing distributions of pretreatment variables of treated and control subjects,before and after weighting.
subset If multiple stop.method rules were used in the ps() call, subset restricts theplots of a subset of the stopping rules that were employed. This argument ex-pects a subset of the integers from 1 to k, if k stop.methods were used.
color If color = FALSE, figures will be gray scale. Default: TRUE.
... Additional arguments.
Details
This function produces lattice-style graphics of diagnostic plots.

32 print.iptw
References
Dan McCaffrey, G. Ridgeway, Andrew Morral (2004). "Propensity Score Estimation with BoostedRegression for Evaluating Adolescent Substance Abuse Treatment", Psychological Methods 9(4):403-425.
See Also
ps
print.dxwts Default print statement for dxwts class
Description
Default print statement for dxwts class
Usage
## S3 method for class 'dxwts'print(x, ...)
Arguments
x A dxwts object
... Additional arguments.
print.iptw Default print statement for iptw class
Description
Default print statement for iptw class
Usage
## S3 method for class 'iptw'print(x, ...)
Arguments
x A iptw object
... Additional arguments.

print.mniptw 33
print.mniptw Default print statement for mniptw class
Description
Default print statement for mniptw class
Usage
## S3 method for class 'mniptw'print(x, ...)
Arguments
x A mniptw object
... Additional arguments.
print.mnps Default print statement for mnps class
Description
Default print statement for mnps class
Usage
## S3 method for class 'mnps'print(x, ...)
Arguments
x A mnps object
... Additional arguments.

34 print.summary.iptw
print.ps Default print statement for ps class
Description
Default print statement for ps class
Usage
## S3 method for class 'ps'print(x, ...)
Arguments
x An ps object
... Additional arguments.
print.summary.iptw Produces a summary table for iptw object
Description
Produces a summary table for iptw object
Usage
## S3 method for class 'summary.iptw'print(x, ...)
Arguments
x An iptw object
... Additional arguments.

print.summary.mniptw 35
print.summary.mniptw Produces a summary table for mniptw object
Description
Produces a summary table for mniptw object
Usage
## S3 method for class 'summary.mniptw'print(x, ...)
Arguments
x An mniptw object
... Additional arguments.
print.summary.mnps Produces a summary table for mnps object
Description
Produces a summary table for mnps object
Usage
## S3 method for class 'summary.mnps'print(x, ...)
Arguments
x An mnps object
... Additional arguments.

36 ps
print.summary.ps Produces a summary table for ps object
Description
Produces a summary table for ps object
Usage
## S3 method for class 'summary.ps'print(x, ...)
Arguments
x An ps object
... Additional arguments.
ps Gradient boosted propensity score estimation
Description
ps calculates propensity scores using gradient boosted logistic regression and diagnoses the result-ing propensity scores using a variety of methods
Usage
ps(formula = formula(data),data,n.trees = 10000,interaction.depth = 3,shrinkage = 0.01,bag.fraction = 1,n.minobsinnode = 10,perm.test.iters = 0,print.level = 2,verbose = TRUE,estimand = "ATE",stop.method = c("ks.mean", "es.mean"),sampw = NULL,version = "gbm",ks.exact = NULL,n.keep = 1,n.grid = 25,

ps 37
keep.data = TRUE,...
)
Arguments
formula An object of class formula: a symbolic description of the propensity scoremodel to be fit with the treatment indicator on the left side of the formula andthe potential confounding variables on the right side.
data A dataset that includes the treatment indicator as well as the potential confound-ing variables.
n.trees Number of gbm iterations passed on to gbm. Default: 10000.interaction.depth
A positive integer denoting the tree depth used in gradient boosting. Default: 3.
shrinkage A numeric value between 0 and 1 denoting the learning rate. See gbm for moredetails. Default: 0.01.
bag.fraction A numeric value between 0 and 1 denoting the fraction of the observations ran-domly selected in each iteration of the gradient boosting algorithm to proposethe next tree. See gbm for more details. Default: 1.0.
n.minobsinnode An integer specifying the minimum number of observations in the terminalnodes of the trees used in the gradient boosting. See gbm for more details. De-fault: 10.
perm.test.iters
A non-negative integer giving the number of iterations of the permutation testfor the KS statistic. If perm.test.iters=0 then the function returns an analyticapproximation to the p-value. Setting perm.test.iters=200 will yield preci-sion to within 3% if the true p-value is 0.05. Use perm.test.iters=500 to bewithin 2%. Default: 0.
print.level The amount of detail to print to the screen. Default: 2.
verbose If TRUE, lots of information will be printed to monitor the the progress of thefitting. Default: TRUE.
estimand "ATE" (average treatment effect) or "ATT" (average treatment effect on the treated): the causal effect of interest. ATE estimates the change in the outcome if thetreatment were applied to the entire population versus if the control were ap-plied to the entire population. ATT estimates the analogous effect, averagingonly over the treated population. Default: "ATE".
stop.method A method or methods of measuring and summarizing balance across pretreat-ment variables. Current options are ks.mean, ks.max, es.mean, and es.max.ks refers to the Kolmogorov-Smirnov statistic and es refers to standardized ef-fect size. These are summarized across the pretreatment variables by either themaximum (.max) or the mean (.mean). Default: c("ks.mean","es.mean").
sampw Optional sampling weights.
version "gbm", "xgboost", or "legacy", indicating which version of the twang packageto use.
• "gbm" uses gradient boosting from the gbm package,

38 ps
• "xgboost" uses gradient boosting from the xgboost package, and• "legacy" uses the prior implementation of the ps function.
Default: "gbm".
ks.exact NULL or a logical indicating whether the Kolmogorov-Smirnov p-value should bebased on an approximation of exact distribution from an unweighted two-sampleKolmogorov-Smirnov test. If NULL, the approximation based on the exact dis-tribution is computed if the product of the effective sample sizes is less than10,000. Otherwise, an approximation based on the asymptotic distribution isused. **Warning:** setting ks.exact = TRUE will add substantial computationtime for larger sample sizes. Default: NULL.
n.keep A numeric variable indicating the algorithm should only consider every n.keep-th iteration of the propensity score model and optimize balance over this setinstead of all iterations. Default: 1.
n.grid A numeric variable that sets the grid size for an initial search of the regionmost likely to minimize the stop.method. A value of n.grid=50 uses a 50point grid from 1:n.trees. It finds the minimum, say at grid point 35. It thenlooks for the actual minimum between grid points 34 and 36. If specified withn.keep>1, n.grid corresponds to a grid of points on the kept iterations as de-fined by n.keep. Default: 25.
keep.data A logical variable indicating whether or not the data is saved in the resulting psobject. Default: TRUE.
... Additional arguments that are passed to ps function.
Details
For user more comfortable with the options of xgboost, the options for ps controlling the behav-ior of the gradient boosting algorithm can be specified using the xgboost naming scheme. Thisincludes nrounds, max_depth, eta, and subsample. In addition, the list of parameters passed toxgboost can be specified with params.
Note that unlike earlier versions of ‘twang‘, the plotting functions are no longer included in the psfunction. See plot for details of the plots.
Value
Returns an object of class ps, a list containing
• gbm.obj The returned gbm or xgboost object.
• treat The vector of treatment indicators.
• treat.var The treatment variable.
• desc A list containing balance tables for each method selected in stop.methods. Includes acomponent for the unweighted analysis names “unw”. Each desc component includes a listwith the following components
– ess The effective sample size of the control group.– n.treat The number of subjects in the treatment group.– n.ctrl The number of subjects in the control group.

ps 39
– max.es The largest effect size across the covariates.– mean.es The mean absolute effect size.– max.ks The largest KS statistic across the covariates.– mean.ks The average KS statistic across the covariates.– bal.tab a (potentially large) table summarizing the quality of the weights for equalizing
the distribution of features across the two groups. This table is best extracted using thebal.table method. See the help for bal.table for details on the table’s contents.
– n.trees The estimated optimal number of gradient boosted iterations to optimize the lossfunction for the associated stop.methods.
– ps a data frame containing the estimated propensity scores. Each column is associatedwith one of the methods selected in stop.methods.
– w a data frame containing the propensity score weights. Each column is associated withone of the methods selected in stop.methods. If sampling weights are given then theseare incorporated into these weights.
– estimand The estimand of interest (ATT or ATE).
• datestamp Records the date of the analysis.
• parameters Saves the ps call.
• alerts Text containing any warnings accumulated during the estimation.
• iters A sequence of iterations used in the GBM fits used by plot function.
• balance The balance measures for the pretreatment covariates used in plotting, with a columnfor each stop.method.
• balance.ks The KS balance measures for the pretreatment covariates used in plotting, with acolumn for each covariate.
• balance.es The standard differences for the pretreatment covariates used in plotting, with acolumn for each covariate.
• ks The KS balance measures for the pretreatment covariates on a finer grid, with a column foreach covariate.
• es The standard differences for the pretreatment covariates on a finer grid, with a column foreach covariate.
• n.trees Maximum number of trees considered in GBM fit.
• data Data as specified in the data argument.
References
Dan McCaffrey, G. Ridgeway, Andrew Morral (2004). "Propensity Score Estimation with BoostedRegression for Evaluating Adolescent Substance Abuse Treatment", *Psychological Methods* 9(4):403-425.
See Also
gbm, xgboost, plot, bal.table

40 raceprofiling
raceprofiling Traffic stop data
Description
Simulated example data for assessing race bias in traffic stop outcomes
Usage
data(raceprofiling)
Format
A data frame with 5000 observations on the following 10 variables.
id an ID for each traffic stop
nhood a factor indicating the neighborhood in which the stop occurred.
reason The reason for the stop, mechanical/registration violations, dangerous moving violation,non-dangerous moving violation
resident an indicator whether the driver is a resident of the city
age driver’s age
male an indicator whether the driver was male
race the race of the driver, with levels A, B, H, W
hour the hour of the stop (24-hour clock)
month and ordered factor indicating in which month the stop took place
citation an indicator of whether the driver received a citation
Source
This is simulated data to demonstrate how to use twang to adjust estimates of racial bias for impor-tant factors. This dataset does not represent real data from any real law enforcement agency.
References
G. Ridgeway (2006). “Assessing the effect of race bias in post-traffic stop outcomes using propen-sity scores,” Journal of Quantitative Criminology 22(1).
Examples
data(raceprofiling)
# the first five lines of the datasetraceprofiling[1:5,]

sensitivity 41
sensitivity Function to run sensitivity analysis described in Ridgeway’s paper;currently works only for ATT.
Description
Performs the sensitivity analyses described in Ridgeway (2006). This is a beta version of thisfunctionality. Please let the developers know if you have problems with it.
Usage
sensitivity(ps1, data, outcome, order.by.importance = TRUE, verbose = TRUE)
Arguments
ps1 A ‘ps‘ object.
data The dataset including the outcomes
outcome The outcome of interest.order.by.importance
Orders the output by relative importance of covariates.
verbose If ‘TRUE‘, extra information will be printed.
Value
Returns the following * ‘tx‘ Summary for treated observations. * ‘ctrl‘ Summary for control obser-vations.
References
Ridgeway, G. (2006). "The effect of race bias in post-traffic stop outcomes using propensity scores",*Journal of Quantitative Criminology* 22(1):1-29.
stop.methods Stop methods (e.g. "es.mean", "ks.mean", etc.) object, used only forbackward compatibility
Description
In older versions of twang, the ‘ps‘ function specified the ‘stop.method‘ in a different manner. This‘stop.methods‘ object is used to ensure backward compatibility; new twang users should not makeuse of it.
Usage
stop.methods

42 summary.iptw
Format
An object of class matrix (inherits from array) with 1 rows and 6 columns.
Details
This is merely a vector with the names of the stopping rules.
summary.iptw Summarize a iptw object
Description
Computes summary information about a stored iptw object
Usage
## S3 method for class 'iptw'summary(object, ...)
Arguments
object An iptw object.
... Additional arguments.
Details
Compresses the information in the desc component of the iptw object into a short summary tabledescribing the size of the dataset and the quality of the propensity score weights.
Value
See iptw for details on the returned table.
See Also
iptw

summary.mniptw 43
summary.mniptw Summarize a mniptw object
Description
Summarize a mniptw object
Usage
## S3 method for class 'mniptw'summary(object, ...)
Arguments
object A mniptw object.
... Additional arguments.
summary.mnps Summarize a mnps object
Description
Computes summary information about a stored mnps object
Usage
## S3 method for class 'mnps'summary(object, ...)
Arguments
object An mnps object.
... Additional arguments.
Details
Compresses the information in the desc component of the mnps object into a short summary tabledescribing the size of the dataset and the quality of the propensity score weights.
Value
See mnps for details on the returned table.
See Also
mnps

44 summary.ps
summary.ps Summarize a ps object
Description
Computes summary information about a stored ps object
Usage
## S3 method for class 'ps'summary(object, ...)
Arguments
object An ps object.
... Additional arguments.
Details
Compresses the information in the desc component of the ps object into a short summary tabledescribing the size of the dataset and the quality of the propensity score weights.
Value
See ps for details on the returned table.
See Also
ps

Index
∗ datasetsAOD, 3egsingle, 12iptwExLong, 18iptwExWide, 18lalonde, 19lindner, 20mnIptwExLong, 21mnIptwExWide, 22raceprofiling, 40stop.methods, 41
∗ modelsdesc.wts, 9ps, 36summary.iptw, 42summary.mnps, 43summary.ps, 44
∗ multivariatebal.stat, 3boxplot.mnps, 6boxplot.ps, 8ps, 36
∗ propensitytwang-package, 2
∗ scoretwang-package, 2
AOD, 3
bal.stat, 3, 10bal.table, 5, 17, 25, 39boxplot.mnps, 6boxplot.ps, 8
desc.wts, 9displayPlots, 10, 27, 29dx.wts, 5, 6, 11
egsingle, 12
formula, 37
gbm, 16, 17, 23–25, 37–39get.weights, 13get.weights.num, 14get.weights.unstab, 14
iptw, 15, 28, 42iptwExLong, 18iptwExWide, 18
lalonde, 19lindner, 20
means.table, 21mnIptwExLong, 21mnIptwExWide, 22mnps, 5, 13, 17, 23, 31, 43
plot, 17, 25, 38, 39plot.dxwts, 26plot.iptw, 26plot.mniptw, 28plot.mnps, 29plot.ps, 31print.dxwts, 32print.iptw, 32print.mniptw, 33print.mnps, 33print.ps, 34print.summary.iptw, 34print.summary.mniptw, 35print.summary.mnps, 35print.summary.ps, 36ps, 5, 6, 10–13, 16, 17, 24, 25, 32, 36, 44
raceprofiling, 40
sensitivity, 41stop.methods, 41summary.iptw, 42summary.mniptw, 43summary.mnps, 43
45

46 INDEX
summary.ps, 44
twang (twang-package), 2twang-package, 2
xgboost, 16, 17, 24, 25, 38, 39