Embed Size (px)
DESCRIPTION
bvbbbbbbbbbbbbbbbm
Citation preview
Please refer to the disclaimer towards the end of the document.
Institutional Equities
1QF
Y16
Res
ult U
pdat
e
Reuters: TVSM.BO; Bloomberg: TVSL IN
TVS Motor Company
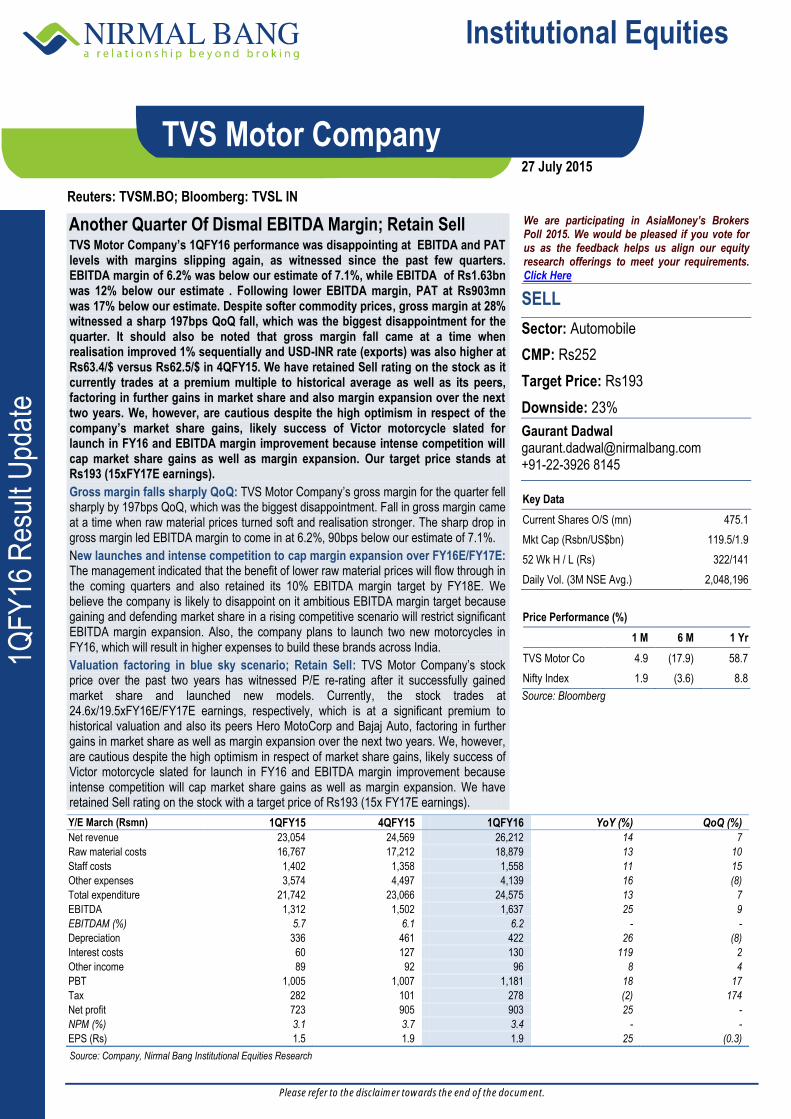
Another Quarter Of Dismal EBITDA Margin; Retain Sell TVS Motor Company’s 1QFY16 performance was disappointing at EBITDA and PAT levels with margins slipping again, as witnessed since the past few quarters. EBITDA margin of 6.2% was below our estimate of 7.1%, while EBITDA of Rs1.63bn was 12% below our estimate . Following lower EBITDA margin, PAT at Rs903mn was 17% below our estimate. Despite softer commodity prices, gross margin at 28% witnessed a sharp 197bps QoQ fall, which was the biggest disappointment for the quarter. It should also be noted that gross margin fall came at a time when realisation improved 1% sequentially and USD-INR rate (exports) was also higher at Rs63.4/$ versus Rs62.5/$ in 4QFY15. We have retained Sell rating on the stock as it currently trades at a premium multiple to historical average as well as its peers, factoring in further gains in market share and also margin expansion over the next two years. We, however, are cautious despite the high optimism in respect of the company’s market share gains, likely success of Victor motorcycle slated for launch in FY16 and EBITDA margin improvement because intense competition will cap market share gains as well as margin expansion. Our target price stands at Rs193 (15xFY17E earnings).
Gross margin falls sharply QoQ: TVS Motor Company’s gross margin for the quarter fell sharply by 197bps QoQ, which was the biggest disappointment. Fall in gross margin came at a time when raw material prices turned soft and realisation stronger. The sharp drop in gross margin led EBITDA margin to come in at 6.2%, 90bps below our estimate of 7.1%.
New launches and intense competition to cap margin expansion over FY16E/FY17E: The management indicated that the benefit of lower raw material prices will flow through in the coming quarters and also retained its 10% EBITDA margin target by FY18E. We believe the company is likely to disappoint on it ambitious EBITDA margin target because gaining and defending market share in a rising competitive scenario will restrict significant EBITDA margin expansion. Also, the company plans to launch two new motorcycles in FY16, which will result in higher expenses to build these brands across India.
Valuation factoring in blue sky scenario; Retain Sell: TVS Motor Company’s stock price over the past two years has witnessed P/E re-rating after it successfully gained market share and launched new models. Currently, the stock trades at 24.6x/19.5xFY16E/FY17E earnings, respectively, which is at a significant premium to historical valuation and also its peers Hero MotoCorp and Bajaj Auto, factoring in further gains in market share as well as margin expansion over the next two years. We, however, are cautious despite the high optimism in respect of market share gains, likely success of Victor motorcycle slated for launch in FY16 and EBITDA margin improvement because intense competition will cap market share gains as well as margin expansion. We have retained Sell rating on the stock with a target price of Rs193 (15x FY17E earnings).
We are participating in AsiaMoney’s Brokers Poll 2015. We would be pleased if you vote for us as the feedback helps us align our equity research offerings to meet your requirements. Click Here
SELL
Sector: Automobile
CMP: Rs252
Target Price: Rs193
Downside: 23%
Gaurant Dadwal [email protected] +91-22-3926 8145
Key Data
Current Shares O/S (mn) 475.1
Mkt Cap (Rsbn/US$bn) 119.5/1.9
52 Wk H / L (Rs) 322/141
Daily Vol. (3M NSE Avg.) 2,048,196
Price Performance (%)
1 M 6 M 1 Yr
TVS Motor Co 4.9 (17.9) 58.7
Nifty Index 1.9 (3.6) 8.8
Source: Bloomberg
Y/E March (Rsmn) 1QFY15 4QFY15 1QFY16 YoY (%) QoQ (%)
Net revenue 23,054 24,569 26,212 14 7
Raw material costs 16,767 17,212 18,879 13 10
Staff costs 1,402 1,358 1,558 11 15
Other expenses 3,574 4,497 4,139 16 (8)
Total expenditure 21,742 23,066 24,575 13 7
EBITDA 1,312 1,502 1,637 25 9
EBITDAM (%) 5.7 6.1 6.2 - -
Depreciation 336 461 422 26 (8)
Interest costs 60 127 130 119 2
Other income 89 92 96 8 4
PBT 1,005 1,007 1,181 18 17
Tax 282 101 278 (2) 174
Net profit 723 905 903 25 -
NPM (%) 3.1 3.7 3.4 - -
EPS (Rs) 1.5 1.9 1.9 25 (0.3)
Source: Company, Nirmal Bang Institutional Equities Research
27 July 2015
Institutional Equities
2 TVS Motor Company
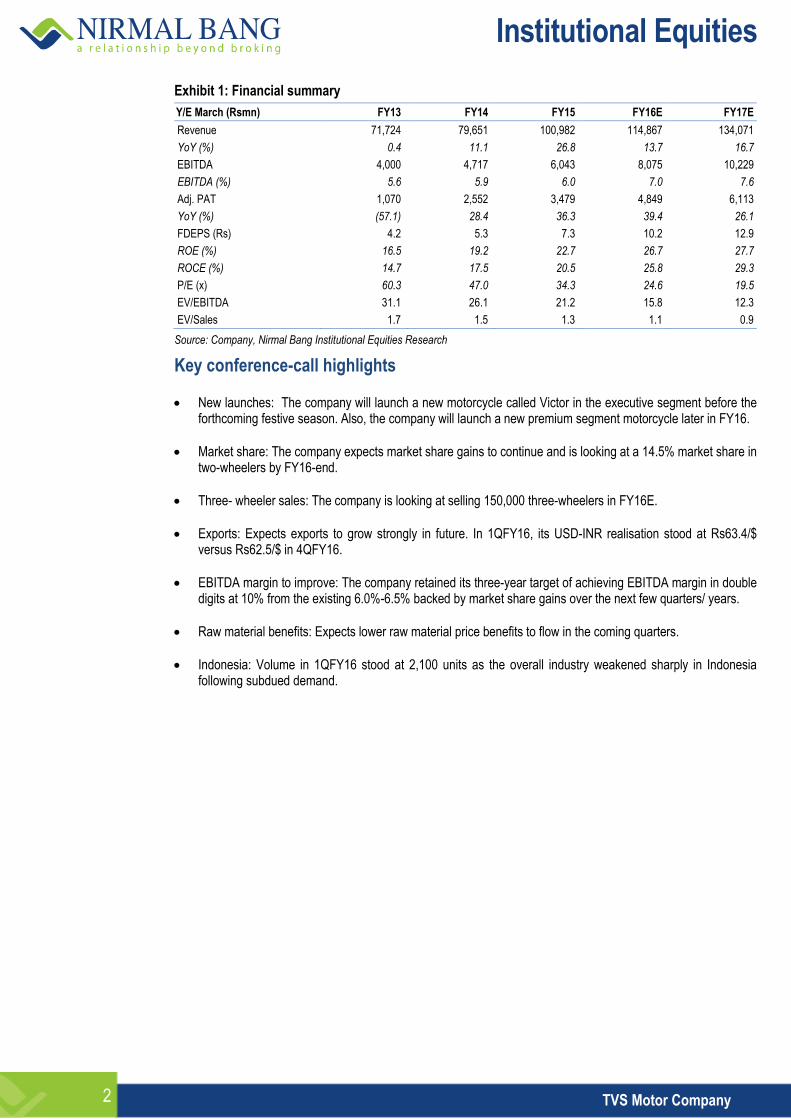
Exhibit 1: Financial summary
Y/E March (Rsmn) FY13 FY14 FY15 FY16E FY17E
Revenue 71,724 79,651 100,982 114,867 134,071
YoY (%) 0.4 11.1 26.8 13.7 16.7
EBITDA 4,000 4,717 6,043 8,075 10,229
EBITDA (%) 5.6 5.9 6.0 7.0 7.6
Adj. PAT 1,070 2,552 3,479 4,849 6,113
YoY (%) (57.1) 28.4 36.3 39.4 26.1
FDEPS (Rs) 4.2 5.3 7.3 10.2 12.9
ROE (%) 16.5 19.2 22.7 26.7 27.7
ROCE (%) 14.7 17.5 20.5 25.8 29.3
P/E (x) 60.3 47.0 34.3 24.6 19.5
EV/EBITDA 31.1 26.1 21.2 15.8 12.3
EV/Sales 1.7 1.5 1.3 1.1 0.9
Source: Company, Nirmal Bang Institutional Equities Research
Key conference-call highlights
New launches: The company will launch a new motorcycle called Victor in the executive segment before the forthcoming festive season. Also, the company will launch a new premium segment motorcycle later in FY16.
Market share: The company expects market share gains to continue and is looking at a 14.5% market share in two-wheelers by FY16-end.
Three- wheeler sales: The company is looking at selling 150,000 three-wheelers in FY16E.
Exports: Expects exports to grow strongly in future. In 1QFY16, its USD-INR realisation stood at Rs63.4/$ versus Rs62.5/$ in 4QFY16.
EBITDA margin to improve: The company retained its three-year target of achieving EBITDA margin in double digits at 10% from the existing 6.0%-6.5% backed by market share gains over the next few quarters/ years.
Raw material benefits: Expects lower raw material price benefits to flow in the coming quarters.
Indonesia: Volume in 1QFY16 stood at 2,100 units as the overall industry weakened sharply in Indonesia following subdued demand.
Institutional Equities
3 TVS Motor Company
Financials
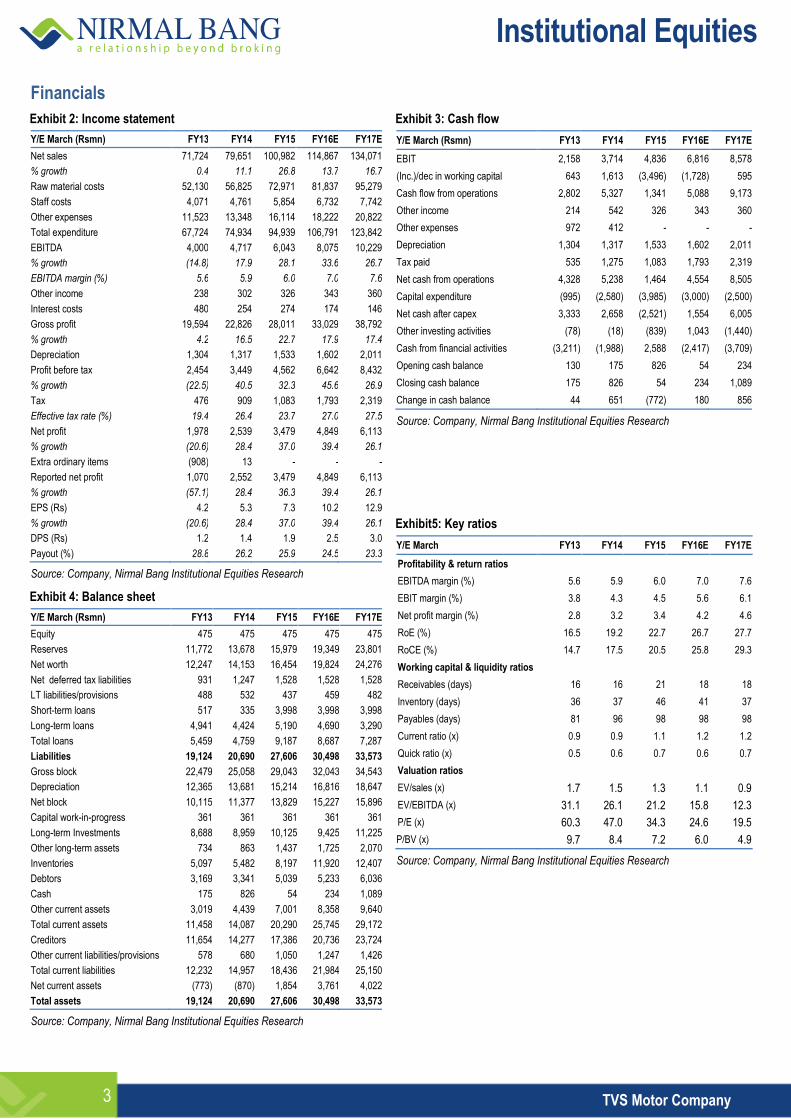
Exhibit 2: Income statement
Y/E March (Rsmn) FY13 FY14 FY15 FY16E FY17E
Net sales 71,724 79,651 100,982 114,867 134,071
% growth 0.4 11.1 26.8 13.7 16.7
Raw material costs 52,130 56,825 72,971 81,837 95,279
Staff costs 4,071 4,761 5,854 6,732 7,742
Other expenses 11,523 13,348 16,114 18,222 20,822
Total expenditure 67,724 74,934 94,939 106,791 123,842
EBITDA 4,000 4,717 6,043 8,075 10,229
% growth (14.8) 17.9 28.1 33.6 26.7
EBITDA margin (%) 5.6 5.9 6.0 7.0 7.6
Other income 238 302 326 343 360
Interest costs 480 254 274 174 146
Gross profit 19,594 22,826 28,011 33,029 38,792
% growth 4.2 16.5 22.7 17.9 17.4
Depreciation 1,304 1,317 1,533 1,602 2,011
Profit before tax 2,454 3,449 4,562 6,642 8,432
% growth (22.5) 40.5 32.3 45.6 26.9
Tax 476 909 1,083 1,793 2,319
Effective tax rate (%) 19.4 26.4 23.7 27.0 27.5
Net profit 1,978 2,539 3,479 4,849 6,113
% growth (20.6) 28.4 37.0 39.4 26.1
Extra ordinary items (908) 13 - - -
Reported net profit 1,070 2,552 3,479 4,849 6,113
% growth (57.1) 28.4 36.3 39.4 26.1
EPS (Rs) 4.2 5.3 7.3 10.2 12.9
% growth (20.6) 28.4 37.0 39.4 26.1
DPS (Rs) 1.2 1.4 1.9 2.5 3.0
Payout (%) 28.8 26.2 25.9 24.5 23.3
Source: Company, Nirmal Bang Institutional Equities Research
Exhibit 4: Balance sheet
Y/E March (Rsmn) FY13 FY14 FY15 FY16E FY17E
Equity 475 475 475 475 475
Reserves 11,772 13,678 15,979 19,349 23,801
Net worth 12,247 14,153 16,454 19,824 24,276
Net deferred tax liabilities 931 1,247 1,528 1,528 1,528
LT liabilities/provisions 488 532 437 459 482
Short-term loans 517 335 3,998 3,998 3,998
Long-term loans 4,941 4,424 5,190 4,690 3,290
Total loans 5,459 4,759 9,187 8,687 7,287
Liabilities 19,124 20,690 27,606 30,498 33,573
Gross block 22,479 25,058 29,043 32,043 34,543
Depreciation 12,365 13,681 15,214 16,816 18,647
Net block 10,115 11,377 13,829 15,227 15,896
Capital work-in-progress 361 361 361 361 361
Long-term Investments 8,688 8,959 10,125 9,425 11,225
Other long-term assets 734 863 1,437 1,725 2,070
Inventories 5,097 5,482 8,197 11,920 12,407
Debtors 3,169 3,341 5,039 5,233 6,036
Cash 175 826 54 234 1,089
Other current assets 3,019 4,439 7,001 8,358 9,640
Total current assets 11,458 14,087 20,290 25,745 29,172
Creditors 11,654 14,277 17,386 20,736 23,724
Other current liabilities/provisions 578 680 1,050 1,247 1,426
Total current liabilities 12,232 14,957 18,436 21,984 25,150
Net current assets (773) (870) 1,854 3,761 4,022
Total assets 19,124 20,690 27,606 30,498 33,573
Source: Company, Nirmal Bang Institutional Equities Research
Exhibit 3: Cash flow
Y/E March (Rsmn) FY13 FY14 FY15 FY16E FY17E
EBIT 2,158 3,714 4,836 6,816 8,578
(Inc.)/dec in working capital 643 1,613 (3,496) (1,728) 595
Cash flow from operations 2,802 5,327 1,341 5,088 9,173
Other income 214 542 326 343 360
Other expenses 972 412 - - -
Depreciation 1,304 1,317 1,533 1,602 2,011
Tax paid 535 1,275 1,083 1,793 2,319
Net cash from operations 4,328 5,238 1,464 4,554 8,505
Capital expenditure (995) (2,580) (3,985) (3,000) (2,500)
Net cash after capex 3,333 2,658 (2,521) 1,554 6,005
Other investing activities (78) (18) (839) 1,043 (1,440)
Cash from financial activities (3,211) (1,988) 2,588 (2,417) (3,709)
Opening cash balance 130 175 826 54 234
Closing cash balance 175 826 54 234 1,089
Change in cash balance 44 651 (772) 180 856
Source: Company, Nirmal Bang Institutional Equities Research
Exhibit5: Key ratios
Y/E March FY13 FY14 FY15 FY16E FY17E
Profitability & return ratios
EBITDA margin (%) 5.6 5.9 6.0 7.0 7.6
EBIT margin (%) 3.8 4.3 4.5 5.6 6.1
Net profit margin (%) 2.8 3.2 3.4 4.2 4.6
RoE (%) 16.5 19.2 22.7 26.7 27.7
RoCE (%) 14.7 17.5 20.5 25.8 29.3
Working capital & liquidity ratios
Receivables (days) 16 16 21 18 18
Inventory (days) 36 37 46 41 37
Payables (days) 81 96 98 98 98
Current ratio (x) 0.9 0.9 1.1 1.2 1.2
Quick ratio (x) 0.5 0.6 0.7 0.6 0.7
Valuation ratios
EV/sales (x) 1.7 1.5 1.3 1.1 0.9
EV/EBITDA (x) 31.1 26.1 21.2 15.8 12.3
P/E (x) 60.3 47.0 34.3 24.6 19.5
P/BV (x) 9.7 8.4 7.2 6.0 4.9
Source: Company, Nirmal Bang Institutional Equities Research
Institutional Equities
4 TVS Motor Company
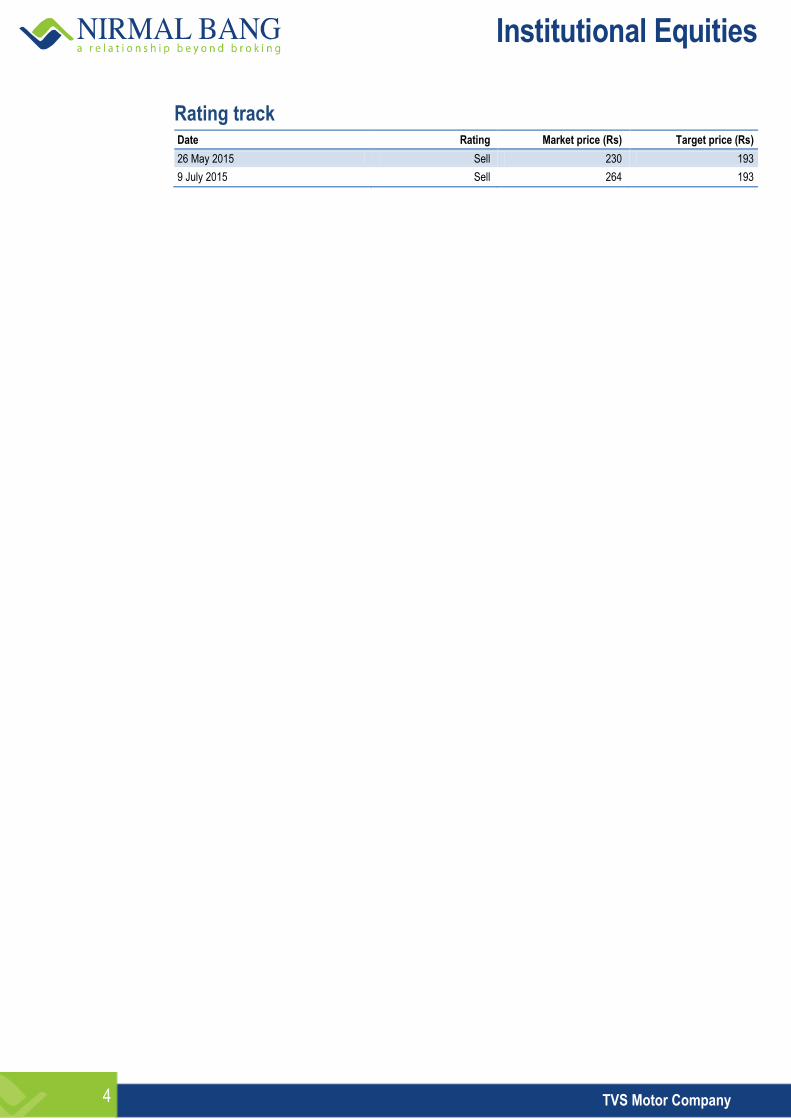
Rating track Date Rating Market price (Rs) Target price (Rs)
26 May 2015 Sell 230 193
9 July 2015 Sell 264 193
Institutional Equities
5 TVS Motor Company
Disclaimer
Stock Ratings Absolute Returns
BUY > 15%
ACCUMULATE -5% to15%
SELL < -5%
This report is published by Nirmal Bang’s Institutional Equities Research desk. Nirmal Bang has other business units with independent research teams separated by Chinese walls, and therefore may, at times, have different or contrary views on stocks and markets. This report is for the personal information of the authorised recipient and is not for public distribution. This should not be reproduced or redistributed to any other person or in any form. This report is for the general information for the clients of Nirmal Bang Equities Pvt. Ltd., a division of Nirmal Bang, and should not be construed as an offer or solicitation of an offer to buy/sell any securities.
We have exercised due diligence in checking the correctness and authenticity of the information contained herein, so far as it relates to current and historical information, but do not guarantee its accuracy or completeness. The opinions expressed are our current opinions as of the date appearing in the material and may be subject to change from time to time without notice.
Nirmal Bang or any persons connected with it do not accept any liability arising from the use of this document or the information contained therein. The recipients of this material should rely on their own judgment and take their own professional advice before acting on this information. Nirmal Bang or any of its connected persons including its directors or subsidiaries or associates or employees or agents shall not be in any way responsible for any loss or damage that may arise to any person/s from any inadvertent error in the information contained, views and opinions expressed in this publication.
Nirmal Bang Equities Private Limited (hereinafter referred to as “NBEPL”) is a registered Member of National Stock Exchange of India Limited, Bombay Stock Exchange Limited. NBEPL is in the process of making an application with SEBI for registering as a Research Entity in terms of SEBI (Research Analyst) Regulations, 2014.
NBEPL or its associates including its relatives/analyst do not hold any financial interest/beneficial ownership of more than 1% in the company covered by Analyst.
NBEPL or its associates/analyst has not received any compensation from the company covered by Analyst during the past twelve months. NBEPL /analyst has not served as an officer, director or employee of company covered by Analyst and has not been engaged in market-making activity of the company covered by Analyst.
The views expressed are based solely on information available publicly and believed to be true. Investors are advised to independently evaluate the market conditions/risks involved before making any investment decision.
Access all our reports on Bloomberg, Thomson Reuters and Factset.
Team Details:
Name Email Id Direct Line
Rahul Arora CEO [email protected] -
Girish Pai Head of Research [email protected] +91 22 3926 8017 / 18
Dealing
Ravi Jagtiani Dealing Desk [email protected] +91 22 3926 8230, +91 22 6636 8833
Pradeep Kasat Dealing Desk [email protected] +91 22 3926 8100/8101, +91 22 6636 8831
Michael Pillai Dealing Desk [email protected] +91 22 3926 8102/8103, +91 22 6636 8830
Umesh Bharadia Dealing Desk [email protected] +91-22-39268226
Nirmal Bang Equities Pvt. Ltd.
Correspondence Address
B-2, 301/302, Marathon Innova,
Nr. Peninsula Corporate Park,
Lower Parel (W), Mumbai-400013.
Board No. : 91 22 3926 8000/1; Fax. : 022 3926 8010