Embed Size (px)
Citation preview
Tutoring in (Online) Higher Education:Experimental Evidence*
David Hardt†, Markus Nagler‡, Johannes Rincke§
January 13, 2022
Abstract
Demand for personalized online tutoring in higher education is growing but there
is little research on its effectiveness. We conducted an RCT offering remote peer
tutoring in micro- and macroeconomics at a German university teaching online
due to the Covid-pandemic. Treated students met in small groups, in alternating
weeks with and without a more senior student tutor. The treatment improved
study behavior and increased contact to other students. Tutored students achieved
around 30% more credits and a one grade level better GPA across treated subjects.
Our findings suggest that the program reduced outcome inequality. We find no
impacts on mental health.
*This field experiment was pre-registered at the AEA Social Science Registry under the ID 7686 andgot IRB approval at the university where the experiment took place. We thank seminar participants atthe University of Innsbruck as well as conference participants the Berlin Network for Labor MarketResearch Workshop at DIW for helpful comments. We are grateful to Veronika Grimm, Christian Merkl,and Claus Schnabel for their support of this project. We thank Jens Gemmel for excellent researchassistance. We thank Paolo Bontempo, Jonas Hupp, Laura Klebl, Lukas Kleinlein, Bastian Lerzer,Martin Loffler, Yordan Medarov, Anna-Sophie Nicklas, Annina Pohl, Tobias Reiser, Alexandra Stahl,Jonas Urbanik, Theresa Weist, Ann-Sophie Wilker, and Anna Zinner for their excellent work as studenttutors. Nagler gratefully acknowledges funding by the Joachim Herz Foundation through an Add-OnFellowship.
†University of Erlangen-Nuremberg; [email protected]‡University of Erlangen-Nuremberg, CESifo, and LASER; [email protected]§Corresponding author; University of Erlangen-Nuremberg and CESifo; [email protected]
1

1 Introduction
A large share of university students never obtain a degree, and those who do oftentake much longer than the program design would suggest.1 This issue in highereducation is at risk of worsening with more students studying virtually since theliterature has largely found online teaching to be less effective than classroom-basedteaching (e.g., Figlio et al., 2013; Bettinger et al., 2017). In the recent pandemic, manystudents struggled to study successfully due to the shift to online teaching (Aucejoet al., 2020; Bird et al., 2020; Kofoed et al., 2021). Students’ mental health may also beaffected by a lack of interactions when studying online, as suggested by evidence ofworse student mental health during the Covid pandemic (e.g., Lai et al., 2020; Sonet al., 2020; Browning et al., 2021; Logel et al., 2021).2 Since three in ten Americansstate that they would prefer an online-only learning option even in the absence of theCovid threat (Strada Education Network, 2020), it is important to understand how toimprove online learning.
Personalized remote tutoring is a promising way to tackle central problemsin (online) higher education and improve student outcomes. In-person tutoringinterventions have been shown to be effective across differing settings and for a widevariety of students (Fryer, 2017; de Ree et al., 2021). The experimental literature ontutoring has so far primarily focused on PreK-12 interventions, finding increases inlearning outcomes of around 0.37SD on average, a large effect in comparison to othereducation interventions (Nickow et al., 2020). This remarkable success of tutoring is incontrast to mentoring interventions that have at best shown small improvements inaverage student performance or improvements only for subgroups of students (e.g.,Angrist et al., 2009; Oreopoulos and Petronijevic, 2019).
To date, little is known about whether tutoring is effective in higher educationsettings. This is why peer tutoring has not been labeled a high-impact practice by theAssociation of American Colleges and Universities (Kuh, 2008).3 However, tutoring isone element of highly successful student support programs such as the City Universityof New York’s Accelerated Study in Associate Programs (ASAP, see Scrivener et al.,2015; Sommo et al., 2018; Weiss et al., 2019). Remote tutoring is also a large and
1For instance, data from the National Center for Education Statistics show that in the United States,less than 40 percent of a cohort entering four-year institutions obtain a bachelor’s degree within fouryears (Weiss et al., 2019). See also, e.g., https://nces.ed.gov/programs/digest/d13/tables/dt13_326.10.asp, last accessed November 17, 2021.
2Among the primary correlates of worse mental health of students during the pandemic areloneliness or studying in isolation (e.g., Elmer et al., 2020; Jaeger et al., 2021; Logel et al., 2021).
3See also “As Students Dispersed, Tutoring Services Adapted” on InsideHigher Ed on March 16, 2021, https://www.insidehighered.com/news/2021/03/16/
face-face-peer-tutoring-decimated-pandemic-universities-turn-new-tools-times-and,last accessed November 4, 2021.
2
growing market served by private sector firms. Market analysts estimated the globalmarket size for online tutoring at around USD 150bn in 2020 and it is projected toreach about 280bn by 2026 (Valuates Reports, 2021).4
In this paper, we report results of a randomized trial designed to test whethersmall-group remote peer tutoring affects student outcomes in (online) higher education.Our sample comprises second term students from the core undergraduate programat a large Germany university’s School of Business, Economics, and Society. Each fall,students enroll in the three-year bachelor’s program Economics and Business Studies. Ineach of the first two semesters, students are to pass six courses each worth five credits.Since the second term includes more rigorous courses relative to the first semester,many students struggle in this term.5
Our program provided personalized remote tutoring in two economics courses.The program featured small groups of two or three students. These small groups metevery week via Zoom, in alternating weeks with and without a more senior studenttutor. In these meetings, students discussed problems in micro- and macroeconomicstaken from problem sets and past exams that were available to all students. As tutors,we hired students from a more advanced term in the same study program. Thus, thiskind of tutoring could be scaled up easily and at modest cost. For instance, includingone additional student into the program for a three-month period would cost aboute60.
Our results show that the tutoring intervention was highly effective in improvinglearning outcomes. First, relative to the control group, treated students are more likelyto report having studied throughout the term and report being more in contact withother students. Second, treated students earn 30% more credits and obtain a GPAacross both tutoring subjects that is better relative to control group students by aroundone grade level. Studying the students’ performance in both tutoring courses’ writtenexams, we find that treated students perform about 30% of a standard deviation betterthan students in the control group. This is of comparable magnitude than the impactsof tutoring in K-12 education (Nickow et al., 2020). Third, the largest improvements inacademic performance occur among students who previously did not perform well.As a result, the program reduced the inequality of academic outcomes among students.Fourth, because of the induced small-group peer interactions, we also hypothesizedthat the tutoring intervention would improve students’ mental health, especially inlight of the pandemic setting. However, we find no impacts on any survey outcomerelated to mental health.
4On private K-12 tutoring markets, see Kim et al. (2021).5Administrative data from the year 2018/19 shows that even in regular times, many students
underperform relative to the suggested curriculum: after the first semester, only 59 percent of enrolledstudents have completed courses worth at least 30 credits.
3

This paper contributes to several literature strands. First, we add to research onthe effectiveness of online higher education. Most of this literature has found onlineteaching to be somewhat less effective than classroom-based teaching (Figlio et al.,2013; Bettinger et al., 2017). A driver of this lower effectiveness seems that studentshave problems of disorganization when taught online, a culprit that could be welladdressed by personalized tutoring (e.g. Banerjee and Duflo, 2014).6 Delivery-sidefrictions such as lack of experience in online teaching may however also be important(e.g., Orlov et al., 2021). There is substantially less research on interventions aimingat improving student outcomes within an online environment.7 Our results showthat remote tutoring in small groups substantially raises student outcomes in suchan environment. Thus, remote tutoring may prove an effective and efficient way topersonalize and improve online education.
Second, we also contribute to the experimental literature on tutoring interventions.Tutoring has been shown to be highly effective in PreK-12 education (Fryer, 2017;de Ree et al., 2021). In a recent review, Nickow et al. (2020) report that tutoringincreases learning outcomes by around 0.37SD on average, a large effect in comparisonto other education interventions. There is much less evidence on the effectivenessof tutoring in higher education, and the available evidence does not provide a clearpicture of the effectiveness of such interventions (see, e.g., Parkinson, 2009; Munleyet al., 2010; Paloyo et al., 2016; Pugatch and Wilson, 2018, 2020; Gordanier et al., 2019).However, tutoring is an important part of CUNY’s ASAP program that seems highlyeffective (Scrivener et al., 2015; Sommo et al., 2018; Weiss et al., 2019). We contribute tothis literature by providing the first estimates of the effect of a pure tutoring programon student outcomes. We show that remote small-group peer tutoring is similarlyeffective in higher than in PreK-12 education.
Finally, we contribute to emerging research on effective education policies duringthe Covid pandemic. Most papers in this literature have focused on primary orsecondary education (e.g., Angrist et al., 2021; Bacher-Hicks et al., 2020; Greweniget al., 2021). The closest paper is Carlana and La Ferrara (2021), who experimentallyassigned Italian middle school students an online tutor during the pandemic andreport positive effects on performance and well-being. The magnitude of their resultsis comparable to the magnitude we find in the subjects covered by the program. Thereis only little research on higher education interventions during the pandemic, despiteworse student outcomes in higher education (Bird et al., 2020; Altindag et al., 2021;Kofoed et al., 2021; Rodriguez-Planas, 2020, 2022). In an earlier paper, we show that
6In line with the hypothesis that disorganization drives lower effectiveness, Patterson (2018)experimentally studies commitment devices, alerts, and distraction blocking tools in a MOOC and findspositive effects for treated students.
7Lavecchia et al. (2016) provide a recent review of behavioral interventions in (higher) education.
4

mentoring focused on student self-organization improves student motivation, butonly raises student achievement among already well-performing students (Hardtet al., 2020). We thus contribute by studying the effectiveness of remote tutoringin (online) higher education during the pandemic. While the pandemic is a specialsituation for many students (Jaeger et al., 2021), we are convinced that the sizable andplausible effects of our intervention carry lessons for improving higher education afteruniversities have fully returned to regular, in-person teaching.
2 Experimental Setting and Design
2.1 Experimental Setting
Our setting is typical of public universities during the pandemic. The undergraduateprogram Economics and Business Studies at the intervention university requires studentsto collect 180 credits to graduate, which is expected after three years. The study planassigns courses worth 30 credits to each semester which corresponds to six courseseach worth five credits. Administrative data show that large shares of students donot complete 30 credits per semester, delaying their graduation. The salient studyplan and target of achieving 30 credits per term, the fact that most students typicallyregister for exams worth these credits, and data from prior terms that suggest thatstudents do not seem to study as much as intended suggests that many students haveproblems in self-organizing and/or studying efficiently.
Due to the Covid pandemic, in the summer term 2021 all courses of the Schoolof Business, Economics, and Society were conducted in online format. To this end,the university acquired licenses of Zoom (already before the summer term 2020), anonline video conference tool used widely in academic settings during this pandemicto digitize classes and seminars and to provide remote education. While the exactimplementation of online teaching differs by subject and instructor, this should makethe setting similar to the setting of other academic institutions around the globe duringthis pandemic. The exams were taken in person at the city’s trade fair sites.
We leveraged the shift to online teaching induced by the pandemic to assess theeffectiveness of remote tutoring programs. One may worry that this pandemic situationwas very different from other online education settings (Jaeger et al., 2021). Whilethis is certainly true, our intervention took place over one year after the beginningof the pandemic. Thus, instructors already had some experience teaching virtuallyvia Zoom since this was the third term in which the university did so (Orlov et al.,2021; Altindag et al., 2021). Also, formal lockdowns ended in early May 2021, shortly
5

after the onset of the intervention. Thus, the situation was more normal and muchimproved relative to the early phases of the pandemic.
We overall believe that our results carry implications for the time in whichuniversities return to in-person teaching. First, we do not observe strong impacts onsome survey questions that should capture pandemic effects. Most importantly, treatedstudents’ self-assessed mental health is no different than control students’, irrespectiveof which measure we analyze. Second, the magnitude of our effects is comparable totutoring interventions in other settings in primary and secondary education that tookplace in person (Nickow et al., 2020).
2.2 The Tutoring Program
In the first week of the semester, students were informed via e-mail about the launchof a new small-group tutoring program in micro- and macroeconomics designedspecifically for students in the second semester of the study program. Studentswere informed that the program had a capacity constraint and that places wouldbe allocated randomly. They were invited to express their interest in the programthrough a webpage. The page asked for the students’ consent to use their personaland administrative information for research purposes in anonymized form and fortheir consent to pass along their name and e-mail address to tutors. We sent remindere-mails to students who did not visit the registration webpage within two days. Afterclosing the registration, we randomly assigned all students who had expressed theirinterest in the program to either a treatment or control group. The number of studentsassigned to treatment was determined by the program’s capacity. Students assigned tothe treatment group were invited via e-mail to participate in the tutoring program andreceived further program-related information. Students in the treatment group werethen randomly assigned to tutoring groups of either two or three students. Studentsassigned to the control group were informed via e-mail that they could not participatein the program.
The tutoring program focused on advancing students’ knowledge of microeconomicsand macroeconomics, two compulsory courses in the second term of their studyprogram, and on inducing peer-to-peer interaction. Students in the treatment groupwere instructed to meet with their tutoring group every two weeks. During thosemeetings, the tutoring groups were supposed to work on problem sets and examsfrom previous teaching terms. Importantly, all problem sets and study materialsprovided to the students in the treatment group were also available to students inthe control group via the department’s e-learning platform. In every other week (i.e.,when the tutoring groups did not meet to work on problem sets), tutors met with thegroups to discuss any issues that the tutoring group had while solving the problem
6
sets and exams from previous terms. During the session, the tutor then explained theproblems, asked for the issues that students had while solving the problem set, andpotentially also offered general advice on how to study effectively or on anything elsethat was related to the students’ second term, depending on students’ demand. Eachtutoring session lasted for 90 minutes. During the teaching term, each tutoring groupwas supposed to meet with their tutor for five tutoring sessions.
The idea of the program was to (i) induce students to take up tutoring services,(ii) induce peer-to-peer interaction between students in an online environment wherethis sort of interaction is largely missing and (iii) provide a commitment device toensure that students study regularly during the term in an (online) environment whereexternal structure (e.g., resulting from a fixed time schedule) is missing. Studentswho fully complied with the program had up to an additional 90 minutes per weekwhere they actively worked through problems in micro- and macroeconomics whileinteracting with peers.
As outlined before, students who had expressed their interest in the program butwere not offered a slot in the randomization serve as our control group. Students inthe control group did not receive small-group tutoring, but they had the opportunityto attend the regular general practice sessions for students in both microeconomicsand macroeconomics. The regular general practice sessions were open to all students(including those in the treatment group) and took place on a weekly basis, weremuch less personalized, and did not directly induce peer-to-peer interaction. Interms of content, these sessions and the materials available to control group studentswere identical to what tutors and student groups discussed in our intervention.In microeconomics, there were also additional (online) practice tests (not countingtowards students’ grade) that all students could take. In summary, relative to what thecontrol group received in terms of study resources, our program aimed at personalizingteaching without changing the contents or study materials students had access to.
2.3 Recruitment of Tutors
In total, we hired 15 tutors. Work contracts were specified such that each tutor couldhandle a maximum of four groups of two to three students. We included an aboutequal number of 2-person and 3-person groups. With 60 groups in total, the tutoringprogram’s maximum capacity therefore was about 150 students. All tutors werestudents who successfully completed the courses that the program focuses on andduring the summer term of 2021 were enrolled in the fourth or sixth semester of the
7

study program. The program could thus be scaled up easily and at low cost. Includingone additional student for a three-month period would cost about e60.8
Shortly before the start of the tutoring program, all tutors took part in a kick-offmeeting. In this meeting, the research team explained the purpose and the generalstructure of the program and laid out the planned sequence and contents of thetutoring sessions to be held with each student group. The tutors could also askquestions. The tutors were informed about the fact that the program’s capacity waslimited and that a random subset of all students in the second term who showedinterest would be allowed to participate.
2.4 Sampling and Random Assignment to Treatment and Control
Group
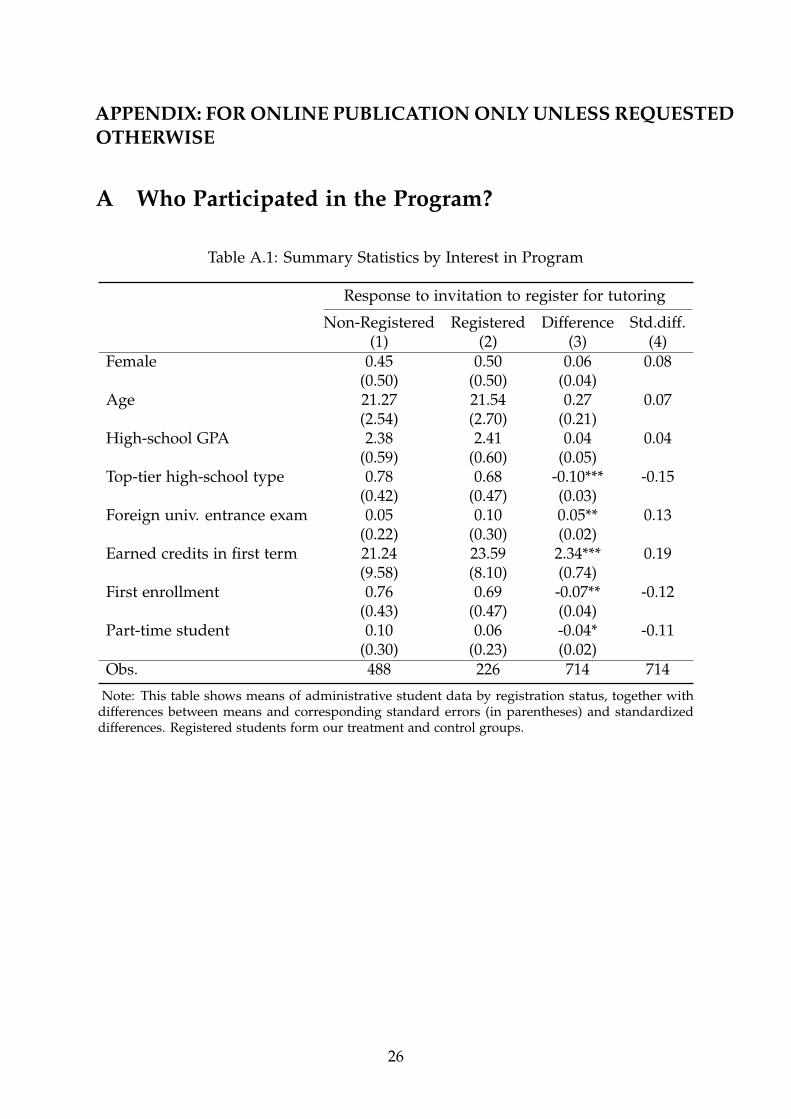
About 790 students enrolled for the study program Business Studies for the fallsemester of 2020. We excluded from the experiment students who dropped out afterthe first semester, who were not formally in their second semester, for example becauseof having been enrolled at another university before and having already completedcourses from the first or second semester of the study program without having takenthese exams at the university, and students who completed less than a full course (5credits) in the first term.9 This leaves us with 714 students entering the second term.These students were invited to participate in the tutoring program in the first week ofthe term. 226 students responded to this invitation and registered their interest in theprogram (see Table A.1 for summary statistics relative to the student population).
We randomly assigned students to the treatment group with a probability ofaround 2/3 to fill all slots, and the other interested students to the control group. Therandomization was done in office by a computer. We used a stratified randomizationscheme with gender and number of credits completed in the first semester (three bins)as strata variables.10 In the end, from the 226 students interested in the program, 145were sampled into the treatment group and 81 into the control group. Students inthe treatment group could drop out at any time with no penalty. If dropouts led totutoring groups with only one student left, we reassigned the remaining student toanother tutoring group of the same tutor.
8Tutors were employed for three months, with work contracts on four hours per week and monthlynet pay of about e160. Employer wage costs were about e200 per month and tutor.
9In Germany, some students enroll at a university because as students they have access to socialsecurity benefits, e.g. to subsidized health insurance.
10We dropped students from the sample who were credited for courses in the second semester andearned the credits in an earlier term (either at the same university, or elsewhere). Such credits oftenshow up with some delay in the administrative data.
8

3 Data and Empirical Strategy
3.1 Data
Survey Data
After the final tutoring sessions and before the beginning of the exam period, weinvited all 226 students in the experimental sample to an online survey. It wasconducted on an existing platform at the department that is regularly used to surveystudents. Students who completed the survey, which lasted around ten minutes,received a payoff of e8.00. The survey elicited the students’ assessment of their studyeffort and behavior as well as their self-perceived (mental) health.
We study the impacts of the tutoring program on study behavior because theprogram was designed to induce students to continuously study throughout the termin small tutoring groups. The questions relating to study behavior include questionson students’ motivation, continuous study behavior, contact to other students, timelyexam preparation and sufficient effort to reach term goals. We study the impacts ofthe tutoring on mental health since the small-group nature of the program, as well asit being among the first formal group interactions in these students’ university life,may alleviate feelings of isolation pervasive in online teaching during the pandemic(e.g., Browning et al., 2021; Logel et al., 2021). The mental health questions comprisequestions on students’ happiness, feelings of stress, anxiety, depression, feelings ofbeing disconnected, sense of belonging, and overall mental health. The full set ofquestions is shown in Appendix B.1.
Our pre-registered primary outcomes from these surveys are (i) a study behaviorindex and (ii) a mental health index. Both indices standardize each reply to a questionin the respective area to have mean zero and standard deviation one in the controlgroup and then build the unweighted sum of the standardized variables (Kling et al.,2007). We coded both indices such that higher values indicate more positive outcomes.The survey was online in the week before the beginning of the examination periodto avoid spillovers from exams to the survey. We use all submitted survey responses.Out of the 226 students in the experimental sample, 142 students (62.8% of the sample)participated and participation was balanced across treatment and control group (seeTable B.3 in the Online Appendix).
Administrative Data
We collected registry data from the university in early October 2021 to measure alloutcomes related to academic achievement. Our pre-registered primary academicoutcome is the total number of credits students earned in the courses microeconomics
9

and macroeconomics, the subjects covered by the program. Passing a subject givesstudents 5 credits each. We also focus on students’ average grade in both subjects,running from 0 (fail grade) to 4 (best grade).11 We note that GPA is, in principle,affected by the student’s decisions on whether to take either exam. However, analyzingthe impact of the program on GPA can reveal whether effects on credits earned cameat the expense of grades. It can also reveal whether there is an effect on studentachievement in parts of the distribution where extensive margin effects on passingexams are unlikely to arise. Finally, we also obtained data on the exact number ofpoints scored in the two exams and use this information to provide a more continuousmeasure of student outcomes in microeconomics and macroeconomics. FollowingAngrist et al. (2009), we did not exclude students who withdrew from the sample.These students were coded as having zero earned credits and no GPA. We assign avalue of zero points in an exam if the student did not participate in it.
The exams took place in person between end of July and September 2021 (i.e.,after the end of the teaching period). In addition to information on individual examparticipation and success, the registry data also contain background information onindividual students (enrollment status, gender, age, type of A-level degree, and A-levelGPA (coded from 1 as the worst to 4 as the best grade)).
3.2 Balancing Checks and Take-Up
Balancing Checks
Table 1 reports differences in means and standardized differences in students’characteristics. The characteristics comprise gender, age (in years), high-school GPA,a dummy for the most common type of high school certificate (“Gymnasium”), adummy for students who obtained their high school certificate abroad, credits earnedin the first term, a dummy for being in their first year at university, and a dummy forpart-time students.12 As can be seen from Table 1, the treatment and control groupswere well balanced across all characteristics.
To assess the quality of our survey data, we repeat the balancing checks usingour survey respondents. We also study selection into survey participation bymean-comparison tests between survey participants and non-participants. Table B.3 inthe Online Appendix shows that the likelihood of survey completion is unrelated totreatment assignment. Within the sample of participants, treatment and control group
11In Germany, a reversed scale is used, with 1 being the best and 4 the worst passing grade. Werecoded the GPA to align with the U.S. system.
12Students can be in the first year of the study program, but in a more advanced year at universityif they were enrolled in a different program before. About 6% of students are enrolled as part-timestudents because their studies are integrated into a vocational training program.
10
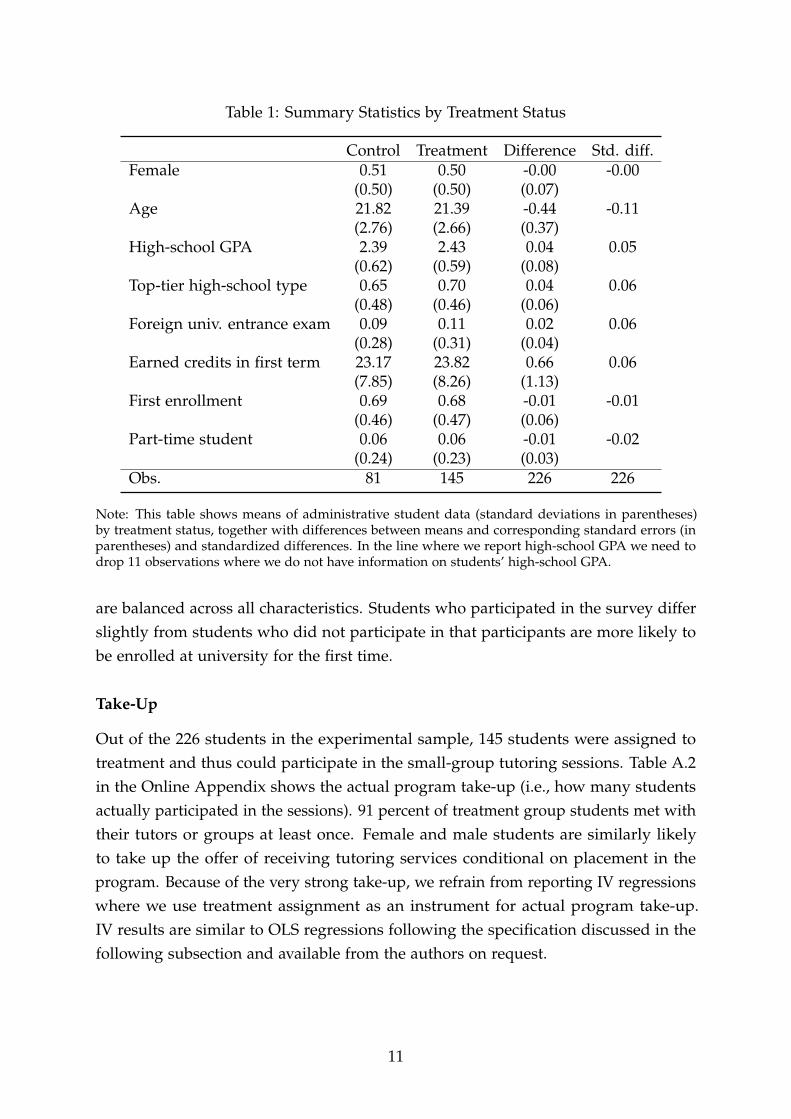
Table 1: Summary Statistics by Treatment Status
Control Treatment Difference Std. diff.Female 0.51 0.50 -0.00 -0.00
(0.50) (0.50) (0.07)Age 21.82 21.39 -0.44 -0.11
(2.76) (2.66) (0.37)High-school GPA 2.39 2.43 0.04 0.05
(0.62) (0.59) (0.08)Top-tier high-school type 0.65 0.70 0.04 0.06
(0.48) (0.46) (0.06)Foreign univ. entrance exam 0.09 0.11 0.02 0.06
(0.28) (0.31) (0.04)Earned credits in first term 23.17 23.82 0.66 0.06
(7.85) (8.26) (1.13)First enrollment 0.69 0.68 -0.01 -0.01
(0.46) (0.47) (0.06)Part-time student 0.06 0.06 -0.01 -0.02
(0.24) (0.23) (0.03)Obs. 81 145 226 226
Note: This table shows means of administrative student data (standard deviations in parentheses)by treatment status, together with differences between means and corresponding standard errors (inparentheses) and standardized differences. In the line where we report high-school GPA we need todrop 11 observations where we do not have information on students’ high-school GPA.
are balanced across all characteristics. Students who participated in the survey differslightly from students who did not participate in that participants are more likely tobe enrolled at university for the first time.
Take-Up
Out of the 226 students in the experimental sample, 145 students were assigned totreatment and thus could participate in the small-group tutoring sessions. Table A.2in the Online Appendix shows the actual program take-up (i.e., how many studentsactually participated in the sessions). 91 percent of treatment group students met withtheir tutors or groups at least once. Female and male students are similarly likelyto take up the offer of receiving tutoring services conditional on placement in theprogram. Because of the very strong take-up, we refrain from reporting IV regressionswhere we use treatment assignment as an instrument for actual program take-up.IV results are similar to OLS regressions following the specification discussed in thefollowing subsection and available from the authors on request.
11

3.3 Estimation
To evaluate the effects of the small-group remote tutoring program, we estimate theequation
yi = α + βTreatmenti + γXi + εi, (1)
where yi is the outcome of student i, Treatmenti is an indicator for (random)treatment assignment, and Xi is the vector of strata variables. The vector thus containsa female indicator and indicators for the tercile of credits completed in the winterterm 2020 the student belongs to. The tercile indicators flexibly control for baselineacademic perfomance. We report robust standard errors that allow for clustering at thetutoring group level for students in the treatment group. We additionally account forissues arising from multiple hypothesis testing and report p-values that adjust for thefamily-wise error rate (FWER) using the procedure of Steinmayr (2020), an extensionof List et al. (2019) allowing for control variables and clustered standard errors.
We considered it likely that the effects of tutoring would differ by studentcharacteristics. First, online education shows more negative effects for weaker students(e.g., Figlio et al., 2013; Bettinger et al., 2017). We thus expected heterogeneous effectsby credits earned in the first term.13 Second, male students show worse outcomesin online relative to in-person teaching, relative to female students (e.g., Figlio et al.,2013; Xu and Jaggars, 2014). However, take-up rates in other (mentoring) programshave typically been higher for female students (e.g., Angrist et al., 2009).14 Thus, itwas ex-ante unclear in which direction a potential heterogeneity by gender would go.
We study treatment effect heterogeneity by including an interaction between thevariable capturing the dimension of heterogeneity and the treatment indicator, jointwith the variable capturing the dimension itself. In addition, we study treatment effectheterogeneity by splitting the sample along the dimension. For the effects by priorperformance, we also split the sample into terciles of prior performance and estimatebaseline regressions in these subsamples.
13We also show results from an endogenous stratification approach in Online Appendix C.5 followingAbadie et al. (2018) and Ferwerda (2014). We find similar results.
14In our context, male students seem to benefit more from similar (mentoring) interventions, ifanything (Hardt et al., 2020), while take-up rates in such programs seem to be higher for femalestudents (e.g., Angrist et al., 2009).
12
4 Results
4.1 Effects on Study Behavior and Mental Health
We first study the effects of the tutoring program on self-reported study behaviorand (mental) health outcomes. As dependent variables, we use indices that aggregateanswers to questions concerning both topics in our survey (Kling et al., 2007) andthat are coded such that higher values indicate more positive outcomes. Table 2shows the result from this analysis. Column (1) shows that treated students reportsubstantially improved study behavior. The treatment effect is sizeable and amountsto around a quarter of a standard deviation in the control group. A more detailedanalysis reveals that the program significantly increased the students’ motivation, ledto more continuous studying, and increased contact to other students (see Table B.4in the Appendix). Instead, Column (2) shows that the mental health index is entirelyunaffected by the treatment. This is also true for each underlying element of themental health index (see Table B.5 in the Appendix).15
Thus, our results suggest that the tutoring program worked as intended, in thesense that it improved students’ study behavior and increased their contact to otherstudents. In contrast, the mental health of students was not affected by the treatment.16
4.2 Impacts on Primary Outcomes
In Figure 1, we plot our main academic outcomes by treatment status. In Panel (a)of the figure, we plot the credits earned in micro- and macroeconomics by treatment.Students can either obtain 0, 5, or 10 credits, depending on whether they pass neitherof the two courses, one of them, or both. The figure shows that the treatment loweredthe likelihood of not passing any course by around 12pp (or 24% of the control groupmean). Correspondingly, the treatment increased the likelihood of reaching 5 creditsby 2.2pp (9%) and the likelihood of passing both courses by 9.8pp (40%).17 Did theincrease in credits earned come at the expense of students’ grades? Panel (b) plotsthe GPA across both courses for those students that obtained a grade. The panelshows that the increase in credits earned documented in Panel (a) came along with a
15Note that this does not arise due to students’ unwillingness to report mental health issues: around60% of students respond to the depression question stating they often or very often felt depressedduring the term, in line with evidence of low mental health among students during the pandemic (e.g.,Lai et al., 2020; Browning et al., 2021).
16All corresponding tables are in Online Appendix B. The statements are shown in Online AppendixB.1. Note that we treat the ordinal scales as if they were cardinal scales. Using ordered probit or orderedlogit models renders qualitatively identical findings.
17Figure C.1 in the Online Appendix also shows means for students who were not interested inparticipating in the program.
13
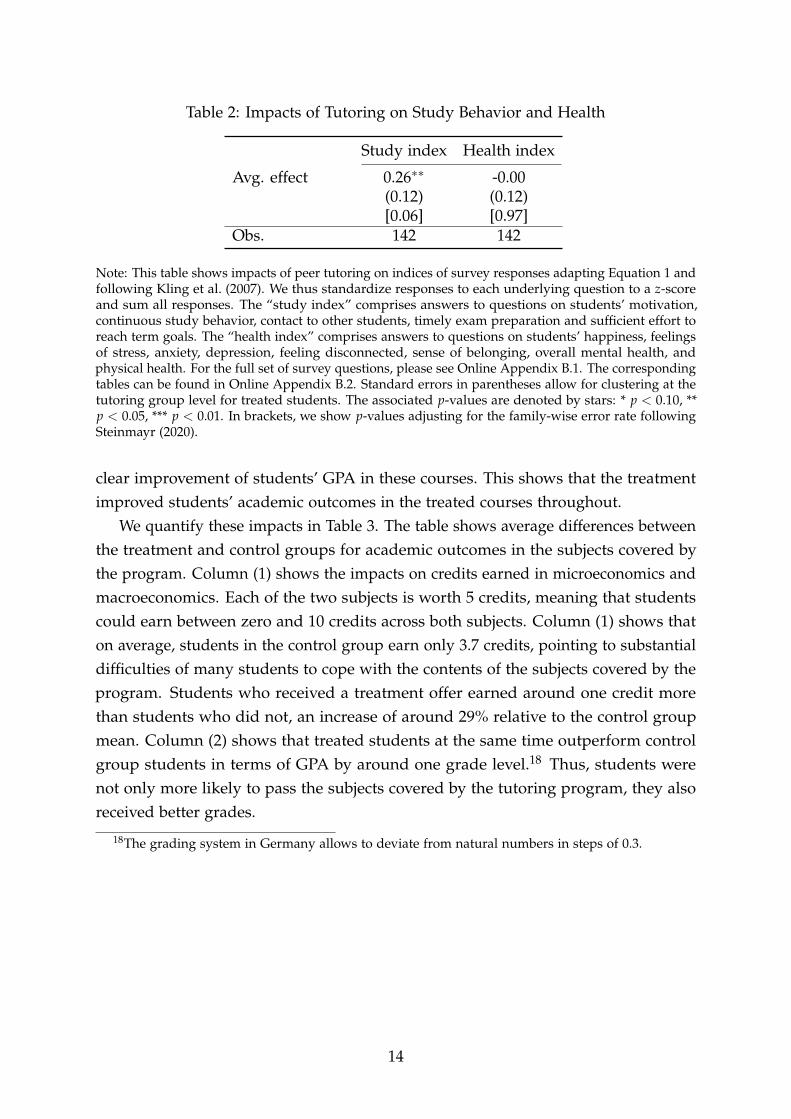
Table 2: Impacts of Tutoring on Study Behavior and Health
Study index Health index
Avg. effect 0.26∗∗ -0.00(0.12) (0.12)[0.06] [0.97]
Obs. 142 142
Note: This table shows impacts of peer tutoring on indices of survey responses adapting Equation 1 andfollowing Kling et al. (2007). We thus standardize responses to each underlying question to a z-scoreand sum all responses. The “study index” comprises answers to questions on students’ motivation,continuous study behavior, contact to other students, timely exam preparation and sufficient effort toreach term goals. The “health index” comprises answers to questions on students’ happiness, feelingsof stress, anxiety, depression, feeling disconnected, sense of belonging, overall mental health, andphysical health. For the full set of survey questions, please see Online Appendix B.1. The correspondingtables can be found in Online Appendix B.2. Standard errors in parentheses allow for clustering at thetutoring group level for treated students. The associated p-values are denoted by stars: * p < 0.10, **p < 0.05, *** p < 0.01. In brackets, we show p-values adjusting for the family-wise error rate followingSteinmayr (2020).
clear improvement of students’ GPA in these courses. This shows that the treatmentimproved students’ academic outcomes in the treated courses throughout.
We quantify these impacts in Table 3. The table shows average differences betweenthe treatment and control groups for academic outcomes in the subjects covered bythe program. Column (1) shows the impacts on credits earned in microeconomics andmacroeconomics. Each of the two subjects is worth 5 credits, meaning that studentscould earn between zero and 10 credits across both subjects. Column (1) shows thaton average, students in the control group earn only 3.7 credits, pointing to substantialdifficulties of many students to cope with the contents of the subjects covered by theprogram. Students who received a treatment offer earned around one credit morethan students who did not, an increase of around 29% relative to the control groupmean. Column (2) shows that treated students at the same time outperform controlgroup students in terms of GPA by around one grade level.18 Thus, students werenot only more likely to pass the subjects covered by the tutoring program, they alsoreceived better grades.
18The grading system in Germany allows to deviate from natural numbers in steps of 0.3.
14
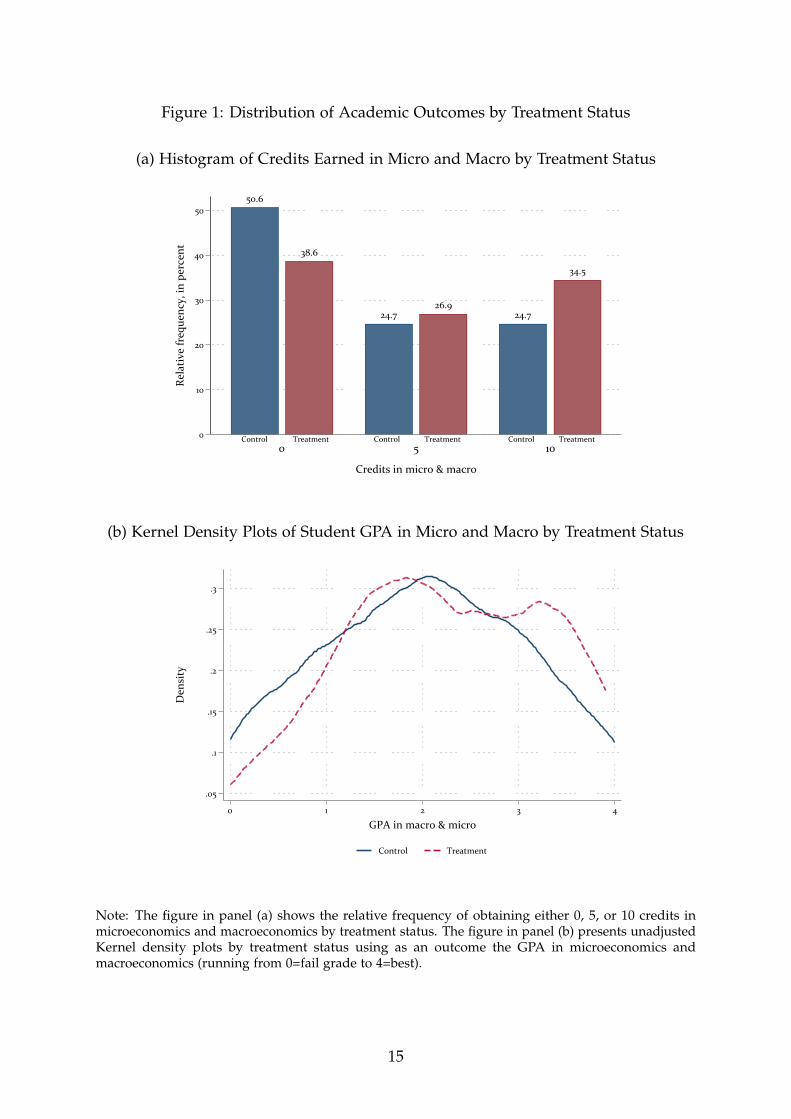
Figure 1: Distribution of Academic Outcomes by Treatment Status
(a) Histogram of Credits Earned in Micro and Macro by Treatment Status
50.6
38.6
24.726.9
24.7
34.5
0 5 10Control Treatment Control Treatment Control Treatment0
10
20
30
40
50
Rela
tive
freq
uenc
y, in
per
cent
0 5 10
Credits in micro & macro
(b) Kernel Density Plots of Student GPA in Micro and Macro by Treatment Status
.05
.1
.15
.2
.25
.3
Den
sity
0 1 2 3 4
GPA in macro & micro
Control Treatment
Note: The figure in panel (a) shows the relative frequency of obtaining either 0, 5, or 10 credits inmicroeconomics and macroeconomics by treatment status. The figure in panel (b) presents unadjustedKernel density plots by treatment status using as an outcome the GPA in microeconomics andmacroeconomics (running from 0=fail grade to 4=best).
15
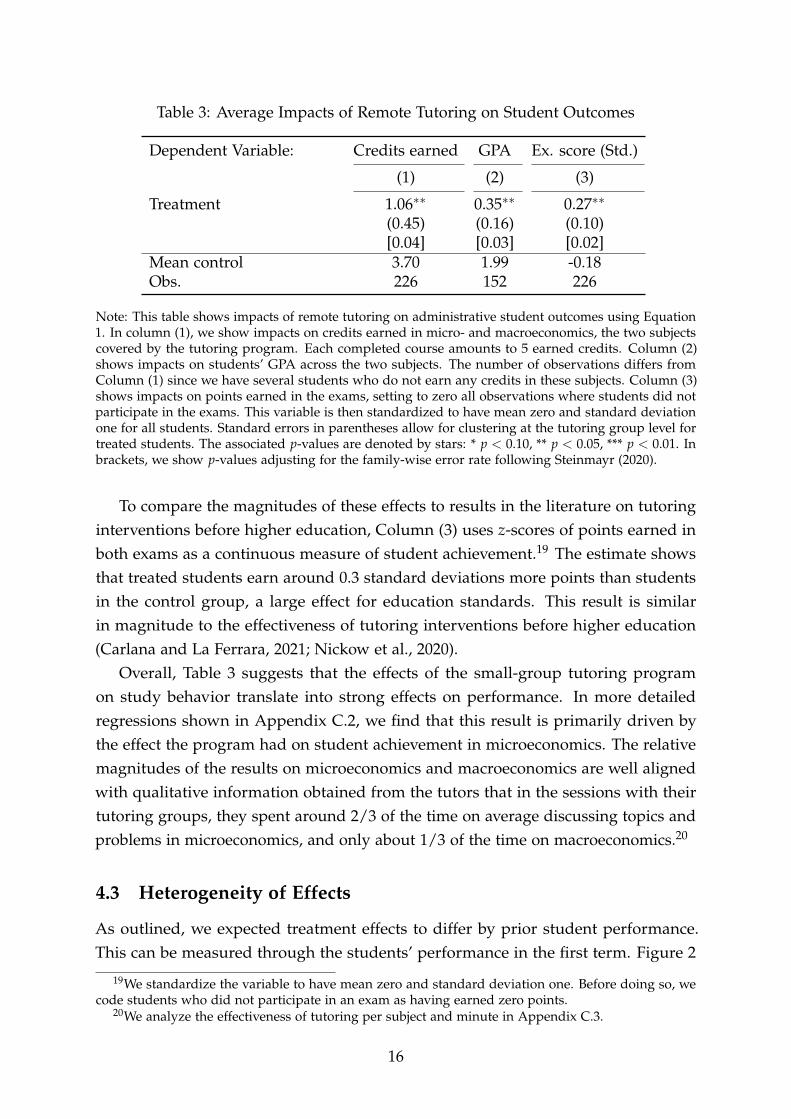
Table 3: Average Impacts of Remote Tutoring on Student Outcomes
Dependent Variable: Credits earned GPA Ex. score (Std.)
(1) (2) (3)
Treatment 1.06∗∗ 0.35∗∗ 0.27∗∗
(0.45) (0.16) (0.10)[0.04] [0.03] [0.02]
Mean control 3.70 1.99 -0.18Obs. 226 152 226
Note: This table shows impacts of remote tutoring on administrative student outcomes using Equation1. In column (1), we show impacts on credits earned in micro- and macroeconomics, the two subjectscovered by the tutoring program. Each completed course amounts to 5 earned credits. Column (2)shows impacts on students’ GPA across the two subjects. The number of observations differs fromColumn (1) since we have several students who do not earn any credits in these subjects. Column (3)shows impacts on points earned in the exams, setting to zero all observations where students did notparticipate in the exams. This variable is then standardized to have mean zero and standard deviationone for all students. Standard errors in parentheses allow for clustering at the tutoring group level fortreated students. The associated p-values are denoted by stars: * p < 0.10, ** p < 0.05, *** p < 0.01. Inbrackets, we show p-values adjusting for the family-wise error rate following Steinmayr (2020).
To compare the magnitudes of these effects to results in the literature on tutoringinterventions before higher education, Column (3) uses z-scores of points earned inboth exams as a continuous measure of student achievement.19 The estimate showsthat treated students earn around 0.3 standard deviations more points than studentsin the control group, a large effect for education standards. This result is similarin magnitude to the effectiveness of tutoring interventions before higher education(Carlana and La Ferrara, 2021; Nickow et al., 2020).
Overall, Table 3 suggests that the effects of the small-group tutoring programon study behavior translate into strong effects on performance. In more detailedregressions shown in Appendix C.2, we find that this result is primarily driven bythe effect the program had on student achievement in microeconomics. The relativemagnitudes of the results on microeconomics and macroeconomics are well alignedwith qualitative information obtained from the tutors that in the sessions with theirtutoring groups, they spent around 2/3 of the time on average discussing topics andproblems in microeconomics, and only about 1/3 of the time on macroeconomics.20
4.3 Heterogeneity of Effects
As outlined, we expected treatment effects to differ by prior student performance.This can be measured through the students’ performance in the first term. Figure 2
19We standardize the variable to have mean zero and standard deviation one. Before doing so, wecode students who did not participate in an exam as having earned zero points.
20We analyze the effectiveness of tutoring per subject and minute in Appendix C.3.
16

shows the key result from this analysis using credits earned in subjects covered bythe program as the dependent variable. We find that the treatment effect is largest forstudents in the second tercile of the prior student performance distribution. The pointestimate for weak students is insignificant, but sizable, suggesting that the treatmentmore than doubled credits earned on average. For good students, there are no effectson credits earned. In Appendix C.4, we repeat this analysis using student GPA as thedependent variable. The results suggest positive impacts of comparable magnitude onthe GPA of all types of students.21
We also investigated the heterogeneity of effects by student gender. In AppendixTable C.5, we show the results from this analysis. Female and male students benefitsimilarly from the tutoring in terms of credits earned, but females benefit a bit morein terms of GPA, although the difference is insignificant. We also studied whether theeffects of tutoring are larger for students tutored by female than by male tutors as wellas gender interactions (e.g., Dee, 2005, 2007; Hoffmann and Oreopoulos, 2009). Westudy this in Table C.6 in the Appendix. We find some differences for men, who seemto be more effectively tutored by male than by female tutors.
Nickow et al. (2020) report that typically, tutors more distant in age and hierarchyare more effective than peer tutors. In additional heterogeneity analyses, we thereforealso study whether the effects of tutoring are larger when students are tutored bymore senior (from the 6th term) or by less senior (from the 4th term) tutors. We findno such effect (Online Appendix Table C.7). Finally, we also investigate whether theeffects of tutoring are larger in two-person or three-person tutoring groups (Table C.8in the Online Appendix). We find that, if anything, larger groups are more effective.
Overall, the heterogeneity analysis thus returns some interesting patterns. Thetutoring program reduced outcome inequality in credits earned, while benefiting goodstudents nevertheless by raising their average grade across the subjects covered bythe treatment. Female and male students benefit similarly from the program. Finally,the tutoring, if anything, works even better in slightly larger groups of three tutoredstudents than in smaller groups of two.
21In Online Appendix C.5, we follow Abadie et al. (2018) and Ferwerda (2014) and estimate effectsusing endogenous stratification approaches. In line with the analysis above, students in the lower andmiddle part of the distribution of predicted outcomes in the summer term seem to benefit most fromthe program in terms of credits earned. In terms of GPA, the impacts are highest for well-performingstudents.
17

Figure 2: Effects on Credits Earned by Prior Performance
0.48
1.25
2.34
4.55
7.68 7.61
Difference: .78SE: .67
Difference: 2.20***SE: .79
Difference: -.07SE: .78
Control Treatment Control Treatment Control Treatment
0
2
4
6
8
10
Cre
dits
ear
ned
in m
acro
& m
icro
Tercile 1 Tercile 2 Tercile 3
Note: This figure shows how students’ credits earned in the summer term 2021 relate to students’ priorperformance as measured by students’ credits earned in the winter term.
4.4 Spillovers to Other Subjects
We now investigate whether students’ performance in subjects not covered by thetutoring program was affected by the treatment as well. Ex-ante, it is unclear whetherwe should expect spillover effects. And if there are spillover effects, it is ex-anteunclear in which direction these effects should go. On the one hand, students couldbenefit from spillovers for example through using their math skills trained in micro-and macroeconomics for other subjects as well. On the other hand, the tutoring mayshift students’ attention towards the subjects covered and away from the remainingsubjects.
Table 4 therefore splits the compulsory courses in the second term into treated andnon-treated subjects. The first two columns show the impacts of the tutoring programon treated compulsory courses and thus repeat the results in Table 3. Column (3)shows the impact on credits earned in non-treated compulsory courses. The effectis slightly negative, but insignificant. Relative to the mean of the control group, itis small, at 4%. Column (4) shows that the impact on students’ GPA in non-treatedcompulsory courses is similarly small and insignificant. Thus, the tutoring intervention
18
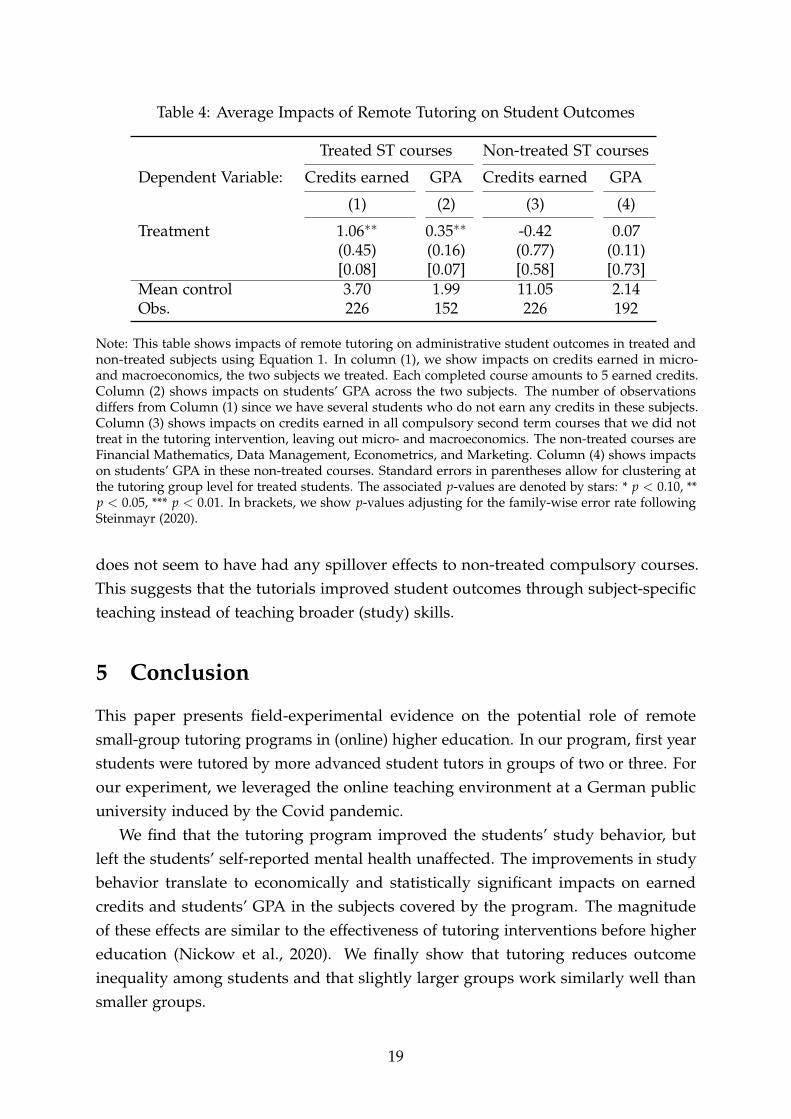
Table 4: Average Impacts of Remote Tutoring on Student Outcomes
Treated ST courses Non-treated ST courses
Dependent Variable: Credits earned GPA Credits earned GPA
(1) (2) (3) (4)
Treatment 1.06∗∗ 0.35∗∗ -0.42 0.07(0.45) (0.16) (0.77) (0.11)[0.08] [0.07] [0.58] [0.73]
Mean control 3.70 1.99 11.05 2.14Obs. 226 152 226 192
Note: This table shows impacts of remote tutoring on administrative student outcomes in treated andnon-treated subjects using Equation 1. In column (1), we show impacts on credits earned in micro-and macroeconomics, the two subjects we treated. Each completed course amounts to 5 earned credits.Column (2) shows impacts on students’ GPA across the two subjects. The number of observationsdiffers from Column (1) since we have several students who do not earn any credits in these subjects.Column (3) shows impacts on credits earned in all compulsory second term courses that we did nottreat in the tutoring intervention, leaving out micro- and macroeconomics. The non-treated courses areFinancial Mathematics, Data Management, Econometrics, and Marketing. Column (4) shows impactson students’ GPA in these non-treated courses. Standard errors in parentheses allow for clustering atthe tutoring group level for treated students. The associated p-values are denoted by stars: * p < 0.10, **p < 0.05, *** p < 0.01. In brackets, we show p-values adjusting for the family-wise error rate followingSteinmayr (2020).
does not seem to have had any spillover effects to non-treated compulsory courses.This suggests that the tutorials improved student outcomes through subject-specificteaching instead of teaching broader (study) skills.
5 Conclusion
This paper presents field-experimental evidence on the potential role of remotesmall-group tutoring programs in (online) higher education. In our program, first yearstudents were tutored by more advanced student tutors in groups of two or three. Forour experiment, we leveraged the online teaching environment at a German publicuniversity induced by the Covid pandemic.
We find that the tutoring program improved the students’ study behavior, butleft the students’ self-reported mental health unaffected. The improvements in studybehavior translate to economically and statistically significant impacts on earnedcredits and students’ GPA in the subjects covered by the program. The magnitudeof these effects are similar to the effectiveness of tutoring interventions before highereducation (Nickow et al., 2020). We finally show that tutoring reduces outcomeinequality among students and that slightly larger groups work similarly well thansmaller groups.
19

Our results show the effectiveness of remote tutoring to improve student outcomesand study behavior in higher education. While transferring field experimental resultsobtained during a pandemic to other settings is certainly a challenge, the sum ofour findings leads us to believe that our results carry implications for the time inwhich universities return to their (new) normal way of teaching. Online-only highereducation has been on the rise already before the pandemic and demand for onlinetutoring services in higher education is expected to further increase in post-pandemictimes.
20

References
Abadie, A., M. M. Chingos, and M. R. West (2018): “Endogenous Stratification inRandomized Experiments,” Review of Economics and Statistics, 100, 567–580.
Altindag, D. T., E. S. Filiz, and E. Tekin (2021): “Is Online Education Working?”NBER Working Paper No. 29113.
Angrist, J., D. Lang, and P. Oreopoulos (2009): “Incentives and Services for CollegeAchievement: Evidence from a Randomized Trial,” American Economic Journal:Applied Economics, 1, 136–163.
Angrist, N., P. Bergman, and M. Matsheng (2021): “School’s Out: ExperimentalEvidence on Limiting Learning Loss Using ‘Low-Tech’ in a Pandemic,” NBERWorking Paper No. 28205.
Aucejo, E. M., J. French, M. P. U. Araya, and B. Zafar (2020): “The Impact ofCOVID-19 on Student Experiences and Expectations: Evidence from a Survey,”Journal of Public Economics, 191, 104271.
Bacher-Hicks, A., J. Goodman, and C. Mulhern (2020): “Inequality in HouseholdAdaptation to Schooling Shocks: Covid-Induced Online Learning Engagement inReal Time,” Journal of Public Economics.
Banerjee, A. V. and E. Duflo (2014): “(Dis)Organization and Success in an EconomicsMOOC,” American Economic Review: Papers & Proceedings, 104, 514–518.
Bettinger, E. P., L. Fox, S. Loeb, and E. S. Taylor (2017): “Virtual Classrooms: HowOnline College Courses Affect Student Success,” American Economic Review, 107,2855–2875.
Bird, K. A., B. L. Castleman, and G. Lohner (2020): “Negative Impacts From theShift to Online Learning During the COVID-19 Crisis: Evidence from a StatewideCommunity College System,” EdWorkingPaper 20-299.
Browning, M., L. R. Larson, I. Sharaievska, A. Rigolon, O. McAnirlin,L. Mullenbach, S. Cloutier, T. M. Vu, J. Thomsen, N. Reigner, E. C. Metcalf,A. D’Antonio, M. Helbich, G. N. Bratman, and H. O. Alvarez (2021):“Psychological impacts from COVID-19 among university students: Risk factorsacross seven states in the United States,” PLOS One.
Carlana, M. and E. La Ferrara (2021): “Apart but Connected: Online Tutoring andStudent Outcomes during the COVID-19 Pandemic,” Working Paper.
21
de Ree, J., M. A. Maggioni, B. Paulle, D. Rossignoli, and D. Walentek (2021): “Highdosage tutoring in pre-vocational secondary education: Experimental evidence fromAmsterdam,” .
Dee, T. S. (2005): “A Teacher Like Me: Does Race, Ethnicity, or Gender Matter?”American Economic Review Papers and Proceedings, 95, 158–165.
——— (2007): “Teachers and the Gender Gaps in Student Achievement,” Journal ofHuman Resources, 42, 528–554.
Elmer, T., K. Mepham, and C. Stadtfeld (2020): “Students under lockdown:Comparisons of students’ social networks and mental health before and during theCOVID-19 crisis in Switzerland,” PLOS One.
Ferwerda, J. (2014): “ESTRAT: Stata module to perform Endogenous Stratification forRandomized Experiments,” Statistical Software Components S457801.
Figlio, D., M. Rush, and L. Yin (2013): “Is It Live or Is It Internet? ExperimentalEstimates of the Effects of Online Instruction on Student Learning,” Journal of LaborEconomics, 31, 763–784.
Fryer, R. G. (2017): “The Production of Human Capital in Developed Countries:Evidence From 196 Randomized Field Experiments,” in Handbook of Economic FieldExperiments, ed. by A. V. Banerjee and E. Duflo, Elsevier, vol. 2.
Gordanier, J., W. Hauk, and C. Sankaran (2019): “Early intervention in collegeclasses and improved student outcomes,” Economics of Education Review, 72, 23–29.
Grewenig, E., P. Lergetporer, K. Werner, L. Woessmann, and L. Zierow (2021):“COVID-19 and Educational Inequality: How School Closures Affect Low- andHigh-Achieving Students,” European Economic Review, 103920.
Hardt, D., M. Nagler, and J. Rincke (2020): “Can Peer Mentoring Improve OnlineTeaching Effectiveness? An RCT during the Covid-19 Pandemic,” CESifo WorkingPaper No. 8671.
Hoffmann, F. and P. Oreopoulos (2009): “A Professor Like Me: The Influence ofInstructor Gender on College Achievement,” Journal of Human Resources, 44, 479–494.
Jaeger, D. A., J. Arellano-Bover, K. Karbownik, M. M. Matute, J. M. Nunley,J. R. Alan Seals, M. Almunia, M. Alston, S. O. Becker, P. Beneito, R. Boheim, J. E.Bosca, J. H. Brown, S. Chang, D. A. Cobb-Clark, S. Danagoulian, S. Donnally,M. Eckrote-Nordland, L. Farre, J. Ferri, M. Fort, J. C. Fruewirth, R. Gelding,A. C. Goodman, M. Guldi, S. Hackl, J. Hankin, S. A. Imberman, J. Lahey,
22

J. Llull, H. Mansour, I. McFarlin, J. Merilainen, T. Mortlund, M. Nybom,S. D. O’Connell, R. Sausgruber, A. Schwartz, J. Stuhler, P. Thiemann, R. van
Veldhuizen, M. H. Wanamaker, and M. Zhu (2021): “The Global COVID-19Student Survey: First Wave Results,” IZA Discussion Paper Series No. 14419.
Kim, E., J. Goodman, and M. R. West (2021): “Kumon In: The Recent, Rapid Rise ofPrivate Tutoring Centers,” EdWorkingPaper: 21-367.
Kling, J. R., J. B. Liebman, and L. F. Katz (2007): “Experimental Analysis ofNeighborhood Effects,” Econometrica, 75, 83–119.
Kofoed, M. S., L. Gebhart, D. Gilmore, and R. Moschitto (2021): “Zoomingto Class?: Experimental Evidence on College Students’ Online Learning duringCOVID-19,” IZA Discussion Paper No. 14356.
Kuh, G. (2008): High-impact educational practices : what they are, who has access tothem, and why they matter, Washington, DC: Association of American Colleges andUniversities.
Lai, A., L. Lee, M. ping Wang, Y. Feng, T. T. kwan Lai, L. ming Ho, V. S. fun Lam,M. S. man Ip, and T. hing Lam (2020): “Mental Health Impacts of the COVID-19Pandemic on International University Students, Related Stressors, and CopingStrategies,” Frontiers in Psychiatry, 11.
Lavecchia, A., H. Liu, and P. Oreopoulos (2016): “Behavioral Economics ofEducation: Progress and Possibilities,” in Handbook of the Economics of Education, ed.by E. A. Hanushek, S. Machin, and L. Woessmann, Elsevier, vol. 5, 1–74.
List, J. A., A. M. Shaikh, and Y. Xu (2019): “Multiple hypothesis testing inexperimental economics,” Experimental Economics, 22, 773–793.
Logel, C., P. Oreopoulos, and U. Petronijevic (2021): “Experiences and CopingStrategies of College Students During the COVID-19 Pandemic,” NBER WorkingPaper No. 28803.
Munley, V. G., E. Garvey, and M. J. McConnell (2010): “The Effectiveness ofPeer Tutoring on Student Achievement at the University Level,” American EconomicReview: Papers & Proceedings, 100, 277–282.
Nickow, A., P. Oreopoulos, and V. Quan (2020): “The Impressive Effects of Tutoringon PreK-12 Learning: A Systematic Review and Meta-Analysis of the ExperimentalEvidence,” NBER Working Paper No. 27476.
23

Oreopoulos, P. and U. Petronijevic (2019): “The Remarkable Unresponsiveness ofCollege Students to Nudging And What We Can Learn from It,” NBER WorkingPaper No. 26059.
Orlov, G., D. McKee, J. Berry, A. Boyle, T. DiCiccio, T. Ransom, A. Rees-Jones,and J. Stoye (2021): “Learning During the COVID-19 Pandemic: It Is Not Who YouTeach, but How You Teach,” Economics Letters, 202, 109812.
Paloyo, A. R., S. Rogana, and P. Siminski (2016): “The effect of supplementalinstruction on academic performance: An encouragement design experiment,”Economics of Education Review, 55, 57–69.
Parkinson, M. (2009): “The effect of peer assisted learning support (PALS) onperformance in mathematics and chemistry,” Innovations in Education and TeachingInternational, 46, 381–392.
Patterson, R. W. (2018): “Can Behavioral Tools Improve Online Student Outcomes?Experimental Evidence from a Massive Open Online Course,” Journal of EconomicBehavior & Organization, 53, 293–321.
Pugatch, T. and N. Wilson (2018): “Nudging study habits: A field experiment onpeer tutoring in higher education,” Economics of Education Review, 62, 151–161.
——— (2020): “Nudging Demand for Academic Support Services: Experimental andStructural Evidence from Higher Education,” IZA Discussion Paper No. 13732.
Rodriguez-Planas, N. (2020): “Hitting Where It Hurts Most: COVID-19 andLow-Income Urban College Students,” IZA Discussion Paper 13644.
——— (2022): “COVID-19 and College Academic Performance: A LongitudinalAnalysis,” Journal of Public Economics, forthcoming.
Scrivener, S., M. J. Weiss, A. Ratledge, T. Rudd, C. Sommo, and H. Fresques (2015):“Doubling Graduation Rates: Three-Year Effects of CUNY’s Accelerated Study inAssociate Programs (ASAP) for Developmental Education Students,” MDRC.
Sommo, C., D. Cullinan, M. Manno, S. Blake, and E. Alonzo (2018): “DoublingGraduation Rates in a New State Two-Year Findings from the ASAP OhioDemonstration,” MDRC Policy Brief 12/2018.
Son, C., S. Hegde, A. Smith, X. Wang, and F. Sasangohar (2020): “Effects ofCOVID-19 on College Students’ Mental Health in the United States: InterviewSurvey Study,” Journal of Medical Internet Research, 22, e21279.
24
Steinmayr, A. (2020): “MHTREG: Stata module for multiple hypothesis testingcontrolling for FWER,” Statistical Software Components S458853, Boston CollegeDepartment of Economics.
Strada Education Network (2020): “Public Viewpoint: Enrolling in Education:Motivations, Barriers, and Expectations,” Released on July 15, 2020, onhttps://cci.stradaeducation.org/pv-release-july-15-2020/.
Valuates Reports (2021): “Global Online Tutoring Market Size, Status and Forecast2021-2027,” Available at https://reports.valuates.com/market-reports/
QYRE-Auto-23Y2571/covid-19-impact-on-online-tutoring.
Weiss, M. J., A. Ratledge, C. Sommo, and H. Gupta (2019): “Supporting CommunityCollege Students from Start to Degree Completion: Long-Term Evidence from aRandomized Trial of CUNY’s ASAP,” American Economic Journal: Applied Economics,11, 253–297.
Xu, D. and S. S. Jaggars (2014): “Performance Gaps between Online and Face-to-FaceCourses: Differences across Types of Students and Academic Subject Areas,” TheJournal of Higher Education, 85, 633–659.
25
APPENDIX: FOR ONLINE PUBLICATION ONLY UNLESS REQUESTEDOTHERWISE
A Who Participated in the Program?
Table A.1: Summary Statistics by Interest in Program
Response to invitation to register for tutoring
Non-Registered Registered Difference Std.diff.(1) (2) (3) (4)
Female 0.45 0.50 0.06 0.08(0.50) (0.50) (0.04)
Age 21.27 21.54 0.27 0.07(2.54) (2.70) (0.21)
High-school GPA 2.38 2.41 0.04 0.04(0.59) (0.60) (0.05)
Top-tier high-school type 0.78 0.68 -0.10*** -0.15(0.42) (0.47) (0.03)
Foreign univ. entrance exam 0.05 0.10 0.05** 0.13(0.22) (0.30) (0.02)
Earned credits in first term 21.24 23.59 2.34*** 0.19(9.58) (8.10) (0.74)
First enrollment 0.76 0.69 -0.07** -0.12(0.43) (0.47) (0.04)
Part-time student 0.10 0.06 -0.04* -0.11(0.30) (0.23) (0.02)
Obs. 488 226 714 714
Note: This table shows means of administrative student data by registration status, together withdifferences between means and corresponding standard errors (in parentheses) and standardizeddifferences. Registered students form our treatment and control groups.
26
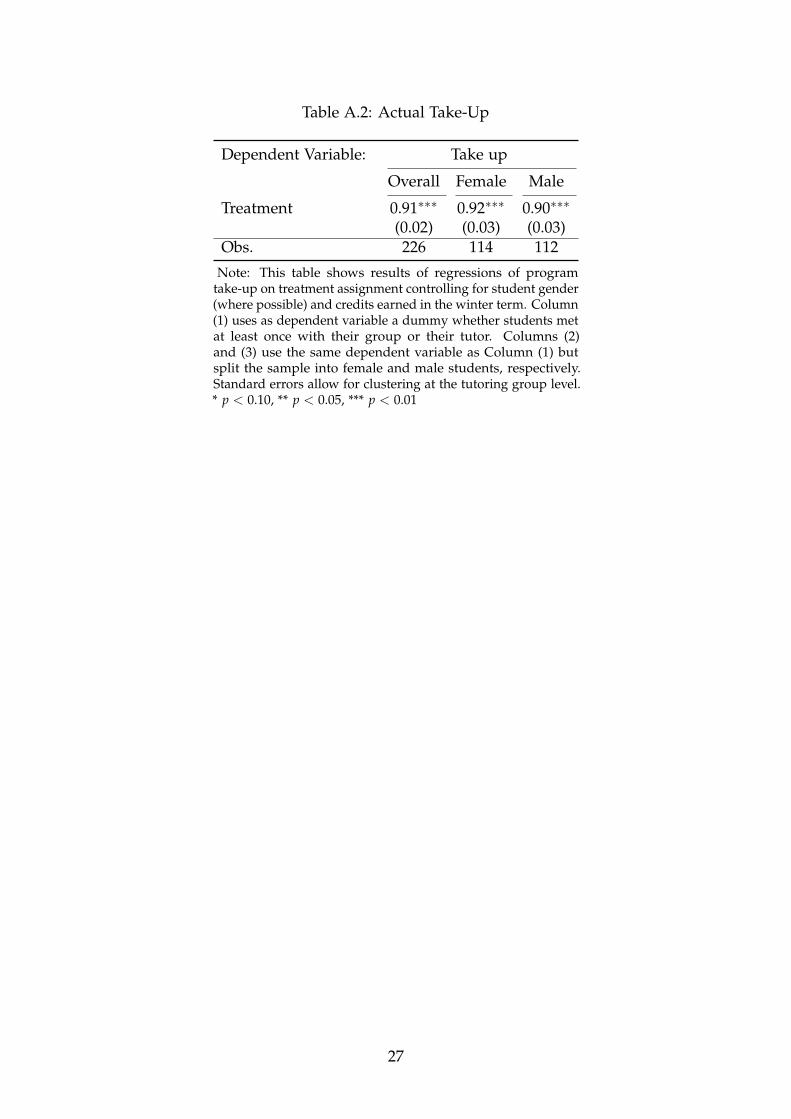
Table A.2: Actual Take-Up
Dependent Variable: Take up
Overall Female Male
Treatment 0.91∗∗∗ 0.92∗∗∗ 0.90∗∗∗
(0.02) (0.03) (0.03)Obs. 226 114 112
Note: This table shows results of regressions of programtake-up on treatment assignment controlling for student gender(where possible) and credits earned in the winter term. Column(1) uses as dependent variable a dummy whether students metat least once with their group or their tutor. Columns (2)and (3) use the same dependent variable as Column (1) butsplit the sample into female and male students, respectively.Standard errors allow for clustering at the tutoring group level.* p < 0.10, ** p < 0.05, *** p < 0.01
27
B Additional Survey Information and Evidence
B.1 Survey Questions and Sorting into Survey Participation
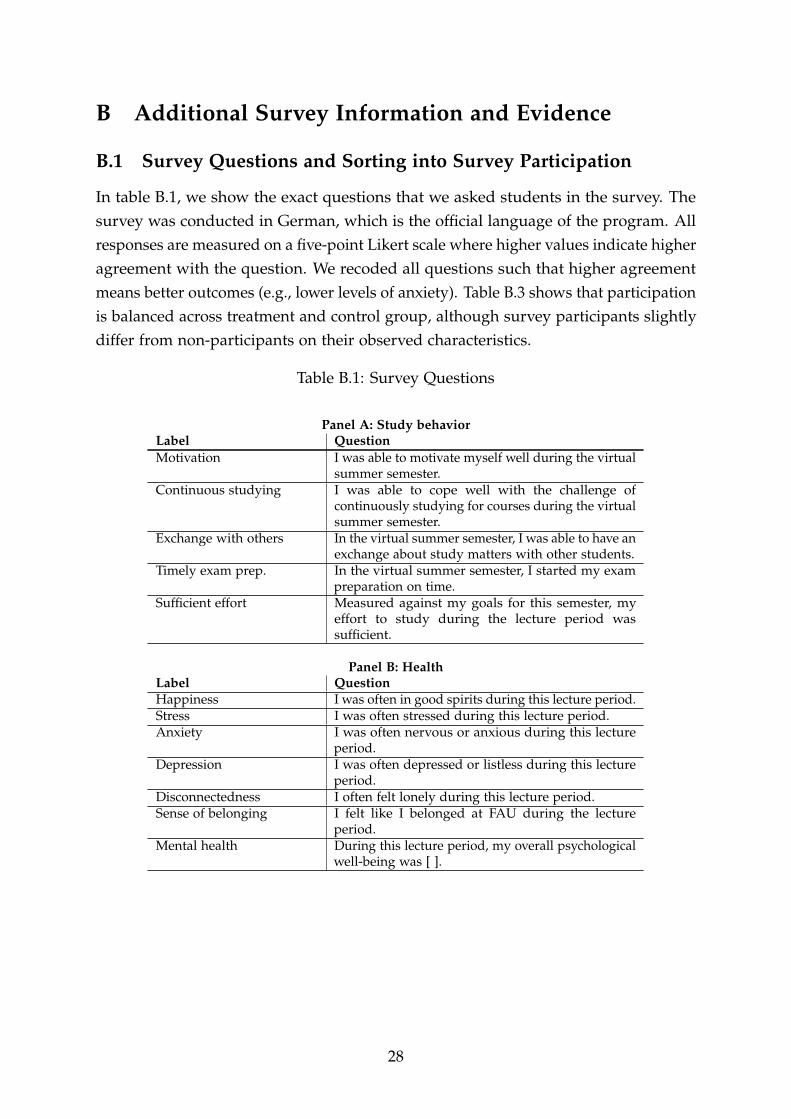
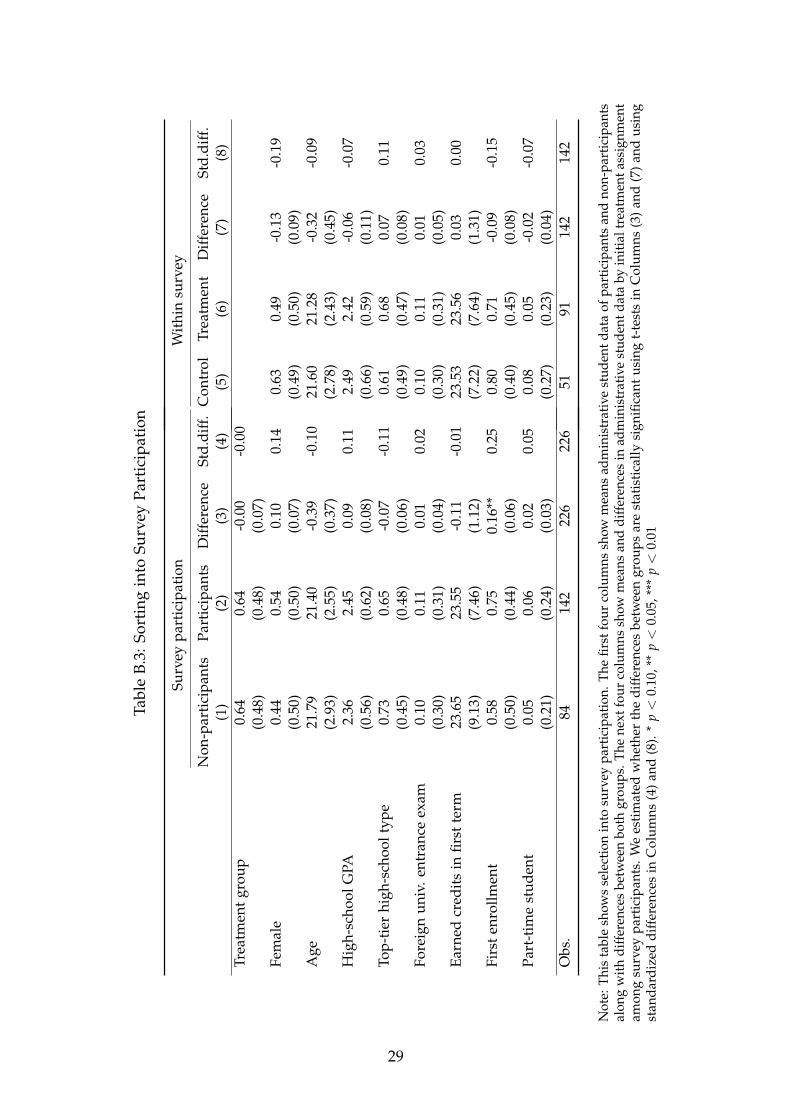
In table B.1, we show the exact questions that we asked students in the survey. Thesurvey was conducted in German, which is the official language of the program. Allresponses are measured on a five-point Likert scale where higher values indicate higheragreement with the question. We recoded all questions such that higher agreementmeans better outcomes (e.g., lower levels of anxiety). Table B.3 shows that participationis balanced across treatment and control group, although survey participants slightlydiffer from non-participants on their observed characteristics.
Table B.1: Survey Questions
Panel A: Study behaviorLabel QuestionMotivation I was able to motivate myself well during the virtual
summer semester.Continuous studying I was able to cope well with the challenge of
continuously studying for courses during the virtualsummer semester.
Exchange with others In the virtual summer semester, I was able to have anexchange about study matters with other students.
Timely exam prep. In the virtual summer semester, I started my exampreparation on time.
Sufficient effort Measured against my goals for this semester, myeffort to study during the lecture period wassufficient.
Panel B: HealthLabel QuestionHappiness I was often in good spirits during this lecture period.Stress I was often stressed during this lecture period.Anxiety I was often nervous or anxious during this lecture
period.Depression I was often depressed or listless during this lecture
period.Disconnectedness I often felt lonely during this lecture period.Sense of belonging I felt like I belonged at FAU during the lecture
period.Mental health During this lecture period, my overall psychological
well-being was [ ].
28
Tabl
eB.
3:So
rtin
gin
toSu
rvey
Part
icip
atio
n
Surv
eypa
rtic
ipat
ion
Non
-par
tici
pant
sPa
rtic
ipan
tsD
iffer
ence
Std.
diff
.(1
)(2
)(3
)(4
)Tr
eatm
ent
grou
p0.
640.
64-0
.00
-0.0
0(0
.48)
(0.4
8)(0
.07)
Fem
ale
0.44
0.54
0.10
0.14
(0.5
0)(0
.50)
(0.0
7)A
ge21
.79
21.4
0-0
.39
-0.1
0(2
.93)
(2.5
5)(0
.37)
Hig
h-sc
hool
GPA
2.36
2.45
0.09
0.11
(0.5
6)(0
.62)
(0.0
8)To
p-ti
erhi
gh-s
choo
ltyp
e0.
730.
65-0
.07
-0.1
1(0
.45)
(0.4
8)(0
.06)
Fore
ign
univ
.ent
ranc
eex
am0.
100.
110.
010.
02(0
.30)
(0.3
1)(0
.04)
Earn
edcr
edit
sin
first
term
23.6
523
.55
-0.1
1-0
.01
(9.1
3)(7
.46)
(1.1
2)Fi
rst
enro
llmen
t0.
580.
750.
16**
0.25
(0.5
0)(0
.44)
(0.0
6)Pa
rt-t
ime
stud
ent
0.05
0.06
0.02
0.05
(0.2
1)(0
.24)
(0.0
3)O
bs.
8414
222
622
6
Wit
hin
surv
ey
Con
trol
Trea
tmen
tD
iffer
ence
Std.
diff
.(5
)(6
)(7
)(8
)
0.63
0.49
-0.1
3-0
.19
(0.4
9)(0
.50)
(0.0
9)21
.60
21.2
8-0
.32
-0.0
9(2
.78)
(2.4
3)(0
.45)
2.49
2.42
-0.0
6-0
.07
(0.6
6)(0
.59)
(0.1
1)0.
610.
680.
070.
11(0
.49)
(0.4
7)(0
.08)
0.10
0.11
0.01
0.03
(0.3
0)(0
.31)
(0.0
5)23
.53
23.5
60.
030.
00(7
.22)
(7.6
4)(1
.31)
0.80
0.71
-0.0
9-0
.15
(0.4
0)(0
.45)
(0.0
8)0.
080.
05-0
.02
-0.0
7(0
.27)
(0.2
3)(0
.04)
5191
142
142
Not
e:Th
ista
ble
show
sse
lect
ion
into
surv
eypa
rtic
ipat
ion.
The
first
four
colu
mns
show
mea
nsad
min
istr
ativ
est
uden
tdat
aof
part
icip
ants
and
non-
part
icip
ants
alon
gw
ithdi
ffer
ence
sbe
twee
nbo
thgr
oups
.The
next
four
colu
mns
show
mea
nsan
ddi
ffer
ence
sin
adm
inis
trat
ive
stud
entd
ata
byin
itial
trea
tmen
tass
ignm
ent
amon
gsu
rvey
part
icip
ants
.W
ees
tim
ated
whe
ther
the
diff
eren
ces
betw
een
grou
psar
est
atis
tica
llysi
gnifi
cant
usin
gt-
test
sin
Col
umns
(3)
and
(7)
and
usin
gst
anda
rdiz
eddi
ffer
ence
sin
Col
umns
(4)
and
(8).
*p<
0.10
,**
p<
0.05
,***
p<
0.01
29
B.2 Regression Results
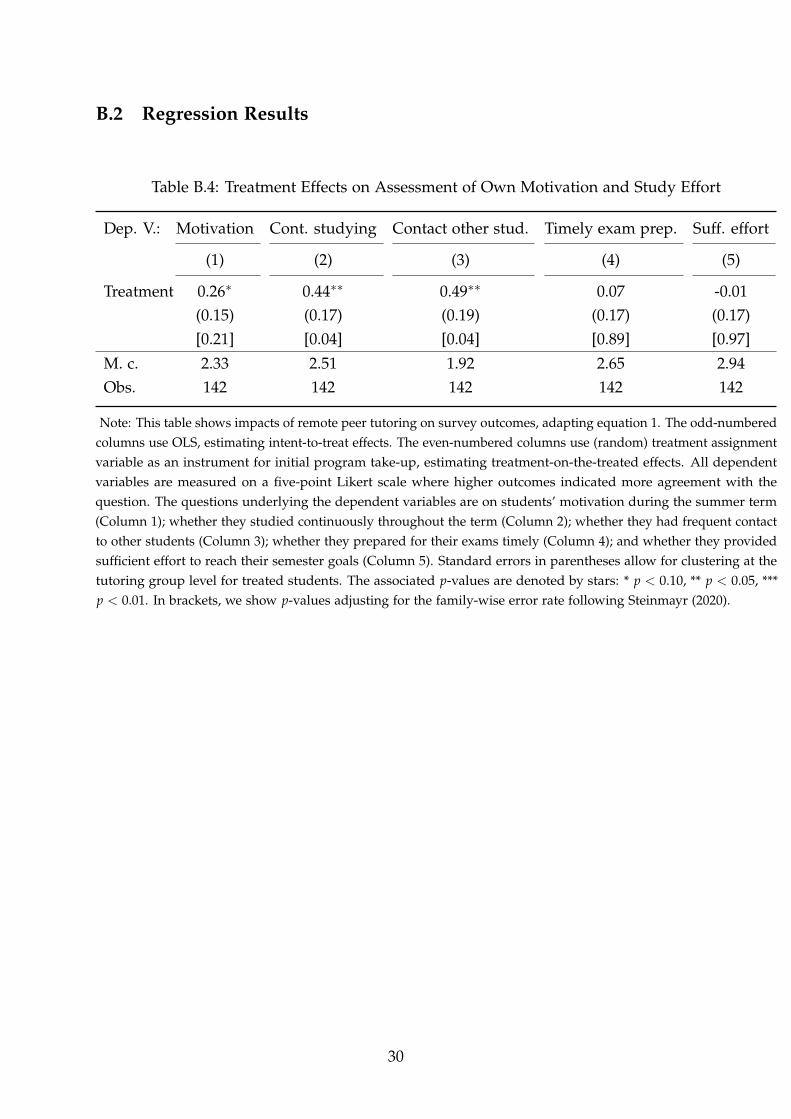
Table B.4: Treatment Effects on Assessment of Own Motivation and Study Effort
Dep. V.: Motivation Cont. studying Contact other stud. Timely exam prep. Suff. effort
(1) (2) (3) (4) (5)
Treatment 0.26∗ 0.44∗∗ 0.49∗∗ 0.07 -0.01(0.15) (0.17) (0.19) (0.17) (0.17)[0.21] [0.04] [0.04] [0.89] [0.97]
M. c. 2.33 2.51 1.92 2.65 2.94Obs. 142 142 142 142 142
Note: This table shows impacts of remote peer tutoring on survey outcomes, adapting equation 1. The odd-numberedcolumns use OLS, estimating intent-to-treat effects. The even-numbered columns use (random) treatment assignmentvariable as an instrument for initial program take-up, estimating treatment-on-the-treated effects. All dependentvariables are measured on a five-point Likert scale where higher outcomes indicated more agreement with thequestion. The questions underlying the dependent variables are on students’ motivation during the summer term(Column 1); whether they studied continuously throughout the term (Column 2); whether they had frequent contactto other students (Column 3); whether they prepared for their exams timely (Column 4); and whether they providedsufficient effort to reach their semester goals (Column 5). Standard errors in parentheses allow for clustering at thetutoring group level for treated students. The associated p-values are denoted by stars: * p < 0.10, ** p < 0.05, ***p < 0.01. In brackets, we show p-values adjusting for the family-wise error rate following Steinmayr (2020).
30

Tabl
eB.
5:Tr
eatm
ent
Effe
cts
on(M
enta
l)H
ealt
hO
utco
mes
Dep
ende
ntV
aria
ble:
Hap
pine
ssSt
ress
Anx
iety
Dep
ress
ion
Dis
conn
ecte
dSe
nse
ofBe
long
ing
Men
talH
ealt
h
(1)
(2)
(3)
(4)
(5)
(6)
(7)
Trea
t.-0
.00
-0.1
2-0
.10
-0.0
8-0
.05
0.02
0.23
(0.1
9)(0
.20)
(0.1
9)(0
.20)
(0.2
4)(0
.19)
(0.1
6)[0
.98]
[0.9
8][0
.99]
[0.9
8][0
.99]
[0.9
9][0
.59]
M.c
.2.
802.
492.
592.
432.
592.
122.
78O
bs.
142
142
142
142
142
142
142
Not
e:N
ote:
Thi
sta
ble
show
sim
pact
sof
rem
ote
peer
tuto
ring
onm
enta
lhea
lth
surv
eyou
tcom
es,a
dap
ting
equa
tion
1.W
ere
cod
edal
lrep
lies
such
that
high
erva
lues
are
mor
ed
esir
able
.T
heod
d-n
um
bere
dco
lum
nsu
seO
LS,
esti
mat
ing
inte
nt-t
o-tr
eat
effe
cts.
The
even
-nu
mbe
red
colu
mns
use
(ran
dom
)tr
eatm
ent
assi
gnm
ent
vari
able
asan
inst
rum
ent
for
init
ial
pro
gram
take
-up
,es
tim
atin
gtr
eatm
ent-
on-t
he-t
reat
edef
fect
s.A
lld
epen
den
tva
riab
les
are
mea
sure
don
afiv
e-po
int
Lik
ert
scal
ew
here
high
erou
tcom
esin
dic
ated
mor
eag
reem
ent
wit
hth
equ
esti
on.T
hequ
esti
ons
unde
rlyi
ngth
ede
pend
ent
vari
able
sar
eon
stud
ents
’hap
pine
ssdu
ring
the
sum
mer
term
(Col
um
n1)
;th
eir
per
cep
tion
ofst
ress
(Col
um
n2)
;th
eir
leve
lsof
anxi
ety
and
nerv
ousn
ess
(Col
um
n3)
;th
eir
sym
pto
ms
ofd
epre
ssio
n(C
olu
mn
4);t
heir
feel
ings
ofd
isco
nnec
ted
ness
(Col
um
n5)
;the
irse
nse
ofbe
long
ing
(Col
um
n6)
;and
thei
rto
talm
enta
lhe
alth
(Col
umn
7).
Stan
dard
erro
rsin
pare
nthe
ses
allo
wfo
rcl
uste
ring
atth
etu
tori
nggr
oup
leve
lfor
trea
ted
stud
ents
.The
asso
ciat
edp-
valu
esar
ed
enot
edby
star
s:*
p<
0.10
,**
p<
0.05
,***
p<
0.01
.In
brac
kets
,we
show
p-va
lues
adju
stin
gfo
rth
efa
mily
-wis
eer
ror
rate
follo
win
gSt
einm
ayr
(202
0).
31

C Additional Results for Administrative Student Outcomes
C.1 Distribution of Outcomes by Treatment Status
Figure C.1: Average Credits Earned in Micro and Macro by Treatment Status IncludingNon-Participants
59.6
50.6
38.6
20.3
24.726.9
20.1
24.7
34.5
0 5 10Others Control Treatment Others Control Treatment Others Control Treatment0
20
40
60
Rela
tive
freq
uenc
y, in
per
cent
0 5 10
Credits in micro & macro
Note: This figure shows the relative frequency of obtaining certain earned credits in microeconomicsand macroeconomics by treatment status including non-participants represented by “Others”.
32
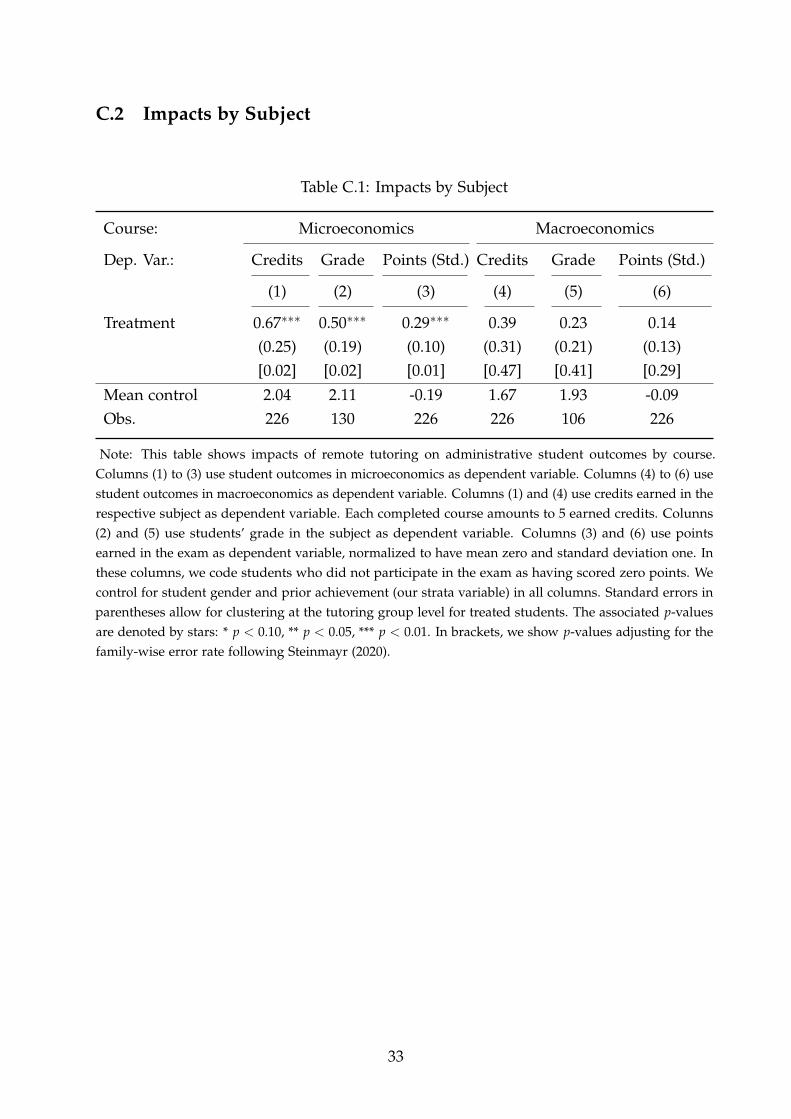
C.2 Impacts by Subject
Table C.1: Impacts by Subject
Course: Microeconomics Macroeconomics
Dep. Var.: Credits Grade Points (Std.) Credits Grade Points (Std.)
(1) (2) (3) (4) (5) (6)
Treatment 0.67∗∗∗ 0.50∗∗∗ 0.29∗∗∗ 0.39 0.23 0.14(0.25) (0.19) (0.10) (0.31) (0.21) (0.13)[0.02] [0.02] [0.01] [0.47] [0.41] [0.29]
Mean control 2.04 2.11 -0.19 1.67 1.93 -0.09Obs. 226 130 226 226 106 226
Note: This table shows impacts of remote tutoring on administrative student outcomes by course.Columns (1) to (3) use student outcomes in microeconomics as dependent variable. Columns (4) to (6) usestudent outcomes in macroeconomics as dependent variable. Columns (1) and (4) use credits earned in therespective subject as dependent variable. Each completed course amounts to 5 earned credits. Colunns(2) and (5) use students’ grade in the subject as dependent variable. Columns (3) and (6) use pointsearned in the exam as dependent variable, normalized to have mean zero and standard deviation one. Inthese columns, we code students who did not participate in the exam as having scored zero points. Wecontrol for student gender and prior achievement (our strata variable) in all columns. Standard errors inparentheses allow for clustering at the tutoring group level for treated students. The associated p-valuesare denoted by stars: * p < 0.10, ** p < 0.05, *** p < 0.01. In brackets, we show p-values adjusting for thefamily-wise error rate following Steinmayr (2020).
33
C.3 Effects per Minute of Tutoring
In this subsection, we analyze the effects per minute of tutoring. For that purpose,we run IV regressions using as outcomes credits earned and GPA in the subjectscovered by the program, separately for both subjects. Our main explanatory variableis the total number of minutes of tutoring a student received in the respective subjectover the full term. We instrument this measure of the intensity of tutoring by theindicator for random treatment assignment. The measures of the intensity of tutoringare constructed as follows. First, we use the total number of minutes a studentparticipated in tutoring sessions with or without the tutor obtained from protocolsof the respective zoom sessions. Second, after the end of the program, we surveyedthe tutors on the relative share (in percent) of time they spent on discussing topicsand problems related to either microeconomics or macroeconomics per tutoringgroup. We then derive tutoring group-specific intensity measures from multiplyingthe group-specific total number of minutes of tutoring received with the group-specificpercentage time shares. For control group students, tutoring intensity is coded as 0.We report robust standard errors that allow for clustering at the tutoring group level.
Our survey among tutors documents that the average tutoring group spent about2/3 of the time on microeconomics, and about 1/3 on macroeconomics. Thiscorresponds closely with the findings from Table C.1, showing that about 2/3 ofthe overall impact of the intervention on credits earned in the subjects covered by theprogram (plus 1.06 credits, see Table 3) comes from microeconomics (plus 0.67 credits).
In Table C.2, we show impacts of tutoring per minute. Adjusting the pointestimate in column (1) to reflect a linear probability model instead of credits earnedto facilitate interpretability, we find that 90 minutes of interaction with peers in atutoring group (i.e., one full session in our program) increase the likelihood of passingthe microeconomics exam by 0.0004 × 90 = 0.036, or about 3.6 percentage points.Column (3) shows that the effects are very similar for macroeconomics, although thecoefficient is estimated with more noise. Columns (2) and (4) show correspondingimpacts on students’ grades in microeconomics and macroeconomics. Again, thereare no significant differences between tutoring impacts per minute on micro- andmacroeconomics. We conclude that there is no evidence that our intervention wasdifferentially effective between subjects once we control for differences in the intensityof tutoring.
Note that given the average performance of control group students in microeconomics,one would need fewer than 3 sessions of 90 minutes each in the subject to shift thesestudents to more likely pass the course than not. Because of the lower averageperformance of students in macro, one would need over 7 sessions to shift these
34

Table C.2: Average Impacts of Minutes of Tutoring on Student Outcomes
Micro Macro
Dependent Variable: Pass Grade Pass Grade
(1) (2) (3) (4)
Treatment 0.0004∗∗∗ 0.0011∗∗∗ 0.0004 0.0009(0.0001) (0.0004) (0.0003) (0.0008)
Mean control 0.41 2.11 0.33 1.93Mean duration treat. 360.42 360.42 202.45 202.45Obs. 226 130 226 106
Note: This table shows impacts of IV estimates of the overall intensity of remotetutoring (measured in overall minutes of tutoring over the term) instrumented bythe random treatment assignment on administrative student outcomes in treatedand non-treated subjects. In column (1), we show impacts on the probabilityto pass the exam in microeconomics, and in Column (2) on students’ grade inmicroeconomics. The number of observations differs from Column (1) sincenot all students earn credits in this subject. Column (3) shows impacts on theprobability to pass the exam in macroeconomics, and Column (4) on students’grade in macroeconomics, again with a differing number of observations dueto non-participation in the exam. Standard errors in parentheses allow forclustering at the tutoring group level for treated students. As a benchmark, wealso show the mean intensity of tutoring in the treatment group per subject.* p < 0.10, ** p < 0.05, *** p < 0.01
student to rather than not pass the course. These analyses suggest that tutoring is avery effective way to improve student outcomes.
35

C.4 Impacts by Credits Earned in Winter Term
Table C.3: Heterogeneity by credits earned in winter term
Panel A: Credits earned in Micro & Macro
Interaction First tercile Second tercile Third tercile
(1) (2) (3) (4)
Treatment 1.11 0.78 2.20∗∗∗ -0.07(0.85) (0.67) (0.79) (0.78)
Treatment · credits (WT) -0.00(0.04)
Mean control 3.70 0.48 2.34 7.68Obs. 226 57 91 78
Panel B: GPA in Micro & Macro
Interaction First tercile Second tercile Third tercile
Treatment -0.20 0.44 0.42 0.27(0.48) (0.76) (0.28) (0.20)
Treatment · credits (WT) 0.02(0.02)
Mean control 1.99 0.77 1.59 2.42Obs. 152 16 63 73
Note: This table shows impacts of remote tutoring on administrative student outcomes by priorstudent performance as measured by credits earned in the winter term. In Panel (A), we show impactson credits earned in micro- and macroeconomics, the two subjects we treated. Each completed courseamounts to 5 earned credits. Panel (B) shows impacts on students’ GPA across the two subjects. Thenumber of observations differs from Panel (A) since we have several students who do not earn anycredits in these subjects. In both panels, we show the interaction effect in Column (1). In the remainingcolumns, we split the sample by students’ tercile of total earned credits in the winter term, our stratavariables. We control for student gender in all columns. Standard errors in parentheses allow forclustering at the tutoring group level for treated students. * p < 0.10, ** p < 0.05, *** p < 0.01
36

C.5 Endogenous Stratification
Table C.4: Endogenous Stratification
Panel A: Credits earned
Predicted Outcome Group: Low Middle High
(1) (2) (3)
Repeated split sampleCoefficient 0.62 2.29 -0.02Std. Err. 0.58 0.84 0.76
Leave-one-outCoefficient 0.46 2.18 0.08Std. Err. 0.73 1.00 0.84
Panel B: GPA
(1) (2) (3)
Repeated split sampleCoefficient 0.11 0.16 0.54Std. Err. 0.36 0.24 0.23
Leave-one-outCoefficient 0.12 0.08 0.48Std. Err. 0.52 0.41 0.30
Note: This table shows impacts of peer tutoring on administrative student outcomes by students’predicted outcome group (“Group”), following the procedures outlined in Abadie et al. (2018) andusing the Stata package estrat by Ferwerda (2014). We use students’ gender, students’ earned creditsin the winter term, and students’ high-school GPA as predictors. All regressions control for studentgender and earned credits in the winter term. We use 100 RSS repetitions and 500 bootstrap repetitions,with 136 treated and 79 control observations since we do not have students’ high school GPA for 11observations. In Panel A, the “low” group has 72 observations, the “middle” group 71 observations,and the “high” group 72 observations. The “low” group has 61 observations, the “middle” group 62observations, and the “high” group 62 observations in Panel B.
37

C.6 Effects by Student Gender
Table C.5: Tutoring Effectiveness by Student Gender
Panel A: Credits earned in Micro & Macro
Interaction Female Male
(1) (2) (3)
Treatment 1.04 1.08∗∗ 1.02(0.68) (0.54) (0.69)
Treatment · female 0.04(0.83)
Mean control 3.70 3.41 4.00Obs. 226 114 112
Panel B: GPA in Micro & Macro
Interaction Female Male
Treatment 0.27 0.43∗∗ 0.25(0.26) (0.20) (0.26)
Treatment · female 0.17(0.33)
Mean control 1.99 1.86 2.14Obs. 152 78 74
Note: This table shows the impact of tutoring on studentoutcomes by gender. Panel A uses the number of credits earnedin microeconomics and macroeconomics in the summer term2021 as the dependent variable. Panel B uses students’ GPA inmicroeconomics and macroeconomics in the summer term 2021as the dependent variable. All columns control for the numberof credits earned in the winter term and the first column alsocontrols for student gender. Standard errors allow for clusteringat the tutoring group level. * p < 0.10, ** p < 0.05, *** p < 0.01
38

C.7 Tutoring Differences by Tutor Gender
In this subsection, we provide descriptive evidence on differences in tutoring by tutorgender. Table C.6 shows impacts of having a female tutor on credits for which studentsregistered in the summer term, credits earned, and GPA. If anything, male tutors seemto be a bit more efficient. This is more pronounced for male tutees, whose performanceunder tutoring also differs substantially more across their tutor’s gender. For femalestudents, tutor gender does not seem to matter much. Our findings therefore showpartial support for results in the literature that matching characteristics of students andinstructors improves student learning (Dee, 2005, 2007; Hoffmann and Oreopoulos,2009). The results are noisy, however.
Table C.6: Tutoring Effectiveness by Tutor Gender
DependentVariable:
Credits earned in Micro & Macro
Female tutor Male tutor Female tutor Male tutor
(1) (2) (3) (4)
Treatment 0.79 1.34∗∗∗ 0.57 1.64∗∗
(0.57) (0.51) (0.82) (0.74)Treatment · female 0.45 -0.56
(1.00) (0.95)
Mean control 3.70 3.70 3.70 3.70Obs. 151 156 151 156
Note: This table shows the impact of tutor gender on outcomes. All columns use the numberof credits earned in microeconomics and macroeconomics in the summer term 2021 as thedependent variable. Columns (1) and (3) use students tutored by female and Columns (2) and(4) use students tutored by male tutors as the treatment group. All columns use non-tutoredstudents as control group. All columns control for the number of credits earned in the winterterm and for student gender. Standard errors allow for clustering at the tutoring group level.* p < 0.10, ** p < 0.05, *** p < 0.01
39

C.8 Effects by Tutor Seniority
Table C.7: Tutoring Effectiveness by Tutor Seniority
Dependent Variable: Credits earned in Micro & Macro
6th term tutor 4th term tutor
(1) (2)
Treatment 1.14∗ 1.04∗∗
(0.59) (0.51)
Mean control 3.70 3.70Obs. 148 159
Note: This table shows the impact of tutoring on student outcomes bytutor seniority. Column (1) uses as treament group students tutored bytutors in their 6th term, while Column (2) uses students tutored by tutorsin their 4th term. Both columns use untreated students as control group.All columns use the number of credits earned in microeconomics andmacroeconomics in the summer term 2021 as the dependent variable. Allcolumns control for the number of credits earned in the winter term andfor student gender. Standard errors allow for clustering at the tutoringgroup level. * p < 0.10, ** p < 0.05, *** p < 0.01
40
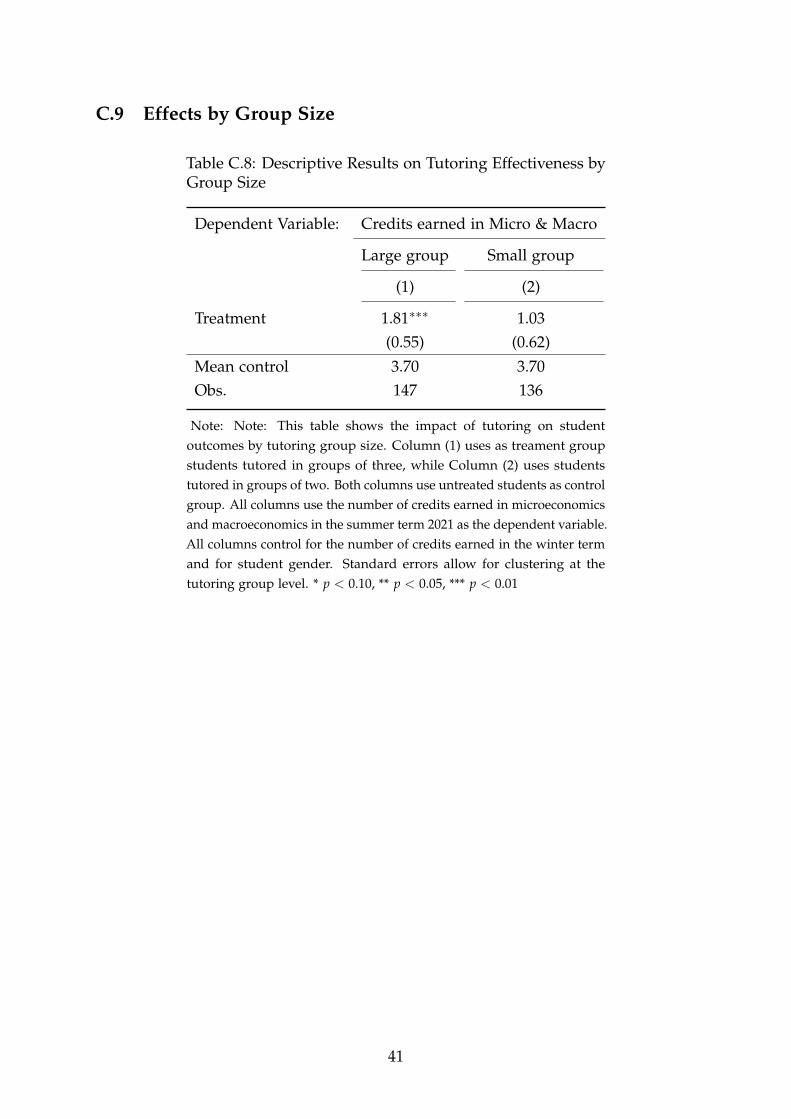
C.9 Effects by Group Size
Table C.8: Descriptive Results on Tutoring Effectiveness byGroup Size
Dependent Variable: Credits earned in Micro & Macro
Large group Small group
(1) (2)
Treatment 1.81∗∗∗ 1.03(0.55) (0.62)
Mean control 3.70 3.70Obs. 147 136
Note: Note: This table shows the impact of tutoring on studentoutcomes by tutoring group size. Column (1) uses as treament groupstudents tutored in groups of three, while Column (2) uses studentstutored in groups of two. Both columns use untreated students as controlgroup. All columns use the number of credits earned in microeconomicsand macroeconomics in the summer term 2021 as the dependent variable.All columns control for the number of credits earned in the winter termand for student gender. Standard errors allow for clustering at thetutoring group level. * p < 0.10, ** p < 0.05, *** p < 0.01
41