Embed Size (px)
Citation preview
Copyright© 2015 by Turbomachinery Laboratory, Texas A&M Engineering Experiment Station
INTRODUCTION OF A NEW FAMILY OF STEAM TURBINE LOW PRESSURE STAGES – A COMPREHENSIVEREVIEW OF 10 YEARS OF EXPERIENCE IN DESIGN, MANUFACTURING, EXPERIMENTAL VALIDATION ANDFIELD APPLICATION
Lorenzo CosiLorenzo CosiGeneral Electric Company, GE Oil&GasVia Matteucci 2, Florence, 50127 , Italy
Lorenzo Cosi is the manager of the SteamTurbine New Product Introduction group atGE O&G in Firenze. His organization isresponsible for the design, validation andindustrialization of the new steam turbinecomponents. Lorenzo Cosi holds a masterdegree in mechanical Engineering from theUniversity of Firenze. He is also a memberof the ASME Turbo Expo Steam Turbine
committee where he is promoting the collaboration betweenacademia and manufacturers in the development of IndustrialSteam Turbine technology.
ABSTRACT
Low Pressure stage design characteristics play a key role insteam turbine product line as they typically set limits to themaximum turbine flow and rotating speed and have a stronginfluence on the overall turbine efficiency.LP stages design presents a combination of structural andaerodynamics challenges that oblige the manufacturers todevelop and test the design well in advance with respect to theturbine design schedule.For the same reason (development complexity) an LP stagesdesign is usually scaled to cover a wide range of rotating speedand annulus area. The set of scaled LP stage is referred to as LPstage family.10 years ago the author’s company has started the design of anew family of LP stages for power generation and mechanicaldrive application. The initial phase of the development hasfocused on the design, manufacturing and experimentalvalidation (wheel box test and full scale turbine test) of themaster size for the reaction product line. Then master sizedesign has been scaled to generate a wide family of LP stages.In parallel to this activity the application of this LP stage familyon the impulse product line has been carried out leading to ahybrid rotor design. Eventually the dynamic behavior of thescaled blades design has been experimentally validatedemploying a combination of strain gages and tip timingfrequency test.This paper will present a comprehensive review of all thephases of development and the major experimental results onthe master and on the scaled designs with the intent to share thekey technical aspects involved in the development of thiscomponents.
INTRODUCTION
Hystorical trends shows that most of the Oil & Gas industries inwhich Mechanical Drive steam turbines are applied follow acontinuous increase of size driven by the economy of scaleeffect. A practical example of this is the Ethylene and Fertilizermarkets. Plant capacity for production of Ethylene is followinga trend which began in the 60’s. From initial values of 200-300kton/y plants are now approaching outputs between 1.5 and 2Mt/y. The global demand for fertilizer, specifically thesynthesis of Ammonia and Urea, has seen a large increase inthe last 25 years and the capacity of these plants hasdramatically increased from the original 200-300 tons per dayto the current daily production of 2000 tons per day. This plantsize growth along with the continuous research of better trade-off between investment and operating cost is pushing theturbomachinery toward larger sizes, higher componentefficiency and higher rotating speed (the so called powerdensity approach). Speed increase, is beneficial in turbocompressor applications because the impeller diameter and thenumber of compression stages can be reduced keeping the samecompression efficiencyOn the industrial Power Generation industry side energyconversion efficiency, initial investment cost and flexibility arethe main drivers of the technology development. Rotating speedincrease (for a given annulus area) is an advantage also forpower generation application. Higher peripheral speed allowsincreased enthalpy drop on the upstream stages whilemaintaining the optimal stage aerodynamic load coefficient.The result is a 10-20% of stage reduction depending on thesteam path selection.Industrial steam turbine customers (both in MD and PGapplications) demand for a customized product capable to fitinto their plants closing the steam balance cycle. For this reasonin this market a full standardization of the product it is notpossible and different approaches to optimize the performanceand keep delivery time and cost under control has beenfollowed in the ST Industry.Steam turbines manufacturers follows a standard/custom mixedapproach in which some components are optimized on theproject basis (within a pre-determined design space), and othercomponents are selected from standard libraries. For exampleHP/IP stages are optimized on the basis of the customer cycledata targeting the optimal flow and work coefficients and
Copyright© 2015 by Turbomachinery Laboratory, Texas A&M Engineering Experiment Station
keeping mechanical design parameters within a wellexperienced design space. This is usually done with automaticprocedures which iterate between aero design and mechanicalverifications. A similar approach is followed for the outercasing design. In this case the casting is customized composingstandard patterns therefore for each project a different andoptimized casing can be selected. On the contrary LP stages arepart of the standard components families because as welldescribed by Gyarmathy their development present manyaerodynamic and mechanical design challenges that require aquite extensive design and testing activities which would not becompatible with the standard projects schedule.Usually the LP section rotating speed capability limits thecapability of the turbine because last stage blades have thehighest A∙N^2. Also in terms of efficiency LP stages have a significant impact on the entire turbine since they deliver from20% to 40% of the power depending on the steam balance ofthe machine. Therefore an improve in LP stages capability andperformance has a significant effect on the entire turbine but tofully exploit its benefit the match between the new section andthe rest of the product structure has to be carefully taken intoaccount since the beginning of the project.To respond to the industry requirements of increased rotatingspeed and higher efficiency, 10 years ago the author companyhas started the development of a new generation of LowPressure blades for MD and PG applications. The new designfeatures a 60% increase in A∙N^2 and a 6 points increase in section efficiency with respect to the traditional design. Thisnew generation of blades has been scaled in order to produce agiven number of sizes and thus to cover a wide range of exitannulus areas. The overall family is ranging from the 8’’(height of the last rotating blades) running at 11250 rpm to the25’’ last stage blade running at 3600 rpm and suitable for the60 Hz power gen market.
DESIGN SPACE DEFINITION
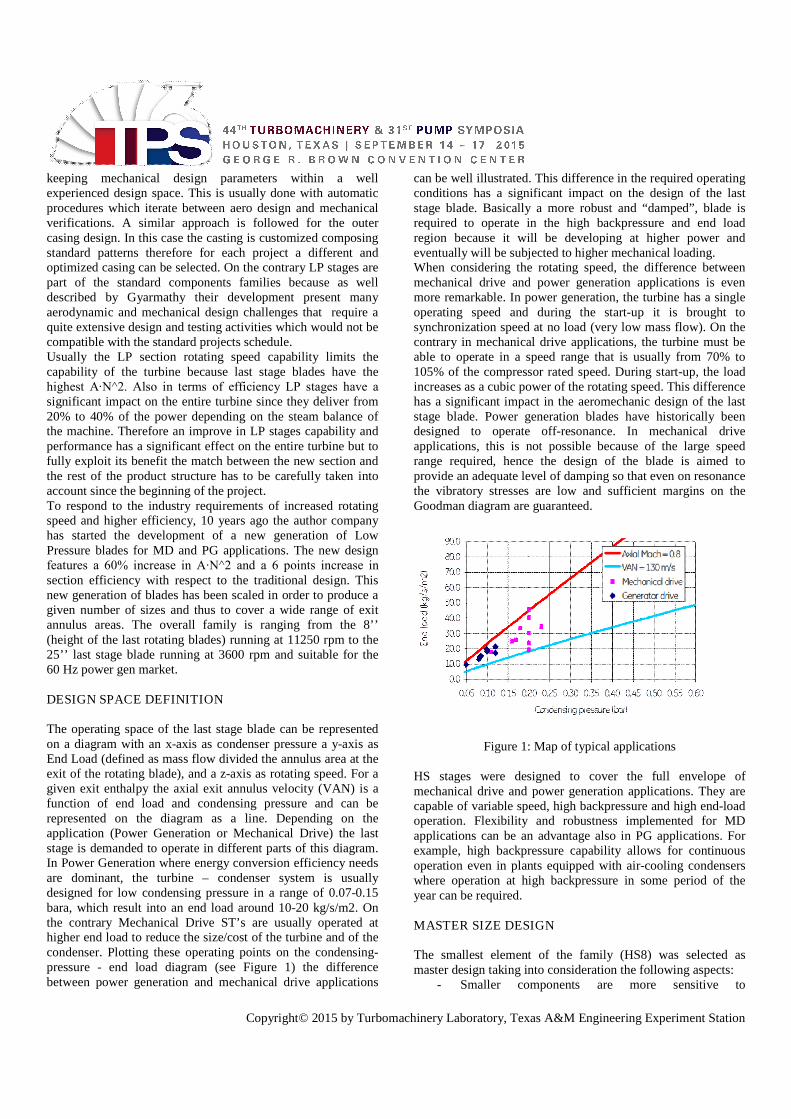
The operating space of the last stage blade can be representedon a diagram with an x-axis as condenser pressure a y-axis asEnd Load (defined as mass flow divided the annulus area at theexit of the rotating blade), and a z-axis as rotating speed. For agiven exit enthalpy the axial exit annulus velocity (VAN) is afunction of end load and condensing pressure and can berepresented on the diagram as a line. Depending on theapplication (Power Generation or Mechanical Drive) the laststage is demanded to operate in different parts of this diagram.In Power Generation where energy conversion efficiency needsare dominant, the turbine – condenser system is usuallydesigned for low condensing pressure in a range of 0.07-0.15bara, which result into an end load around 10-20 kg/s/m2. Onthe contrary Mechanical Drive ST’s are usually operated athigher end load to reduce the size/cost of the turbine and of thecondenser. Plotting these operating points on the condensing-pressure - end load diagram (see Figure 1) the differencebetween power generation and mechanical drive applications
can be well illustrated. This difference in the required operatingconditions has a significant impact on the design of the laststage blade. Basically a more robust and “damped”, blade isrequired to operate in the high backpressure and end loadregion because it will be developing at higher power andeventually will be subjected to higher mechanical loading.When considering the rotating speed, the difference betweenmechanical drive and power generation applications is evenmore remarkable. In power generation, the turbine has a singleoperating speed and during the start-up it is brought tosynchronization speed at no load (very low mass flow). On thecontrary in mechanical drive applications, the turbine must beable to operate in a speed range that is usually from 70% to105% of the compressor rated speed. During start-up, the loadincreases as a cubic power of the rotating speed. This differencehas a significant impact in the aeromechanic design of the laststage blade. Power generation blades have historically beendesigned to operate off-resonance. In mechanical driveapplications, this is not possible because of the large speedrange required, hence the design of the blade is aimed toprovide an adequate level of damping so that even on resonancethe vibratory stresses are low and sufficient margins on theGoodman diagram are guaranteed.
Figure 1: Map of typical applications
HS stages were designed to cover the full envelope ofmechanical drive and power generation applications. They arecapable of variable speed, high backpressure and high end-loadoperation. Flexibility and robustness implemented for MDapplications can be an advantage also in PG applications. Forexample, high backpressure capability allows for continuousoperation even in plants equipped with air-cooling condenserswhere operation at high backpressure in some period of theyear can be required.
MASTER SIZE DESIGN
The smallest element of the family (HS8) was selected asmaster design taking into consideration the following aspects:
- Smaller components are more sensitive to
Copyright© 2015 by Turbomachinery Laboratory, Texas A&M Engineering Experiment Station
manufacturing tolerances therefore scaling up it isalways a safer and easier process
- Smaller components would have allowed reducing theprocurement time for hardware manufacturing andvalidation
- Given the high end-load design specification of thisfamily full load testing requires such a high steamflow that choosing the minimum size would havecontributed to contain testing cost.
Low Pressure stages design process is based on iterationbetween aerodynamics and mechanical design. A summary ofthe design process adopted at each iteration is reported in thefollowing paragraphs.
Aerodynamic Design
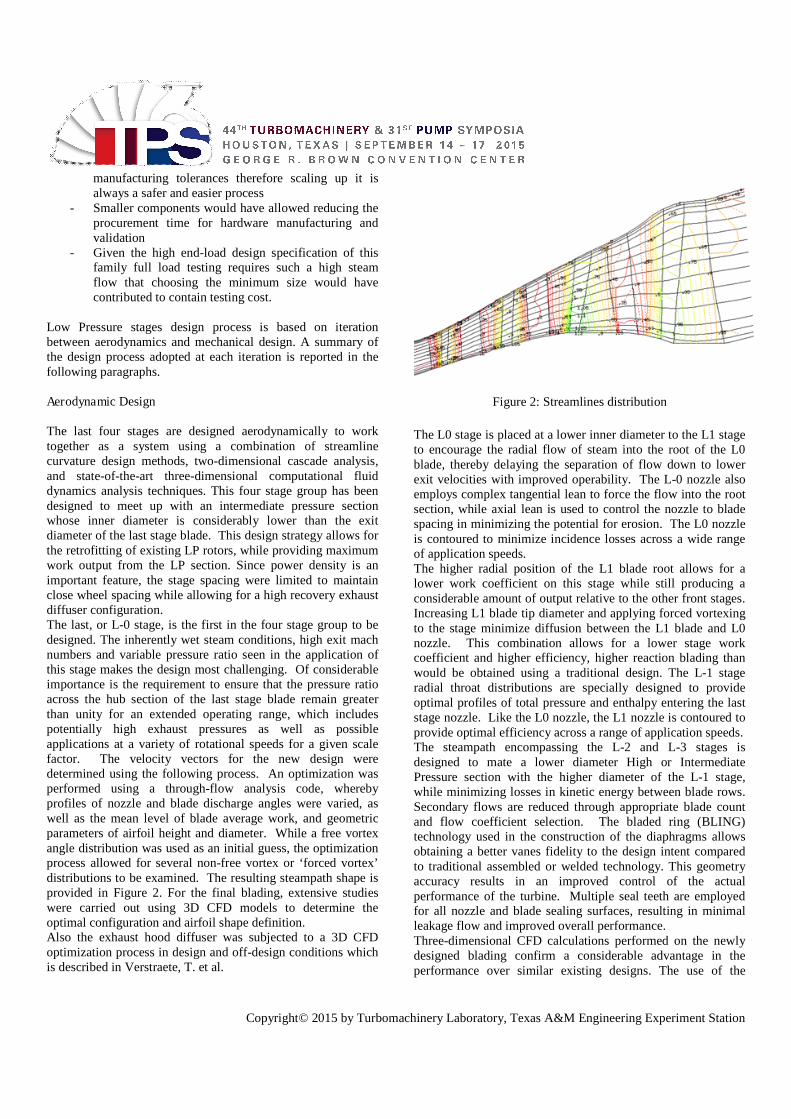
The last four stages are designed aerodynamically to worktogether as a system using a combination of streamlinecurvature design methods, two-dimensional cascade analysis,and state-of-the-art three-dimensional computational fluiddynamics analysis techniques. This four stage group has beendesigned to meet up with an intermediate pressure sectionwhose inner diameter is considerably lower than the exitdiameter of the last stage blade. This design strategy allows forthe retrofitting of existing LP rotors, while providing maximumwork output from the LP section. Since power density is animportant feature, the stage spacing were limited to maintainclose wheel spacing while allowing for a high recovery exhaustdiffuser configuration.The last, or L-0 stage, is the first in the four stage group to bedesigned. The inherently wet steam conditions, high exit machnumbers and variable pressure ratio seen in the application ofthis stage makes the design most challenging. Of considerableimportance is the requirement to ensure that the pressure ratioacross the hub section of the last stage blade remain greaterthan unity for an extended operating range, which includespotentially high exhaust pressures as well as possibleapplications at a variety of rotational speeds for a given scalefactor. The velocity vectors for the new design weredetermined using the following process. An optimization wasperformed using a through-flow analysis code, wherebyprofiles of nozzle and blade discharge angles were varied, aswell as the mean level of blade average work, and geometricparameters of airfoil height and diameter. While a free vortexangle distribution was used as an initial guess, the optimizationprocess allowed for several non-free vortex or ‘forced vortex’distributions to be examined. The resulting steampath shape isprovided in Figure 2. For the final blading, extensive studieswere carried out using 3D CFD models to determine theoptimal configuration and airfoil shape definition.Also the exhaust hood diffuser was subjected to a 3D CFDoptimization process in design and off-design conditions whichis described in Verstraete, T. et al.
Figure 2: Streamlines distribution
The L0 stage is placed at a lower inner diameter to the L1 stageto encourage the radial flow of steam into the root of the L0blade, thereby delaying the separation of flow down to lowerexit velocities with improved operability. The L-0 nozzle alsoemploys complex tangential lean to force the flow into the rootsection, while axial lean is used to control the nozzle to bladespacing in minimizing the potential for erosion. The L0 nozzleis contoured to minimize incidence losses across a wide rangeof application speeds.The higher radial position of the L1 blade root allows for alower work coefficient on this stage while still producing aconsiderable amount of output relative to the other front stages.Increasing L1 blade tip diameter and applying forced vortexingto the stage minimize diffusion between the L1 blade and L0nozzle. This combination allows for a lower stage workcoefficient and higher efficiency, higher reaction blading thanwould be obtained using a traditional design. The L-1 stageradial throat distributions are specially designed to provideoptimal profiles of total pressure and enthalpy entering the laststage nozzle. Like the L0 nozzle, the L1 nozzle is contoured toprovide optimal efficiency across a range of application speeds.The steampath encompassing the L-2 and L-3 stages isdesigned to mate a lower diameter High or IntermediatePressure section with the higher diameter of the L-1 stage,while minimizing losses in kinetic energy between blade rows.Secondary flows are reduced through appropriate blade countand flow coefficient selection. The bladed ring (BLING)technology used in the construction of the diaphragms allowsobtaining a better vanes fidelity to the design intent comparedto traditional assembled or welded technology. This geometryaccuracy results in an improved control of the actualperformance of the turbine. Multiple seal teeth are employedfor all nozzle and blade sealing surfaces, resulting in minimalleakage flow and improved overall performance.Three-dimensional CFD calculations performed on the newlydesigned blading confirm a considerable advantage in theperformance over similar existing designs. The use of the
Copyright© 2015 by Turbomachinery Laboratory, Texas A&M Engineering Experiment Station
numerical test bed allows for investigation into the performanceof the new design over a wide range of corrected speeds,Reynolds numbers, and moisture levels. The larger annulusarea and higher speed capability further increases theapplication space of this design, resulting in higher unit output.
Rotating Blades Mechanical Design
The mechanical design process consists of a few interconnectedsteps: transforming the aerodynamic shape of the airfoil into theas-machined one; static design; dynamic design (oraeromechanics design) and erosion design. This section willdescribe those design steps. The design process for this bladingbuilds upon the process reported in Mujezinovic et al. [1], withspecial design calculations and testing to ensure robustnessthrough a greater range of applications.The airfoil shape used in the aerodynamic calculations is theone that the airfoil will assume at the running speed. The low-pressure blades untwist during acceleration from rest to runningspeed. A necessary step during mechanical design is to followan iterative process that seeks a zero-speed airfoil shape, whichyields a shape nearly identical to the aerodynamic shape at theoperating speed. The process is accomplished by using acomputer-implemented finite element method. Since the bladeshave integral covers in this particular design, the maximumcover untwist is limited by a cover-to-cover gap at theassembly.The basic premise in the static design of the blade and wheel isthat both the maximum average stress in all the wheel and bladesections—and the maximum local stress throughout the bladeand the wheel—is maintained under a certain predeterminedlevel. The maximum average stress (assuming fixed materialproperties) determines the overspeed margin: when comparedto the yield strength of the materials (blade and wheel) itdetermines overspeed at which section gross yielding wouldoccur. When compared to the ultimate strength, it determinesoverspeed at which the ductile failure would occur. Maximumlocal stress determines the low cycle fatigue life (number ofcycles to a crack initiation) and also plays a role in the level ofstress corrosion cracking (SCC) risk.The average stresses in blade and wheel can be easilycalculated using the zero-speed blade geometry and computer-implemented finite element method. A relatively unrefinedfinite element mesh is sufficient for such a task. However,concentrated stress calculations— specifically in a dovetailregion—require a very refined finite element mesh in all threedimensions, appropriate boundary condition between the rotorand the blade and the appropriate material model.The simplest approach would be a coupling between matingfinite element nodes on the rotor and blade as a boundarycondition, and linear elastic material model. However, to modelthe actual problem with more fidelity a non-linear analysis wasemployed with contact between blade and wheel modelled andan elastic plastic material model used. In addition, to obtain afinite element mesh of sufficient refinement and reasonable
calculation time, sub-modelling of the dovetail locations withthe highest local stresses was employed. The local stresscalculated in such a way was also used in a fracture analysis.Fracture analysis methods traditionally used in aircraft enginedesigns have been employed to show that the blade/wheelconfiguration meets an acceptable number of cycles before anypotential crack would grow to an unacceptable size.The overspeed capability and life parameters calculated byusing the described method are also compared to the sameparameters in the previous successful designs. In a case when asophisticated analysis was run for the first time on thisparticular design (as it was a case for a fracture analysis) theprevious designs were also analyzed and the results werecompared. In all instances, this design compares favorably tothe previous ones.In variable speed application, the crossings between bladenatural frequencies and a number of multiples of engine speed(so-called per rev lines), will occur in the operating range. Per-rev excitations come from different sources, most of which areassociated with the non- uniformity in the steam path, and havedifferent stimulus intensity. Experience collected in field andtest turbines allows classifying the stimulus intensity of thedifferent per rev lines. Based on this categorization and on thetype of damping device used it is required to avoid crossingsbetween some determined per rev lines and the first modes ofthe blade. Therefore an accurate calculation of the blade rownatural frequencies and a correct choice of the damping devicesare the key points of the aeromechanic design. At this time theblade natural frequency calculations are linear calculations (i.e.,the finite element boundary conditions and material modelshave to be linear) due to the limitation in the methods available.The analysis has to take into account the centrifugal effects inaddition to the inertia and stiffness terms. Since the motions ofthe blades in this particular construction are strongly coupled,both through the cover, a simple calculation of the individualblade properties would lead to false results. Assuming that allthe blades have the same vibratory characteristics (andconsidering tight tolerances on the blade manufacturing that is areasonable assumption), a finite element model of a singleblade and the corresponding wheel sector is constructed. Thismodel is then considered as a basic element in a cyclicallyrepetitive structure that is analysed. Thus the frequency (modal)analysis of the entire row is performed by modelling only onesector of it and applying cyclic symmetry boundary conditions.Using this method, both the single modes (zero nodal diameterand N/2 nodal diameter modes, where N is a number of bladesin the assembly) and double modes (modes of higher nodaldiameter that appear in pairs) are identified.In addition to the synchronous per-rev excitation, long low-pressure blades (in particular last stage blades in some of theoff-design operating regimes) can experience flow inducedvibration and aeroelastic instability. Design solutions dealingwith aeroelastic instability have been primarily empirical innature and specific to a particular application.The design of the L0 stage blade consists of an axial entry
Copyright© 2015 by Turbomachinery Laboratory, Texas A&M Engineering Experiment Station
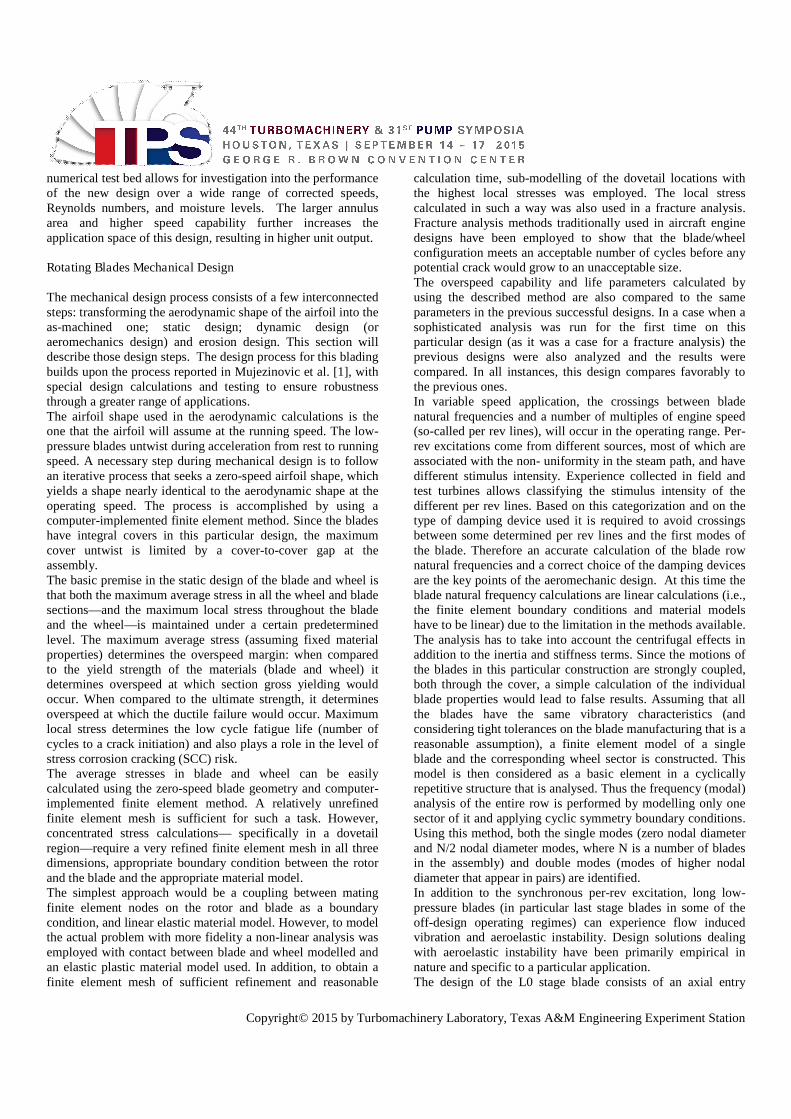
dovetail skewed in the axial-tangential plane. The blade isshrouded at the tip with an integral cover, providing a rigidform of continuous coupling for robust operation. No couplingwas included within the steam path to minimize performancelosses. A lock-wire is used to restrain the blade from axialmotion and springs have been used under the blade dovetails toensure hook engagement at low speed revolutions. The coverwas optimised to provide the lowest possible stresses withoutcompromising the aerodynamic design. The blades have aninitial gap at assembly and rely on blade untwist at speed toestablish the connection. Figure 3 outlines the mechanicaldesign of the L0 stage.The L1 (next to the last), stage blade is composed of a 3Dairfoil, a two hooks axial entry dovetail, and an integral V-shape cover (see Figure 4). On the top part of the cover twoseal teeth are machined realizing a stepped labyrinth sealbetween the blade and the stationary end wall that minimize theleakage losses. Cover geometry has been optimized in order tominimize tip stresses reducing the overhung mass whilekeeping an adequate coverage of the throat area. Blades areassembled with an initial gap between the cover contact faces.This gap is closed at speed in consequence of the cover rotationcaused by the untwist of the blade. Once the covers come incontact, the blades behave like a single continuously coupledstructure which shows a superior stiffness and dampingcharacteristics leading to very low vibratory stresses whencompared to an uncoupled design.L2 and L3 blades (third and fourth to the last), blades arecomposed of a 3D vane, a tangential entry T shape root and a Vshape integral cover (see Figure 5). Tip sealing is realized as astepped labyrinth with strip seals on the stationary end wallwhich mates with cylindrical surfaces on the top of the cover.Blades are assembled with initial pretwist and when the rotor isspun at speed contact forces between the covers increase andthe entire row of blades behave like a continuously coupledstructure.
Figure 3: Solid Model of L0 Stage Blade
Figure 4: Solid Model of L1 Stage Blade
Figure 5: Solid Model of L3 Stage Blade
Stationary part design
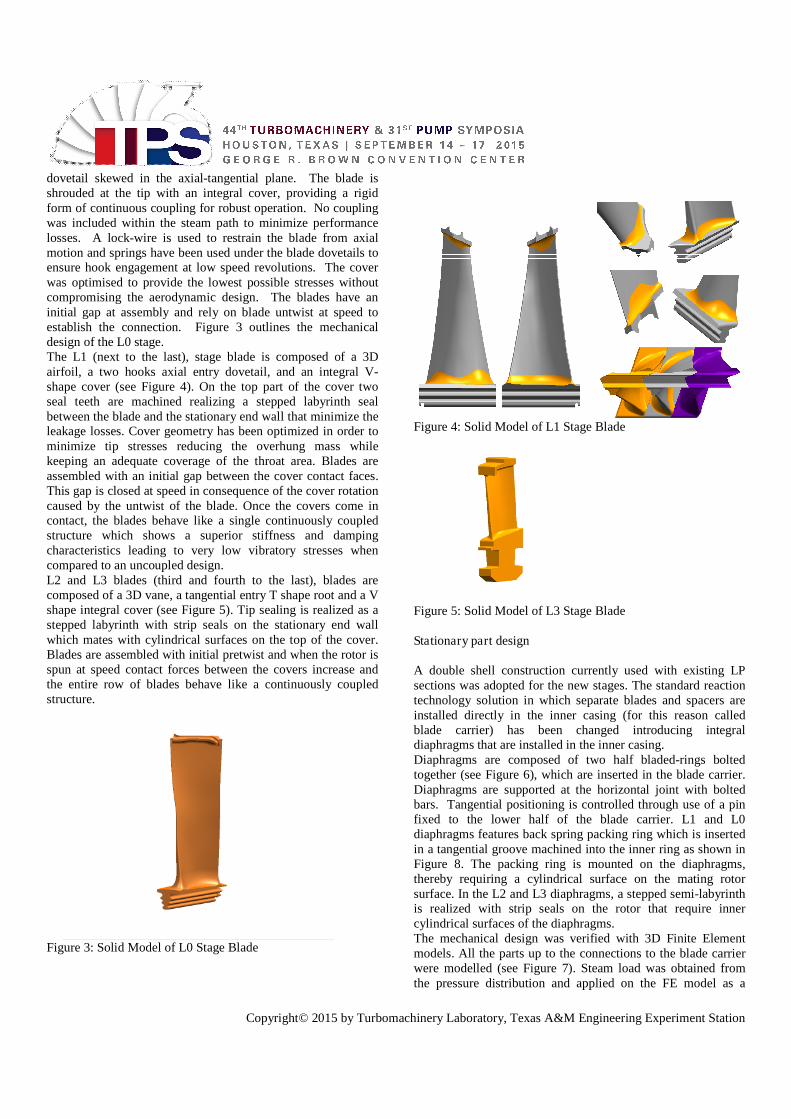
A double shell construction currently used with existing LPsections was adopted for the new stages. The standard reactiontechnology solution in which separate blades and spacers areinstalled directly in the inner casing (for this reason calledblade carrier) has been changed introducing integraldiaphragms that are installed in the inner casing.Diaphragms are composed of two half bladed-rings boltedtogether (see Figure 6), which are inserted in the blade carrier.Diaphragms are supported at the horizontal joint with boltedbars. Tangential positioning is controlled through use of a pinfixed to the lower half of the blade carrier. L1 and L0diaphragms features back spring packing ring which is insertedin a tangential groove machined into the inner ring as shown inFigure 8. The packing ring is mounted on the diaphragms,thereby requiring a cylindrical surface on the mating rotorsurface. In the L2 and L3 diaphragms, a stepped semi-labyrinthis realized with strip seals on the rotor that require innercylindrical surfaces of the diaphragms.The mechanical design was verified with 3D Finite Elementmodels. All the parts up to the connections to the blade carrierwere modelled (see Figure 7). Steam load was obtained fromthe pressure distribution and applied on the FE model as a
Copyright© 2015 by Turbomachinery Laboratory, Texas A&M Engineering Experiment Station
pressure distribution. It was verified that local and averagestresses are well below the allowable values.
Figure 6: L1 Stage Bladed Ring
Figure 7: Finite Elements model of L3 Stage Bladed Ring
Figure 8: Detail of the Packing Ring of L0 Bladed Ring
Layout design
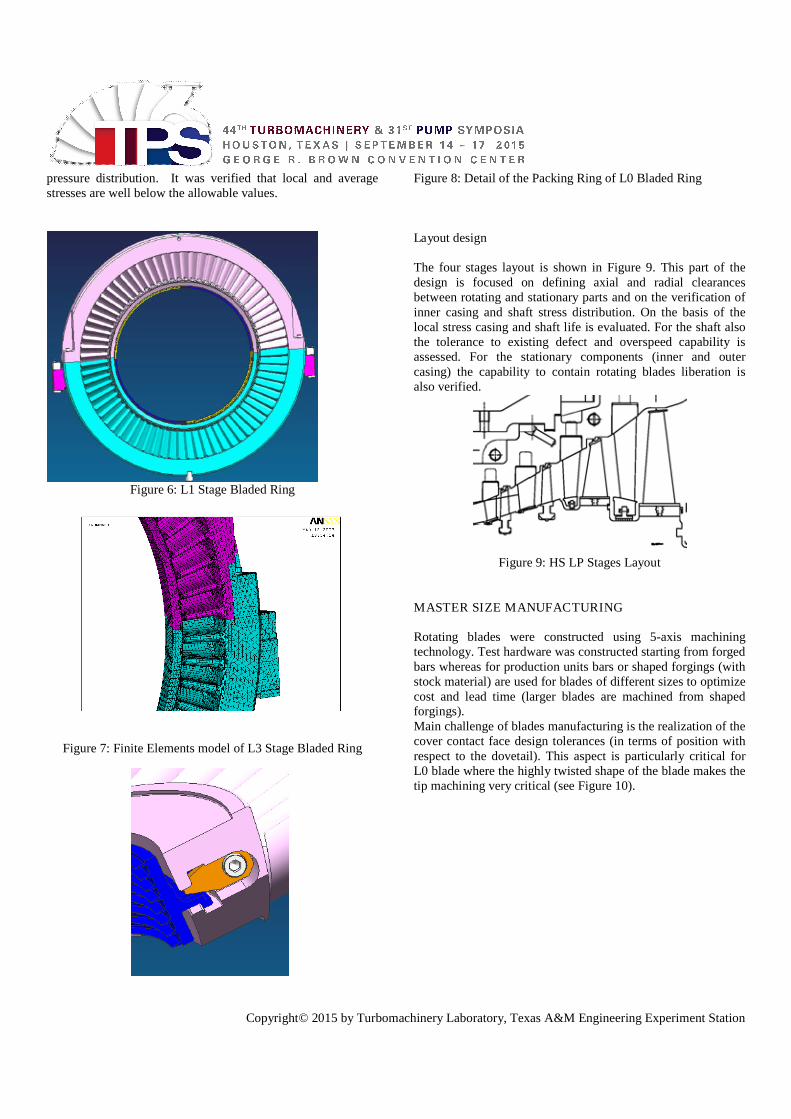
The four stages layout is shown in Figure 9. This part of thedesign is focused on defining axial and radial clearancesbetween rotating and stationary parts and on the verification ofinner casing and shaft stress distribution. On the basis of thelocal stress casing and shaft life is evaluated. For the shaft alsothe tolerance to existing defect and overspeed capability isassessed. For the stationary components (inner and outercasing) the capability to contain rotating blades liberation isalso verified.
Figure 9: HS LP Stages Layout
MASTER SIZE MANUFACTURING
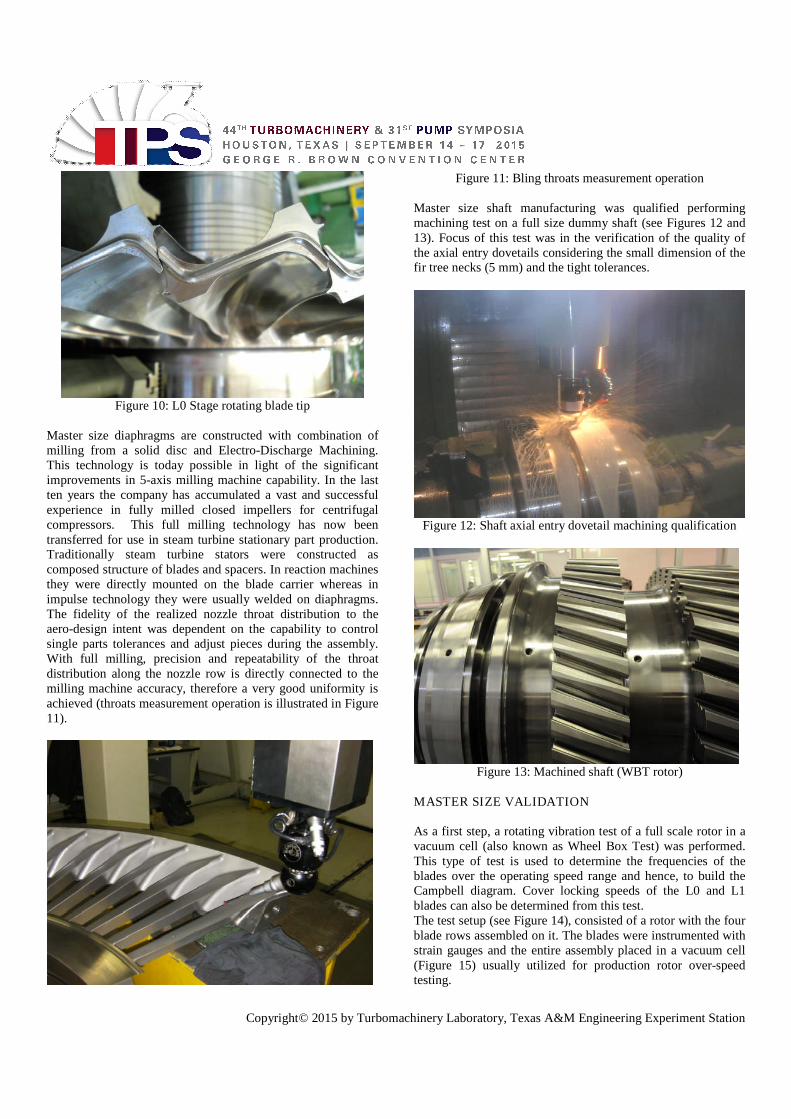
Rotating blades were constructed using 5-axis machiningtechnology. Test hardware was constructed starting from forgedbars whereas for production units bars or shaped forgings (withstock material) are used for blades of different sizes to optimizecost and lead time (larger blades are machined from shapedforgings).Main challenge of blades manufacturing is the realization of thecover contact face design tolerances (in terms of position withrespect to the dovetail). This aspect is particularly critical forL0 blade where the highly twisted shape of the blade makes thetip machining very critical (see Figure 10).
Copyright© 2015 by Turbomachinery Laboratory, Texas A&M Engineering Experiment Station
Figure 10: L0 Stage rotating blade tip
Master size diaphragms are constructed with combination ofmilling from a solid disc and Electro-Discharge Machining.This technology is today possible in light of the significantimprovements in 5-axis milling machine capability. In the lastten years the company has accumulated a vast and successfulexperience in fully milled closed impellers for centrifugalcompressors. This full milling technology has now beentransferred for use in steam turbine stationary part production.Traditionally steam turbine stators were constructed ascomposed structure of blades and spacers. In reaction machinesthey were directly mounted on the blade carrier whereas inimpulse technology they were usually welded on diaphragms.The fidelity of the realized nozzle throat distribution to theaero-design intent was dependent on the capability to controlsingle parts tolerances and adjust pieces during the assembly.With full milling, precision and repeatability of the throatdistribution along the nozzle row is directly connected to themilling machine accuracy, therefore a very good uniformity isachieved (throats measurement operation is illustrated in Figure11).
Figure 11: Bling throats measurement operation
Master size shaft manufacturing was qualified performingmachining test on a full size dummy shaft (see Figures 12 and13). Focus of this test was in the verification of the quality ofthe axial entry dovetails considering the small dimension of thefir tree necks (5 mm) and the tight tolerances.
Figure 12: Shaft axial entry dovetail machining qualification
Figure 13: Machined shaft (WBT rotor)
MASTER SIZE VALIDATION
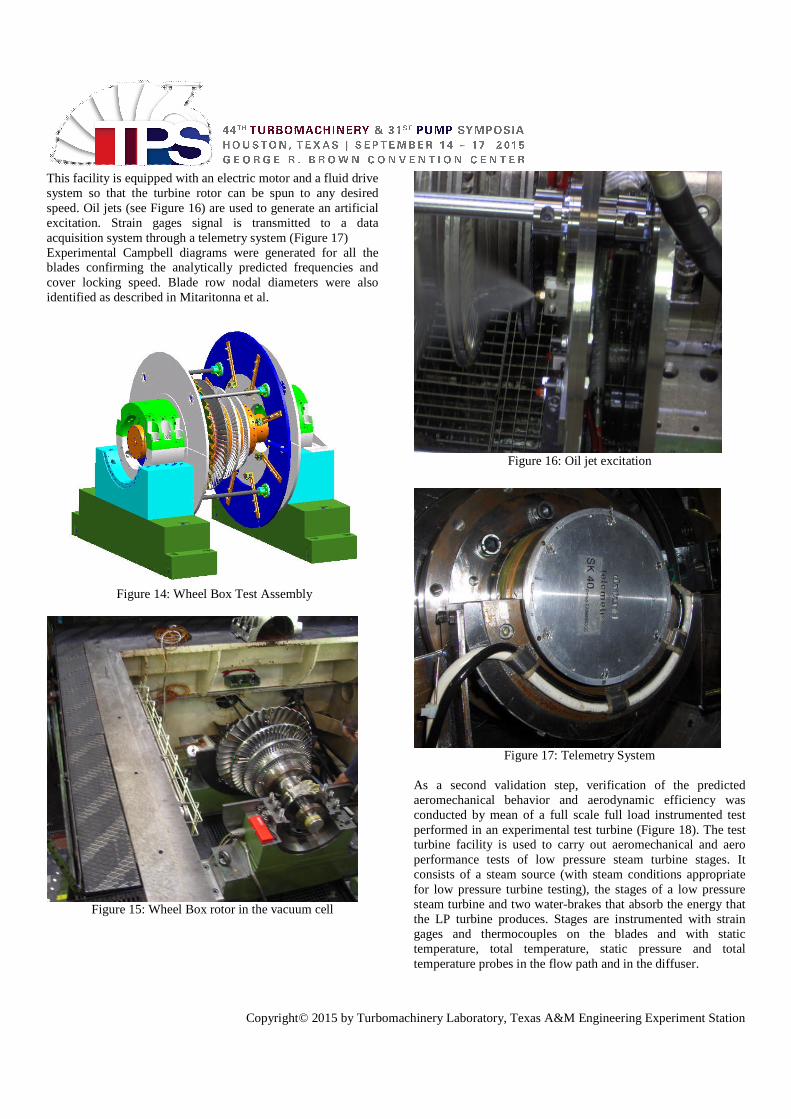
As a first step, a rotating vibration test of a full scale rotor in avacuum cell (also known as Wheel Box Test) was performed.This type of test is used to determine the frequencies of theblades over the operating speed range and hence, to build theCampbell diagram. Cover locking speeds of the L0 and L1blades can also be determined from this test.The test setup (see Figure 14), consisted of a rotor with the fourblade rows assembled on it. The blades were instrumented withstrain gauges and the entire assembly placed in a vacuum cell(Figure 15) usually utilized for production rotor over-speedtesting.
Copyright© 2015 by Turbomachinery Laboratory, Texas A&M Engineering Experiment Station
This facility is equipped with an electric motor and a fluid drivesystem so that the turbine rotor can be spun to any desiredspeed. Oil jets (see Figure 16) are used to generate an artificialexcitation. Strain gages signal is transmitted to a dataacquisition system through a telemetry system (Figure 17)Experimental Campbell diagrams were generated for all theblades confirming the analytically predicted frequencies andcover locking speed. Blade row nodal diameters were alsoidentified as described in Mitaritonna et al.
Figure 14: Wheel Box Test Assembly
Figure 15: Wheel Box rotor in the vacuum cell
Figure 16: Oil jet excitation
Figure 17: Telemetry System
As a second validation step, verification of the predictedaeromechanical behavior and aerodynamic efficiency wasconducted by mean of a full scale full load instrumented testperformed in an experimental test turbine (Figure 18). The testturbine facility is used to carry out aeromechanical and aeroperformance tests of low pressure steam turbine stages. Itconsists of a steam source (with steam conditions appropriatefor low pressure turbine testing), the stages of a low pressuresteam turbine and two water-brakes that absorb the energy thatthe LP turbine produces. Stages are instrumented with straingages and thermocouples on the blades and with statictemperature, total temperature, static pressure and totaltemperature probes in the flow path and in the diffuser.
Copyright© 2015 by Turbomachinery Laboratory, Texas A&M Engineering Experiment Station
Figure 18: Experimental Test Turbine
The aeromechanics test space is a three-dimensional space withthe three critical variables being mass flow, exhaust pressureand turbine speed. Test points are established by fixing themass flow first. With the mass flow constant, the exhaustpressure assumes distinct values between the minimum andmaximum exhaust pressure (in this case between 0.05 and 0.7bara). At each of those combinations of mass flow and exhaustpressure, the speed of the turbine is varied between 50% ofMaximum Continuous Speed 100% of Maximum ContinuousSpeed while acquiring the strain gages data.Main result of the aeromechanics validation consists in themapping of blades vibratory response over the entire operatingrange. Vibratory response is post-processed on a statisticalbasis to take into account blade to blade variability and build tobuild variability. Eventually the experimental Goodmandiagrams of the blades are built for any operating condition. Abroader description of the test set-up and results is presented in“Aeromechanical Validation of a New Steam Turbine LPSection: Test Major Outcomes” by Piraccini et al.Turbine performance is as a function of several operatingparameters, namely: mass flow (Reynolds number), rotatingspeed, condensing pressure and wetness content. For thisreason the performance test is conducted in a set of operatingpoints which are selected in order to map the dependence of theefficiency upon the above parameters.For each point the operating conditions are set and maintaineduntil all the temperatures stabilize and eventually all thepressure probes are purged to remove water lags and the dataare recorded.Data are then post-processed to measure all the performancecharacteristics of the turbine like: section efficiency, individualstages efficiency, diffuser recovery factor and moisture losscontribution.
APPLICATION ON IMPULSE PRODUCT LINE
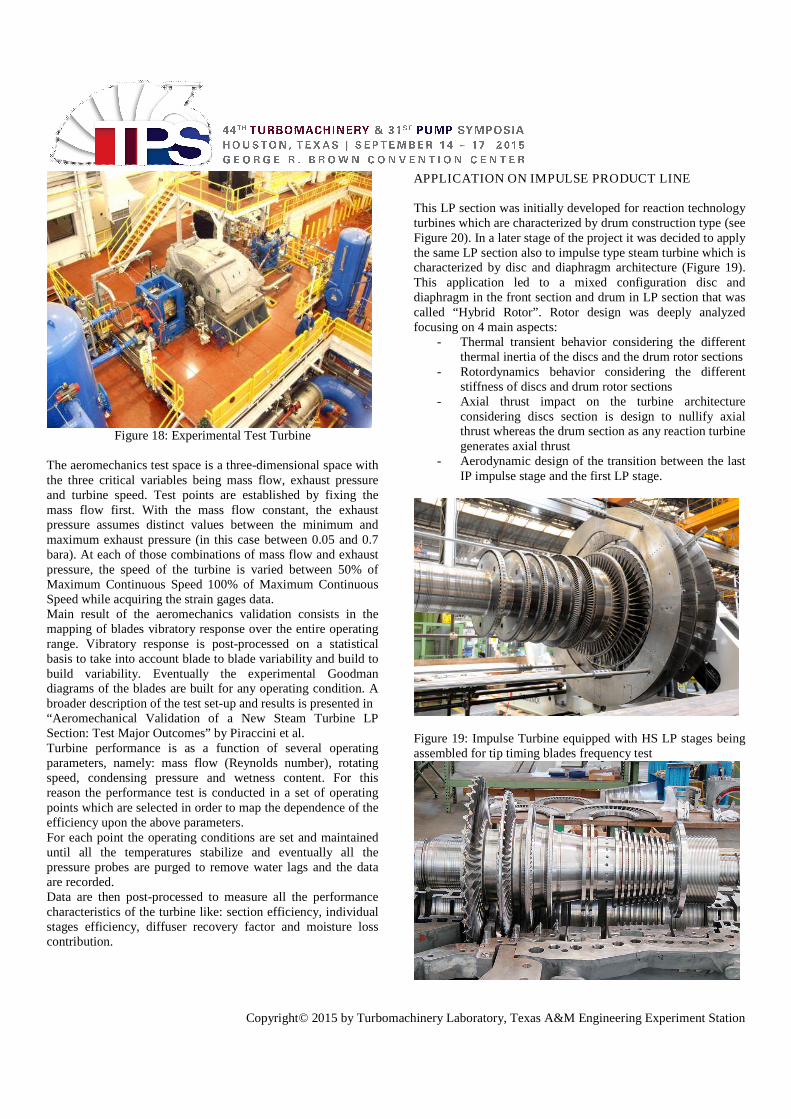
This LP section was initially developed for reaction technologyturbines which are characterized by drum construction type (seeFigure 20). In a later stage of the project it was decided to applythe same LP section also to impulse type steam turbine which ischaracterized by disc and diaphragm architecture (Figure 19).This application led to a mixed configuration disc anddiaphragm in the front section and drum in LP section that wascalled “Hybrid Rotor”. Rotor design was deeply analyzedfocusing on 4 main aspects:
- Thermal transient behavior considering the differentthermal inertia of the discs and the drum rotor sections
- Rotordynamics behavior considering the differentstiffness of discs and drum rotor sections
- Axial thrust impact on the turbine architectureconsidering discs section is design to nullify axialthrust whereas the drum section as any reaction turbinegenerates axial thrust
- Aerodynamic design of the transition between the lastIP impulse stage and the first LP stage.
Figure 19: Impulse Turbine equipped with HS LP stages beingassembled for tip timing blades frequency test
Copyright© 2015 by Turbomachinery Laboratory, Texas A&M Engineering Experiment Station
Figure 20: Reaction turbine with HS LP StagesThermal transient behavior was assessed analyzing the entirerotor by mean of a Finite Element axial symmetric model.Complete warm-up, steady state and shut-down mission wasanalyzed.Rotordynamic was analyzed performing a back to back gravitysag and lateral analysis on a reference unit. The effect of thedrum section is actually to increase the stiffness of the rotor,this is clearly visible from the gravity sag analysis a s shown inFigure 21. This effect is visible also in term of critical speedincrease and amplification factor decrease as shown from theback to back analysis performed on the same unit.
Figure 21: Hybrid Rotor gravity sag analysis
Figure 22: Hybrid Rotor rotordynamic analysis
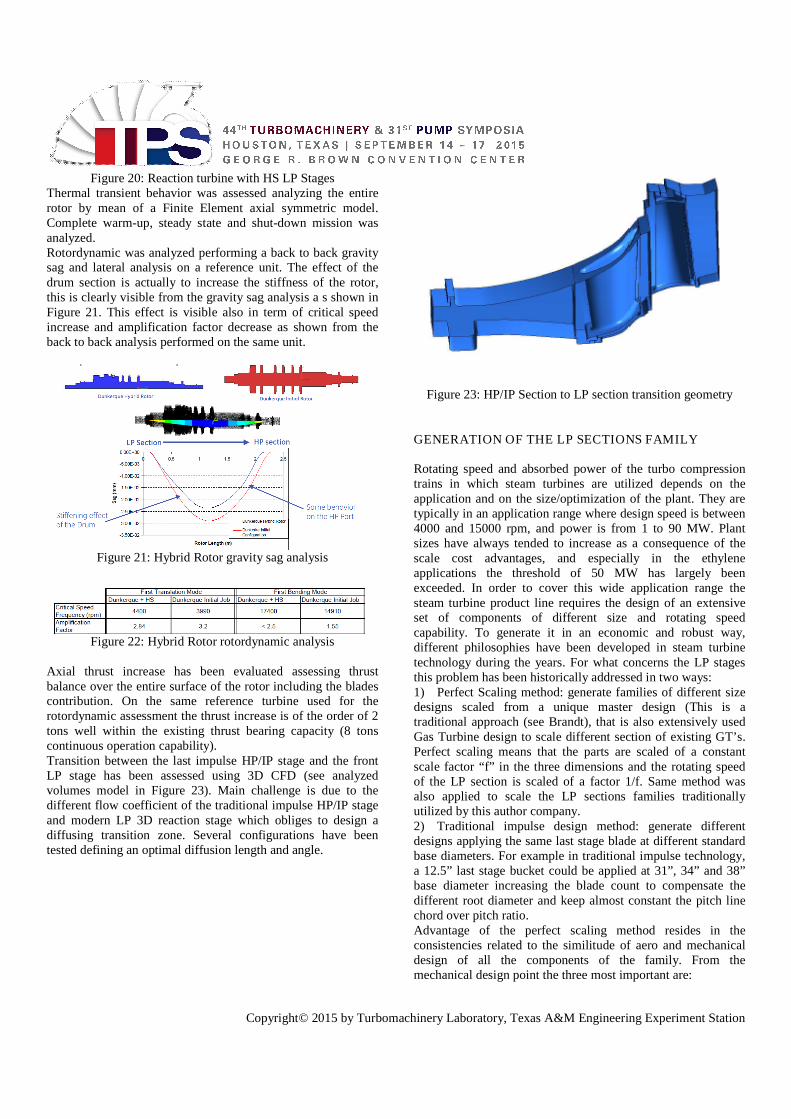
Axial thrust increase has been evaluated assessing thrustbalance over the entire surface of the rotor including the bladescontribution. On the same reference turbine used for therotordynamic assessment the thrust increase is of the order of 2tons well within the existing thrust bearing capacity (8 tonscontinuous operation capability).Transition between the last impulse HP/IP stage and the frontLP stage has been assessed using 3D CFD (see analyzedvolumes model in Figure 23). Main challenge is due to thedifferent flow coefficient of the traditional impulse HP/IP stageand modern LP 3D reaction stage which obliges to design adiffusing transition zone. Several configurations have beentested defining an optimal diffusion length and angle.
Figure 23: HP/IP Section to LP section transition geometry
GENERATION OF THE LP SECTIONS FAMILY
Rotating speed and absorbed power of the turbo compressiontrains in which steam turbines are utilized depends on theapplication and on the size/optimization of the plant. They aretypically in an application range where design speed is between4000 and 15000 rpm, and power is from 1 to 90 MW. Plantsizes have always tended to increase as a consequence of thescale cost advantages, and especially in the ethyleneapplications the threshold of 50 MW has largely beenexceeded. In order to cover this wide application range thesteam turbine product line requires the design of an extensiveset of components of different size and rotating speedcapability. To generate it in an economic and robust way,different philosophies have been developed in steam turbinetechnology during the years. For what concerns the LP stagesthis problem has been historically addressed in two ways:1) Perfect Scaling method: generate families of different sizedesigns scaled from a unique master design (This is atraditional approach (see Brandt), that is also extensively usedGas Turbine design to scale different section of existing GT’s.Perfect scaling means that the parts are scaled of a constantscale factor “f” in the three dimensions and the rotating speedof the LP section is scaled of a factor 1/f. Same method wasalso applied to scale the LP sections families traditionallyutilized by this author company.2) Traditional impulse design method: generate differentdesigns applying the same last stage blade at different standardbase diameters. For example in traditional impulse technology,a 12.5” last stage bucket could be applied at 31”, 34” and 38”base diameter increasing the blade count to compensate thedifferent root diameter and keep almost constant the pitch linechord over pitch ratio.Advantage of the perfect scaling method resides in theconsistencies related to the similitude of aero and mechanicaldesign of all the components of the family. From themechanical design point the three most important are:
Copyright© 2015 by Turbomachinery Laboratory, Texas A&M Engineering Experiment Station
- Campbell diagram apart from small frequency shift relatedto non-perfect scalability of damping effects are the same.- Static stresses are the same and Goodman diagram of thebucket are affected just by a small variation of bucketsvibratory effect that can be introduced by the non-scalability ofdamping and Reynolds number.- There is a significant experience and history ofaeromechanic validation based on scaled model. Therefore thetest of one single component can cover the validation of all thefamilyFrom the aero standpoint the most important relations are thefollowings:
- Stage velocity triangles are the same- Section and stage efficiency are the same apart from
Reynolds effect- Flow function (or Stodola coefficient of the LP
section) is the sameAnother significant advantage is the fact that a very largefamily of components can be generated from a single design.The only disadvantage of this method when compared to thetraditional impulse one is related to the production process. Allthe components of the family have different parts and this doesnot allow any production simplification.Advantages of the traditional impulse method are related to thesimplification of the manufacturing and sourcing process.There is one forging size, one drawing (with multiple set oftabulated dimensions), one set of dovetails cutters, and one setof interchangeable jigs and fixtures. However, since thedesigner needs to set a whole part count, an exact scale part isnever obtained and hence it is necessary to generate a multipleset of tabulated dimensions and slightly different machiningcodes.The disadvantages of this method are related the fact that theaero and mechanical operating conditions of the singlecomponents of the family are different. This has two importanteffects:- There is a limit to the number of components that can begenerated with the same bucket. This is because moving awayfrom the optimum design, bucket frequencies, and static stresschange and cannot easily be compensated by speed variationand aero performance deteriorates.- Aeromechanic validation of all the family cannot beobtained with the test of just one component. The change innozzle and bucket counts from one component of the family toanother and the related change in wakes interaction is a seriousconcern for aeromechanics. Therefore the validation of all thecomponents of the family would be strongly recommended.
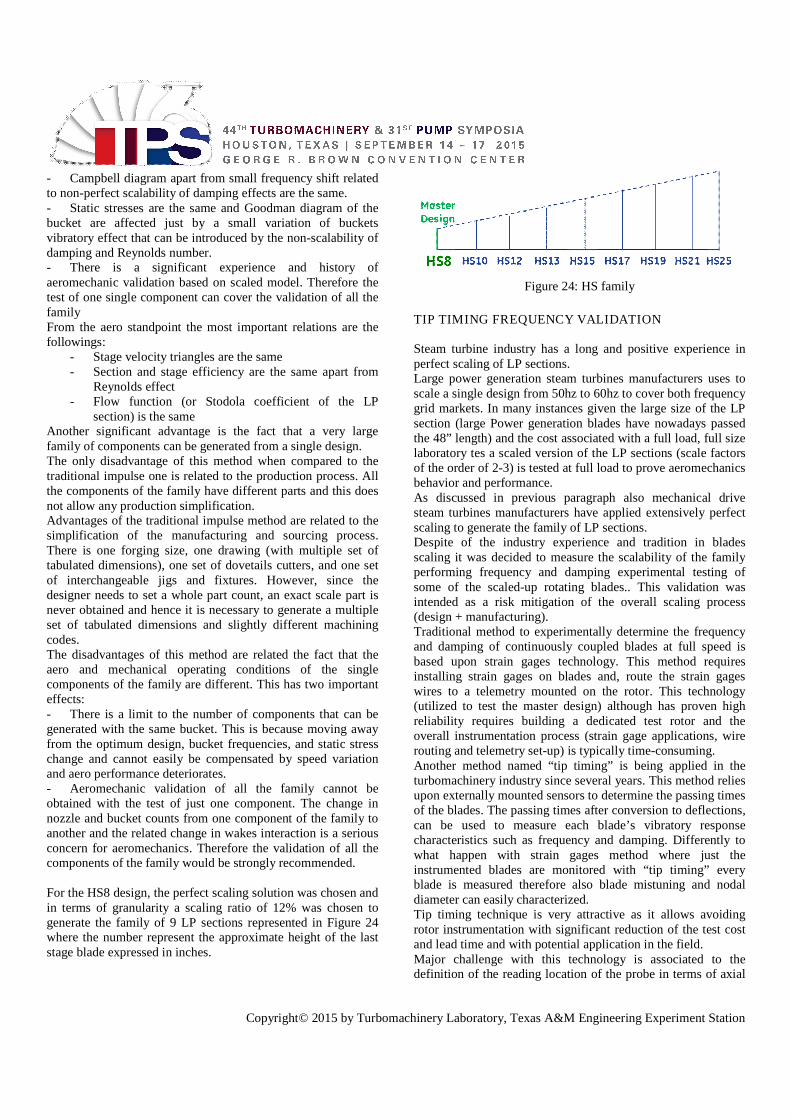
For the HS8 design, the perfect scaling solution was chosen andin terms of granularity a scaling ratio of 12% was chosen togenerate the family of 9 LP sections represented in Figure 24where the number represent the approximate height of the laststage blade expressed in inches.
Figure 24: HS family
TIP TIMING FREQUENCY VALIDATION
Steam turbine industry has a long and positive experience inperfect scaling of LP sections.Large power generation steam turbines manufacturers uses toscale a single design from 50hz to 60hz to cover both frequencygrid markets. In many instances given the large size of the LPsection (large Power generation blades have nowadays passedthe 48” length) and the cost associated with a full load, full sizelaboratory tes a scaled version of the LP sections (scale factorsof the order of 2-3) is tested at full load to prove aeromechanicsbehavior and performance.As discussed in previous paragraph also mechanical drivesteam turbines manufacturers have applied extensively perfectscaling to generate the family of LP sections.Despite of the industry experience and tradition in bladesscaling it was decided to measure the scalability of the familyperforming frequency and damping experimental testing ofsome of the scaled-up rotating blades.. This validation wasintended as a risk mitigation of the overall scaling process(design + manufacturing).Traditional method to experimentally determine the frequencyand damping of continuously coupled blades at full speed isbased upon strain gages technology. This method requiresinstalling strain gages on blades and, route the strain gageswires to a telemetry mounted on the rotor. This technology(utilized to test the master design) although has proven highreliability requires building a dedicated test rotor and theoverall instrumentation process (strain gage applications, wirerouting and telemetry set-up) is typically time-consuming.Another method named “tip timing” is being applied in theturbomachinery industry since several years. This method reliesupon externally mounted sensors to determine the passing timesof the blades. The passing times after conversion to deflections,can be used to measure each blade’s vibratory responsecharacteristics such as frequency and damping. Differently towhat happen with strain gages method where just theinstrumented blades are monitored with “tip timing” everyblade is measured therefore also blade mistuning and nodaldiameter can easily characterized.Tip timing technique is very attractive as it allows avoidingrotor instrumentation with significant reduction of the test costand lead time and with potential application in the field.Major challenge with this technology is associated to thedefinition of the reading location of the probe in terms of axial

Copyright© 2015 by Turbomachinery Laboratory, Texas A&M Engineering Experiment Station
and radial position.Radial distance from the tip of the blade influences the qualityof the measurement, as amplitude of the signal is a function ofthe distance of the probe from the object subjected to measure.In theory would be optimal to position the probe few tenth ofmillimeter from the tip of the blade but this requirement clearlyconflicts with the need of avoiding contact between the bladeand the probe itself. Design engineer must concur with testengineer to define trade-off between these two requirements.Axial position is also important as it drives the sensitivity of theprobes to blade modes. In this case the goal is to position theprobe at the axial location at which for a given vibratory modeblade is expected to show the highest displacement. Hencedesigner must trade off among the different modes and makesure the untwist of the blade and all the contributions to theaxial displacement of the rotor are well captured in the analysis.Accuracy in the determination of the axial position of the proberelative to the blade tip in running condition will have a stronginfluence in the accuracy of the response measurement.
Figure 25: HS15 tip timing and strain gages WBT rotor
Figure 26: HS15 tip timing and strain gages WBT rotor
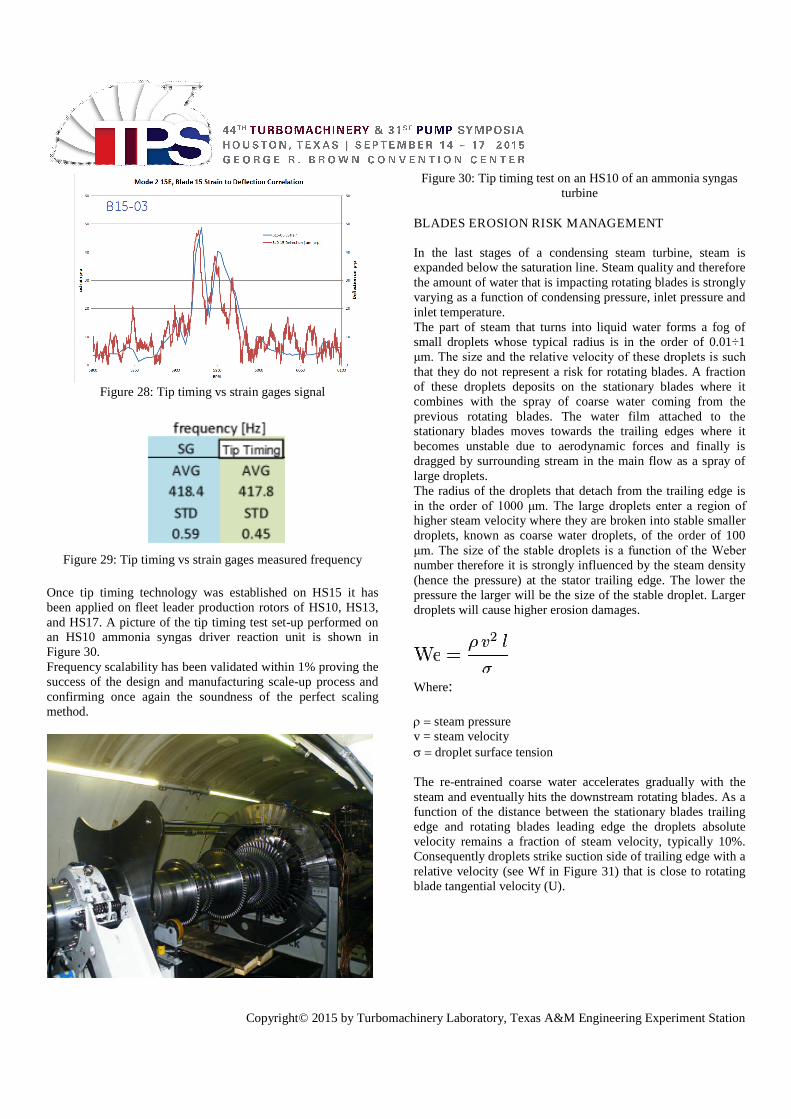
In order to be able to perform the frequency validation direct onfleet leaders production rotors it was decided to establish tiptiming technology building another test rotor. A back to backcomparison Wheel Box Test on HS15 (see Figure 25 and 26)was designed as a mean to select the best tip timing sensors,tune the excitation system and calibrate the tip timingfrequency measurement against strain gages.Three types of tip timing sensors were tested: eddy-current,laser and microwave. Two type of excitations were tested: oiljets and permanent magnets.Blades were also heavily instrumented with strain gages (55)and thermocouples (4) an illustration of L0 bladesinstrumentation is shown in Figure 27.A back to back comparison between the strain gages signal(reference) and the different tip timing probes was performed.Eventually eddy-current probes (with oil jet excitation) wereselected as optimal solution demonstrating very good accuracyand fidelity to the strain gages data. The signal back to backcomparison illustrated in Figure 28 shows how tip timingsensors are able to detect accurately the response peak.Also statistical data (over 20 strain gages) taking as referenceL0 blade 1st mode frequency show a very good consistencybetween strain gages and tip timing measurements (Figure 29).
Figure 27: HS15 WBT L0 stage instrumentation
Copyright© 2015 by Turbomachinery Laboratory, Texas A&M Engineering Experiment Station
Figure 28: Tip timing vs strain gages signal
Figure 29: Tip timing vs strain gages measured frequency
Once tip timing technology was established on HS15 it hasbeen applied on fleet leader production rotors of HS10, HS13,and HS17. A picture of the tip timing test set-up performed onan HS10 ammonia syngas driver reaction unit is shown inFigure 30.Frequency scalability has been validated within 1% proving thesuccess of the design and manufacturing scale-up process andconfirming once again the soundness of the perfect scalingmethod.
Figure 30: Tip timing test on an HS10 of an ammonia syngasturbine
BLADES EROSION RISK MANAGEMENT
In the last stages of a condensing steam turbine, steam isexpanded below the saturation line. Steam quality and thereforethe amount of water that is impacting rotating blades is stronglyvarying as a function of condensing pressure, inlet pressure andinlet temperature.The part of steam that turns into liquid water forms a fog ofsmall droplets whose typical radius is in the order of 0.01÷1μm. The size and the relative velocity of these droplets is such that they do not represent a risk for rotating blades. A fractionof these droplets deposits on the stationary blades where itcombines with the spray of coarse water coming from theprevious rotating blades. The water film attached to thestationary blades moves towards the trailing edges where itbecomes unstable due to aerodynamic forces and finally isdragged by surrounding stream in the main flow as a spray oflarge droplets.The radius of the droplets that detach from the trailing edge isin the order of 1000 μm. The large droplets enter a region of higher steam velocity where they are broken into stable smallerdroplets, known as coarse water droplets, of the order of 100μm. The size of the stable droplets is a function of the Weber number therefore it is strongly influenced by the steam density(hence the pressure) at the stator trailing edge. The lower thepressure the larger will be the size of the stable droplet. Largerdroplets will cause higher erosion damages.
Where:
steam pressurev = steam velocitydroplet surface tension
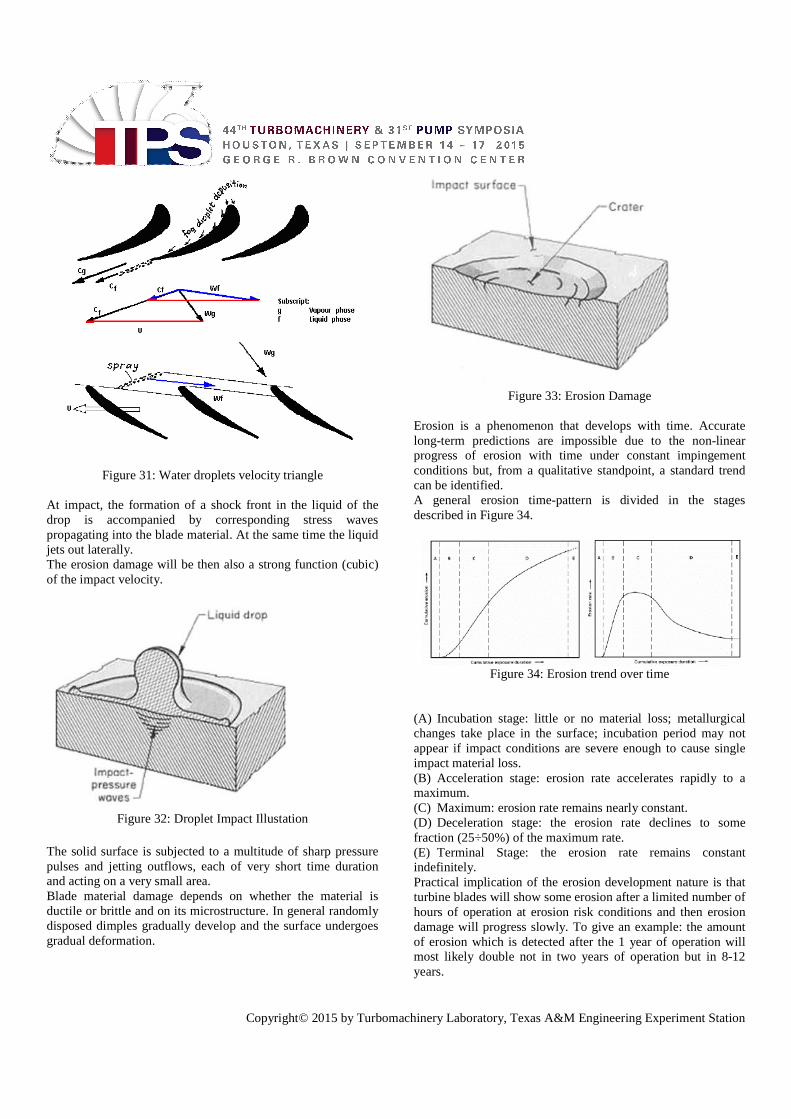
The re-entrained coarse water accelerates gradually with thesteam and eventually hits the downstream rotating blades. As afunction of the distance between the stationary blades trailingedge and rotating blades leading edge the droplets absolutevelocity remains a fraction of steam velocity, typically 10%.Consequently droplets strike suction side of trailing edge with arelative velocity (see Wf in Figure 31) that is close to rotatingblade tangential velocity (U).
Copyright© 2015 by Turbomachinery Laboratory, Texas A&M Engineering Experiment Station
Figure 31: Water droplets velocity triangle
At impact, the formation of a shock front in the liquid of thedrop is accompanied by corresponding stress wavespropagating into the blade material. At the same time the liquidjets out laterally.The erosion damage will be then also a strong function (cubic)of the impact velocity.
Figure 32: Droplet Impact Illustation
The solid surface is subjected to a multitude of sharp pressurepulses and jetting outflows, each of very short time durationand acting on a very small area.Blade material damage depends on whether the material isductile or brittle and on its microstructure. In general randomlydisposed dimples gradually develop and the surface undergoesgradual deformation.
Figure 33: Erosion Damage
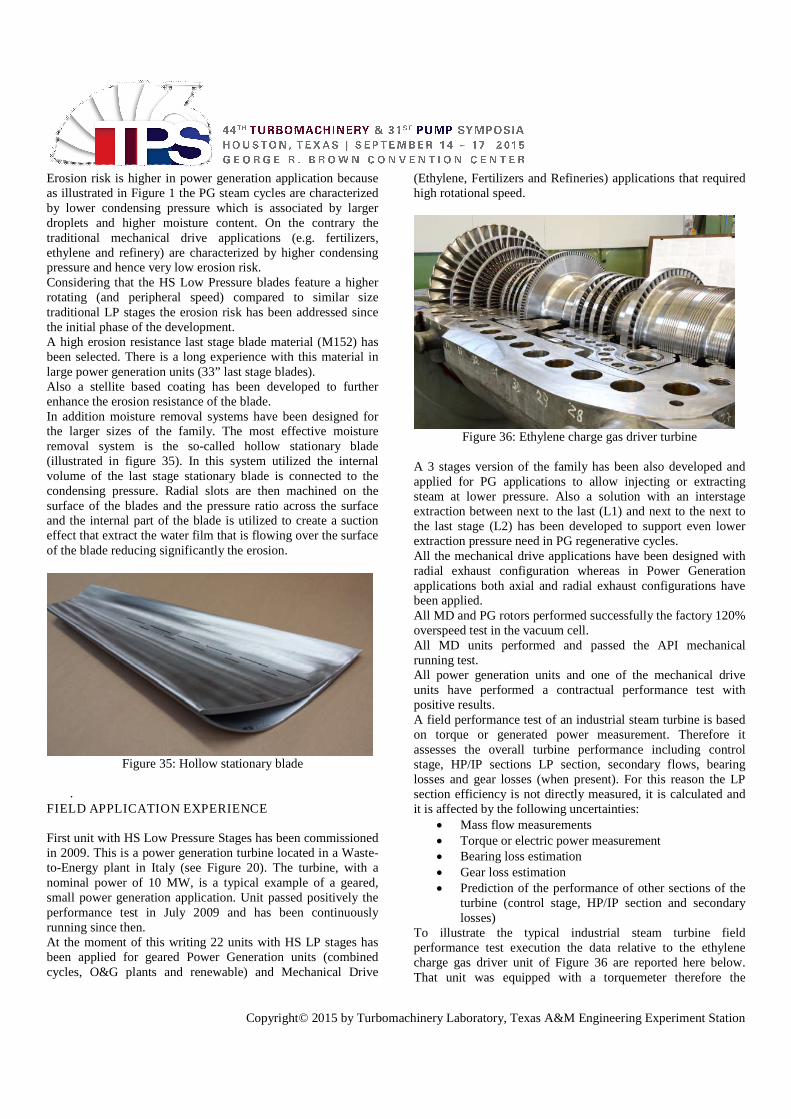
Erosion is a phenomenon that develops with time. Accuratelong-term predictions are impossible due to the non-linearprogress of erosion with time under constant impingementconditions but, from a qualitative standpoint, a standard trendcan be identified.A general erosion time-pattern is divided in the stagesdescribed in Figure 34.
Figure 34: Erosion trend over time
(A) Incubation stage: little or no material loss; metallurgicalchanges take place in the surface; incubation period may notappear if impact conditions are severe enough to cause singleimpact material loss.(B) Acceleration stage: erosion rate accelerates rapidly to amaximum.(C) Maximum: erosion rate remains nearly constant.(D) Deceleration stage: the erosion rate declines to somefraction (25÷50%) of the maximum rate.(E) Terminal Stage: the erosion rate remains constantindefinitely.Practical implication of the erosion development nature is thatturbine blades will show some erosion after a limited number ofhours of operation at erosion risk conditions and then erosiondamage will progress slowly. To give an example: the amountof erosion which is detected after the 1 year of operation willmost likely double not in two years of operation but in 8-12years.
Copyright© 2015 by Turbomachinery Laboratory, Texas A&M Engineering Experiment Station
Erosion risk is higher in power generation application becauseas illustrated in Figure 1 the PG steam cycles are characterizedby lower condensing pressure which is associated by largerdroplets and higher moisture content. On the contrary thetraditional mechanical drive applications (e.g. fertilizers,ethylene and refinery) are characterized by higher condensingpressure and hence very low erosion risk.Considering that the HS Low Pressure blades feature a higherrotating (and peripheral speed) compared to similar sizetraditional LP stages the erosion risk has been addressed sincethe initial phase of the development.A high erosion resistance last stage blade material (M152) hasbeen selected. There is a long experience with this material inlarge power generation units (33” last stage blades).Also a stellite based coating has been developed to furtherenhance the erosion resistance of the blade.In addition moisture removal systems have been designed forthe larger sizes of the family. The most effective moistureremoval system is the so-called hollow stationary blade(illustrated in figure 35). In this system utilized the internalvolume of the last stage stationary blade is connected to thecondensing pressure. Radial slots are then machined on thesurface of the blades and the pressure ratio across the surfaceand the internal part of the blade is utilized to create a suctioneffect that extract the water film that is flowing over the surfaceof the blade reducing significantly the erosion.
Figure 35: Hollow stationary blade
.FIELD APPLICATION EXPERIENCE
First unit with HS Low Pressure Stages has been commissionedin 2009. This is a power generation turbine located in a Waste-to-Energy plant in Italy (see Figure 20). The turbine, with anominal power of 10 MW, is a typical example of a geared,small power generation application. Unit passed positively theperformance test in July 2009 and has been continuouslyrunning since then.At the moment of this writing 22 units with HS LP stages hasbeen applied for geared Power Generation units (combinedcycles, O&G plants and renewable) and Mechanical Drive
(Ethylene, Fertilizers and Refineries) applications that requiredhigh rotational speed.
Figure 36: Ethylene charge gas driver turbine
A 3 stages version of the family has been also developed andapplied for PG applications to allow injecting or extractingsteam at lower pressure. Also a solution with an interstageextraction between next to the last (L1) and next to the next tothe last stage (L2) has been developed to support even lowerextraction pressure need in PG regenerative cycles.All the mechanical drive applications have been designed withradial exhaust configuration whereas in Power Generationapplications both axial and radial exhaust configurations havebeen applied.All MD and PG rotors performed successfully the factory 120%overspeed test in the vacuum cell.All MD units performed and passed the API mechanicalrunning test.All power generation units and one of the mechanical driveunits have performed a contractual performance test withpositive results.A field performance test of an industrial steam turbine is basedon torque or generated power measurement. Therefore itassesses the overall turbine performance including controlstage, HP/IP sections LP section, secondary flows, bearinglosses and gear losses (when present). For this reason the LPsection efficiency is not directly measured, it is calculated andit is affected by the following uncertainties:
Mass flow measurements Torque or electric power measurement Bearing loss estimation Gear loss estimation Prediction of the performance of other sections of the
turbine (control stage, HP/IP section and secondarylosses)
To illustrate the typical industrial steam turbine fieldperformance test execution the data relative to the ethylenecharge gas driver unit of Figure 36 are reported here below.That unit was equipped with a torquemeter therefore the
Copyright© 2015 by Turbomachinery Laboratory, Texas A&M Engineering Experiment Station
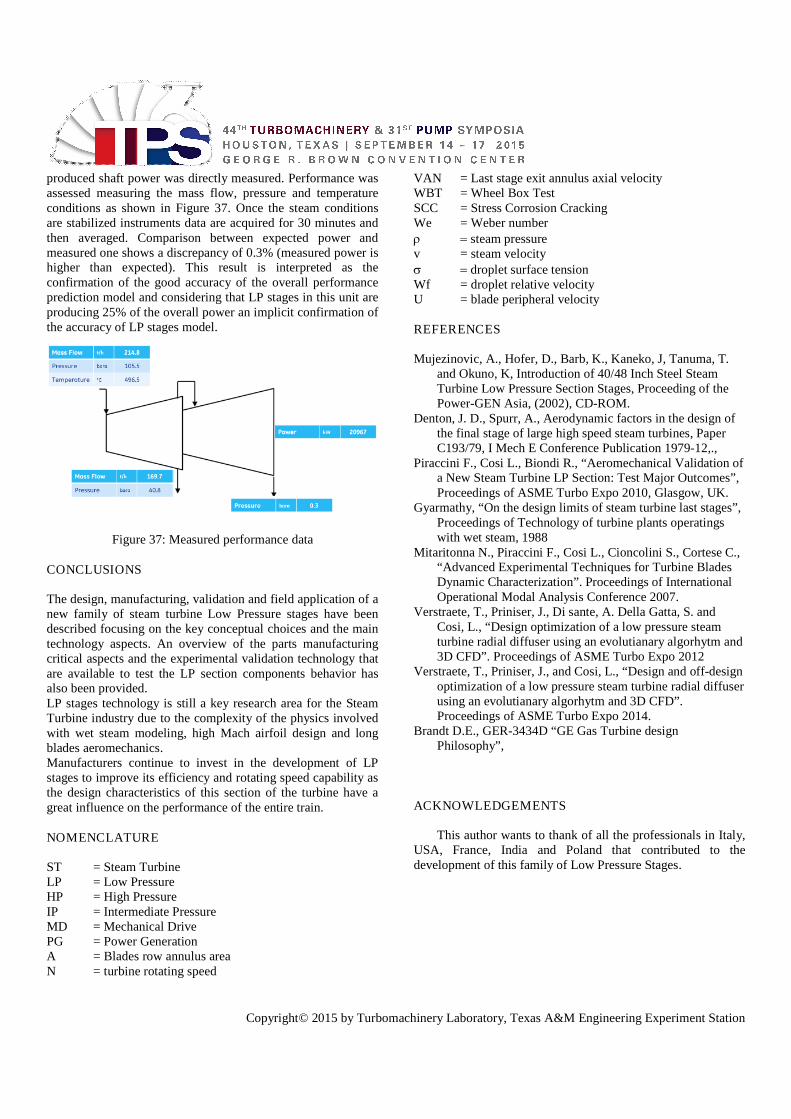
produced shaft power was directly measured. Performance wasassessed measuring the mass flow, pressure and temperatureconditions as shown in Figure 37. Once the steam conditionsare stabilized instruments data are acquired for 30 minutes andthen averaged. Comparison between expected power andmeasured one shows a discrepancy of 0.3% (measured power ishigher than expected). This result is interpreted as theconfirmation of the good accuracy of the overall performanceprediction model and considering that LP stages in this unit areproducing 25% of the overall power an implicit confirmation ofthe accuracy of LP stages model.
Figure 37: Measured performance data
CONCLUSIONS
The design, manufacturing, validation and field application of anew family of steam turbine Low Pressure stages have beendescribed focusing on the key conceptual choices and the maintechnology aspects. An overview of the parts manufacturingcritical aspects and the experimental validation technology thatare available to test the LP section components behavior hasalso been provided.LP stages technology is still a key research area for the SteamTurbine industry due to the complexity of the physics involvedwith wet steam modeling, high Mach airfoil design and longblades aeromechanics.Manufacturers continue to invest in the development of LPstages to improve its efficiency and rotating speed capability asthe design characteristics of this section of the turbine have agreat influence on the performance of the entire train.
NOMENCLATURE
ST = Steam TurbineLP = Low PressureHP = High PressureIP = Intermediate PressureMD = Mechanical DrivePG = Power GenerationA = Blades row annulus areaN = turbine rotating speed
VAN = Last stage exit annulus axial velocityWBT = Wheel Box TestSCC = Stress Corrosion CrackingWe = Weber number steam pressurev = steam velocity droplet surface tensionWf = droplet relative velocityU = blade peripheral velocity
REFERENCES
Mujezinovic, A., Hofer, D., Barb, K., Kaneko, J, Tanuma, T.and Okuno, K, Introduction of 40/48 Inch Steel SteamTurbine Low Pressure Section Stages, Proceeding of thePower-GEN Asia, (2002), CD-ROM.
Denton, J. D., Spurr, A., Aerodynamic factors in the design ofthe final stage of large high speed steam turbines, PaperC193/79, I Mech E Conference Publication 1979-12,.,
Piraccini F., Cosi L., Biondi R., “Aeromechanical Validation ofa New Steam Turbine LP Section: Test Major Outcomes”,Proceedings of ASME Turbo Expo 2010, Glasgow, UK.
Gyarmathy, “On the design limits of steam turbine last stages”,Proceedings of Technology of turbine plants operatingswith wet steam, 1988
Mitaritonna N., Piraccini F., Cosi L., Cioncolini S., Cortese C.,“Advanced Experimental Techniques for Turbine BladesDynamic Characterization”. Proceedings of InternationalOperational Modal Analysis Conference 2007.
Verstraete, T., Priniser, J., Di sante, A. Della Gatta, S. andCosi, L., “Design optimization of a low pressure steamturbine radial diffuser using an evolutianary algorhytm and3D CFD”. Proceedings of ASME Turbo Expo 2012
Verstraete, T., Priniser, J., and Cosi, L., “Design and off-designoptimization of a low pressure steam turbine radial diffuserusing an evolutianary algorhytm and 3D CFD”.Proceedings of ASME Turbo Expo 2014.
Brandt D.E., GER-3434D “GE Gas Turbine designPhilosophy”,
ACKNOWLEDGEMENTS
This author wants to thank of all the professionals in Italy,USA, France, India and Poland that contributed to thedevelopment of this family of Low Pressure Stages.