Embed Size (px)
Citation preview
How to evaluate a Raman map with Origin Pro 9.0 Niclas Müller
1
Tutorial: How to evaluate a Raman map with Origin Pro 9.0 This tutorial intends to show you how to evaluate a Raman map, which you for example recorded at the Raman XploRa. I will give an example how to create a Raman map, which shows the 2D/G-peak intensity ratio of a graphene flake. You can find the data which belong to the map below on my website1.
1. Exporting data from the Raman-XploRa: After recording the Raman map click on the window in which all the spectra are displayed (in program Labspec). Click on File → Split and type as a file name M. The spectra will now be exported with the names M_x_y, with the coordinates x and y.
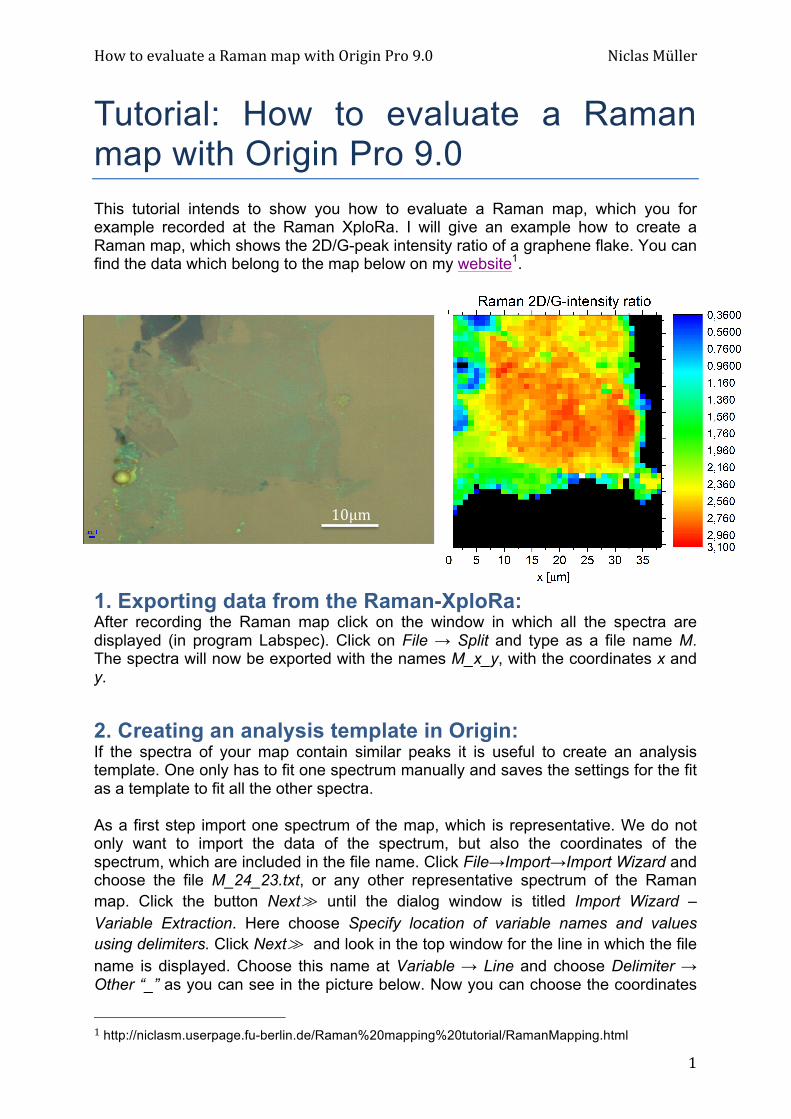
2. Creating an analysis template in Origin: If the spectra of your map contain similar peaks it is useful to create an analysis template. One only has to fit one spectrum manually and saves the settings for the fit as a template to fit all the other spectra. As a first step import one spectrum of the map, which is representative. We do not only want to import the data of the spectrum, but also the coordinates of the spectrum, which are included in the file name. Click File→Import→Import Wizard and choose the file M_24_23.txt, or any other representative spectrum of the Raman map. Click the button Next≫ until the dialog window is titled Import Wizard – Variable Extraction. Here choose Specify location of variable names and values using delimiters. Click Next≫ and look in the top window for the line in which the file name is displayed. Choose this name at Variable → Line and choose Delimiter → Other “_” as you can see in the picture below. Now you can choose the coordinates
1 http://niclasm.userpage.fu-berlin.de/Raman%20mapping%20tutorial/RamanMapping.html
10μm
How to evaluate a Raman map with Origin Pro 9.0 Niclas Müller
2
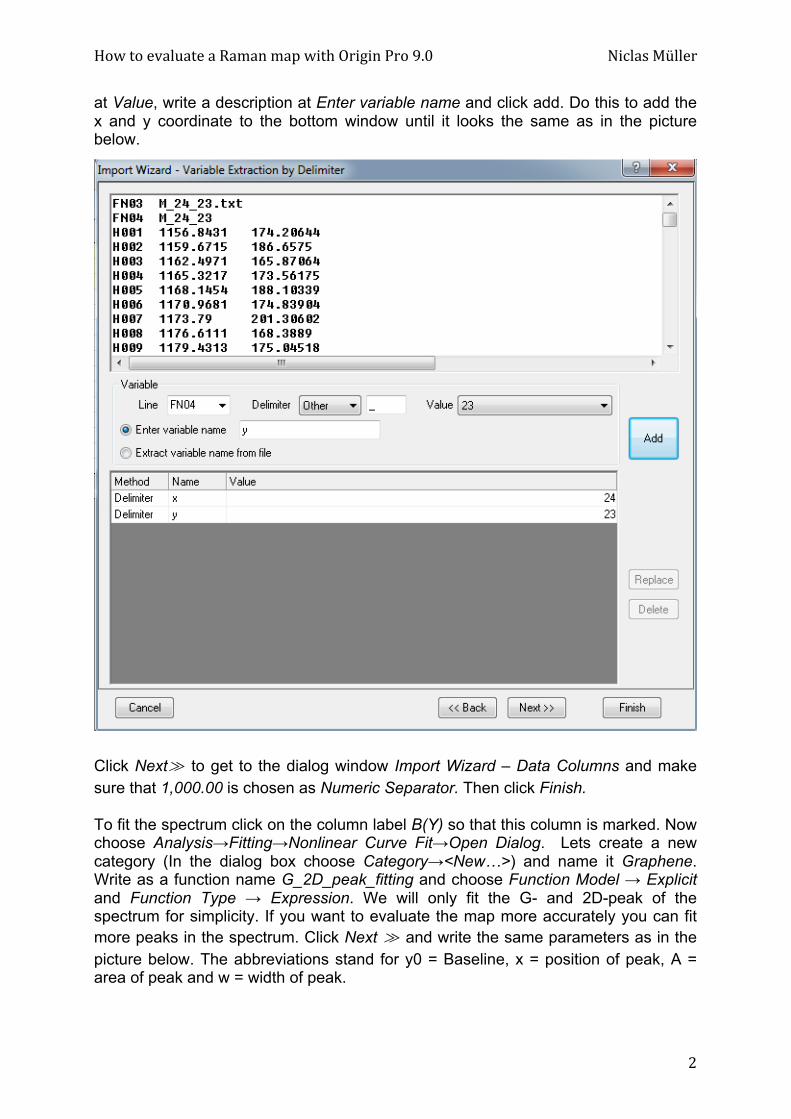
at Value, write a description at Enter variable name and click add. Do this to add the x and y coordinate to the bottom window until it looks the same as in the picture below. Click Next≫ to get to the dialog window Import Wizard – Data Columns and make sure that 1,000.00 is chosen as Numeric Separator. Then click Finish. To fit the spectrum click on the column label B(Y) so that this column is marked. Now choose Analysis→Fitting→Nonlinear Curve Fit→Open Dialog. Lets create a new category (In the dialog box choose Category→<New…>) and name it Graphene. Write as a function name G_2D_peak_fitting and choose Function Model → Explicit and Function Type → Expression. We will only fit the G- and 2D-peak of the spectrum for simplicity. If you want to evaluate the map more accurately you can fit more peaks in the spectrum. Click Next ≫ and write the same parameters as in the picture below. The abbreviations stand for y0 = Baseline, x = position of peak, A = area of peak and w = width of peak.
How to evaluate a Raman map with Origin Pro 9.0 Niclas Müller
3
Click Next ≫ and fill in all the information as shown in the picture below. The Function Body should be y0 + (2*A_G/PI)*(w_G/(4*(x-x_G)^2 + (w_G)^2))+ (2*A_2D/PI)*(w_2D/(4*(x-x_2D)^2 + (w_2D)^2)) which is a fit of the spectrum with two Lorentz peaks. Click Next ≫ and choose Always run Initialization Code before Fitting and Use Origin C. Click Next ≫ to set the upper and lower bounds of the parameters as shown in the picture below.
How to evaluate a Raman map with Origin Pro 9.0 Niclas Müller
4
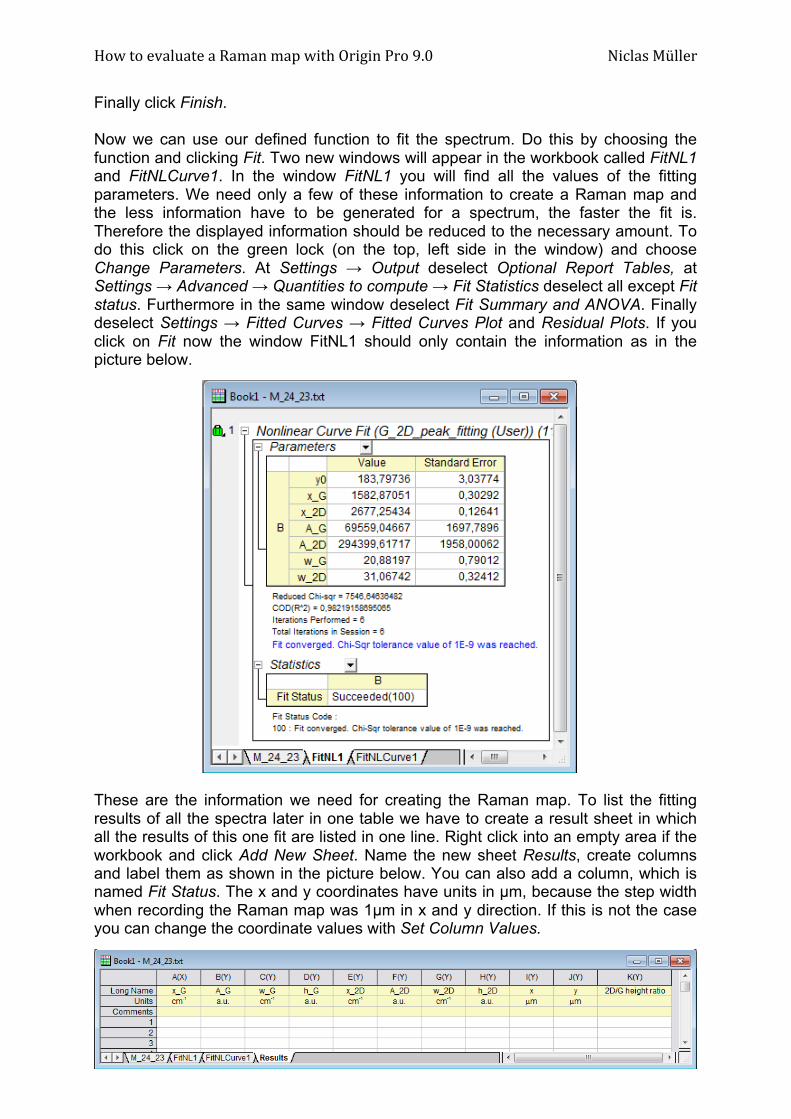
Finally click Finish. Now we can use our defined function to fit the spectrum. Do this by choosing the function and clicking Fit. Two new windows will appear in the workbook called FitNL1 and FitNLCurve1. In the window FitNL1 you will find all the values of the fitting parameters. We need only a few of these information to create a Raman map and the less information have to be generated for a spectrum, the faster the fit is. Therefore the displayed information should be reduced to the necessary amount. To do this click on the green lock (on the top, left side in the window) and choose Change Parameters. At Settings → Output deselect Optional Report Tables, at Settings → Advanced → Quantities to compute → Fit Statistics deselect all except Fit status. Furthermore in the same window deselect Fit Summary and ANOVA. Finally deselect Settings → Fitted Curves → Fitted Curves Plot and Residual Plots. If you click on Fit now the window FitNL1 should only contain the information as in the picture below. These are the information we need for creating the Raman map. To list the fitting results of all the spectra later in one table we have to create a result sheet in which all the results of this one fit are listed in one line. Right click into an empty area if the workbook and click Add New Sheet. Name the new sheet Results, create columns and label them as shown in the picture below. You can also add a column, which is named Fit Status. The x and y coordinates have units in µm, because the step width when recording the Raman map was 1µm in x and y direction. If this is not the case you can change the coordinate values with Set Column Values.
How to evaluate a Raman map with Origin Pro 9.0 Niclas Müller
5
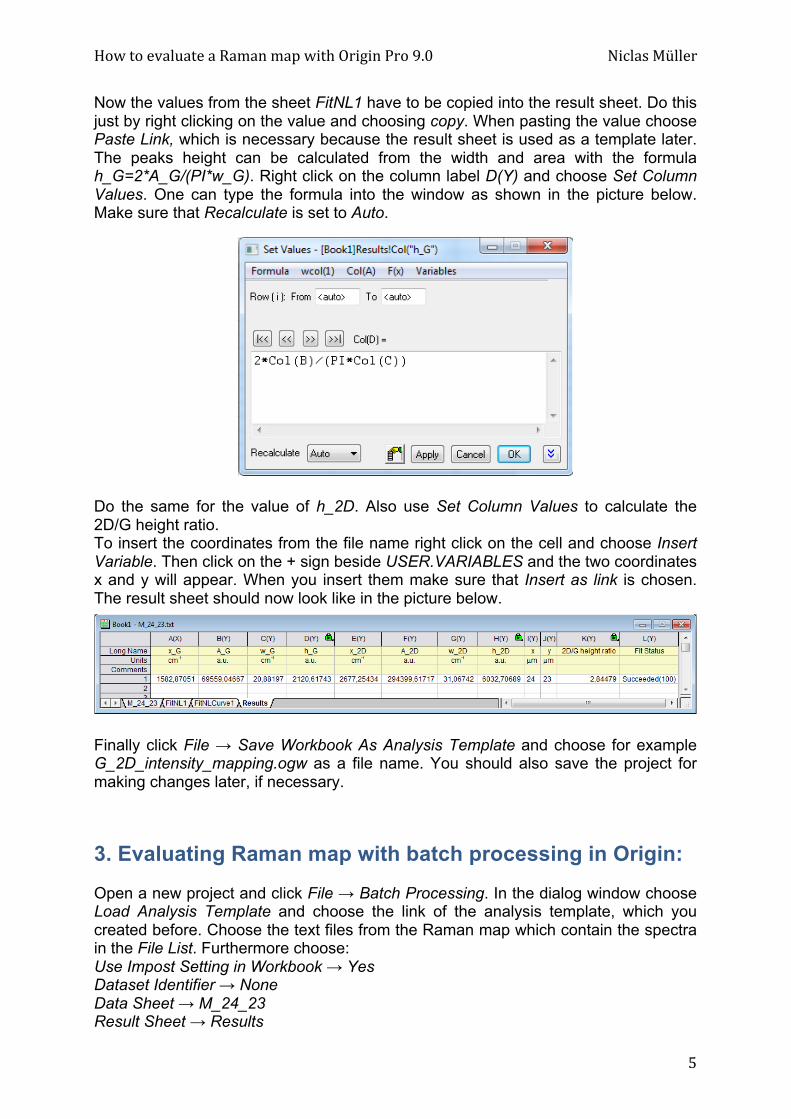
Now the values from the sheet FitNL1 have to be copied into the result sheet. Do this just by right clicking on the value and choosing copy. When pasting the value choose Paste Link, which is necessary because the result sheet is used as a template later. The peaks height can be calculated from the width and area with the formula h_G=2*A_G/(PI*w_G). Right click on the column label D(Y) and choose Set Column Values. One can type the formula into the window as shown in the picture below. Make sure that Recalculate is set to Auto. Do the same for the value of h_2D. Also use Set Column Values to calculate the 2D/G height ratio. To insert the coordinates from the file name right click on the cell and choose Insert Variable. Then click on the + sign beside USER.VARIABLES and the two coordinates x and y will appear. When you insert them make sure that Insert as link is chosen. The result sheet should now look like in the picture below. Finally click File → Save Workbook As Analysis Template and choose for example G_2D_intensity_mapping.ogw as a file name. You should also save the project for making changes later, if necessary.
3. Evaluating Raman map with batch processing in Origin: Open a new project and click File → Batch Processing. In the dialog window choose Load Analysis Template and choose the link of the analysis template, which you created before. Choose the text files from the Raman map which contain the spectra in the File List. Furthermore choose: Use Impost Setting in Workbook → Yes Dataset Identifier → None Data Sheet → M_24_23 Result Sheet → Results
How to evaluate a Raman map with Origin Pro 9.0 Niclas Müller
6
Output Sheet → [Summary]Results! Delete Intermediate Workbook → Yes Options → Starting Row of Output Sheet → 1 Options → Clear Output Sheet on Start → Yes Options → Append Label Rows → No Click OK. Origin is now fitting all the Raman spectra of the map and creating a table with all the results. This can take up to several hours, depending on the size of the map. Now you should look over the result sheet and replace all unreasonable values for the 2D/G height ratio with a default value, for example 0. The fastest way to control whether a fit was successful is to look at the peak width of the G- and 2D-peak, which should not be one of the boundary values.
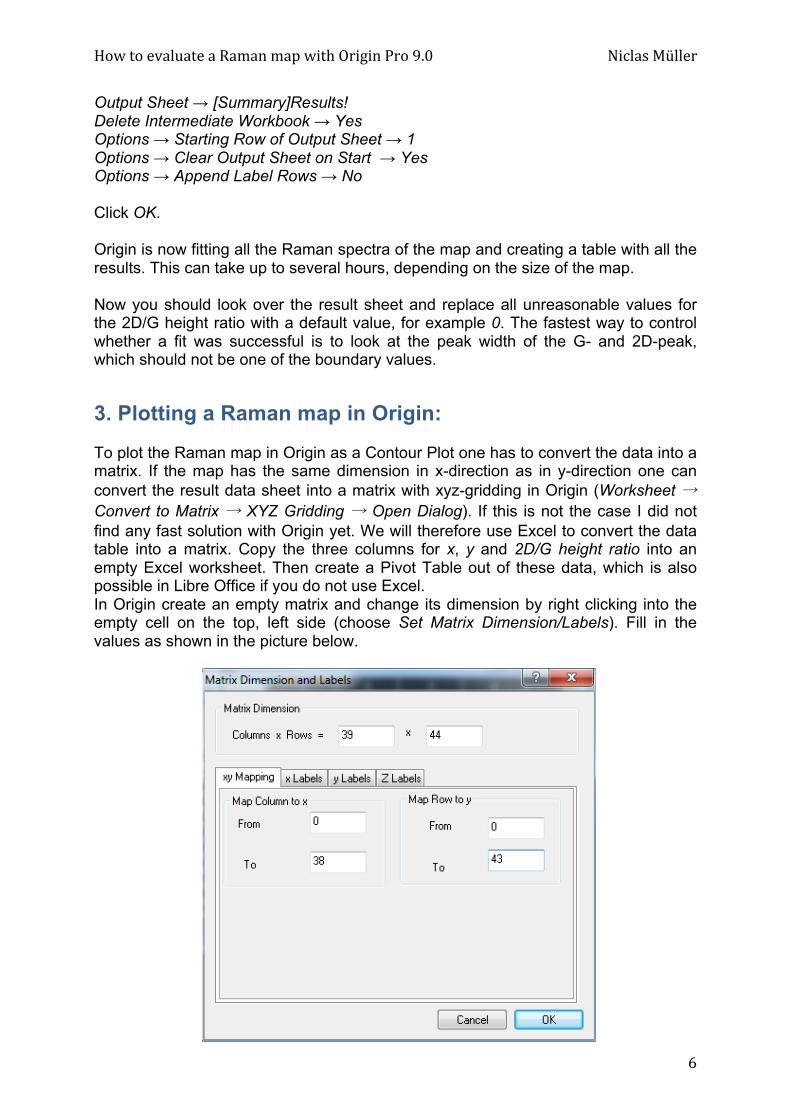
3. Plotting a Raman map in Origin: To plot the Raman map in Origin as a Contour Plot one has to convert the data into a matrix. If the map has the same dimension in x-direction as in y-direction one can convert the result data sheet into a matrix with xyz-gridding in Origin (Worksheet → Convert to Matrix → XYZ Gridding → Open Dialog). If this is not the case I did not find any fast solution with Origin yet. We will therefore use Excel to convert the data table into a matrix. Copy the three columns for x, y and 2D/G height ratio into an empty Excel worksheet. Then create a Pivot Table out of these data, which is also possible in Libre Office if you do not use Excel. In Origin create an empty matrix and change its dimension by right clicking into the empty cell on the top, left side (choose Set Matrix Dimension/Labels). Fill in the values as shown in the picture below.
How to evaluate a Raman map with Origin Pro 9.0 Niclas Müller
7
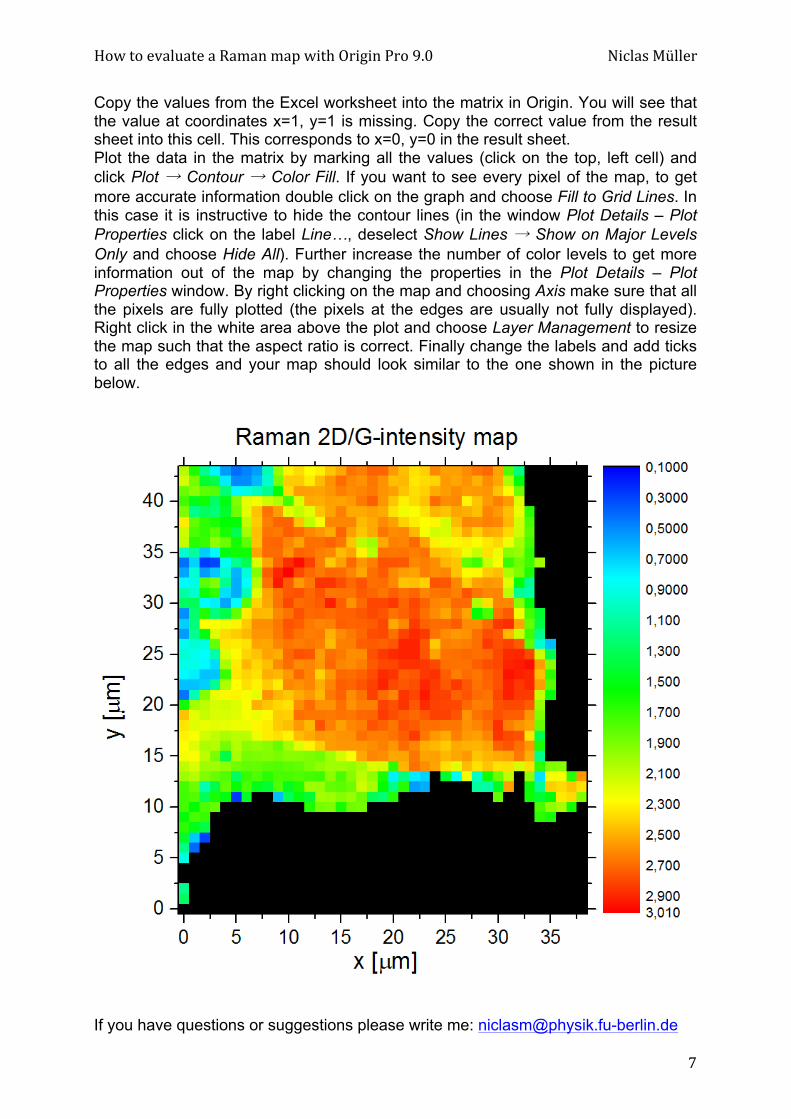
Copy the values from the Excel worksheet into the matrix in Origin. You will see that the value at coordinates x=1, y=1 is missing. Copy the correct value from the result sheet into this cell. This corresponds to x=0, y=0 in the result sheet. Plot the data in the matrix by marking all the values (click on the top, left cell) and click Plot → Contour → Color Fill. If you want to see every pixel of the map, to get more accurate information double click on the graph and choose Fill to Grid Lines. In this case it is instructive to hide the contour lines (in the window Plot Details – Plot Properties click on the label Line…, deselect Show Lines → Show on Major Levels Only and choose Hide All). Further increase the number of color levels to get more information out of the map by changing the properties in the Plot Details – Plot Properties window. By right clicking on the map and choosing Axis make sure that all the pixels are fully plotted (the pixels at the edges are usually not fully displayed). Right click in the white area above the plot and choose Layer Management to resize the map such that the aspect ratio is correct. Finally change the labels and add ticks to all the edges and your map should look similar to the one shown in the picture below. If you have questions or suggestions please write me: [email protected]


![[React-Native Tutorial] Map](https://img.pdfslide.us/doc/110x75/58728d3f1a28ab36118b57e9/react-native-tutorial-map.jpg)