Embed Size (px)
Citation preview

Sample to Insight
Tutorial
Typing and Epidemiological Clustering of Com-mon Pathogens (beta)
November 21, 2017
QIAGEN Aarhus Silkeborgvej 2 Prismet 8000 Aarhus C DenmarkTelephone: +45 70 22 32 44 [email protected]

Tutorial
Typing and Epidemiological Clustering of Common Pathogens (beta) 2
Typing and Epidemiological Clustering of Common Pathogens (beta)This tutorial will take you through the tools available in CLC Microbial Genomics Module 3.0 (orhigher) to perform typing and epidemiological studies of cultured bacteria.
Note that the functionality of the plugin described within this tutorial is in beta. It is under activedevelopment and subject to change without notice.
Introduction Typing bacteria like Salmonella enterica, Listeria monocytogenes, Vibrio para-haemolyticus, Escherichia coli, Shigella, Campylobacter and Cronobacter allows surveillance infood safety and public health. Molecular methods using Next Generation Sequencing (NGS)data from whole pathogen genomes are increasingly used for outbreak detection of commonpathogens. This tutorial will guide you through the different workflows and tools included in CLCMicrobial Genomics Module to analyze NGS data from isolated and cultivated bacterial samples.
Prerequisites For this tutorial, you must be working with CLC Genomics Workbench 9.0 or higheror Biomedical Genomics Workbench 3.0 or higher, and you must have installed CLC MicrobialGenomics Module.
Overview Using NGS data of cultured Salmonella enterica, this tutorial will guide you throughthe following:
• Creating metadata and analysis results tables.
• Customizing provided template workflows in order to:
– Identify the best matching reference and its taxonomy.
– Perform NGS-based Multilocus Sequence Typing (MLST).
– Find antimicrobial resistance genes.
– Identify potential contaminants in a sample.
• Performing outbreak analysis based on phylogenetic trees.
• Visualizing associated metadata in the context of the phylogenetic tree.
Downloading and importing the data
For this tutorial we will use a Salmonella enterica data set originally described by Leekitcharoen-phon et al., 2014. To ensure a reasonable analysis time for the tutorial, only 5 of 47 samplesare included in this tutorial, and each read file has been reduced to include only 20% of theoriginal reads.
The data for this tutorial includes the following files:
• "MGM_metadata.xlsx": The metadata spreadsheet includes the sample metadata asstated in the original reference by Leekitcharoenphon and co-workers. Note that a metadataspreadsheet is different from a metadata table, and you will learn in this tutorial how toconvert the former into the latter.

Tutorial
Typing and Epidemiological Clustering of Common Pathogens (beta) 3
• Raw reads: 5 sequence data files in CLC format containing each 20% of the originalSalmonella enterica reads.
• A reference genome NZ_CP014971 used for re-mapping
• Databases: All databases needed for typing are easily downloadable through specific toolsof CLC Microbial Genomics Module. The data included in this folder is provided for userswho wish to bypass the different download steps of this tutorial.
We can now get started.
1. Download the data from our website: http://resources.qiagenbioinformatics.com/testdata/typing_tutorial/typing_tutorial_5.zip. Unzip and save thefiles locally.
2. Start your CLC Workbench and go to File | Import | Standard Import. In the wizard, leave theimport option to Automatic Import. Choose the folder called Raw reads and the referenceNZ_CP014971 (see figure 1) and save the imported files into a new folder called you cancall for example "Typing tutorial".
Figure 1: Importing the reads and the reference.
3. Now import the metadata table via the toolbar: File | Import | Import Metadata.
• A wizard opens. In the first field (figure 2), select the spreadsheet saved on your localcomputer that contains the sample information "MGM_Metadata.xls". The contents ofthe Excel spreadsheet populates the table situated at the bottom of the dialog. ClickNext.
• Click on the Navigation button next to "Location of data", and select the importedreads in your Navigation Area. Click OK.
• The "Data association preview" table at the bottom of the dialog shows that theassociation between reads and metadata is successful (figure 3). Click Next.
• Select the "Typing tutorial" folder to save the resulting metadata table. Metadatatables are called "Samples" by default, but you will be able to rename them whenanalyzing your own data.
4. Most of CLC Microbial Genomics Module functionalities require the use of a genomereference list, a resistance database and/or MLST schemes. To download the databasesand schemes needed for this tutorial specifically, go to File | Import | Standard Import
Tutorial
Typing and Epidemiological Clustering of Common Pathogens (beta) 4
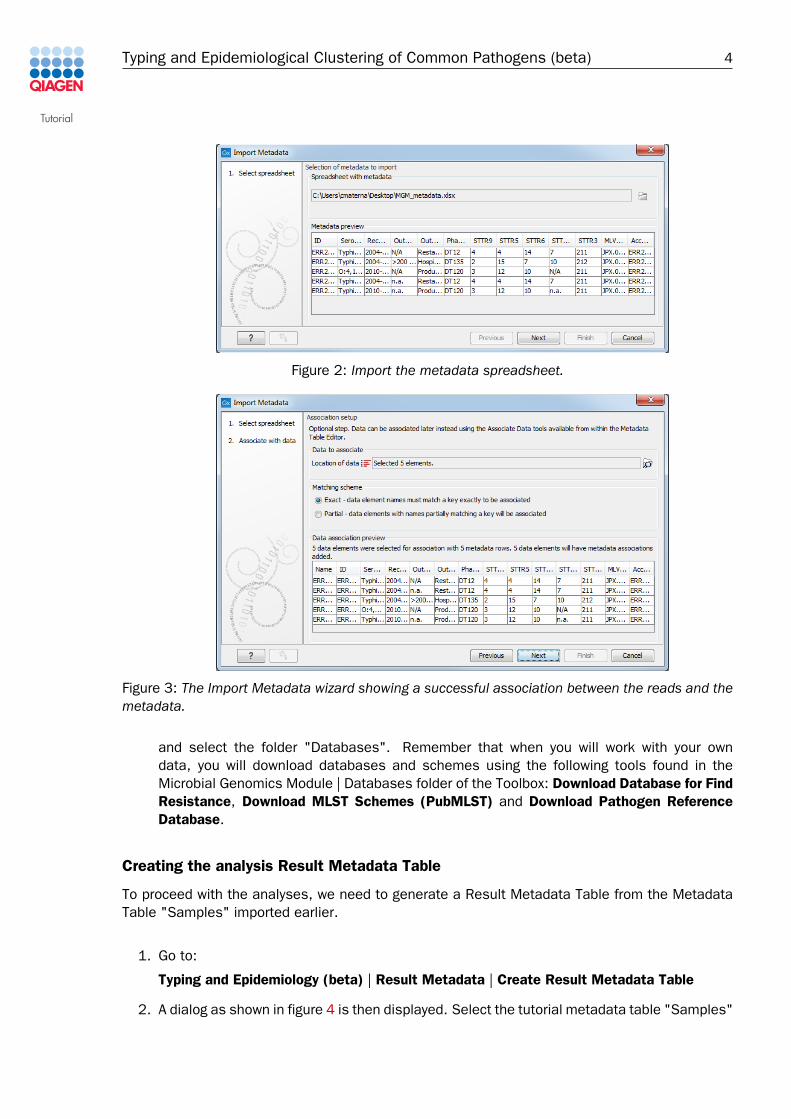
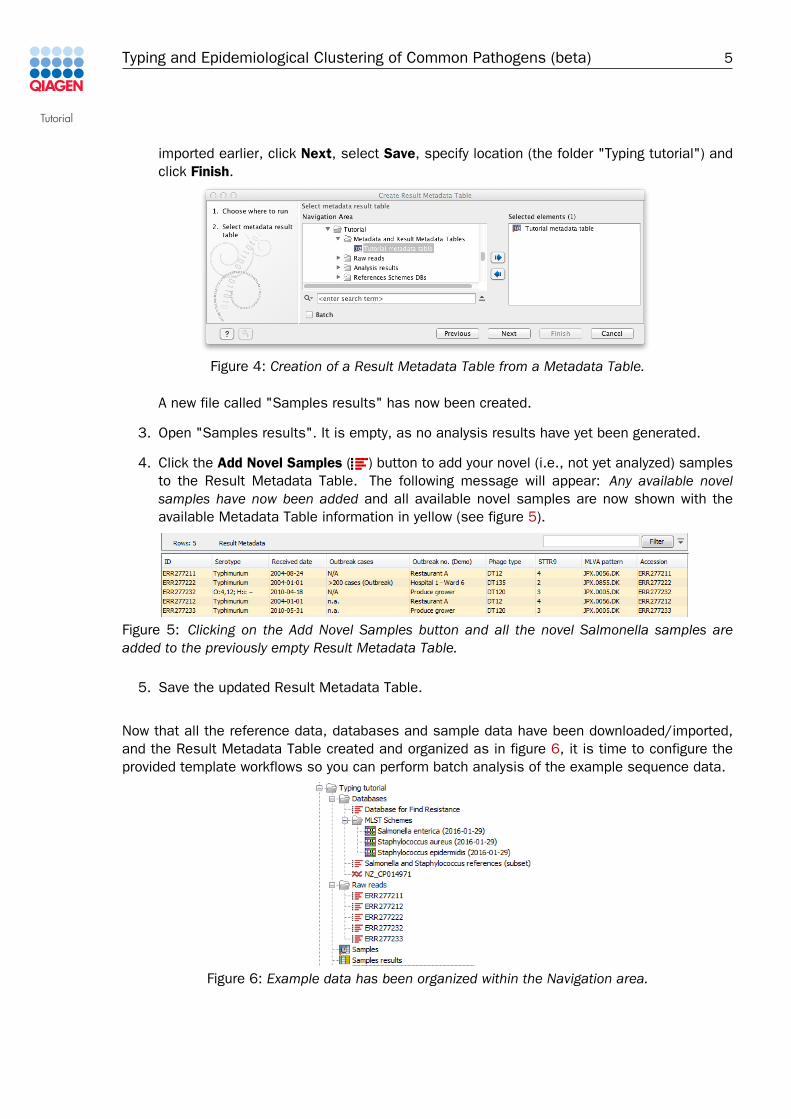
Figure 2: Import the metadata spreadsheet.
Figure 3: The Import Metadata wizard showing a successful association between the reads and themetadata.
and select the folder "Databases". Remember that when you will work with your owndata, you will download databases and schemes using the following tools found in theMicrobial Genomics Module | Databases folder of the Toolbox: Download Database for FindResistance, Download MLST Schemes (PubMLST) and Download Pathogen ReferenceDatabase.
Creating the analysis Result Metadata Table
To proceed with the analyses, we need to generate a Result Metadata Table from the MetadataTable "Samples" imported earlier.
1. Go to:
Typing and Epidemiology (beta) | Result Metadata | Create Result Metadata Table
2. A dialog as shown in figure 4 is then displayed. Select the tutorial metadata table "Samples"
Tutorial
Typing and Epidemiological Clustering of Common Pathogens (beta) 5
imported earlier, click Next, select Save, specify location (the folder "Typing tutorial") andclick Finish.
Figure 4: Creation of a Result Metadata Table from a Metadata Table.
A new file called "Samples results" has now been created.
3. Open "Samples results". It is empty, as no analysis results have yet been generated.
4. Click the Add Novel Samples ( ) button to add your novel (i.e., not yet analyzed) samplesto the Result Metadata Table. The following message will appear: Any available novelsamples have now been added and all available novel samples are now shown with theavailable Metadata Table information in yellow (see figure 5).
Figure 5: Clicking on the Add Novel Samples button and all the novel Salmonella samples areadded to the previously empty Result Metadata Table.
5. Save the updated Result Metadata Table.
Now that all the reference data, databases and sample data have been downloaded/imported,and the Result Metadata Table created and organized as in figure 6, it is time to configure theprovided template workflows so you can perform batch analysis of the example sequence data.
Figure 6: Example data has been organized within the Navigation area.

Tutorial
Typing and Epidemiological Clustering of Common Pathogens (beta) 6
How to run the Type Among Multiple Species workflow on a batch of samples:
The Type Among Multiple Species workflow is designed for typing a sample among multiplepredefined species. The workflow allows identification of the closest matching reference speciesamong the user specified reference list(s), and of potential contaminants. The workflow alsoidentifies the associated MLST scheme and type, determines variants found when mappingthe sample data against the identified best matching reference, and finds occurring antibioticresistance genes if they match genes within the user specified resistance database.
To be able to run multiple sample data sets in batch mode you will need to make a copy of thetemplate workflow and save the copy of the workflow in the Navigation Area before running it.In addition, it is possible to use the open layout of the workflow to configure it before runningit. This is described in detail below. Note that while having a saved copy of the workflow in theNavigation Area, and an open view of the layout open in the View Area are necessary to run theworkflows, the configuration is optional and can be done later in the successive dialogs of theworkflow wizard.
1. Select the workflow Type Among Multiple Species in the "Workflows" subfolder of the"Typing and Epidemiology (beta)" folder with one click (do not open the wizard yet with adouble click). Right-click on the name of the workflow and choose the option Open Copy ofWorkflow (figure 7).
Figure 7: Open a copy of a workflow.
2. This opens a copy of the workflow in the view area of your workbench. Double click on thegreen tile representing the Result Metadata Table input file (highlighted in red in figure 8).
Figure 8: Double click on the Result Metadata Table green input file tile.
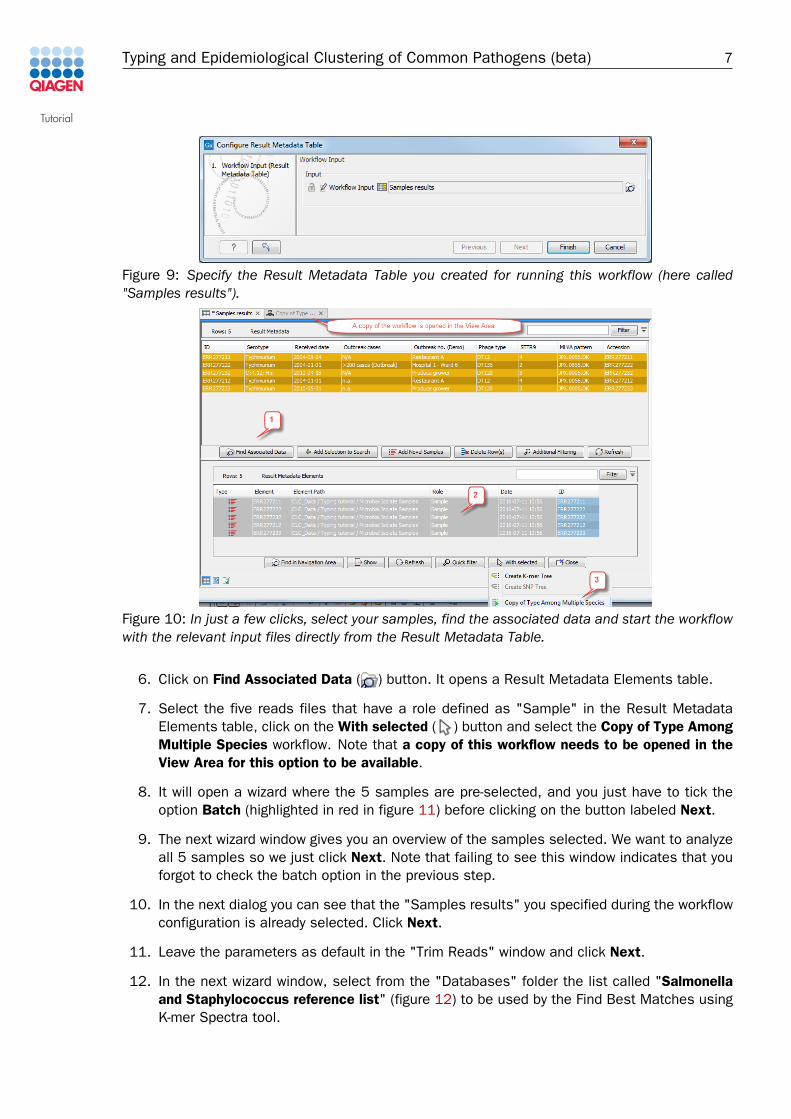
3. It opens a dialog where you have to specify the Result Metadata Table created earlier andcalled "Samples results" (figure 9). Click on Finish.
4. Save you workflow in your Navigation Area by dragging the workflow tab to the relevantlocation in your Navigation Area (here in the folder called Typing tutorial).
5. Switch back to your Result metadata table and select the 5 samples to be typed (figure 10).
Tutorial
Typing and Epidemiological Clustering of Common Pathogens (beta) 7
Figure 9: Specify the Result Metadata Table you created for running this workflow (here called"Samples results").
Figure 10: In just a few clicks, select your samples, find the associated data and start the workflowwith the relevant input files directly from the Result Metadata Table.
6. Click on Find Associated Data ( ) button. It opens a Result Metadata Elements table.
7. Select the five reads files that have a role defined as "Sample" in the Result MetadataElements table, click on the With selected ( ) button and select the Copy of Type AmongMultiple Species workflow. Note that a copy of this workflow needs to be opened in theView Area for this option to be available.
8. It will open a wizard where the 5 samples are pre-selected, and you just have to tick theoption Batch (highlighted in red in figure 11) before clicking on the button labeled Next.
9. The next wizard window gives you an overview of the samples selected. We want to analyzeall 5 samples so we just click Next. Note that failing to see this window indicates that youforgot to check the batch option in the previous step.
10. In the next dialog you can see that the "Samples results" you specified during the workflowconfiguration is already selected. Click Next.
11. Leave the parameters as default in the "Trim Reads" window and click Next.
12. In the next wizard window, select from the "Databases" folder the list called "Salmonellaand Staphylococcus reference list" (figure 12) to be used by the Find Best Matches usingK-mer Spectra tool.

Tutorial
Typing and Epidemiological Clustering of Common Pathogens (beta) 8
Figure 11: Remember to tick the button labeled Batch highlighted in red at the bottom of the wizardwindow when selecting multiple samples you want to analyze. If you do not tick batch, all sampleswill be analyzed as one unique sample instead of independent ones.
Figure 12: Choose the genome references called "Salmonella and Staphylococcus reference list".
13. The "Identify MLST Scheme from Genomes" dialog, you should select the downloaded MLSTschemes for Staphylococcus aureus, Staphylocossus epidermis and Salmonella enterica(figure 13).
Figure 13: Select the downloaded MLST schemes for Salmonella and Staphylococcus.
14. In the "Find Resistance" window you should specify the provided resistance database called"Database for Find Resistance" as shown in figure 14.

Tutorial
Typing and Epidemiological Clustering of Common Pathogens (beta) 9
Figure 14: Select the resistance database called "Database for Find Resistance".
15. Leave parameters as they are set by default in the "Basic Variant Detection" and "IdentifyMLST" windows, and click Next.
16. In the last wizard window "Result handling", we recommend saving the results in separatefolders (figure 15) within a new folder you can call "Type Among Multiple species". Click onFinish.
Figure 15: Save your results in separate folders.

Tutorial
Typing and Epidemiological Clustering of Common Pathogens (beta) 10
Checking results in the Result Metadata Table - optional
Once the typing analyses are done, each typing analysis results in 15 output files (elements).They are all accessible both from the Navigation area, and from the lower part of the ResultMetadata Table (click on the "Refresh" button to see them). In addition, the main findingsare also summarized in the Result Metadata Table as new columns added next to the yellowmetadata columns.
Open the Result Metadata Table ("Samples results") and look at the results columns (in white).Adjust the visualization of the table according to your own preferences using the right hand sidepanel: you can influence columns width, and which columns should be displayed using the menus"Show column" (for selecting individual columns) or the "Show column groups" (for selectingentire group of columns at once).
• "Best matches" to see the best matching reference and its taxonomy in the "Best match,Description" column, as well as to identify potential contamination in the samples.
• "MLST Scheme" to see which schemes were associated with the data, and whether thisassociation was conclusive or not.
• "Resistance genes" for a description of the resistance genes found in each sample.
• "Metadata" for all metadata column that were included in the original spreadsheet.
Finding contamination using the functionalities of the Result Metadata Table
Looking at the "Best matches" group, check the "Best match, % mapped" and "Contaminatingspecies, % mapped" columns (figure 16).
Figure 16: Finding contamination in the Result Metadata Table.
You can see that the sample ERR277232 has only half of his reads mapped to Salmonellaenterica, while others mapped to Staphylococcus aureus. In the Elements table, find the elementwhose role is "Contamination report" and double-click on it to learn more about this particularsample, and decide whether you want to exclude it from subsequent analyses.
Finding non-conclusive MLST association using the functionalities of the Result Metadata Table
1. In the Result Metadata Table, open the advanced filter functionality by clicking on the arrowin the top right corner (1) (figure 17).

Tutorial
Typing and Epidemiological Clustering of Common Pathogens (beta) 11
Figure 17: Use the filter (1), select the remaining sample (2) and find associated data (3).
2. From the first drop down menu, select "MLST". Leave the second drop down menu to"contains", and write "non" (for "non-conclusive") in the last window. Click on Filter.
3. In this tutorial, only one sample remain in the Metadata table (2). Select that sample andclick on the button Find Associated Data (3).
4. You should see 15 associated elements in the Metadata Elements table (figure 18).
Figure 18: Open elements directly from the Metadata elements table, or select the element youare interested in (4) and highlight it in the Navigation Area (5) where you can open it (6).
5. We are first going to check the report. Select the element whose role is "MLST report" (4)and double click on it. Another way to open it is to click on the button Find in NavigationArea (5) and open the report from there (6).
The report shows the different loci of the scheme, and the last column gives a value for thecoverage of these regions. We can see that the coverage is low, and below the thresholdspecified in the "Identify MLST" step of the workflow (set to 30 by default).

Tutorial
Typing and Epidemiological Clustering of Common Pathogens (beta) 12
Another powerful element you can use to visualize your data is the Track Viewer (figure 19). Goback to the Result Metadata Table, and open the element whose role is "Track list". You canchoose the loci you want to look at from the drop down menu in the right side panel. Observehow few reads are covering the regions of interest. To put it in perspective, open the track listof a sample whose MLST was deemed conclusive by changing the filter in the Result Metadatatable.
Figure 19: A track list showing the mapped reads covering a specific region defined by the MLSTscheme.

Tutorial
Typing and Epidemiological Clustering of Common Pathogens (beta) 13
Exploring the obtained Best match results and identifying a common reference
Go back to the "Samples results" and clear all filters before looking at the "Best match" column.
If all entries in the "Best match" column are the same: This indicates that the read filesrepresent a single clade, and it is possible to create a SNP tree directly from the typing analysisdata. Note that this is not the case for this tutorial.
If the "Best match" column includes multiple accession numbers: This indicates that theSalmonella read files in this tutorial do not represent a single clade. However, creating a SNPtree including multiple clusters requires that all read files were mapped and variants called usingthe same reference.
If you are under time constraints, you can go directly to the section on "Map to SpecifiedReference" and use the NZ_CP014971 genome sequence provided in the folder "Databases" forre-mapping and variant calling of the read files. Otherwise, follow the steps below to learn howyou can identify a common reference by creating a k-mer tree.
First you need create a Salmonella specific reference subset to be used for k-mer tree generation.In this tutorial, you will use the "Salmonella and Staphylococcus reference list", but otherwiseyou would create a subset from the "Bacteria from NCBI" file you need to download to use CLCMicrobial Genomics Module for your own analyses.
1. Open the "Salmonella and Staphylococcus reference list". This file opens as a Sequencelist.
2. Click on the Show table icon at the bottom of the View Area (highlighted in red in figure 20).
Figure 20: Selection of Salmonella specific genomes for subset reference list to be used for k-mercreation
3. Filter on the term "Salmonella".
4. Select the remaining sequences, click on the Create New Sequence List button. It opens anew tab called "Salmonella and Staphylococcus reference list (subset) subset". Save thelist by dragging it to the Navigation Area and rename it to "Salmonella references subset".
You can now create a K-mer tree through the Result Metadata Table:
Tutorial
Typing and Epidemiological Clustering of Common Pathogens (beta) 14
1. Open the "Samples results" tab and select the five samples to which a common bestmatching references should be identified. Note that we decided to leave the contaminatedsample in the analysis, but you could sort the table based on the "Contaminating species,% mapped" column and select only the samples that are below a certain threshold ofcontamination for example.
2. Click on the Find Associated Data ( ) button to find the 75 associated Metadata Elements.
3. Click on the Quick Filter ( ) button and select the option Filter for K-mer Tree to findMetadata Elements with the Role "Trimmed Reads".
4. Select all remaining Metadata Element files.
5. Click on the With selected ( ) button and select the Create K-mer Tree action to openthe tool’s wizard.
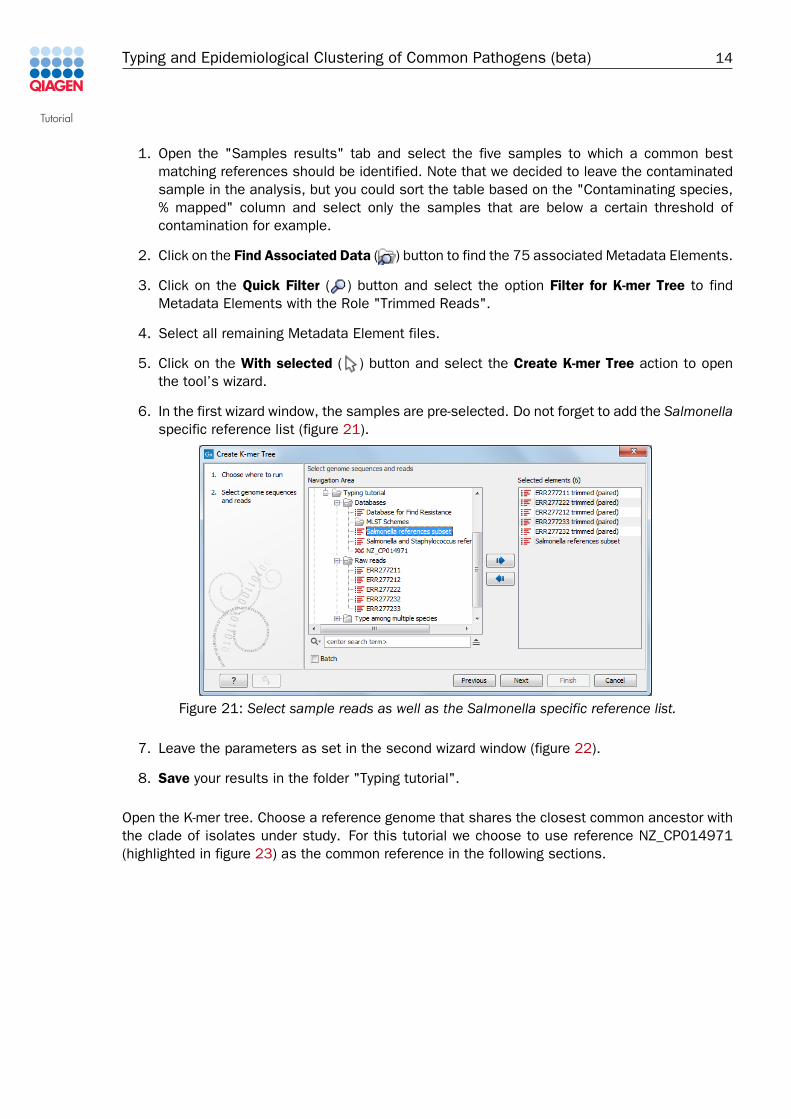
6. In the first wizard window, the samples are pre-selected. Do not forget to add the Salmonellaspecific reference list (figure 21).
Figure 21: Select sample reads as well as the Salmonella specific reference list.
7. Leave the parameters as set in the second wizard window (figure 22).
8. Save your results in the folder "Typing tutorial".
Open the K-mer tree. Choose a reference genome that shares the closest common ancestor withthe clade of isolates under study. For this tutorial we choose to use reference NZ_CP014971(highlighted in figure 23) as the common reference in the following sections.

Tutorial
Typing and Epidemiological Clustering of Common Pathogens (beta) 15
Figure 22: Default parameters for the "Create K-mer Tree" tool, including the view setting set toK-mer Tree Default.
Figure 23: K-mer Tree with NZ_CP014971 highlighted in red.

Tutorial
Typing and Epidemiological Clustering of Common Pathogens (beta) 16
Map to Specified Reference
As we saw previously, to be able to run multiple sample data sets in batch mode you mustinitially make a copy of the template workflow, specify your Result Metadata Table and save thecopy of the workflow in the Navigation Area before running it.
1. Select the workflow Map to Specified Reference in the Toolbox, right-click on the name andchoose the option Open Copy of Workflow (figure 24).
Figure 24: Open a copy of a workflow.
2. This opens a copy of the workflow in the view area of your workbench. Double click onthe Map Reads to Reference element. This will open a window where you can specify thereference sequence to "NZ_CP014971" (figure 25). Click on Finish.
Figure 25: Specify the references to "NZ_CP014971".
3. Now double click on the green tile representing the Result Metadata Table input file. Itopens a window where you have to specify the Result Metadata Table called "Samplesresults" you created for this tutorial. Click on Finish.
4. Save the workflow by simply dragging the tab to the relevant location in your NavigationArea.
5. Switch back to your Result Metadata Table. Select again the 5 Metadata Elements thathave their role set to "Trimmed Reads". Note that you could also use the untrimmed reads(elements whose role is "Sample") as the workflow includes a trimming step.
6. Click on the With selected ( ) button and select the Copy of Map to Specified Referenceworkflow.
7. A wizard similar to the one showed in figure 26 will appear. The samples are pre-selectedbecause you started the workflow directly from the Metadata Elements table. Remember tocheck the option Batch.
8. The next wizard window gives an overview of the selected samples. Click Next.

Tutorial
Typing and Epidemiological Clustering of Common Pathogens (beta) 17
Figure 26: The "trimmed reads" you want to map to the reference are pre-selected.
9. In the third wizard window, you can see the Result Metadata Table specified earlier (called"Samples results"). It is pre-selected because you configured the workflow before saving itin the Navigation Area. Click Next.
10. Leave all parameters of the "Trim Reads" dialog as they are set by default and just clickNext.
11. In the "Map Reads to Reference" window, you can see that the select reference specifiedearlier is already selected. Click Next.
12. In the "Basic Variant Detection" window, leave parameters as default and click Next.
13. In the last Result Handling window, we recommend saving the results in separate folderswithin a new folder you can call "Map to Specified Reference".
Note that the tool will output, among other files, variant tracks. It is possible to export multiplevariant track files from monoploid data into a single VCF file with the Multi-VCF exporter. Thisexporter is uploaded to the workbench when installing the Microbial Genomics Module. All varianttrack files must have the same reference genome for the Multi-VCF export to work.
Tree generation and visualization
Once the Map to Specified Reference workflow has finished, it is possible to create a SNPtree. There are two ways to initiate creation of a SNP tree: from the Result Metadata Table (asdescribed in the following section) or by running the tool from the Toolbox.
1. In the Result Metadata Elements table, click on the Quick Filters ( ) button to clearprevious filters.
2. Click on the Refresh button. We can see that there are now 95 elements in total associatedwith the five samples selected in the Result Metadata Table (figure 27).

Tutorial
Typing and Epidemiological Clustering of Common Pathogens (beta) 18
3. Click on the Quick Filters ( ) button again and select the Filter Remapped ’(NZ_CP014971)’for SNP Tree option (highlighted in figure 27).
Figure 27: The option "Filter Remapped ’(NZ_CP014971)’ for SNP Tree" only select files that werere-mapped using a common reference.
4. Select all the remaining elements (5 Read mapping and 5 Variants tracks).
5. Click on the With selected ( ) button and select the Create SNP Tree option.
6. The "Create SNP Tree" wizard is then displayed and five read mappings are pre-selected asinput (figure 28). Click Next.
Figure 28: The read mappings are pre-selected to build the SNP tree.
7. In the next wizard window, you can see that the variant tracks are also automaticallypre-selected (figure 29), as is the "Samples results" Result Metadata Table. Leave theother parameters as default and click Next.

Tutorial
Typing and Epidemiological Clustering of Common Pathogens (beta) 19
Figure 29: Parameters to create the SNP tree are pre-selected when you use the Result MetadataTable to start the tree.
8. In the Tree construction algorithm dialog, choose to construct the tree using MaximumLikelihood and click Next.
9. Set the Nucleotide substitution model to HKY and check the option to Perform a bootstrapanalysis with 100 replicates. Leave the remaining parameters as default (figure 30).
Figure 30: Maximum lieklihood parameters.
10. Choose to save the data, select a location and click on Finish.
Open the generated SNP tree file and explore the settings in the right hand side panel to fitthe visualization to your needs. An example is shown in figure 31. The following settings wherechosen:
• Tree layout - Ordering as Increasing

Tutorial
Typing and Epidemiological Clustering of Common Pathogens (beta) 20
• Metadata - Label text as Name
• Metadata layer #1 MLST
• Metadata layer #2 Serotype
• Metadata layer #3 Outbreak No
Color coding can be modified by clicking on the associated color marks. Read more onTree Settings in general in CLC Genomics Workbench manual, section http://resources.qiagenbioinformatics.com/manuals/clcgenomicsworkbench/current/index.php?manual=Tree_Settings.html.
Figure 31: Visualization of metadata as well as analysis results on the SNP tree.
Results and metadata available during tree generation can also be used to explore and decoratethis epidemiologically relevant information on the phylogenetic tree.

Tutorial
Typing and Epidemiological Clustering of Common Pathogens (beta) 21
References[Leekitcharoenphon et al., 2014] Leekitcharoenphon, P., Nielsen, E. M., Kaas, R. S., Lund, O.,
and Aarestrup, F. M. (2014). Evaluation of whole genome sequencing for outbreak detectionof salmonella enterica. PLoS One, 9(2):e87991.