Embed Size (px)
Citation preview

Tutorial on Biological Vision- 1
1. The last 500 Million Years of Evolution
Taxonomists have struggled mightily in organizing the animal kingdom by familiar traits [1.2]. They have usuallyconsidered about 12 different traits as important. By selecting these traits in different order, they have constructedmany family trees representing the evolution of all animals from a single cell ancestor. A sequence that has beenuseful and widely published is:
+ Type of body symmetry+ Presence or absence of a coelom, an intestinal tract+ Presence or absence of a digestive system+ Type of skeleton
This sequence has led to the widely recognized dichotomies, vertebrates versus invertebrates OR chordates versusnon chordates OR internal versus external skeletons. It has also generated the much more formal dichotomydividing all animals into Protostomia and Deuterostomia, which also conform approximately to non-chordates andchordates respectively. These formal names have led to the formal Diphyletic Theory of Phylogeny. This theory isnot well suited to describing animal vision.
Figure 1.1.1-1 provides a more detailed phylogenic tree describing the bilaterally symmetrical animals. It is basedon two traits. First, it is based on the form of the eyes used in the animal kingdom. It is also based on an unusualsecond trait. This second trait is based on the molecular form of a s116pecific retinoid found in the animals. Theretinoids are a large group of organic chemicals based on the structure of Vitamin A. The name retinoid is derivedfrom the common name for Vitamin A, retinal. This vitamin has had a close association with vision since itsdiscovery in the early 1900's.
The figure includes a bottom row to help orient the reader. With the recent discovery of the hyperthermophiles(primarily tube worms at the bottom of the ocean near hot water vents), the most recent classification of lifecontains three branches. The first and possibly oldest is Archaea. It is a prokaryote that does not rely upon oxygenin its metabolism (the hyperthermophiles). The second branch contains the oxygen loving prokaryotes, theBacteria. The third branch includes the eukaryotes that include the plant and animals. In this arrangement, theAlgae and Fungi are considered plants. Protozoa remain grouped with the animals. Many primitive animalsplaced between the protozoa and the first animal of interest in vision continue to live to this day. These animalsdivide into two fundamental groups. Group I includes animals that lack a symmetry with respect to their featuresor exhibit a point symmetry. This symmetry is found in cylindrical animals and starfish. Many animals in thisgroup, such as the round worms, lack any obvious structural symmetry. Group II animals generally exhibit abilateral symmetry. It begins with the very simple flat worms. They are assigned to the Phylum, Annelida. Thefirst animal to exhibit a primitive vision capability was an early bilaterally symmetrical flat worm known asAnnelida Planaria.
The bilateral feature seems to have been the key to success in evolution. Annelida soon evolved into threeadditional phyla that form the cornerstones of animal life today. These additional phyla exhibit substantiallydifferent forms based on their skeletons. Mollusca includes a wide range of essentially skeleton-free, soft bodiedanimals. Most of these animals are aquatic. Arthropoda include a similarly wide range of animals with anexterior shell-like skeleton. The insects, spiders and many other classes and families are members of this phylum. Chordata include animals with well-defined internal skeletons, although the skeletons need not be completelycalcified. The internal skeleton allows the animal to grow larger without needing to shed its skeleton. On theother hand, many members of Chordata display a keratinoid-based external structure providing some protectionfound in an external skeleton. These structures are usually localized and do not impede growth. Many animalswithin Chordata belong to the class, Vertebrata. Vertebrata is also known by the name Craniata indicative of thehard skeletal case enclosing the central nervous system, the brain.
2 Guide to Processes in Biological Vision
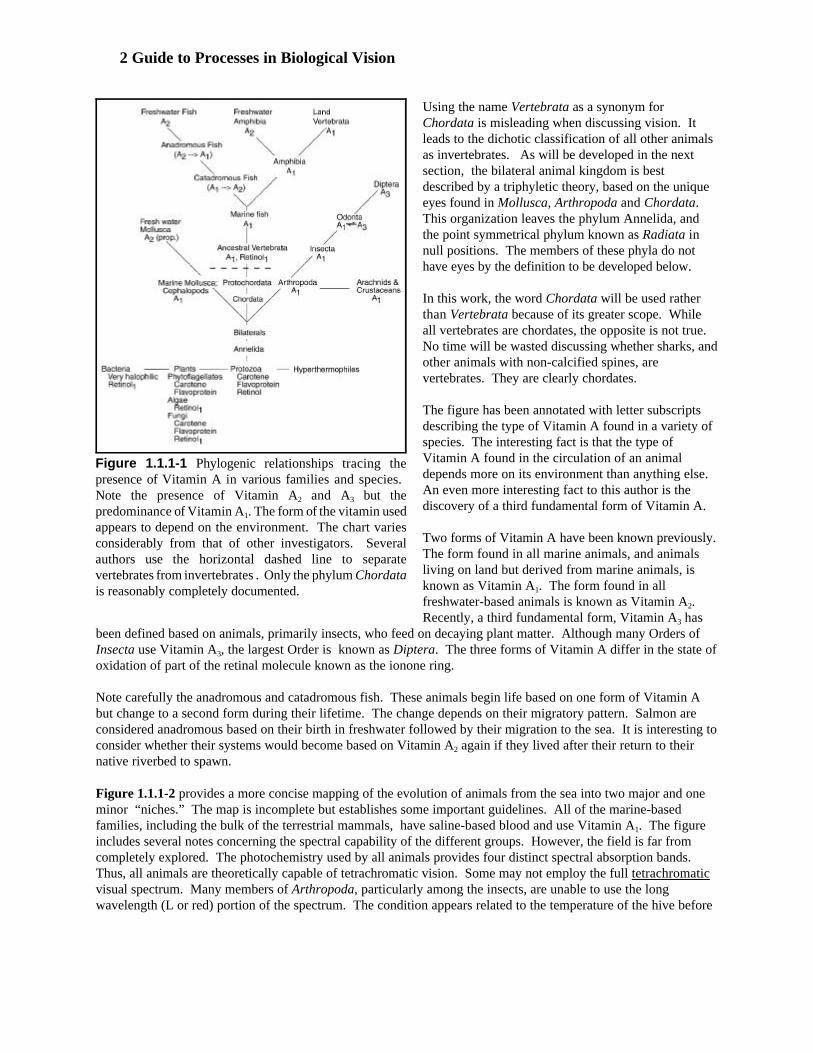
Figure 1.1.1-1 Phylogenic relationships tracing thepresence of Vitamin A in various families and species. Note the presence of Vitamin A2 and A3 but thepredominance of Vitamin A1. The form of the vitamin usedappears to depend on the environment. The chart variesconsiderably from that of other investigators. Severalauthors use the horizontal dashed line to separatevertebrates from invertebrates . Only the phylum Chordatais reasonably completely documented.
Using the name Vertebrata as a synonym forChordata is misleading when discussing vision. Itleads to the dichotic classification of all other animalsas invertebrates. As will be developed in the nextsection, the bilateral animal kingdom is bestdescribed by a triphyletic theory, based on the uniqueeyes found in Mollusca, Arthropoda and Chordata. This organization leaves the phylum Annelida, andthe point symmetrical phylum known as Radiata innull positions. The members of these phyla do nothave eyes by the definition to be developed below.
In this work, the word Chordata will be used ratherthan Vertebrata because of its greater scope. Whileall vertebrates are chordates, the opposite is not true. No time will be wasted discussing whether sharks, andother animals with non-calcified spines, arevertebrates. They are clearly chordates.
The figure has been annotated with letter subscriptsdescribing the type of Vitamin A found in a variety ofspecies. The interesting fact is that the type ofVitamin A found in the circulation of an animaldepends more on its environment than anything else. An even more interesting fact to this author is thediscovery of a third fundamental form of Vitamin A.
Two forms of Vitamin A have been known previously. The form found in all marine animals, and animalsliving on land but derived from marine animals, isknown as Vitamin A1. The form found in allfreshwater-based animals is known as Vitamin A2. Recently, a third fundamental form, Vitamin A3 has
been defined based on animals, primarily insects, who feed on decaying plant matter. Although many Orders ofInsecta use Vitamin A3, the largest Order is known as Diptera. The three forms of Vitamin A differ in the state ofoxidation of part of the retinal molecule known as the ionone ring.
Note carefully the anadromous and catadromous fish. These animals begin life based on one form of Vitamin Abut change to a second form during their lifetime. The change depends on their migratory pattern. Salmon areconsidered anadromous based on their birth in freshwater followed by their migration to the sea. It is interesting toconsider whether their systems would become based on Vitamin A2 again if they lived after their return to theirnative riverbed to spawn.
Figure 1.1.1-2 provides a more concise mapping of the evolution of animals from the sea into two major and oneminor “niches.” The map is incomplete but establishes some important guidelines. All of the marine-basedfamilies, including the bulk of the terrestrial mammals, have saline-based blood and use Vitamin A1. The figureincludes several notes concerning the spectral capability of the different groups. However, the field is far fromcompletely explored. The photochemistry used by all animals provides four distinct spectral absorption bands. Thus, all animals are theoretically capable of tetrachromatic vision. Some may not employ the full tetrachromaticvisual spectrum. Many members of Arthropoda, particularly among the insects, are unable to use the longwavelength (L or red) portion of the spectrum. The condition appears related to the temperature of the hive before

Figure 1.1.1-2 Mapping of phylogenic families by environment. Keyconsiderations involve the salinity of the environment, the food supply and theindex of refraction of the visual medium.
their birth. It is well established that they can use the ultraviolet (UV), short (S) and Mid (M) wavelengthchromophores of animal vision. They can be considered “short-wavelength” trichromats. Among Chordata, mostanimals sense light in all four spectral regions and are tetrachromats (at least during part of their lifetime). Thecontrolling factors are the size of the animal and its environment. Large terrestrial animals (like man) areparticularly susceptible to the loss of ultraviolet performance. As they grow larger, the thickness of the lens oftheir eye grows proportionally thicker. As a result, the absorption of their lens at wavelengths shorter than 400 nmin the ultraviolet becomes greater. This absorption restricts, but does not eliminate, the operation of the ultravioletspectral channel of vision. Animals in this category can be considered blocked tetrachromats. They are recognizedby the label 3.5 in the figure. Blocked tetrachromats (such as man) are typically labeled trichromats.
A particularly large open questionremains concerning how manyspectral channels are employed byMollusca. While many members ofthe phylum display color visioncapabilities, the number of spectralchannels may vary by species andfamily.
When migrating to freshwateraquatic environments, the familiesretain their spectral capability butnow employ Vitamin A2 in growthand vision. As mentioned above,carrion feeders among Arthropodaare now known to employ VitaminA3 in their bodily functions. Theshift in the secondary structure ofthe retinoid causes no significanteffect on the spectral response ofthese animal.
The literature contains an interesting dichotomy right now concerning the highly inferential science matchinggenetics to the features expressed by the genetic code in various animals (including humans). Several groups havesought and identified three putative genes responsible for the putative trichromatic vision of humans. However,equally good data is available showing that the human retina is sensitive to the complete visual spectrum,including the ultraviolet. This performance clearly requires the isolation of four genes not three. If the geneticistis correct and he has isolated the genes responsible for color vision in humans, and that spectral data is correct thathuman vision employs four chromophores, why are there only three genes?
Figure 1.1.1-3 expands on the above phylogenic trees and will form a convenient reference. The tree isabbreviated, but remains based on the sequences discussed above. It explicitly recognizes the skeletal typesassociate with each phylum and shows a parallel between skeletal type and eye type. The species named in the topline are those exhibiting unique characteristics that will be touched upon in this tutorial. Several appear frequentlyas subjects in the laboratory literature.

4 Guide to Processes in Biological Vision
Figure 1.1.1-3 An abbreviated Phylogenic Tree focused on the visual aspects of taxonomy. All of the animals shownare bilaterally symmetrical. Planaria can be considered the simplest of the bilaterals. All of the animals to the rightof Planaria have a coelom. As indicated by the subtitles within the phylum boxes, each phylum has a different bodystructure and each phylum has evolved a functionally and structurally different visual system. Planaria, Copilia andLimulus evolved in ancient times but are still available for study. Also noted are the names of other species that haveplayed a major role in the literature of vision. Copilia and Araneae are the only known eyes where the photoreceptorsscan separately from, and behind, the lens.
Each major phylum has adopted a fundamentally different form of eyes. The details of these will be developedbelow. Overall, the fundamental eye type is phylum-specific. However, there appears to be some overlap. Theliterature suggests that some species of Mollusca employ a few compound eyes along with their complex eyes. This would suggest that they carried forward compound eyes from an earlier evolutionary period or they evolvedthis type of eye independently (a process called evolutionary convergence). Whether members of Mollusca exhibitactual compound eyes may be a matter of precision in definition. Alternately, it may be an evolutionary issue. Noexamples of evolutionary borrowing or significant convergence have been reported among Chordata. However,experimentation with unique variations upon the fundamental eye configurations is found in all phyla. Strikingexamples of mechanical scanning of the eyes or eye components are found in all phyla. Mechanical scanning isparticularly important among the higher primates.
Limulus, also known in the vernacular as the horseshoe crab or king crab, illustrates the difficulty of forming aphylogenic tree. Limulus has existed for so long, it affects the development of any chronologically basedphylogenic tree. Limulus is not a crab (Subphylum Mandibulata, Order Decapoda). It belongs to a distinctlydifferent subphylum of Arthropoda called chelicerata. Though it exhibits a prominent hard mantle, it is clearlynot a member of Mollusca. Turning the animal over displays its exoskeleton. The mantle is unusual in having twocompound eyes embedded in it. While modified in interesting ways, these are the eyes of Arthropoda. TheLimulus literature is particularly inconsistent regarding its eyes. Some researchers have counted light-sensitivephotospots (defined below) located within vascular tissue as eyes. Others have provided descriptions of eyes thatcan be interpreted as either compound or complex.
Tutorial on Biological Vision- 5
2. The Variation among Eyes is Enormous
Most multi-celled animals are light sensitive [1.7]. As one ascends the evolutionary tree, the simplest animalsbegin to exhibit specialized cells sensitive to light. They invariably respond to light by attempting to move awayfrom it. The round worms frequently exhibit light-sensitive cells on the surface of their “leading end.” Thesepatches will be defined as photospots because they have no lens assembly. Early in the development of the flatworms, a bilaterally symmetrical species appeared known as planaria. Planaria developed a pair of ridges thatcan be considered the first “eyebrows.” These ridges acted as light stops. As a result, the photospots are placed inshadow when the animal is oriented properly with respect to the light source. Thus, the animal gained a greaterdegree of discrimination with respect to the direction of the light. Because of the precise orientation of these“eyebrows,” Planaria has earned the descriptor, “cross-eyed.”
A second evolutionary feature was to recognize that the photospots were cells located on the animals exteriorsurface. They were sensitive to light from any direction. By forming ridges that enclosed three of the four sides ofsuch cells, additional directional capability was achieved. Through additional evolution, two configurations ofphotospots emerged. The first could only be illuminated by light passing through the neural portion of the cell(labeled inverse photo spots). The second could only be illuminated by light not passing through the neural tissue(labeled direct photospots). This difference becomes a fundamental difference between the eyes of Mollusca andChordata.
The next two evolutionary developments occurred essentially in parallel and their statistical combination resultedin a great variety of eyes. Here the term lens must be replaced with the term aperture for reasons that will becomeobvious. If a photospot near the “leading end” of an animal could be enclosed by a ridge on three sides, it was nottoo difficult to evolve further. By revolving this structure about the axis through the photospot and the open area, a“camera” was created. The basic definition of a camera is an enclosed space with only one (entry) aperture. Thisdefinition is frequently associated with a secure luggage room at a railway station in Europe, Russia, etc. It wasonly through the efforts of George Eastman that the term was broadened to include a photographically sensitivematerial on the side of the chamber opposite the aperture.
Simultaneous with the evolution of the camera structure, the photosensitive cell, or cells, began to proliferate andto evolve into four spectrally selective types. Some of these spectrally selective types also evolved into unique physical orientations, relative to the line between the cell location and the aperture, that provided polarizationselective information. The resulting minimal groups of spectrally, and polarization, selective types are now foundin the capsules of Arthropoda eyes. However, in Mollusca and Chordata, these minimal groups replicated intospatially extensive retinas. While Mollusca included the polarization sensitive photoreceptors in its minimalgroups, Chordata did not. Where needed, Chordata introduced different mechanisms to sense polarization of theincident light.
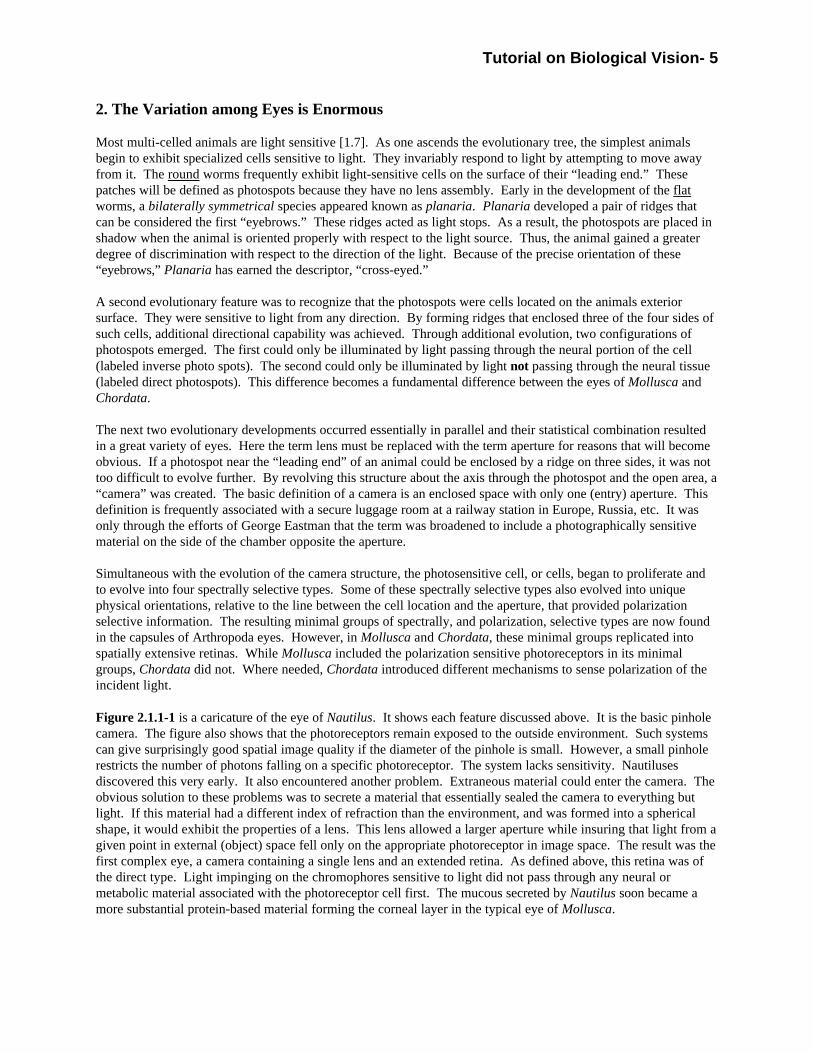
Figure 2.1.1-1 is a caricature of the eye of Nautilus. It shows each feature discussed above. It is the basic pinholecamera. The figure also shows that the photoreceptors remain exposed to the outside environment. Such systemscan give surprisingly good spatial image quality if the diameter of the pinhole is small. However, a small pinholerestricts the number of photons falling on a specific photoreceptor. The system lacks sensitivity. Nautilusesdiscovered this very early. It also encountered another problem. Extraneous material could enter the camera. Theobvious solution to these problems was to secrete a material that essentially sealed the camera to everything butlight. If this material had a different index of refraction than the environment, and was formed into a sphericalshape, it would exhibit the properties of a lens. This lens allowed a larger aperture while insuring that light from agiven point in external (object) space fell only on the appropriate photoreceptor in image space. The result was thefirst complex eye, a camera containing a single lens and an extended retina. As defined above, this retina was ofthe direct type. Light impinging on the chromophores sensitive to light did not pass through any neural ormetabolic material associated with the photoreceptor cell first. The mucous secreted by Nautilus soon became amore substantial protein-based material forming the corneal layer in the typical eye of Mollusca.
6 Guide to Processes in Biological Vision
Figure 2.1.1-1 Eye of the primitive mollusc, Nautilus.The most well known pin-hole camera in the Animalkingdom. The tissue forming the aperture has the potentialto secrete material to form a lens.
2.1 Each Phylum has a distinctive eyearchitecture
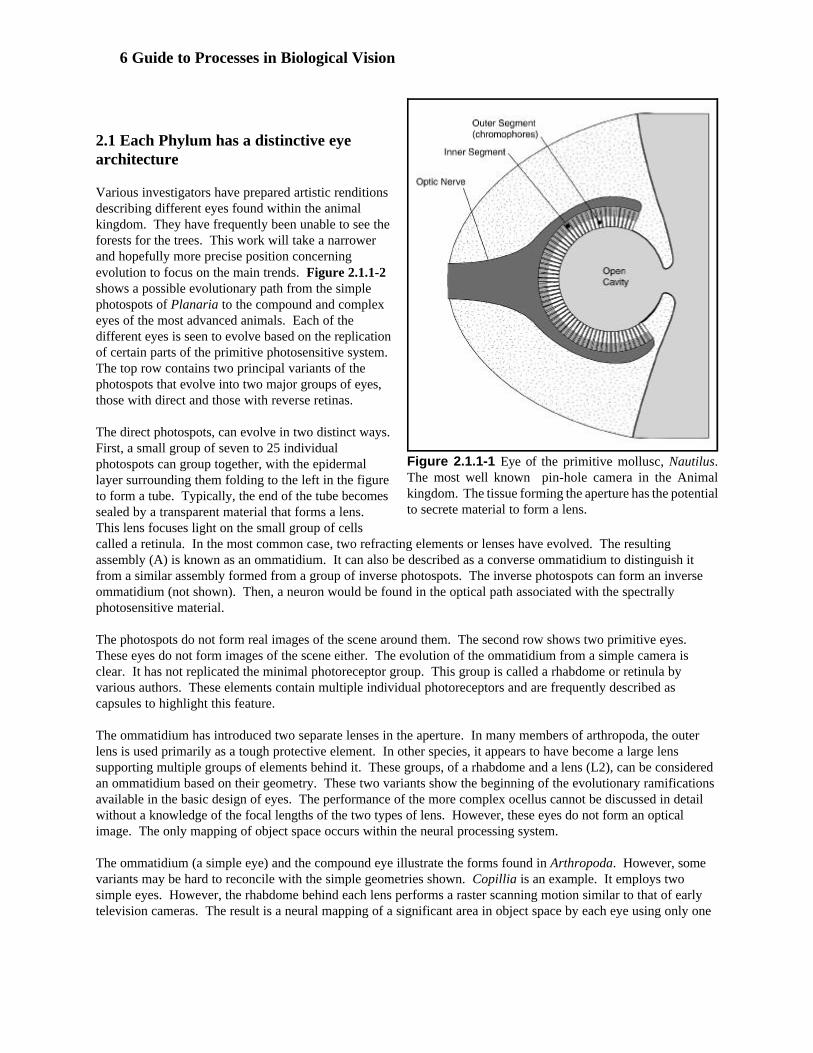
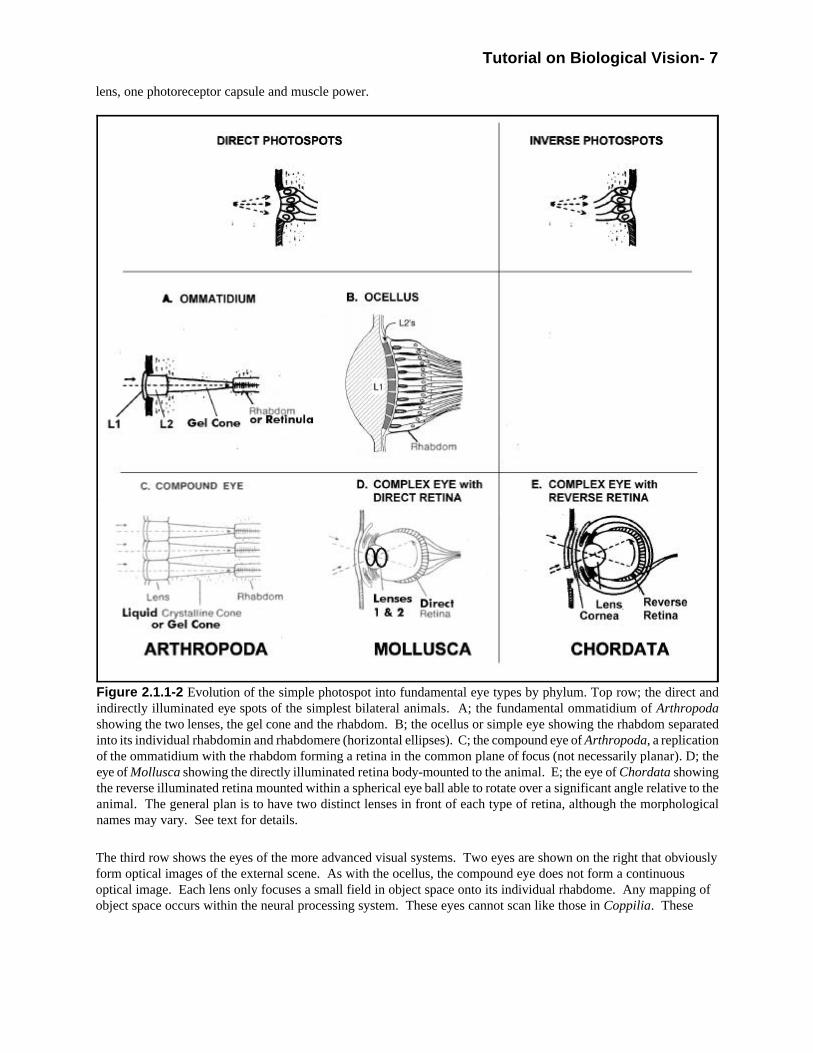
Various investigators have prepared artistic renditionsdescribing different eyes found within the animalkingdom. They have frequently been unable to see theforests for the trees. This work will take a narrowerand hopefully more precise position concerningevolution to focus on the main trends. Figure 2.1.1-2shows a possible evolutionary path from the simplephotospots of Planaria to the compound and complexeyes of the most advanced animals. Each of thedifferent eyes is seen to evolve based on the replicationof certain parts of the primitive photosensitive system. The top row contains two principal variants of thephotospots that evolve into two major groups of eyes,those with direct and those with reverse retinas.
The direct photospots, can evolve in two distinct ways. First, a small group of seven to 25 individualphotospots can group together, with the epidermallayer surrounding them folding to the left in the figureto form a tube. Typically, the end of the tube becomessealed by a transparent material that forms a lens. This lens focuses light on the small group of cellscalled a retinula. In the most common case, two refracting elements or lenses have evolved. The resultingassembly (A) is known as an ommatidium. It can also be described as a converse ommatidium to distinguish itfrom a similar assembly formed from a group of inverse photospots. The inverse photospots can form an inverseommatidium (not shown). Then, a neuron would be found in the optical path associated with the spectrallyphotosensitive material.
The photospots do not form real images of the scene around them. The second row shows two primitive eyes. These eyes do not form images of the scene either. The evolution of the ommatidium from a simple camera isclear. It has not replicated the minimal photoreceptor group. This group is called a rhabdome or retinula byvarious authors. These elements contain multiple individual photoreceptors and are frequently described ascapsules to highlight this feature.
The ommatidium has introduced two separate lenses in the aperture. In many members of arthropoda, the outerlens is used primarily as a tough protective element. In other species, it appears to have become a large lenssupporting multiple groups of elements behind it. These groups, of a rhabdome and a lens (L2), can be consideredan ommatidium based on their geometry. These two variants show the beginning of the evolutionary ramificationsavailable in the basic design of eyes. The performance of the more complex ocellus cannot be discussed in detailwithout a knowledge of the focal lengths of the two types of lens. However, these eyes do not form an opticalimage. The only mapping of object space occurs within the neural processing system.
The ommatidium (a simple eye) and the compound eye illustrate the forms found in Arthropoda. However, somevariants may be hard to reconcile with the simple geometries shown. Copillia is an example. It employs twosimple eyes. However, the rhabdome behind each lens performs a raster scanning motion similar to that of earlytelevision cameras. The result is a neural mapping of a significant area in object space by each eye using only one
Tutorial on Biological Vision- 7
Figure 2.1.1-2 Evolution of the simple photospot into fundamental eye types by phylum. Top row; the direct andindirectly illuminated eye spots of the simplest bilateral animals. A; the fundamental ommatidium of Arthropodashowing the two lenses, the gel cone and the rhabdom. B; the ocellus or simple eye showing the rhabdom separatedinto its individual rhabdomin and rhabdomere (horizontal ellipses). C; the compound eye of Arthropoda, a replicationof the ommatidium with the rhabdom forming a retina in the common plane of focus (not necessarily planar). D; theeye of Mollusca showing the directly illuminated retina body-mounted to the animal. E; the eye of Chordata showingthe reverse illuminated retina mounted within a spherical eye ball able to rotate over a significant angle relative to theanimal. The general plan is to have two distinct lenses in front of each type of retina, although the morphologicalnames may vary. See text for details.
lens, one photoreceptor capsule and muscle power.
The third row shows the eyes of the more advanced visual systems. Two eyes are shown on the right that obviouslyform optical images of the external scene. As with the ocellus, the compound eye does not form a continuousoptical image. Each lens only focuses a small field in object space onto its individual rhabdome. Any mapping ofobject space occurs within the neural processing system. These eyes cannot scan like those in Coppilia. These
8 Guide to Processes in Biological Vision
compound eyes usually cover a large area of the head of the animal and interrogate a large volume in object space.When desiring to interrogate a different optical volume in object space, the head is usually rotated through a largeand obvious angle.
The eyes of Mollusca have not been well characterized with respect to their geometry or their spectral performance. The higher members of Mollusca employ complex eyes with direct retinas. These appear to have evolved from theeye of Nautilus discussed above. Two lenses appear to have evolved in these eyes along with an outer covering thatis not movable. In some of these animals, an iris has also developed that appears to be between the outer coveringand the lens group. Some of these irises have highly tailored and unusual shapes. In lower members of Mollusca,a similar eye has developed. Its geometry appears to be of the ocellus type. The literature is not clear whether themore primitive eyes of Mollusca are simpler versions of the complex eye with a direct retina or whether they sharean origin with the compound eye of Arthropoda.
The eyes to the left of the vertical line all involve direct retinas. Those on the right employ reverse retinas.
All of the known eyes of Chordata employ the complex eye with a reverse retina. This configuration introduces asignificant set of problems but also provides for the development of the human eye. The most obvious problem isthe existence of the blood vessels and other structures supporting the retina in the optical path of the incident light. Worse, these elements are found very close to the image plane where they are very near to being in focus.
To achieve the high rotational flexibility of the chordate eye, the number of neurons in the optical nerve has beengreatly reduced compared with eyes in Mollusca and Chordata with similar numbers of photoreceptors. This hasrequired that more signal processing be accomplished within the ocular. The only potential location for therequired neural circuitry in the reverse retina eye is in the path of the incident light. To achieve rotationalflexibility, the eye of chordate has further complicated the optimization required to achieve high acuity. The nextsection will show how the chordate has overcome the problems with this configuration to achieve unprecedentedperformance in acuity over a large field of view.
Chordata has taken a different approach than Arthropoda and Mollusca to the protection of the eyes. Instead of asingle hard outer covering for physical protection the basic Chordate eye has evolved two distinctly separateflexible and movable eye lids. This redundant feature has evolved in a variety of directions.
Complex eyes (D) and (E) also exhibit important mounting arrangements that are critical to their operation. Thesefeatures will be discussed in the following section.
2.2 The Chordate eye and the significance of the reverse retina
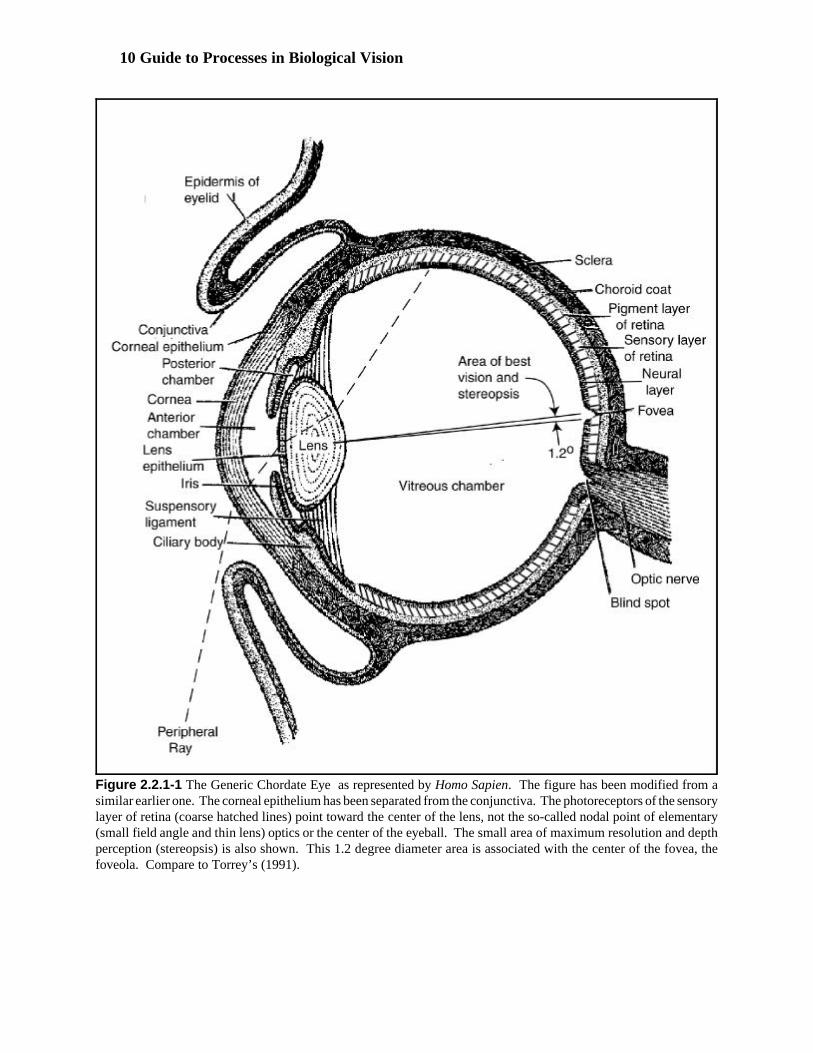
Figure 2.2.1-1 provides details of the anatomy of the human eye as representative of the phylum Chordata [2.4]. Itis important to note however, most chordate eyes are not round. The human eye is remarkable in this respect. This feature allows it to rotate much more freely than other chordate eyes. The figure differs from other similarfigures in several respects. First, the area of the foveola is shown explicitly as the area of 1.2 degrees diameter atthe very center of the larger fovea. Stereopsis, or precision imaging in three dimensions, is only achieved withinthis area [7.4.4]. The precision of depth perception falls by more than two orders of magnitude outside the 1.2degree field shown Spatial resolution also decreases precipitously outside this region.
The larger fovea has a diameter of 6.5 degrees in image space (8.7 degrees in object space). Noting that light raysdo not pass straight through the optics of the eye on the way to the retina, as shown by most authors, is important. Because of the difference in index of refraction of the air outside the eye and the anterior and vitreous humors, therays are bent significantly according to Snell’s Law. For an external ray approaching the pupil at 70 degrees fromthe optical axis, its internal extension leaves the lens at an angle of 45 degrees from the axis.

Tutorial on Biological Vision- 9
The foveola is not found exactly on the optical axis. It is displaced about 5.5 degrees as referred to object space bythe typical optometrist or ophthalmologist. Measured from the back focal point of the lens, the angle would beabout 4.1 degrees. Optometrist and Ophthalmologists like to use the paraxial approximation first introduced byNewton but now known under the name Gaussian Optics. It simplifies the mathematics of the lens considerablybut only applies to rays approaching the eye from within one degree of the optical axis. The 1.2 degree diameter ofthe foveola in object space is only 0.9 degrees in image space. Although slightly off-axis, its features andperformance can be described using the paraxial approximation.
The paraxial approximation defines a nodal point along the optical axis at a distance from the retina of 75% of theback focal distance. This point is near the center of the ocular globe. This location has caused many authors toshow all of the photoreceptors of the retina pointing toward this nodal point. However, this is a major error. All ofthe photoreceptors point toward the back focal point (along the optical axis near the back surface of the lens). Thisback focal point is also known as the 2nd principal point. For photoreceptors pointing elsewhere, performance isdegraded significantly and the subject has a pathological problem.
Finally, this eye is not typical of Chordata because it only exhibits one bilateral eyelid. Many chordates possesstwo eyelids. The second is a nictating eyelid that consists of only a single membrane. When extended, this eyelidcompletely covers the cornea. It is used for a variety of protective and adaptive purposes. The most striking is itsuse by diving birds, and other animals living at the air-water interface. They use the nictating eyelid as anauxiliary lens to compensate for the change in the index of refraction between air and water. When under water,they see as clearly as they do in the air.
While not commonly stressed in the literature, it is not the “lens” but the cornea that is the most powerful lens inthe human visual system. The cornea has a nominal power of 43 diopters while the power of the lens variesbetween 15 and 25 diopters in its autofocus role.
A further correction regards the cornea. The cornea is not of uniform thickness. The inner radius is shorter thanthe outer radius. This causes the cornea to be thinner on-axis than at its edge. As a result, the cornea is a negativemeniscus lens, a key feature of all wide angle optical systems. The optical power of the outer surface is nominally49 diopters and the inner surface has a nominal power of – 6 diopters.
The dashed line shows the effect of the autofocus lens and the meniscus lens of the cornea acting together. Anoptical ray approaching the eye at 70 degrees from the optical axis, leaves the autofocus lens at 45 degrees.
10 Guide to Processes in Biological Vision
Figure 2.2.1-1 The Generic Chordate Eye as represented by Homo Sapien. The figure has been modified from asimilar earlier one. The corneal epithelium has been separated from the conjunctiva. The photoreceptors of the sensorylayer of retina (coarse hatched lines) point toward the center of the lens, not the so-called nodal point of elementary(small field angle and thin lens) optics or the center of the eyeball. The small area of maximum resolution and depthperception (stereopsis) is also shown. This 1.2 degree diameter area is associated with the center of the fovea, thefoveola. Compare to Torrey’s (1991).
Tutorial on Biological Vision- 11
3. The Eyes are only part of a Visual System
Unfortunately, the figure describing the morphology of the human eye fails to suggest how the eye actually works. It will be shown that the familiar analogy to a camera fails when applied to vision. The retinas are not made up ofintegrating imaging elements like photographic film. The individual photoreceptors are continuously activechange detectors. The consequences of this will become apparent in Section 8.3. The photoreceptors are notsampled at a regular interval like in a television camera. Thus, the concept of a frame time is different in vision. Such a concept is related more directly to the “flicker or fusion frequency” of the signal processing within the brainthan that within the eyes.
Without including the details of signal processing in both the retina and the rest of the brain, and also the motor-neuron system, understanding the operation of the eye is hindered considerably. What is initially sensed andeventually perceived by the animal is much more complicated than the notion of taking a picture. While crucialcomponents of the visual system, the eyes are relatively simple parts of the overall visual system [2.8]. Thesophistication is in its feature extraction capability and its ability to recognize fine details related to those features. The visual system reaches its pinnacle of sophistication among only a few of the higher primates. In Man, it isepitomized by his ability to read.
Understanding the operation of the visual system is simplified by defining a series of operating modes. Theseinclude the awareness, alarm, analytical, volition, and command modes. While the names were chosen to suggesttheir function, the details related to these modes will be introduced incrementally in the following discussion.
The signal processing system is designed to recognize the limited optical performance of the eye’s optics. Thespatial performance of the optics of the eye falls very rapidly with field angle. The eye is only able to maintainhigh performance over a small portion of the fovea centered near the point of fixation and the foveola. Tomaximize performance, the visual system uses two parallel signal processing paths. The coarse path is associatedwith the awareness and alarm modes of perception. This path involves most the photoreceptors in all visualsystems and corresponds to the full field of view of the animal. Many species also employ a precision pathassociated with the analytical mode of vision. This mode invariably involves a narrower field of view and a subsetof the photoreceptors available. Additional signal paths associated with the volition mode (involving the will of ananimal) will be developed later in this work.
The method of implementing the coarse and precision paths of the visual system vary considerably among species. It is seldom implemented among Arthropoda. However, the spiders form the glaring exception. Their multipleeyes are tailored to meet the objectives of coarse and precision performance. Typically having eight eyes, it ispossible to describe the outer pair as providing coarse peripheral vision associated with the awareness and alarmmodes of operation. Two of the forward facing eyes operate as a pair to provide binocular vision over a relativelywide field of view, generally extending to the peripheral area observed by the previously defined pair. These eyesalso support the awareness and alarm mode. The inner pair of eyes is unique in that they can observe a small areawithin the field of view of the binocular pair. By limiting their field to a small region, they are able to observe thatarea at higher spatial resolution. This higher spatial resolution provides them the analytical capability they need toperform higher precision activities (such as jumping onto their prey from a distance). By distorting the tubeconnecting the photoreceptor capsules of these eyes with their lenses, the spider can cause the precision field ofview of these eyes to scan within the binocular field of the earlier defined pair.
Chordata has taken a different path in implementing both an awareness and alarm mode capability, and a separateanalytical mode capability. Each of the two eyes exhibits a wide field of view with a limited spatial resolution. This limit is imposed primarily by the limited performance of their wide-angle optical system. This capabilityprovides them a significant field of view as required to satisfy the requirements of the awareness and alarm modes. In the more advanced species, an analytical capability has been implemented. This has been achieved byexploiting the limited high resolution capability of the particular wide angle lens system used in the eye. This
12 Guide to Processes in Biological Vision
capability only covers a field of view of a few degrees in object space. It occurs very near the optical axis of thelens. This corresponds to the area known as the foveola in Chordata. To achieve the variable pointing capability,like that of the jumping spider with only one pair of eyes, Chordata has adopted the rotating ocular approach. Thiscapability requires a very flexible optic nerve connecting the oculars to the central nervous system. This flexibilityis achieved by reducing the number of neurons leaving the ocular. Such a reduction is dependent on the reverseretina configuration and the enhanced signal processing associated with it
Mollusca has generally followed the approach of Arthropoda. In some cases, hundreds of ocelli decorate one ormore ridge lines of their exterior anatomy. For the more predatory, and therefore more advanced, members ofMollusca, a complex eye with a direct retina has been used to advantage. This configuration provides much thesame capability as found in Chordata, except the ocular is more solidly mounted to the body. Even here, the squidand octopus have attempted to introduce tremor. The tremor mechanism is critical to the performance of the eyesof higher members of Chordata. This critical capability will be discussed in Section 8.2.
Until recently, exploring and understanding the complete visual system has been difficult because of its packaging. Critical elements of the system were hidden deep within the central nervous system and surrounded by the skull. Recently, magnetic resonance imaging techniques have provided new avenues of exploration that have overcomethese physical barriers. Unfortunately, these techniques are generally slow. Even the new functional magneticresonance technique (fMRI) is unable to provide information about changes occurring within a few millisecondswithin the neural pathways. A technique known as visual evoked potential (VEP) can provide much moretemporally precise data than the magnetic imaging techniques. Combining the results from these techniquesshould soon provide unprecedented clarity on how the visual system works.
3.1 The Building Block Architecture of the Chordate Visual System
While the basic organization of the visual system of all animals is the same, the complexity increases rapidly withposition in the phylogenic tree.
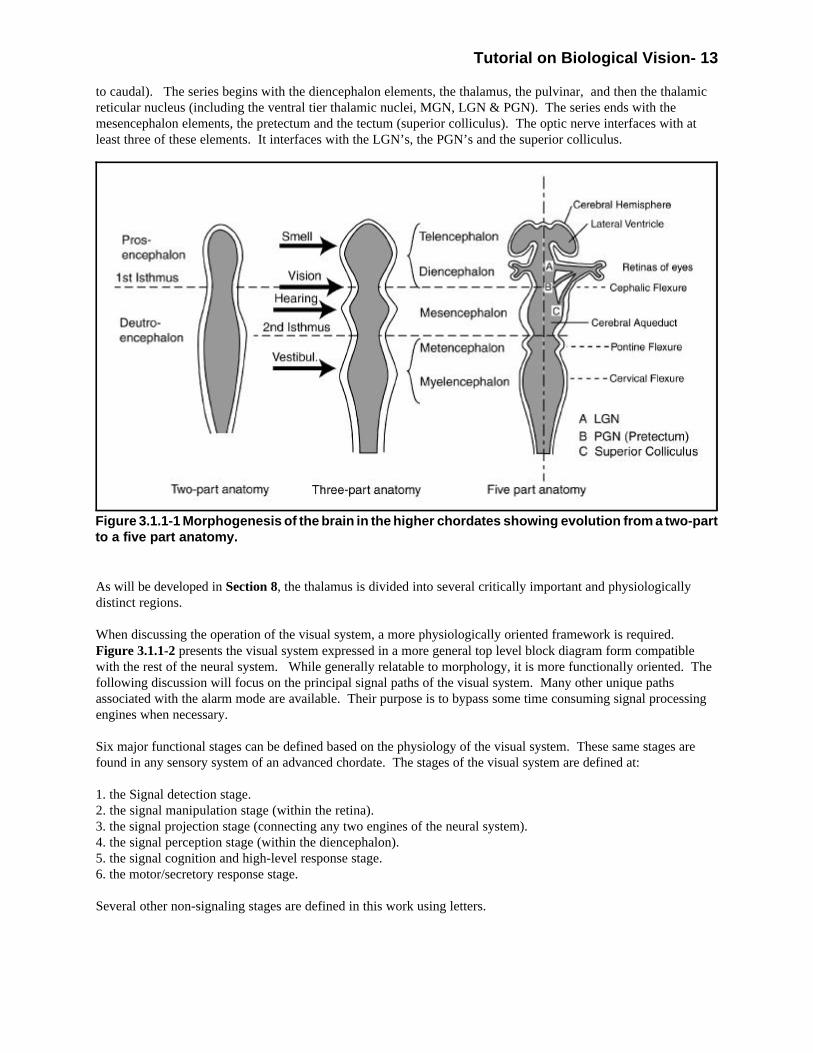
Speaking of the brain in the vernacular is common in the vision literature. Following the common humanproclivity, expressing ideas using a dichotomy is also common. Terms such as fore brain and midbrain are paired,regardless of the species being discussed. This nomenclature frequently overlooks the critical importance of thethalamus of Chordata. This morphological structure is occasionally associated with the forebrain. More often, itis associated with the midbrain. Its importance requires a more precise description. Figure 3.1.1-1 provides aclearer description of the morphological evolution of the brain using more scientific nomenclature. Withsophistication comes complexity. In progressing from the simpler two-part anatomy of the brain to the five-partanatomy associated with the higher chordates, greater precision is required. The transition from the nomenclatureof the three-part anatomy has been tortuous. Whereas the mesencephalon continues to correspond to the midbrainof classic morphology, and the telencephalon has become known as the forebrain, the diencephalon has struggledwith multiple labels. The common appearance of “between-brain” or “interbrain” to describe the diencephalonsuggests the problem. It suggests why it is frequently confused with or associated with the midbrain.
The prefix of the technical name for the forebrain, tele- or distant, should suggest the telecephalon and thediencephalon are not closely related. This is particularly true from the physiological perspective. Themesencephalon, or midbrain is highly involved in motor activities. The telencephalon is the center of cognitiveactivities. It is the diencephalon that is the seat of sensory activity. These activities are concentrated in thethalamus. It is also the control center for the motor activities of the higher primate brain. These activities areshared between the thalamus and the cerebellum (not shown in this figure).
As shown in the illustration, no sharp dividing lines appear related to the functional aspect of the neural system. This makes precise location of various functional elements difficult. To be clear, this work will separate thediencephalon and mesencephalon into the following series of distinct functional elements (proceeding from rostral
Tutorial on Biological Vision- 13
Figure 3.1.1-1 Morphogenesis of the brain in the higher chordates showing evolution from a two-partto a five part anatomy.
to caudal). The series begins with the diencephalon elements, the thalamus, the pulvinar, and then the thalamicreticular nucleus (including the ventral tier thalamic nuclei, MGN, LGN & PGN). The series ends with themesencephalon elements, the pretectum and the tectum (superior colliculus). The optic nerve interfaces with atleast three of these elements. It interfaces with the LGN’s, the PGN’s and the superior colliculus.
As will be developed in Section 8, the thalamus is divided into several critically important and physiologicallydistinct regions.
When discussing the operation of the visual system, a more physiologically oriented framework is required. Figure 3.1.1-2 presents the visual system expressed in a more general top level block diagram form compatiblewith the rest of the neural system. While generally relatable to morphology, it is more functionally oriented. Thefollowing discussion will focus on the principal signal paths of the visual system. Many other unique pathsassociated with the alarm mode are available. Their purpose is to bypass some time consuming signal processingengines when necessary.
Six major functional stages can be defined based on the physiology of the visual system. These same stages arefound in any sensory system of an advanced chordate. The stages of the visual system are defined at:
1. the Signal detection stage.2. the signal manipulation stage (within the retina).3. the signal projection stage (connecting any two engines of the neural system).4. the signal perception stage (within the diencephalon).5. the signal cognition and high-level response stage.6. the motor/secretory response stage.
Several other non-signaling stages are defined in this work using letters.

14 Guide to Processes in Biological Vision
Figure 3.1.1-2 Top level block diagram of the neural system focused on the visual subsystem of Chordata. The stagesdefined in the text are shown. All of the projection neurons of stage 3 (employing action potentials) are shown by thearrows. Each of the boxes shown (except the lower left box) contain at least one million active analog devices. Therole of the thalamic reticular nucleus, TRN, as a “gatekeeper” is highlighted by shading. The parallel roles of theLGN/occipital couple and the PGN/pulvinar couple is highlighted by hatching. The superior colliculus/cerebellumcouple is highlighted by cross hatching.
Noting that all of the above stages, except stage 3, involve analog signal processing is crucial to the understandingof vision. Only about 10% of the neural signals within the system involve pulse signaling (action potentials). Theother 90% of all signals are analog (electrotonic) in character. Each of the signal processing engines representedby a box (except the oculomotor functions represented by the lower left box) contain at least a few million analogneural circuits. Each box also typically contains 1000 ganglion cells generating action potentials (and found nearthe tail of each arrow). The heads of each arrow represent a similar 1000 stellate cells converting the actionpotentials back to analog signals for processing within an engine.
To complicate matters further, most of the signals projected between the engines of the central nervous system areprojected in bit-parallel word format. Within the CNS, most of the information involves complex packets ofinformation transmitted in vector format. This means that no one neural fiber carries an entire message. Multipleindividual fibers carry different parts of the same vectorized message. In the laboratory, multiple neural fibersmust be observed at the same time to discern the meaning of any message transmitted within the CNS. A similarsituation is found with respect to at least the aural and visual sensory systems. Their information is alsotransmitted in a bit-parallel format, although the bits may be skewed in time and position for purposes ofcomputational convenience. This subject is discussed in Section 8.
The two afferent boxes at upper left and the oculomotor box are within, or found next to, the ocular globes inChordata. The signal processing of stage 2 is not found within the eyes in Arthropoda and Mollusca. It is foundin a separate structure or consolidated with the brain. The two boxes at the far right, and the occipital box arelocated within the cerebral hemispheres (the telencephalon). The LGN, PGN, pulvinar and TRN are located

Tutorial on Biological Vision- 15
within the diencephalon [15.6.2]. The superior colliculus and cerebellum are usually associated with themesencephalon.
Two of the stage 4 circuit couples, the LGN/occipital couple and the PGN/pulvinar couple, are each physicallyseparated by stage 3 projection circuits. Both deliver their output to the stage 4 circuits of the parietal lobe.
VEP data exists to show the output of the PGN/pulvinar couple travels directly to the parietal lobe without passingthrough the occipital lobe. VEP and morphological data also exists that suggests that most signals from theLGN/occipital couple pass back through the TRN before proceeding to the parietal lobe. It is the TRN that makesthe final decision on the importance of information passing through it. Thus, the name “primary visual cortex”may not be appropriate for the rear section of the occipital lobe (Brodmann area 17). It is only primary withrespect to the coarse signal path of vision. Understanding these signaling paths is an area of active currentresearch.
Because of the difficulty of accessing the thalamus in the laboratory, knowledge of the physiology of the pulvinarand the thalamic reticular nucleus is very limited. Understanding the complete role of the pulvinar and the TRNare also areas of active research. Clearly, the level of development of the PGN, pulvinar and TRN determine thevisual capability of the higher primates. By combining their psychophysical performance and the model presentedhere, these species can be ranked. Only the great apes of the family Pongidae are competitive with humans. Indescending order of ability, these are the chimpanzee, Pan, the Orangutan, Simia, and the Gorilla, Gorilla. Whenstudying reading and the analysis of fine detail, the lesser apes and monkeys are not homologous with humans. Inmany cases, only the chimpanzee can be considered an adequate surrogate for humans in the laboratory. [1.2.1.5]
The retinotopic character of the afferent signals is continuously degraded as the signals move to the right. Theyare entirely abstract and in vector form beyond the output of the pulvinar and occipital lobes. The vector mapknown as the saliency map has not been located morphologically or physiologically. It is shown under the label#4/#5 to show it receives information from stage 4 circuits and is accessible by stage 5 circuits of the anterior lobe.
3.1.1 The signal processing within the retina of man
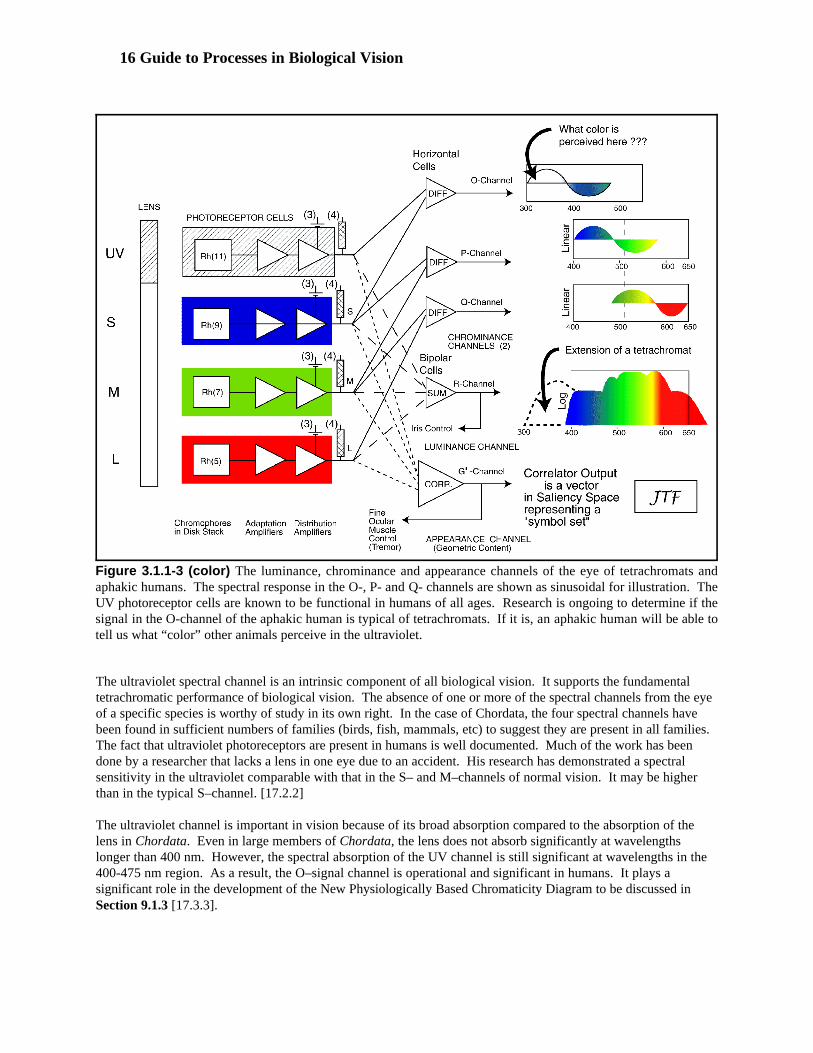
The interface between Stage 1 and Stage 2 circuitry in Chordata is shown in Figure 3.1.1-3 along with the lens ofthe physiological optics, Stage B. [17.2-17.4]. Three crucial situations are illustrated. First, the formation ofmultiple signaling channels at the output of the photoreceptor cells is described. Three chrominance channels, oneluminance channel, and one appearance channel are described. The calculations performed in and the resultingperformance of the appearance channel are unique. They will be described in Section 3.2. Second the subdivisionof the photoreceptor cells into their functional elements is shown. Finally, a graphic representation of the signalscarried by the individual channels at the location of the S-plane of the retina is presented. This figure shows thatthe theory presented here is an extension of the earlier zone theory. It expands the old Young-Helmholtz theory byadding the ultraviolet channel (ultraviolet light was unknown in Young’s time and largely a curiosity inHelmholtz’s time). It also introduces a series of color difference channels reminiscent of Hering. However, thedifference channels are derived from the spectral channels and are defined in terms of the UV–, S–, M– andL–channel peak wavelengths rather than some other arbitrary colors. The differencing results in three “opponentchannels” rather than the two of the Hering school. They are labeled the O–, P– and Q–channels as shown. Theseare the chrominance channels of chordate vision.
There is also a summing channel, labeled the R–channel. This is the luminance channel of chordate vision. Notecarefully, there is no achromatic (or rod) sensor channel in this configuration. All of the necessary information isacquired from the spectrally selective sensor channels. This figure shows a familial resemblance to many otherfigures in the literature (except for the addition of the ultraviolet channel). The functional difference will bediscussed after discussing the elements of the photoreceptor cell.
16 Guide to Processes in Biological Vision
Figure 3.1.1-3 (color) The luminance, chrominance and appearance channels of the eye of tetrachromats andaphakic humans. The spectral response in the O-, P- and Q- channels are shown as sinusoidal for illustration. TheUV photoreceptor cells are known to be functional in humans of all ages. Research is ongoing to determine if thesignal in the O-channel of the aphakic human is typical of tetrachromats. If it is, an aphakic human will be able totell us what “color” other animals perceive in the ultraviolet.
The ultraviolet spectral channel is an intrinsic component of all biological vision. It supports the fundamentaltetrachromatic performance of biological vision. The absence of one or more of the spectral channels from the eyeof a specific species is worthy of study in its own right. In the case of Chordata, the four spectral channels havebeen found in sufficient numbers of families (birds, fish, mammals, etc) to suggest they are present in all families. The fact that ultraviolet photoreceptors are present in humans is well documented. Much of the work has beendone by a researcher that lacks a lens in one eye due to an accident. His research has demonstrated a spectralsensitivity in the ultraviolet comparable with that in the S– and M–channels of normal vision. It may be higherthan in the typical S–channel. [17.2.2]
The ultraviolet channel is important in vision because of its broad absorption compared to the absorption of thelens in Chordata. Even in large members of Chordata, the lens does not absorb significantly at wavelengthslonger than 400 nm. However, the spectral absorption of the UV channel is still significant at wavelengths in the400-475 nm region. As a result, the O–signal channel is operational and significant in humans. It plays asignificant role in the development of the New Physiologically Based Chromaticity Diagram to be discussed inSection 9.1.3 [17.3.3].

Tutorial on Biological Vision- 17
Each photoreceptor of the eye is shown to consist of four distinctly separate physiological entities. Thechromophores of the disk stack (the outer segment) is one entity. Two separate signal amplifiers form two moredistinct entities. The final entity is the electrical load, marked (4). This entity is associated with the pedicle ofeach photoreceptor. It plays a critical role in converting the current derived from the incident photons into avoltage. It is this voltage that can be passed to the subsequent signal processing circuits without attenuation. Theconversion is not linear. The conversion is logarithmic. The load associated with the pedicle is the fundamentalelement that negates the linearity laws, of Grassman and others, so frequently cited in the literature. It forces theselaws into a category that only relate to “small signals.” This logarithmic conversion is also one of the principalfeatures establishing the very large dynamic range of the visual system.
The adaptation amplifier of each photoreceptor is critically important to the operation of the eye. This amplifierintroduces a large amount of negative feedback. The level of feedback varies with temporal frequency. It is 100%at very low temporal frequencies. The low frequency half amplitude point is between 0.3 and 0.5 Hz in mostmembers of Chordata. The performance of the amplifier is also reduced at high frequencies. The upper halfamplitude point of the amplifier alone is between 8-12 Hz. This frequency varies with the health of the vascularsystem of the eye (and may vary with position within the chordate retina).
The performance parameters of the photoreceptor cell are critical in determining the overall performance of thevisual system. Because of the zero at zero frequency in the transfer characteristic of the adaptation amplifier, theeye of Chordata is fundamentally blind to stationary objects that do not change rapidly in lightness. This feature iscommonly observed in reptiles and can be observed in humans. At least the mammals, and probably the fish andbirds have introduced an additional mechanism to overcome this difficulty. They employ tremor to encode theimagery from a scene and bypass the limited performance of the adaptation amplifier [12.6-12.7]. Some mammals,particularly the cats appear to be able to turn this mechanism on and off to meet their predatory needs.
Because the adaptation amplifiers of the retina operate independently, they introduce the concept of “colorconstancy” into the visual system. Over a local region, all of the adaptation amplifier associated with a particularspectral channel tend to receive the same signal level from their chromophores. They tend to adjust theiramplification factor, or gain, in response to this level. As a result, all of the adaptation amplifiers associated with aparticular spectral channel change their gain as a group. The effect is to adjust the gain of each spectral channel ofvision to compensate for major changes in lightness applied to that channel compared to the other channels. Thisis the essence of color constancy.
As noted above, the electrical load element associated with each pedicle performs a logarithmic conversion ofcurrent to voltage. As a result, the differencing circuits of the chrominance channels, O–, P– and Q– calculate thedifference of logarithms. Such a calculation is equivalent to taking the logarithm of a ratio. This conversion playsa major role in stabilizing the color perceived by the brain. A similar calculation occurs in the luminance channel,R– . Here the luminance signal is the sum of the logarithms of the spectral inputs. This calculation introducesartifacts into the perceived brightness at wavelengths near 494 and 575 nm that have frequently been confused withprimary spectral responses. This has been a particular problem in psychophysically isolating the L–channelresponse of human vision. The signature of these spectral frequencies are associated with the Bezold-Brucke andPurkinje Effects. Efforts to limit the intensity of light presented to the eye in the laboratory have frequentlyresulted in the peak at 575 nm being confused with the true long wavelength peak at 625 nm. The details of thehuman visual spectrum are discussed in Section 6.
The signals generated by the various signaling channels are shown at the right in the figure. They are shown forboth normal humans and aphakic eyes (eyes lacking a lens that absorbs the ultraviolet). These are the signals thatcan be recorded at the so-called S-Plane of the retina (named in honor of Svaetichin). It can be shown that thephysiologically measured signals at the S-Plane of the retina are in excellent agreement with the psychophysicallyperceived signals in humans [17.3.3]. The agreement strongly suggests they are the same.
18 Guide to Processes in Biological Vision
3.2 The major role played by the Diencephalon
The information concerning the morphology of the diencephalon is frequently inconsistent. This situation is lessdue to conflict between investigators and more due to extrapolation from limited findings related to differentphysical areas. However, the data on the physical appearance of different portions of the diencephalon and thetraffic analysis available allows many conclusions to be drawn [15.6].
The highly protected location of the diencephalon makes it very difficult to study in-vivo. Most of the availablephysiological data is inferred from psychophysical data following strokes or major injuries to the brain. While therecent development of magnetic resonance techniques offers new possibilities, these techniques are still limited. They do not explore the actual electrophysiology of the diencephalon. Instead they sense the presence, and changein concentration, of certain conditions related to reactants involved in respiration. Currently, these are blood flowand changes in hemoglobin content. Unfortunately, these are not the primary reactants supporting the signalingoperation of the neural system. The primary chemical process is the conversion of glutamate (glutamic acid) toGABA (gamma amino-butyric acid) in an electrostenolytic process associated with every neural plasma. Thisprocess does not directly involve either the glucose level or the oxygen level of the blood and tissue.
Most of the available data concerning the diencephalon is from detailed morphological examination and the studyof the physical interconnections of the neurons of the brain. The study of these interconnections (a form of trafficanalysis in the language of the cryptographer) has become sufficiently sophisticated to determine the direction ofsignal flow. Defining multiple terminations for the same neuron is also frequently possible. However, thechemical-based trail is interrupted by the presence of a synapse.
The diencephalon is found between the mesencephalon (midbrain) and the telencephalon (the cerebral cortex). Itsmajor constituents are the thalamus and the hypothalamus. The thalamus is the element of principal interest invision. It is a single structure of unusually construction. Instead of a thin corrugated shell, as found in many partsof the brain, it contains several solid three-dimensional parts. The primary part is the large pulvinar. It also canbe divided into several solid portions.
During evolution, the brain of man has grown significantly. His mental and intellectual capacityis often judged by this fact. It is useful to note that the area of the thin corrugated shellassociated with the cerebral cortex has increase about four times as the radius of the brain hasdoubled, the volume of the thalamus has increased by eight times.
Until recently, several surface features of the thalamus were thought to be integral parts of the pulvinar. In manyspecies, this is probably true. However, recent work on humans has shown that the pulvinar is enshrouded by avery important shell. This shell is called the thalamic reticular nucleus, TRN. It encloses more than two thirds ofthe human pulvinar and includes the geniculate nuclei. The lateral and medial geniculate nuclei are shared withmany higher primates. However, it is the perigeniculate nuclei, found adjacent to the lateral geniculate nuclei, andthe gross expansion of the pulvinar in humans that are of major interest. These features appear to distinguish thehuman visual system from all others, including the other great apes. The perigeniculate nuclei appear to haverecently evolved from the lateral geniculate nuclei. Unless carefully instructed, most medical artists do notdistinguish between these structures. Where the artists do not distinguish, neither do the textbooks [15.6].
Unlike the pulvinar it encloses, the TRN is a shell more typical of most brain tissue. It can be divided into severalparts based on its surface structure and one other fact. A major part of the TRN is striated. A second part ispierced by a multitude of axons proceeding through the TRN shell. Some of these axons branch and support localterminations within the shell. Other neurons traversing the shell may accept synapse inputs from neuronsoriginating within the shell. Finally, the parts forming the various geniculate nuclei appear to form significantfeature extraction engines on their own [15.6.2 & 15.6.3].

Tutorial on Biological Vision- 19
While much of the TRN is bilateral, like most of the rest of the organism, the pulvinar appears to be different. Thepulvinar and the cerebellum are two parts of the chordate body that are not bilateral.
The striated portion of the TRN has an appearance reminiscent of the early man-made magnetic core memories forcomputers. The key features of these devices were a series of orthogonal electrical wire (conduits) interwoven witha series of sensing conduits. The orthogonal wires were used to introduce particular states of magnetization in thecores located at their junctions. The sensing wires allowed that state of magnetization of individual cores to besensed without affecting that state. It appears the striated portion of the TRN serves this same functional role.
The striated portion of the TRN appears to operate as a two-dimensional associative correlator under the control ofan adjacent unstriated portion. The two bilateral striated portions will be labeled the perigeniculate nuclei, PGN.
The perigeniculate nuclei differ from the lateral geniculate nuclei in one major characteristic. While the LGN’saccept input from their respective halves of the retina, they do not receive significant signals from the foveola. Thesignals from the foveola are directed to the perigeniculate nuclei. Whereas the outputs of the LGN proceed to theoccipital lobe of the cerebral cortex, the outputs of the PGN are passed to the pulvinar.
The outputs of the two PGN correlators are passed to the “non-bilateral” posterior pulvinar. This configurationwould suggest that the sensing circuits of the two PGN’s might be shared in order to form a single compositeoutput that could be passed to the pulvinar. This concept supports the hypothesis that the pulvinar forms a verylarge lookup table that can accept the outputs of the PGN correlators and issue an output describing the input interms of similar patterns found in its memory.
3.2.1 The operation of the TRN as the gatekeeper of sensory inputs and muscular/skeletalresponses The performance of the non-striated portion of the thalamic reticular nucleus and its strategic location suggest thatit is the seat of control (but not cognition) within the neural system. It is able to evaluate all sensory inputs passingthrough it. It is also able to inhibit or redirect all autonomous and volition mode instructions directed toward themusculature/skeletal system . This subject will be explored more completely in the supporting compendium[15.6.6]. The non-striated portion of the TRN is also optimally positioned to control the operation of the PrecisionOptical System (POS). Th POS forms a major closed loop servomechanism that supports a variety of visualfunctions [7.3]. These include pointing (version), convergence (vergence), focus, and analysis (interpretation andperception). It also contains and controls the tremor generator and the inertial reference signals provided by theinner ears. Physically, the POS consists of the eyes, major parts of the thalamus, the oculomotor subsystem (andthe skeletal motor system as required) and the neural nodes formerly known as the auxiliary optical system. Thisservomechanism is able to respond to alarm mode, analytical mode and volition mode instructions. Generating avariety of largely autonomous responses is also possible.
3.2.2 The operation of the PGN/pulvinar couple
Based on the description discussed above, it is proposed that the PGN/pulvinar couple plays a critical role inhuman vision that is not achieved in any other species. This role involves the interpretation and perception ofscenes presented to the foveola of the eyes. The extent of this capability is controlled largely by the size of theposterior portion of the pulvinar.
The capability of the 2-D associative correlator will be discussed further in Section 8.3
3.2.3 The Precision Optical System
20 Guide to Processes in Biological Vision
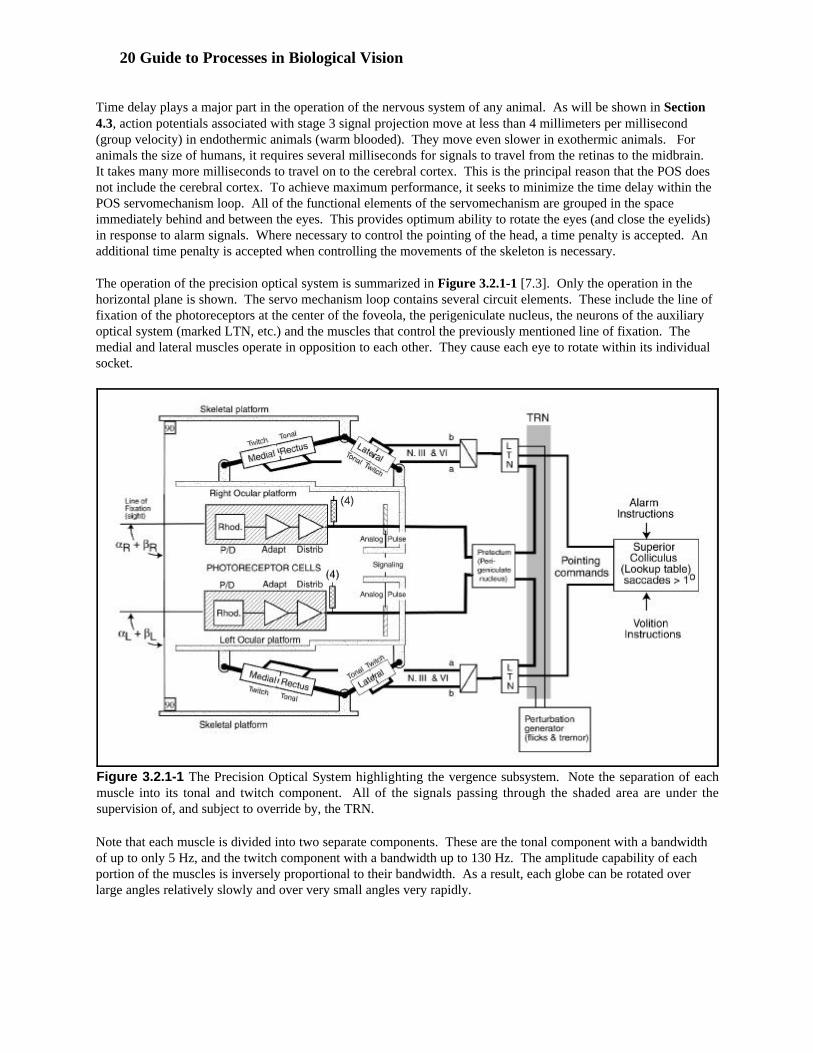
Figure 3.2.1-1 The Precision Optical System highlighting the vergence subsystem. Note the separation of eachmuscle into its tonal and twitch component. All of the signals passing through the shaded area are under thesupervision of, and subject to override by, the TRN.
Time delay plays a major part in the operation of the nervous system of any animal. As will be shown in Section4.3, action potentials associated with stage 3 signal projection move at less than 4 millimeters per millisecond(group velocity) in endothermic animals (warm blooded). They move even slower in exothermic animals. Foranimals the size of humans, it requires several milliseconds for signals to travel from the retinas to the midbrain. It takes many more milliseconds to travel on to the cerebral cortex. This is the principal reason that the POS doesnot include the cerebral cortex. To achieve maximum performance, it seeks to minimize the time delay within thePOS servomechanism loop. All of the functional elements of the servomechanism are grouped in the spaceimmediately behind and between the eyes. This provides optimum ability to rotate the eyes (and close the eyelids)in response to alarm signals. Where necessary to control the pointing of the head, a time penalty is accepted. Anadditional time penalty is accepted when controlling the movements of the skeleton is necessary.
The operation of the precision optical system is summarized in Figure 3.2.1-1 [7.3]. Only the operation in thehorizontal plane is shown. The servo mechanism loop contains several circuit elements. These include the line offixation of the photoreceptors at the center of the foveola, the perigeniculate nucleus, the neurons of the auxiliaryoptical system (marked LTN, etc.) and the muscles that control the previously mentioned line of fixation. Themedial and lateral muscles operate in opposition to each other. They cause each eye to rotate within its individualsocket.
Note that each muscle is divided into two separate components. These are the tonal component with a bandwidthof up to only 5 Hz, and the twitch component with a bandwidth up to 130 Hz. The amplitude capability of eachportion of the muscles is inversely proportional to their bandwidth. As a result, each globe can be rotated overlarge angles relatively slowly and over very small angles very rapidly.
Tutorial on Biological Vision- 21
The rotation of the ocular globes at rates up to five Hz is controlled by the tonic portion of each muscle. Thesetonic muscle fibers are used for pointing and convergence. When driven in phase with each other, the eyes changetheir gross pointing direction (their vergence). When driven differentially, the eyes converge or diverge relative toeach other. These actions can be caused by the POS operating on its own via the PGN (but under the ultimatecontrol of the TRN). Alternately, they can be caused in response to alarm and volition mode instructions receivedvia the superior colliculus. These instructions are converted to implementable commands by the superior colliculus(that is also under the ultimate control of the TRN). The TRN is in a position to supervise and override any signalspassing through the shaded box in the figure. It has both an autonomous capability and can accept guidance fromthe higher cognitive centers (an expression of the will).
The twitch portions of the muscles are used for greatly different functions. They are used for two functions. Theyare used to generate the motion necessary to change the spatial domain information presented to the retinas intothe temporal domain information that can be processed by the neural system. As noted earlier, the adaptationamplifiers of each photoreceptor have zero gain at zero temporal frequency. Because of this, no signal appears atthe pedicle of a photoreceptor in the absence of some change in the image projected onto these photoreceptors. It isthis change in the temporal signal due to the fine motion of the eyes that is perceived by the visual system. In fact,the signals from the retina generated during coarse motion caused by the tonic muscles are blanked out within thesignal processing of the visual system. This avoids performing signal processing on hopelessly smearedinformation.
As above, the twitch portion of the muscles can be independently driven by the PGN. However, an additionalcapability is introduced to support the analysis of fine detail and reading. The vertical and horizontal direction ofmotion of the eyes can be controlled separately. This allows the eyes to perform a small raster scan. The result ofthis scanning pattern is to provide information to the PGN/pulvinar couple that can be analyzed to detect (the termused in the literature is interpret) fine detail within the image projected on the foveola. This small raster scan isgenerated by the tremor generator and can be detected in the laboratory with sufficiently precise instrumentation. The amplitude of the tremor is normally only a few arc seconds in amplitude (about the angular size of one or twophotoreceptors of 2 micron diameter).
3.3 Plan and profile views of the human visual system
The discussion presented above leads to a significantly different view of the operation of the visual system thanappears in texts more than a few years old. The pace of learning in physiology is similar to that in computersciences. The ground rule is “Do not buy a text book with a copyright date earlier than two years ago.”
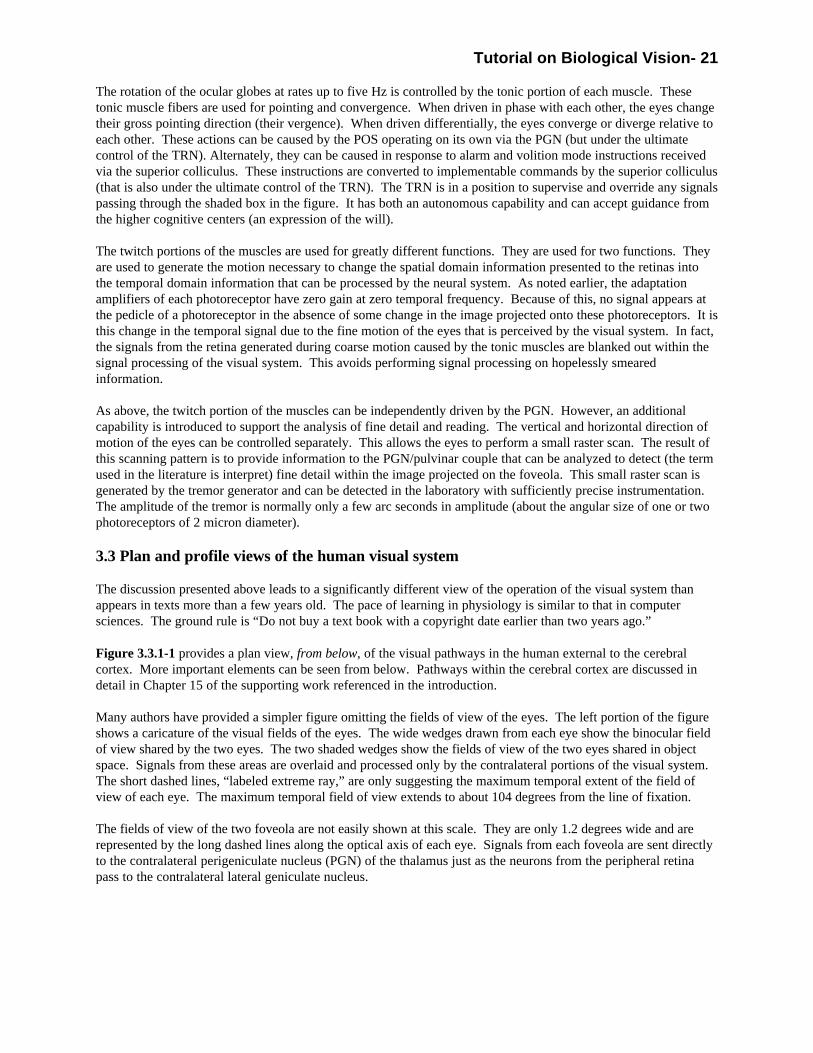
Figure 3.3.1-1 provides a plan view, from below, of the visual pathways in the human external to the cerebralcortex. More important elements can be seen from below. Pathways within the cerebral cortex are discussed indetail in Chapter 15 of the supporting work referenced in the introduction.
Many authors have provided a simpler figure omitting the fields of view of the eyes. The left portion of the figureshows a caricature of the visual fields of the eyes. The wide wedges drawn from each eye show the binocular fieldof view shared by the two eyes. The two shaded wedges show the fields of view of the two eyes shared in objectspace. Signals from these areas are overlaid and processed only by the contralateral portions of the visual system. The short dashed lines, “labeled extreme ray,” are only suggesting the maximum temporal extent of the field ofview of each eye. The maximum temporal field of view extends to about 104 degrees from the line of fixation.
The fields of view of the two foveola are not easily shown at this scale. They are only 1.2 degrees wide and arerepresented by the long dashed lines along the optical axis of each eye. Signals from each foveola are sent directlyto the contralateral perigeniculate nucleus (PGN) of the thalamus just as the neurons from the peripheral retinapass to the contralateral lateral geniculate nucleus.

22 Guide to Processes in Biological Vision
Figure 3.3.1-1 Plan view of the human visual system as seen from BELOW. The retina projects to the lateralgeniculate nuclei and the perigeniculate nuclei. Signals originate in the superior colliculus. The figure is similar toone by Daw (1995). The optical rays are redrawn to illustrate both the stereo viewing field and the maximum viewingfield. Note the fact that the rays do not follow straight lines as they enter the eyes due to the immersion mode of theoptics in terrestrial animals. The optic nerves are shown bifurcated. Note how they are rearranged at the chiasm sothat all signals from the left field of vision proceed to the right side of the brain. Axons from nasal retina cross in thechiasm, and axons from temporal retina do not. Note also the additional bifurcation in the optical tracts with neuronsproceeding to both the lateral geniculate nucleus, LGN, and the PGN. Neurons controlling the iris and lens originatein the superior colliculus. Additional neurons are shown leaving the LGN and proceeding to the striated cortex, Area17, as the optic radiation. Note the presence of Meyer’s Loop. Additional neurons also leave the PGN and proceed(out of the plane of the paper) directly to Area 7 of the cortex via the Pulvinar Pathway.
Because of the limited performance of the wide-angle optical system of the eye, the signals related to the foveolaand processed by the PGN/pulvinar couple are of much higher spatial quality than those processed by theLGN/occipital couple.
Note the off-axis optical rays shown are not straight lines. They bend as they pass through the cornea of the eye. This is due to Snell’s Law. Optical rays passing from air into a medium of higher index of refraction are benttoward the normal to the surface traversed. The dashed axial rays are shown converging on a distant object. Thecommon and potential stereographic field of the eyes is shown along with two extreme rays. As mentioned above,the extreme rays are more than 90 degrees from the axial ray. The optical field of each eye is shown bifurcated andthis arrangement is also found in the optic nerve. Upon reaching the optic Chiasm, these bifurcated bundles ofnerves are rearranged into the bundles shown within the optic tracts. All of the nerves associated with the leftfields of view go to the right half of the brain and vice versa. The secondary divisions in the optic tracts after this
Tutorial on Biological Vision- 23
Chiasm are very important. They separate the signals related to the foveola from the main neural path. Thesesignals are routed to the perigeniculate nucleus and the superior colliculus. Afferent signals from the retina arerouted to the PGN. The signals related to the superior colliculus are efferent signals returning to the eyes and theassociated eye muscles.
Several investigators have reacted with surprise to their findings concerning the constituents of the optic nerve[3.2.2 & 15.1.1]. They found that no neurons from the foveola went to the LGN. About 10% of all neurons wentdirectly to the PGN. As many as 80% of the neurons represented chrominance channels.
Artistic license has been used in the figure for clarity. The two LGN’s and the two PGN’s are much smaller than the pulvinar. Morphologically, they are generally seen as protuberances on the surface of the posterior pulvinar.While two perigeniculate nuclei are shown, only one pulvinar is shown. The signals from the two halves of thetwo peripheral retinas are merged in one of the LGN’s. The merged data is then processed further in theassociated halves of the occipital lobe of the cerebral cortex. However, the left and right fields are processedentirely separately. The signals from the two halves of the foveola are treated differently. While the left and righthalves of the images from the two eyes are merged in separate PGN’s, the output of these two PGN’s is combinedinto a single channel. This channel is delivered to a single posterior pulvinar for further processing.
From the pulvinar on, the signal processing associated with vision is no longer bilateral in character. The signalsfrom the pulvinar are passed to area 7 of the parietal lobe in totally abstract form. This fact contributes to thehypothesis that signals from the two symmetrical regions of the occipital lobe are returned to the thalamus formerging before transmission to area 7. Evidence is growing that as many neural paths go from the occipital lobe tothe thalamus as there are going from the LGN’s to the occipital lobes. This would suggest that the thalamusmerges the signals into their final abstract form before delivery to the parietal areas.
Under this interpretation, the PGN’s and posterior pulvinar act as one processing couple associated with fine detailin the analytical channel of vision. Similarly, the LGN’s and the Occipital lobe act as one processing coupleassociated with the coarse data in the awareness channel of vision. The output of these two couples is directed tothe parietal lobe and used to populate a single saliency map. This totally abstract map is then accessed by thehigher cognitive centers.
The signal paths from the occipital lobes back to the thalamus may not be as circuitous as those shown going fromthe LGN’s to the occipital lobe. Meyer’s loops play a very important role in the visual system that has not beendescribed previously. They will be discussed in Section 8.1.
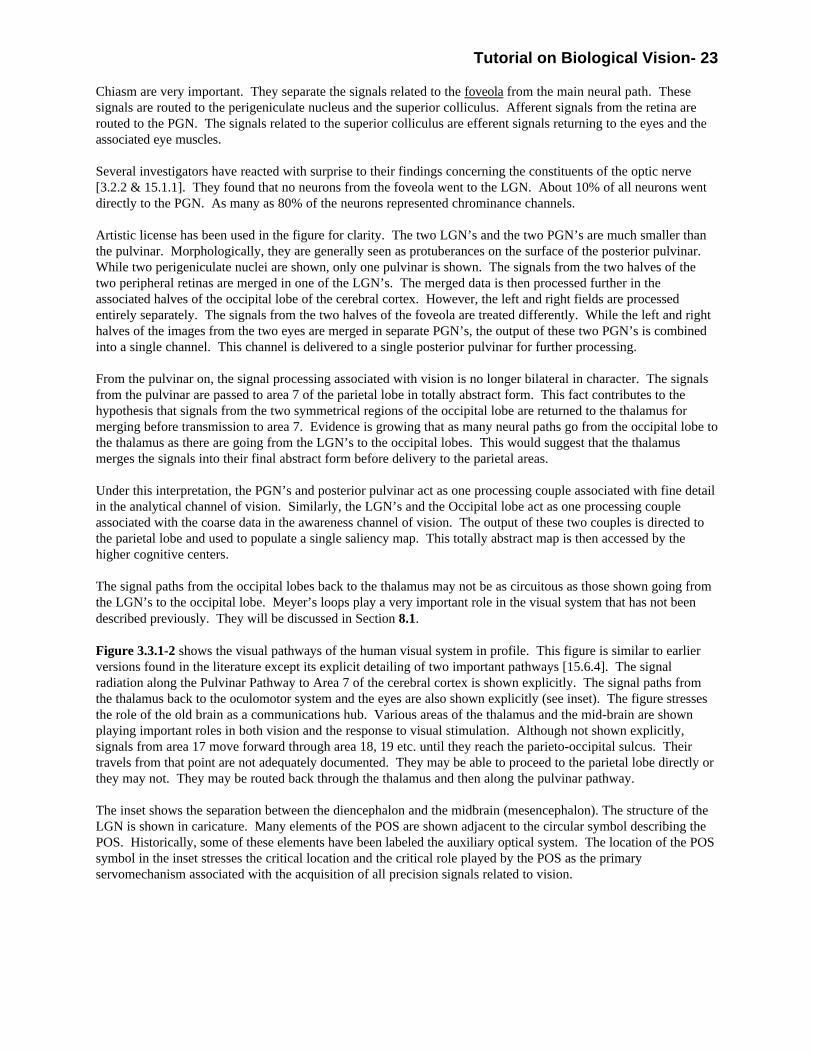
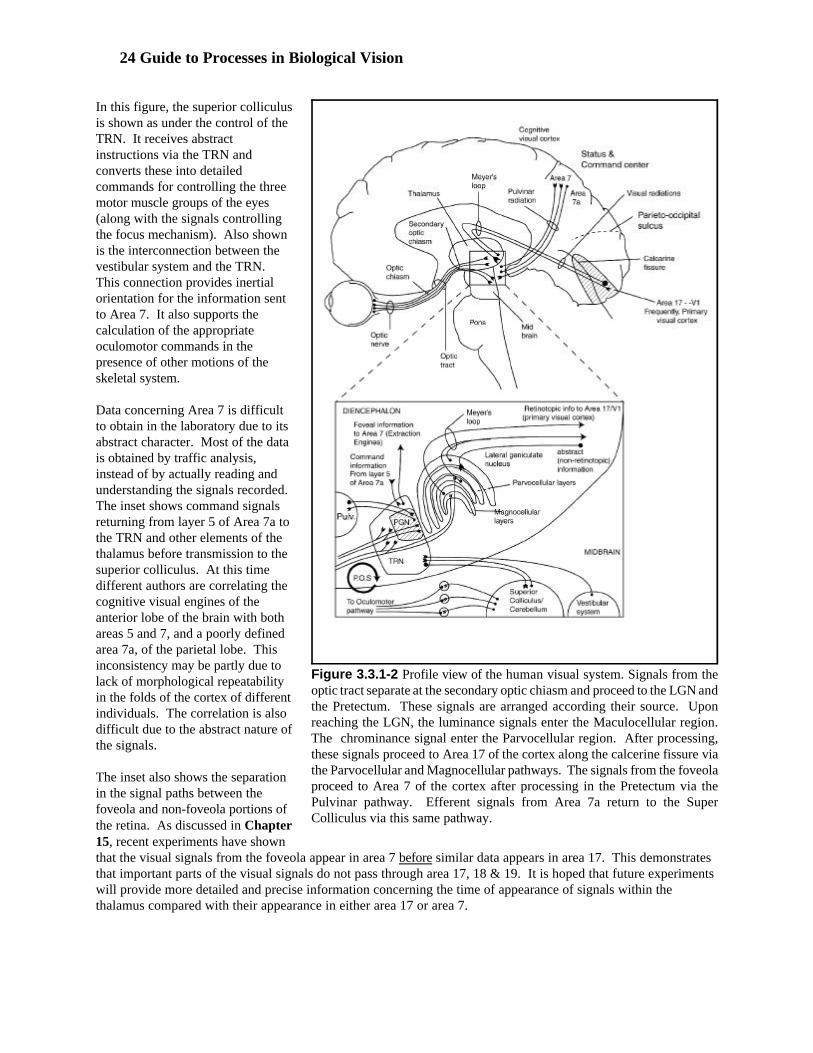
Figure 3.3.1-2 shows the visual pathways of the human visual system in profile. This figure is similar to earlierversions found in the literature except its explicit detailing of two important pathways [15.6.4]. The signalradiation along the Pulvinar Pathway to Area 7 of the cerebral cortex is shown explicitly. The signal paths fromthe thalamus back to the oculomotor system and the eyes are also shown explicitly (see inset). The figure stressesthe role of the old brain as a communications hub. Various areas of the thalamus and the mid-brain are shownplaying important roles in both vision and the response to visual stimulation. Although not shown explicitly,signals from area 17 move forward through area 18, 19 etc. until they reach the parieto-occipital sulcus. Theirtravels from that point are not adequately documented. They may be able to proceed to the parietal lobe directly orthey may not. They may be routed back through the thalamus and then along the pulvinar pathway.
The inset shows the separation between the diencephalon and the midbrain (mesencephalon). The structure of theLGN is shown in caricature. Many elements of the POS are shown adjacent to the circular symbol describing thePOS. Historically, some of these elements have been labeled the auxiliary optical system. The location of the POSsymbol in the inset stresses the critical location and the critical role played by the POS as the primaryservomechanism associated with the acquisition of all precision signals related to vision.
24 Guide to Processes in Biological Vision
Figure 3.3.1-2 Profile view of the human visual system. Signals from theoptic tract separate at the secondary optic chiasm and proceed to the LGN andthe Pretectum. These signals are arranged according their source. Uponreaching the LGN, the luminance signals enter the Maculocellular region.The chrominance signal enter the Parvocellular region. After processing,these signals proceed to Area 17 of the cortex along the calcerine fissure viathe Parvocellular and Magnocellular pathways. The signals from the foveolaproceed to Area 7 of the cortex after processing in the Pretectum via thePulvinar pathway. Efferent signals from Area 7a return to the SuperColliculus via this same pathway.
In this figure, the superior colliculusis shown as under the control of theTRN. It receives abstractinstructions via the TRN andconverts these into detailedcommands for controlling the threemotor muscle groups of the eyes(along with the signals controllingthe focus mechanism). Also shownis the interconnection between thevestibular system and the TRN. This connection provides inertialorientation for the information sentto Area 7. It also supports thecalculation of the appropriateoculomotor commands in thepresence of other motions of theskeletal system.
Data concerning Area 7 is difficultto obtain in the laboratory due to itsabstract character. Most of the datais obtained by traffic analysis,instead of by actually reading andunderstanding the signals recorded. The inset shows command signalsreturning from layer 5 of Area 7a tothe TRN and other elements of thethalamus before transmission to thesuperior colliculus. At this timedifferent authors are correlating thecognitive visual engines of theanterior lobe of the brain with bothareas 5 and 7, and a poorly definedarea 7a, of the parietal lobe. Thisinconsistency may be partly due tolack of morphological repeatabilityin the folds of the cortex of differentindividuals. The correlation is alsodifficult due to the abstract nature ofthe signals.
The inset also shows the separationin the signal paths between thefoveola and non-foveola portions ofthe retina. As discussed in Chapter15, recent experiments have shownthat the visual signals from the foveola appear in area 7 before similar data appears in area 17. This demonstratesthat important parts of the visual signals do not pass through area 17, 18 & 19. It is hoped that future experimentswill provide more detailed and precise information concerning the time of appearance of signals within thethalamus compared with their appearance in either area 17 or area 7.

Tutorial on Biological Vision- 25
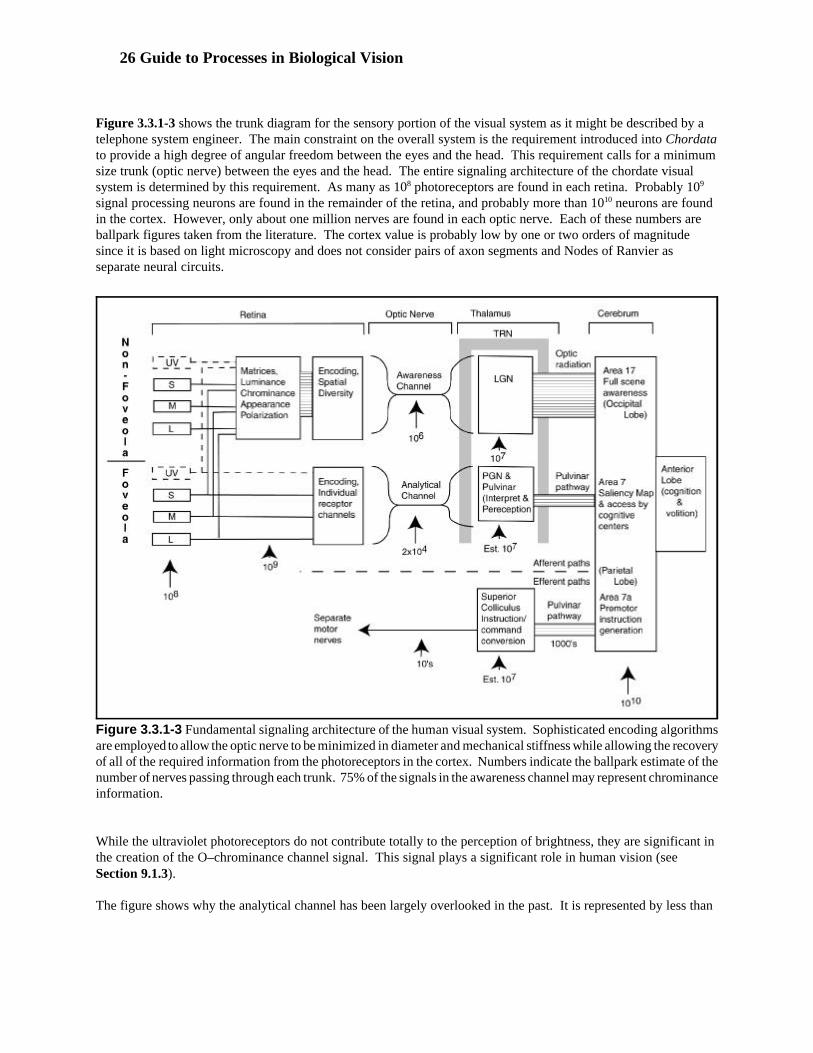
26 Guide to Processes in Biological Vision
Figure 3.3.1-3 Fundamental signaling architecture of the human visual system. Sophisticated encoding algorithmsare employed to allow the optic nerve to be minimized in diameter and mechanical stiffness while allowing the recoveryof all of the required information from the photoreceptors in the cortex. Numbers indicate the ballpark estimate of thenumber of nerves passing through each trunk. 75% of the signals in the awareness channel may represent chrominanceinformation.
Figure 3.3.1-3 shows the trunk diagram for the sensory portion of the visual system as it might be described by atelephone system engineer. The main constraint on the overall system is the requirement introduced into Chordatato provide a high degree of angular freedom between the eyes and the head. This requirement calls for a minimumsize trunk (optic nerve) between the eyes and the head. The entire signaling architecture of the chordate visualsystem is determined by this requirement. As many as 108 photoreceptors are found in each retina. Probably 109
signal processing neurons are found in the remainder of the retina, and probably more than 1010 neurons are foundin the cortex. However, only about one million nerves are found in each optic nerve. Each of these numbers areballpark figures taken from the literature. The cortex value is probably low by one or two orders of magnitudesince it is based on light microscopy and does not consider pairs of axon segments and Nodes of Ranvier asseparate neural circuits.
While the ultraviolet photoreceptors do not contribute totally to the perception of brightness, they are significant inthe creation of the O–chrominance channel signal. This signal plays a significant role in human vision (seeSection 9.1.3).
The figure shows why the analytical channel has been largely overlooked in the past. It is represented by less than
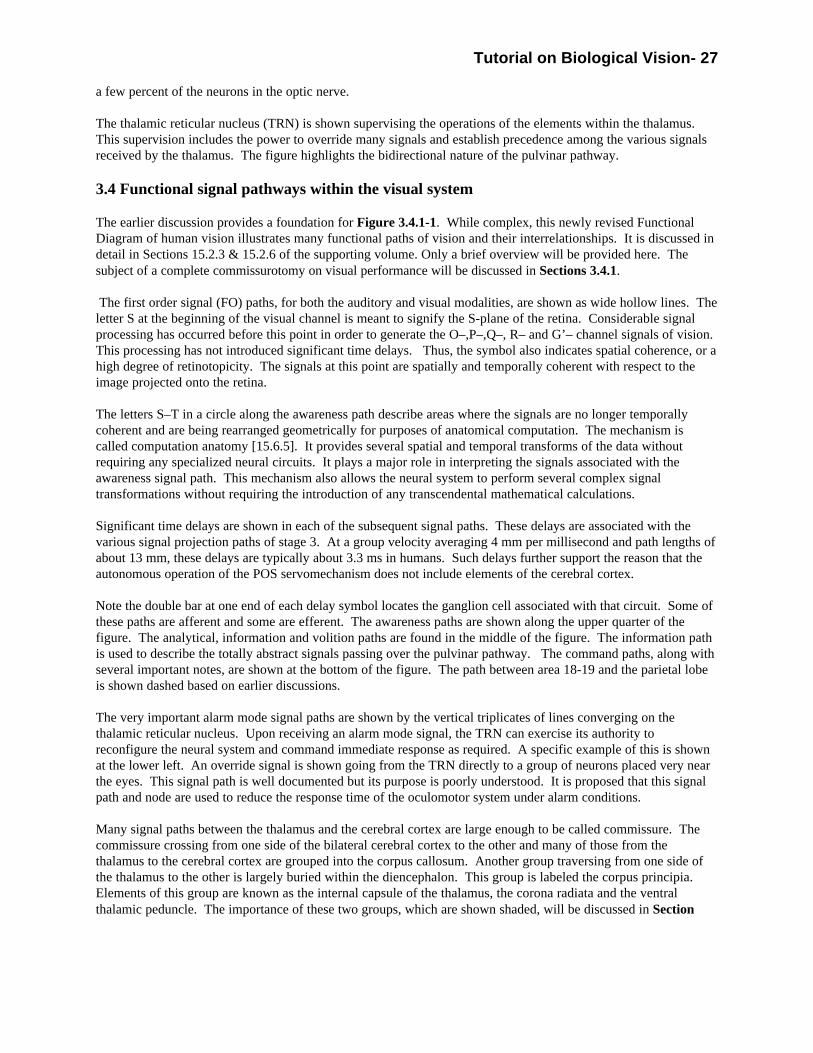
Tutorial on Biological Vision- 27
a few percent of the neurons in the optic nerve.
The thalamic reticular nucleus (TRN) is shown supervising the operations of the elements within the thalamus. This supervision includes the power to override many signals and establish precedence among the various signalsreceived by the thalamus. The figure highlights the bidirectional nature of the pulvinar pathway.
3.4 Functional signal pathways within the visual system
The earlier discussion provides a foundation for Figure 3.4.1-1. While complex, this newly revised FunctionalDiagram of human vision illustrates many functional paths of vision and their interrelationships. It is discussed indetail in Sections 15.2.3 & 15.2.6 of the supporting volume. Only a brief overview will be provided here. Thesubject of a complete commissurotomy on visual performance will be discussed in Sections 3.4.1.
The first order signal (FO) paths, for both the auditory and visual modalities, are shown as wide hollow lines. Theletter S at the beginning of the visual channel is meant to signify the S-plane of the retina. Considerable signalprocessing has occurred before this point in order to generate the O–,P–,Q–, R– and G’– channel signals of vision.This processing has not introduced significant time delays. Thus, the symbol also indicates spatial coherence, or ahigh degree of retinotopicity. The signals at this point are spatially and temporally coherent with respect to theimage projected onto the retina.
The letters S–T in a circle along the awareness path describe areas where the signals are no longer temporallycoherent and are being rearranged geometrically for purposes of anatomical computation. The mechanism iscalled computation anatomy [15.6.5]. It provides several spatial and temporal transforms of the data withoutrequiring any specialized neural circuits. It plays a major role in interpreting the signals associated with theawareness signal path. This mechanism also allows the neural system to perform several complex signaltransformations without requiring the introduction of any transcendental mathematical calculations.
Significant time delays are shown in each of the subsequent signal paths. These delays are associated with thevarious signal projection paths of stage 3. At a group velocity averaging 4 mm per millisecond and path lengths ofabout 13 mm, these delays are typically about 3.3 ms in humans. Such delays further support the reason that theautonomous operation of the POS servomechanism does not include elements of the cerebral cortex.
Note the double bar at one end of each delay symbol locates the ganglion cell associated with that circuit. Some ofthese paths are afferent and some are efferent. The awareness paths are shown along the upper quarter of thefigure. The analytical, information and volition paths are found in the middle of the figure. The information pathis used to describe the totally abstract signals passing over the pulvinar pathway. The command paths, along withseveral important notes, are shown at the bottom of the figure. The path between area 18-19 and the parietal lobeis shown dashed based on earlier discussions.
The very important alarm mode signal paths are shown by the vertical triplicates of lines converging on thethalamic reticular nucleus. Upon receiving an alarm mode signal, the TRN can exercise its authority toreconfigure the neural system and command immediate response as required. A specific example of this is shownat the lower left. An override signal is shown going from the TRN directly to a group of neurons placed very nearthe eyes. This signal path is well documented but its purpose is poorly understood. It is proposed that this signalpath and node are used to reduce the response time of the oculomotor system under alarm conditions.
Many signal paths between the thalamus and the cerebral cortex are large enough to be called commissure. Thecommissure crossing from one side of the bilateral cerebral cortex to the other and many of those from thethalamus to the cerebral cortex are grouped into the corpus callosum. Another group traversing from one side ofthe thalamus to the other is largely buried within the diencephalon. This group is labeled the corpus principia. Elements of this group are known as the internal capsule of the thalamus, the corona radiata and the ventralthalamic peduncle. The importance of these two groups, which are shown shaded, will be discussed in Section
28 Guide to Processes in Biological Vision
Figure 3.4.1-1 A revised Functional Diagram of human vision, ca 2002, introducing the TRN, in its role as thecentral control point of vision, and the relationship between the left and right hemispheres of the cortex.. The diagramshows the nominal resolution signal path via the LGN to the striate/V>2 couple and the high resolution signal path fromthe foveola to the PGN/pulvinar couple. The diagram is compatible with dual mechanisms of depth perception andshows only abstract command signals being transmitted to the SC/cerebellum for implementation. It also shows twodistinct major commissure between the left and right portions of the brain. See text.
3.4.1.
Tutorial on Biological Vision- 29
3.4.1 Effect of a “total commissurotomy” of the corpus callosum
Trevarthen & Sperry reported the results of complete commissurotomies on most of their patients through 19731. Their report was presented based on the conventional wisdom of that time. That wisdom assumed the onlysignaling path between the two sides of the cerebral hemispheres was via the corpus callosum. They noted theobserved performance of their patients was not compatible with this framework. However, the performance iscompatible with the Top Level Schematic presented above. Their patients performance highlights two situations. A path between the two halves of the cerebral hemispheres independent of the corpus callosum clearly exists. Thispath was not interrupted surgically. This path is the corpus principia. It consists primarily of the internal capsuleconnecting the two halves of the thalamus, and the two halves of the TRN. While not as large as the corpuscallosum, it is clearly as important or more important. Additional paths may also exist that pass between the twosides of the thalamus. These paths were only discussed in concept in Trevanthen & Sperry.
The subjects were asked to report their visual capability using their voice. Since the vocal system is a motor systemcontrolled by the TRN and commanded by the SC/cerebellum couple, a patient can report an alarm signal receivedfrom any sensory system without relying upon the corpus callosum. However, this does not insure he can reportverbally. His ability to report verbally may require cooperation between the two hemispheres.
The main role of the corpus callosum in vision may be to aid in the merging of the peripheral images from the leftand right halves of the visual field. With training, a subject may regain nearly normal visual facility after acomplete commissurotomy, except for the ability to merge images that cross the medial line dividing his visualfield vertically.
Based on the 2002 model of this work, a total commissurotomy is probably not an appropriate name for theprocedure of Trevarthen & Sperry. It would be better to speak of a total corpus callosumotomy.
The emerging model provides a more comprehensive explanation for the performance of the subjects of Trevarthen& Sperry both before and following their operation. The medical implications are discussed briefly in Section18.8.6.
3.4.2 Agnosia as a function of location or of feature extraction engine
Agnosia is the inability to perceive objects through otherwise normally functioning sensory channels. It includesalexia, the inability to read complex character groups and symbols. Alexia varies in degree from the inability toread multiple symbol syllables to global alexia, the inability to recognize individual numbers, letters and symbols. Global anterograde amnesia is a condition where the subject is no longer able to recognize people, places, facts etc. These conditions are frequently associated with problems in either the thalamus or the parietal lobe of the neo-cortex. This association is compatible with the analytical mode of vision described above.
Kandel, Schwartz & Jessell2 have provided a table of visual agnosia by area of cortical lesions. Unfortunately it isdated 1980 and it can be assumed that better data is becoming available almost daily. Their synopsis concerningthe blind painter on pp. 586-587 is important and touching. Discussions of this author with a clinical patient havealso suggested the results of agnosia near area 7. The discussions concerned the merging of the vector data(abstract signals) from the PGN/pulvinar couple (related to the foveola of the retina) and the vector data receivedfrom the LGN/occipital couple (related to the non-foveola retina). He reported a shimmering area consisting of awheel with a diameter of about 2-3 degrees and five or six equally spaced spokes radiating from the wheel. Whether these features were directly associated with the conformal transformation presented at the striate cortexcould not be determined. However, the number of spokes and possible damage involving the low resolution imageof the fovea, found in the striate cortex, could explain these symptoms. They are compatible with the two-channelvisual process described above. This subject appears to be suffering from an inability to merge the informationfrom the analytical and awareness channels into a composite saliency map.
30 Guide to Processes in Biological Vision
3.5 The thalamic reticular nucleus (TRN) as the gate keeper of vision
Recent empirical and theoretical work has shown clearly that the so-called “primary visual cortex” is not adominant element in the visual system. While physically easy to investigate, its importance is eclipsed by thediencephalon, with particular emphasis on the perigeniculate nucleus/pulvinar couple in humans. Furthermore, itis the shroud enclosing much of the thalamus, the thalamic reticular nucleus, that is the primary operational centerof both the nervous system and the visual system. The typical chordate can survive and see adequately with theprimary visual cortex completely destroyed or removed. The typical chordate can survive with the frontal lobesdestroyed or removed. However, significant damage to the TRN leads quickly to the death of the organism. In thiscontext, severing the corpus principia, within the diencephalon, is much more serious than severing the corpuscallosum between the two lobes of the cerebral cortex. Among other effects, this action causes agnosia
Within the context of the TRN as the most important element of the nervous system, describing the roles of thesubservient elements more clearly is possible. The TRN receives, supervises and processes signals from all of thesensory systems. The location of many neural engines is determined by their operational importance and the timedelay involved in transmitting and receiving information between them and the TRN. Time delay, related to thepropagation of stage 3 (phasic) signals within the neural system, is a very important parameter of many signalingpaths. In this context, the PGN/pulvinar couple is much more important than the LGN/occipital couple because ofits role within the POS servomechanism. In addition, it appears a special neural complex, the ganglia nucleus isdesigned specifically to eliminate one source of delay. It is found along the oculomotor neural path from the AOSto the oculomotor muscles. When necessary to protect the organism, the TRN can command the muscles via thisnucleus. Thus, coarse signals from the TEN to the oculomotor muscles can bypass the SC/cerebellum couple andthe other nuclei associated with the oculomotor neural paths when a crisis arises.
3.6 Summary of overall visual operation
In humans, the visual system is highly redundant. The critical aspects of the image forming physiological opticsare duplicated in the two eyes. The retina of each eye consists of four sets of photoreceptors. It normally operateswith the UV sensitive photoreceptors only partly operational. The signals from the four sets of photoreceptors aremultiplexed in several ways. Those from the general retina are multiplexed into separate luminance and (3)chrominance channels. These signals are extended and processed in tandem as far as the striated area of theoccipital lobe (area 17) of the cerebral cortex. These signals are used in the awareness mode of chordate vision.
Simultaneously, the subset of the photoreceptors forming the foveola is processed in a separate channel, generallydefined historically as the Y-channel in cats. This analytical channel is processed at a higher resolution. Itprovides signals to both the higher cognitive centers and to the POS. While the awareness mode signals are notprocessed synchronously when they reach area 17, the analytical mode signals are processed synchronously withinthe loop of the POS servomechanism.
While the LGN/occipital couple extracts information from the peripheral retina describing the externalenvironment of the organism, the information is of relatively coarse resolution. The precise information isextracted from near the point of fixation by the PGN/pulvinar couple. Both couples return most their informationto the TRN, in abstract (non-visuotopic) form, for subsequent transmission to area 7 of the parietal lobe asmessages compatible with the saliency map. This map is maintained within the parietal-occipital-temporal (P-O-T) area of the cerebral cortex. It is made available to the higher cognitive processing engines within the anteriorlobe. These engines create instructions that are returned to the TRN via the P-O-T area, primarily via area 6(sometimes labeled 7a). The TRN routinely routes these abstract volition commands to the superiorcolliculus/cerebellum couple for decoding, elaboration and implementation. The TRN operates semi-autonomouslybased on prior learning and stored instructions from the engines of the anterior lobe. However, it has greatflexibility and can often reroute signals when necessary (or learn new methods of operation).

Tutorial on Biological Vision- 31
The lateral geniculate nuclei perform as more than relays. They are responsible for generating alarm mode signalsat the earliest possible time (the primary reason the LGN’s are located within the diencephalon). These signals areused by the TRN to control blinking and other reflexive actions. The LGN’s also provide a coarse stereoptic errorsignal to the POS. A more precise stereopsis signal is provided to the parietal lobe by the PGN/pulvinar couple. The superior colliculus/cerebellum couple serves to convert all of the abstract volition and alarm signals processedthrough the TRN into action commands that the oculomotor and skeletal motor systems can accept. It does this forall of the efferent neural signals whatever the originating sensor modality. While neurons can be located in thesuperior colliculus/cerebellum couple that exhibit a receptive field in object space of vision, the relationship is notone-to-one. All of the signals have passed through an abstract phase before reaching this couple.
Figure 3.6.1-1 summarizes the above discussion without showing all of the delay elements in the system. It alsoshows an expanded responsibility for the left and right portions of the pulvinar in support of the left and rightlateral geniculate nuclei. If appropriate, this modification would redistribute the memory function within theawareness channels and further limit the role of the occipital lobe.
To achieve the performance required, the oculomotor plant is of two-stage design. The tonal portions of theoculomotor muscles respond to the majority of signals calling for saccades. However, in the more advancedchordates, the twitch portions of the oculomotor muscles respond to higher frequency commands and create thetremor motion required to achieve fine detail analysis and reading. The stage 3 (phasic signaling) neural circuitsassociated with tremor, including the “Y-channel” circuits of the retina exhibit a much higher maximum frequencythan do most sensory or efferent neural channels. The top frequency is near 150 Hz. Within the POS, andparticularly within the PGN/pulvinar, there appear to be electrotonic signal processing circuits operating atsignificantly higher maximum frequencies. Some stage 3 circuits in this area can propagate signals approaching500 Hz.
While the signaling code used in the eye and optic nerve is well understood, the machine language (neural code)used within the CNS is unknown at this time. Decoding it will be difficult because it appears many messages aretransmitted in “word parallel format.” Each word is transmitted using multiple bits transmitted over separateparallel neural paths. This method results in the very complex “burst patterns” reported on individual neural pathsin current research. Even to capture these words requires more sophisticated electronic data recording than usuallyused in vision research.
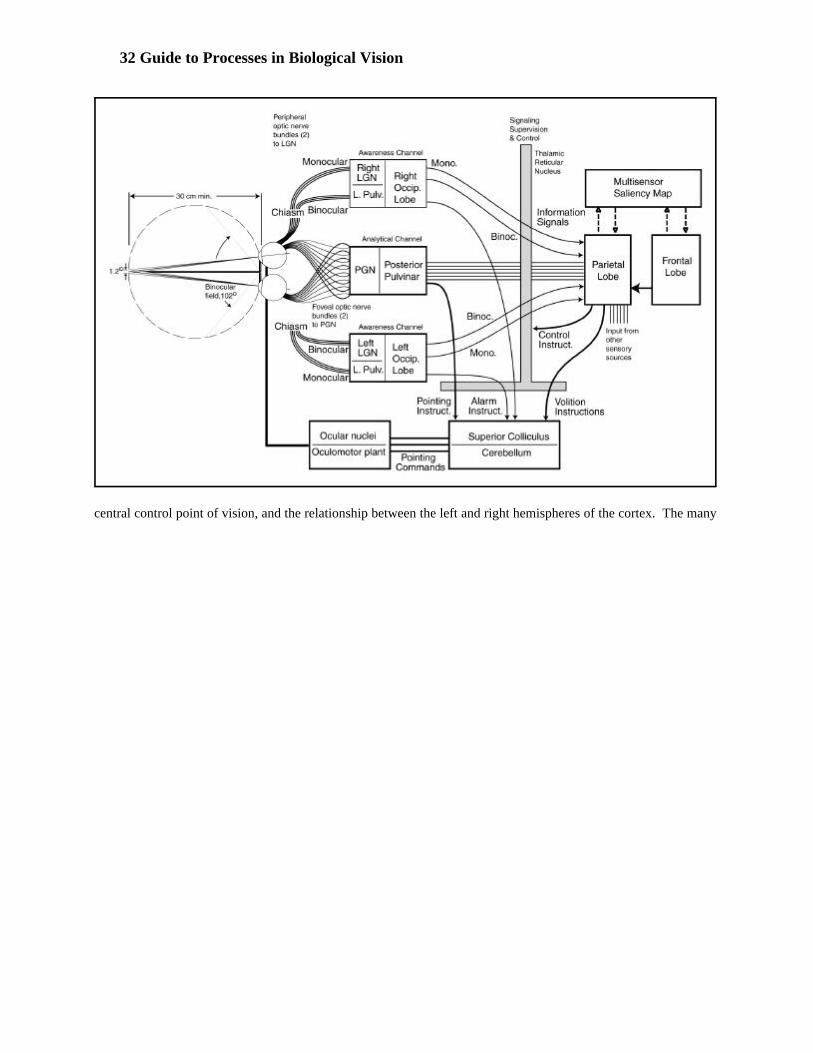
32 Guide to Processes in Biological Vision
central control point of vision, and the relationship between the left and right hemispheres of the cortex. The many
Tutorial on Biological Vision- 33
4. Neurons are the electrolytic equivalent of man-made electrical circuits
Many of the relationships and hypotheses presented above cannot be addressed without a detailed understanding ofhow the neuron works. Such an understanding is not available under the chemically based neuron doctrine orneurotransmitter dogma of neuroscience.
An electrolytically based description of the neuron and the synapse is needed to understand the detailed functionalrelationships of the neuron and the neural system. This section will provide an overview of that understanding.
The primary point (that will be justified below) is that the electrolytic circuitry found within and between neuronsis directly analogous to man-made electronic circuits. For the reader versed in electronics, the Activa of the neuronis a PNP type junction device operating at very low voltages (maximum collector potential of -154 mV). It is theelectrolytic equivalent of a solid-state transistor. The man-made equivalent to the electrolytic Activa is protectedby United States Patent #5,946,185.
All of the neural circuits are direct coupled. However, a variety of techniques are used to avoid the problemsinherent in direct coupled circuits. Each neuron is supported by a number of individual electrolytic power sources. These sources use a unique battery concept similar to that found in a fuel cell.
4.1 The electrolytic versus ionic argument of neuron operation
From the mid 1800's until about 1960, the neuron had been considered an electrical device of mysterious character. At the time of Hodgkin & Huxley, the argument turned to the neuron as a chemically controlled device. Threereasons are apparent for this change. First, most of the investigators were biologically oriented based on their early training in chemistry. Second, Hodgkin & Huxley had difficulty explaining how the electrical potential internal toan axon changed during their experiments. Lacking an alternative, they described the axolemma as an activetissue with two significantly different time related characteristics. It could transfer ions slowly from one side of themembrane to the other by an undefined metabolic mechanism they called an ion-pump. This provided thenecessary bias potential. In addition, they described an action potential as consisting of two nominally exponential current functions opposing each other. By assuming two different time constants, they could generate currentwaveforms that resembled the responses they recorded from their test set. They then sought the potential sourcesof such currents. They looked at the concentration of different ions found on each side of the membrane. Theconclusion was reached that sodium ions were more abundant on one side of the membrane than the other. Similarly, potassium ions exhibited the opposite abundance characteristic. Based on these observations, theyproceeded to conceptualize two separate conduction paths for ions of these types. These paths were variable inconductance and supported by opposing independent electrical batteries that only affected the individualconductance paths. Using this technique, they could explain to the audience of that day why both positive ionswent in opposite directions relative to the bias across the membrane. Unfortunately, no explanation for themechanism controlling the variable conductances was ever given, although they were obviously linked.
Third, the technology of semiconductor physics was maturing simultaneously in a different field. It was a fieldwhere most biologists felt uncomfortable. The decision of the community at that time was to select ionic currentsas the dominant source and mechanism of neuron activity. This decision became a strong suppressant to activityby investigators in the field. To be published, they had to accept what became the neurotransmitter dogma. Between the 1960's and the present, semiconductor physics has caused the greatest advancements in man’sknowledge, and standard of living ever known. Meanwhile, the concept of the neuron has remained largelystagnant in the literature over the same period.
To this day, most neuroscientists are unaware of the other mechanisms of charge transport provided bysemiconductor physics and overlooked by Hodgkin & Huxley. Proving the motion of any ions across the

34 Guide to Processes in Biological Vision
membrane as part of an action potential is also extremely difficult. A typical current of 25 pA for 10 millisecondsamounts to only 2.6 micro-micro-micro moles of a mono-charged ion. Even with the latest instrumentation, this isa small number. Finally, the ideas offered by Hodgkin & Huxley only applied to neurons generating actionpotentials. Less than 10% of the neurons in the brain and less than 4% of the neurons in the retina generate actionpotentials. What is the conceptual explanation, based on chemistry, for the operation of the other 90% of theneurons?
4.2 Semiconductor physics applied to the neuron
Early in the development of semiconductor physics, an unusual effect was isolated using the Hall Effect. ThisEffect showed clearly that two different kinds of charge were being transported through crystalline semiconductormaterials. They appeared to be of opposite charge and to move in opposite directions within a single electricalfield. They could be isolated by applying an orthogonal magnetic field. The result was the recognition of anegative charge carrier as the electron and an equivalent positive charge carrier called a “hole.” The hole is in factan electron jumping from one electrically unbalanced location in the crystal lattice to another. This motionexhibits a significantly different mobility than does the motion of the electrons associated with the conductionband.
Ample data is now available concerning the ability of liquid crystalline organic materials to transmit currents aseither electrons or “holes.” In fact the field of organic semiconductors is now a major field of research leading to light-emitting diodes.
The application of semiconductor physics to the liquid crystalline structures known as plasma membranes leads toan entirely different explanation of how a neuron works. This application will be explored below. It provides theanswer to how a neuron works and also how it is powered. Section 4.3.2 will be shown that the long sought ion-pump is in fact an electron/hole pump based on an electrostenolytic chemical process.
4.2.1 The plasma membrane as an electrolytic component
The fundamental molecular structure of the bilayer membrane forming the plasmalemma of a biological cell is wellknown [4.1]. However, the variations in that structure related specifically to the neuron are not. The bilayermembrane is made up of two liquid crystalline layers of triphospholipids with their hydrophobic terminals facingeach other. Their hydrophilic terminals face the water-based plasmas on each side of the membrane. Thecontrolling feature of the membrane with respect to neural operation is the symmetry of the molecular layers. Ifthe two liquid crystalline layers are symmetrical at the molecular level, the membrane is a very high qualityinsulator electrically. If however, the two liquid crystalline layers are asymmetrical, the membrane exhibits theelectrical characteristic of a very high quality diode. A typical plasma membrane may have distinct zonesconsisting of symmetrical and asymmetrical layers. The asymmetrical zones are the keys to the operation of theneural system.
Figure 4.2.1-1 illustrates the molecular structure of a typical bilayer membrane. It also defines the electricalcharacteristics of individual zones of the membrane from an electrical perspective. Additional labels are providedalong the top to help orient the reader. Water-based solutions are shown on both sides of this membrane. In thissimple example, one solution is associated with the intercellular space and one is associated with the intracellularspace of the cell. These solutions are electrically conductive. The long-chain lipid portions of the molecules arelabeled p-type below the figure. This is the term used in semiconductor physics to designate a material exhibitinga deficit of electrons (relative to a neutral condition) within its crystalline structure. Similarly, the phosphorylatedportion of the molecules are labeled n-type material. This material is found to exhibit an excess of electronsrelative to a neutral condition. These labels are consistent with the polarization of a molecule defined by achemist.
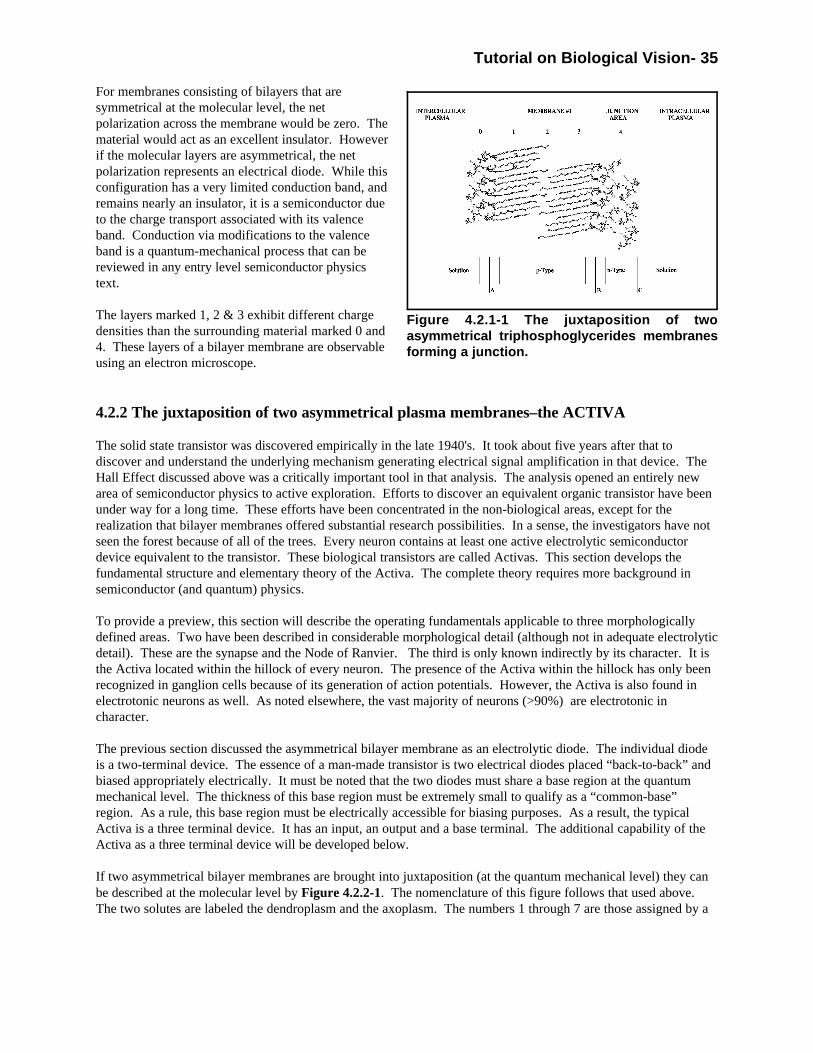
Tutorial on Biological Vision- 35
Figure 4.2.1-1 The juxtaposition of twoasymmetrical triphosphoglycerides membranesforming a junction.
For membranes consisting of bilayers that aresymmetrical at the molecular level, the netpolarization across the membrane would be zero. Thematerial would act as an excellent insulator. Howeverif the molecular layers are asymmetrical, the netpolarization represents an electrical diode. While thisconfiguration has a very limited conduction band, andremains nearly an insulator, it is a semiconductor dueto the charge transport associated with its valenceband. Conduction via modifications to the valenceband is a quantum-mechanical process that can bereviewed in any entry level semiconductor physicstext.
The layers marked 1, 2 & 3 exhibit different chargedensities than the surrounding material marked 0 and4. These layers of a bilayer membrane are observableusing an electron microscope.
4.2.2 The juxtaposition of two asymmetrical plasma membranes–the ACTIVA
The solid state transistor was discovered empirically in the late 1940's. It took about five years after that todiscover and understand the underlying mechanism generating electrical signal amplification in that device. TheHall Effect discussed above was a critically important tool in that analysis. The analysis opened an entirely newarea of semiconductor physics to active exploration. Efforts to discover an equivalent organic transistor have beenunder way for a long time. These efforts have been concentrated in the non-biological areas, except for therealization that bilayer membranes offered substantial research possibilities. In a sense, the investigators have notseen the forest because of all of the trees. Every neuron contains at least one active electrolytic semiconductordevice equivalent to the transistor. These biological transistors are called Activas. This section develops thefundamental structure and elementary theory of the Activa. The complete theory requires more background insemiconductor (and quantum) physics.
To provide a preview, this section will describe the operating fundamentals applicable to three morphologicallydefined areas. Two have been described in considerable morphological detail (although not in adequate electrolyticdetail). These are the synapse and the Node of Ranvier. The third is only known indirectly by its character. It isthe Activa located within the hillock of every neuron. The presence of the Activa within the hillock has only beenrecognized in ganglion cells because of its generation of action potentials. However, the Activa is also found inelectrotonic neurons as well. As noted elsewhere, the vast majority of neurons (>90%) are electrotonic incharacter.
The previous section discussed the asymmetrical bilayer membrane as an electrolytic diode. The individual diodeis a two-terminal device. The essence of a man-made transistor is two electrical diodes placed “back-to-back” andbiased appropriately electrically. It must be noted that the two diodes must share a base region at the quantummechanical level. The thickness of this base region must be extremely small to qualify as a “common-base”region. As a rule, this base region must be electrically accessible for biasing purposes. As a result, the typicalActiva is a three terminal device. It has an input, an output and a base terminal. The additional capability of theActiva as a three terminal device will be developed below.
If two asymmetrical bilayer membranes are brought into juxtaposition (at the quantum mechanical level) they canbe described at the molecular level by Figure 4.2.2-1. The nomenclature of this figure follows that used above. The two solutes are labeled the dendroplasm and the axoplasm. The numbers 1 through 7 are those assigned by a

36 Guide to Processes in Biological Vision
Figure 4.2.2-1 The molecular structure of the Activa within the hillock of a neuron. In operation, the configurationconsists of two asymmetrical bilayer membranes (BLM) in close proximity and appropriate voltages applied betweenthe dendroplasm, the axoplasm and the material in the junction area between the two bilayers (the podaplasm). Thelattices in the junction area and on the extreme left and right surfaces are hydronium.
cytologist to a seven-layer junction between two bilayer membrane walls. Note they usually see layers 1, 3, 5 & 7as dark lines and assign 2, 4 & 6 to the light spaces between these lines. It is seen from this figure that thecharacters of these spaces are different. Whereas 2 & 6 appear empty, 4 has a distinct character. In fact, thematerial represented by 4 is critical to the operation of the neurons. A similar material that is performing adifferent function is found between layers 1 & 7 and their respective solutions. It would be advisable to numberthese regions 0 & 8 when speaking of the functional performance of such a sandwich.
Note the complex molecular structure at the interface between each plasma and the adjacent leaflet. This area isdescribed in terms of hydronium ions. The structure in the junction area is also described in terms of hydronium. In these cases, the material constitutes a hydronium crystal.
There is no physical movement of heavy ions within this overall structure. This is true even under the influence ofexternal voltages. Additional material related to the electrical topology of this seven-layer junction will be found inChapter 8 of the supporting work.
The area marked 4 becomes the common base area of the Activa. It has a nominal width of less than 10nanometers. Because of its small size (comparable to that of many molecules), units of Angstrom remain commonwhen discussing this region. The gap is frequently described as less than 100 Angstrom wide. A value of 80Angstrom can be considered typical for a “gap junction.”
Under the above definition of an Activa, two different forms of “gap junction” are evident. The first merely meetsthe criteria of physical spacing between the two membranes. This condition is easily observed using the electronmicroscope. The second form is an “active gap junction,” (a-gap). It meets the additional criteria that it iselectrically asymmetrical at the molecular level and is properly biased electrically. This form can also berecognized using the electron microscope. However, greater degrees of observation skill and experience arerequired.
After physical juxtaposition, the electrical environment must be established that will support “transistor action.”
Tutorial on Biological Vision- 37
This requires that the input diode be biased to encourage current flow from the input to the base. Simultaneously,the output diode must be biased to discourage current flow from the output to the base. Under these conditions, aremarkable result is achieved. A current equivalent to that injected at the input appears at the output terminal. Itis as though the input current failed to make a turn to exit through the base and went on directly to the outputterminal despite the opposing electrical bias of the output circuit. This effect is known as “transistor action.” Inthe figure, current introduced at terminal 0 will appear at terminal 8 under the appropriate bias conditions. Theoretically, no net current need flow through terminal 4 under these conditions. However, a current throughterminal 4 of between 0.1 and 1.0 percent of the output current is typically observed.
Many researchers have noted the apparently small forward impedance between the input and output plasmas ofneurons. They have also noted the high electrical impedance for current flowing in the opposite direction. This isa basic characteristic of an Activa with its input terminal forward biased and its output terminal reverse biased (asrequired to achieve the transistor effect). A simple operational Activa looks like an electrical diode connectedbetween the appropriate input plasma and the appropriate output plasma.
Using the electron microscope, the active electrolytic semiconducting device, the Activa, is easily identified. It isusually described cytologically as a seven-layer structure. The fourth layer is formed by the base region. Areasmarked 0 and 8 are usually not considered part of the structure but indicative of the background environmentformed by the associated plasmas.
The two diodes exhibit a capacitance between their terminals. When properly biased for operation, these twocapacitances within the Activa become charged electrically. If care is taken in specimen preparation, the presenceof these charges can be seen using an appropriate electron microscope. These charges contribute to a morecomplex picture than that of an unbiased gap junction. The charges frequently bend the beam of the electronmicroscope sufficiently to obscure one or more individual layers of the junction. [4.3.6]. Additional materialrelated to the electrical topology of this seven-layer junction will be found in Chapters 4 and 8 of the compendium.
4.2.3 The Electrostenolytic Process defines/replaces the ion-pump
The source of the electrical bias across the plasma membrane of every cell has been sought a very long time. Basedon their experiments, Hodgkin & Huxley hypothesized an ion-pump as a component of a neuron. This putativeion-pump could transfer ions across a membrane for purposes of biasing the cell. Because of their otherhypotheses, two ion-pumps were required, one for moving sodium ions into the neuron and another one for movingpotassium ions out of the neuron. These pumps necessarily moved one ion in opposition to the existing electricalbias. While many researchers have sought this ion-pump, no actual, or even plausible, cytological explanation ofsuch a mechanism has appeared during the last 50 years.
An asymmetrical bilayer membrane is an electrolytic diode. It can transport charge across the membrane underproper bias conditions. In this configuration, it can participate in an additional mechanism that is critical to theoperation of all neurons. This is the electrostenolytic process, an obscure although well-documented process ofphysical chemistry.
The electrostenolytic process involves a chemical reaction that is stereochemically dependent on a substrate. Substrate is used here in a physical as well as an enzymatic context. The reaction will not take place unless thepotential reactant(s) is in a specific stereochemical relationship with the substrate.
The electrostenolytic process of interest in neuroscience is the conversion of an unusual amino-acid in exchange forthe release of CO2 and an electron. The specific reaction is shown in Figure 4.2.2-2. Glutamic acid (glutamate)can become attached to the surface of an asymmetrical bilayer membrane by sharing a hydrogen bond (shown bythe dashed line) with that surface that is part of a carboxyl radical. The glutamate can then release a secondcarbon dioxide group along with an electron. This electron can then pass to the inside of the membrane. Thischarge movement causes a net negative charge on the capacitor associated with the membrane. The inside of the
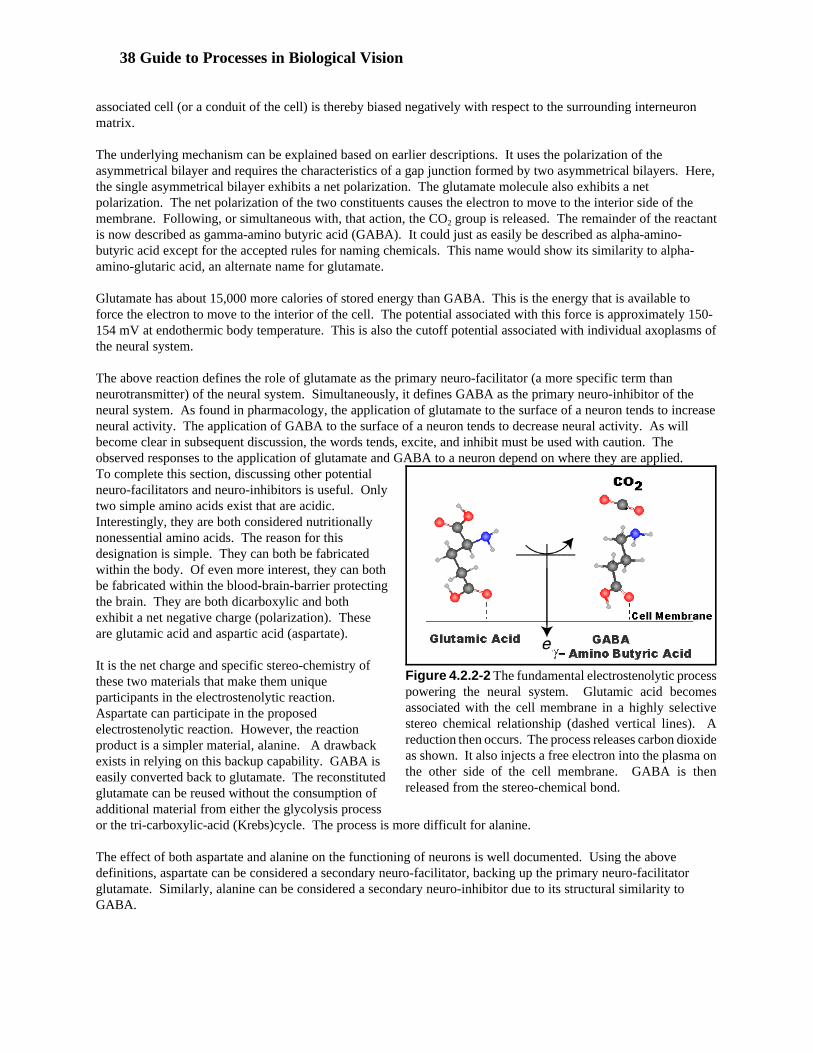
38 Guide to Processes in Biological Vision
Figure 4.2.2-2 The fundamental electrostenolytic processpowering the neural system. Glutamic acid becomesassociated with the cell membrane in a highly selectivestereo chemical relationship (dashed vertical lines). Areduction then occurs. The process releases carbon dioxideas shown. It also injects a free electron into the plasma onthe other side of the cell membrane. GABA is thenreleased from the stereo-chemical bond.
associated cell (or a conduit of the cell) is thereby biased negatively with respect to the surrounding interneuronmatrix.
The underlying mechanism can be explained based on earlier descriptions. It uses the polarization of theasymmetrical bilayer and requires the characteristics of a gap junction formed by two asymmetrical bilayers. Here,the single asymmetrical bilayer exhibits a net polarization. The glutamate molecule also exhibits a netpolarization. The net polarization of the two constituents causes the electron to move to the interior side of themembrane. Following, or simultaneous with, that action, the CO2 group is released. The remainder of the reactantis now described as gamma-amino butyric acid (GABA). It could just as easily be described as alpha-amino-butyric acid except for the accepted rules for naming chemicals. This name would show its similarity to alpha-amino-glutaric acid, an alternate name for glutamate.
Glutamate has about 15,000 more calories of stored energy than GABA. This is the energy that is available toforce the electron to move to the interior of the cell. The potential associated with this force is approximately 150-154 mV at endothermic body temperature. This is also the cutoff potential associated with individual axoplasms ofthe neural system.
The above reaction defines the role of glutamate as the primary neuro-facilitator (a more specific term thanneurotransmitter) of the neural system. Simultaneously, it defines GABA as the primary neuro-inhibitor of theneural system. As found in pharmacology, the application of glutamate to the surface of a neuron tends to increaseneural activity. The application of GABA to the surface of a neuron tends to decrease neural activity. As willbecome clear in subsequent discussion, the words tends, excite, and inhibit must be used with caution. Theobserved responses to the application of glutamate and GABA to a neuron depend on where they are applied. To complete this section, discussing other potentialneuro-facilitators and neuro-inhibitors is useful. Onlytwo simple amino acids exist that are acidic. Interestingly, they are both considered nutritionallynonessential amino acids. The reason for thisdesignation is simple. They can both be fabricatedwithin the body. Of even more interest, they can bothbe fabricated within the blood-brain-barrier protectingthe brain. They are both dicarboxylic and bothexhibit a net negative charge (polarization). Theseare glutamic acid and aspartic acid (aspartate).
It is the net charge and specific stereo-chemistry ofthese two materials that make them uniqueparticipants in the electrostenolytic reaction. Aspartate can participate in the proposedelectrostenolytic reaction. However, the reactionproduct is a simpler material, alanine. A drawbackexists in relying on this backup capability. GABA iseasily converted back to glutamate. The reconstitutedglutamate can be reused without the consumption ofadditional material from either the glycolysis processor the tri-carboxylic-acid (Krebs)cycle. The process is more difficult for alanine.
The effect of both aspartate and alanine on the functioning of neurons is well documented. Using the abovedefinitions, aspartate can be considered a secondary neuro-facilitator, backing up the primary neuro-facilitatorglutamate. Similarly, alanine can be considered a secondary neuro-inhibitor due to its structural similarity toGABA.

Tutorial on Biological Vision- 39
Based on the above discussion, seeing how other materials might affect the operation of neurons is easy. Two basicmethods are available. One is to affect the access of glutamate to the electrostenolytic site and/or the removal ofGABA from the site. The second is to affect the availability of glutamate regardless of access. The steps inproviding glutamate to the neurons are many. Any chemical that interferes with the process of providingglutamate in nominal quantities can be considered a neuro-inhibitor. Any action that increases the concentrationof glutamate at the electrostenolytic site can be considered a neuro-facilitator. Long lists of agents have beenprepared based on these qualifications. They have previously been lumped under the designation“neurotransmitters.” However, it is critically important to note these materials are completely unrelated to signaltransmission in a neuron.
The symbol in the figure is drawn to suggest that glutamate reacts to form GABA while releasing CO2 on one sideof the membrane and an electron on the other. It suggests the reaction occurs on the outside of the cell membrane. More study is required of this reaction. The reaction may occur within the cell
The reaction of glutamate to form GABA has long been associated with the operation of neurons. By associatingthe reaction with the electrical biasing of the plasma associated with the process, the explanation of the putativeion-pump is provided. Noting that the ion-pump is really a charge-pump is important. Either electrons, or if thereader prefers, holes are the form of charge moved (pumped) across the membrane. There is no need for heavyions to be transported (pumped) across the membrane as part of the neural mechanism.
4.3 The operation of the electrolytic neuron
4.3.1 The application of the ACTIVA and electrostenolysis to the synapse
The above discussion can be applied directly to the synapse between two neurons. Only the names change.
Within the synaptic region, the presynaptic terminal is now formed by the axolemma and axoplasm of thepreceding neuron and the post synaptic terminal is now formed by the dendrolemma and dendroplasm of theorthodromic neuron. The base terminal is now at an electrical potential that is close to that of the interneuronmatrix, except for any potential related to the impedance due to the very narrow passage connecting to the baseregion. This impedance can be significant. The synaptic region is so narrow that all large molecules are forcedout of this region by Brownian motion. As a result, the remaining small molecules (water) form a liquidcrystalline structure called hydronium. This small crystal has frequently been observed by electron microscopists(who have always considered it an unwelcome artifact).
The electrostenolytic processes powering both the axoplasm and the dendroplasm are frequently found near thesynaptic junction. However, they do not involve a juxtaposition of two membranes and need not be in any part ofthe synaptic gap. In fact the chemical reaction associated with electrostenolysis is enhanced by easy access to thesurrounding interneuron matrix.
Figure 4.3.1-1(A) provides a caricature of a synapse showing both the signaling and support areas. Thiscaricature is compatible with the electron microscope images in the literature. However, it differs in interpretation. The synapse can be divided into two major areas, the area associated with signaling and the area associated withsupport activities. These areas are frequently crowded together for two reasons. The presence of myelination onthe axon restricts the diffusion of chemicals to the immediate area of the synapse. The size of the post synapticstructure is usually quite small. Keeping this component small assures adequate electrical conduit bandwidth inthe absence of myelination. The support area also consists of two areas. The first area supports the metabolism ofthe cells. Many chemicals can be captured by vesicles and transferred into the two conduits as required. Similarly,waste products unable to diffuse through the cell membranes can be expired via vesicles. The second area providesthe substrate for the electrostenolytic process. The process is shown here as releasing CO2 into the interneuron

40 Guide to Processes in Biological Vision
Figure 4.3.1-1 A simple caricature of the morphology ofa synapse with equivalent electrolytic symbols. A; thesignaling space does not contain any mobile ions orchemicals. Metabolic support to the synapse is via theadjacent support space. B; the electrical equivalent of thesynapse showing the Activa. C; the simplified electricalequivalent when the instantaneous axoplasm potential ismore positive than the instantaneous dendroplasm.
matrix.
The very narrowest part of the synapse, the active gapjunction is frequently obscured (appears fuzzy) inelectron micrographs due to the concentration ofcharge in the area. The same fuzziness is frequentlyobserved associated with the electrostenolyticprocesses shown along the top edge of both the preand post synaptic junction. The more open area of thesynapse is usually imaged with greater clarity. However, this clarity is not usually at sufficientmagnification to show the vesicles clearly. In anycase, the electron micrograph is an image in time. Itdoes not show the dynamic character of the vesicles asthey breach the membrane.
The two electrostenolytic processes are the primarymodes of biasing the active gap junction of thesynapse. However, the impedance between theinterneuron matrix and the base area of the Activa canalso create a bias potential due to the current flowingthrough it. The resulting situation is shown in (B)from an electrical perspective. The active gapjunction forms a conventional electrolyticsemiconductor device, an Activa. The Activa is ananalog device. A current injected into the pre synapticcircuit results in a nearly identical current in the postsynaptic circuit. This fact is illustrated by thesimplified symbol used in (C).
The exposed active gap junction, or synapse isnormally an electrotonic circuit characterized by itslow forward impedance. However, as manyinvestigators have found, Makin a synapse begin togenerate action potentials is easy. The capacitance ofthe test probe is adequate to cause this action. Thegeneration of action potentials will be discussed inSection 4.3.3.
4.3.2 The synapse in a morphological and functional context
Figure 4.3.2-1 expands on the above figure to show the synapse in a larger morphological and functional context. The upper frame shows the morphological situation. Terminal 1 suggests the input of a current from the Activafound within a cell and to be discussed below. This occurs at a region of the axolemma that is molecularlyasymmetrical. Most of the remainder of the axolemma is an insulator due to the presence of symmetrical bilayers. However, electrostenolysis occurs in the area labeled power source and the transfer of current from the axoplasm tothe dendroplasm occurs via the active gap junction.
The dendrolemma is designed like the axolemma. The membrane is inherently insulating except in regions wherethe bilayer is asymmetrical at the molecular level. These regions act analogously to those described above.
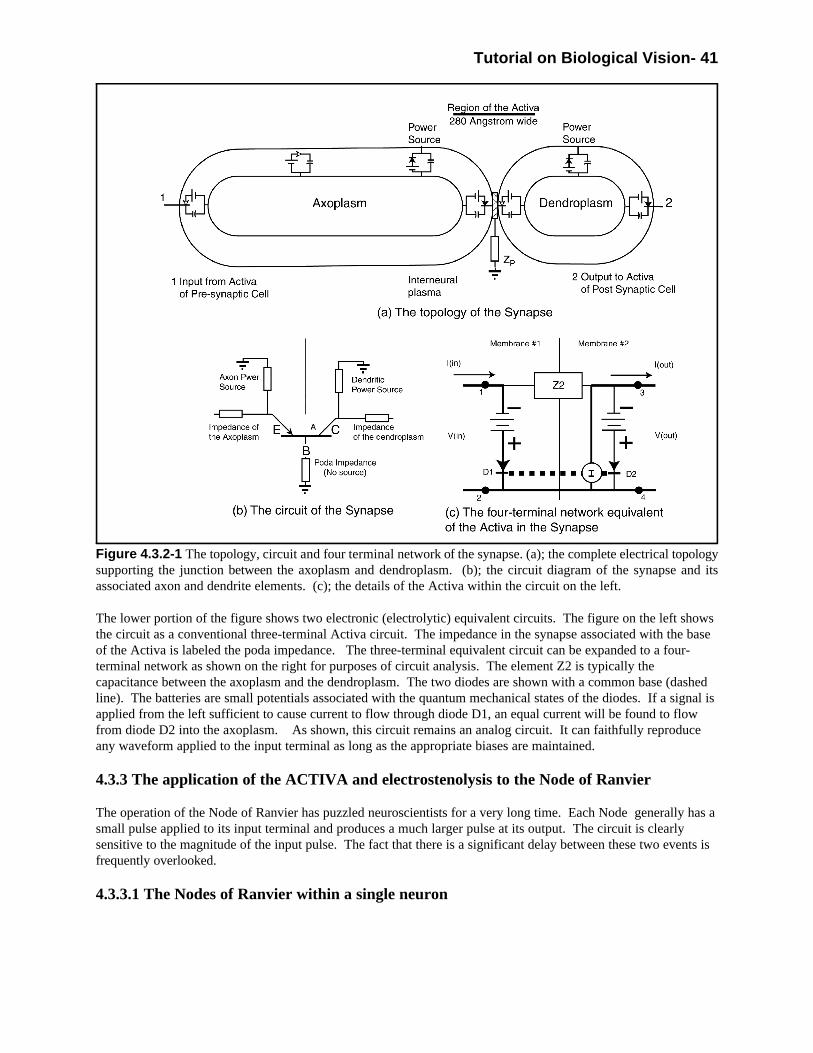
Tutorial on Biological Vision- 41
Figure 4.3.2-1 The topology, circuit and four terminal network of the synapse. (a); the complete electrical topologysupporting the junction between the axoplasm and dendroplasm. (b); the circuit diagram of the synapse and itsassociated axon and dendrite elements. (c); the details of the Activa within the circuit on the left.
The lower portion of the figure shows two electronic (electrolytic) equivalent circuits. The figure on the left showsthe circuit as a conventional three-terminal Activa circuit. The impedance in the synapse associated with the baseof the Activa is labeled the poda impedance. The three-terminal equivalent circuit can be expanded to a four-terminal network as shown on the right for purposes of circuit analysis. The element Z2 is typically thecapacitance between the axoplasm and the dendroplasm. The two diodes are shown with a common base (dashedline). The batteries are small potentials associated with the quantum mechanical states of the diodes. If a signal isapplied from the left sufficient to cause current to flow through diode D1, an equal current will be found to flowfrom diode D2 into the axoplasm. As shown, this circuit remains an analog circuit. It can faithfully reproduceany waveform applied to the input terminal as long as the appropriate biases are maintained.
4.3.3 The application of the ACTIVA and electrostenolysis to the Node of Ranvier
The operation of the Node of Ranvier has puzzled neuroscientists for a very long time. Each Node generally has asmall pulse applied to its input terminal and produces a much larger pulse at its output. The circuit is clearlysensitive to the magnitude of the input pulse. The fact that there is a significant delay between these two events isfrequently overlooked.
4.3.3.1 The Nodes of Ranvier within a single neuron

42 Guide to Processes in Biological Vision
Figure 4.3.3-1 The first-order hydraulic plan of the brain using a ganglion cell as an example. The axon is shownunmyelinated. The Dendrite, Podite, Axon and Interaxons are all supported metabolically by the nucleus within thesoma. Additional amounts of lactate are probably supplied to the Interaxons by the Glia. The myelination of theInteraxons physically restricts such metabolic supply.
While the neuron is clearly the basic unit of the neurological system from a morphological and metabolicperspective, the case is not so clear from an electrical and signaling perspective. Figure 4.3.3-1 shows a singlemore complex neuron within its normal interneuron matrix environment. It is supported by a glia cell that is notimportant in this discussion. The important features of this figure are the multiple Activas (shown by the solidblack boxes) found between individual electrolytic conduits. The two conduits on the left of the nucleus representthe two input terminals of a complete neuron. The conventional dendrite (a neurite) forms the non invertingterminal of the neuron. It operates as described above. The podite terminal is also formed by a neurite. These twoneurites are frequently identified when discussing neurons as separate bi-stratified neurite structures. They arefrequently labeled bi-stratified dendritic structures when their differences in electrolytic properties have not beenrecognized.
In a properly biased neuron, introducing a differential current into the dendroplasm will cause an equal differentialcurrent in the axoplasm . As an alternative, a differential charge can be introduced into the podaplasm. However,this current will cause the output current to the axoplasm to be of equal magnitude but opposite in sign. The poditeterminal is the inverting input to a neuron.
The figure shows three conduit segments following the Activa embedded in the hillock of the cell body (soma). Allof the neurite conduits and axon conduits are supplied metabolically from the soma of the neuron. In this sense,only one cell is present. However, multiple distinct axons and active devices are present. The biological neuronconsists of multiple building blocks of several different types. In this sense, a single neuron is not a basicelectrolytic entity. For purposes of signaling, a single Activa and its supporting conduits and bias supplies formthe basic neurological element. Whether it is supplied metabolically from the parent soma or via diffusion fromthe adjacent glia is largely immaterial.
Using the above concept as a baseline, differentiating between the first axon and later axons is necessary. The firstaxon always connects to a dendrite via the Activa embedded in the hillock. The later axons do not. They connect

Tutorial on Biological Vision- 43
between an axon, or an axon like structure, and the dendrite of an orthodromic neuron, OR another axon likestructure. Here, the axon like structure looks like a dendrite or podite electrolytically. These intermediatestructures will be labeled interaxons. From an electrolytic perspective, they are at the potential and have theproperties of a dendrite at their antidromic end. At their orthodromic end, they are at the potential and have theproperties of an axon.
Within this overall configuration, each Node of Ranvier looks the same. It is an Activa found between twoconduits and it is not embedded in the hillock of the parent neuron. Either or both conduits may be myelinated. Inthe retina, axon segments are not myelinated until they enter the optic nerve.
4.3.3.2 The morphology/cytology of a Node of Ranvier
Describing the morphology of a Node of Ranvier in detail is difficult, based on individual electron micrographs. The image portrayed in an electron micrograph only shows one plane, generally including the axis, of a tubular orrod like structure. While the electrolytic conduits associated with both sides of the Node are usually easilyrecognized, many other details are difficult to portray. When examining the tissue surrounding the Node of Ranvier, the metabolic tissue provided by the supporting somamay or may not be symmetrical with respect to the chosen slice. Similarly, the tissue associated with the glia mayappear asymmetrically in the micrograph. These conditions complicate the analysis of the micrograph.
The active gap junction is frequently so small, the microtome slice chosen for examination does not contain it. Inthis case, the investigator frequently suggests the two plasma membranes are not in intimate contact. Occasionally, the sample will contain the area immediately adjacent to the active gap junction but not the junctionitself. Here, the investigator generally claims the two membranes are in intimate physical contact. Typically, themagnification of the microscope is not adequate to support this claim.
A similar situation occurs when a cross section view of the Node is wanted. In this case, the microtome slice maynot include the active gap junction. The investigator generally describes the area near the active gap junction asuniform. Alternately, the microtome slice may include the active gap junction. Here, the investigator frequentlyremoves the hydronium crystal mechanically. He does this because the presence of water molecules seriouslydisrupts the vacuum pumping system associated with the microscope.
4.3.3.3 The Node of Ranvier alone
The Node of Ranvier is fundamentally different from the synapse in at least three ways. First, the Node of Ranviermay be embedded within a neuron. If not totally embedded, it is frequently more completely surrounded byassociated structures than the typical synapse. Second, the output circuit associated with a Node of Ranvier is notthe dendrite of an orthodromic neuron. Finally, the circuit is designed as a monopulse oscillator. It is notelectrotonic. It generates action potentials at the output terminal of the Activa. A series of Nodes of Ranvier maybe found within one neuron.
To understand how a Node of Ranvier can generate an action potential, it is necessary to understand the operationof a simple Activa when combined with an appropriate size capacitor. This capacitor can be found connecting anytwo terminals of the three-terminal device. This work will not dwell on the specific circuit configuration. Figure4.3.3-2 (A) shows two capacitors in a typical Node of Ranvier circuit. One is connected between the emitter(input) terminal and the base. The second is connected between the collector (output) terminal and the base. Depending on their size, either one is adequate to cause oscillation [10.8.4].

44 Guide to Processes in Biological Vision
Figure 4.3.3-2 Functional operation of a Node of Ranvier.A; During discharge, the Activa “acts” as a short circuitbetween the emitter and collector circuits. Duringrecharging, it is an open switch. The circuits rechargeindependently. B; details of the current flow during anaction potential. C; current flow into and out of the INMduring an action potential.
There are three phases to the generation of an actionpotential. They are shown in frame (B) of the figure. After the biases are established in a Node of Ranvier,the circuit enters a quiescent mode. No current flowsthrough the device and the output circuit potential isnear electrical cutoff. This potential is typically –150mV relative to the interneuron matrix.
If a small input is applied to the emitter terminal,nothing will happen until the amplitude of that inputexceeds a threshold value. At that point, current willbegin to flow through the Activa. If the timeconstants of the emitter and collector circuits areappropriate, the net current through the poditicimpedance will maintain the voltage differencebetween the emitter and the base until the collector(axoplasm) potential approaches a low voltage. Thisvoltage is typically near -20 mV. At that point, thecurrent through the Activa will cease. The input andoutput circuits will then recharge to their initialvalues. The various currents are shown by dashedlines in the frame. The output (axoplasm) potential isshown by the curved solid lines. Note the risingpotential exhibits one time constant and the fallingpotential exhibits another. This feature and thediscontinuity near the peak positive value of thewaveform are characteristic of a Node of Ranvieraction potential.
Frame C shows the net currents and voltagesfrequently recorded by investigators. The shape ofthese waveforms is consistent with the waveforms defined in frame B. The loop current shown can be predictedprecisely if the limited travel velocity of electrolytic currents along the axon segment is accounted for.
Figure 4.3.3-3 shows a theoretical action potential based on this model. It has been fit to a variety of measuredaction potentials [10.8.3]. The time constant of the rising waveform is 0.18 msec. The time constant of thenominal falling waveform (solid line) is 0.8 msec. Note that switching occurred at 0.6 msec after a voltage changeof 62 mV. In the absence of switching, the rising waveform would have followed the dotted line. In the particularcase shown, the dashed line shows the effect of superfusing the neuron with 4-aminopyridine. The effect has beento increase the time constant of only the falling waveform to 1.4 msec. The chemical did not affect the risingwaveform or the switching point. This change suggests 4-aminopyridine interfered with the site of theelectrostenolytic process providing power (current) to the neuron.

Tutorial on Biological Vision- 45
Figure 4.3.3-3 The theoretical action potential for anendothermic animal. The solid curve represents thenominal response. The dashed curve represents theresponse after pharmacological intervention. Note theabrupt switching transition at 0.0006 seconds.
The action potential waveform is the result of aswitching process related to the gain characteristic ofthe Activa and the impedance of the other electrolyticelements in the Node of Ranvier circuit. This is theswitching mechanism that biochemists have beenseeking ever since Hodgkin & Huxley proposed theirionic theory of the action potential during the 1950's. Note the fact that the action potential involves a trueswitching mechanism. Section 9.1.1 will show thewaveform of the photoexcitation/de-excitationmechanism is fundamentally different. This so-calledgenerator potential involves the difference betweentwo exponential processes competing continuouslyagainst each other.
4.3.4 The application of the ACTIVA andelectrostenolysis to a ganglion cell
[Figure 4.3.3-2 (A)] can also be used to describe theoperation of any ganglion cell [14]. A ganglion cell islike a Node of Ranvier with respect to capacitance. However, two different types of ganglion cells exist based ontheir bias conditions [14.2]. If the Activa within the hillock is biased like the Node of Ranvier, the circuit willoperate like a Node of Ranvier. It will generate an individual action potential upon the application of anywaveform sufficient to start current flowing in the Activa. This monopulse will look exactly like the actionpotential of the typical Node of Ranvier unless the time constants are different.
If the input waveform is held above the threshold for an extended interval, the circuit will generate a series ofaction potentials of essentially equal spacing (after the first pulse pair) until the input goes below threshold. Thefirst pulse pair may exhibit a slightly different spacing because of the parameters of the circuit. This circuit actionis that associated with the ganglion cells of the luminance channel (the R–channel) of biological vision. This typeof ganglion cell is frequently associated with the magnocellular pathway of vision. It is also the type of signalobserved in the G’–channel of vision. These cells are frequently labeled midget ganglion cells and exhibit an“intermittent” output.
If the bias applied to the above ganglion cell is appropriate to cause a continuous current to flow in the Activa, adifferent action is observed. As in the previous case, the gain of the circuit will cause the Activa to begin to switchstates and the axoplasm potential will fall. When the axoplasm reaches its minimum potential, the current throughthe Activa will cease and recharging of the input and output circuits will begin. However, the input circuit willreach a point where current will begin to flow through the Activa. As a result, the cycle will repeat itself. Acontinuous series of action potentials will be generated. This is the type of signal generated in the chrominancechannels (O–, P– and Q–channels) of biological vision. It is frequently associated with the parvocellular pathwayof vision. These cells are frequently labeled parasol ganglion cells and exhibit a “sustained” output.
If an additional signal is applied to the input of a parasol ganglion cell, the interval between the action potentialswill vary as a function of this input signal. This is the method used to encode electrotonic chrominance signalsinto phasic action potentials. The input signal can be of either polarity or change polarities. The spacing betweenthe action potentials will follow the prescribed waveform.
Note that all action potentials exhibit a discontinuity near the peak positive excursion of the pulse. This feature isa characteristic of a switching type oscillator. It is seen in all recordings of action potentials if adequate care istaken.
46 Guide to Processes in Biological Vision
4.3.5 The application of the Activa to a bipolar or lateral cell
The above discussion of the ganglion cell provides the backdrop for understanding the operation of the bipolar andlateral cell types [13]. The bipolar and lateral cells do not contain the necessary capacitance to oscillate andgenerate action potentials. These cell types are electrotonic amplifiers. Their output is proportional to thedifference between their input signals as long as their bias potentials are appropriate to allow some current to passthrough the Activa.
The lateral cells include the horizontal cell and a variety of amercine cells. The bipolar cell only uses the dendriticsignal input and generates an output of the same polarity as the input. The lateral cells use both the dendritic andpoditic inputs to generate an output that is the algebraic difference between the two inputs. While the output maybe at a different absolute potential than the inputs, the output waveform will faithfully represent the electrotonicdifference between the two input waveforms. The output of the lateral cells are frequently described as invertingcells. However, inversion only applies to the poditic input signal.
The analyses provided above describe the exact potentials measured in the laboratory for the various classes ofneurons.
4.3.6 The stellate cell recovers the encoded signals
After the ganglion cells encode visual signal information, and propagation neurons deliver the signal informationto the various feature extraction engines of the brain, an electrolytic circuit is needed to recover the encodedinformation [14]. This area has not been discussed previously in the literature. Examining the signal pathsentering these engines, based on morphology, it appears the stellate cells perform this decoding function. Decoding of time-interval encoded streams of action potentials, like those found in the luminance channel, arequite easy from an electrical perspective. A circuit consisting of a series diode connected to a long time-constantparallel resistor-capacitor combination will accept a stream of pulses and provide an output waveform that is thetime averaged equivalent of the input. As discussed above, the transfer characteristic between the input and outputof the Activa within a typical neuron looks like a diode when properly biased. Decoding the chrominance channelsignals is slightly more difficult. However, the same circuit can be used. Since the action potential stream iscontinuous here, an average output voltage will be generated in the absence of any signal. Where the pulses aremore widely spaced, the output will be reduced. Where the pulses are closer together, the output will rise. Thus,the recovered output signal consists of a constant potential added to a faithful reconstruction of the encodedinformation. [14.5.4]
The capacitance required in the resistor-capacitor network of the stellate cell is much larger than required foroscillation in the propagation neurons.
4.3.7 Signal propagation by a neuron
Figure 4.3.7-1 illustrates the vastly different signal propagation velocities found in neural systems [14]. Thevelocity associated with the method of electromagnetic propagation is shown above the graphic. The rateassociated with the more commonly discussed diffusion method is shown below the graphic. The graphic showsmultiple dendritic trees converging on the soma of the cell and one poditic tree. The Activa is shown by thecrosshatched area. The size of the hillock is related to the size of the capacitors associated with the Activa. Forpropagation neurons, the hillock is large compared with the rest of the soma. Two Nodes of Ranvier are shown. The myelinated areas of the axon and interaxons are shown by the dark wrapping.
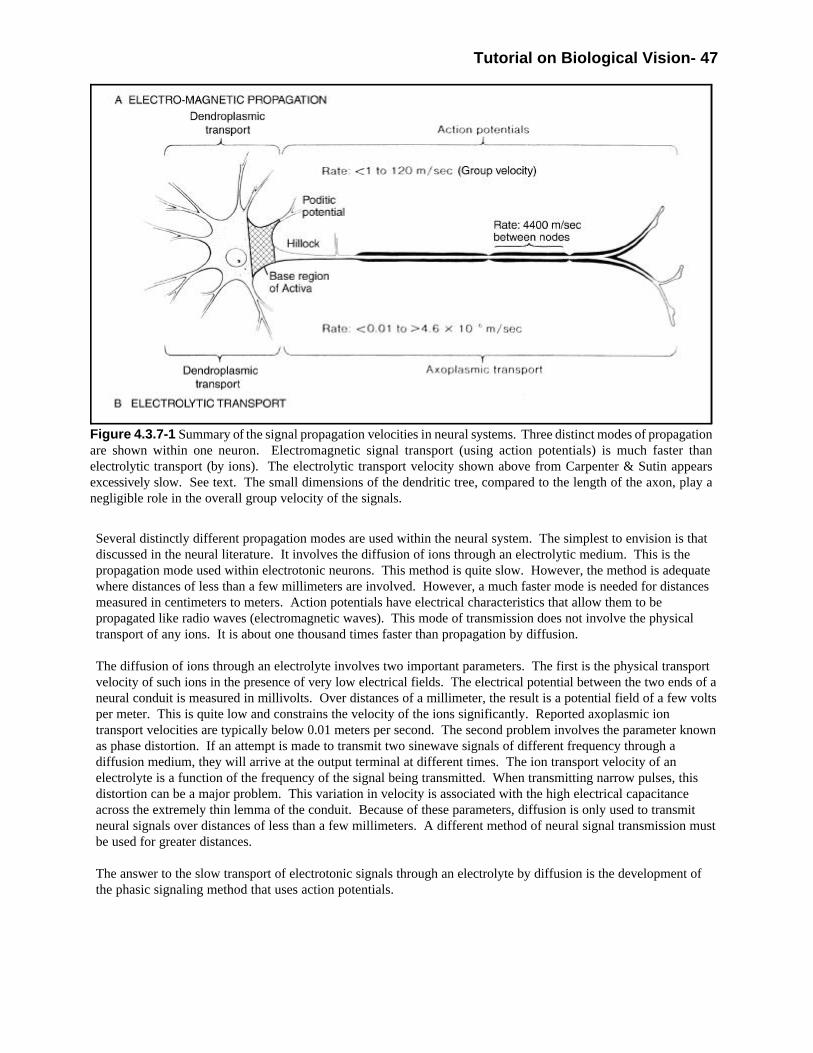
Tutorial on Biological Vision- 47
Figure 4.3.7-1 Summary of the signal propagation velocities in neural systems. Three distinct modes of propagationare shown within one neuron. Electromagnetic signal transport (using action potentials) is much faster thanelectrolytic transport (by ions). The electrolytic transport velocity shown above from Carpenter & Sutin appearsexcessively slow. See text. The small dimensions of the dendritic tree, compared to the length of the axon, play anegligible role in the overall group velocity of the signals.
Several distinctly different propagation modes are used within the neural system. The simplest to envision is thatdiscussed in the neural literature. It involves the diffusion of ions through an electrolytic medium. This is thepropagation mode used within electrotonic neurons. This method is quite slow. However, the method is adequatewhere distances of less than a few millimeters are involved. However, a much faster mode is needed for distancesmeasured in centimeters to meters. Action potentials have electrical characteristics that allow them to bepropagated like radio waves (electromagnetic waves). This mode of transmission does not involve the physicaltransport of any ions. It is about one thousand times faster than propagation by diffusion.
The diffusion of ions through an electrolyte involves two important parameters. The first is the physical transportvelocity of such ions in the presence of very low electrical fields. The electrical potential between the two ends of aneural conduit is measured in millivolts. Over distances of a millimeter, the result is a potential field of a few voltsper meter. This is quite low and constrains the velocity of the ions significantly. Reported axoplasmic iontransport velocities are typically below 0.01 meters per second. The second problem involves the parameter knownas phase distortion. If an attempt is made to transmit two sinewave signals of different frequency through adiffusion medium, they will arrive at the output terminal at different times. The ion transport velocity of anelectrolyte is a function of the frequency of the signal being transmitted. When transmitting narrow pulses, thisdistortion can be a major problem. This variation in velocity is associated with the high electrical capacitanceacross the extremely thin lemma of the conduit. Because of these parameters, diffusion is only used to transmitneural signals over distances of less than a few millimeters. A different method of neural signal transmission mustbe used for greater distances.
The answer to the slow transport of electrotonic signals through an electrolyte by diffusion is the development ofthe phasic signaling method that uses action potentials.

48 Guide to Processes in Biological Vision
4.3.7.1 A coaxial axon is not a Herman Cable
The biological community has long discussed signal transmission within the neural system based on the simpleconcept of a continuous series of resistor-capacitor networks as defined by Herman in the mid 1800's. This was shortly after the invention of the telegraph and before the invention of the telephone. Soon after the invention ofthe telephone, it was discovered that wide bandwidth signals could not be sent any appreciable distance over atelephone line consisting of only resistors and capacitors. The phase distortion was so high, the voice signal couldnot be understood. Furthermore, the attenuation was excessive. Two solutions were devised. The earliest solution was to introduce large inductors periodically along the line to compensate for the effect of capacitance. A moresatisfactory solution came later. It was found that coaxial cables did not suffer from the same phase distortion.
Any coaxial cable exhibits an intrinsic inductance plus an intrinsic capacitance. In fact, the intrinsic capacitanceand inductance of a coaxial cable are far more important than the resistance of the cable. They determine twoproperties of the cable, the input impedance and the propagation velocity of the circuit. A theoretical coaxial cablecontaining no resistance will still exhibit an input impedance that is resistive. It will also exhibit a propagationvelocity given by the square root of the inductance per unit length divided by the capacitance per unit length (andindependent of the resistance per unit length). These are the properties of importance in propagation of actionpotentials within neurons.
To understand the electromagnetic propagation of action potentials, recognizing and understanding the electricalcharacteristics of an axon are important. Electrically, an axon is a coaxial cable. It consists of a conductingmaterial, the plasma surrounded by a cylindrical insulating material, the lemma. The lemma is in turn surroundedby a second conducting material, the interneuron matrix. The fact that the interneuron matrix may be of greatextent outside the axon is largely irrelevant. However, whether the axon is myelinated or not is highly relevant. The myelin exhibits a very low dielectric constant. Its presence greatly reduces the capacitance per unit length ofthe axon. This change increases the propagation velocity of the axon greatly.
The Herman Cable has been an archaic concept since 1890 or earlier. More recent discussions based on theHerman Cable are largely irrelevant to the propagation of action potentials. Their only relevance is to the diffusionof electrotonic signals over distances of less than a few millimeters.
4.3.7.2 Understanding the group velocity, and other signal velocities within a neuron
The literature frequently discusses the velocity of neural signals without clear definition of the velocities involved. The easiest velocity to define is the group velocity of a signal (an action potential) propagating within a stage 3neuron. This is the average velocity of the signal measured by the time for it to travel between two pointsseparated by at least one cm. The longer the separation distance, the more accurate the measurement. Such ameasurement will include multiple axon segments and multiple Nodes of Ranvier. A mixture of ion transport andelectromagnetic propagation modes will also be involved. The resulting group velocity can be dissected into itscomponents. These include the diffusion velocity of the signal during ion transport, the phase velocity of the signalduring electromagnetic propagation and a fixed time delay during the regeneration cycle at each Activa.
The easiest way to calculate the group velocity is to calculate the time delay associated with each segment of thepropagation path. The group velocity is then given by the total distance divided by the total time delay. Thisallows the time delay associated with the regeneration process to fit seamlessly into the calculation.
The phase velocity of a signal within a conduit is a function of the dimensions of the conduit. Because of theircomplex shape, computing the precise phase velocity within a neurite is difficult (even as a function of positionalong the dendritic tree). In addition, the high capacitance per unit length of the neurolemma reduces theachievable velocity. Values of 0.01 meters per second down to 4.6 x 10⁻⁶ meters per second appear in theliterature. A typical diffusion velocity is near 7 x 10⁻³ meters per second based on ERG data [11.1.6 & 17.5.6].
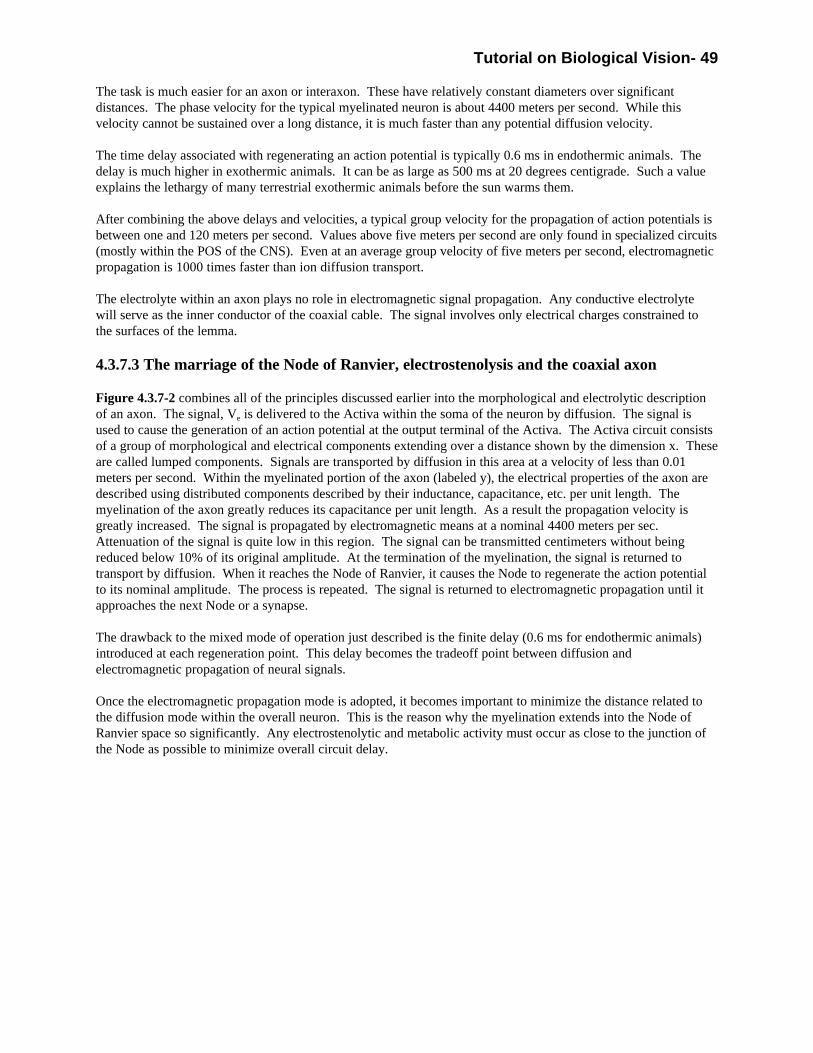
Tutorial on Biological Vision- 49
The task is much easier for an axon or interaxon. These have relatively constant diameters over significantdistances. The phase velocity for the typical myelinated neuron is about 4400 meters per second. While thisvelocity cannot be sustained over a long distance, it is much faster than any potential diffusion velocity.
The time delay associated with regenerating an action potential is typically 0.6 ms in endothermic animals. Thedelay is much higher in exothermic animals. It can be as large as 500 ms at 20 degrees centigrade. Such a valueexplains the lethargy of many terrestrial exothermic animals before the sun warms them.
After combining the above delays and velocities, a typical group velocity for the propagation of action potentials isbetween one and 120 meters per second. Values above five meters per second are only found in specialized circuits(mostly within the POS of the CNS). Even at an average group velocity of five meters per second, electromagneticpropagation is 1000 times faster than ion diffusion transport.
The electrolyte within an axon plays no role in electromagnetic signal propagation. Any conductive electrolytewill serve as the inner conductor of the coaxial cable. The signal involves only electrical charges constrained tothe surfaces of the lemma.
4.3.7.3 The marriage of the Node of Ranvier, electrostenolysis and the coaxial axon
Figure 4.3.7-2 combines all of the principles discussed earlier into the morphological and electrolytic descriptionof an axon. The signal, Ve is delivered to the Activa within the soma of the neuron by diffusion. The signal isused to cause the generation of an action potential at the output terminal of the Activa. The Activa circuit consistsof a group of morphological and electrical components extending over a distance shown by the dimension x. Theseare called lumped components. Signals are transported by diffusion in this area at a velocity of less than 0.01meters per second. Within the myelinated portion of the axon (labeled y), the electrical properties of the axon aredescribed using distributed components described by their inductance, capacitance, etc. per unit length. Themyelination of the axon greatly reduces its capacitance per unit length. As a result the propagation velocity isgreatly increased. The signal is propagated by electromagnetic means at a nominal 4400 meters per sec. Attenuation of the signal is quite low in this region. The signal can be transmitted centimeters without beingreduced below 10% of its original amplitude. At the termination of the myelination, the signal is returned totransport by diffusion. When it reaches the Node of Ranvier, it causes the Node to regenerate the action potentialto its nominal amplitude. The process is repeated. The signal is returned to electromagnetic propagation until itapproaches the next Node or a synapse.
The drawback to the mixed mode of operation just described is the finite delay (0.6 ms for endothermic animals)introduced at each regeneration point. This delay becomes the tradeoff point between diffusion andelectromagnetic propagation of neural signals.
Once the electromagnetic propagation mode is adopted, it becomes important to minimize the distance related tothe diffusion mode within the overall neuron. This is the reason why the myelination extends into the Node ofRanvier space so significantly. Any electrostenolytic and metabolic activity must occur as close to the junction ofthe Node as possible to minimize overall circuit delay.

50 Guide to Processes in Biological Vision
Figure 4.3.7-2 The overall signal transmission environment for thepropagation of action potentials. Top; the morphological situation withelectrolytic symbols as an overlay. Bottom; the electrolytic situation stressingthe relevant lumped components and the distributed nature of the myelinatedportion of the axon. Resistance plays no role in the operation of theinteraxon (over the distance y). The letters in the boxes refer to the compleximpedances of the electrostenolytic supplies. P = podite or base. C =collector. E = emitter.
4.4 Metabolic support to theneuron
The metabolism of the neuron canbe divided into two distinct parts,the metabolism required to maintainthe homoeostasis of the cell and themetabolism required to support thesignaling function of the cell. Maintaining homoeostasis involvesthe movement of many reactantsand waste products through thewalls of the cell. Precisely how thismovement is accomplished formany different materials remainsunclear after many years of study. Clearly, glycogen can move fromthe blood stream, through even theblood-brain-barrier and into any cellof the neural system with ease. Thissection will review the highlights ofthe process required to power thesignaling function within a neuron.
4.4.1 Introductoryelectrostatics
The biology community hasgenerally adopted a narrow philosophy regarding the electrostatics of a cell. They have assumed that it requiresseparating the ions of an ionizable material by a membrane to create an electrical potential across that membrane. Another method exists for achieving the same potential. If the purest of deionized water (pH =7.000) is placed oneach side of a closed insulating membrane and a battery is used to inject free electrons into the interior of themembrane, the same result will be obtained. The interior of the membrane will assume a negative electricalpotential with respect to the outside fluid. The potential will be precisely equal to the charge injected times thecapacitance of the membrane. If the experiment is repeated using a solution of neutral saltwater on each side of themembrane, the same result will be obtained. The fact that all of the salt in the water is fully ionized is immaterial.
The above experiment shows that transferring ions through the membrane of a cell to achieve a negative electricalpotential inside the cell is not necessary. Any mechanism that will transfer electrons to the interior of themembrane will generate such a negative potential. The simplest method of providing this potential has beendescribed in Section 4.2.3. Electrostenolysis of glutamate on the surface of a locally asymmetric plasma membranewill inject electrons into the interior of the membrane and cause a negative potential to be observed. The freecharge will spread out evenly over the interior of the closed membrane (assuming it is spherical) just as it would onthe surface of any capacitor. The charge cannot escape through the membrane because of the insulating propertiesof the membrane with respect to negative charges attempting to move out through it. Chemically, the results of theelectrostenolytic process are the release of a molecule of CO2 and the formation of a molecule of GABA.
4.4.2 Metabolic processes related to the operation of the neuron
Tutorial on Biological Vision- 51
The generation and delivery of glutamate (glutamic acid) to the site of electrostenolysis, and the removal of thewaste products, are key to the polarization of all living cells. Only small quantities of electrons are required perunit time in the typical cell. The transport of unbalanced charges through the membrane by metabolism is unusual. However, electrostenolysis plays a more important role in the dynamics of the neuron because of the use ofelectrons in signaling. Therefore, understanding the source of glutamate is more important in the study of theneuron.
Glycogen is the primary source of energy for the cell. The complete degradation of a single molecule of glucose,the basic unit of the glycogen polymer, to CO2 and H2O releases a great deal of energy (686 kcalories). The energyassociated with glucose and the quantized method of its release are key to the efficient operation of the neuron. The energy is usually released in units of 7.3 kcal through reactions involving ATP and other enzymes. Thereaction of interest here, the electrostenolysis of glutamate to CO2 and GABA involves an energy change of about14.6 kcal. This value generates a maximum negative potential of 154 mV across the lemma of a cell (or aconduit).
To obtain glutamate from glucose involves the glycolysis of glucose to either pyruvate or lactate followed by twoadditional steps. The first involves the tri-carboxylic-acid (Krebs) cycle (abbreviated TCA) and the creation ofalpha-ketoglutarate. This material can be readily converted into glutamate by amination. The process is carriedout in the glutamate shunt to the TCA cycle.
The reason both pyruvate and lactate are mentioned is because of their different properties. While they are easilyinterconverted, lactate moves easily through cell walls whereas pyruvate does not. There are suggestions in theliterature that some neurons have limited capacity to prepare pyruvate and deliver it to the point of use along theaxon. It is suggested that glia may generate excess lactate that can easily be transferred through the necessary cellwalls to support the interaxons found far from the soma of a propagation neuron. In large animals like humans,individual stage 3 neurons may be one to a few meters long. Supplying of lactate by glia cells could substantiallyreduce the axoplasmic transport of pyruvate and other materials from the soma to the remote interaxons of theneuron.
[Figure 4.3.3-1] provided a gross view of the stage 3 signal propagation neuron within the capillary bed andsupported by the vascular system [10.8]. The location of the blood-brain-barrier was also shown symbolically. Figure 4.3.7-3 shows an expanded view of the area including the Activa embedded within the soma (the solidblack box on the left) and the next Node of Ranvier (the solid black box on the right). The metabolic steps ofprimary interest in neuron signaling, discussed above, are illustrated in this figure.
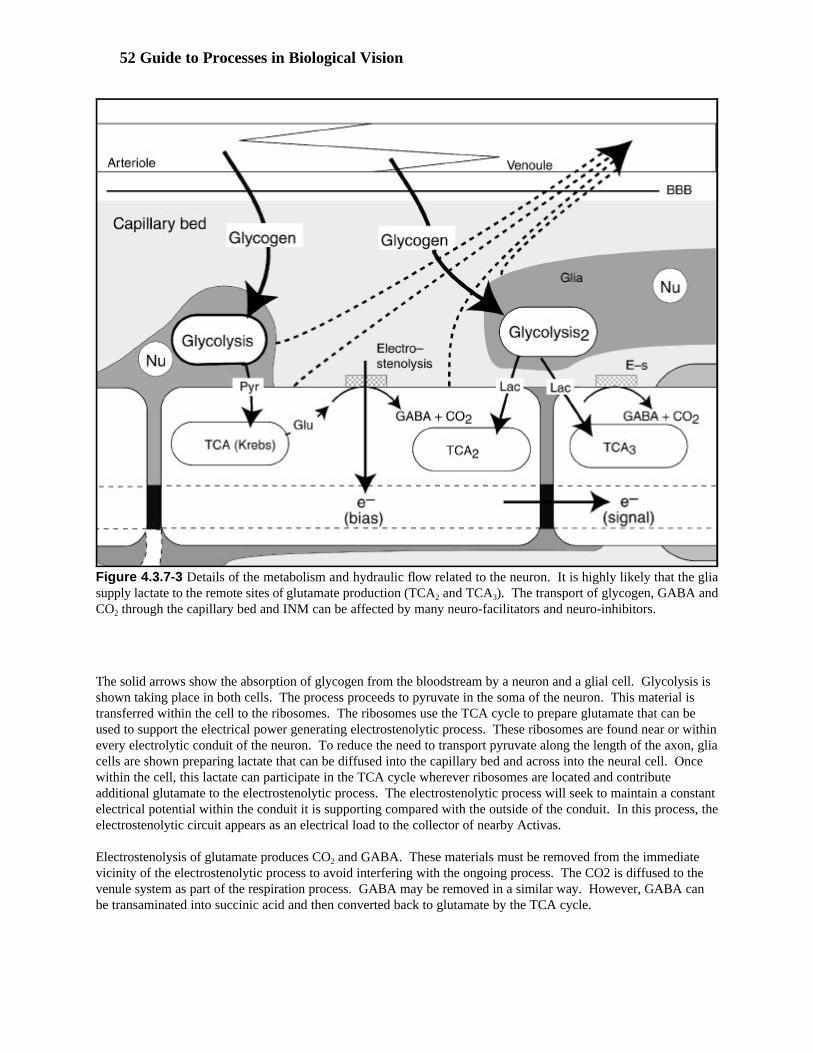
52 Guide to Processes in Biological Vision
Figure 4.3.7-3 Details of the metabolism and hydraulic flow related to the neuron. It is highly likely that the gliasupply lactate to the remote sites of glutamate production (TCA2 and TCA3). The transport of glycogen, GABA andCO2 through the capillary bed and INM can be affected by many neuro-facilitators and neuro-inhibitors.
The solid arrows show the absorption of glycogen from the bloodstream by a neuron and a glial cell. Glycolysis isshown taking place in both cells. The process proceeds to pyruvate in the soma of the neuron. This material istransferred within the cell to the ribosomes. The ribosomes use the TCA cycle to prepare glutamate that can beused to support the electrical power generating electrostenolytic process. These ribosomes are found near or withinevery electrolytic conduit of the neuron. To reduce the need to transport pyruvate along the length of the axon, gliacells are shown preparing lactate that can be diffused into the capillary bed and across into the neural cell. Oncewithin the cell, this lactate can participate in the TCA cycle wherever ribosomes are located and contributeadditional glutamate to the electrostenolytic process. The electrostenolytic process will seek to maintain a constantelectrical potential within the conduit it is supporting compared with the outside of the conduit. In this process, theelectrostenolytic circuit appears as an electrical load to the collector of nearby Activas.
Electrostenolysis of glutamate produces CO2 and GABA. These materials must be removed from the immediatevicinity of the electrostenolytic process to avoid interfering with the ongoing process. The CO2 is diffused to thevenule system as part of the respiration process. GABA may be removed in a similar way. However, GABA canbe transaminated into succinic acid and then converted back to glutamate by the TCA cycle.

Tutorial on Biological Vision- 53
The mechanical, metabolic and chromophoric dynamics associated with the photoreceptor cell makes it verydifficult to discuss the cell in isolation. To understand the operation of the photoreceptor cell in chordates,
appreciating the operation of the PC/IPM/RPE interface without a detailed appreciation of the operation of thephotoreceptor cell is difficult. Once the genesis of the photoreceptor cells (PC’s) is understood, understanding
between the outer limiting membrane (OLM) of the retina and the retinal pigmented epithelium (RPE). Thefollowing material will discuss the photoreceptor cell in detail. will discuss the spectral capability of thechromophores in detail and then will blend these discussions into an overall discussion that will lead toSection 8 9.
attention in recent years. This is particularly true with respect to the outer segment. Clearly, the outer segment istruly outer. It is external to the plasma membrane of the cell and interconnected with it electrolytically by the
detail in Section 7.3
The upper left portion of Figure 5.1.1-1figure bares a family resemblance to several figures appearing in the literature from 1975 through 1985. Anexception is the clear absence of a membrane surrounding the disk stack. The plasma membrane of the inner
intimate relationship with the microtubules in their fissures. The photoreceptor cell is one of the most complexcells within the neural system. Like many other cells associated with the neural system (and particularly the
the same cell will be presented later in this section. This caricature will be further developed into a block diagramand then further into a schematic diagram as the discussion below develops.
aspect ratio, of 25:1. It is long and fragile. Similarly, the distance between the nucleus and the pedicle and thedistance between the nucleus and the inner segment can both be much longer than the entire inner segment.
based on an original caricature that appeared in 1967. The caricature was prepared by a medical illustrator andwas apparently based on only a few images acquired with a light microscope, or limited verbal consultation. This
connecting the inner and outer segments. It also showed a very complex relationship between a putativemembrane surrounding (and interconnecting with) the disks and connecting to the inner segment. The caricature
Unfortunately the putative asymmetrically located neck between the inner and outer segment has produced aninstantly recognizable icon of the photoreceptor cell.
Individual micrographs do not represent the structure of the cell well. Images chosen to show the colax in detailfrequently do not show the circularly symmetrical calyx area equally well. More recent electron micrographs, and
or metabolic functions have been associated with the colax. It is clearly the collar through which neuralcomponents pass from within the inner segment to interface with the disk stack. Similarly, the larger calyx can be
from the protein material secreted by the inner segment.
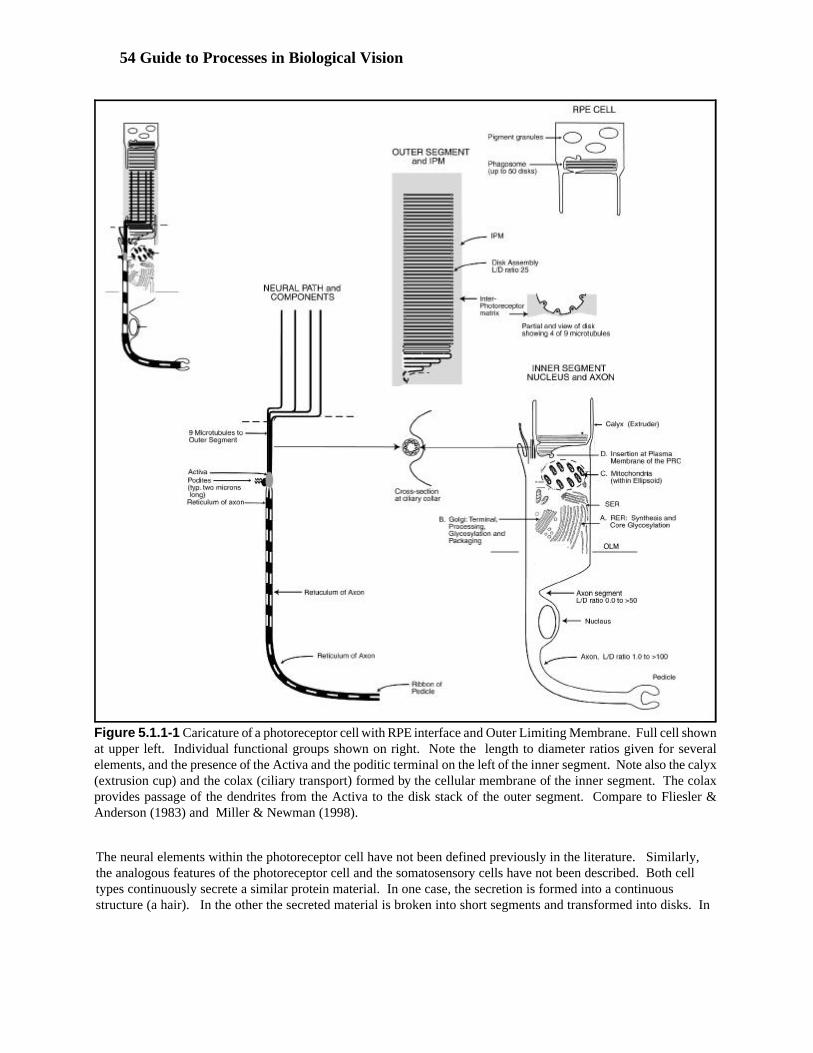
54 Guide to Processes in Biological Vision
Figure 5.1.1-1 Caricature of a photoreceptor cell with RPE interface and Outer Limiting Membrane. Full cell shownat upper left. Individual functional groups shown on right. Note the length to diameter ratios given for severalelements, and the presence of the Activa and the poditic terminal on the left of the inner segment. Note also the calyx(extrusion cup) and the colax (ciliary transport) formed by the cellular membrane of the inner segment. The colaxprovides passage of the dendrites from the Activa to the disk stack of the outer segment. Compare to Fliesler &Anderson (1983) and Miller & Newman (1998).
The neural elements within the photoreceptor cell have not been defined previously in the literature. Similarly,the analogous features of the photoreceptor cell and the somatosensory cells have not been described. Both celltypes continuously secrete a similar protein material. In one case, the secretion is formed into a continuousstructure (a hair). In the other the secreted material is broken into short segments and transformed into disks. In

Tutorial on Biological Vision- 55
both cases, a single dendrite-like element has subdivided into a group of microtubules. These microtubules arearranged to surround the protein material. In both cases, the continuous secretion of protein causes a continuousmovement of the material away from the secretion area.
Since the photoreceptor cell is found in a closed volume of finite size, the extruded protein material musteventually be disposed of. This is achieved by phagocytosis at the RPE interface. Disks are typically engulfed ingroups of 20-50. Their digestion is well documented. It appears the protein material is broken down into aminoacids and returned to the blood stream. The chromophores are isolated and stored in pigment granules beforebeing redeployed to new disks.
5.1 Functional divisions of the photoreceptor cell
The right portion of Figure 5.1.1-1 shows the photoreceptor cell and RPE separated into functional componentsusing an exploded view format. The extracellular Outer Segment (the disk stack) is shown in the center of thefigure. The glandular portion of the cell (part of the inner segment) is shown in the lower right along with thenucleus. A major function of this portion is the production of opsin by the Golgi Apparatus, mitochondria andribosomes. This material is then secreted into the extrusion barrel where it is formed into furrowed disks by thecalyx. The neural portion of the cell is shown in the lower left. The photoreceptor cell is one of the most complexneurons of the nervous system. It contains a host of individual Activa providing both signal processing(adaptation) and signal distribution. The reticulum (the conductor within the morphologically designated axon)connects the distribution amplifier to the pedicle of the cell. In this view, the (typically) nine microtubules of theneuron exit the cell at the colax (the basal body of the cilium) and fan out around the Outer Segment before beingplaced in the furrows of the disk stack. Microtubules are specialized forms of dendrites. Below the cilium, thedendrites merge into a single connection to the distribution amplifier, or Activa, shown. The poditic terminal ofthis Activa is shown explicitly. This terminal has been successfully documented with the electron microscope.[4.3.1] Full details of the elements of the photoreceptor cell are described in Chapter 12 of the supporting work. The individual structures associated with these portions of the cell can only be imaged at 120,000x or higher.
5.2 Electrical configuration of the photoreceptor cell
5.2.1 Unique dendritic structure of the neuron
Like other initial neurons in an afferent neural signal path, the photoreceptor cell is highly specialized. It maycontain the most complex neural circuitry in the organism. To achieve its function, the neuron has significantlymodified the dendritic structure associated with one Activa. The main dendrite has ramified into nine individualdendrites (typical in humans but up to 25 in other species). These have been grouped into a small bundle beforetheir passing out of the soma of the cell through the area morphologically labeled the colax. Beyond the colax, theindividual dendrites change their character. The inner membrane, the reticulum, becomes very close to the outerlemma and becomes a bilayer. Simultaneously, the dendrolemma reverses the asymmetry of its bilayer. As aresult, the dendrite forms what appears to be a continuous Activa along its surface. In actuality, an Activa is onlyformed periodically where the microtubule is in quantum-mechanical contact with a disk. This modified structureis labeled a microtubule in the morphology of the photoreceptor cell.
In modifying the morphology of the dendrites as described, a significant change in performance has been achieved. The outer lemma o f the microtubule has become the collector terminal of an Activa. The reticulum has becomethe emitter terminal and the hydronium liquid crystal formed between the two bilayers forms the base region. Noelectrical connection is provided to the base region. The plasma within the reticulum remains in contact with theinput terminal of the original Activa.
The configuration of the Activas within the microtubules is fundamentally different from most other Activas of theneural system. The Activas of the microtubules are in the common-emitter configuration. The common-emitter
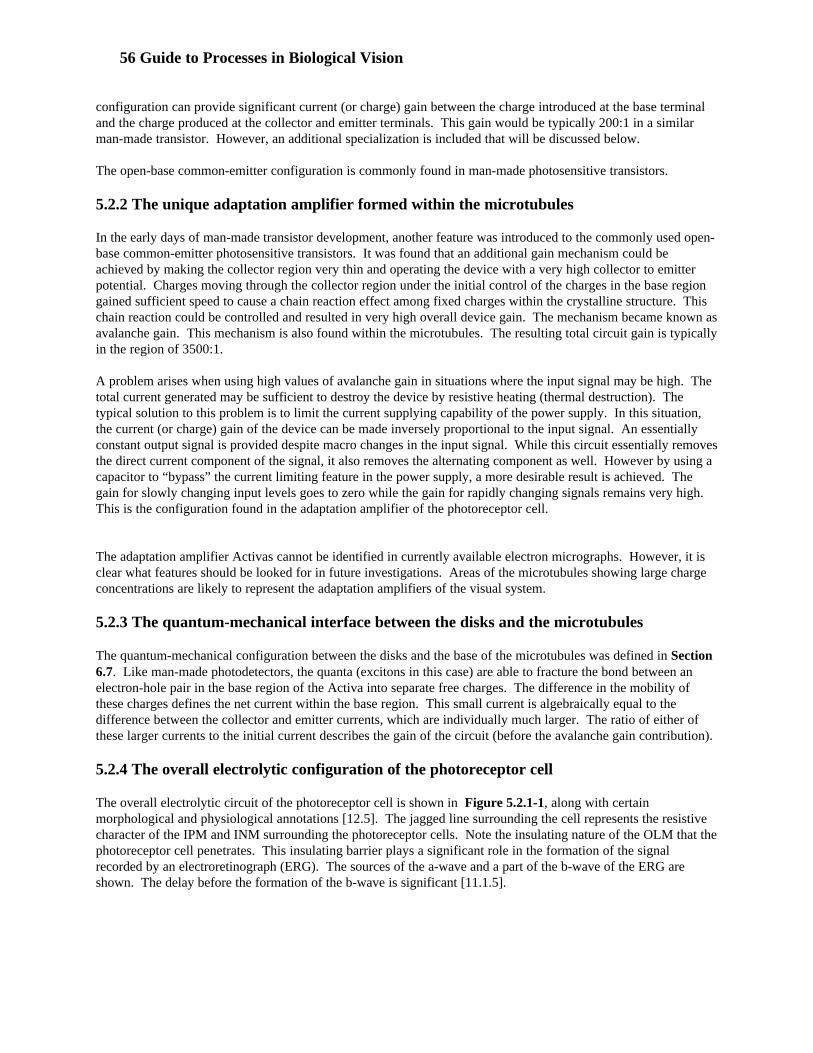
56 Guide to Processes in Biological Vision
configuration can provide significant current (or charge) gain between the charge introduced at the base terminaland the charge produced at the collector and emitter terminals. This gain would be typically 200:1 in a similarman-made transistor. However, an additional specialization is included that will be discussed below.
The open-base common-emitter configuration is commonly found in man-made photosensitive transistors.
5.2.2 The unique adaptation amplifier formed within the microtubules
In the early days of man-made transistor development, another feature was introduced to the commonly used open-base common-emitter photosensitive transistors. It was found that an additional gain mechanism could beachieved by making the collector region very thin and operating the device with a very high collector to emitterpotential. Charges moving through the collector region under the initial control of the charges in the base regiongained sufficient speed to cause a chain reaction effect among fixed charges within the crystalline structure. Thischain reaction could be controlled and resulted in very high overall device gain. The mechanism became known asavalanche gain. This mechanism is also found within the microtubules. The resulting total circuit gain is typicallyin the region of 3500:1.
A problem arises when using high values of avalanche gain in situations where the input signal may be high. Thetotal current generated may be sufficient to destroy the device by resistive heating (thermal destruction). Thetypical solution to this problem is to limit the current supplying capability of the power supply. In this situation,the current (or charge) gain of the device can be made inversely proportional to the input signal. An essentiallyconstant output signal is provided despite macro changes in the input signal. While this circuit essentially removesthe direct current component of the signal, it also removes the alternating component as well. However by using acapacitor to “bypass” the current limiting feature in the power supply, a more desirable result is achieved. Thegain for slowly changing input levels goes to zero while the gain for rapidly changing signals remains very high. This is the configuration found in the adaptation amplifier of the photoreceptor cell.
The adaptation amplifier Activas cannot be identified in currently available electron micrographs. However, it isclear what features should be looked for in future investigations. Areas of the microtubules showing large chargeconcentrations are likely to represent the adaptation amplifiers of the visual system.
5.2.3 The quantum-mechanical interface between the disks and the microtubules
The quantum-mechanical configuration between the disks and the base of the microtubules was defined in Section6.7. Like man-made photodetectors, the quanta (excitons in this case) are able to fracture the bond between anelectron-hole pair in the base region of the Activa into separate free charges. The difference in the mobility ofthese charges defines the net current within the base region. This small current is algebraically equal to thedifference between the collector and emitter currents, which are individually much larger. The ratio of either ofthese larger currents to the initial current describes the gain of the circuit (before the avalanche gain contribution).
5.2.4 The overall electrolytic configuration of the photoreceptor cell
The overall electrolytic circuit of the photoreceptor cell is shown in Figure 5.2.1-1, along with certainmorphological and physiological annotations [12.5]. The jagged line surrounding the cell represents the resistivecharacter of the IPM and INM surrounding the photoreceptor cells. Note the insulating nature of the OLM that thephotoreceptor cell penetrates. This insulating barrier plays a significant role in the formation of the signalrecorded by an electroretinograph (ERG). The sources of the a-wave and a part of the b-wave of the ERG areshown. The delay before the formation of the b-wave is significant [11.1.5].
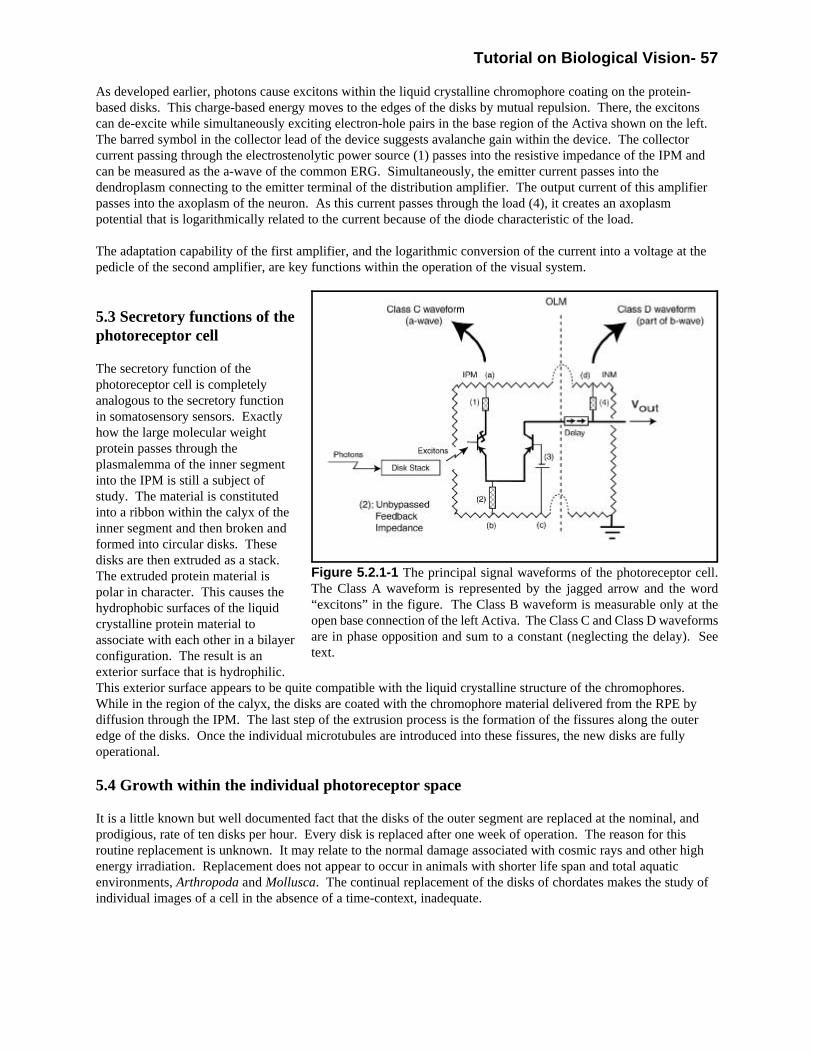
Tutorial on Biological Vision- 57
Figure 5.2.1-1 The principal signal waveforms of the photoreceptor cell.The Class A waveform is represented by the jagged arrow and the word“excitons” in the figure. The Class B waveform is measurable only at theopen base connection of the left Activa. The Class C and Class D waveformsare in phase opposition and sum to a constant (neglecting the delay). Seetext.
As developed earlier, photons cause excitons within the liquid crystalline chromophore coating on the protein-based disks. This charge-based energy moves to the edges of the disks by mutual repulsion. There, the excitonscan de-excite while simultaneously exciting electron-hole pairs in the base region of the Activa shown on the left. The barred symbol in the collector lead of the device suggests avalanche gain within the device. The collectorcurrent passing through the electrostenolytic power source (1) passes into the resistive impedance of the IPM andcan be measured as the a-wave of the common ERG. Simultaneously, the emitter current passes into thedendroplasm connecting to the emitter terminal of the distribution amplifier. The output current of this amplifierpasses into the axoplasm of the neuron. As this current passes through the load (4), it creates an axoplasmpotential that is logarithmically related to the current because of the diode characteristic of the load.
The adaptation capability of the first amplifier, and the logarithmic conversion of the current into a voltage at thepedicle of the second amplifier, are key functions within the operation of the visual system.
5.3 Secretory functions of thephotoreceptor cell
The secretory function of thephotoreceptor cell is completelyanalogous to the secretory functionin somatosensory sensors. Exactlyhow the large molecular weightprotein passes through theplasmalemma of the inner segmentinto the IPM is still a subject ofstudy. The material is constitutedinto a ribbon within the calyx of theinner segment and then broken andformed into circular disks. Thesedisks are then extruded as a stack. The extruded protein material ispolar in character. This causes thehydrophobic surfaces of the liquidcrystalline protein material toassociate with each other in a bilayerconfiguration. The result is anexterior surface that is hydrophilic. This exterior surface appears to be quite compatible with the liquid crystalline structure of the chromophores. While in the region of the calyx, the disks are coated with the chromophore material delivered from the RPE bydiffusion through the IPM. The last step of the extrusion process is the formation of the fissures along the outeredge of the disks. Once the individual microtubules are introduced into these fissures, the new disks are fullyoperational.
5.4 Growth within the individual photoreceptor space
It is a little known but well documented fact that the disks of the outer segment are replaced at the nominal, andprodigious, rate of ten disks per hour. Every disk is replaced after one week of operation. The reason for thisroutine replacement is unknown. It may relate to the normal damage associated with cosmic rays and other highenergy irradiation. Replacement does not appear to occur in animals with shorter life span and total aquaticenvironments, Arthropoda and Mollusca. The continual replacement of the disks of chordates makes the study ofindividual images of a cell in the absence of a time-context, inadequate.
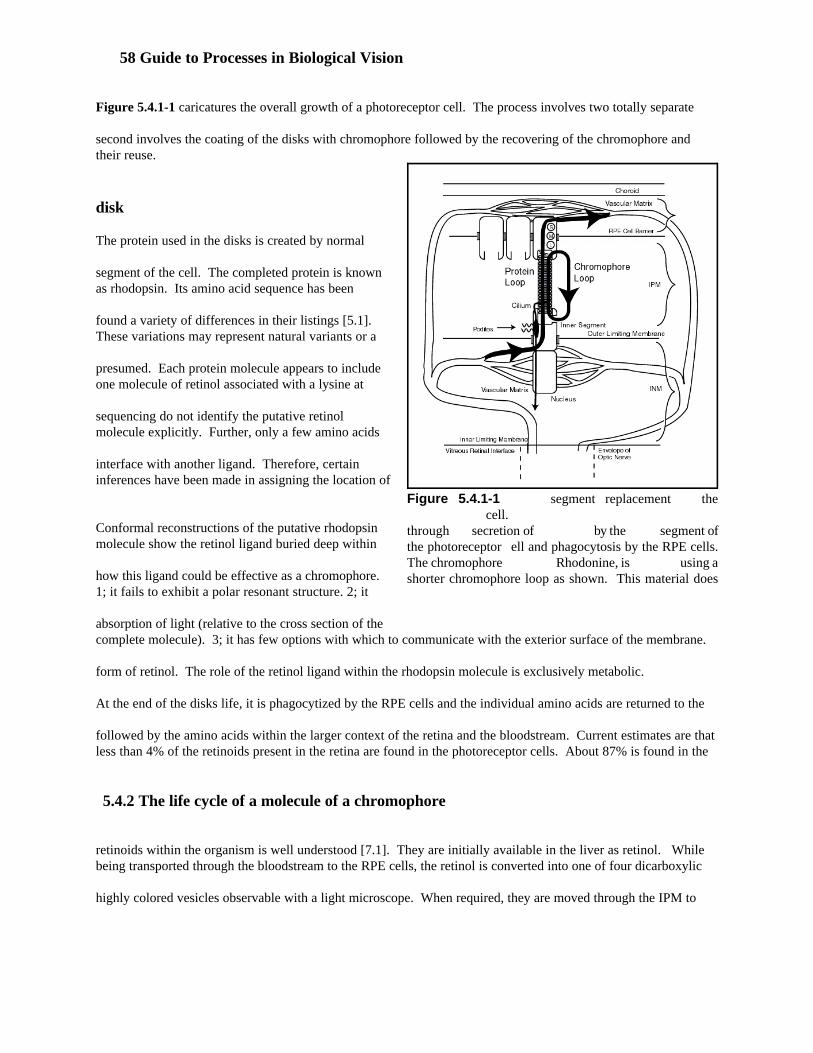
58 Guide to Processes in Biological Vision
Figure 5.4.1-1 segment replacement the cell.
through secretion of by the segment ofthe photoreceptor ell and phagocytosis by the RPE cells.The chromophore Rhodonine, is using ashorter chromophore loop as shown. This material does
Figure 5.4.1-1 caricatures the overall growth of a photoreceptor cell. The process involves two totally separate
second involves the coating of the disks with chromophore followed by the recovering of the chromophore andtheir reuse.
disk
The protein used in the disks is created by normal
segment of the cell. The completed protein is knownas rhodopsin. Its amino acid sequence has been
found a variety of differences in their listings [5.1]. These variations may represent natural variants or a
presumed. Each protein molecule appears to includeone molecule of retinol associated with a lysine at
sequencing do not identify the putative retinolmolecule explicitly. Further, only a few amino acids
interface with another ligand. Therefore, certaininferences have been made in assigning the location of
Conformal reconstructions of the putative rhodopsinmolecule show the retinol ligand buried deep within
how this ligand could be effective as a chromophore. 1; it fails to exhibit a polar resonant structure. 2; it
absorption of light (relative to the cross section of thecomplete molecule). 3; it has few options with which to communicate with the exterior surface of the membrane.
form of retinol. The role of the retinol ligand within the rhodopsin molecule is exclusively metabolic.
At the end of the disks life, it is phagocytized by the RPE cells and the individual amino acids are returned to the
followed by the amino acids within the larger context of the retina and the bloodstream. Current estimates are thatless than 4% of the retinoids present in the retina are found in the photoreceptor cells. About 87% is found in the
5.4.2 The life cycle of a molecule of a chromophore
retinoids within the organism is well understood [7.1]. They are initially available in the liver as retinol. Whilebeing transported through the bloodstream to the RPE cells, the retinol is converted into one of four dicarboxylic
highly colored vesicles observable with a light microscope. When required, they are moved through the IPM to

Tutorial on Biological Vision- 59
their point of deposition as a liquid crystalline film covering the hydrophilic surface of the individual disks. Themovement is aided by a special retinal binding protein (IRBP) found only within the IPM.
While only one molecular layer thick, this material covers the disk with a very dense layer of chromophore [4.3.5]. In the absence of any liquid crystalline properties, each molecule of the layer would exhibit an absorption crosssection equal to its own diameter (about 5 Angstrom or 0.5 nm). However, due to the liquid crystalline propertiesof the layer, the absorption is described by the same laws as for other electromagnetic absorbers (antennas). Theabsorption cross section of each molecule is equal to the area represented by the diameter of the full disk (about 2microns). This extremely large effective absorption cross section is achieved at the expense of isotropic absorption. Only light traveling along the axis of the disk stack is absorbed with this efficiency.
Since the chromophores of Rhodonine are excited by light but not stereochemically altered, each molecule canabsorb light whenever it is unexcited. Once excited, it cannot absorb another photon until it has been de-excited aspart of the photoexcitation/de-excitation process. This process is addressed in Section 9.1.1. At typical lightlevels, an individual molecule is de-excited within 10-20 ms of excitation. Under this operating scenario, anindividual molecule can be excited and de-excited millions of times during the life of its associated disk. Replacing a stereochemically altered retinoid every time it is excited by light is not necessary.
The recovery of the retinoids during disk phagocytosis is less well understood. However, it is a simple matter forthe various RBP’s found within the RPE cells to bind to the chromophores freed during digestion. Once bound, thechromophores can be moved to the chromophore storage vesicles (pigment granules) or provided to the IRBP’s forredeployment to new disks.

60 Guide to Processes in Biological Vision
Tutorial on Biological Vision- 61
6. The Tetrachromatic Capability of the Typical Photoreceptor Group
The material in this section is excerpted from several locations in the underlying work. Chapter5 provides the bulk of the background. Other locations will be annotated with brackets as usual.
The effect of absorption by oil droplets, found in the inner segments of many species (particularlybirds) can affect the overall absorption of the eye. This absorption is not considered here.
The typical biological photoreceptor group (retina in Mollusca and Chordata) exhibits significant spectralabsorption over the range from 300 nm to 675 nm. This absorption is achieved by using four distinct spectralchannels supported by four distinct chromophores.
As noted in Section 1 and demonstrated in Section 9, the overall performance of the human eye, along with that ofother large Chordates, is restricted by the spectral absorption of the lens. The lens absorbs maximally in the300–400 nm region of the spectrum. However, its absorption is related exponentially to its thickness. Smallermembers of Chordata exhibit excellent vision in the 300-400 nm region [1.7.2]. Performance in this region fallsexponentially with the thickness of the lens. Because of this effect, the human eye can be characterizedscientifically as that of a blocked tetrachromat. In the vernacular, the human is a trichromat. However, thisdesignation obscures the fact that the ultraviolet spectral channel of the human eye plays a significant role whenviewing colors with a peak intensity in the 400-437 nm region.
A variety of technical barriers have restricted research into the nature of the chromophores of biological vision. The most limiting physical constraint has been the failure of the community to recognize that the photoreceptors ofbiological vision are quantum-mechanical detectors, rather than thermal detectors. Researchers have continued toinvestigate spectral absorption since the 1910's using light sources that were grossly deficient in the blue andpurple region of the spectrum. From these measurements, they concluded the performance of the human eye waspoor in these same regions. Another has been due to the claimed relationship between the chromophores of visionand the protein substrate, opsin, found in the disks of the outer segment of the chordate eye. In the 1930's, it wasclaimed that the putative marriage of the chromophore and the protein substrate deserved to claim the earlierconceptual name for the chromophore(s) of vision, rhodopsin. After many decades, the community has not shownhow the putative rhodopsin achieved the required spectral absorption of the chordate retina.
To understand the true nature and operation of the choromophores of vision requires a knowledge of liquid crystalsemiconductor physics not available before the 1960's (although similar materials had been used in commercialcolor photography since the late 1930's). The actual characteristics of the chromophores can be defined in detailbased on conventional chemistry combined with knowledge of liquid crystal chemistry obtained from thephotographic film industry. The four chromophores of biological vision are called Rhodonine™ based on theirchemical composition.
The liquid crystalline state of matter required to observe the spectral absorption of the chromophores (theRhodonines) is routinely destroyed using the laboratory protocols designed to isolate rhodopsin. When the liquidcrystalline material is separated from its de-excitation mechanism, it remains highly absorptive until it is excitedby light. It then becomes transparent. When in solution, the low molecular weight chromophores are alsotransparent. The chromophores are generally discarded with the supernatant liquid following centrifugation.
During the 1970's, excellent data was obtained showing that the source of the chromophores used in vision was notthe photoreceptor cells themselves but the retinal pigment epithelial (RPE) cells. The photoreceptor cells onlyprovided the protein substrate used to manufacture the disks. This knowledge, combined with the new data onquantum chemistry of the liquid crystal has provided a new understanding of the chromophores of vision. The new understanding described above has provided a new level of precision. The spectral performance of thevisual system of any organism can now be calculated with an accuracy of better than 10%. With respect to the

62 Guide to Processes in Biological Vision
spectral bandwidth of each spectral absorber, it can be calculated to within 2 nm in 500 nm or 0.4 %. Thiscapability will be proved in Section 9. These levels far exceed the accuracy of present day empirical laboratorytechniques (usually about +/– 50%).
Quantum physics explains the unique character of the long wavelength spectral absorber. It is this characteristicthat explains why the biological eye loses sensitivity in the red portion of the spectrum as the illumination level isdecreased.
6.1 The eyes are quantum detectors, not energy detectors
Two great classes of photodetectors exist in science, the thermal absorbers and the quantum absorbers. Einsteindefined the characteristics of the quantum absorbers in his famous paper of 1904 defining the photoelectric effect. The photochemistry of biological vision employs quantum-mechanical absorption. This has been amply shown bymany analyses of the signal-to-noise performance of human vision. This parameter follows follows Poissonstatistics as a function of illumination intensity.
To properly evaluate the spectral performance of a quantum-mechanical sensor system, it is critically importantthat an adequate test source be used. The test source should deliver the same number of quanta per unitwavelength to the specimen under test at any wavelength. To achieve a uniform photon flux over the spectrum ofinterest in vision, a source with a color temperature of 7053 degrees Kelvin is optimum [2.1.1]. This spectrumappears to provide an excess of energy, in watts, in the short wavelength region. Note however, energy in watts isapplicable to thermal detectors, not the detectors of vision.
A brief look at the spectral content of a blackbody (based on quantum flux) will show that “North Sky” daylight isan excellent source of broadband radiation for vision testing. However, the radiant intensity of daylight variesdepending on local atmospheric conditions between a low of about 5000 and a high of about 20,000 Kelvin. Spectrally, daylight is not as uniform as a simple blackbody at 7053 Kelvin, D70. Unfortunately, the illuminationcommunity has chosen to define such radiation in terms of a “coordinated color temperature,” D65, of 6500 Kelvin. They have done this using a convoluted procedure that is difficult to use. To escape from this dilemma, theInternational Standards Organization and the CIE do not offer a standard source at their recommended colortemperature.
Traditionally, laboratory investigators have used a light source as low as 2000 Kelvin (in the early part of the lastcentury) to 3600 Kelvin. Only a rare investigator has used a 6500 Kelvin source. At source temperatures below3600 Kelvin, the radiant flux at 400 nm is typically an order of magnitude less than at the peak wavelength. Usinga low source temperature introduces needless requirements to perform correction calculations. It also introduceserrors due to differences in signal-to-noise ratio within the measurements on a spectrally selective basis.
Most of the psychophysical experiments of the last half century have suggested the “blue” spectral channel plays alesser role in color vision than the “green” or “red” channels. This finding has been due largely to the colortemperature of their sources.
6.2 Liquid crystal quantum physics is key to understanding spectral absorption
The quantum physics of the chromophores of vision follows the same rules as that of the chromophores ofphotographic color chemistry [5]. All good absorbers of visible light share several characteristics. Each moleculecontains two polar atoms of either oxygen or nitrogen. These atoms exhibit unpaired electrons even when part of alarger molecule. These polar atoms are connected by a conjugated carbon backbone. The straighter this backbone,the higher the peak spectral absorption. The unpaired electrons and the conjugated backbone result in a resonancecondition at the molecular level. This resonance condition exhibits a spectral absorption band separate from thenormal absorption spectrum of the material in the absence of either of these conditions. This separate spectral
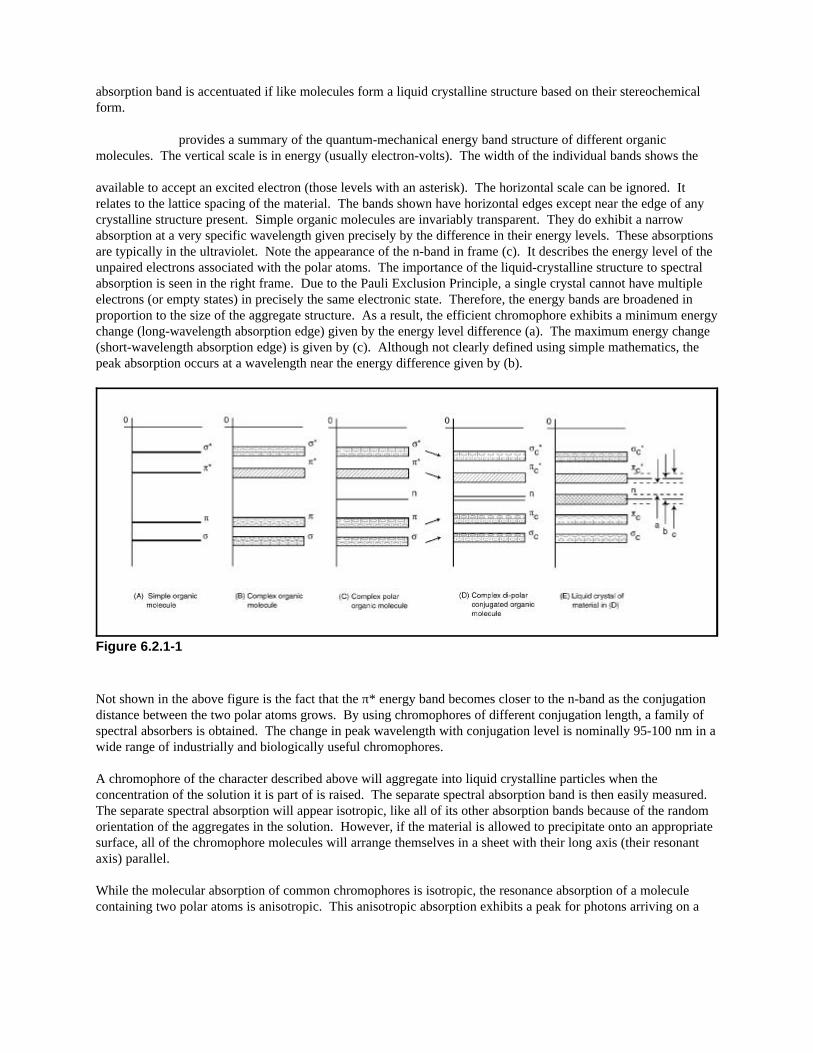
Figure 6.2.1-1
absorption band is accentuated if like molecules form a liquid crystalline structure based on their stereochemicalform.
provides a summary of the quantum-mechanical energy band structure of different organicmolecules. The vertical scale is in energy (usually electron-volts). The width of the individual bands shows the
available to accept an excited electron (those levels with an asterisk). The horizontal scale can be ignored. Itrelates to the lattice spacing of the material. The bands shown have horizontal edges except near the edge of anycrystalline structure present. Simple organic molecules are invariably transparent. They do exhibit a narrowabsorption at a very specific wavelength given precisely by the difference in their energy levels. These absorptionsare typically in the ultraviolet. Note the appearance of the n-band in frame (c). It describes the energy level of theunpaired electrons associated with the polar atoms. The importance of the liquid-crystalline structure to spectralabsorption is seen in the right frame. Due to the Pauli Exclusion Principle, a single crystal cannot have multipleelectrons (or empty states) in precisely the same electronic state. Therefore, the energy bands are broadened inproportion to the size of the aggregate structure. As a result, the efficient chromophore exhibits a minimum energychange (long-wavelength absorption edge) given by the energy level difference (a). The maximum energy change(short-wavelength absorption edge) is given by (c). Although not clearly defined using simple mathematics, thepeak absorption occurs at a wavelength near the energy difference given by (b).
Not shown in the above figure is the fact that the π* energy band becomes closer to the n-band as the conjugationdistance between the two polar atoms grows. By using chromophores of different conjugation length, a family ofspectral absorbers is obtained. The change in peak wavelength with conjugation level is nominally 95-100 nm in awide range of industrially and biologically useful chromophores.
A chromophore of the character described above will aggregate into liquid crystalline particles when theconcentration of the solution it is part of is raised. The separate spectral absorption band is then easily measured. The separate spectral absorption will appear isotropic, like all of its other absorption bands because of the randomorientation of the aggregates in the solution. However, if the material is allowed to precipitate onto an appropriatesurface, all of the chromophore molecules will arrange themselves in a sheet with their long axis (their resonantaxis) parallel.
While the molecular absorption of common chromophores is isotropic, the resonance absorption of a moleculecontaining two polar atoms is anisotropic. This anisotropic absorption exhibits a peak for photons arriving on a
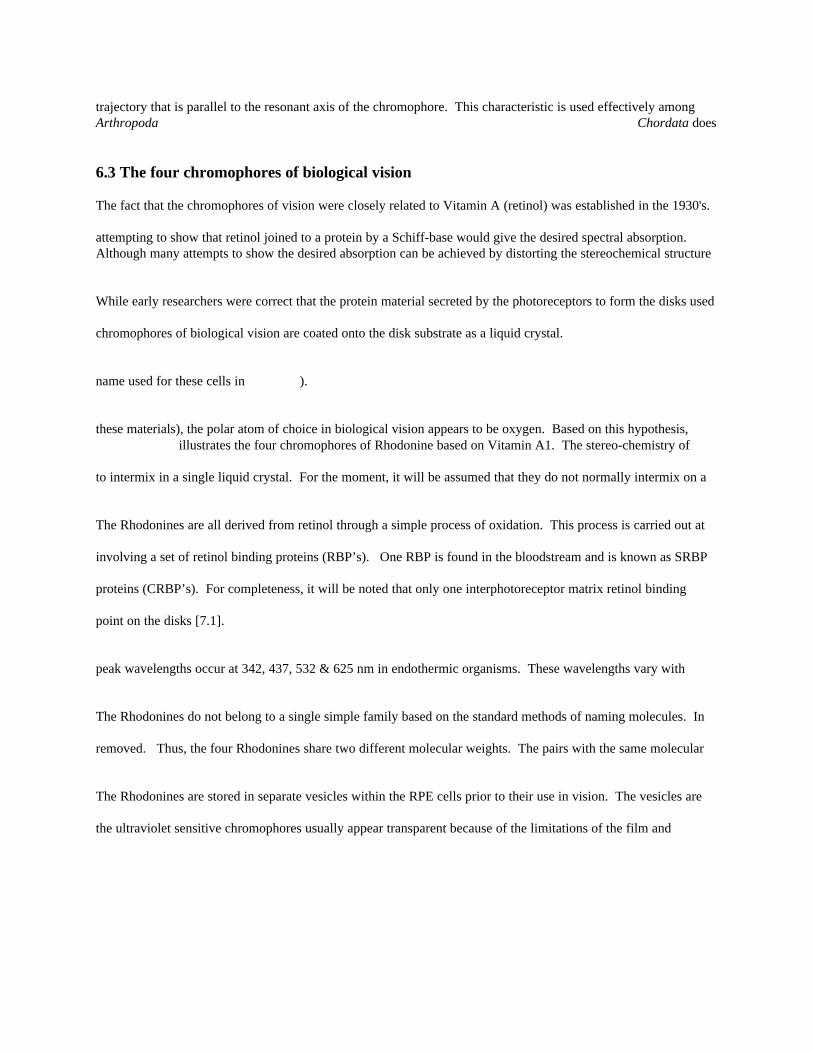
trajectory that is parallel to the resonant axis of the chromophore. This characteristic is used effectively amongArthropoda Chordata does
6.3 The four chromophores of biological vision
The fact that the chromophores of vision were closely related to Vitamin A (retinol) was established in the 1930's.
attempting to show that retinol joined to a protein by a Schiff-base would give the desired spectral absorption. Although many attempts to show the desired absorption can be achieved by distorting the stereochemical structure
While early researchers were correct that the protein material secreted by the photoreceptors to form the disks used
chromophores of biological vision are coated onto the disk substrate as a liquid crystal.
name used for these cells in ).
these materials), the polar atom of choice in biological vision appears to be oxygen. Based on this hypothesis, illustrates the four chromophores of Rhodonine based on Vitamin A1. The stereo-chemistry of
to intermix in a single liquid crystal. For the moment, it will be assumed that they do not normally intermix on a
The Rhodonines are all derived from retinol through a simple process of oxidation. This process is carried out at
involving a set of retinol binding proteins (RBP’s). One RBP is found in the bloodstream and is known as SRBP
proteins (CRBP’s). For completeness, it will be noted that only one interphotoreceptor matrix retinol binding
point on the disks [7.1].
peak wavelengths occur at 342, 437, 532 & 625 nm in endothermic organisms. These wavelengths vary with
The Rhodonines do not belong to a single simple family based on the standard methods of naming molecules. In
removed. Thus, the four Rhodonines share two different molecular weights. The pairs with the same molecular
The Rhodonines are stored in separate vesicles within the RPE cells prior to their use in vision. The vesicles are
the ultraviolet sensitive chromophores usually appear transparent because of the limitations of the film and
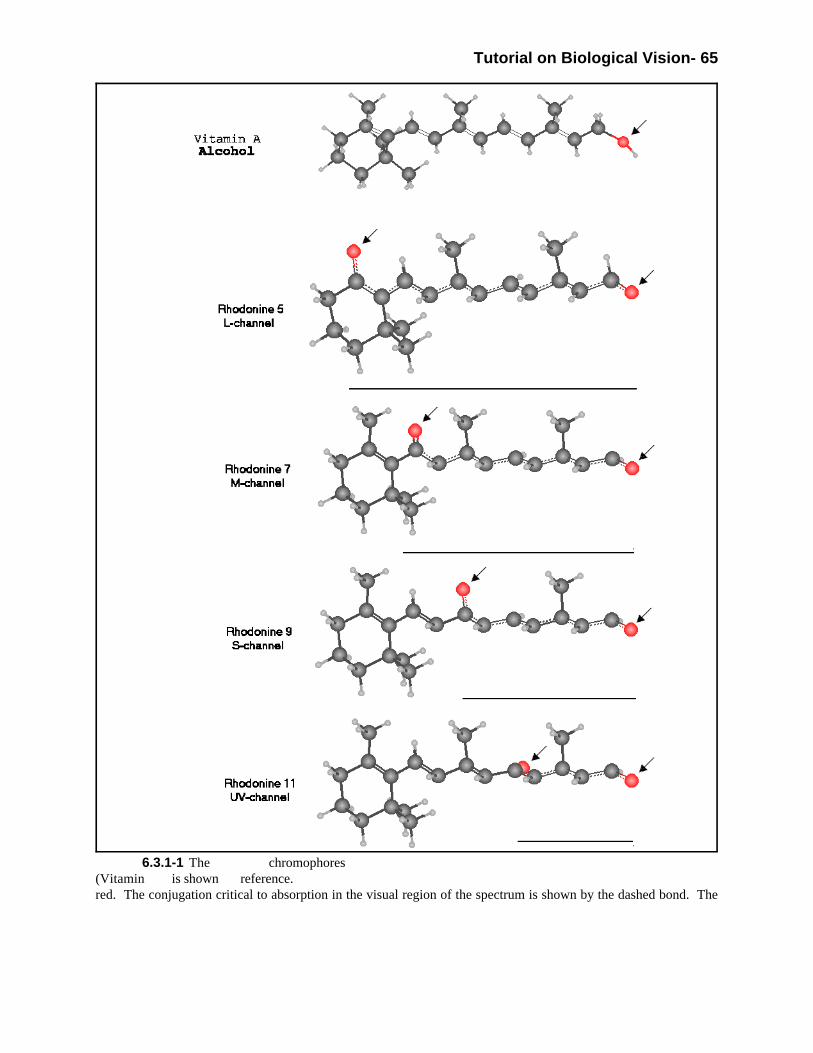
Tutorial on Biological Vision- 65
6.3.1-1 The chromophores(Vitamin is shown reference.red. The conjugation critical to absorption in the visual region of the spectrum is shown by the dashed bond. The
66 Guide to Processes in Biological Vision
The spectral characteristics of the above chromophores, when present in nominal human eyes can be defined using
with the length of the outer segments and the area of the retina stimulated. The lengths vary with position within aretina. The half amplitude values vary within a few nanometers among individuals. These variations are
Transducer Resonant 8l m h
chain length :
Rhodonine (5) 0.595 0.655Rhodonine(7) 0.500 0.565Rhodonine(9) 0.400 0.475Rhodonine(11) [UV] 0.300 0.385
where l, m and h indicate the low half amplitude point, the mid wavelength point and the high half amplitude
high values because the function is so broad that the center point is ill defined. The value of Q given in the last
separated by 0.095 +/-0.005 microns which is a typical spacing for these homologs.
system. They do influence the spectral discrimination capability of the eye in the region between 400 nm. and 437
6.4 Non-spectral variants between chromophores due to their Vitamin A base
forms differ in the hydroxylation state of the -ionone ring shown on the left of each Rhodonine. The differences
the order of 1-2 nm is possible at a given temperature, such differences have only occasionally been reported in the
The isotropic absorption spectra of the Vitamin A’s, which are not involved in the visual response, show greater
absorption was ten nm between Vitamin A1 and Vitamin A2. The data was based on a less than ideal protocol.
6.5 Isotropic and anisotropic absorption of the liquid crystalline chromophores
During the 1980's, a micropipette technique was used to measure the absorption spectrum of selected
drawing of the outer segment (and frequently part of the inner segment) of the cell into a pipette without damage.
were believed to be either “red cones” or “green cones.” However, the recorded spectra invariably showed the of the cell and chromophore. This spectrum peaked near 500 nm.

Tutorial on Biological Vision- 67
Investigators using an equal energy source usually report the value as higher, in the 500-505 nm range. Investigators using an equal photon flux source usually report the value as 495-500 nm.
6.6 The spectral characteristics of the in-vivo chromophores of biological vision
The spectral absorption of a single photoreceptor cell exhibits a spectrally specific anisotropic absorption optimizedto be maximum for light impinging parallel to its long axis. It also exhibits an isotropic absorption spectrum witha much lower peak absorption per unit angle.
The width of the spectral peak of the anisotropic absorption of an individual photoreceptor depends on two physicalquantities [. First, it depends on the diameter of the disk stack. This diameter determines the spectral bandwidthof the liquid crystalline chromophore associated with each individual disk. This spectral broadening is based onthe Pauli Exclusion Principle discussed above.
Second, it depends on the number of chromophore-coated disks through which the photon flux passes. Each diskis optically and quantum-mechanically isolated from each other. Under this condition, each incident photon has afinite chance of being absorbed by each disk (until it is absorbed). With a nominal disk stack of 2000 disks, and avery efficient chromophore, the photons at the wavelength of peak absorption have a 100% chance of absorption. The photons at nearby wavelengths also have a very high chance of absorption. Even photons at a wavelengthequal the half amplitude point for the spectrum of a single disk have a very high chance of absorption beforereaching the last disk in the stack.
The absorption spectrum of the photoreceptor, due to its isotropic absorption, is also multiplied by the number ofdisks in the disk stack. However, the cumulative absorption is always less than that of the anisotropic absorption. This is due to the higher peak absorption per disk of the latter. Thus, the molecular absorption spectrum is notsignificant in normal human vision.
Note that efforts to assess the spectral absorption spectrum of a photoreceptor using the suction pipette techniqueand transverse illumination are limited. The technique does not take advantage of the cumulative absorptionprovided by the multi-disk stack. This technique will routinely measure the isotropic spectrum of the chromophoreof interest. Only an artifact of the anisotropic spectrum can be expected in the measured data.
Because of the above two-step broadening of the absorption spectrum of each chromophore, the effective spectrumof each chromophore can only be described based on empirical evidence. Figure 9.1.2-1 [17.2] below presents thebest available data based on both the theory and the empirical measurements.
6.6.1 The unique character of the long wavelength spectral channel
While the above spectra are those frequently obtained by micro-spectrometry in a variety of species, they are notthe spectra that are always obtained using psychophysical methods. This is true for two reasons. First, thelogarithmic signal processing of stage 2 introduces the previously described artifacts near 490 nm and 575 nm. Second, the long wavelength absorption spectrum exhibits a large variation in absorptance as a function of lightintensity. This variation is due to a critical design feature of the interface between the chromophores and theneural system.
Figure 6.7.1-1 illustrates the quantum mechanical model of the transduction process for a specific chromophore totransfer the energy of an incident photon to the dendrites of the inner segment for further manipulation. Theenergy bands on the left were discussed above. It was noted that the energy difference between the n-band and theπ*-band varied among the chromophores. It varies in proportion to their level of conjugation between the polaratoms. The right side of this figure represents the energy band structure for the microtubules (dendrites) of thephotoreceptor cell in contact with each disk. Note the change in horizontal scale between the left and right halves
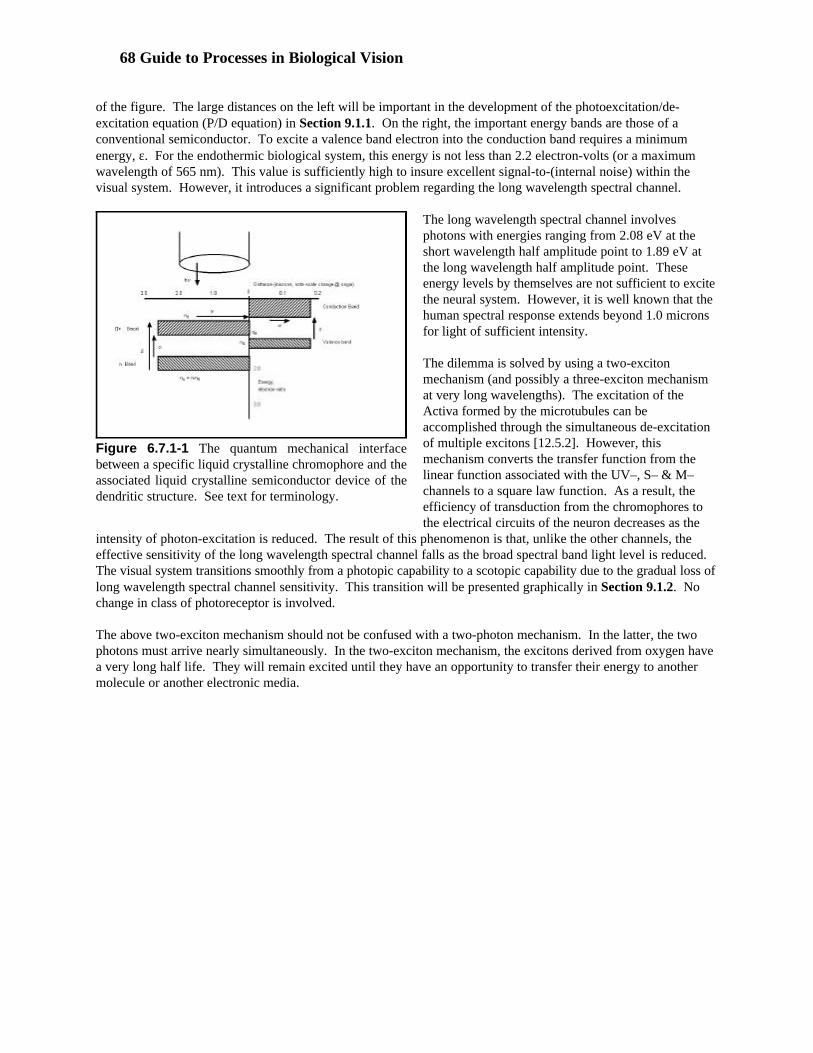
68 Guide to Processes in Biological Vision
Figure 6.7.1-1 The quantum mechanical interfacebetween a specific liquid crystalline chromophore and theassociated liquid crystalline semiconductor device of thedendritic structure. See text for terminology.
of the figure. The large distances on the left will be important in the development of the photoexcitation/de-excitation equation (P/D equation) in Section 9.1.1. On the right, the important energy bands are those of aconventional semiconductor. To excite a valence band electron into the conduction band requires a minimumenergy, ε. For the endothermic biological system, this energy is not less than 2.2 electron-volts (or a maximumwavelength of 565 nm). This value is sufficiently high to insure excellent signal-to-(internal noise) within thevisual system. However, it introduces a significant problem regarding the long wavelength spectral channel.
The long wavelength spectral channel involvesphotons with energies ranging from 2.08 eV at theshort wavelength half amplitude point to 1.89 eV atthe long wavelength half amplitude point. Theseenergy levels by themselves are not sufficient to excitethe neural system. However, it is well known that the human spectral response extends beyond 1.0 micronsfor light of sufficient intensity.
The dilemma is solved by using a two-excitonmechanism (and possibly a three-exciton mechanismat very long wavelengths). The excitation of theActiva formed by the microtubules can beaccomplished through the simultaneous de-excitationof multiple excitons [12.5.2]. However, thismechanism converts the transfer function from thelinear function associated with the UV–, S– & M–channels to a square law function. As a result, theefficiency of transduction from the chromophores tothe electrical circuits of the neuron decreases as the
intensity of photon-excitation is reduced. The result of this phenomenon is that, unlike the other channels, theeffective sensitivity of the long wavelength spectral channel falls as the broad spectral band light level is reduced. The visual system transitions smoothly from a photopic capability to a scotopic capability due to the gradual loss oflong wavelength spectral channel sensitivity. This transition will be presented graphically in Section 9.1.2. Nochange in class of photoreceptor is involved.
The above two-exciton mechanism should not be confused with a two-photon mechanism. In the latter, the twophotons must arrive nearly simultaneously. In the two-exciton mechanism, the excitons derived from oxygen havea very long half life. They will remain excited until they have an opportunity to transfer their energy to anothermolecule or another electronic media.
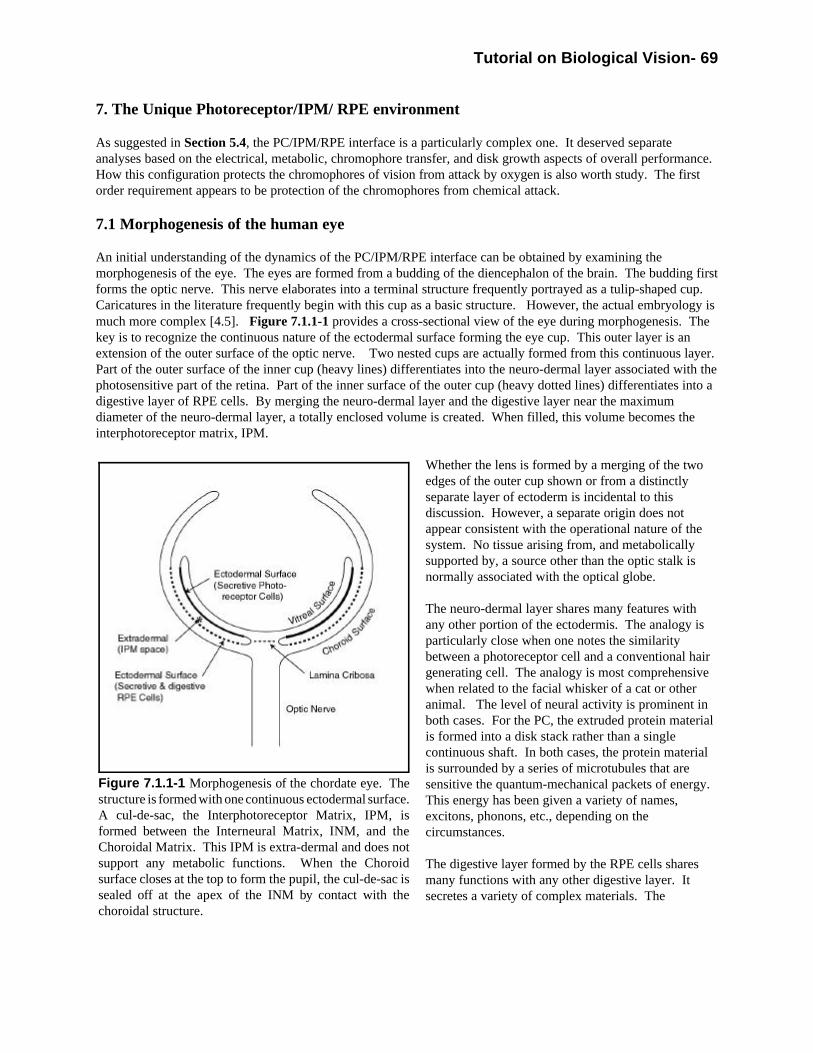
Tutorial on Biological Vision- 69
Figure 7.1.1-1 Morphogenesis of the chordate eye. Thestructure is formed with one continuous ectodermal surface.A cul-de-sac, the Interphotoreceptor Matrix, IPM, isformed between the Interneural Matrix, INM, and theChoroidal Matrix. This IPM is extra-dermal and does notsupport any metabolic functions. When the Choroidsurface closes at the top to form the pupil, the cul-de-sac issealed off at the apex of the INM by contact with thechoroidal structure.
7. The Unique Photoreceptor/IPM/ RPE environment
As suggested in Section 5.4, the PC/IPM/RPE interface is a particularly complex one. It deserved separateanalyses based on the electrical, metabolic, chromophore transfer, and disk growth aspects of overall performance. How this configuration protects the chromophores of vision from attack by oxygen is also worth study. The firstorder requirement appears to be protection of the chromophores from chemical attack.
7.1 Morphogenesis of the human eye
An initial understanding of the dynamics of the PC/IPM/RPE interface can be obtained by examining themorphogenesis of the eye. The eyes are formed from a budding of the diencephalon of the brain. The budding firstforms the optic nerve. This nerve elaborates into a terminal structure frequently portrayed as a tulip-shaped cup. Caricatures in the literature frequently begin with this cup as a basic structure. However, the actual embryology ismuch more complex [4.5]. Figure 7.1.1-1 provides a cross-sectional view of the eye during morphogenesis. Thekey is to recognize the continuous nature of the ectodermal surface forming the eye cup. This outer layer is anextension of the outer surface of the optic nerve. Two nested cups are actually formed from this continuous layer. Part of the outer surface of the inner cup (heavy lines) differentiates into the neuro-dermal layer associated with thephotosensitive part of the retina. Part of the inner surface of the outer cup (heavy dotted lines) differentiates into adigestive layer of RPE cells. By merging the neuro-dermal layer and the digestive layer near the maximumdiameter of the neuro-dermal layer, a totally enclosed volume is created. When filled, this volume becomes theinterphotoreceptor matrix, IPM.
Whether the lens is formed by a merging of the twoedges of the outer cup shown or from a distinctlyseparate layer of ectoderm is incidental to thisdiscussion. However, a separate origin does notappear consistent with the operational nature of thesystem. No tissue arising from, and metabolicallysupported by, a source other than the optic stalk isnormally associated with the optical globe.
The neuro-dermal layer shares many features withany other portion of the ectodermis. The analogy isparticularly close when one notes the similaritybetween a photoreceptor cell and a conventional hairgenerating cell. The analogy is most comprehensivewhen related to the facial whisker of a cat or otheranimal. The level of neural activity is prominent inboth cases. For the PC, the extruded protein materialis formed into a disk stack rather than a singlecontinuous shaft. In both cases, the protein materialis surrounded by a series of microtubules that aresensitive the quantum-mechanical packets of energy. This energy has been given a variety of names,excitons, phonons, etc., depending on thecircumstances.
The digestive layer formed by the RPE cells sharesmany functions with any other digestive layer. Itsecretes a variety of complex materials. The

70 Guide to Processes in Biological Vision
clear whether the measured data refers to the apo-IRBP or the complete IRBP-chromophore complex. In eithercase, the IRBP provides the transport mechanism required to present the chromophores to the disks as they are
a continuous liquid crystalline coating covering the disks. This coating becomes photosensitive following itsquantum-mechanical interface with the microtubules along the edges of the disks.
at a continuous rate. This rate is a nominal 350 nm per hour in a human. Similar rates can be expected in otherendothermic animals. For an outer segment that is nominally 50 microns long, the lifetime of a 25 nm thick disk
The continuous secretion of protein material and the formation of disks obviously cannot continue in a closedspace. When the disk stack begins to impinge on the RPE cells, the RPE cells partially invaginate and partially
in Section 5.4
7.2 The complete mature PC/IPM/RPE complex
This photoreceptor/IPM/RPE complex both provides and maintains the chromophores of vision. It also supportsFigure 7.2.1-1 provides a composite view of this interface
conditions will be discussed individually by reference to the cell number along the left margin.
A critically important feature of this figure is its dynamic character. As indicated at the bottom, the disks move
this rate suggests a disk generation rate of ten disks per hour per disk. At this rate, each disk stack is completelyreplaced weekly in humans. The generation of new disks at a rate of ten per hour per cell suggests a prodigious
for the RPE cells. The RPE cells on the right are shown storing a variety of chromophores in so-called colorgranules. The granules marked U represent stores of the ultraviolet chromophore, Rhodonine(11). The other
spectra of the individual chromophores.
The disks of the outer segment continue to be shown without an enclosing membrane. Several recent micrographs
these micrographs provide details confirming the functional independence of the colax and the calyx.
Bruch’s membrane is shown explicitly near the RPE cells. Also shown explicitly, but less obviously, is the Outer
rectangles are shown long enough to accommodate a variety of Mueller Cells (glia) in the space between thephotoreceptor cells. These two barriers, the OLM and the Mueller cells squeezed between the PC’s, provide both
cells provide the same isolation between the IPM and the choro-vascular matrix. Both the microtubules and thepoditic terminal of the photoreceptor cells are in electrical contact with the IPM. Simultaneously, the axon of the
plays an important role in the electrical waveforms generated by the visual system. It is particularly relevant to the
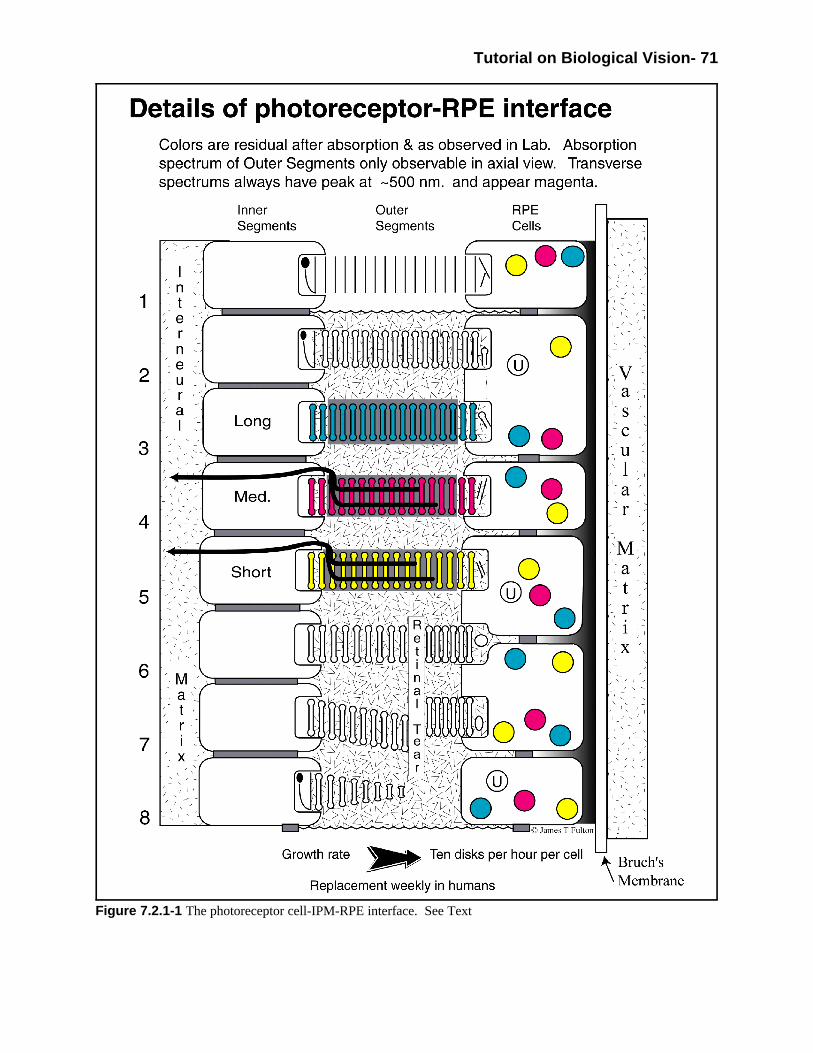
Tutorial on Biological Vision- 71
Figure 7.2.1-1 The photoreceptor cell-IPM-RPE interface. See Text
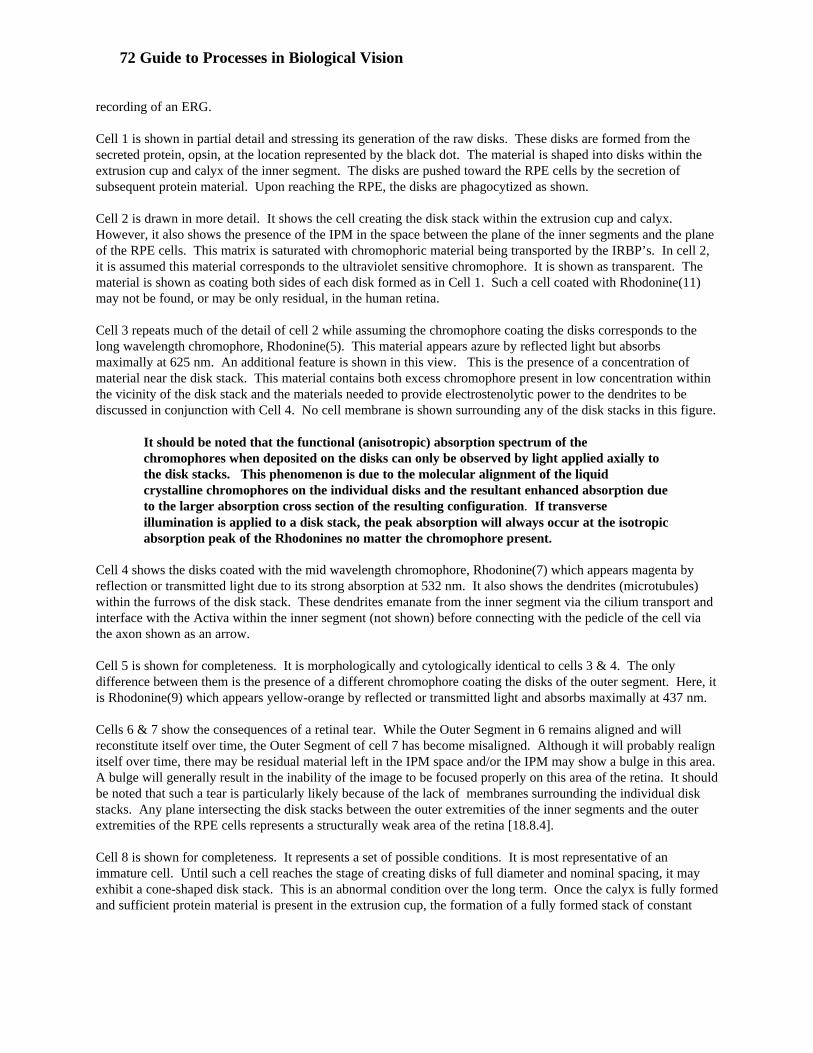
72 Guide to Processes in Biological Vision
recording of an ERG.
Cell 1 is shown in partial detail and stressing its generation of the raw disks. These disks are formed from thesecreted protein, opsin, at the location represented by the black dot. The material is shaped into disks within theextrusion cup and calyx of the inner segment. The disks are pushed toward the RPE cells by the secretion ofsubsequent protein material. Upon reaching the RPE, the disks are phagocytized as shown.
Cell 2 is drawn in more detail. It shows the cell creating the disk stack within the extrusion cup and calyx. However, it also shows the presence of the IPM in the space between the plane of the inner segments and the planeof the RPE cells. This matrix is saturated with chromophoric material being transported by the IRBP’s. In cell 2,it is assumed this material corresponds to the ultraviolet sensitive chromophore. It is shown as transparent. Thematerial is shown as coating both sides of each disk formed as in Cell 1. Such a cell coated with Rhodonine(11)may not be found, or may be only residual, in the human retina.
Cell 3 repeats much of the detail of cell 2 while assuming the chromophore coating the disks corresponds to thelong wavelength chromophore, Rhodonine(5). This material appears azure by reflected light but absorbsmaximally at 625 nm. An additional feature is shown in this view. This is the presence of a concentration ofmaterial near the disk stack. This material contains both excess chromophore present in low concentration withinthe vicinity of the disk stack and the materials needed to provide electrostenolytic power to the dendrites to bediscussed in conjunction with Cell 4. No cell membrane is shown surrounding any of the disk stacks in this figure.
It should be noted that the functional (anisotropic) absorption spectrum of thechromophores when deposited on the disks can only be observed by light applied axially tothe disk stacks. This phenomenon is due to the molecular alignment of the liquidcrystalline chromophores on the individual disks and the resultant enhanced absorption dueto the larger absorption cross section of the resulting configuration. If transverseillumination is applied to a disk stack, the peak absorption will always occur at the isotropicabsorption peak of the Rhodonines no matter the chromophore present.
Cell 4 shows the disks coated with the mid wavelength chromophore, Rhodonine(7) which appears magenta byreflection or transmitted light due to its strong absorption at 532 nm. It also shows the dendrites (microtubules) within the furrows of the disk stack. These dendrites emanate from the inner segment via the cilium transport andinterface with the Activa within the inner segment (not shown) before connecting with the pedicle of the cell viathe axon shown as an arrow.
Cell 5 is shown for completeness. It is morphologically and cytologically identical to cells 3 & 4. The onlydifference between them is the presence of a different chromophore coating the disks of the outer segment. Here, itis Rhodonine(9) which appears yellow-orange by reflected or transmitted light and absorbs maximally at 437 nm.
Cells 6 & 7 show the consequences of a retinal tear. While the Outer Segment in 6 remains aligned and willreconstitute itself over time, the Outer Segment of cell 7 has become misaligned. Although it will probably realignitself over time, there may be residual material left in the IPM space and/or the IPM may show a bulge in this area. A bulge will generally result in the inability of the image to be focused properly on this area of the retina. It shouldbe noted that such a tear is particularly likely because of the lack of membranes surrounding the individual diskstacks. Any plane intersecting the disk stacks between the outer extremities of the inner segments and the outerextremities of the RPE cells represents a structurally weak area of the retina [18.8.4].
Cell 8 is shown for completeness. It represents a set of possible conditions. It is most representative of animmature cell. Until such a cell reaches the stage of creating disks of full diameter and nominal spacing, it mayexhibit a cone-shaped disk stack. This is an abnormal condition over the long term. Once the calyx is fully formedand sufficient protein material is present in the extrusion cup, the formation of a fully formed stack of constant

Tutorial on Biological Vision- 73
diameter disks can be expected. It is possible that this will not occur until the additional back pressure provided bythe presence of the RPE cells blocking the growth of the disk stack becomes important. In any case, a conicalshape for the outer segment of a photoreceptor cell cannot be sustained over a period longer than a week due to thegrowth of the stack.
The figure does not address the geometrical grouping of the photoreceptors in the plane of the retina. While thisgrouping is frequently obvious in other phyla, discerning it in most chordate species is difficult. Theinstrumentation difficulties have been significant in the past. Failure to recognize the presence of ultravioletspectral absorbers has been a problem until recently. Failure to recognize the distinct characteristics of theawareness and analytical modes of signal processing have also contributed to the problem. The high degree ofconsistency in the composite spectra of the eye no matter the position in the retina would suggest the concentrationof the different spectral absorbers is nearly constant.

74 Guide to Processes in Biological Vision
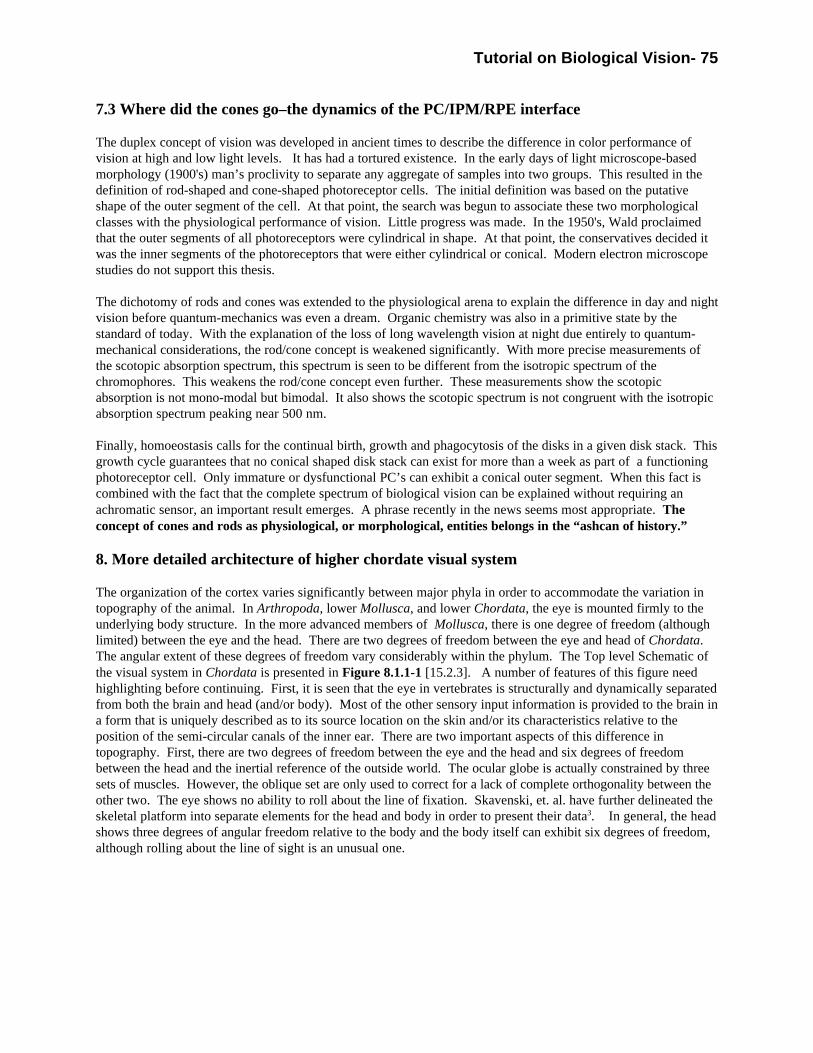
Tutorial on Biological Vision- 75
7.3 Where did the cones go–the dynamics of the PC/IPM/RPE interface
The duplex concept of vision was developed in ancient times to describe the difference in color performance ofvision at high and low light levels. It has had a tortured existence. In the early days of light microscope-basedmorphology (1900's) man’s proclivity to separate any aggregate of samples into two groups. This resulted in thedefinition of rod-shaped and cone-shaped photoreceptor cells. The initial definition was based on the putativeshape of the outer segment of the cell. At that point, the search was begun to associate these two morphologicalclasses with the physiological performance of vision. Little progress was made. In the 1950's, Wald proclaimedthat the outer segments of all photoreceptors were cylindrical in shape. At that point, the conservatives decided itwas the inner segments of the photoreceptors that were either cylindrical or conical. Modern electron microscopestudies do not support this thesis.
The dichotomy of rods and cones was extended to the physiological arena to explain the difference in day and nightvision before quantum-mechanics was even a dream. Organic chemistry was also in a primitive state by thestandard of today. With the explanation of the loss of long wavelength vision at night due entirely to quantum-mechanical considerations, the rod/cone concept is weakened significantly. With more precise measurements ofthe scotopic absorption spectrum, this spectrum is seen to be different from the isotropic spectrum of thechromophores. This weakens the rod/cone concept even further. These measurements show the scotopicabsorption is not mono-modal but bimodal. It also shows the scotopic spectrum is not congruent with the isotropicabsorption spectrum peaking near 500 nm.
Finally, homoeostasis calls for the continual birth, growth and phagocytosis of the disks in a given disk stack. Thisgrowth cycle guarantees that no conical shaped disk stack can exist for more than a week as part of a functioningphotoreceptor cell. Only immature or dysfunctional PC’s can exhibit a conical outer segment. When this fact iscombined with the fact that the complete spectrum of biological vision can be explained without requiring anachromatic sensor, an important result emerges. A phrase recently in the news seems most appropriate. Theconcept of cones and rods as physiological, or morphological, entities belongs in the “ashcan of history.”
8. More detailed architecture of higher chordate visual system
The organization of the cortex varies significantly between major phyla in order to accommodate the variation intopography of the animal. In Arthropoda, lower Mollusca, and lower Chordata, the eye is mounted firmly to theunderlying body structure. In the more advanced members of Mollusca, there is one degree of freedom (althoughlimited) between the eye and the head. There are two degrees of freedom between the eye and head of Chordata. The angular extent of these degrees of freedom vary considerably within the phylum. The Top level Schematic ofthe visual system in Chordata is presented in Figure 8.1.1-1 [15.2.3]. A number of features of this figure needhighlighting before continuing. First, it is seen that the eye in vertebrates is structurally and dynamically separatedfrom both the brain and head (and/or body). Most of the other sensory input information is provided to the brain ina form that is uniquely described as to its source location on the skin and/or its characteristics relative to theposition of the semi-circular canals of the inner ear. There are two important aspects of this difference intopography. First, there are two degrees of freedom between the eye and the head and six degrees of freedombetween the head and the inertial reference of the outside world. The ocular globe is actually constrained by threesets of muscles. However, the oblique set are only used to correct for a lack of complete orthogonality between theother two. The eye shows no ability to roll about the line of fixation. Skavenski, et. al. have further delineated theskeletal platform into separate elements for the head and body in order to present their data3. In general, the headshows three degrees of angular freedom relative to the body and the body itself can exhibit six degrees of freedom,although rolling about the line of sight is an unusual one.

76 Guide to Processes in Biological Vision
Figure 8.1.1-1 Top level schematic of the visual system in Chordata. Note the two external feedback loopsrepresented by the signals from the photoreceptors flowing to the LGN and PGN and back through the SuperiorColliculus to the muscles controlling the head, eyes, eyelids and aperture. The performance of these loops is augmentedby command signals originating in Area V6 of the cortex. See discussion supporting figure 1.5.2-2 of the supportingdocument for additional nomenclature.
8.1 The role of delay in the signal processing of vision
The configuration of the PGN/pulvinar, superior colliculus and the interconnections between them is only shownconceptually in the above figure. The functional roles assigned to these elements can be expanded as shown inFigure 8.1.1-2. This figure will be discussed further in the following sections. At this level, it shows the principlesignaling paths found in the human visual system and their relationships. It also illustrates the major delaysinvolved in the system related to the projection of signals over long distances by the Stage 3 circuits. Finally, itshows the key location of the Precision Optical System in the visual system.
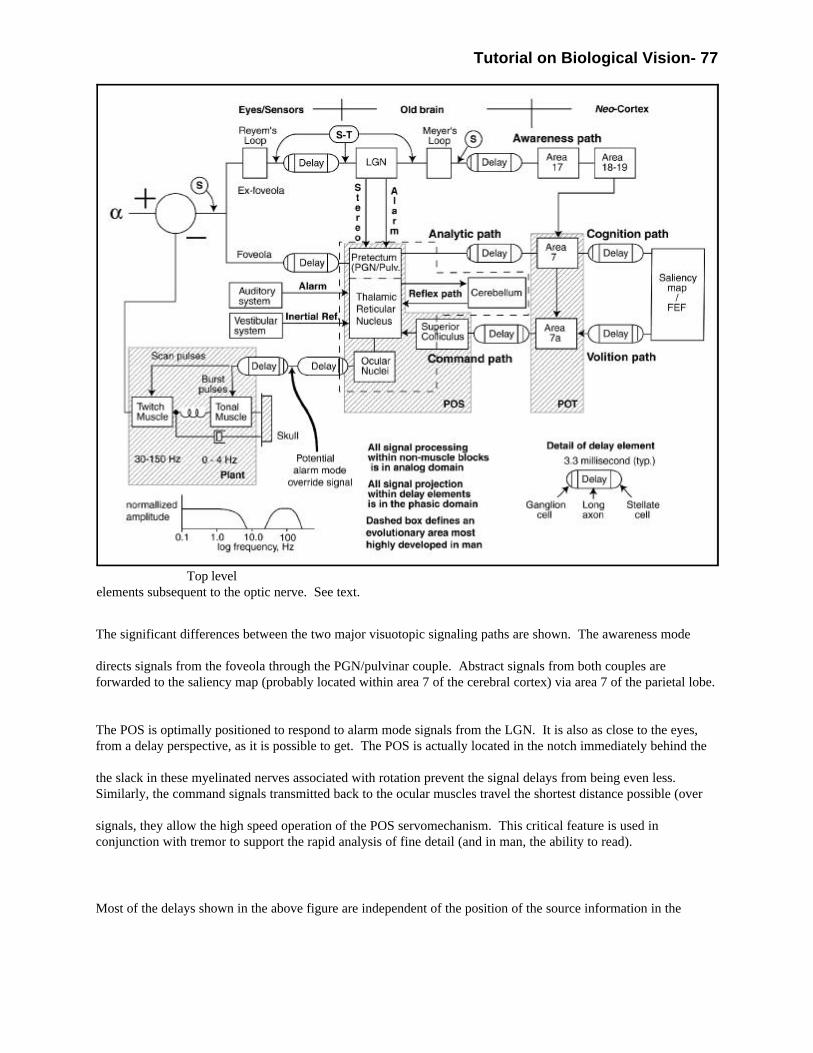
Tutorial on Biological Vision- 77
Top level elements subsequent to the optic nerve. See text.
The significant differences between the two major visuotopic signaling paths are shown. The awareness mode
directs signals from the foveola through the PGN/pulvinar couple. Abstract signals from both couples areforwarded to the saliency map (probably located within area 7 of the cerebral cortex) via area 7 of the parietal lobe.
The POS is optimally positioned to respond to alarm mode signals from the LGN. It is also as close to the eyes,from a delay perspective, as it is possible to get. The POS is actually located in the notch immediately behind the
the slack in these myelinated nerves associated with rotation prevent the signal delays from being even less. Similarly, the command signals transmitted back to the ocular muscles travel the shortest distance possible (over
signals, they allow the high speed operation of the POS servomechanism. This critical feature is used inconjunction with tremor to support the rapid analysis of fine detail (and in man, the ability to read).
Most of the delays shown in the above figure are independent of the position of the source information in the
78 Guide to Processes in Biological Vision
retina. The delays are primarily due to the physical distance between various feature extraction engines. Inaddition, the figure does not address the visuotopic aspects of the signals presented to different feature extractionengines. A powerful technique offers to significantly reduce the signal processing load of these engines [15.2.8]. It also removes the need for any transcendental (primarily trigonometric) mathematical calculations within thevisual system. The technique is known as computational anatomy within the vision community. It is anapplication of a technique known more generally as conformal transformation within higher mathematics. Thetechnique aims to reduce the signal processing load by rearranging the geometrical distribution of the individualneural channels as they travel between two locations. Two prominent applications of this technique have beendocumented. The features known as Meyer’s loops appear in both applications.
8.2.1 Temporal computational anatomy
The pair of features designated Reyem’s loops and Meyer’s loops reduce the signal processing load of the LGNconsiderably. Reyem’s loops do this by dispersing the time of arrival of signals at the LGN based on the positionof the source within the retina. By measuring the time delay between the signals, a signal proportional to thedistance of the source from the fixation point is easily computed. This signal is the principle signal in the alarmmode of vision. However, this dispersion is not of value in the signal processing of the occipital lobe. Therefore,Meyer’s loops are arranged to negate the time dispersal introduced by Reyem’s loops.
Reyem’s loops are morphologically less prominent than Meyer’s loops. They are formed by the variable length ofthe ganglion cell axons within the curved retina. These axons are unmyelinated until the reach the lamina cribosa. Therefore, the signals move at a much slower speed than the same signals within in Meyer’s loops. To achieve thesame time delay, the axons of Reyem’s loops can be much shorter.
8.2.2 Geometric computational anatomy
Much research has been performed attempting to map the signals representing the image in object space as theyappear at different planes in the visual system. Because of the difference in index of refraction of the vitreoushumor, the image projected onto the retina is not a faithful spatial representation of object space. It is not trulyvisuotopic. Such a lack of conformality can be corrected by rearranging the spacing and position of the individualneurons as they travel to the LGN. However, true conformality may not be desirable.
Data is available describing the spatial mapping of the LGN. This mapping is frequently compared to thevisuotopic input. The map of the LGN is frequently compared to the visuotopic situation using the term retinotopicunder the paraxial optical assumption. The paraxial optical assumption makes the unjustified assumption that theretinal image is a faithful reproduction of object space.
Recently data has become available describing the mapping of the striate portion of the occipital lobes. Wheninterpreted carefully, this data shows two significant features. The occipital lobe does not contain a high resolutionmap of the area called the foveola. It actually contains a very poor map of the foveola. More significantly, the mapis not visuotopic. It contains a very distinctive distortion produced by a logarithmic conformal transformation. This transformation has a number of unique features. A primary one is that it converts circles in object spacecentered on the point of fixation into straight lines in occipital space. Thus, any pie shaped sector in object space isrepresented by three straight lines in occipital space. This geometrical change greatly simplifies the correlationprocess that is key to feature extraction, perception and eventually cognition.
Note that the correlation processes used in the occipital lobe become less and less visuotopic as individual featuresare extracted. Once extracted, these features are described in abstract vector form. This form cannot be related toelements or features in object space. The spatial maps of the occipital lobe reflect the receptive field of theindividual neurons at that point rather than any visuotopic relationship.

Tutorial on Biological Vision- 79
8.3 The role of tremor in the signal processing of vision
The lower left corner of the above figure shows a feature that has long confounded electrophysiologists. Themuscles of the eye show a unique configuration. They have one portion that responds tonically to low frequencysignals. These responses can involve large angles of rotation. They also have a distinct portion that responds veryrapidly, but over low angular excursions, to higher frequency signals. When the data is coupled with thepsychophysical experiments of Yarbus and Ditchburn, the purpose of this unique feature becomes clear. The highfrequency response is used to introduce tremor into the visual system.
Section 5.2.2 explained how the adaptation amplifier circuit included a method of removing the slowly changingcomponents of the input signal from the faster changing component. This mechanism gives the visual system avery large dynamic range relative to the input intensity level. It also leaves the system blind to any constantintensity elements in the scene. This is quite adequate for many lower chordates who use their vision primarily foralarm purposes, (sedentary rabbits) or to track food that moves within their field of view (frogs). However, it iscompletely inadequate for predators. Predators must be able to discern food that is stationary with respect to theirbackground. To overcome this problem, many members of Chordata (and through convergent evolution, somemembers of Mollusca) have introduced a fine angular vibration into their visual systems. This tremor causes allintensity changes (contours) in object space to appear to move with respect to the line of sight of the retina. Thistechnique largely restores the imaging capability of the visual system while maintaining its large dynamic rangewith respect to average scene intensity. The tremor amplitude need not be large. However, it becomes lesseffective if it has an amplitude less than the diameter of one photoreceptor cell.
The requirement for the product of tremor and contrast contours in a scene if it to be discerned bya human is easy to demonstrate. Using an optometrist’s perimeter with an unblemished whitescreen, look through the eyepiece and hold the line of fixation constant. Within three seconds,the subject will note the center of his field of view changing to a large blob best described as aneutral gray. The fact that the scene does not go to black makes another point. It shows that thevisual system is not direct coupled (using the vernacular of the electrical engineer). The visualsystem cannot report an absolute intensity level.
More complex test equipment can zero out the motion introduced by natural tremor. Then, evenprinted text will disappear from the field of view within three seconds and be replaced by aneutral gray blob. Tremor is the key to the ability of the human to read and analyze finedetail. Sections 8.4 and 9.2 discuss this capability.
While the human cannot control the amplitude or existence of tremor, it appears that a variety of lower animalscan. The big cats and the felines are examples. The alligator and crocodile are others. Some birds like the kitesand hawks are also examples. These animals seem able to stop the tremor when they want to detect motion withinan otherwise stationary scene. They can then start the tremor to provide background scene information.
Studies of the arc-second level tremor signals were difficult until recently. Instrumentation with both the necessarysensitivity and precision was difficult to construct. However, recent data has proved that tremor is not merely arandom noise level. It is a highly structured signal. The vertical and horizontal components of this signal arelargely independent. This fact provides the second clue about tremor. It is the source of the analytical capability ofthe higher members of Chordata (and apparently some higher members of Mollusca).
Tremor is used to convert every lightness contour in object space into a temporal feature that can be transmittedfrom the retina to the brain for further processing. To do this in an unambiguous way, the information must beseparated into vertical and horizontal components. This is achieved by time sharing the tremor motion betweenthe vertical and horizontal directions [7.3.5].
Going back to the ancient concept, tremor and saccades can best be visualized by thinking of a narrow beam of

80 Guide to Processes in Biological Vision
light emanating from the eye and scanning a scene. Once the beam falls on an object of interest, the beamperforms a very minute scan of the object in two dimensions to discover its shape. In the real case, the beamconsists of multiple, tightly grouped, small beams. The receptive fields, rather than the projected fields ofindividual beams relate to the individual photoreceptors of the eye. Thus, the eye scans an object of interest using atwo-dimensional array of photoreceptors. The above signals generated by the foveola are forwarded to thePGN/pulvinar couple for further processing. The peripheral signals are forwarded to the LGN/occipital couple.
8.4 The correlation process of the PGN/pulvinar couple
The PGN/pulvinar couple, under the control of the TRN and working with the rest of the POS, is responsible withthe initial feature extraction process associated with analytical vision. The PGN is organized as a multiple planecorrelator where each plane is a two dimensional surface. The neurons forming this surface are arranged largelyvisuotopically because of the small area of the retina served, typically 1.2 degrees in diameter. For this size field,the paraxial (Gaussian) optical assumption applies. Under the control of the TRN, the POS scans the field of viewforming the temporal electrical signals defined above. These signals are received at the PGN and inserted intodifferent signal planes based on their time of arrival. Their time of arrival is correlated with the vertical andhorizontal components of the tremor. This process generates two distinct, but closely related, images. One isfocused on the horizontal edges in the scene. The other is focused on the vertical edges. By performing a simplelinear correlation along each resolved line in each plane, the location of all significant line segments can bedetermined. This information is available as a vector describing both the length and location of each line segment.
The PGN/pulvinar couple is tasked with further reducing the above library of line segments into interps. Interpsdefine the basic unit of information about a scene element. The interp is an abstract message describing theparticular arrangements of line elements found within the field of view of the foveola during any one glimpse ofbetween 50 and 200 msec. [19.8.2] These interps can be compared with the library of interps previouslyencountered and stored in the pulvinar. For each match, the PGN/pulvinar couple issues a higher level, and moreabstract, interp describing what the simple interp represents.
The correlator of the PGN consists of about 23,000 nodes in each plane. These nodes represent the circular area ofthe foveola. The foveola has a diameter of about 175 photoreceptors. Depending on the language being read, thePGN can examine and interpret one short word or two syllables during one 200 msec glimpse. The POS thencommands the oculomotor system to perform a flick to the next word group or pictogram. This interpretationprocedure is reported until the end of a line of symbols is reached. At that point, a saccade is performed to returnto the next line of text.
The PGN/pulvinar couple also appears to contain a short term memory (a shift register) that allows it to assemblestrings of these initial interps and compare them to previously stored interp strings. Where a match is found, thecouple issues a higher level abstract signal known as a percept. The percept may represent a short phrase or acomplete thought.
If the PGN/pulvinar couple cannot match either a low level interp or a string of interps, it can enter a learningmode that will impress the new pattern into its permanent memory. If a percept cannot be identified, a similarlearning procedure may be invoked. However, this procedure may involve the higher cognitive centers in thelearning process. Invocation of one of these learning procedures slows the reading process substantially.
Tutorial on Biological Vision- 81
The performance of the human visual system has been studied from many perspectives. Only a selected set of theseperspectives can be addressed in this tutorial. The supporting work devotes several hundred pages to these
detail. The Glossary, and the summary of the parameters associated with the Standard Eye, listed in Section 1
The previous studies of visual performance have generally fallen into two categories, electrophysiological(generally invasive) techniques and psychophysical (generally non-invasive) techniques. The former has generally
above. The challenge has frequently been to decide which data sets included the fewest number of uncontrolledvariables. Once this was determined, rationalizing the initially disparate data sets was frequently possible.
occur in visuotopic space and those that occur in abstract vector space. Those performance parameters related tovisuotopic space can be measured electrophysiologically. They have been measured at the stellate cells of the PGN
have reflected the receptive field of view of the individual occipital cells (referred to visuotopic space) more thanthe performance of the system. will address the functional performance of vision from theelectrophysiological perspective.
abstract signals relate directly to the processes of perception. Two new techniques have recently appeared thatshow considerable potential for evaluation abstract visual signals. Magnetically augmented visual evoked potential
the current capabilities of these techniques remain temporally and spatially limited.
Substantial progress is being made in understanding the operation of the brain at the abstract signal level. 9.2 will look briefly at the subjects of stereopsis, analysis of a bucolic scene, and reading. These discussions will
Section 9.2.4 will provide some introductory words concerning the distinction between perception and cognition.
major difference between perceptual awareness and cognitive awareness. The difference is critical to explanationsof such phenomenon as blindsight and to further definition of the capabilities of the “zombie.” The section will
9.1 Functional Performance related to Physiology
Many individual mechanisms come together in a variety of ways to complicate the description of visual
specific performance characteristics. Sometimes, documenting the presence of more than a single mechanism isnecessary. Sometimes, the signatures of other mechanisms are only slightly visible in a given performance
A mechanism of primary significance to the physiological performance of the human eyes is the two-excitonmechanism of long wavelength vision. It is the source of the change in the spectral performance between photopic
mesopic range. Without this phenomenon, normal human vision would be limited to wavelengths shorter than 600
82 Guide to Processes in Biological Vision
nm.
Many performance phenomena of human vision derive from the adaptation mechanism of the adaptation amplifier. The transition from photopic to scotopic vision is a direct result of the adaptation mechanism. Because of the largedynamic range of this mechanism, earlier investigators have invariably defined some form of a duplex mechanismto account for it. This duplex mechanism has generally been associated with the putative (but poorly supported)morphological dichotomy separating photoreceptors into the rods and cones.
The dark adaptation phenomenon (Section 9.1.4), the color constancy phenomenon (Section 9.1.5), and the spatial(and temporal) frequency characteristic (Section 9.1.6) are all based on the adaptation mechanism.
9.1.1 The transient performance of the photodetection process–the P/D Equation
The overall photodetection process involves the conversion of incident photons into an electrical signal by thephotoreceptors [7.2]. This process is frequently divided into two distinct conceptual processes in the literature. The first is then the photodetection process where the incident photons are converted into excitons (or stereo-isomers in the older literature). The second becomes the transduction process where excitons are converted into astream of free electrons in the electrolytic circuitry. Unfortunately, the process is controlled by a single differentialequation. This fact makes the above division of the overall task inappropriate. Such a division actually obscuresthe boundary conditions applicable to the differential equation.
The dynamics of photodetection in vision is based on the energy band structure and the physical dimensions shownin [Figure 6.7.1-1]. Under dynamic conditions, each photon absorbed within the liquid crystalline structure of thechromophores creates an exciton at that location. This exciton must travel to the edge of the disk where it caninteract with a microtubule. If only a single exciton is created, the trajectory of the exciton is difficult to describe. However, if several excitons exist in the π* band simultaneously, their mutual repulsion defines both the path andthe velocity along that path quite well. When an exciton reaches the microtubule interface, it can be de-excited bytransferring its energy to an electron-hole pair in the base region of the Activa formed at the microtubule interface. In this process, the exciton returns to the n-band as an unexcited electron. The total number of unexcited electronsin the n-band determines the absorption coefficient of the liquid crystalline chromophore. The time that anelectron is absent from the n-band due to excitation is a function of the diameter of the disk and the parameterscontrolling the velocity of excitons within the p* band. This velocity is strongly dependent on the localtemperature. While the temperature is invariant in endothermic animals, it varies significantly in exothermicanimals. This variation is a valuable source of data in the laboratory. Much of the data confirming the equationspresented below come from experiments performed at varying temperatures [7.2.6]. Good data requires thetemperature to be recorded to a precision exceeding one degree Celsius.
By writing a two-part differential equation describing the above mechanism, the dynamics of the overallphotodetection/de-excitation (P/D) process can be described. The first part of the equation describes the excitationand de-excitation events described above. The second part, or secondary equation, describes the time delaybetween excitation by absorption and de-excitation at the interface. When written in this form, the equation is verysimilar to the well known (among nuclear physicists) equation describing the creation of nucleotides in a nuclearreactor. However, in the nucleotide case, the transmuted material does not return to its original state while still inthe reactor. The solution to the overall differential equation, using the proper boundary conditions, describes thephotodetection/de-excitation process in detail.
To solve the above differential equation requires that the time delay be described in the secondary equation usingcomplex mathematics. The imaginary operator, j, must be used if the complete solution is wanted. The resulting solution contains j in only one term. This term describes an absolute delay that has been ignored by earlierinvestigators.

Tutorial on Biological Vision- 83
The short lifetime of the excitons within the visual process leads to two distinctly different solutions to the P/DEquation. If the stimulus is applied for a period shorter than the time constants of the intrinsic process, thestimulus can be considered a mathematical impulse of zero duration. The response is then proportional to theintegrated flux of the stimulus. If the stimulus is of longer duration than the time constants of the mechanism, itmust be considered a mathematical step function. In this case, the response achieves a steady state conditionduring stimulation. Usually, stimuli lasting between 0.1 and 50 milliseconds should not be used in experiments toconfirm the P/D Equation, unless the investigators are prepared to handle the mathematics of a complex transientcase. The following material will only describe the impulse solution of the P/D Equation. The supportingdocument provides data on the response to longer stimulation [Appen. A].
9.1.1.1 The solution of the P/D Equation for the transient case
The overall differential equation for the P/D Equation is given in Section 7.2.4 of the supporting document. Thesolution to the P/D Equation, describing the current injected into the neural system by a single disk in response toan impulse stimulus, is given below. The equation uses four parameters and the imaginary operator, j. The firsttwo parameters are the intensity of the stimulus, F, and the duration of the stimulus, t (or the product of these twoterms). The other two parameters are the absorption cross section of the liquid crystal chromophore, σ, and thetime constant of the de-excitation process, τ.
Eq. 7.2.4-1
under the condition that σ •F•τ not equal 1.00.
A different solution to the differential equation must be found for the condition σ •F•τ = 1.00. This solution will bediscussed in Section 9.1.1.2.
The general solution has been divided into three terms. Each term exhibits a unique feature. For σ •F•τ > 1.00,the first term approaches a value of –1.00 and can be ignored. However, for lower values of σ •F•τ, the term ispositive and decreases in proportion to this product.
Note carefully that the delay term (the first exponential term) contains the imaginary operator, j. This notationrepresents an absolute delay in the overall response. It forces each individual response to diverge from the baselineat a different time. This term has not appeared previously in the literature although it is apparent in the empiricalrecord.
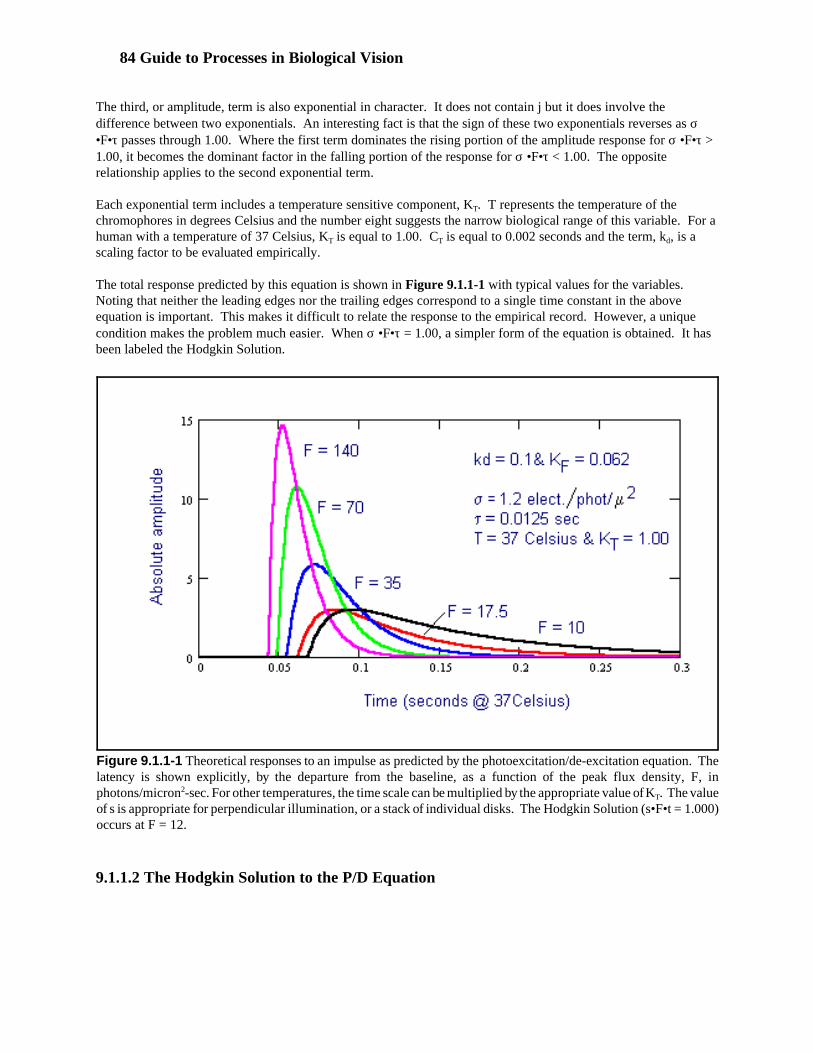
84 Guide to Processes in Biological Vision
Figure 9.1.1-1 Theoretical responses to an impulse as predicted by the photoexcitation/de-excitation equation. Thelatency is shown explicitly, by the departure from the baseline, as a function of the peak flux density, F, inphotons/micron2-sec. For other temperatures, the time scale can be multiplied by the appropriate value of KT. The valueof s is appropriate for perpendicular illumination, or a stack of individual disks. The Hodgkin Solution (s•F•t = 1.000)occurs at F = 12.
The third, or amplitude, term is also exponential in character. It does not contain j but it does involve thedifference between two exponentials. An interesting fact is that the sign of these two exponentials reverses as σ•F•τ passes through 1.00. Where the first term dominates the rising portion of the amplitude response for σ •F•τ >1.00, it becomes the dominant factor in the falling portion of the response for σ •F•τ < 1.00. The oppositerelationship applies to the second exponential term.
Each exponential term includes a temperature sensitive component, KT. T represents the temperature of thechromophores in degrees Celsius and the number eight suggests the narrow biological range of this variable. For ahuman with a temperature of 37 Celsius, KT is equal to 1.00. CT is equal to 0.002 seconds and the term, kd, is ascaling factor to be evaluated empirically.
The total response predicted by this equation is shown in Figure 9.1.1-1 with typical values for the variables. Noting that neither the leading edges nor the trailing edges correspond to a single time constant in the aboveequation is important. This makes it difficult to relate the response to the empirical record. However, a uniquecondition makes the problem much easier. When σ •F•τ = 1.00, a simpler form of the equation is obtained. It hasbeen labeled the Hodgkin Solution.
9.1.1.2 The Hodgkin Solution to the P/D Equation
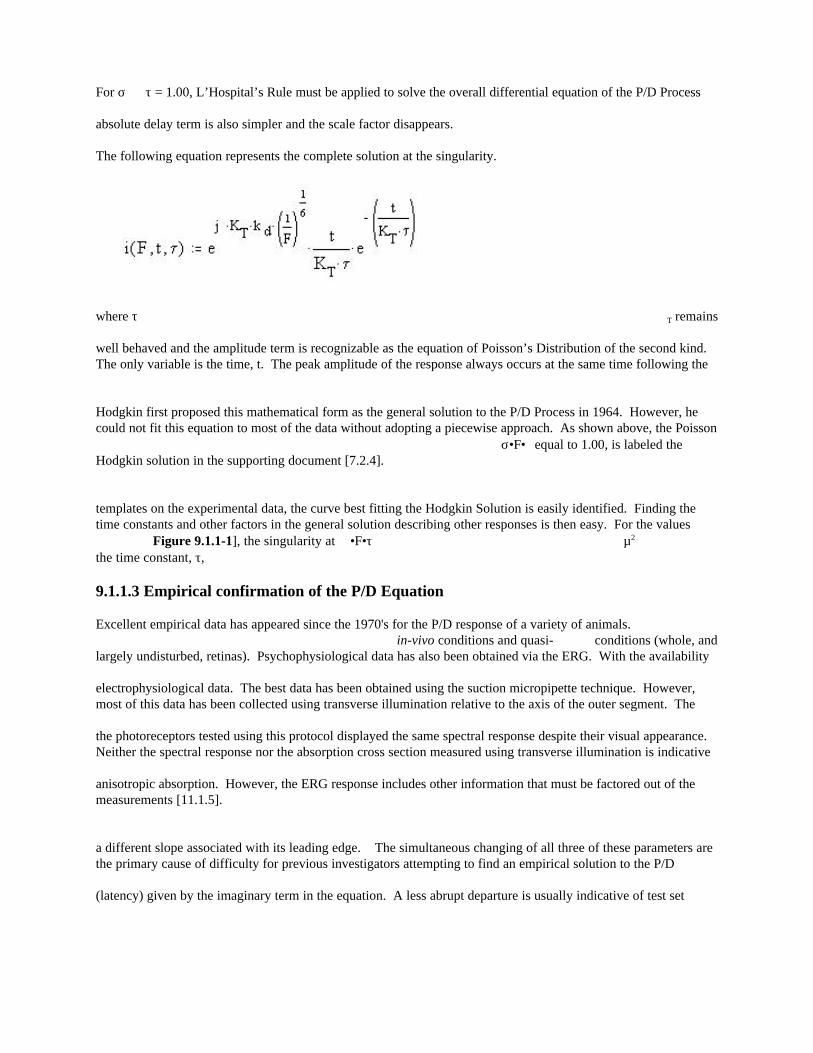
For σ τ = 1.00, L’Hospital’s Rule must be applied to solve the overall differential equation of the P/D Process
absolute delay term is also simpler and the scale factor disappears.
The following equation represents the complete solution at the singularity.
where τ T remains
well behaved and the amplitude term is recognizable as the equation of Poisson’s Distribution of the second kind. The only variable is the time, t. The peak amplitude of the response always occurs at the same time following the
Hodgkin first proposed this mathematical form as the general solution to the P/D Process in 1964. However, hecould not fit this equation to most of the data without adopting a piecewise approach. As shown above, the Poisson
σ•F• equal to 1.00, is labeled theHodgkin solution in the supporting document [7.2.4].
templates on the experimental data, the curve best fitting the Hodgkin Solution is easily identified. Finding thetime constants and other factors in the general solution describing other responses is then easy. For the values
Figure 9.1.1-1], the singularity at •F•τ µ2
the time constant, τ,
9.1.1.3 Empirical confirmation of the P/D Equation
Excellent empirical data has appeared since the 1970's for the P/D response of a variety of animals. in-vivo conditions and quasi- conditions (whole, and
largely undisturbed, retinas). Psychophysiological data has also been obtained via the ERG. With the availability
electrophysiological data. The best data has been obtained using the suction micropipette technique. However,most of this data has been collected using transverse illumination relative to the axis of the outer segment. The
the photoreceptors tested using this protocol displayed the same spectral response despite their visual appearance. Neither the spectral response nor the absorption cross section measured using transverse illumination is indicative
anisotropic absorption. However, the ERG response includes other information that must be factored out of themeasurements [11.1.5].
a different slope associated with its leading edge. The simultaneous changing of all three of these parameters arethe primary cause of difficulty for previous investigators attempting to find an empirical solution to the P/D
(latency) given by the imaginary term in the equation. A less abrupt departure is usually indicative of test set
86 Guide to Processes in Biological Vision
Care should be taken not to normalize the P/D responses measured in the laboratory. This manipulation distortsthe rates of rise and fall of the waveforms to simplify the presentation for largely pedagogical purposes.
The spectral performance of the human eye involves many distinct mechanisms operating over their ownindividual performance ranges. This makes a complete understanding of this performance parameter difficult. It
Traditionally, two distinct operating regions have been defined when studying spectral performance. The photopicregion is related to daylight vision. The scotopic region is related to vision under low-light conditions. An
scotopic regions, based on the intensity of the illumination (irradiation), do not appear in the literature. Instead,they have come to be defined in terms of the diameter of the test stimulus used in threshold sensitivity
supporting documentation [17.2].
Initially, this section will address the spectral response of only the human retina. The well-documented results will
Then the impact of the lens of the eye on overall performance will be reviewed. Unexpected results also appear inthis area. With this foundation, it becomes straightforward to differentiate between the scotopic, mesopic and
To reproduce the results in this section requires a source of adequate color temperature. An optimum source wouldhave a color temperature of 7053 Kelvin. For sources with a color temperature below 3600 Kelvin, a simple
measurements are made at the threshold level. This level changes as a function of wavelength. In addition, itsstatistical character also changes with intensity. The proper correction requires a detailed model of the signal-to-
9.1.2.1 Scotopic performance based on underlying photoreceptors–the full tetrachromat
In 1992, two researchers had a rare opportunity. They were able to examine a subject who had lost the lens from
a wavelength of 314.5 nm under what they described as scotopic conditions. However, the angular field of view ofthe targets was only 38 minutes of arc. This value is even smaller than the standard for photopic sensitivity
shown in Figure 9.1.2-1individuals. Also shown are the individual spectral responses of human vision described in this tutorial. They arenormalized to unity for convenience. The lower horizontal line shows the half amplitude level. This allows one to
of all subjects was limited in the long wavelength region. What was new was the fact that the subjects exhibited aspectral sensitivity in the ultraviolet that was approximately the same as in the short and medium wavelength
spectrum of interest. An artificial pupil was used to eliminate any variation due to potential changes in pupil size. The notations “w/B & W” and “w/o B & W” refer to the data of Boettner & Wolter collected in 1962. They
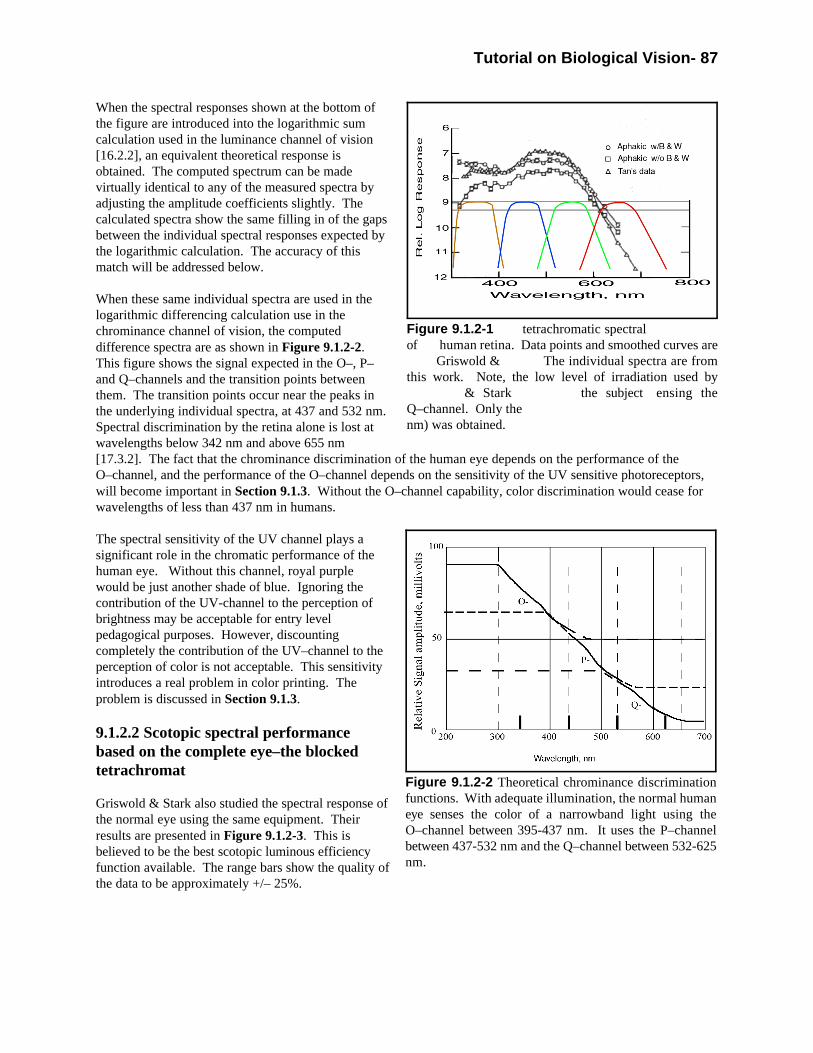
Tutorial on Biological Vision- 87
Figure 9.1.2-1 tetrachromatic spectral of human retina. Data points and smoothed curves are
Griswold & The individual spectra are fromthis work. Note, the low level of irradiation used by
& Stark the subject ensing theQ–channel. Only the nm) was obtained.
Figure 9.1.2-2 Theoretical chrominance discriminationfunctions. With adequate illumination, the normal humaneye senses the color of a narrowband light using theO–channel between 395-437 nm. It uses the P–channelbetween 437-532 nm and the Q–channel between 532-625nm.
When the spectral responses shown at the bottom ofthe figure are introduced into the logarithmic sumcalculation used in the luminance channel of vision[16.2.2], an equivalent theoretical response isobtained. The computed spectrum can be madevirtually identical to any of the measured spectra byadjusting the amplitude coefficients slightly. Thecalculated spectra show the same filling in of the gapsbetween the individual spectral responses expected bythe logarithmic calculation. The accuracy of thismatch will be addressed below.
When these same individual spectra are used in thelogarithmic differencing calculation use in thechrominance channel of vision, the computeddifference spectra are as shown in Figure 9.1.2-2. This figure shows the signal expected in the O–, P–and Q–channels and the transition points betweenthem. The transition points occur near the peaks inthe underlying individual spectra, at 437 and 532 nm. Spectral discrimination by the retina alone is lost atwavelengths below 342 nm and above 655 nm[17.3.2]. The fact that the chrominance discrimination of the human eye depends on the performance of theO–channel, and the performance of the O–channel depends on the sensitivity of the UV sensitive photoreceptors,will become important in Section 9.1.3. Without the O–channel capability, color discrimination would cease forwavelengths of less than 437 nm in humans.
The spectral sensitivity of the UV channel plays asignificant role in the chromatic performance of thehuman eye. Without this channel, royal purplewould be just another shade of blue. Ignoring thecontribution of the UV-channel to the perception ofbrightness may be acceptable for entry levelpedagogical purposes. However, discountingcompletely the contribution of the UV–channel to theperception of color is not acceptable. This sensitivityintroduces a real problem in color printing. Theproblem is discussed in Section 9.1.3.
9.1.2.2 Scotopic spectral performancebased on the complete eye–the blockedtetrachromat
Griswold & Stark also studied the spectral response ofthe normal eye using the same equipment. Theirresults are presented in Figure 9.1.2-3. This isbelieved to be the best scotopic luminous efficiencyfunction available. The range bars show the quality ofthe data to be approximately +/– 25%.

88 Guide to Processes in Biological Vision
Figure 9.1.2-3 The complete scotopic luminousefficiency function for the human eye. There is aBezold-Brucke peak in this waveform in the 485- 494nm region. Data points from Griswold & Stark, 1992.The solid line is the function predicted by this model.
The continuous line through the data represents the calculated luminous efficiency function based on the proposedindividual spectral responses of this work. The line remains within the range bars at all measured values.
Note the measured increase in human retinalsensitivity in the 300-340 nm region. This isexplained by the narrow absorption spectrum of thelens. Its maximum absorption is in the 355-360 nmregion [17.2.2]. Because of the very great dynamicrange of the visual system, the sensitivity in theregion between 300 and 330 nm may not benegligible under special conditions. It is suggestedthat this distinct rise in human spectral sensitivityaccounts for the perceived dazzling aspects of theultraviolet lights used in many discotheques. Thisrise in sensitivity is not included in the CIE ScotopicLuminous Efficiency Function.
9.1.2.3 Photopic spectral performancebased on the complete eye–the blockedtetrachromat
As discussed above, the luminosity function variessignificantly with the state of adaptation of the eye,with irradiation level, with the color temperature ofthe source irradiation and to a lesser extent with age[17.2]. Little data is available relative to age (lessthan 40 subjects). However, the available datasuggest the transmission of the lens group varies less with age than the dispersion in performance due to othervariables4. Figure 9.1.2-4 provides an overview of the subject matter for the complete eye. The luminousefficiency function is a continuous variable as a function of illumination, although it does exhibit two regions ofreasonably constant shape. These are the photopic and scotopic regions. The hyperopic region exhibits significantsaturation in the M–channel region. The mesopic region exhibits a continuous change in spectral performance thatwill be addressed below. The spectral absorption characteristics of the four chromophores of long wavelengthtrichromats are shown normalized at the bottom of the figure. The overall spectral performance is a direct functionof these underlying spectral absorption characteristics, although this is not obvious because of the logarithmicsignal processing employed. This signal processing also results in the two auxiliary peaks at 487 and 580 nmknown as the Bezold-Brucke and Purkinje peaks respectively. These artifacts will be discussed in Section 9.1.2.5. The auxiliary peak at 580 is frequently reported as the actual peak in the absorption function of the longwavelength chromophore. It is not. The hatching on the left suggests the absorption introduced by the lens groupof large terrestrial chordates. This absorption varies with the thickness of the lens group. The larger the animal,the longer wavelength for the cutoff wavelength of this mechanism.
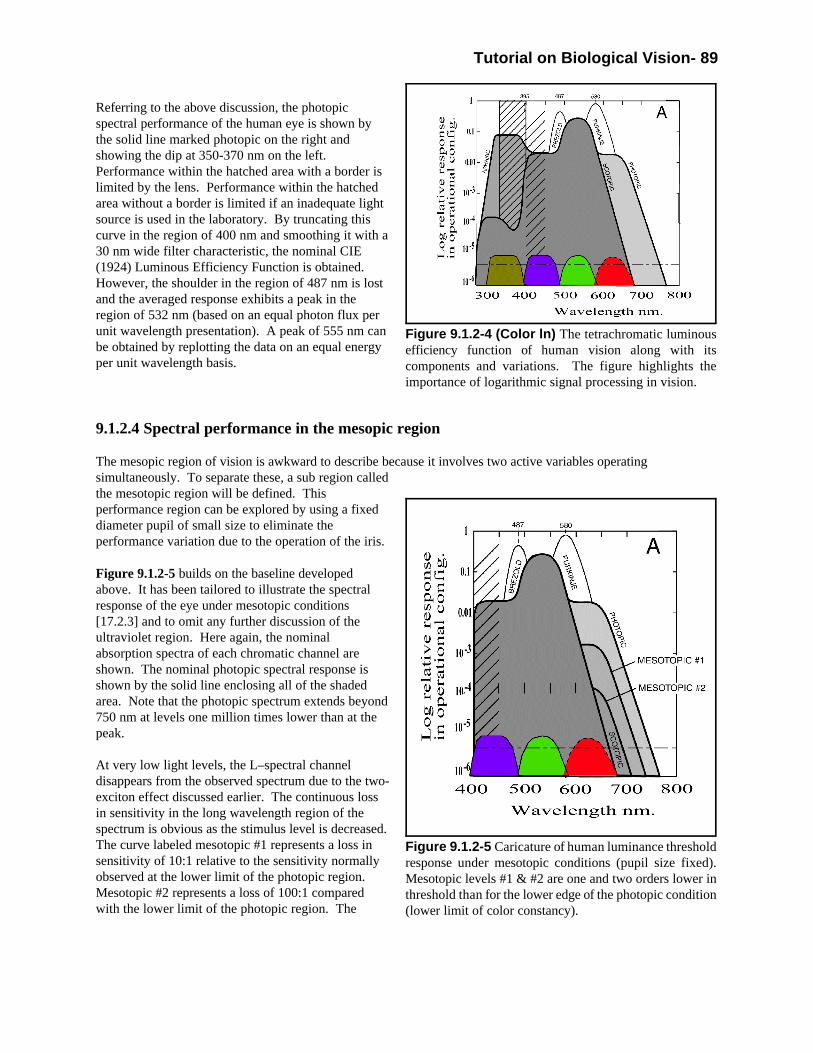
Tutorial on Biological Vision- 89
Figure 9.1.2-4 (Color ln) The tetrachromatic luminousefficiency function of human vision along with itscomponents and variations. The figure highlights theimportance of logarithmic signal processing in vision.
Figure 9.1.2-5 Caricature of human luminance thresholdresponse under mesotopic conditions (pupil size fixed).Mesotopic levels #1 & #2 are one and two orders lower inthreshold than for the lower edge of the photopic condition(lower limit of color constancy).
Referring to the above discussion, the photopicspectral performance of the human eye is shown bythe solid line marked photopic on the right andshowing the dip at 350-370 nm on the left. Performance within the hatched area with a border islimited by the lens. Performance within the hatchedarea without a border is limited if an inadequate lightsource is used in the laboratory. By truncating thiscurve in the region of 400 nm and smoothing it with a30 nm wide filter characteristic, the nominal CIE(1924) Luminous Efficiency Function is obtained. However, the shoulder in the region of 487 nm is lostand the averaged response exhibits a peak in theregion of 532 nm (based on an equal photon flux perunit wavelength presentation). A peak of 555 nm canbe obtained by replotting the data on an equal energyper unit wavelength basis.
9.1.2.4 Spectral performance in the mesopic region
The mesopic region of vision is awkward to describe because it involves two active variables operatingsimultaneously. To separate these, a sub region calledthe mesotopic region will be defined. Thisperformance region can be explored by using a fixeddiameter pupil of small size to eliminate theperformance variation due to the operation of the iris.
Figure 9.1.2-5 builds on the baseline developedabove. It has been tailored to illustrate the spectralresponse of the eye under mesotopic conditions[17.2.3] and to omit any further discussion of theultraviolet region. Here again, the nominalabsorption spectra of each chromatic channel areshown. The nominal photopic spectral response isshown by the solid line enclosing all of the shadedarea. Note that the photopic spectrum extends beyond750 nm at levels one million times lower than at thepeak.
At very low light levels, the L–spectral channeldisappears from the observed spectrum due to the two-exciton effect discussed earlier. The continuous lossin sensitivity in the long wavelength region of thespectrum is obvious as the stimulus level is decreased. The curve labeled mesotopic #1 represents a loss insensitivity of 10:1 relative to the sensitivity normallyobserved at the lower limit of the photopic region. Mesotopic #2 represents a loss of 100:1 comparedwith the lower limit of the photopic region. The

90 Guide to Processes in Biological Vision
scotopic spectral response is normally encountered at light levels 1000:1 below the lower limit of the photopicregion.
9.1.2.5 Artifacts of the logarithmic summation process
If the eye is chromatically adapted at the top of the mesotopic region by suppressing the M-channel sensitivity, or ifthe spectrum of the stimulus is deficient in the M-channel region, the regions labeled the Bezold (Bezold-Brucke)Effect and the Purkinje Effect can be observed. See Section 17.2.3.4. The Purkinje Effect is ultimately lost as thesensitivity of the L–channel is lost.
To isolate the long wavelength spectrum in the psychophysical laboratory, suppressing the sensitivity of the mid-wavelength spectral channel by at least a factor of 1000 is necessary. This is seldom achieved because of theintensity of the adapting light required. If inadequate attempts are made in the psychophysical laboratory to isolatethe long wavelength spectral channel, the observed spectrum is that of the Purkinje Peak, an artifact. It exhibits apeak wavelength between 575-580 nm under most conditions. This is the peak usually labeled the spectrum of thelong wavelength spectral channel in the experimental literature.
The short wavelength artifact at 480-490 nm is less often reported in the empirical literature.
9.1.2.6 The empirical database versus the current CIE spectral performance standards
The available animal data on the individual spectral channel absorptions agree very well with the derivationspresented here. The human data is poorer for several reasons. The general prohibition against invasiveexperiments has largely prevented acquisition of precise electrophysiological data. The resulting focus onpsychophysical techniques has introduced its own group of problems. The psychophysical data has been collectedusing a variety of methods and protocols. Several of these protocols are clearly inadequate. They generally do notemploy sufficient suppression of the mid wavelength spectral channel when trying to isolate the long wavelengthchannel. Thus, the preponderance of the putative long wavelength data shows the Purkinje Peak in the region of580 nm. One investigator recorded a peak at 610 nm and then placed an unsubstantiated comment in the captionsaying “The peak near 610 nm cannot be due to a cone pigment.” He did not offer any alternate interpretation ofthe data [17.2.2].
Data recorded before 1975 usually shows significant smoothing of the spectral responses due to the use of spectralfilters wider than 15 nm. The result is a smoothing and broadening of the recorded spectra because of the CentralLimit Theorem.
The Central Limit Theorem says that poor instrumentation and excessive mathematical manipulation leads toGaussian spectra. This is evident in the CIE (1924) Luminous Efficiency Function. This function was assembledpiecewise from the spectrally non-overlapping investigations of multiple workers. It was then smoothed. In lateryears, it was interpolated and extrapolated. Professor Wright, one of the last living investigators who provided theunderlying data, made an important comment concerning the CIE photopic spectral absorption function of 1924 in1969. “When I look at the revised table of the x-bar, y-bar, z-bar, functions, I am rather surprised to say the least. You see, I know how inaccurate the actual measurements really were. (Laughter) Guild did not take anyobservations below 400 nm and neither did I, and neither did Gibson and Tyndall on the V-sub λ curve, and yet ata wavelength of 362 nm, for example we find a value y-bar of .000004929604! This, in spite of the fact that at 400nm the value of y-bar may be in error by a factor of 10. (Laughter) ”
The CIE Standards were originally developed for use in illumination engineering. They have little role in researchand should never be used as an absolute standard representing the performance of the eye.
Tutorial on Biological Vision- 91
9.1.3 Chromatic performance of the complete human eye–a blocked tetrachromat
The material developed above leads to a new physiologically-based Chromaticity Diagram. This diagram is ofparticular value in research. It is not intended to replace th current CIE standards. They have become tooimbedded in commercial lighting practice. However, the new diagram does provide a theoretical foundation thathighlight the problems with them.
9.1.3.1 Overview
Early vision researchers made the assumption that vision was based on the linear summation of light as sensed by asmall group of individual spectral channels. The general assumption was the group consisted of three spectralchannels. An additional assumption was that the spectral response of the middle spectral channel dominated theoverall spectral response, known then by various titles. A common title for this response was the luminousefficiency function. These assumptions were codified by the CIE during the 1920's and 1930's. Based on the aboveassumptions, a chromaticity diagram was also codified by the CIE. This occurred initially in 1951.
Nearly every assumption involved in the above CIE Standards has proven inappropriate. The actual situation canbe derived from the block diagram of vision as documented in [ Figure 3.1.1-3]. The visual system islogarithmically based and is not based on linear algebra. The number of spectral channels in human vision is four. This is true although one channel is truncated. Further, the signals related to chromatic vision are not summed. They are differenced. No direct relationship exists between the achromatic luminance channel of vision and thechromatic chrominance channels. They are not serially related as assumed in many theoretical discussions.
A similar situation has occurred concerning the Univariance Principle [17.1.5]. Rushton introduced this highlyconceptual principle and initially documented it in 1972. The wording of the concept has been modified considerably as time has passed. It was derived using a floating model based entirely on the assumption of anachromatic “rod” with a spectral absorption matching the scotopic spectrum. This is a problem since no singlechromophore has ever been isolated with the spectral response equivalent to the scotopic spectrum. The conceptcenters on the notion that the wavelength of an absorbed photon cannot be determined by the eye. However, thedifferential logarithmic processing of the chrominance channels shows this to be unrealistic. See Section 3.1.1. For a stream of monochromatic photons with wavelengths between 437 and 625 nm, some will be absorbed by eachof at least two spectral channels. The chrominance channels produce net responses that are linearly related to thewavelength of the incident photons. See Section 9.1.2. While not calibrated within the brain, the wavelength ofthe photons is clearly perceived by the brain. Similar results are obtained by a broadband spectrum. The brainperceives the color of the source as equal to the mean wavelength of the spectrum of that source.
9.1.3.2 Formulation of a new physiologically based color space
Physiologically, the three chrominance channels of human vision are treated as totally independent in the CNS. Mathematically, this independence is best described in terms of orthogonality. Equally important, the algebraicdifferences between the logarithmic signals at the pedicles of the photoreceptor cells result in nearly linearchrominance signals as a function of wavelength. Exactly how these relationships are presented could be a matterof preference except for an additional set of desirable conditions. It would be useful if the relationships could beshown in a conformal form and that the scales could be related directly to wavelength. Conformality insuresproper portrayal of mathematical relationships between the quantities [17.3.3].
The easiest way to achieve these goals is to employ a three-dimensional color space conformally transferred onto aCartesian coordinate system. Since it has been shown that signals in the O–, P– & Q–channels are nearly linearwith respect to wavelength, it is intriguing to attempt to use a spectral locus conformally transformed onto such aCartesian system [16.1.3]. Figure 9.1.3-1(a) shows the spectral locus of a tetrachromat. The nominal points oftransition between the O–, P– and Q– channels are noted at 437 and 532 nm. (b) illustrates the resulting totally

92 Guide to Processes in Biological Vision
conformal three-dimensional color space.
Note that the spectral locus is continuous. The space would form a true cube if it were truncated at the peakwavelength of each chromophore, i. e., 342, 437, 532 and 625 nm. However, this smaller color space would notaccommodate the larger perceivable color space of tetrachromatic vision. The full space is technically a rightparallelopiped. The orientation with 300 nm at the extreme upper corner was chosen arbitrarily. The longwavelength limit was matched to the perceived “color reversal” that occurs at 655 nm [17.3.2]. These choices givea New Chromaticity Diagram that is compatible with much of the recent psychophysical literature.
Note that a null appears in each of the three chrominance equations. The location of this null in object spacedepends on the state of adaptation of the eye. When transferring the chrominance equations to this color spaceunder dark adapted conditions, the null in the equation for Q occurs at 572 nm. The null in the equation for Poccurs at 494 nm and that for O occurs near 395 nm. These values are shown by the long dashed lines.
This cubic form shows unambiguously how the perception of "white" is achieved [17.3]. When O = P = Q = 0,there are no chrominance signals to transfer from the retina to the brain. However, the luminance channel usesdifferent mathematics. A luminance signal is still present and it is transferred to the brain. The above equationdefines the “white point,” W. Based on the above determinations, the “white point” for a tetrachromat occurs atthe intersection of 395, 494 and 572 nm using the folded spectrum locus as a scale. Note that this point is notdescribed by the sum of any signals. It is described by the condition where the three difference equations are allequal to zero. This color space differs fundamentally from the conventional assumption of additive color. Additivecolor assumes that white is described by the sum of the intensities associated with a group of spectral terms.
Since the O–, P– & Q– signals are nearly linearly related to wavelength and all are equal to zero at the intersectionW, considering this point a displaced zero within the conformal space is convenient. As a result, any color can beuniquely described using its O–, P– & Q– coordinate values.
The absorption of the lens restricts the spectral performance of the human eye at wavelengths shorter than 395–400 nm as shown. 395 nm will be used at the nominal limit as a convenient equality with the above null in theO–channel. As a result, the human subject only uses the color spectrum within a narrower parallelopiped enclosedby 395, 437, 532 and 655 nm. Technically, a human can perceive individual colors at any point within thisvolume. However, good discrimination performance in the region between 395 and 437 nm requires daylightillumination (or an artificial source at an optimum color temperature of 7053 Kelvin).
Since a three-dimensional color space is more difficult to manipulate, and addition of a luminance axis leads to afourth dimension, seeking a two-dimensional presentation is useful. However a two-dimensional representation ofa three-dimensional space is by definition non-conformal. (c) shows a degenerate form of the color cube thatprovides a 2-dimensional color space compatible with the conventional interpretation of a trichromat. This spaceextends beyond the spectral peak at 437 nm to support the perceptual color space extending to 395 nm. Thisextension from 437 to 395 nm is not continuous with the lower part of the figure. While both sections areconformal, no conformality exists across the 437 nm line. Note the difference in coloration at wavelengths lessthan 437 nm. A constant color is shown horizontally for each wavelength. A theoretical “white” cannot be shownexplicitly as a single point in this representation. A true white would be represented by a simultaneous null at both395, 572 nm and 494,572 nm. (D) shows a pseudo-color cube that is easier to work with where a truerrepresentation is needed. It folds the spectral locus at 437 nm but keeps it in-plane. It applies to the completetetrachromat and shows its complete perceptual color space on a flat surface. As in (C), the left and right sectionsof the figure are conformal. Here again, no conformality exists across the vertical spectral line. Theoretical“white” cannot be shown explicitly as a single point in this representation either.

Tutorial on Biological Vision- 93
Figure 9.1.3-1 Formation of candidate conformal color spaces. A; the spectral locus from 300 to 655 nm used as anumber line. B; the spectral locus bent at 532 nm to form a plane and bent again out of that plane at 437 nm to forma “color cube.” C; the spectral locus bent at 532 nm as above but not bent at 437 nm. This configuration contains adiscontinuity along the 437 nm axis. The spectrum is truncated at 395 nm for convenience. D; the spectral locus bentat 532 nm to form a plane and bent again at 437 nm but staying in-plane.
9.1.3.3 A new physiologically based chromaticity diagram for research

94 Guide to Processes in Biological Vision
A New Chromaticity Diagram for Research can be prepared using absolute scales in a rectilinear two-dimensionalgraph space with minimum compromise [17.3.3]. However, several caveats must be attached to the figure.
First, the color space only applies to blocked tetrachromats (primarily chordates with ocular globes > 20 mm indiameter). Second, the color space is primarily used for stimuli with half-amplitude full spectral widths greaterthan 50 nm. If multi-modal, each mode of the stimuli will meet the above criteria. Third, when narrower bandstimuli are used in the short wavelength regions, the impact of the O-chrominance channel must be recognized. Fourth, if a color temperature of less than 3600 Kelvin is provided by the ultimate source, filters of any spectralwidth can be used with this diagram.
These caveats are designed to surface the fact that the perceived colors in the spectral region of 400 to 437 nm willdiffer depending on the test circumstance. They depend on the color temperature of the light source and theselection rules used by the brain. The second and fourth caveats insure that the subject will not perceive saturatedpurples at test wavelengths below 437 nm. In the absence of these two caveats, the subject may perceive saturatedpurples correctly.
With these caveats, the resulting complete graph of perceived color by humans is shown in Figure 9.1.3-2. Thepresentation is completely conformal except along the discontinuity at 437 nm. This method of presentation of thehuman color gamut does not require the introduction of a “purple line” and there are no “non-spectral colors.” Saturated magenta, for instance, is a bimodal color obtained by mixing 437 nm radiation and 655 nm radiation.
Note the word perceived in the above paragraph. This is a Diagram of the response of the human eye in perceptualspace, not the nominal stimulus applied to the eye in object space as used to define the CIE Chromaticity Diagram. As presented, it is applicable to the nominal eye under dark adapted conditions. This state of adaptation ispresumed to be the same as that achieved when viewing an equal quanta per unit wavelength source, e. g., a“daylight” source with a color temperature of 7053 Kelvin for the normal human eye.
Using this presentation format, the wavelength scales are linear and the field of the graph is conformal. All ofMacAdam’s circles (ellipses in CIE color space) remain circles in this presentation [17.3.3]. A unique color can bedefined precisely and unequivocally using only two wavelength numbers. Furthermore, the result of adding twolights of known spectral distribution can be determined using simple arithmetic and geometry.
In practice, white is always perceived at one point, the point where the value of both P and Q are zero. Aperception of pure white can be obtained by mixing only two monochromatic spectral wavelengths, 494 and 570nm, in object space under dark (and presumably equal flux) adaptation. A perception of white can also be obtainedby mixing any two lights having means applicable to their spectral distributions that equal 494 and 570 nm. TheC.I.E. Chromaticity Diagrams are misleading in this area because of their lack of conformality. Therefore, theconventional practice is to use three lights and vary their relative intensity levels until the condition P = Q = 0 isobtained empirically.
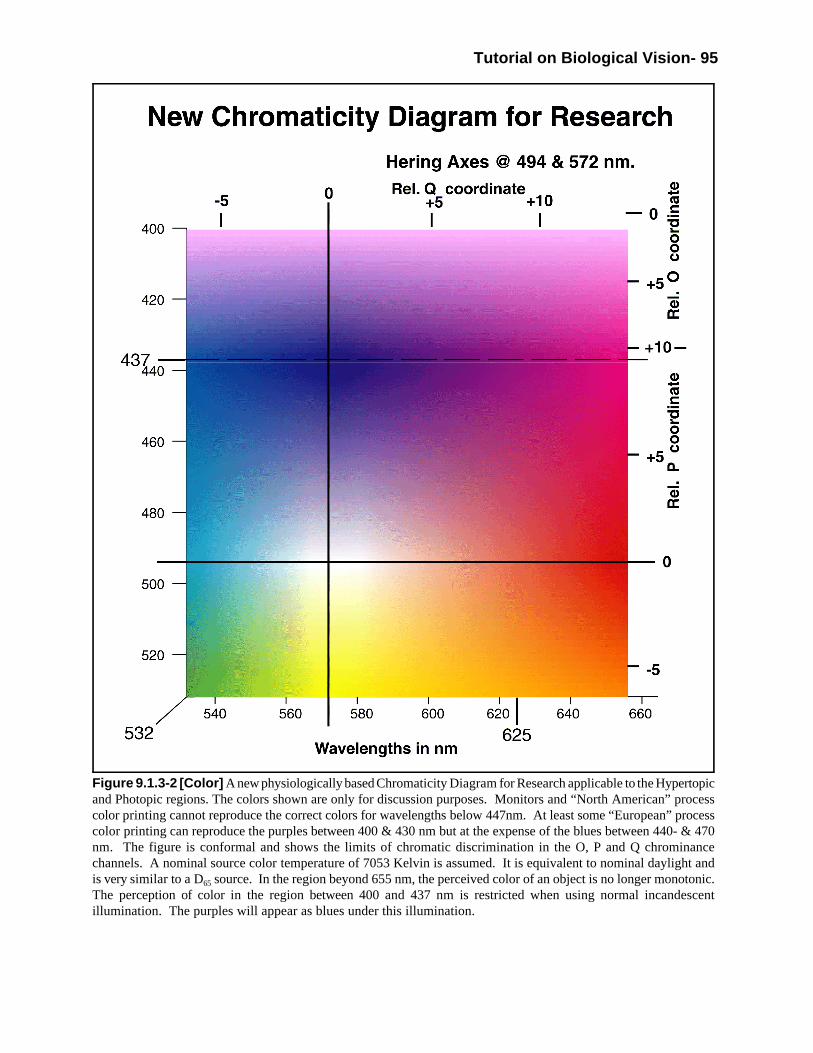
Tutorial on Biological Vision- 95
Figure 9.1.3-2 [Color] A new physiologically based Chromaticity Diagram for Research applicable to the Hypertopicand Photopic regions. The colors shown are only for discussion purposes. Monitors and “North American” processcolor printing cannot reproduce the correct colors for wavelengths below 447nm. At least some “European” processcolor printing can reproduce the purples between 400 & 430 nm but at the expense of the blues between 440- & 470nm. The figure is conformal and shows the limits of chromatic discrimination in the O, P and Q chrominancechannels. A nominal source color temperature of 7053 Kelvin is assumed. It is equivalent to nominal daylight andis very similar to a D65 source. In the region beyond 655 nm, the perceived color of an object is no longer monotonic.The perception of color in the region between 400 and 437 nm is restricted when using normal incandescentillumination. The purples will appear as blues under this illumination.

96 Guide to Processes in Biological Vision
9.1.3.4 The definition of Unique Colors and color axes
A long-standing problem exists in attempting to name the colors perceived based on narrowband (nominallymonochromatic) and broadband sources. Similarly, an argument has persisted since the 1900's concerning theprincipal axes of the perceived human color space. These two problems will be addressed in sequence.
Many authors have attempted to define unique colors in the past. Their starting point was invariablypsychophysically-based or semantics-based. The physiologically-based color space defined above provides a set ofcolor coordinates tied directly to the physics-based spectrum of vision. Colors defined in this way are truly unique. Look first at monochromatic sources. The lower right frame of Figure 9.1.3-2 provides an opportunity to define adefendable set of unique colors. These colors can be defined in terms of their monochromatic wavelength or themean of their broader irradiation spectrum. Six “unique color” points appear on the new chromaticity diagram. They can be associated with the common names, white, green, aqua, yellow, red & either blue or violet [17.3.4]. The last option between blue and violet is important and will be addressed below.
The definition of these six colors is based on the geometry of the new chromaticity diagram that, in turn, relatesdirectly to the signal manipulation within the retina. Four of the six colors are related to nulls in one of the twochrominance channels and one of them is due to a null in both chrominance channels. The easiest to definemathematically are those occurring along the axes. The following precise wavelength values are subject torefinement in the laboratory. They can be considered accurate within +/- 2 nm. Also given are the approximateMunsell hue coordinates, at high saturation (but not constant numerical saturation), of these unique colors [17.3.5]. These hue values are also subject to refinement in the laboratory and will be discussed further below. These uniquecolors are defined here:
+ Unique green (at the intersection of the vertical and horizontal axes, 532 nm, Munsell value 3G),
+ Unique aqua (at 494 nm on the vertical axis and 532 nm on the horizontal axis, Munsell value 5BG), and
+ Unique yellow (at 532 nm on the vertical axis and 572 nm on the horizontal axis, Munsell value 10Y).
The next obvious unique color is white. It is represented functionally by null signals in both of the chrominancechannels. This occurs on the diagram at:
+ Unique white (ordinate value of 494 nm and abscissa value of 568 nm, Munsell value undefined).
The final two values are more difficult to define. Several criteria can be used. The criteria are not the same forboth cases.
Temporarily overlook the discontinuity associated with the New Chromaticity Diagram for Research at 437 nm. The most saturated spectral blue perceived by most observers occurs near the peak in the S–channel at 437 nm. Onthe other hand, the perceived spectral color at 395 nm is unsaturated (based on very limited data) and will belabeled lilac. Between these two spectral wavelengths is a region of higher saturation best described as purple.
Using these labels, two more colors can be defined.
+ Unique Blue (ordinate value of 437 nm and abscissa value of 532 nm, Munsell value of 10B)
+ Unique violet (ordinate value 437 nm and abscissa value of 572 nm, Munsell value of 10PB)
Discussing the precise colors perceived in the region between 395 and 437 nm is difficult based on the literature.

Tutorial on Biological Vision- 97
This is partly because of the inadequate color temperature of the light used in most psychophysical experiments. Only museums seem to take pains to insure a color temperature source adequate to reproduce deep purples in theworks of the old masters.
A problem also occurs in defining unique colors with respect to the red region of the spectrum. A need exists todefine both a spectral red and the red associated with the end of the 494 nm axis. In conformity with the abovenomenclature, unique red can be defined with respect to the spectral peak in the absorption of the L–channel. Thisoccurs at a nominal 625 nm. However, most people perceive this color as distinctly orangish. A better definitionwould be to define red based on its dominant wavelength. Beyond 655 nm, the color of the perceived radiationbecomes less red and more orange.
+ Unique Red (ordinate value 532 nm and abscissa value of 655 nm, Munsell value of approximately 2YR) Based on the above definition, a red at 494,655 nm needs to be defined. For reasons that will be discussed below,this red will be labeled Hering red.
+ Hering Red (ordinate value 494 nm and abscissa value of 655 nm, Munsell value of approximately 5R)
Following the above logic to its conclusion should define a unique magenta. However, another problem surfaces. Should the short wavelength ordinate be at 437 nm or at 395 nm? At this time, an arbitrary choice will be madebased on common usage. Magenta will be defined as a mixture of blue and red.
+ Unique Magenta (ordinate value 437 nm and abscissa value of 655 nm, Munsell value of approximately 6RP)
The color mauve will be defined at the intersection 395,655.
+ Unique Mauve (ordinate value 395 nm and abscissa value of 655 nm, Munsell value of approximately 2RP)
As discussed below, the distinction between Magenta and Mauve becomes important in printing using “processcolor.”
The above definitions apply to essentially monochromatic “colors.” These can be obtained using high intensitybroadband sources and narrowband filters (of only a few nanometers width). When it is desired to work with lessspectrally pure illumination, a more complete set of definitions are needed to explicitly define the colors perceivedby humans. These specifications appear in Section 17.3.4 in the supporting document. A variety of auxiliary axescan also be used with the New Chromaticity Diagram for Research [17.3.3]. The above color space and uniquecolors can also be compared with a variety of other color spaces appearing in the literature [17.3.5]
Munsell made a fortunate choice in the 1900's. He subdivided his color circle into ten equally spaced sectors andthen assigned names to them. These sectors were independent of any theoretical axes promoted by the visionresearch community. As noted in the above definitions, his major radial axes conform very well to thephysiological color space of human vision.
The above definitions provide a clear distinction between the so-called Young-Helmholtz and Hering axes of thehuman color space. Both sets of axes are defined relative to the white point at 494,572 nm. The Hering axes areuniquely defined based on the physiology of vision (although not in the way Hering proposed). The Hering axescorrespond to the null conditions, P = 0.00 (ordinate of 494 nm) and Q = 0.00 (abscissa of 572 nm). They arenamed based on the above definitions; the “Hering Red”-Aqua axis and the yellow-violet axis. A label such asyellow-blue does not describe the Hering axis correctly.
The correlation of the physiological color space with the Young-Helmholtz axes is more difficult. The colorsassociated with these axes have never been defined precisely. The axes are conceptually defined based on their
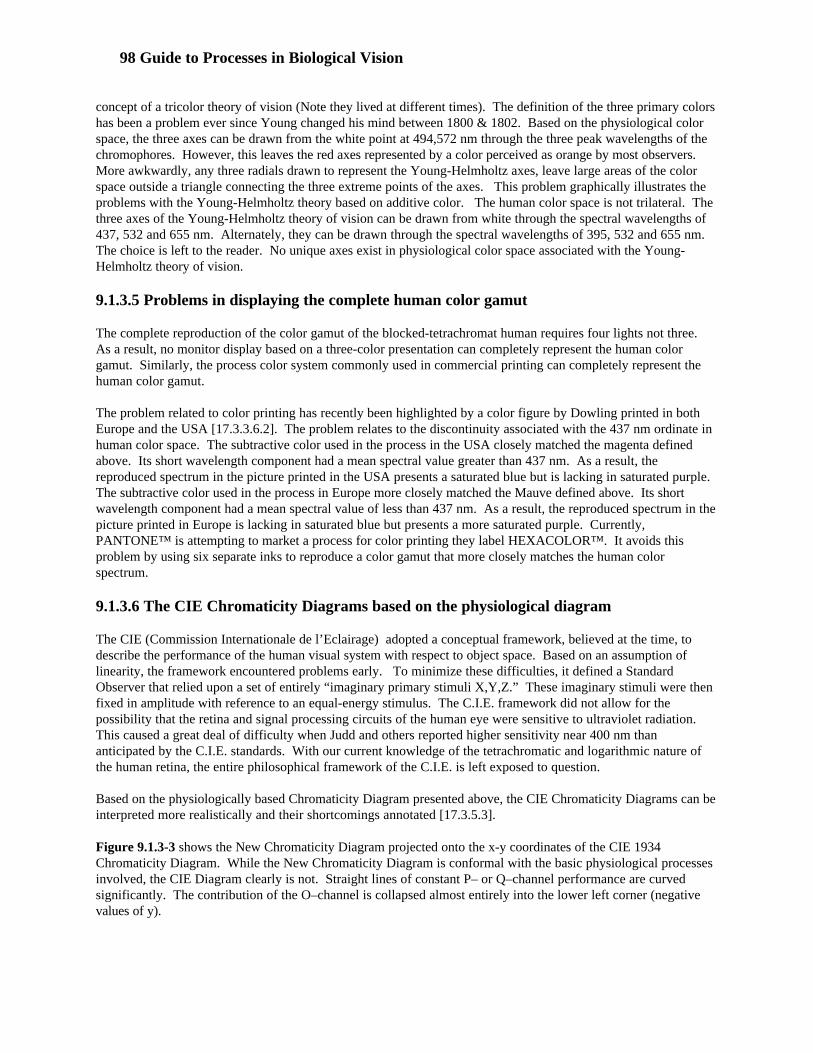
98 Guide to Processes in Biological Vision
concept of a tricolor theory of vision (Note they lived at different times). The definition of the three primary colorshas been a problem ever since Young changed his mind between 1800 & 1802. Based on the physiological colorspace, the three axes can be drawn from the white point at 494,572 nm through the three peak wavelengths of thechromophores. However, this leaves the red axes represented by a color perceived as orange by most observers. More awkwardly, any three radials drawn to represent the Young-Helmholtz axes, leave large areas of the colorspace outside a triangle connecting the three extreme points of the axes. This problem graphically illustrates theproblems with the Young-Helmholtz theory based on additive color. The human color space is not trilateral. Thethree axes of the Young-Helmholtz theory of vision can be drawn from white through the spectral wavelengths of437, 532 and 655 nm. Alternately, they can be drawn through the spectral wavelengths of 395, 532 and 655 nm. The choice is left to the reader. No unique axes exist in physiological color space associated with the Young-Helmholtz theory of vision.
9.1.3.5 Problems in displaying the complete human color gamut
The complete reproduction of the color gamut of the blocked-tetrachromat human requires four lights not three. As a result, no monitor display based on a three-color presentation can completely represent the human colorgamut. Similarly, the process color system commonly used in commercial printing can completely represent thehuman color gamut.
The problem related to color printing has recently been highlighted by a color figure by Dowling printed in bothEurope and the USA [17.3.3.6.2]. The problem relates to the discontinuity associated with the 437 nm ordinate inhuman color space. The subtractive color used in the process in the USA closely matched the magenta definedabove. Its short wavelength component had a mean spectral value greater than 437 nm. As a result, thereproduced spectrum in the picture printed in the USA presents a saturated blue but is lacking in saturated purple. The subtractive color used in the process in Europe more closely matched the Mauve defined above. Its shortwavelength component had a mean spectral value of less than 437 nm. As a result, the reproduced spectrum in thepicture printed in Europe is lacking in saturated blue but presents a more saturated purple. Currently,PANTONE™ is attempting to market a process for color printing they label HEXACOLOR™. It avoids thisproblem by using six separate inks to reproduce a color gamut that more closely matches the human colorspectrum.
9.1.3.6 The CIE Chromaticity Diagrams based on the physiological diagram
The CIE (Commission Internationale de l’Eclairage) adopted a conceptual framework, believed at the time, todescribe the performance of the human visual system with respect to object space. Based on an assumption oflinearity, the framework encountered problems early. To minimize these difficulties, it defined a StandardObserver that relied upon a set of entirely “imaginary primary stimuli X,Y,Z.” These imaginary stimuli were thenfixed in amplitude with reference to an equal-energy stimulus. The C.I.E. framework did not allow for thepossibility that the retina and signal processing circuits of the human eye were sensitive to ultraviolet radiation. This caused a great deal of difficulty when Judd and others reported higher sensitivity near 400 nm thananticipated by the C.I.E. standards. With our current knowledge of the tetrachromatic and logarithmic nature ofthe human retina, the entire philosophical framework of the C.I.E. is left exposed to question.
Based on the physiologically based Chromaticity Diagram presented above, the CIE Chromaticity Diagrams can beinterpreted more realistically and their shortcomings annotated [17.3.5.3].
Figure 9.1.3-3 shows the New Chromaticity Diagram projected onto the x-y coordinates of the CIE 1934Chromaticity Diagram. While the New Chromaticity Diagram is conformal with the basic physiological processesinvolved, the CIE Diagram clearly is not. Straight lines of constant P– or Q–channel performance are curvedsignificantly. The contribution of the O–channel is collapsed almost entirely into the lower left corner (negativevalues of y).
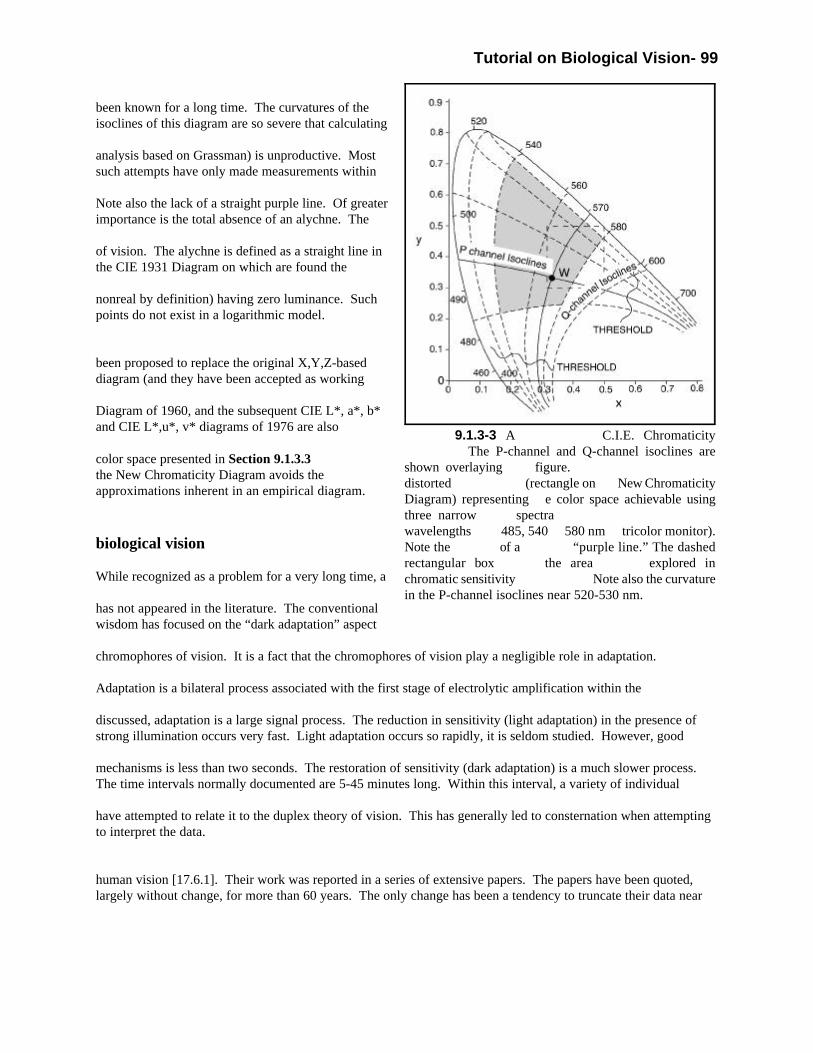
Tutorial on Biological Vision- 99
9.1.3-3 A C.I.E. Chromaticity The P-channel and Q-channel isoclines are
shown overlaying figure.distorted (rectangle on New ChromaticityDiagram) representing e color space achievable usingthree narrow spectrawavelengths 485, 540 580 nm tricolor monitor).Note the of a “purple line.” The dashedrectangular box the area explored inchromatic sensitivity Note also the curvaturein the P-channel isoclines near 520-530 nm.
been known for a long time. The curvatures of theisoclines of this diagram are so severe that calculating
analysis based on Grassman) is unproductive. Mostsuch attempts have only made measurements within
Note also the lack of a straight purple line. Of greaterimportance is the total absence of an alychne. The
of vision. The alychne is defined as a straight line inthe CIE 1931 Diagram on which are found the
nonreal by definition) having zero luminance. Suchpoints do not exist in a logarithmic model.
been proposed to replace the original X,Y,Z-baseddiagram (and they have been accepted as working
Diagram of 1960, and the subsequent CIE L*, a*, b*and CIE L*,u*, v* diagrams of 1976 are also
color space presented in Section 9.1.3.3the New Chromaticity Diagram avoids theapproximations inherent in an empirical diagram.
biological vision
While recognized as a problem for a very long time, a
has not appeared in the literature. The conventionalwisdom has focused on the “dark adaptation” aspect
chromophores of vision. It is a fact that the chromophores of vision play a negligible role in adaptation.
Adaptation is a bilateral process associated with the first stage of electrolytic amplification within the
discussed, adaptation is a large signal process. The reduction in sensitivity (light adaptation) in the presence ofstrong illumination occurs very fast. Light adaptation occurs so rapidly, it is seldom studied. However, good
mechanisms is less than two seconds. The restoration of sensitivity (dark adaptation) is a much slower process. The time intervals normally documented are 5-45 minutes long. Within this interval, a variety of individual
have attempted to relate it to the duplex theory of vision. This has generally led to consternation when attemptingto interpret the data.
human vision [17.6.1]. Their work was reported in a series of extensive papers. The papers have been quoted,largely without change, for more than 60 years. The only change has been a tendency to truncate their data near

100 Guide to Processes in Biological Vision
20 minutes. This practice avoids needing to address the awkward fact that the traces show a distinctive rise(relative to a smooth curve drawn through the points) before continuing to decrease. These rises are key tounderstanding the operation of the dark adaptation mechanisms.
In their 1937 paper, they detail five special points regarding their test arrangements. One of the most important isthat their measurements do not represent the absolute threshold of visibility. They suggest the test illuminationintensity was about three times threshold. They did not discuss how they determined the factor of three. Aprecision error of 300% is a large factor in modern laboratory measurements. They also describe several piecewiseadjustments to bring their data into better conformity. They used a “violet filter” and a “red filter.” They describetheir adapting light as “whole (white) light” and say their light source was a flashlight bulb operating at 3.8 voltsand 0.28 amperes. It would be expected that the color temperature of this bulb is near 2400 K.
By today’s standards, their instrumentation, conception of the operation of the eye, and protocols were primitive. They expected the violet light to provide the greatest and the red light to provide the least definition between theirputative cone and rod threshold sensitivity. However, their findings did not support that assertion. They said:“Nevertheless, even with red light, rod adaptation makes its appearance.” This characteristic has been confirmedoften subsequently. Each individual spectral channel exhibits an adaptation characteristic of its own.
Although later references to the work of these authors frequently refer to the two branches of the typical adaptationcharacteristic in humans as related to two separate photoreceptor types, the “rods” and “cones,” these authors alsointroduced another regime. Quoting from their 1937 paper; “There are two types of rod dark adaptation, a rapidand a delayed, which are probably the manifestations of two methods of formation of visual purple in the rods afterits bleaching by the pre-adaptation lights.” Here, the generic term rods should be replaced by the termphotoreceptor cells. The speculation concerning two methods of chromophore formation can be replaced with adescription of the adaptation amplifier performance. The difference between their rapid and delayed response(which does not relate to the chromophores) can be explained in detail based on the adaptation amplifier of the PCand its electrostenolytic power supply.
The knowledge available at the time did not support a detailed explanation of the underlying mechanisms involvedin sensitivity recovery (dark adaptation). Lacking such an explanation, the variation in the responses as a functionof prior adaptation, of position in the retina and of color of the stimulus was quite baffling. This predicament wasenhanced by the tendency in the community to normalize data with respect to time zero. In their early work,Hecht, et. al. frequently drew trend lines through their data that did not intersect. At other times, the trend lineswere connected to form a sharp corner. When drawn in the latter form, their presentations suggest the presence oftwo separate exponential like sections to the response. However, where amplitude scales are provided, it is seenthat the curves are not simple exponentials. A close look at the underlying mathematics of the process shows thetwo branches are not due to separate mechanisms.
9.1.4.1 Overview
By examining the overall block diagram of the visual process, and the individual mechanisms discussed above, thephenomenon of dark adaptation can be placed in perspective. Understanding the operation of the adaptationamplifiers of the photoreceptor cells are key to understanding this characteristic [17.6.1]. Figure 9.1.4-1 providesa physiological description of the photodetection process related to adaptation. It shows only a portion of [Figure5.2.1-1], with emphasis on the adaptation amplifier and its power supply. The power supply consists of anelectrostenolytic process (described by circuit element R2). This process transfers charge to the axon capacitance,CA. Charge on this capacitor is drawn off only through the Activa. The diffusion through, and concentrationwithin, the IPM of reactants in the electrostenolytic process are described by elements C2 through C4 and R3 & R4. After an extended period in the dark, the potential VC equals – 154 mV.
The following points should be recalled from earlier sections in this work:
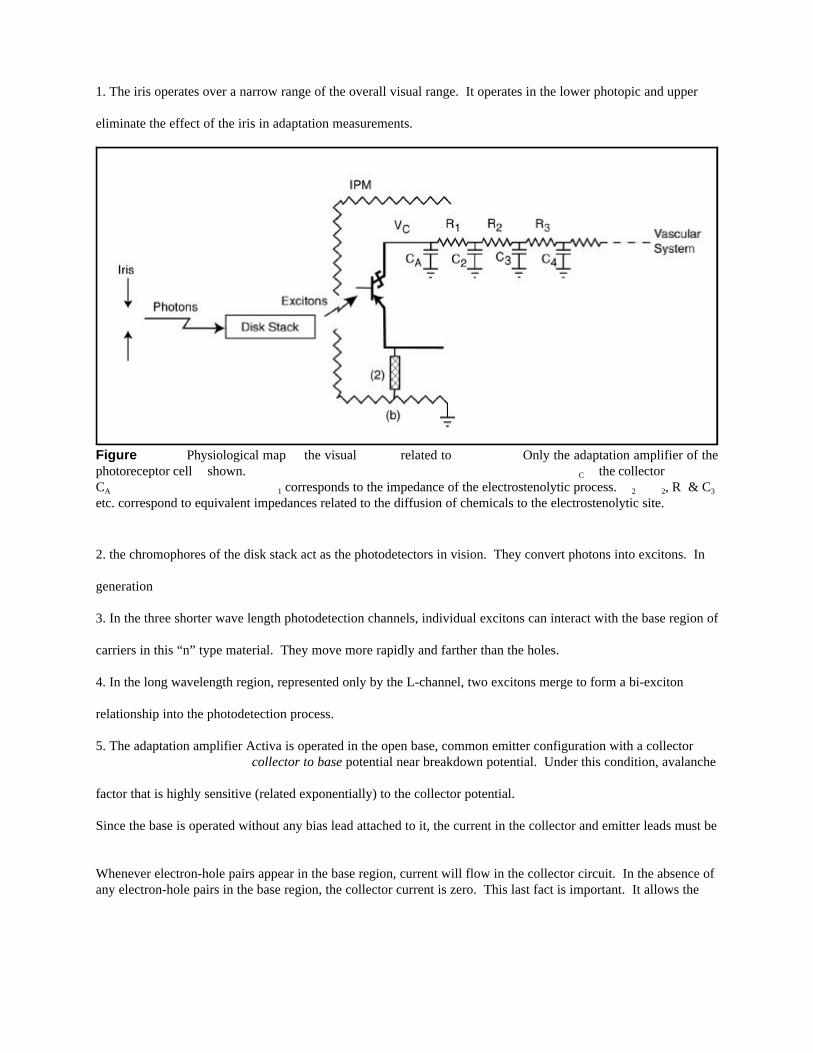
Figure Physiological map the visual related to Only the adaptation amplifier of thephotoreceptor cell shown. C the collector CA 1 corresponds to the impedance of the electrostenolytic process. 2 2, R & C3
etc. correspond to equivalent impedances related to the diffusion of chemicals to the electrostenolytic site.
1. The iris operates over a narrow range of the overall visual range. It operates in the lower photopic and upper
eliminate the effect of the iris in adaptation measurements.
2. the chromophores of the disk stack act as the photodetectors in vision. They convert photons into excitons. In
generation
3. In the three shorter wave length photodetection channels, individual excitons can interact with the base region of
carriers in this “n” type material. They move more rapidly and farther than the holes.
4. In the long wavelength region, represented only by the L-channel, two excitons merge to form a bi-exciton
relationship into the photodetection process.
5. The adaptation amplifier Activa is operated in the open base, common emitter configuration with a collectorcollector to base potential near breakdown potential. Under this condition, avalanche
factor that is highly sensitive (related exponentially) to the collector potential.
Since the base is operated without any bias lead attached to it, the current in the collector and emitter leads must be
Whenever electron-hole pairs appear in the base region, current will flow in the collector circuit. In the absence ofany electron-hole pairs in the base region, the collector current is zero. This last fact is important. It allows the
102 Guide to Processes in Biological Vision
precision.
The performance of the adaptation circuit changes very rapidly during the initial time of illumination (lightadaptation). The illumination causes a rapid rise in current through the collector of the Activa. This currentlowers the collector potential rapidly as it discharges the axon capacitance. As this potential falls, the avalanche-gain of the collector also drops exponentially. As a result, the overall gain of the system falls with a time constantmeasured in fractions of a second.
Operation of the adaptation circuit is different during sensitivity recovery (dark adaptation). The axon capacitanceis recharged more slowly through resistance, R1. As long as the potential on C3 is equal to the potential on C4, theload impedance consists of only R1 and CA. The circuit shows an exponential recovery following the cessation ofillumination. This time constant is measured in minutes (8-12 minutes). However, if the potential on C3 fallsbelow that on C4, the overall circuit is represented by a third order differential equation. The solution to a thirdorder equation is the product of an exponential and a sinusoid as will be developed below. The period of thesinusoid is also measured in minutes (12-24 minutes)
9.1.4.2 Mathematics of the dark adaptation process
Understanding the operation of the adaptation process is complicated by the protocol of the psychophysiologist. Instead of measuring the output waveform of the process as a function of input intensity, they typically measure theinput intensity required to achieve a perceived visual threshold. As a result, the input intensity profile exhibits ahyperbolic form. This form is described by the input intensity = perceived threshold divided by the amplificationof the signal channel, where the amplification changes as a function of time. Extracting the time constants of theunderlying mechanisms is difficult based on this hyperbolic form of presentation. The time constant correspondsto the time when the signal amplitude is equal to 158% of its terminal value.
Four separate mechanisms are found to participate in sensitivity recovery. First, a finite delay exists in the P/DEquation following the cessation of illumination. This cessation is followed by an exponential decline in photocurrent in the base region of the adaptation amplifier. The time constant of this decay can become several secondsfor illumination levels below the Hodgkin solution (in the scotopic and mesopic regions). On the other hand, it ismeasured in milliseconds at photopic levels. Without an artificial iris, the opening of the iris must also beconsidered when recovering from high retinal illumination levels. The time constant of this opening is typicallysix seconds and the amplitude change is nominally 16:1. The above factors influence the response within a fewseconds of a light level change.
The remaining adaptation factors typically exhibit time constants of minutes. The next factor in sensitivityrecovery involves the charging time constant of the adaptation amplifier collector circuit. Following high levels ofillumination, the collector potential is near –22 mV. If the eye is subjected to no illumination, no current will flowthrough the adaptation collector. The restoration of the nominal –154 mV of the adaptation collector in the darkcan only be accomplished through the charging of the axon capacitance by the electrostenolytic power supplycircuit. This circuit involves both a chemical reaction and the chemical diffusion required to support the reaction. The overall circuit, including the impedance of the electrostenolytic process and the collector capacitance, can berepresented by a third order differential equation. The potential of the collector is described by the solution of thisdifferential equation. The solution of third order differential equation has the form;
z = (1-e–at) (1– b•e–at •sine ωt) b is a constant dependent on the pre-adaptation level
This form is frequently described as a damped sinusoid when the time constant 1/a is much longer than the period1/ω. In vision, the time constant is frequently shorter than, or similar to, the period and the expression will bedescribed as an exposine (a sinusoidally modulated exponential).
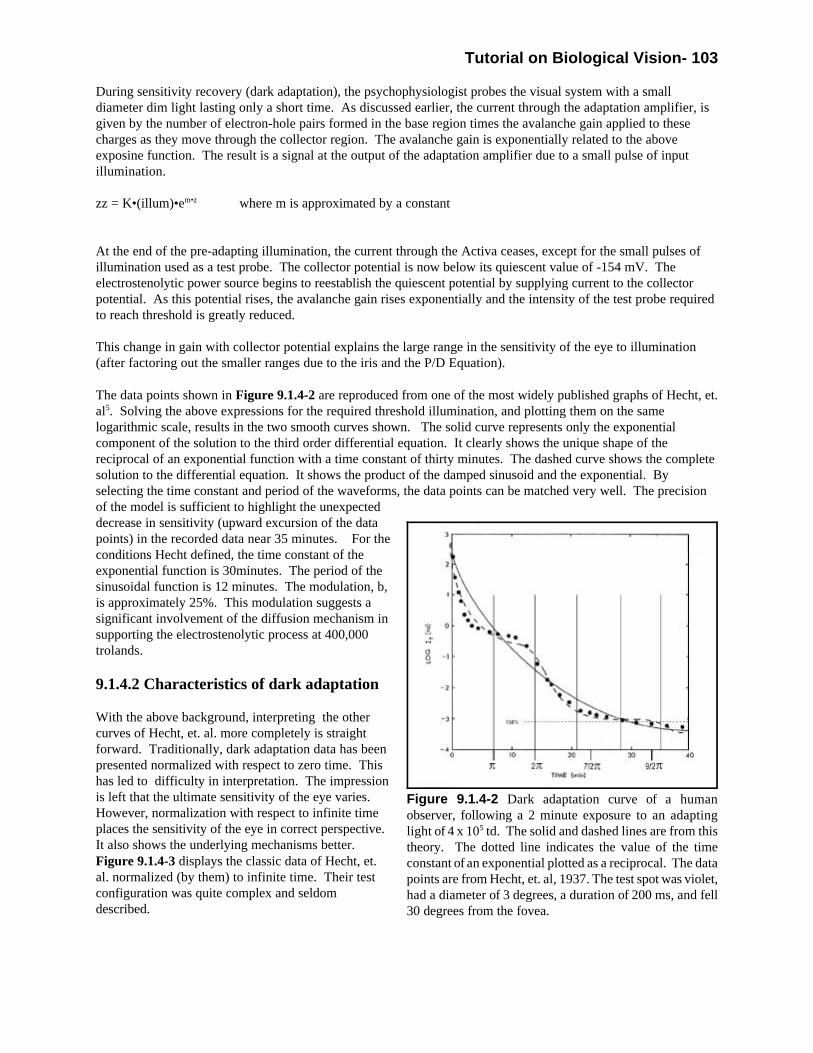
Tutorial on Biological Vision- 103
Figure 9.1.4-2 Dark adaptation curve of a humanobserver, following a 2 minute exposure to an adaptinglight of 4 x 10⁵ td. The solid and dashed lines are from thistheory. The dotted line indicates the value of the timeconstant of an exponential plotted as a reciprocal. The datapoints are from Hecht, et. al, 1937. The test spot was violet,had a diameter of 3 degrees, a duration of 200 ms, and fell30 degrees from the fovea.
During sensitivity recovery (dark adaptation), the psychophysiologist probes the visual system with a smalldiameter dim light lasting only a short time. As discussed earlier, the current through the adaptation amplifier, isgiven by the number of electron-hole pairs formed in the base region times the avalanche gain applied to thesecharges as they move through the collector region. The avalanche gain is exponentially related to the aboveexposine function. The result is a signal at the output of the adaptation amplifier due to a small pulse of inputillumination.
zz = K•(illum)•em•z where m is approximated by a constant
At the end of the pre-adapting illumination, the current through the Activa ceases, except for the small pulses ofillumination used as a test probe. The collector potential is now below its quiescent value of -154 mV. Theelectrostenolytic power source begins to reestablish the quiescent potential by supplying current to the collectorpotential. As this potential rises, the avalanche gain rises exponentially and the intensity of the test probe requiredto reach threshold is greatly reduced.
This change in gain with collector potential explains the large range in the sensitivity of the eye to illumination(after factoring out the smaller ranges due to the iris and the P/D Equation).
The data points shown in Figure 9.1.4-2 are reproduced from one of the most widely published graphs of Hecht, et.al5. Solving the above expressions for the required threshold illumination, and plotting them on the samelogarithmic scale, results in the two smooth curves shown. The solid curve represents only the exponentialcomponent of the solution to the third order differential equation. It clearly shows the unique shape of thereciprocal of an exponential function with a time constant of thirty minutes. The dashed curve shows the completesolution to the differential equation. It shows the product of the damped sinusoid and the exponential. Byselecting the time constant and period of the waveforms, the data points can be matched very well. The precisionof the model is sufficient to highlight the unexpecteddecrease in sensitivity (upward excursion of the datapoints) in the recorded data near 35 minutes. For theconditions Hecht defined, the time constant of theexponential function is 30minutes. The period of thesinusoidal function is 12 minutes. The modulation, b,is approximately 25%. This modulation suggests asignificant involvement of the diffusion mechanism insupporting the electrostenolytic process at 400,000trolands.
9.1.4.2 Characteristics of dark adaptation
With the above background, interpreting the othercurves of Hecht, et. al. more completely is straightforward. Traditionally, dark adaptation data has beenpresented normalized with respect to zero time. Thishas led to difficulty in interpretation. The impressionis left that the ultimate sensitivity of the eye varies. However, normalization with respect to infinite timeplaces the sensitivity of the eye in correct perspective. It also shows the underlying mechanisms better. Figure 9.1.4-3 displays the classic data of Hecht, et.al. normalized (by them) to infinite time. Their testconfiguration was quite complex and seldomdescribed.

104 Guide to Processes in Biological Vision
Figure 9.1.4-3 Recovery of threshold sensitivity for extra-foveal vision (30 degrees temporal from the fixation point).Data normalized to the terminal condition. Data fromHecht, et. al., 1937.
“The eye was first adapted to “white” light for 2 min at the fixed retinal illuminance shown usinga 30 degree diameter field. The “violet” test stimulus consisted of a five degree diameter fieldpresented in 0.2 sec pulses. Both fields were presented in Maxwellian view. For the test stimulusto be treated as visible, the observer had to detect it in a broad black cross. Filled in symbolsindicate that a violet color was apparent at that threshold. Empty symbols indicate a colorlesssensation. The authors estimated the threshold was approximately three times the absolutethreshold.”
The comments of the authors on page 838 show the bafflement encountered. “What is startling, however, is thatcolor is definitely associate with threshold intensities well below those which show no color following adaptation tothe high intensities. We do not know what this means, and whether it is a special property of violet light;” Theexplanation is straight forward now. The color threshold is a characteristic of the CNS and the signal levelreaching the CNS is controlled by the gain of the adaptation amplifier times the intensity of the illumination. Theperception of color is not directly related to the intensity of the stimulus.
The figure has been redrawn to show the very high intensity level associated with the 400,000 troland test versusthe lower intensity tests. For this figure, the potential change in sensitivity due to the iris opening is presented inthis trace. It operates with a six-second time constant during the first part of the response. Its amplitudecontribution is suggested by the location of the horizontal line about one order of magnitude below the initial value.
Interpreting the figure begins by noting the lowertrace. It was the result of a very low intensity pre-adapting light. It is suggested that the iris played norole in this response and that the collector capacitorwas recharged without significant impact on thediffusion parameters supporting the electrostenolyticpower source. As a result, the response resembles areciprocal of an exponential function. The timeconstant of this trace is between eight and tenminutes. As the intensity of the pre-adaptingillumination is raised, the operation of the iris comesinto play (unless replaced by a fixed pupil). Moreimportant, the diffusion mechanism comes into playin support of the electrostenolytic process. Theactivity of this mechanism causes the overall circuit tobegin operating as a third order system. The timeconstant related to the exponential begins to increasesince the effective resistive impedance of the powersupply becomes larger. The modulation coefficientrelating to the sinusoidal modulation also begins toincrease. As a result, the individual responses beginto approach the shape of the response at 400,000trolands discussed above. The shoulder for eachwaveform in the figure (the α-break) corresponds tothe first positive peak in the sine wave component ofthe response.
Hecht, et. al. provided data on the variation of sensitivity recovery relative to two other variables. They describedthe sensitivity recovery as a function of color of the pre-adapting light. They also described this sensitivity as afunction of the distance of the pre-adapting light from the line of fixation. This data is easily interpreted in termsof the ability of the interphotoreceptor matrix to support diffusion of the necessary chemicals to the site of the

Tutorial on Biological Vision- 105
electrostenolytic process. It suggests that the impedances R and R3
each other. It also suggests that the value of these impedances varies in a systematic way with location in theretina and the species under study. It also suggests Oguchi’s Disease is related primarily to the low collector
9.1.4.3 The primary role of the iris is to control image quality, not intensity
Because of its prominence, the opening and closing of the iris have long been related to the control of the
50,000:1. Less than 0.1% of this range (about 16:1) is contributed by the iris changing the size of the pupil.
The physiological optics, of each eye, forms a unique wide-angle optical system with a field of more than 114
varies both with distance along the optical axis and radially from that axis. Stiles & Crawford explored the impactof this variation in great detail. However, their empirical results were not related directly to easily understood
different distances from the optical axis, and at different angles relative to the optical axis, did not pass through thesame zone of the retina as their compatriot rays. Instead of all rays from a given spot in object space forming a
spatial resolution and contrast in the image on the retina
The iris is designed to rationalize two requirements [7.4.8]. It is designed to provide maximum light collecting
due to the Stiles-Crawford Effects when examining fine detail at high illumination levels. In humans, minimizingaberration under high illumination conditions is the most important function. The optics of the eyes are essentially
optical system is highly aberrated.
The primary role of the iris is to minimize the diameter of the pupil when the incident light level is adequate. In
the lower limit of the photopic range.
9.1.5 The phenomenon of Color Constancy
this biological vision capability. The capability is intimately related to two features of the visual system. Itdepends on the previously unpublished transfer function of the adaptation amplifier and the logarithmic signal
The goal of each adaptation amplifier is to insure a constant average output signal amplitude at the pedicle of eachphotoreceptor throughout the photopic region of operation. In fact, the photopic region is defined by this property.
feedback into the circuit. Most biological investigators are unfamiliar with internal feedback. It does not use anexternal signal path from the output to the input. Instead, the feedback is achieved internally due to a shared
impedance in the emitter lead of the adaptation amplifier. Because of the high gain in the collector circuit due tothe avalanche effect, this feedback introduces a zero in the transfer function of the amplifier at zero frequency. The
Three consequences arise from this effect. The signal at the output of the pedicle maintains the contrast present inthe original image. However, the signal is largely independent of the absolute light level of the image. The

106 Guide to Processes in Biological Vision
these ratios are now independent of the original average signal levels, the phenomenon of color constancy isperceived.
The mechanism causing color constancy is also the cause of the automatic adjustment of the “white point” underconditions of differential spectral illumination. The adaptation amplifiers associated with a specific spectralchannel operate similarly when their average irradiation level is changed. If an excess of blue light is used toilluminate a scene, The adaptation amplifiers will compensate for this by lowering their amplification factor. As aresult, the signal level at the pedicles of the S–channel photoreceptors will be held at a constant level. Since theselevels have not changed, the chrominance channels will still exhibit nulls in their signals when the average signalsin the different spectral channels are differenced. The brain will perceive a white value in spite of the new averagescene illumination levels See Section 9.1.3.
A tertiary consequence of the zero in the transfer function at zero frequency was discussed earlier. The eyes ofchordates are blind in the absence of tremor.
9.1.6 The contrast performance of the visual system
The contrast performance of the visual system can be described using a variety of protocols. The temporal contrastcan be evaluated at a specific point in the visual field. Alternately, the spatial contrast can be evaluated over aregion centered on a specific point in the visual field. Both modes of evaluation can be defined using a stimulus ofconstant spectral quality or of variable spectral characteristics. The result is a large family of contrast performancecharacteristics. A hidden problem is found in many protocols found in the literature. All visual signals aretranslated into temporal signals for transmission through the visual signals. The temporal response of the visualsystem includes a zero at zero frequency. Therefore, it is very important to document and control any temporalaspects of a test stimulus designed to evaluate the spatial performance of the system. For test signals presented tothe eye for short periods (typically less than ten seconds) the temporal response of the adaptation processintroduces a variable into the experiment. In tests presenting the spatial test stimulus to the eye for an interval ofless than one second, the temporal response associated with the P/D process should also be considered.
Many investigators have failed to perform their experiments at sufficiently low spatial and temporal frequencies todocument the zero signal amplitude at zero frequency in the visual system. This is an intrinsic feature of thesystem. These experimenters frequently describe the visual system as a low pass system rather than a bandpasssystem. In other experiments, spectral signals have been used that are not well matched to the spectral absorptionchannels of vision. Failure to match the spectral channels reduces the contrast and the signal-to-noise ratio in theindividual chrominance channels of the visual system. The interpretation of the results is more difficult underthese conditions.
The contrast performance, particularly the color contrast performance, differs between the foveola and theperipheral retina [17.3.1]. This difference involves intrinsic operating differences between the awareness andanalytical modes of vision. Complexities also arise related to how the information processed by these two modes ismerged in the brain. The results of experiments involving stimuli with a spatial extent of more than 1.2 degreesdiameter centered on the point of fixation can be diluted due to these differences.
9.1.6.1 The (achromatic) contrast temporal frequency transfer function (CTF)
The contrast performance of the visual system in the temporal domain has been studied for a very long time using avariety of methods. Many of these studies occurred without an adequate model of the system, were exploratory incharacter, and appeared at the time to conflict with each other. Most of these conflicts can be resolved when thecomplexity of the achromatic temporal contrast transfer function (CTF) is examined. The key areas of conflictrevolve around inadequate documentation of the low frequency performance of the system and inadequatedocumentation of the light level employed.

Tutorial on Biological Vision- 107
The overall temporal transfer function of the visual system is quite complex [17.6]. Ignoring the operation of the
applied light level).
The most important low frequency limitation on the visual system is due to the load characteristic of the adaptation
varying changes in illumination so that it can operate successfully over a dynamic range of about 107
the signal passband is restricted to frequencies above about f1/2
f1/2 πT).
experiments. This is due primarily to the P/D Process discussed in Section 9.1.1the system at a given level can vary more than two to one due to this parameter alone. Therefore, documentationof the illumination intensity used (and its color temperature) is important. Because of this variation, differences in
When the illumination level is sufficiently high, the bandwidth of the P/D Process and the adaptation circuits aresufficiently high that the limitations due to the Stage 3 propagation circuits become significant.
shows the terms in the modulation transfer function of the visual process as they relate to theabove stages. Note the use of the imaginary operator, j, in the equation.
representing frequency, in the numerator. The form of the equation is that of a high-pass filter. It results from thepresence of a lowpass filter in the feedback path controlling the iris.
associated with the chromophores within the outer segment of each photoreceptor cell. It is the Laplace transformof the transient response developed in [12 & Appen. A]. The denominator contains two terms andone of them is a direct function of the illumination level. A special mathematical case applies when the two time
proposed in 1964.
The stage 2 term also has S in the numerator. This is the term associated with the adaptation amplifier within the
The stage 3 term is that of a lowpass filter. It represents the integrators associated with the stellate cells in thePGN and LGN at the end of the projection circuits associated with the ganglion cells of the retina.
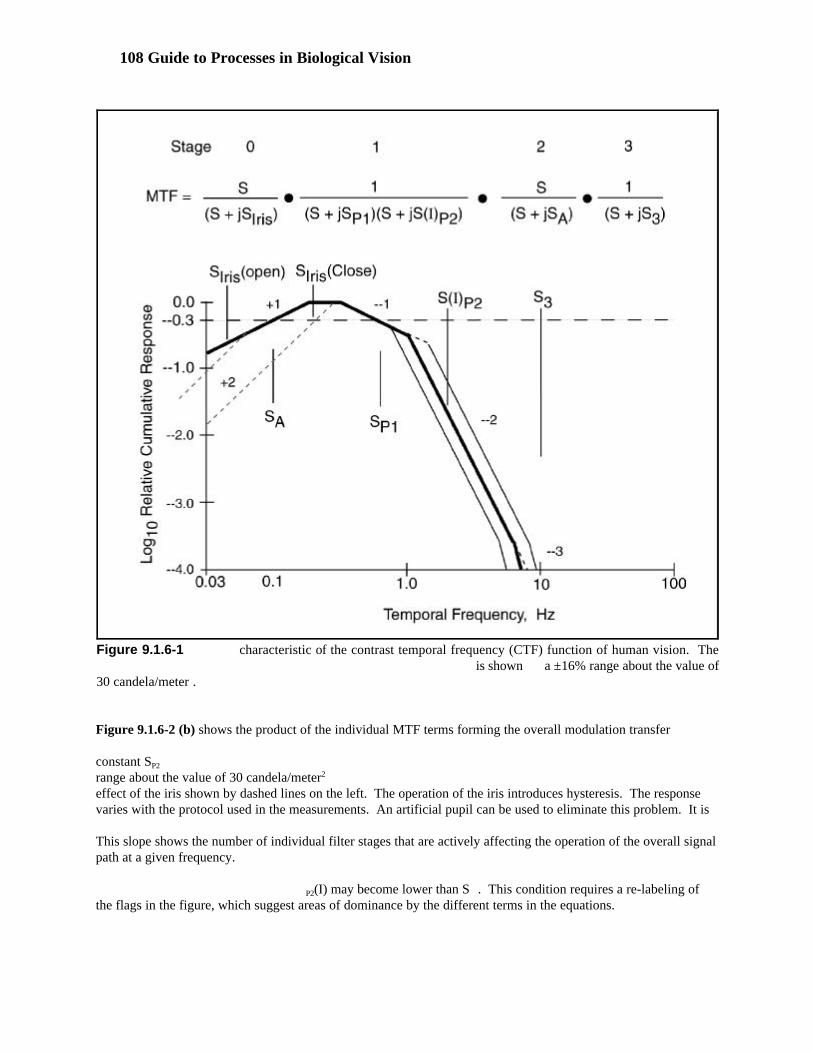
108 Guide to Processes in Biological Vision
Figure 9.1.6-1 characteristic of the contrast temporal frequency (CTF) function of human vision. The is shown a ±16% range about the value of
30 candela/meter .
Figure 9.1.6-2 (b) shows the product of the individual MTF terms forming the overall modulation transfer
constant SP2
range about the value of 30 candela/meter2
effect of the iris shown by dashed lines on the left. The operation of the iris introduces hysteresis. The responsevaries with the protocol used in the measurements. An artificial pupil can be used to eliminate this problem. It is
This slope shows the number of individual filter stages that are actively affecting the operation of the overall signalpath at a given frequency.
P2(I) may become lower than S . This condition requires a re-labeling ofthe flags in the figure, which suggest areas of dominance by the different terms in the equations.

At very low frequencies and illumination ranges where the iris is active, the slope of the overall MTF becomes +2and the visual response falls very rapidly with decreasing frequency. At the higher frequencies, the form of the
P2(I). The form is precisely that
required to recognize the short segment labeled –1. The maximum slope at high frequencies measured in thelaboratory is frequently minus three. However, some experimental data has suggested a slope of minus four or
9.1.6.2 The (achromatic) contrast spatial frequency transfer function (CSF)
The mechanism of tremor provides a method of converting the temporal contrast frequency transfer function (CTF)
with the spatial contrast frequency function of the physiological optics, a complete spatial contrast frequencytransfer function (CSF) is obtained [17.6.3]. This response is frequently labeled the modulation transfer function
Figure 9.1.6-2(a) and . The result shown in the lower part of the figure shows that the slope of the asymptotescan be used to evaluate the character of an equivalent measured function in the laboratory.
eyes for the on-optical-axis condition. A similar situation applies to the foveola at the point of fixation. Thespatial performance of the visual system as a function of frequency is largely independent of the optics of the eye
performance of the optical system falls dramatically.
As mentioned above, the method of presentation of the test stimuli can affect the observed performance
eliminate certain edge effects (Gibb’s Phenomenon) related to square-wave or sinusoidal bar-patterns of finitespatial duration. The techniques are usually based on Gabor Patterns, where the contrast of the overall pattern is
monotonically to zero near the edges (in either one or two dimensions). While the performances are theoreticallydifferent, the practical results have not changed greatly by using the Gabor Patterns [17.6.3].
includes two additional lines presenting the data curves obtained by a recent MODELFESTcarried out over the internet. The diamonds represent data collected using fixed size Gabor patches. The squares
in good agreement with the data collected by that group at a nominal illumination level of 30 cd/m2
illumination, the value of SP2 P1.
slope is only recognizable when the parameters SA P1 or S (I) are separated wellnumerically. At frequencies higher than these frequencies, the slope of the composite function becomes –2. It is
literature. The dip has traditionally been ignored by the computational modelers.

110 Guide to Processes in Biological Vision
Figure 9.1.6-2 Nominal characteristic of the contrast spatial frequency (CSF) function of human vision. The analysisand diagrams apply specifically to the foveola. Top; equation of the overall MTF. Bottom, the overall MTF (heavysolid line) with the time constants changed to represent a real situation. Data points and light lines from MODELFESTdata (see text).
9.1.6.3 The chromatic contrast transfer function (CCF)
Although several investigators have used the term chromatic contrast transfer function (CCF), it has seldom beendefined explicitly. Sometimes it has been used to describe essentially monochromatic temporal or spatialmeasurements. More often, it has been used to describe temporal or spatial measurements based on a broadbandcolor filter. Occasionally, it has been used to describe differential measurements involving two different colorspresented sequentially. The mean wavelength of the filtered light used has seldom been identified. Without thisinformation, interpreting the collected data precisely is difficult.
An additional complication arises in CCF experiments due to the asymmetry of the stage 3 signal projection
circuits. This asymmetry causes a variation in perceived color as a function of time. A test stimulus presented for0.5 seconds is frequently judged to be different from the same stimulus presented for two seconds.
conditions. The preferred experiments would be those evaluating either the P– or Q–channel independently. Thisrequires careful choice of the illumination employed. For the P–channel, the preferred light sources are located
introduce any signal in the Q–channel. Similarly, to evaluate the Q–channel, two light sources well separatedalong the P = 0.00 (494 nm) axis should be chosen. The use of narrow band spectral lights introduce the awkward
or R–, channel unless the amplitudes of the chosen signals are appropriately matched to the luminance function ofthe system. Demonstrating this condition is difficult because the human observer is not able to distinguish a
The model used here can describe the theoretical performance expected under any of the above conditions [17.6.3]. However, the equations become quite complex. As suggested above, the CSF of each color component must be
remains limited at the highest frequencies by the stage 3 terms in the equations and at the lowest frequency by thezeroes associated with the adaptation terms. Section 17.6.3.5 of the supporting work provides the details of the
under specific test conditions.
9.2 Functional Performance related to Perception
References will be provided to more extensive material in the underlying document.
Since the mid 1990's, it has become abundantly clear that the operations of the visual system related to stereopsis,
Brodmann’s notation or V1)[15.1.1].
As shown in , the functions associated with feature extraction, leading to interpretation and perception,are controlled and implemented within the Precision Optical System (POS). The POS consists of the retina,
cerebellum, perform most of the analytical steps related to interpretation and perception (as distinct fromcognition). The vectorized output of these mechanisms are delivered directly to the parietal lobe of the cerebral
map of the subject is still unknown.
A set of block diagrams, schematics, etc of the visual system (updated as of 2003) are available in Section 15.5 & 6
9.2.1 The horopter
The term horopter is used to describe both a conceptual model of the visual function as it relates to object space and
conceptual model. The conceptual model of the horopter has frequently been refined into what is represented as atheoretical model. Measurements designed to confirm the theoretical horopter generally do not. Significant
These deviations, and an improved model will be reviewed in the next section.
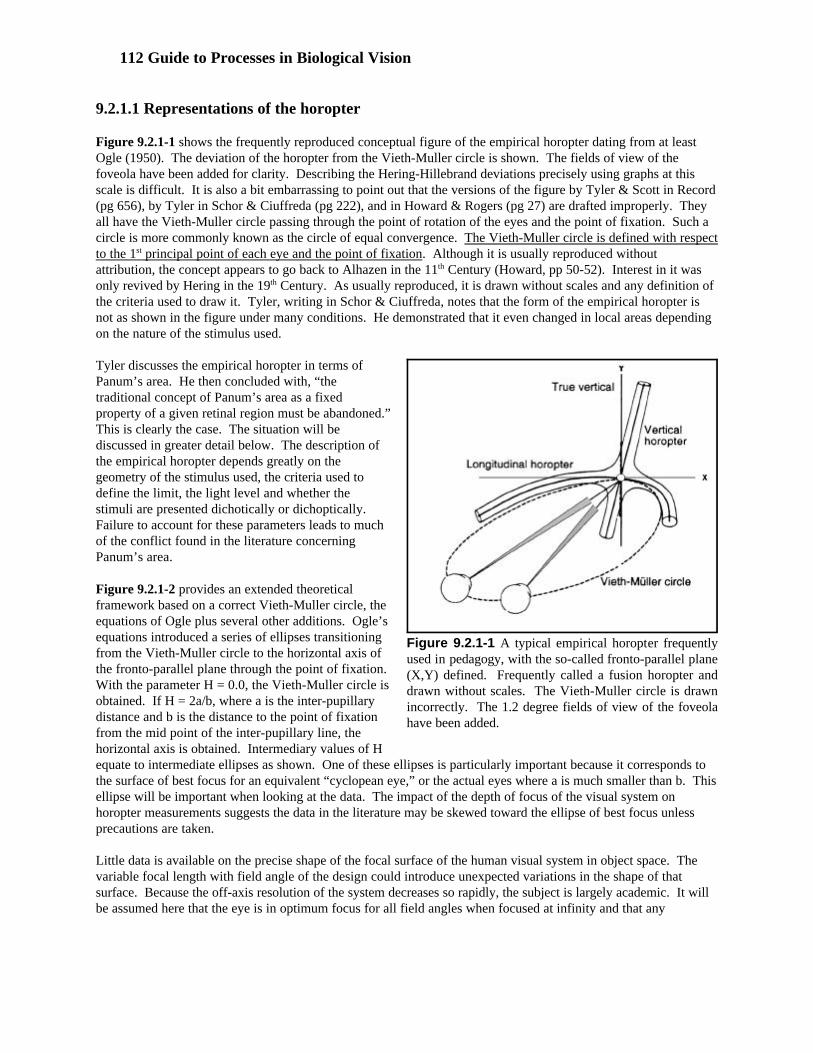
112 Guide to Processes in Biological Vision
Figure 9.2.1-1 A typical empirical horopter frequentlyused in pedagogy, with the so-called fronto-parallel plane(X,Y) defined. Frequently called a fusion horopter anddrawn without scales. The Vieth-Muller circle is drawnincorrectly. The 1.2 degree fields of view of the foveolahave been added.
9.2.1.1 Representations of the horopter
Figure 9.2.1-1 shows the frequently reproduced conceptual figure of the empirical horopter dating from at leastOgle (1950). The deviation of the horopter from the Vieth-Muller circle is shown. The fields of view of thefoveola have been added for clarity. Describing the Hering-Hillebrand deviations precisely using graphs at thisscale is difficult. It is also a bit embarrassing to point out that the versions of the figure by Tyler & Scott in Record(pg 656), by Tyler in Schor & Ciuffreda (pg 222), and in Howard & Rogers (pg 27) are drafted improperly. Theyall have the Vieth-Muller circle passing through the point of rotation of the eyes and the point of fixation. Such acircle is more commonly known as the circle of equal convergence. The Vieth-Muller circle is defined with respectto the 1st principal point of each eye and the point of fixation. Although it is usually reproduced withoutattribution, the concept appears to go back to Alhazen in the 11th Century (Howard, pp 50-52). Interest in it wasonly revived by Hering in the 19th Century. As usually reproduced, it is drawn without scales and any definition ofthe criteria used to draw it. Tyler, writing in Schor & Ciuffreda, notes that the form of the empirical horopter isnot as shown in the figure under many conditions. He demonstrated that it even changed in local areas dependingon the nature of the stimulus used.
Tyler discusses the empirical horopter in terms of Panum’s area. He then concluded with, “thetraditional concept of Panum’s area as a fixedproperty of a given retinal region must be abandoned.” This is clearly the case. The situation will bediscussed in greater detail below. The description ofthe empirical horopter depends greatly on thegeometry of the stimulus used, the criteria used todefine the limit, the light level and whether thestimuli are presented dichotically or dichoptically. Failure to account for these parameters leads to muchof the conflict found in the literature concerningPanum’s area.
Figure 9.2.1-2 provides an extended theoreticalframework based on a correct Vieth-Muller circle, theequations of Ogle plus several other additions. Ogle’sequations introduced a series of ellipses transitioningfrom the Vieth-Muller circle to the horizontal axis ofthe fronto-parallel plane through the point of fixation. With the parameter H = 0.0, the Vieth-Muller circle isobtained. If H = 2a/b, where a is the inter-pupillarydistance and b is the distance to the point of fixationfrom the mid point of the inter-pupillary line, thehorizontal axis is obtained. Intermediary values of Hequate to intermediate ellipses as shown. One of these ellipses is particularly important because it corresponds tothe surface of best focus for an equivalent “cyclopean eye,” or the actual eyes where a is much smaller than b. Thisellipse will be important when looking at the data. The impact of the depth of focus of the visual system onhoropter measurements suggests the data in the literature may be skewed toward the ellipse of best focus unlessprecautions are taken.
Little data is available on the precise shape of the focal surface of the human visual system in object space. Thevariable focal length with field angle of the design could introduce unexpected variations in the shape of thatsurface. Because the off-axis resolution of the system decreases so rapidly, the subject is largely academic. It willbe assumed here that the eye is in optimum focus for all field angles when focused at infinity and that any
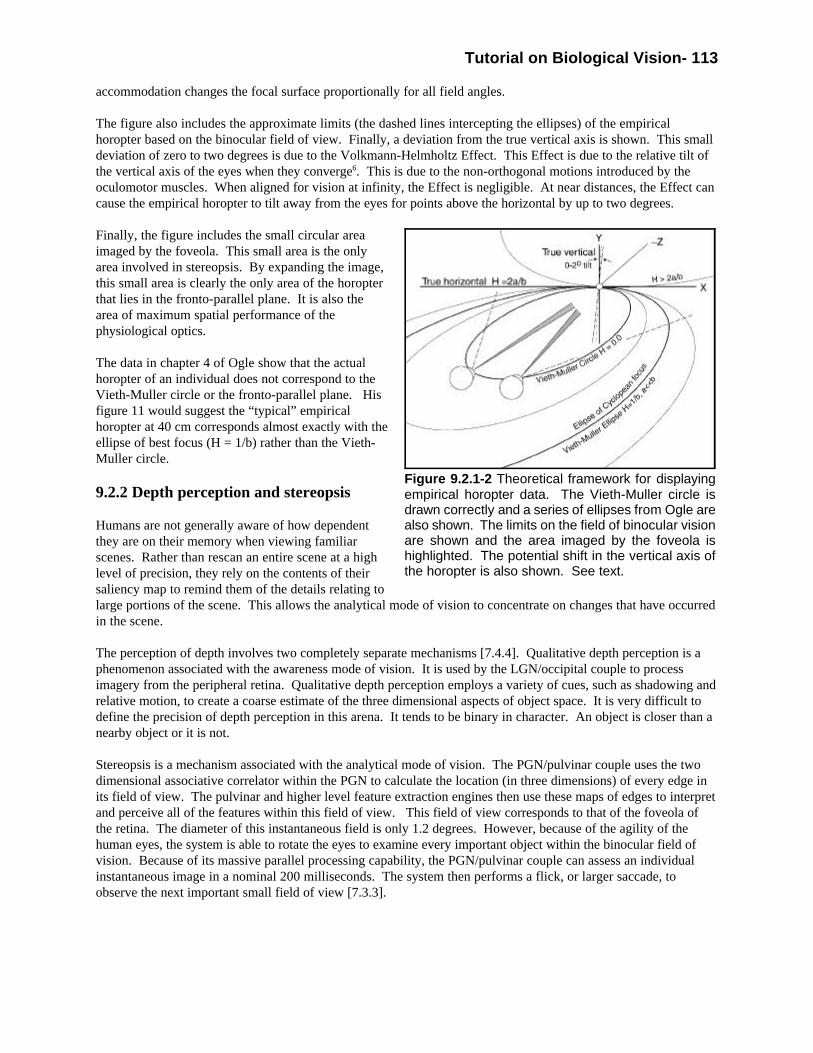
Tutorial on Biological Vision- 113
Figure 9.2.1-2 Theoretical framework for displayingempirical horopter data. The Vieth-Muller circle isdrawn correctly and a series of ellipses from Ogle arealso shown. The limits on the field of binocular visionare shown and the area imaged by the foveola ishighlighted. The potential shift in the vertical axis ofthe horopter is also shown. See text.
accommodation changes the focal surface proportionally for all field angles.
The figure also includes the approximate limits (the dashed lines intercepting the ellipses) of the empiricalhoropter based on the binocular field of view. Finally, a deviation from the true vertical axis is shown. This smalldeviation of zero to two degrees is due to the Volkmann-Helmholtz Effect. This Effect is due to the relative tilt ofthe vertical axis of the eyes when they converge6. This is due to the non-orthogonal motions introduced by theoculomotor muscles. When aligned for vision at infinity, the Effect is negligible. At near distances, the Effect cancause the empirical horopter to tilt away from the eyes for points above the horizontal by up to two degrees.
Finally, the figure includes the small circular areaimaged by the foveola. This small area is the onlyarea involved in stereopsis. By expanding the image,this small area is clearly the only area of the horopterthat lies in the fronto-parallel plane. It is also thearea of maximum spatial performance of thephysiological optics.
The data in chapter 4 of Ogle show that the actualhoropter of an individual does not correspond to theVieth-Muller circle or the fronto-parallel plane. Hisfigure 11 would suggest the “typical” empiricalhoropter at 40 cm corresponds almost exactly with theellipse of best focus (H = 1/b) rather than the Vieth-Muller circle.
9.2.2 Depth perception and stereopsis
Humans are not generally aware of how dependentthey are on their memory when viewing familiarscenes. Rather than rescan an entire scene at a highlevel of precision, they rely on the contents of theirsaliency map to remind them of the details relating tolarge portions of the scene. This allows the analytical mode of vision to concentrate on changes that have occurredin the scene.
The perception of depth involves two completely separate mechanisms [7.4.4]. Qualitative depth perception is aphenomenon associated with the awareness mode of vision. It is used by the LGN/occipital couple to processimagery from the peripheral retina. Qualitative depth perception employs a variety of cues, such as shadowing andrelative motion, to create a coarse estimate of the three dimensional aspects of object space. It is very difficult todefine the precision of depth perception in this arena. It tends to be binary in character. An object is closer than anearby object or it is not.
Stereopsis is a mechanism associated with the analytical mode of vision. The PGN/pulvinar couple uses the twodimensional associative correlator within the PGN to calculate the location (in three dimensions) of every edge inits field of view. The pulvinar and higher level feature extraction engines then use these maps of edges to interpretand perceive all of the features within this field of view. This field of view corresponds to that of the foveola ofthe retina. The diameter of this instantaneous field is only 1.2 degrees. However, because of the agility of thehuman eyes, the system is able to rotate the eyes to examine every important object within the binocular field ofvision. Because of its massive parallel processing capability, the PGN/pulvinar couple can assess an individualinstantaneous image in a nominal 200 milliseconds. The system then performs a flick, or larger saccade, toobserve the next important small field of view [7.3.3].
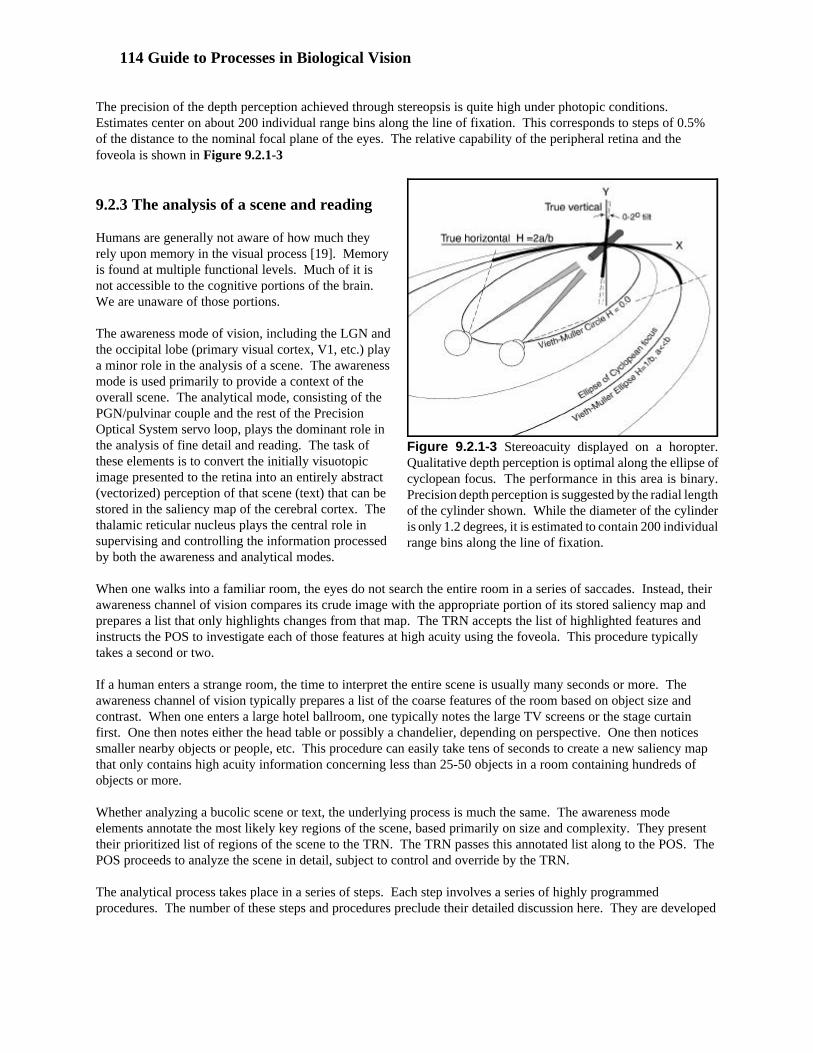
114 Guide to Processes in Biological Vision
Figure 9.2.1-3 Stereoacuity displayed on a horopter.Qualitative depth perception is optimal along the ellipse ofcyclopean focus. The performance in this area is binary.Precision depth perception is suggested by the radial lengthof the cylinder shown. While the diameter of the cylinderis only 1.2 degrees, it is estimated to contain 200 individualrange bins along the line of fixation.
The precision of the depth perception achieved through stereopsis is quite high under photopic conditions. Estimates center on about 200 individual range bins along the line of fixation. This corresponds to steps of 0.5%of the distance to the nominal focal plane of the eyes. The relative capability of the peripheral retina and thefoveola is shown in Figure 9.2.1-3
9.2.3 The analysis of a scene and reading
Humans are generally not aware of how much theyrely upon memory in the visual process [19]. Memoryis found at multiple functional levels. Much of it isnot accessible to the cognitive portions of the brain. We are unaware of those portions.
The awareness mode of vision, including the LGN andthe occipital lobe (primary visual cortex, V1, etc.) playa minor role in the analysis of a scene. The awarenessmode is used primarily to provide a context of theoverall scene. The analytical mode, consisting of thePGN/pulvinar couple and the rest of the PrecisionOptical System servo loop, plays the dominant role inthe analysis of fine detail and reading. The task ofthese elements is to convert the initially visuotopicimage presented to the retina into an entirely abstract(vectorized) perception of that scene (text) that can bestored in the saliency map of the cerebral cortex. Thethalamic reticular nucleus plays the central role insupervising and controlling the information processedby both the awareness and analytical modes.
When one walks into a familiar room, the eyes do not search the entire room in a series of saccades. Instead, theirawareness channel of vision compares its crude image with the appropriate portion of its stored saliency map andprepares a list that only highlights changes from that map. The TRN accepts the list of highlighted features andinstructs the POS to investigate each of those features at high acuity using the foveola. This procedure typicallytakes a second or two.
If a human enters a strange room, the time to interpret the entire scene is usually many seconds or more. Theawareness channel of vision typically prepares a list of the coarse features of the room based on object size andcontrast. When one enters a large hotel ballroom, one typically notes the large TV screens or the stage curtainfirst. One then notes either the head table or possibly a chandelier, depending on perspective. One then noticessmaller nearby objects or people, etc. This procedure can easily take tens of seconds to create a new saliency mapthat only contains high acuity information concerning less than 25-50 objects in a room containing hundreds ofobjects or more.
Whether analyzing a bucolic scene or text, the underlying process is much the same. The awareness modeelements annotate the most likely key regions of the scene, based primarily on size and complexity. They presenttheir prioritized list of regions of the scene to the TRN. The TRN passes this annotated list along to the POS. ThePOS proceeds to analyze the scene in detail, subject to control and override by the TRN.
The analytical process takes place in a series of steps. Each step involves a series of highly programmedprocedures. The number of these steps and procedures preclude their detailed discussion here. They are developed

Tutorial on Biological Vision- 115
to the image projected onto the foveola. This image is initially analyzed into a series of contrast edges. Contiguous edges are grouped into a figure known as an interp within the psychology community. Several interps
encountered before. By comparing the percept with the contents of memory, assigning a totally abstract designatorto this visuotopic percept is frequently possible. This designator becomes the abstract percept passed up the line to
involves moving the image on the foveola with the effect that the foveola scans the overall image. The result is aseries of percepts acquired in time sequence.
example, the assimilated percept may say that the overall image is of mya bedroom.
performed within the PGN/pulvinar couple of the POS and the analytical mode of vision. If learning is involved, itappears the cerebellum, a large memory unit, may also play a role.
procedures. As discussed briefly above, the cerebellum and the superior colliculus of the PGN appear to beinvolved in learning the required programmatic procedures. These procedures are culturally controlled. Indo-
Middle East have adopted a similar procedure but different characters. They prefer to read from right to left. Inthe Orient, a system more akin to the ancient Egyptians has survived. They prefer to read more complex
Reading relies on the same signal processing functions as defined above. However, greater emphasis is placed onthe analysis of fine detail, presented stylistically to the foveola of vision, and processed entirely within the
diencephalon. The information associated with a message is almost totally extracted and perceived before theforebrain becomes involved. This allows the forebrain to concentrate on cognition, the determination of the
maximum performance, the subject rapidly gets into a level of detail beyond the scope of this tutorial. Chapter 19of the supporting document addresses reading in detail.

116 Guide to Processes in Biological Vision
Figure 9.2.1-4 The Stellen E placed on the retina at20/20. Top frame shows the word PRESS overlayed on theretinal mosaic. The arrows on the upper left show the sizeof 10 adjacent photoreceptors. The arrows on the upperright show the nominal size of the tremor (microsaccades).The bottom line shows the extent of the tremor if itsamplitude is 40 arc seconds peak to peak. The top lineshows its extent if its amplitude is 40 arc seconds RMS. Bottom frame presents the question of how a singlecharacter is parsed for transmission to the cortex.
Figure 9.2.1-4 shows how a simple word is imaged on the foveola. It has been scaled to represent the word aspresented under standard conditions. Each character occupies nominally five by five minutes of arc in objectspace. The background shows the nominal equivalent size of individual photoreceptors. The simple five-letterword “PRESS” fills about 43% of the diameter of the foveola. This fact suggests that the foveola can only analyzea word of less than ten characters within one nominal period of 200 msec. In practice, it employs a differentstrategy. It analyzes character groups of about five characters as shown and uses the rest of the available imagespace as part of a “look-ahead” routine. The POS attempts to determine if the “space” following the charactergroup is occupied by a significant character group or the space between words. A decision on this fact can changethe saccade sequence to skip over empty space, or even go to the next line of text. Just going to the next line of textinvolves a complex series of procedures and saccades.
The lower frame of the figure shows potentialindividual interps based on the edge contrast detectionmechanism performed by the PGN. Depending on thecontrast of the image, the PGN may detect the twoedges of each stroke of a single printed character asshown for “P.” Alternately, it may only detect a singleedge representing each stroke as shown for “R.”
A Chinese pictogram can be imaged onto the retinasimilarly. However, care must be taken to insure thateach stroke in the pictogram has a width of more thanone minute of arc. A spacing of at least one minute ofarc is also required between strokes understandardized conditions. This is the dominant factorin the design of simplified pictograms for use inchildren’s books and in text to be transmitted ascaptions within television presentations.
9.2.4 The difference between perceptionand cognition (the alarm mode)
The visual system is now understood well enough tobegin moving into the questions of cognition as it relates to the frontal lobe of the cerebral cortex, andconsciousness in general [15.1]. Prior to moving in this direction, it is absolutely critical that all terms be definedclearly and precisely. Normally, this level of definition is not found within the neuroscience community whendiscussing these subjects. The word awareness is a particular problem. It is proposed that the saliency map formsa unique location (boundary) within the neurological system. It separates the operations of the sensory systemswhich provide information to the saliency map and the higher level operations of the brain which access this data. The sensory systems provide the interpretation and perception of the raw input and derive the abstract (vectorized)signals placed in the saliency map. The higher level cognitive centers use this map to cognate on theenvironmental situation described by the saliency map and to prepare instructions to be implemented by theefferent neural systems.
In the above context, a subject can achieve perceptual awareness without achieving cognitive awareness. Theformer relates to the operation of the system prior to the saliency map and includes the performance of the“zombie.” It also includes the performance of many subjects exhibiting “blindsight.” These subjects are able toperceive and respond to threats and other visual symbology without being cognitively aware of the threat orsymbology.

There is another point of clarification related to the efferent signal paths of vision. It may be useful to consider theoutput of the higher cognitive centers as being passed to an equivalent of the saliency map before implementation.
motor areas) of the brain. This delineation would aid in separating those subjects who have cognitive awareness ofan event but cannot report that awareness using the conventional methods (primarily speech). Such cases are
subjects are frequently tongue- tied during moments of anxiety (even though they may point at something ferventlyor take other protective action).
ball and calculate its trajectory before he is required to take action. Similarly, anecdotal evidence exists that atrack sprinter begins to leave the chocks before he has had time to recognize the sound of the starter’s gun. These
capability [15.2]. Note the etymology of the word recognize (re-cognize). It implies the organism has been in asimilar position previously.
Figure 8.1.1-2, is the underlying mode associated with these situations. It is
the audio system. These signals are extracted within the LGN and passed directly to the appropriate elements ofthe thalamus. The signals are sent directly to the POS, and the equivalent elements of the skeletomotor system to
appropriate. The POS performs the interp and percept extraction tasks as described above. It forwards the resultsof its analytical tasks to the saliency map. However, it has been also programmed (through learning) to take
When received by the controllers of the oculomotor and skeletomotor systems, action can be taken immediately. The action to be taken is highly dependent on prior learning.
Until the abstract percepts are placed in the saliency map, the cognitive centers of the brain are not able torecognize these percepts. Once placed in the map, time is required for the engines of the cognitive centers to
irrelevant. It is performed mostly as a matter of keeping good records. The motor systems of the organism havealready taken the required action under the supervision of the TRN (as previously negotiated and authorized during
coaches), but not the cerebral cortex.
Section 15.6 of the underlying work develop the latest information in the rapidly changing fields related to

118 Guide to Processes in Biological Vision
Table of Contents
1. The last 500 Million Years of Evolution . . . . . . . . . . . . . . . . . . . . . . . . . . . . . . . . . . . . . . . . . . . . . . . . . . . . . . . . . . . . . . 1
2. The Variation among Eyes is Enormous . . . . . . . . . . . . . . . . . . . . . . . . . . . . . . . . . . . . . . . . . . . . . . . . . . . . . . . . . . . . . . . 52.1 Each Phylum has a distinctive eye architecture . . . . . . . . . . . . . . . . . . . . . . . . . . . . . . . . . . . . . . . . . . . . . . . . . 62.2 The Chordate eye and the significance of the reverse retina . . . . . . . . . . . . . . . . . . . . . . . . . . . . . . . . . . . . . . . . 8
3. The Eyes are only part of a Visual System . . . . . . . . . . . . . . . . . . . . . . . . . . . . . . . . . . . . . . . . . . . . . . . . . . . . . . . . . . . . 113.1 The Building Block Architecture of the Chordate Visual System . . . . . . . . . . . . . . . . . . . . . . . . . . . . . . . . . . . 12
3.1.1 The signal processing within the retina of man . . . . . . . . . . . . . . . . . . . . . . . . . . . . . . . . . . . . . . . 153.2 The major role played by the Diencephalon . . . . . . . . . . . . . . . . . . . . . . . . . . . . . . . . . . . . . . . . . . . . . . . . . . . 18
3.2.1 The operation of the TRN as the gatekeeper of sensory inputs and muscular/skeletal responses . . . 193.2.2 The operation of the PGN/pulvinar couple . . . . . . . . . . . . . . . . . . . . . . . . . . . . . . . . . . . . . . . . . . . 193.2.3 The Precision Optical System . . . . . . . . . . . . . . . . . . . . . . . . . . . . . . . . . . . . . . . . . . . . . . . . . . . . 19
3.3 Plan and profile views of the human visual system . . . . . . . . . . . . . . . . . . . . . . . . . . . . . . . . . . . . . . . . . . . . . 213.4 Functional signal pathways within the visual system . . . . . . . . . . . . . . . . . . . . . . . . . . . . . . . . . . . . . . . . . . . . 27
3.4.1 Effect of a “total commissurotomy” of the corpus callosum . . . . . . . . . . . . . . . . . . . . . . . . . . . . . . 293.4.2 Agnosia as a function of location or of feature extraction engine . . . . . . . . . . . . . . . . . . . . . . . . . . 29
3.5 The thalamic reticular nucleus (TRN) as the gate keeper of vision . . . . . . . . . . . . . . . . . . . . . . . . . . . . . . . . . . 303.6 Summary of overall visual operation . . . . . . . . . . . . . . . . . . . . . . . . . . . . . . . . . . . . . . . . . . . . . . . . . . . . . . . . 30
4. Neurons are the electrolytic equivalent of man-made electrical circuits . . . . . . . . . . . . . . . . . . . . . . . . . . . . . . . . . . . . . . . 334.1 The electrolytic versus ionic argument of neuron operation . . . . . . . . . . . . . . . . . . . . . . . . . . . . . . . . . . . . . . . 334.2 Semiconductor physics applied to the neuron . . . . . . . . . . . . . . . . . . . . . . . . . . . . . . . . . . . . . . . . . . . . . . . . . 34
4.2.1 The plasma membrane as an electrolytic component . . . . . . . . . . . . . . . . . . . . . . . . . . . . . . . . . . . 344.2.2 The juxtaposition of two asymmetrical plasma membranes–the ACTIVA . . . . . . . . . . . . . . . . . . . 354.2.3 The Electrostenolytic Process defines/replaces the ion-pump . . . . . . . . . . . . . . . . . . . . . . . . . . . . . 37
4.3 The operation of the electrolytic neuron . . . . . . . . . . . . . . . . . . . . . . . . . . . . . . . . . . . . . . . . . . . . . . . . . . . . . 394.3.1 The application of the ACTIVA and electrostenolysis to the synapse . . . . . . . . . . . . . . . . . . . . . . . 394.3.2 The synapse in a morphological and functional context . . . . . . . . . . . . . . . . . . . . . . . . . . . . . . . . . 404.3.3 The application of the ACTIVA and electrostenolysis to the Node of Ranvier . . . . . . . . . . . . . . . . 41
4.3.3.1 The Nodes of Ranvier within a single neuron . . . . . . . . . . . . . . . . . . . . . . . . . . . . . . . 414.3.3.2 The morphology/cytology of a Node of Ranvier . . . . . . . . . . . . . . . . . . . . . . . . . . . . . . 434.3.3.3 The Node of Ranvier alone . . . . . . . . . . . . . . . . . . . . . . . . . . . . . . . . . . . . . . . . . . . . . 43
4.3.4 The application of the ACTIVA and electrostenolysis to a ganglion cell . . . . . . . . . . . . . . . . . . . . . 454.3.5 The application of the Activa to a bipolar or lateral cell . . . . . . . . . . . . . . . . . . . . . . . . . . . . . . . . . 464.3.6 The stellate cell recovers the encoded signals . . . . . . . . . . . . . . . . . . . . . . . . . . . . . . . . . . . . . . . . 464.3.7 Signal propagation by a neuron . . . . . . . . . . . . . . . . . . . . . . . . . . . . . . . . . . . . . . . . . . . . . . . . . . . 46
4.3.7.1 A coaxial axon is not a Herman Cable . . . . . . . . . . . . . . . . . . . . . . . . . . . . . . . . . . . . . 484.3.7.2 Understanding the group velocity, and other signal velocities within a neuron . . . . . . . 484.3.7.3 The marriage of the Node of Ranvier, electrostenolysis and the coaxial axon . . . . . . . . 49
4.4 Metabolic support to the neuron . . . . . . . . . . . . . . . . . . . . . . . . . . . . . . . . . . . . . . . . . . . . . . . . . . . . . . . . . . . 504.4.1 Introductory electrostatics . . . . . . . . . . . . . . . . . . . . . . . . . . . . . . . . . . . . . . . . . . . . . . . . . . . . . . . 504.4.2 Metabolic processes related to the operation of the neuron . . . . . . . . . . . . . . . . . . . . . . . . . . . . . . 50
5. The unique neuro-secretory photoreceptor cell . . . . . . . . . . . . . . . . . . . . . . . . . . . . . . . . . . . . . . . . . . . . . . . . . . . . . . . . . 535.1 Functional divisions of the photoreceptor cell . . . . . . . . . . . . . . . . . . . . . . . . . . . . . . . . . . . . . . . . . . . . . . . . . 555.2 Electrical configuration of the photoreceptor cell . . . . . . . . . . . . . . . . . . . . . . . . . . . . . . . . . . . . . . . . . . . . . . . 55
5.2.1 Unique dendritic structure of the neuron . . . . . . . . . . . . . . . . . . . . . . . . . . . . . . . . . . . . . . . . . . . . 555.2.2 The unique adaptation amplifier formed within the microtubules . . . . . . . . . . . . . . . . . . . . . . . . . . 565.2.3 The quantum-mechanical interface between the disks and the microtubules . . . . . . . . . . . . . . . . . . 565.2.4 The overall electrolytic configuration of the photoreceptor cell . . . . . . . . . . . . . . . . . . . . . . . . . . . 56
5.3 Secretory functions of the photoreceptor cell . . . . . . . . . . . . . . . . . . . . . . . . . . . . . . . . . . . . . . . . . . . . . . . . . . 57

Tutorial on Biological Vision- 119
5.4 Growth within the individual photoreceptor space . . . . . . . . . . . . . . . . . . . . . . . . . . . . . . . . . . . . . . . . . . . . . . 575.4.1 The life cycle of a rhodopsin based disk . . . . . . . . . . . . . . . . . . . . . . . . . . . . . . . . . . . . . . . . . . . . 585.4.2 The life cycle of a molecule of a chromophore . . . . . . . . . . . . . . . . . . . . . . . . . . . . . . . . . . . . . . . . 58
6. The Tetrachromatic Capability of the Typical Photoreceptor Group . . . . . . . . . . . . . . . . . . . . . . . . . . . . . . . . . . . . . . . . . 616.1 The eyes are quantum detectors, not energy detectors . . . . . . . . . . . . . . . . . . . . . . . . . . . . . . . . . . . . . . . . . . . 626.2 Liquid crystal quantum physics is key to understanding spectral absorption . . . . . . . . . . . . . . . . . . . . . . . . . . . 626.3 The four chromophores of biological vision . . . . . . . . . . . . . . . . . . . . . . . . . . . . . . . . . . . . . . . . . . . . . . . . . . . 646.4 Non-spectral variants between chromophores due to their Vitamin A base . . . . . . . . . . . . . . . . . . . . . . . . . . . . 666.5 Isotropic and anisotropic absorption of the liquid crystalline chromophores . . . . . . . . . . . . . . . . . . . . . . . . . . . 66
6.5.1 Empirical verification of the isotropic and anisotropic spectra . . . . . . . . . . . . . . . . . . . . . . . . . . . . 666.6 The spectral characteristics of the in-vivo chromophores of biological vision . . . . . . . . . . . . . . . . . . . . . . . . . . 67
6.6.1 The unique character of the long wavelength spectral channel . . . . . . . . . . . . . . . . . . . . . . . . . . . . 67
7. The Unique Photoreceptor/IPM/ RPE environment . . . . . . . . . . . . . . . . . . . . . . . . . . . . . . . . . . . . . . . . . . . . . . . . . . . . . . 697.1 Morphogenesis of the human eye . . . . . . . . . . . . . . . . . . . . . . . . . . . . . . . . . . . . . . . . . . . . . . . . . . . . . . . . . . 697.2 The complete mature PC/IPM/RPE complex . . . . . . . . . . . . . . . . . . . . . . . . . . . . . . . . . . . . . . . . . . . . . . . . . . 707.3 Where did the cones go–the dynamics of the PC/IPM/RPE interface . . . . . . . . . . . . . . . . . . . . . . . . . . . . . . . . 75
8. More detailed architecture of higher chordate visual system . . . . . . . . . . . . . . . . . . . . . . . . . . . . . . . . . . . . . . . . . . . . . . . 758.1 The role of delay in the signal processing of vision . . . . . . . . . . . . . . . . . . . . . . . . . . . . . . . . . . . . . . . . . . . . . 768.2 The role of computational anatomy in vision . . . . . . . . . . . . . . . . . . . . . . . . . . . . . . . . . . . . . . . . . . . . . . . . . . 77
8.2.1 Temporal computational anatomy . . . . . . . . . . . . . . . . . . . . . . . . . . . . . . . . . . . . . . . . . . . . . . . . . 788.2.2 Geometric computational anatomy . . . . . . . . . . . . . . . . . . . . . . . . . . . . . . . . . . . . . . . . . . . . . . . . . 78
8.3 The role of tremor in the signal processing of vision . . . . . . . . . . . . . . . . . . . . . . . . . . . . . . . . . . . . . . . . . . . . 798.4 The correlation process of the PGN/pulvinar couple . . . . . . . . . . . . . . . . . . . . . . . . . . . . . . . . . . . . . . . . . . . . 80
9. The Performance of the Nominal Human Visual System . . . . . . . . . . . . . . . . . . . . . . . . . . . . . . . . . . . . . . . . . . . . . . . . . 819.1 Functional Performance related to Physiology . . . . . . . . . . . . . . . . . . . . . . . . . . . . . . . . . . . . . . . . . . . . . . . . . 81
9.1.1 The transient performance of the photodetection process–the P/D Equation . . . . . . . . . . . . . . . . . . 829.1.1.1 The solution of the P/D Equation for the transient case . . . . . . . . . . . . . . . . . . . . . . . . 839.1.1.2 The Hodgkin Solution to the P/D Equation . . . . . . . . . . . . . . . . . . . . . . . . . . . . . . . . . 849.1.1.3 Empirical confirmation of the P/D Equation . . . . . . . . . . . . . . . . . . . . . . . . . . . . . . . . 85
9.1.2 Spectral performance of the human eye . . . . . . . . . . . . . . . . . . . . . . . . . . . . . . . . . . . . . . . . . . . . . 869.1.2.1 Scotopic performance based on underlying photoreceptors . . . . . . . . . . . . . . . . . . . . . . 869.1.2.2 Scotopic spectral performance based on the complete eye . . . . . . . . . . . . . . . . . . . . . . 879.1.2.3 Photopic spectral performance based on the complete eye . . . . . . . . . . . . . . . . . . . . . . 889.1.2.4 Spectral performance in the mesopic region . . . . . . . . . . . . . . . . . . . . . . . . . . . . . . . . . 899.1.2.5 Artifacts of the logarithmic summation process . . . . . . . . . . . . . . . . . . . . . . . . . . . . . . 909.1.2.6 The empirical database versus the current CIE spectral performance standards . . . . . . 90
9.1.3 Chromatic performance of the complete human eye–a blocked tetrachromat . . . . . . . . . . . . . . . . . 919.1.3.1 Overview . . . . . . . . . . . . . . . . . . . . . . . . . . . . . . . . . . . . . . . . . . . . . . . . . . . . . . . . . . 919.1.3.2 Formulation of a new physiologically based color space . . . . . . . . . . . . . . . . . . . . . . . . 919.1.3.3 A new physiologically based chromaticity diagram for research . . . . . . . . . . . . . . . . . . 939.1.3.4 The definition of Unique Colors and color axes . . . . . . . . . . . . . . . . . . . . . . . . . . . . . . 969.1.3.5 Problems in displaying the complete human color gamut . . . . . . . . . . . . . . . . . . . . . . . 989.1.3.6 The CIE Chromaticity Diagrams based on the physiological diagram . . . . . . . . . . . . . . 98
9.1.4 Adaptation is a crucial mechanism in biological vision . . . . . . . . . . . . . . . . . . . . . . . . . . . . . . . . . 999.1.4.1 Overview . . . . . . . . . . . . . . . . . . . . . . . . . . . . . . . . . . . . . . . . . . . . . . . . . . . . . . . . . 1009.1.4.2 Mathematics of the dark adaptation process . . . . . . . . . . . . . . . . . . . . . . . . . . . . . . . . 1029.1.4.2 Characteristics of dark adaptation . . . . . . . . . . . . . . . . . . . . . . . . . . . . . . . . . . . . . . . 1039.1.4.3 The primary role of the iris is to control image quality, not intensity . . . . . . . . . . . . . 105
9.1.5 The phenomenon of Color Constancy . . . . . . . . . . . . . . . . . . . . . . . . . . . . . . . . . . . . . . . . . . . . . 1059.1.6 The contrast performance of the visual system . . . . . . . . . . . . . . . . . . . . . . . . . . . . . . . . . . . . . . . 106
9.1.6.1 The (achromatic) contrast temporal frequency transfer function (CTF) . . . . . . . . . . . . 1069.1.6.2 The (achromatic) contrast spatial frequency transfer function (CSF) . . . . . . . . . . . . . 1099.1.6.3 The chromatic contrast transfer function (CCF) . . . . . . . . . . . . . . . . . . . . . . . . . . . . . 110
9.2 Functional Performance related to Perception . . . . . . . . . . . . . . . . . . . . . . . . . . . . . . . . . . . . . . . . . . . . . . . . 111

120 Guide to Processes in Biological Vision
9.2.1 The horopter . . . . . . . . . . . . . . . . . . . . . . . . . . . . . . . . . . . . . . . . . . . . . . . . . . . . . . . . . . . . . . . . 1119.2.1.1 Representations of the horopter . . . . . . . . . . . . . . . . . . . . . . . . . . . . . . . . . . . . . . . . . 112
9.2.2 Depth perception and stereopsis . . . . . . . . . . . . . . . . . . . . . . . . . . . . . . . . . . . . . . . . . . . . . . . . . 1139.2.3 The analysis of a scene and reading . . . . . . . . . . . . . . . . . . . . . . . . . . . . . . . . . . . . . . . . . . . . . . . 1149.2.4 The difference between perception and cognition (the alarm mode) . . . . . . . . . . . . . . . . . . . . . . 116
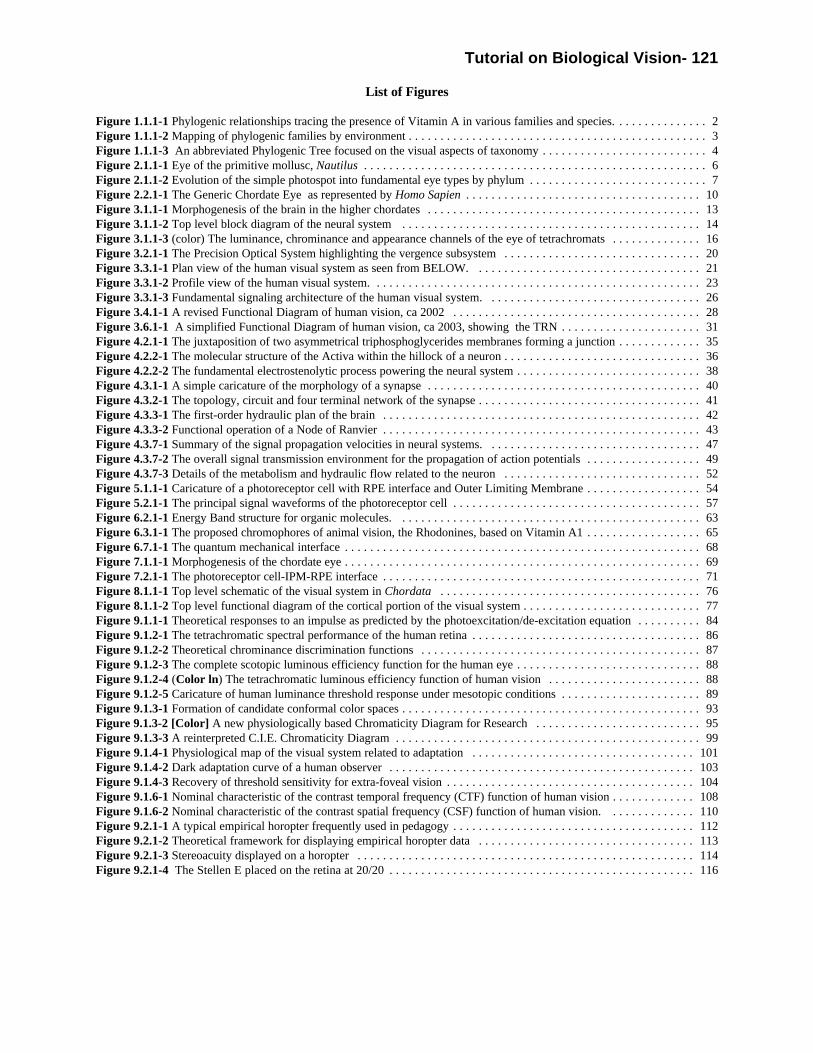
Tutorial on Biological Vision- 121
List of Figures
Figure 1.1.1-1 Phylogenic relationships tracing the presence of Vitamin A in various families and species. . . . . . . . . . . . . . . 2Figure 1.1.1-2 Mapping of phylogenic families by environment . . . . . . . . . . . . . . . . . . . . . . . . . . . . . . . . . . . . . . . . . . . . . . . 3Figure 1.1.1-3 An abbreviated Phylogenic Tree focused on the visual aspects of taxonomy . . . . . . . . . . . . . . . . . . . . . . . . . . 4Figure 2.1.1-1 Eye of the primitive mollusc, Nautilus . . . . . . . . . . . . . . . . . . . . . . . . . . . . . . . . . . . . . . . . . . . . . . . . . . . . . . 6Figure 2.1.1-2 Evolution of the simple photospot into fundamental eye types by phylum . . . . . . . . . . . . . . . . . . . . . . . . . . . . 7Figure 2.2.1-1 The Generic Chordate Eye as represented by Homo Sapien . . . . . . . . . . . . . . . . . . . . . . . . . . . . . . . . . . . . . 10Figure 3.1.1-1 Morphogenesis of the brain in the higher chordates . . . . . . . . . . . . . . . . . . . . . . . . . . . . . . . . . . . . . . . . . . . 13Figure 3.1.1-2 Top level block diagram of the neural system . . . . . . . . . . . . . . . . . . . . . . . . . . . . . . . . . . . . . . . . . . . . . . . 14Figure 3.1.1-3 (color) The luminance, chrominance and appearance channels of the eye of tetrachromats . . . . . . . . . . . . . . 16Figure 3.2.1-1 The Precision Optical System highlighting the vergence subsystem . . . . . . . . . . . . . . . . . . . . . . . . . . . . . . . 20Figure 3.3.1-1 Plan view of the human visual system as seen from BELOW. . . . . . . . . . . . . . . . . . . . . . . . . . . . . . . . . . . . 21Figure 3.3.1-2 Profile view of the human visual system. . . . . . . . . . . . . . . . . . . . . . . . . . . . . . . . . . . . . . . . . . . . . . . . . . . . 23Figure 3.3.1-3 Fundamental signaling architecture of the human visual system. . . . . . . . . . . . . . . . . . . . . . . . . . . . . . . . . . 26Figure 3.4.1-1 A revised Functional Diagram of human vision, ca 2002 . . . . . . . . . . . . . . . . . . . . . . . . . . . . . . . . . . . . . . . 28Figure 3.6.1-1 A simplified Functional Diagram of human vision, ca 2003, showing the TRN . . . . . . . . . . . . . . . . . . . . . . 31Figure 4.2.1-1 The juxtaposition of two asymmetrical triphosphoglycerides membranes forming a junction . . . . . . . . . . . . . 35Figure 4.2.2-1 The molecular structure of the Activa within the hillock of a neuron . . . . . . . . . . . . . . . . . . . . . . . . . . . . . . . 36Figure 4.2.2-2 The fundamental electrostenolytic process powering the neural system . . . . . . . . . . . . . . . . . . . . . . . . . . . . . 38Figure 4.3.1-1 A simple caricature of the morphology of a synapse . . . . . . . . . . . . . . . . . . . . . . . . . . . . . . . . . . . . . . . . . . . 40Figure 4.3.2-1 The topology, circuit and four terminal network of the synapse . . . . . . . . . . . . . . . . . . . . . . . . . . . . . . . . . . . 41Figure 4.3.3-1 The first-order hydraulic plan of the brain . . . . . . . . . . . . . . . . . . . . . . . . . . . . . . . . . . . . . . . . . . . . . . . . . . 42Figure 4.3.3-2 Functional operation of a Node of Ranvier . . . . . . . . . . . . . . . . . . . . . . . . . . . . . . . . . . . . . . . . . . . . . . . . . . 43Figure 4.3.7-1 Summary of the signal propagation velocities in neural systems. . . . . . . . . . . . . . . . . . . . . . . . . . . . . . . . . . 47Figure 4.3.7-2 The overall signal transmission environment for the propagation of action potentials . . . . . . . . . . . . . . . . . . 49Figure 4.3.7-3 Details of the metabolism and hydraulic flow related to the neuron . . . . . . . . . . . . . . . . . . . . . . . . . . . . . . . 52Figure 5.1.1-1 Caricature of a photoreceptor cell with RPE interface and Outer Limiting Membrane . . . . . . . . . . . . . . . . . . 54Figure 5.2.1-1 The principal signal waveforms of the photoreceptor cell . . . . . . . . . . . . . . . . . . . . . . . . . . . . . . . . . . . . . . . 57Figure 6.2.1-1 Energy Band structure for organic molecules. . . . . . . . . . . . . . . . . . . . . . . . . . . . . . . . . . . . . . . . . . . . . . . . 63Figure 6.3.1-1 The proposed chromophores of animal vision, the Rhodonines, based on Vitamin A1 . . . . . . . . . . . . . . . . . . 65Figure 6.7.1-1 The quantum mechanical interface . . . . . . . . . . . . . . . . . . . . . . . . . . . . . . . . . . . . . . . . . . . . . . . . . . . . . . . . 68Figure 7.1.1-1 Morphogenesis of the chordate eye . . . . . . . . . . . . . . . . . . . . . . . . . . . . . . . . . . . . . . . . . . . . . . . . . . . . . . . . 69Figure 7.2.1-1 The photoreceptor cell-IPM-RPE interface . . . . . . . . . . . . . . . . . . . . . . . . . . . . . . . . . . . . . . . . . . . . . . . . . . 71Figure 8.1.1-1 Top level schematic of the visual system in Chordata . . . . . . . . . . . . . . . . . . . . . . . . . . . . . . . . . . . . . . . . . 76Figure 8.1.1-2 Top level functional diagram of the cortical portion of the visual system . . . . . . . . . . . . . . . . . . . . . . . . . . . . 77Figure 9.1.1-1 Theoretical responses to an impulse as predicted by the photoexcitation/de-excitation equation . . . . . . . . . . 84Figure 9.1.2-1 The tetrachromatic spectral performance of the human retina . . . . . . . . . . . . . . . . . . . . . . . . . . . . . . . . . . . . 86Figure 9.1.2-2 Theoretical chrominance discrimination functions . . . . . . . . . . . . . . . . . . . . . . . . . . . . . . . . . . . . . . . . . . . . 87Figure 9.1.2-3 The complete scotopic luminous efficiency function for the human eye . . . . . . . . . . . . . . . . . . . . . . . . . . . . . 88Figure 9.1.2-4 (Color ln) The tetrachromatic luminous efficiency function of human vision . . . . . . . . . . . . . . . . . . . . . . . . 88Figure 9.1.2-5 Caricature of human luminance threshold response under mesotopic conditions . . . . . . . . . . . . . . . . . . . . . . 89Figure 9.1.3-1 Formation of candidate conformal color spaces . . . . . . . . . . . . . . . . . . . . . . . . . . . . . . . . . . . . . . . . . . . . . . . 93Figure 9.1.3-2 [Color] A new physiologically based Chromaticity Diagram for Research . . . . . . . . . . . . . . . . . . . . . . . . . . 95Figure 9.1.3-3 A reinterpreted C.I.E. Chromaticity Diagram . . . . . . . . . . . . . . . . . . . . . . . . . . . . . . . . . . . . . . . . . . . . . . . . 99Figure 9.1.4-1 Physiological map of the visual system related to adaptation . . . . . . . . . . . . . . . . . . . . . . . . . . . . . . . . . . . 101Figure 9.1.4-2 Dark adaptation curve of a human observer . . . . . . . . . . . . . . . . . . . . . . . . . . . . . . . . . . . . . . . . . . . . . . . . 103Figure 9.1.4-3 Recovery of threshold sensitivity for extra-foveal vision . . . . . . . . . . . . . . . . . . . . . . . . . . . . . . . . . . . . . . . 104Figure 9.1.6-1 Nominal characteristic of the contrast temporal frequency (CTF) function of human vision . . . . . . . . . . . . . 108Figure 9.1.6-2 Nominal characteristic of the contrast spatial frequency (CSF) function of human vision. . . . . . . . . . . . . . 110Figure 9.2.1-1 A typical empirical horopter frequently used in pedagogy . . . . . . . . . . . . . . . . . . . . . . . . . . . . . . . . . . . . . . 112Figure 9.2.1-2 Theoretical framework for displaying empirical horopter data . . . . . . . . . . . . . . . . . . . . . . . . . . . . . . . . . . 113Figure 9.2.1-3 Stereoacuity displayed on a horopter . . . . . . . . . . . . . . . . . . . . . . . . . . . . . . . . . . . . . . . . . . . . . . . . . . . . . 114Figure 9.2.1-4 The Stellen E placed on the retina at 20/20 . . . . . . . . . . . . . . . . . . . . . . . . . . . . . . . . . . . . . . . . . . . . . . . . 116

122 Guide to Processes in Biological Vision
SUBJECT INDEX (using advanced indexing option)
action potential . . . . . . . . . . . . . . . . . . . . . . . . . . . . . . . . . . . . . . . . . . . . . . . . . . . . . . . . . . . 33, 34, 43-46, 48, 49activa . . . . . . . . . . . . . . . . . . . . . . . . . . . . . . . . . . . . . . . 33, 35-37, 39-46, 48, 49, 51, 54-57, 68, 72, 82, 100-103acuity . . . . . . . . . . . . . . . . . . . . . . . . . . . . . . . . . . . . . . . . . . . . . . . . . . . . . . . . . . . . . . . . . . . . . . . . . . . . . 8, 114adaptation amplifier . . . . . . . . . . . . . . . . . . . . . . . . . . . . . . . . . . . . . . . . . . . . . . . . . 17, 56, 79, 82, 100-105, 107additive color . . . . . . . . . . . . . . . . . . . . . . . . . . . . . . . . . . . . . . . . . . . . . . . . . . . . . . . . . . . . . . . . . . . . . . . . 92, 98agnosia . . . . . . . . . . . . . . . . . . . . . . . . . . . . . . . . . . . . . . . . . . . . . . . . . . . . . . . . . . . . . . . . . . . . . . . . . . . . 29, 30alarm mode . . . . . . . . . . . . . . . . . . . . . . . . . . . . . . . . . . . . . . . . . . . . . . . . . . . 11, 13, 19, 27, 31, 77, 78, 116, 117amercine . . . . . . . . . . . . . . . . . . . . . . . . . . . . . . . . . . . . . . . . . . . . . . . . . . . . . . . . . . . . . . . . . . . . . . . . . . . . . . 46amino acid . . . . . . . . . . . . . . . . . . . . . . . . . . . . . . . . . . . . . . . . . . . . . . . . . . . . . . . . . . . . . . . . . . . . . . . . . . . . . 58analytical mode . . . . . . . . . . . . . . . . . . . . . . . . . . . . . . . . . . . . . . . . . . . . . . . . . . . . . . 11, 19, 29, 30, 77, 113-115anisotropic absorption . . . . . . . . . . . . . . . . . . . . . . . . . . . . . . . . . . . . . . . . . . . . . . . . . . . . . . . . . . . . 63, 66, 67, 85annelida . . . . . . . . . . . . . . . . . . . . . . . . . . . . . . . . . . . . . . . . . . . . . . . . . . . . . . . . . . . . . . . . . . . . . . . . . . . . . 1, 2AOS . . . . . . . . . . . . . . . . . . . . . . . . . . . . . . . . . . . . . . . . . . . . . . . . . . . . . . . . . . . . . . . . . . . . . . . . . . . . . . . . . 30architecture . . . . . . . . . . . . . . . . . . . . . . . . . . . . . . . . . . . . . . . . . . . . . . . . . . . . . . . . . . . . . . . . . . . . 6, 12, 26, 75area 17 . . . . . . . . . . . . . . . . . . . . . . . . . . . . . . . . . . . . . . . . . . . . . . . . . . . . . . . . . . . . . . . . 15, 21, 23, 24, 30, 111area 18 . . . . . . . . . . . . . . . . . . . . . . . . . . . . . . . . . . . . . . . . . . . . . . . . . . . . . . . . . . . . . . . . . . . . . . . . . . . . 23, 27area 6 . . . . . . . . . . . . . . . . . . . . . . . . . . . . . . . . . . . . . . . . . . . . . . . . . . . . . . . . . . . . . . . . . . . . . . . . . . . . . . . . 30area 7 . . . . . . . . . . . . . . . . . . . . . . . . . . . . . . . . . . . . . . . . . . . . . . . . . . . . . . . . . . . . . . . . . . 21, 23, 24, 29, 30, 77area 7a . . . . . . . . . . . . . . . . . . . . . . . . . . . . . . . . . . . . . . . . . . . . . . . . . . . . . . . . . . . . . . . . . . . . . . . . . . . . 23, 24avalanche . . . . . . . . . . . . . . . . . . . . . . . . . . . . . . . . . . . . . . . . . . . . . . . . . . . . . . . . . . . . . . . 56, 57, 101-103, 105avalanche gain . . . . . . . . . . . . . . . . . . . . . . . . . . . . . . . . . . . . . . . . . . . . . . . . . . . . . . . . . . . . . . . 56, 57, 101, 103awareness mode . . . . . . . . . . . . . . . . . . . . . . . . . . . . . . . . . . . . . . . . . . . . . . . . . . . . . . . . . . . . . . . 30, 77, 113, 114axon segment . . . . . . . . . . . . . . . . . . . . . . . . . . . . . . . . . . . . . . . . . . . . . . . . . . . . . . . . . . . . . . . . . . . . . . . . . . 44axoplasm . . . . . . . . . . . . . . . . . . . . . . . . . . . . . . . . . . . . . . . . . . . . . . . . . . . . . . . . . . . . . 35, 36, 39-42, 44, 45, 57Bezold-Brucke Peak . . . . . . . . . . . . . . . . . . . . . . . . . . . . . . . . . . . . . . . . . . . . . . . . . . . . . . . . . . . . . . . . . . . . . 88bifurcation . . . . . . . . . . . . . . . . . . . . . . . . . . . . . . . . . . . . . . . . . . . . . . . . . . . . . . . . . . . . . . . . . . . . . . . . . . . . . 21bilayer . . . . . . . . . . . . . . . . . . . . . . . . . . . . . . . . . . . . . . . . . . . . . . . . . . . . . . . . . . . . . . . . . . . . . 34-38, 40, 55, 57bilayer membrane . . . . . . . . . . . . . . . . . . . . . . . . . . . . . . . . . . . . . . . . . . . . . . . . . . . . . . . . . . . . . . . . . . . . . 34-37blindsight . . . . . . . . . . . . . . . . . . . . . . . . . . . . . . . . . . . . . . . . . . . . . . . . . . . . . . . . . . . . . . . . . . . . . . . . . 81, 116blood . . . . . . . . . . . . . . . . . . . . . . . . . . . . . . . . . . . . . . . . . . . . . . . . . . . . . . . . . . . . . . . . . . 2, 8, 18, 38, 50, 51, 55broadband . . . . . . . . . . . . . . . . . . . . . . . . . . . . . . . . . . . . . . . . . . . . . . . . . . . . . . . . . . . . . . . . . 62, 91, 96, 97, 110Brodmann . . . . . . . . . . . . . . . . . . . . . . . . . . . . . . . . . . . . . . . . . . . . . . . . . . . . . . . . . . . . . . . . . . . . . . . . . . . . . 15C.I.E . . . . . . . . . . . . . . . . . . . . . . . . . . . . . . . . . . . . . . . . . . . . . . . . . . . . . . . . . . . . . . . . . . . . . . . . . . . 94, 98, 99C.I.E. . . . . . . . . . . . . . . . . . . . . . . . . . . . . . . . . . . . . . . . . . . . . . . . . . . . . . . . . . . . . . . . . . . . . . . . . . . 94, 98, 99calyx . . . . . . . . . . . . . . . . . . . . . . . . . . . . . . . . . . . . . . . . . . . . . . . . . . . . . . . . . . . . . . . . . . . . . . 53-55, 57, 70, 72cerebellum . . . . . . . . . . . . . . . . . . . . . . . . . . . . . . . . . . . . . . . . . . . . . . . . . . . . . . . 12, 14, 15, 19, 28-31, 111, 115chrominance . . . . . . . . . . . . . . . . . . . . . . . . . . . . . . . . 15-17, 23, 26, 30, 45, 46, 87, 91, 92, 94-96, 105, 106, 111chromophore . . . . . . . . . . . . . . . . . . . . . . . . . . . . . . . . . . . . . . . . . . . 57-59, 61, 63-70, 72, 82, 83, 88, 91, 92, 100chromophores . . . . . . . . . . . . . . . . . . . . . . . . . . . . 3, 5, 17, 53, 55, 57, 59, 61-70, 72, 75, 82, 84, 88, 98-101, 107chromophoric . . . . . . . . . . . . . . . . . . . . . . . . . . . . . . . . . . . . . . . . . . . . . . . . . . . . . . . . . . . . . . . . . . . . . . . 53, 72Class A . . . . . . . . . . . . . . . . . . . . . . . . . . . . . . . . . . . . . . . . . . . . . . . . . . . . . . . . . . . . . . . . . . . . . . . . . . . . . . . 57Class B . . . . . . . . . . . . . . . . . . . . . . . . . . . . . . . . . . . . . . . . . . . . . . . . . . . . . . . . . . . . . . . . . . . . . . . . . . . . . . . 57Class C . . . . . . . . . . . . . . . . . . . . . . . . . . . . . . . . . . . . . . . . . . . . . . . . . . . . . . . . . . . . . . . . . . . . . . . . . . . . . . . 57Class D . . . . . . . . . . . . . . . . . . . . . . . . . . . . . . . . . . . . . . . . . . . . . . . . . . . . . . . . . . . . . . . . . . . . . . . . . . . . . . . 57Coaxial cable . . . . . . . . . . . . . . . . . . . . . . . . . . . . . . . . . . . . . . . . . . . . . . . . . . . . . . . . . . . . . . . . . . . . . . . . 48, 49colax . . . . . . . . . . . . . . . . . . . . . . . . . . . . . . . . . . . . . . . . . . . . . . . . . . . . . . . . . . . . . . . . . . . . . . . . . . . . 53-55, 70Colliculus . . . . . . . . . . . . . . . . . . . . . . . . . . . . . . . . . . . . . . . . . . . . . . . . . . . . . 13-15, 21, 23, 24, 30, 31, 76, 115color constancy . . . . . . . . . . . . . . . . . . . . . . . . . . . . . . . . . . . . . . . . . . . . . . . . . . . . . . . . . . . . 17, 82, 89, 105, 106computational anatomy . . . . . . . . . . . . . . . . . . . . . . . . . . . . . . . . . . . . . . . . . . . . . . . . . . . . . . . . . . . . . . . . 77, 78

Tutorial on Biological Vision- 123
contrast transfer function . . . . . . . . . . . . . . . . . . . . . . . . . . . . . . . . . . . . . . . . . . . . . . . . . . . . . . . . . . . . . 106, 110copunctal points . . . . . . . . . . . . . . . . . . . . . . . . . . . . . . . . . . . . . . . . . . . . . . . . . . . . . . . . . . . . . . . . . . . . . . . . 99cortex . . . . . . . . . . . . . . . . . . . . . . . . . . . . . . . . . . . . . . . . . . . 15, 18-21, 23, 24, 26-31, 75-77, 111, 114, 116, 117cyclopean . . . . . . . . . . . . . . . . . . . . . . . . . . . . . . . . . . . . . . . . . . . . . . . . . . . . . . . . . . . . . . . . . . . . . . . . 112, 114dark adaptation . . . . . . . . . . . . . . . . . . . . . . . . . . . . . . . . . . . . . . . . . . . . . . . . . . . . . . . . . . . . . . . . . . . 82, 99-103dendrolemma . . . . . . . . . . . . . . . . . . . . . . . . . . . . . . . . . . . . . . . . . . . . . . . . . . . . . . . . . . . . . . . . . . . . 39, 40, 55dicarboxylic . . . . . . . . . . . . . . . . . . . . . . . . . . . . . . . . . . . . . . . . . . . . . . . . . . . . . . . . . . . . . . . . . . . . . . . . . 38, 58differencing . . . . . . . . . . . . . . . . . . . . . . . . . . . . . . . . . . . . . . . . . . . . . . . . . . . . . . . . . . . . . . . . . . . . . . 15, 17, 87diode . . . . . . . . . . . . . . . . . . . . . . . . . . . . . . . . . . . . . . . . . . . . . . . . . . . . . . . . . . . . . . . . . . . 34, 35, 37, 41, 46, 57dogma . . . . . . . . . . . . . . . . . . . . . . . . . . . . . . . . . . . . . . . . . . . . . . . . . . . . . . . . . . . . . . . . . . . . . . . . . . . . . . . . 33electrolytic . . . . . . . . . . . . . . . . . . . . . . . . . . . . . . . . . . . . . . . . . . . . . . . . . . . . 33-35, 37, 39-47, 49, 52, 56, 82, 99electromagnetic propagation . . . . . . . . . . . . . . . . . . . . . . . . . . . . . . . . . . . . . . . . . . . . . . . . . . . . . . . . . 46, 48, 49electrophysiological . . . . . . . . . . . . . . . . . . . . . . . . . . . . . . . . . . . . . . . . . . . . . . . . . . . . . . . . . . 66, 81, 85, 90, 109electrostenolytic . . . . . . . . . . . . . . . . . . . . . . . . . . . . . . . . . . . . . . . . 18, 34, 37-40, 44, 49, 50, 52, 57, 72, 100-105ERG . . . . . . . . . . . . . . . . . . . . . . . . . . . . . . . . . . . . . . . . . . . . . . . . . . . . . . . . . . . . . . . . . . . . . . 48, 56, 57, 72, 85external feedback . . . . . . . . . . . . . . . . . . . . . . . . . . . . . . . . . . . . . . . . . . . . . . . . . . . . . . . . . . . . . . . . . . . . . . . . 76feedback . . . . . . . . . . . . . . . . . . . . . . . . . . . . . . . . . . . . . . . . . . . . . . . . . . . . . . . . . . . . . . . . . . . . 17, 76, 105, 107fMRI . . . . . . . . . . . . . . . . . . . . . . . . . . . . . . . . . . . . . . . . . . . . . . . . . . . . . . . . . . . . . . . . . . . . . . . . . . . . . . . . . 12focal length . . . . . . . . . . . . . . . . . . . . . . . . . . . . . . . . . . . . . . . . . . . . . . . . . . . . . . . . . . . . . . . . . . . . . . . . . . . 112fusion . . . . . . . . . . . . . . . . . . . . . . . . . . . . . . . . . . . . . . . . . . . . . . . . . . . . . . . . . . . . . . . . . . . . . . . . . . . . 11, 112GABA . . . . . . . . . . . . . . . . . . . . . . . . . . . . . . . . . . . . . . . . . . . . . . . . . . . . . . . . . . . . . . . . . . . . . 18, 38, 39, 50-52Gaussian . . . . . . . . . . . . . . . . . . . . . . . . . . . . . . . . . . . . . . . . . . . . . . . . . . . . . . . . . . . . . . . . . . . . . . . . . 9, 80, 90genesis . . . . . . . . . . . . . . . . . . . . . . . . . . . . . . . . . . . . . . . . . . . . . . . . . . . . . . . . . . . . . . . . . . . . . . . . . . . . . . . 53genetics . . . . . . . . . . . . . . . . . . . . . . . . . . . . . . . . . . . . . . . . . . . . . . . . . . . . . . . . . . . . . . . . . . . . . . . . . . . . . . . . 3glial cell . . . . . . . . . . . . . . . . . . . . . . . . . . . . . . . . . . . . . . . . . . . . . . . . . . . . . . . . . . . . . . . . . . . . . . . . . . . . . . 52glimpse . . . . . . . . . . . . . . . . . . . . . . . . . . . . . . . . . . . . . . . . . . . . . . . . . . . . . . . . . . . . . . . . . . . . . . . . . . . . . . . 80glutamate . . . . . . . . . . . . . . . . . . . . . . . . . . . . . . . . . . . . . . . . . . . . . . . . . . . . . . . . . . . . . . . . . . 18, 37-39, 50-52glutamate shunt . . . . . . . . . . . . . . . . . . . . . . . . . . . . . . . . . . . . . . . . . . . . . . . . . . . . . . . . . . . . . . . . . . . . . . . . . 51Grassman . . . . . . . . . . . . . . . . . . . . . . . . . . . . . . . . . . . . . . . . . . . . . . . . . . . . . . . . . . . . . . . . . . . . . . . . . . 17, 99group velocity . . . . . . . . . . . . . . . . . . . . . . . . . . . . . . . . . . . . . . . . . . . . . . . . . . . . . . . . . . . . . . . . . . 20, 27, 47-49half amplitude . . . . . . . . . . . . . . . . . . . . . . . . . . . . . . . . . . . . . . . . . . . . . . . . . . . . . . . . . . . . . . . . . . 17, 66-68, 86half-amplitude . . . . . . . . . . . . . . . . . . . . . . . . . . . . . . . . . . . . . . . . . . . . . . . . . . . . . . . . . . . . . . . . . . . . . . . 66, 94Herman cable . . . . . . . . . . . . . . . . . . . . . . . . . . . . . . . . . . . . . . . . . . . . . . . . . . . . . . . . . . . . . . . . . . . . . . . . . . 48Hodgkin solution . . . . . . . . . . . . . . . . . . . . . . . . . . . . . . . . . . . . . . . . . . . . . . . . . . . . . . . . . . . . . . 84, 85, 102, 107horopter . . . . . . . . . . . . . . . . . . . . . . . . . . . . . . . . . . . . . . . . . . . . . . . . . . . . . . . . . . . . . . . . . . . . . . . . . . . 111-114hydronium . . . . . . . . . . . . . . . . . . . . . . . . . . . . . . . . . . . . . . . . . . . . . . . . . . . . . . . . . . . . . . . . . . . . . 36, 39, 43, 55hydrophilic . . . . . . . . . . . . . . . . . . . . . . . . . . . . . . . . . . . . . . . . . . . . . . . . . . . . . . . . . . . . . . . . . . . . . . 34, 57, 59hydrophobic . . . . . . . . . . . . . . . . . . . . . . . . . . . . . . . . . . . . . . . . . . . . . . . . . . . . . . . . . . . . . . . . . . . . . . . . 34, 57hypothalamus . . . . . . . . . . . . . . . . . . . . . . . . . . . . . . . . . . . . . . . . . . . . . . . . . . . . . . . . . . . . . . . . . . . . . . . . . . 18hysteresis . . . . . . . . . . . . . . . . . . . . . . . . . . . . . . . . . . . . . . . . . . . . . . . . . . . . . . . . . . . . . . . . . . . . . . . . . . . . . 108INM . . . . . . . . . . . . . . . . . . . . . . . . . . . . . . . . . . . . . . . . . . . . . . . . . . . . . . . . . . . . . . . . . . . . . . 43, 52, 56, 69, 70interaxon . . . . . . . . . . . . . . . . . . . . . . . . . . . . . . . . . . . . . . . . . . . . . . . . . . . . . . . . . . . . . . . . . . . . . . . . . . . . . . 49internal capsule . . . . . . . . . . . . . . . . . . . . . . . . . . . . . . . . . . . . . . . . . . . . . . . . . . . . . . . . . . . . . . . . . . . . . . 27, 29internal feedback . . . . . . . . . . . . . . . . . . . . . . . . . . . . . . . . . . . . . . . . . . . . . . . . . . . . . . . . . . . . . . . . . . . . . . . 105interp . . . . . . . . . . . . . . . . . . . . . . . . . . . . . . . . . . . . . . . . . . . . . . . . . . . . . . . . . . . . . . . . . . . . . . . . . 80, 115, 117ion-pump . . . . . . . . . . . . . . . . . . . . . . . . . . . . . . . . . . . . . . . . . . . . . . . . . . . . . . . . . . . . . . . . . . . . . . 33, 34, 37, 39IPM . . . . . . . . . . . . . . . . . . . . . . . . . . . . . . . . . . . . . . . . . . . . . . . . . . . . . . . . . . . . . . . . . 53, 56-59, 69-72, 75, 100isotropic absorption . . . . . . . . . . . . . . . . . . . . . . . . . . . . . . . . . . . . . . . . . . . . . . . . . . . . . . . . 59, 66, 67, 72, 75, 85Krebs . . . . . . . . . . . . . . . . . . . . . . . . . . . . . . . . . . . . . . . . . . . . . . . . . . . . . . . . . . . . . . . . . . . . . . . . . . . . . . 38, 51lamina cribosa . . . . . . . . . . . . . . . . . . . . . . . . . . . . . . . . . . . . . . . . . . . . . . . . . . . . . . . . . . . . . . . . . . . . . . . . . . 78latency . . . . . . . . . . . . . . . . . . . . . . . . . . . . . . . . . . . . . . . . . . . . . . . . . . . . . . . . . . . . . . . . . . . . . . . . . . . . . 84, 85light adaptation . . . . . . . . . . . . . . . . . . . . . . . . . . . . . . . . . . . . . . . . . . . . . . . . . . . . . . . . . . . . . . . . . . 99, 102, 103linearity . . . . . . . . . . . . . . . . . . . . . . . . . . . . . . . . . . . . . . . . . . . . . . . . . . . . . . . . . . . . . . . . . . . . . . . . . . . . 17, 98

124 Guide to Processes in Biological Vision
lipid . . . . . . . . . . . . . . . . . . . . . . . . . . . . . . . . . . . . . . . . . . . . . . . . . . . . . . . . . . . . . . . . . . . . . . . . . . . . . . . . . 34liquid crystal . . . . . . . . . . . . . . . . . . . . . . . . . . . . . . . . . . . . . . . . . . . . . . . . . . . . . . . . . . . . . . . . 55, 61, 62, 64, 83liquid crystalline . . . . . . . . . . . . . . . . . . . . . . . . . . . . . . . . . . . . . . . . . . . . 34, 39, 57, 59, 61, 63, 66-68, 70, 72, 82magnetic resonance . . . . . . . . . . . . . . . . . . . . . . . . . . . . . . . . . . . . . . . . . . . . . . . . . . . . . . . . . . . . . . . . 12, 18, 81magnocellular . . . . . . . . . . . . . . . . . . . . . . . . . . . . . . . . . . . . . . . . . . . . . . . . . . . . . . . . . . . . . . . . . . . . . . . 23, 45mesopic . . . . . . . . . . . . . . . . . . . . . . . . . . . . . . . . . . . . . . . . . . . . . . . . . . . . . . . . . . . . . . . 81, 86, 88, 89, 101, 102mesotopic . . . . . . . . . . . . . . . . . . . . . . . . . . . . . . . . . . . . . . . . . . . . . . . . . . . . . . . . . . . . . . . . . . . . . . . . . . 89, 90Meyer’s loop . . . . . . . . . . . . . . . . . . . . . . . . . . . . . . . . . . . . . . . . . . . . . . . . . . . . . . . . . . . . . . . . . . . . . . . . . . . 21microtubules . . . . . . . . . . . . . . . . . . . . . . . . . . . . . . . . . . . . . . . . . . . . . . . . . . . . . . . . . . . . . 53, 55-57, 67-70, 72midbrain . . . . . . . . . . . . . . . . . . . . . . . . . . . . . . . . . . . . . . . . . . . . . . . . . . . . . . . . . . . . . . . . . . . . . . 12, 18, 20, 23mid-brain . . . . . . . . . . . . . . . . . . . . . . . . . . . . . . . . . . . . . . . . . . . . . . . . . . . . . . . . . . . . . . . . . . . . . . . . . . . . . 23modulation . . . . . . . . . . . . . . . . . . . . . . . . . . . . . . . . . . . . . . . . . . . . . . . . . . . . . . . . . . . . . . . . 103, 104, 107-109molecular absorption . . . . . . . . . . . . . . . . . . . . . . . . . . . . . . . . . . . . . . . . . . . . . . . . . . . . . . . . . . . . . . . 63, 66, 67monopulse . . . . . . . . . . . . . . . . . . . . . . . . . . . . . . . . . . . . . . . . . . . . . . . . . . . . . . . . . . . . . . . . . . . . . . . . . . 43, 45morphogenesis . . . . . . . . . . . . . . . . . . . . . . . . . . . . . . . . . . . . . . . . . . . . . . . . . . . . . . . . . . . . . . . . . . . 13, 53, 69MRI . . . . . . . . . . . . . . . . . . . . . . . . . . . . . . . . . . . . . . . . . . . . . . . . . . . . . . . . . . . . . . . . . . . . . . . . . . . . . . . . . 81myelin . . . . . . . . . . . . . . . . . . . . . . . . . . . . . . . . . . . . . . . . . . . . . . . . . . . . . . . . . . . . . . . . . . . . . . . . . . . . . . . . 48myelinated . . . . . . . . . . . . . . . . . . . . . . . . . . . . . . . . . . . . . . . . . . . . . . . . . . . . . . . . . . . . . . . . . . 43, 46, 48, 49, 77Myelination . . . . . . . . . . . . . . . . . . . . . . . . . . . . . . . . . . . . . . . . . . . . . . . . . . . . . . . . . . . . . . . . . . . . . . 39, 42, 49narrow band . . . . . . . . . . . . . . . . . . . . . . . . . . . . . . . . . . . . . . . . . . . . . . . . . . . . . . . . . . . . . . . . . . . . . . . 99, 111neurite . . . . . . . . . . . . . . . . . . . . . . . . . . . . . . . . . . . . . . . . . . . . . . . . . . . . . . . . . . . . . . . . . . . . . . . . . . . . . 42, 48neurites . . . . . . . . . . . . . . . . . . . . . . . . . . . . . . . . . . . . . . . . . . . . . . . . . . . . . . . . . . . . . . . . . . . . . . . . . . . . . . . 42Neuron Doctrine . . . . . . . . . . . . . . . . . . . . . . . . . . . . . . . . . . . . . . . . . . . . . . . . . . . . . . . . . . . . . . . . . . . . . . . . 33neurotransmitter . . . . . . . . . . . . . . . . . . . . . . . . . . . . . . . . . . . . . . . . . . . . . . . . . . . . . . . . . . . . . . . . . . . . . 33, 38neurotransmitter dogma . . . . . . . . . . . . . . . . . . . . . . . . . . . . . . . . . . . . . . . . . . . . . . . . . . . . . . . . . . . . . . . . . . . 33neurotransmitters . . . . . . . . . . . . . . . . . . . . . . . . . . . . . . . . . . . . . . . . . . . . . . . . . . . . . . . . . . . . . . . . . . . . . . . 39neuro-facilitator . . . . . . . . . . . . . . . . . . . . . . . . . . . . . . . . . . . . . . . . . . . . . . . . . . . . . . . . . . . . . . . . . . . . . . 38, 39nictating eyelid . . . . . . . . . . . . . . . . . . . . . . . . . . . . . . . . . . . . . . . . . . . . . . . . . . . . . . . . . . . . . . . . . . . . . . . . . . 9Node of Ranvier . . . . . . . . . . . . . . . . . . . . . . . . . . . . . . . . . . . . . . . . . . . . . . . . . . . . . . . . . . 35, 41, 43-45, 49, 51noise . . . . . . . . . . . . . . . . . . . . . . . . . . . . . . . . . . . . . . . . . . . . . . . . . . . . . . . . . . . . . . . . . . . . . 62, 68, 79, 86, 106object space . . . . . . . . . . . . . . . . . . . . . . . . . . . . . . . . . . . . . 6-9, 12, 21, 31, 78, 79, 92, 94, 98, 105, 111-113, 116ocular globe . . . . . . . . . . . . . . . . . . . . . . . . . . . . . . . . . . . . . . . . . . . . . . . . . . . . . . . . . . . . . . . . . . . . . . . . . . 9, 75orthodromic . . . . . . . . . . . . . . . . . . . . . . . . . . . . . . . . . . . . . . . . . . . . . . . . . . . . . . . . . . . . . . . . . . . . . . . . . 39, 43P/D equation . . . . . . . . . . . . . . . . . . . . . . . . . . . . . . . . . . . . . . . . . . . . . . . . . . . . . . . . . . 68, 82-85, 102, 103, 107Panum’s Area . . . . . . . . . . . . . . . . . . . . . . . . . . . . . . . . . . . . . . . . . . . . . . . . . . . . . . . . . . . . . . . . . . . . . . . . . 112parvocellular . . . . . . . . . . . . . . . . . . . . . . . . . . . . . . . . . . . . . . . . . . . . . . . . . . . . . . . . . . . . . . . . . . . . . . . . 23, 45Pauli exclusion principle . . . . . . . . . . . . . . . . . . . . . . . . . . . . . . . . . . . . . . . . . . . . . . . . . . . . . . . . . . . . . . . 63, 67percept . . . . . . . . . . . . . . . . . . . . . . . . . . . . . . . . . . . . . . . . . . . . . . . . . . . . . . . . . . . . . . . . . . . . . . . . 80, 115, 117perceptual space . . . . . . . . . . . . . . . . . . . . . . . . . . . . . . . . . . . . . . . . . . . . . . . . . . . . . . . . . . . . . . . . . . . . . . . . 94perigeniculate nucleus . . . . . . . . . . . . . . . . . . . . . . . . . . . . . . . . . . . . . . . . . . . . . . . . . . . . . . . . . . . . 20, 21, 23, 30PGN/pulvinar couple . . . . . . . . . . . . . . . . . . . . . . . . . . . . . . . . . . . . . . . 14, 15, 19, 21, 22, 28-31, 77, 80, 113-115phagocytosis . . . . . . . . . . . . . . . . . . . . . . . . . . . . . . . . . . . . . . . . . . . . . . . . . . . . . . . . . . . . . . . . 55, 58, 59, 70, 75pharmacology . . . . . . . . . . . . . . . . . . . . . . . . . . . . . . . . . . . . . . . . . . . . . . . . . . . . . . . . . . . . . . . . . . . . . . . . . . 38phase velocity . . . . . . . . . . . . . . . . . . . . . . . . . . . . . . . . . . . . . . . . . . . . . . . . . . . . . . . . . . . . . . . . . . . . . . . 48, 49photodetection . . . . . . . . . . . . . . . . . . . . . . . . . . . . . . . . . . . . . . . . . . . . . . . . . . . . . . . . . . . . . . . . 64, 82, 100, 101photoexcitation/de-excitation . . . . . . . . . . . . . . . . . . . . . . . . . . . . . . . . . . . . . . . . . . . . . . . . . . . . . . . 45, 59, 68, 84photon . . . . . . . . . . . . . . . . . . . . . . . . . . . . . . . . . . . . . . . . . . . . . . . . . . . . . . . . . . . . 59, 62, 67, 68, 82, 85, 89, 91photopic . . . . . . . . . . . . . . . . . . . . . . . . . . . . . . . . . . . . . . . . . . . . . . 68, 81, 82, 86, 88-90, 95, 101, 102, 105, 114photoreceptor cell . . . . . . . . . . . . . . . . . . . . . . . . . . . . . 5, 15, 17, 53-58, 67, 69-71, 73, 75, 79, 85, 101, 105, 107pnp . . . . . . . . . . . . . . . . . . . . . . . . . . . . . . . . . . . . . . . . . . . . . . . . . . . . . . . . . . . . . . . . . . . . . . . . . . . . . . . . . . 33poda . . . . . . . . . . . . . . . . . . . . . . . . . . . . . . . . . . . . . . . . . . . . . . . . . . . . . . . . . . . . . . . . . . . . . . . . . . . . . . . . . 41poditic . . . . . . . . . . . . . . . . . . . . . . . . . . . . . . . . . . . . . . . . . . . . . . . . . . . . . . . . . . . . . . . . . . . . . 44, 46, 54, 55, 70

Tutorial on Biological Vision- 125
POS . . . . . . . . . . . . . . . . . . . . . . . . . . . . . . . . . . . . . . . . . . . . . . . . 19-21, 23, 27, 30, 31, 49, 77, 80, 111, 114-117Pretectum . . . . . . . . . . . . . . . . . . . . . . . . . . . . . . . . . . . . . . . . . . . . . . . . . . . . . . . . . . . . . . . . . . . . . . . . . . 13, 23process color . . . . . . . . . . . . . . . . . . . . . . . . . . . . . . . . . . . . . . . . . . . . . . . . . . . . . . . . . . . . . . . . . . . . . 95, 97, 98psychophysically . . . . . . . . . . . . . . . . . . . . . . . . . . . . . . . . . . . . . . . . . . . . . . . . . . . . . . . . . . . . . . . . 17, 66, 81, 96Pulvinar pathway . . . . . . . . . . . . . . . . . . . . . . . . . . . . . . . . . . . . . . . . . . . . . . . . . . . . . . . . . . . . . . . 21, 23, 27, 111pump . . . . . . . . . . . . . . . . . . . . . . . . . . . . . . . . . . . . . . . . . . . . . . . . . . . . . . . . . . . . . . . . . . . . . . . . . 33, 34, 37, 39Purkinje Effect . . . . . . . . . . . . . . . . . . . . . . . . . . . . . . . . . . . . . . . . . . . . . . . . . . . . . . . . . . . . . . . . . . . . . . . . . 90Purkinje peak . . . . . . . . . . . . . . . . . . . . . . . . . . . . . . . . . . . . . . . . . . . . . . . . . . . . . . . . . . . . . . . . . . . . . . . . . . 90quantum mechanical . . . . . . . . . . . . . . . . . . . . . . . . . . . . . . . . . . . . . . . . . . . . . . . . . . . . . . . . . . . . . 35, 41, 67, 68quantum-mechanical . . . . . . . . . . . . . . . . . . . . . . . . . . . . . . . . . . . . . . . . . . . . . . . . . 35, 55, 56, 61-63, 69, 70, 75resonance . . . . . . . . . . . . . . . . . . . . . . . . . . . . . . . . . . . . . . . . . . . . . . . . . . . . . . . . . . . . . . . . . . 12, 18, 62, 63, 81retinotopic . . . . . . . . . . . . . . . . . . . . . . . . . . . . . . . . . . . . . . . . . . . . . . . . . . . . . . . . . . . . . . . . . . . . . . . . . . 15, 78Rhodonine . . . . . . . . . . . . . . . . . . . . . . . . . . . . . . . . . . . . . . . . . . . . . . . . . . . . . . . . . . . . . . . 58, 59, 64, 66, 70, 72saccades . . . . . . . . . . . . . . . . . . . . . . . . . . . . . . . . . . . . . . . . . . . . . . . . . . . . . . . . . . . . . . . . . . . . 31, 79, 114, 116saliency map . . . . . . . . . . . . . . . . . . . . . . . . . . . . . . . . . . . . . . . . . . . . . . . . . . . . 15, 23, 29, 30, 77, 111, 113-117scotopic . . . . . . . . . . . . . . . . . . . . . . . . . . . . . . . . . . . . . . . . . . . . . . . . . . . . . . . 68, 75, 81, 82, 86-88, 90, 91, 102secondary . . . . . . . . . . . . . . . . . . . . . . . . . . . . . . . . . . . . . . . . . . . . . . . . . . . . . . . . . . . . . . . . . . . 3, 22, 23, 38, 82servo loop . . . . . . . . . . . . . . . . . . . . . . . . . . . . . . . . . . . . . . . . . . . . . . . . . . . . . . . . . . . . . . . . . . . . . . . . 107, 114servomechanism . . . . . . . . . . . . . . . . . . . . . . . . . . . . . . . . . . . . . . . . . . . . . . . . . . . . . . . . . . 19, 20, 23, 27, 30, 77simple eye . . . . . . . . . . . . . . . . . . . . . . . . . . . . . . . . . . . . . . . . . . . . . . . . . . . . . . . . . . . . . . . . . . . . . . . . . . . . 6, 7SRBP . . . . . . . . . . . . . . . . . . . . . . . . . . . . . . . . . . . . . . . . . . . . . . . . . . . . . . . . . . . . . . . . . . . . . . . . . . . . . . . . 64stellate cell . . . . . . . . . . . . . . . . . . . . . . . . . . . . . . . . . . . . . . . . . . . . . . . . . . . . . . . . . . . . . . . . . . . . . . . . . . . . 46stereopsis . . . . . . . . . . . . . . . . . . . . . . . . . . . . . . . . . . . . . . . . . . . . . . . . . . . . . . . . . . . 8, 10, 31, 81, 111, 113, 114subtractive color . . . . . . . . . . . . . . . . . . . . . . . . . . . . . . . . . . . . . . . . . . . . . . . . . . . . . . . . . . . . . . . . . . . . . . . . 98suction micropipette . . . . . . . . . . . . . . . . . . . . . . . . . . . . . . . . . . . . . . . . . . . . . . . . . . . . . . . . . . . . . . . . . . . . . 85suction pipette . . . . . . . . . . . . . . . . . . . . . . . . . . . . . . . . . . . . . . . . . . . . . . . . . . . . . . . . . . . . . . . . . . . . . . . . . . 67super colliculus . . . . . . . . . . . . . . . . . . . . . . . . . . . . . . . . . . . . . . . . . . . . . . . . . . . . . . . . . . . . . . . . . . . . . . . . . 23superior colliculus . . . . . . . . . . . . . . . . . . . . . . . . . . . . . . . . . . . . . . . . . . . . . . . 13-15, 21, 23, 24, 30, 31, 76, 115supernatant . . . . . . . . . . . . . . . . . . . . . . . . . . . . . . . . . . . . . . . . . . . . . . . . . . . . . . . . . . . . . . . . . . . . . . . . . . . . 61synapse . . . . . . . . . . . . . . . . . . . . . . . . . . . . . . . . . . . . . . . . . . . . . . . . . . . . . . . . . . . . . . 18, 33, 35, 39-41, 43, 49templates . . . . . . . . . . . . . . . . . . . . . . . . . . . . . . . . . . . . . . . . . . . . . . . . . . . . . . . . . . . . . . . . . . . . . . . . . . . . . . 85test set . . . . . . . . . . . . . . . . . . . . . . . . . . . . . . . . . . . . . . . . . . . . . . . . . . . . . . . . . . . . . . . . . . . . . . . . . . . . . 33, 85tetrachromats . . . . . . . . . . . . . . . . . . . . . . . . . . . . . . . . . . . . . . . . . . . . . . . . . . . . . . . . . . . . . . . . . . . . . . 3, 16, 94thalamic reticular nucleus . . . . . . . . . . . . . . . . . . . . . . . . . . . . . . . . . . . . . . . . . . . . . . . 13-15, 18, 19, 27, 30, 114thalamus . . . . . . . . . . . . . . . . . . . . . . . . . . . . . . . . . . . . . . 12, 13, 15, 18, 19, 21, 23, 24, 27, 29, 30, 111, 115, 117time delay . . . . . . . . . . . . . . . . . . . . . . . . . . . . . . . . . . . . . . . . . . . . . . . . . . . . . . . . . . . . . . . 20, 30, 48, 49, 78, 82topography . . . . . . . . . . . . . . . . . . . . . . . . . . . . . . . . . . . . . . . . . . . . . . . . . . . . . . . . . . . . . . . . . . . . . . . . . . . . 75topology . . . . . . . . . . . . . . . . . . . . . . . . . . . . . . . . . . . . . . . . . . . . . . . . . . . . . . . . . . . . . . . . . . . . . . . . 36, 37, 41traffic analysis . . . . . . . . . . . . . . . . . . . . . . . . . . . . . . . . . . . . . . . . . . . . . . . . . . . . . . . . . . . . . . . . . . . . . . . 18, 24transcendental . . . . . . . . . . . . . . . . . . . . . . . . . . . . . . . . . . . . . . . . . . . . . . . . . . . . . . . . . . . . . . . . . . . . . . . 27, 78transistor action . . . . . . . . . . . . . . . . . . . . . . . . . . . . . . . . . . . . . . . . . . . . . . . . . . . . . . . . . . . . . . . . . . . . . . 36, 37transport velocity . . . . . . . . . . . . . . . . . . . . . . . . . . . . . . . . . . . . . . . . . . . . . . . . . . . . . . . . . . . . . . . . . . . . . . . . 47tremor . . . . . . . . . . . . . . . . . . . . . . . . . . . . . . . . . . . . . . . . . . . . . . . . 12, 17, 19, 21, 31, 77, 79, 80, 106, 109, 116trichromats . . . . . . . . . . . . . . . . . . . . . . . . . . . . . . . . . . . . . . . . . . . . . . . . . . . . . . . . . . . . . . . . . . . . . . . . . . 3, 88trigonometric . . . . . . . . . . . . . . . . . . . . . . . . . . . . . . . . . . . . . . . . . . . . . . . . . . . . . . . . . . . . . . . . . . . . . . . . . . . 78Univariance . . . . . . . . . . . . . . . . . . . . . . . . . . . . . . . . . . . . . . . . . . . . . . . . . . . . . . . . . . . . . . . . . . . . . . . . . . . . 91V1 . . . . . . . . . . . . . . . . . . . . . . . . . . . . . . . . . . . . . . . . . . . . . . . . . . . . . . . . . . . . . . . . . . . . . . . . . . . . . . 111, 114vascular matrix . . . . . . . . . . . . . . . . . . . . . . . . . . . . . . . . . . . . . . . . . . . . . . . . . . . . . . . . . . . . . . . . . . . . . . . . . 70velocity . . . . . . . . . . . . . . . . . . . . . . . . . . . . . . . . . . . . . . . . . . . . . . . . . . . . . . . . . . . . . . . . . 20, 27, 44, 46-49, 82VEP . . . . . . . . . . . . . . . . . . . . . . . . . . . . . . . . . . . . . . . . . . . . . . . . . . . . . . . . . . . . . . . . . . . . . . . . . . . 12, 15, 81version . . . . . . . . . . . . . . . . . . . . . . . . . . . . . . . . . . . . . . . . . . . . . . . . . . . . . . . . . . . . . . . . . . . . . . . . . . . . . . . 19vesicles . . . . . . . . . . . . . . . . . . . . . . . . . . . . . . . . . . . . . . . . . . . . . . . . . . . . . . . . . . . . . . . . . . . . 39, 40, 58, 59, 64visual evoked potential . . . . . . . . . . . . . . . . . . . . . . . . . . . . . . . . . . . . . . . . . . . . . . . . . . . . . . . . . . . . . . . . 12, 81

126 Guide to Processes in Biological Vision
Vitamin A1 . . . . . . . . . . . . . . . . . . . . . . . . . . . . . . . . . . . . . . . . . . . . . . . . . . . . . . . . . . . . . . . . . . . . . . . . 2, 64-66Vitamin A2 . . . . . . . . . . . . . . . . . . . . . . . . . . . . . . . . . . . . . . . . . . . . . . . . . . . . . . . . . . . . . . . . . . . . . . . . 2, 3, 66Vitamin A3 . . . . . . . . . . . . . . . . . . . . . . . . . . . . . . . . . . . . . . . . . . . . . . . . . . . . . . . . . . . . . . . . . . . . . . . . . . . 2, 3volition mode . . . . . . . . . . . . . . . . . . . . . . . . . . . . . . . . . . . . . . . . . . . . . . . . . . . . . . . . . . . . . . . . . . . . 11, 19, 21Yarbus . . . . . . . . . . . . . . . . . . . . . . . . . . . . . . . . . . . . . . . . . . . . . . . . . . . . . . . . . . . . . . . . . . . . . . . . . . . . . . . . 79Y-channel . . . . . . . . . . . . . . . . . . . . . . . . . . . . . . . . . . . . . . . . . . . . . . . . . . . . . . . . . . . . . . . . . . . . . . . . . . 30, 31

Tutorial on Biological Vision- 127
1. Trevarthen, C. & Sperry, R. (1973) Perceptual unity of the ambient visual field in human commissurotomypatients. Brain, vol. 96, pp 547-570
2. Kandel, E. Schwartz, J. & Jessell, T. (2000) Principles of neural science, 4th ed. NY: McGraw-Hill. pg. 498-500
3. Skavenski, A. Hansen, R. Steinman, R. & Winterson, B. (1979) Quality of retinal image stabilization duringsmall natural and artificial body rotations in man Vision Res. vol. 19, pp. 675-683
4. North, A. & Fairchild, M. (1993) Measuring color-matching functions. Part II. Color Res. Appl. vol. 18, no. 3,pp. 163-170
5. Hecht, S. Haig, C. & Chase, A. (1937) The influence of light adaptation on subsequent dark adaptation of theeye. J. Gen. Physiol. Vol. 20, pp. 831-850
6. Tyler, C. & Scott, A. (1979) Binocular vision, Chapter 22 in Records, R. Op. Cit. pp 650-656
Endnotes