Embed Size (px)
Citation preview
Outcome Rate Calculator Page | 1
Tutorial for Using the Outcome Rate Calculator
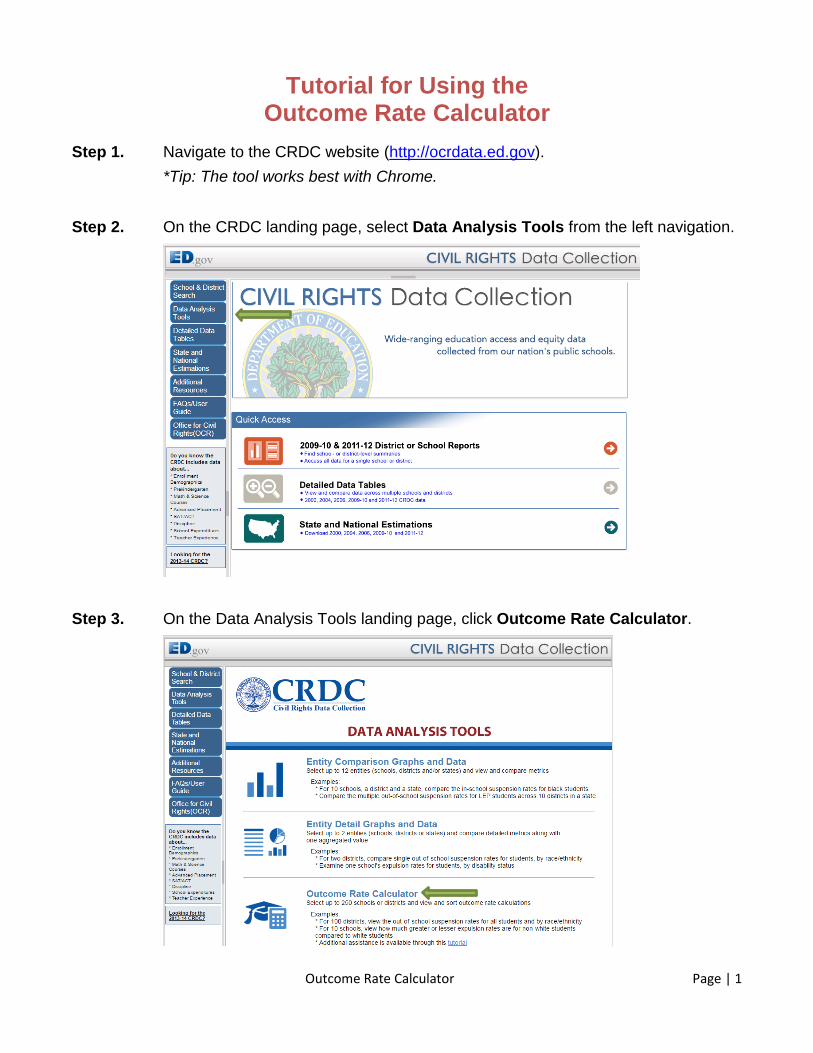
Step 1. Navigate to the CRDC website (http://ocrdata.ed.gov). *Tip: The tool works best with Chrome.
Step 2. On the CRDC landing page, select Data Analysis Tools from the left navigation.
Step 3. On the Data Analysis Tools landing page, click Outcome Rate Calculator.
Outcome Rate Calculator Page | 2
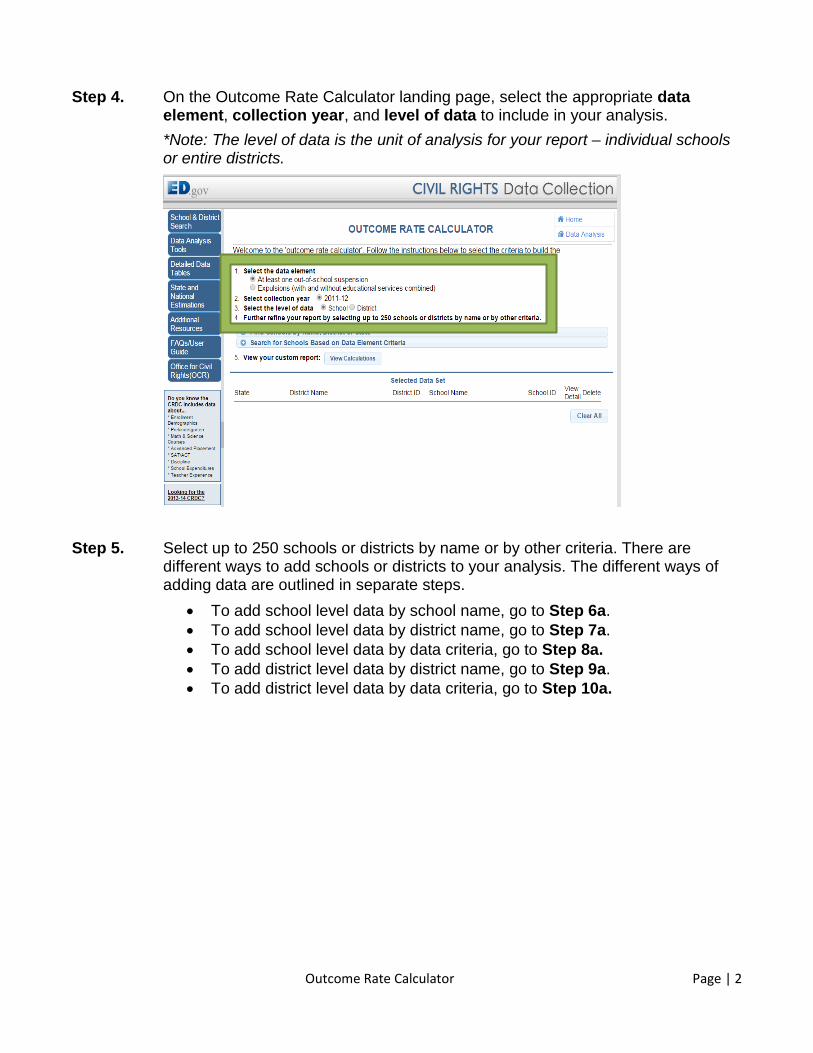
Step 4. On the Outcome Rate Calculator landing page, select the appropriate data element, collection year, and level of data to include in your analysis. *Note: The level of data is the unit of analysis for your report – individual schools or entire districts.
Step 5. Select up to 250 schools or districts by name or by other criteria. There are different ways to add schools or districts to your analysis. The different ways of adding data are outlined in separate steps.
• To add school level data by school name, go to Step 6a. • To add school level data by district name, go to Step 7a. • To add school level data by data criteria, go to Step 8a. • To add district level data by district name, go to Step 9a. • To add district level data by data criteria, go to Step 10a.
Outcome Rate Calculator Page | 3
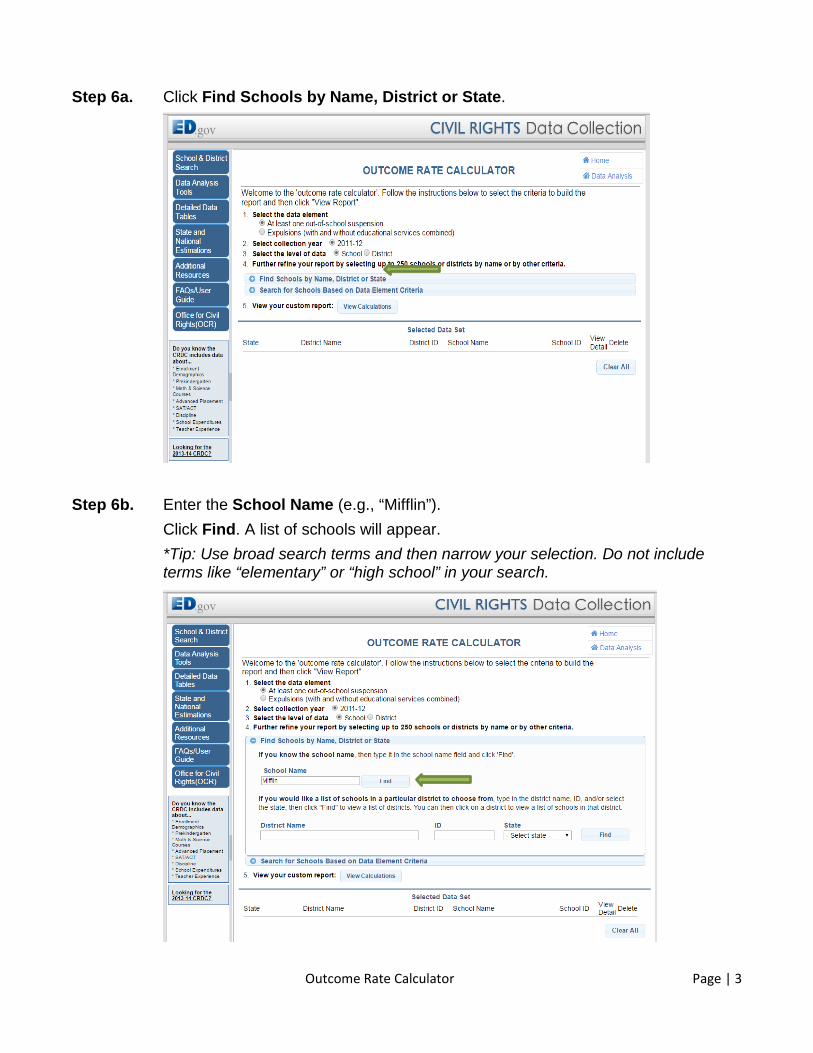
Step 6a. Click Find Schools by Name, District or State.
Step 6b. Enter the School Name (e.g., “Mifflin”). Click Find. A list of schools will appear. *Tip: Use broad search terms and then narrow your selection. Do not include terms like “elementary” or “high school” in your search.
Outcome Rate Calculator Page | 4
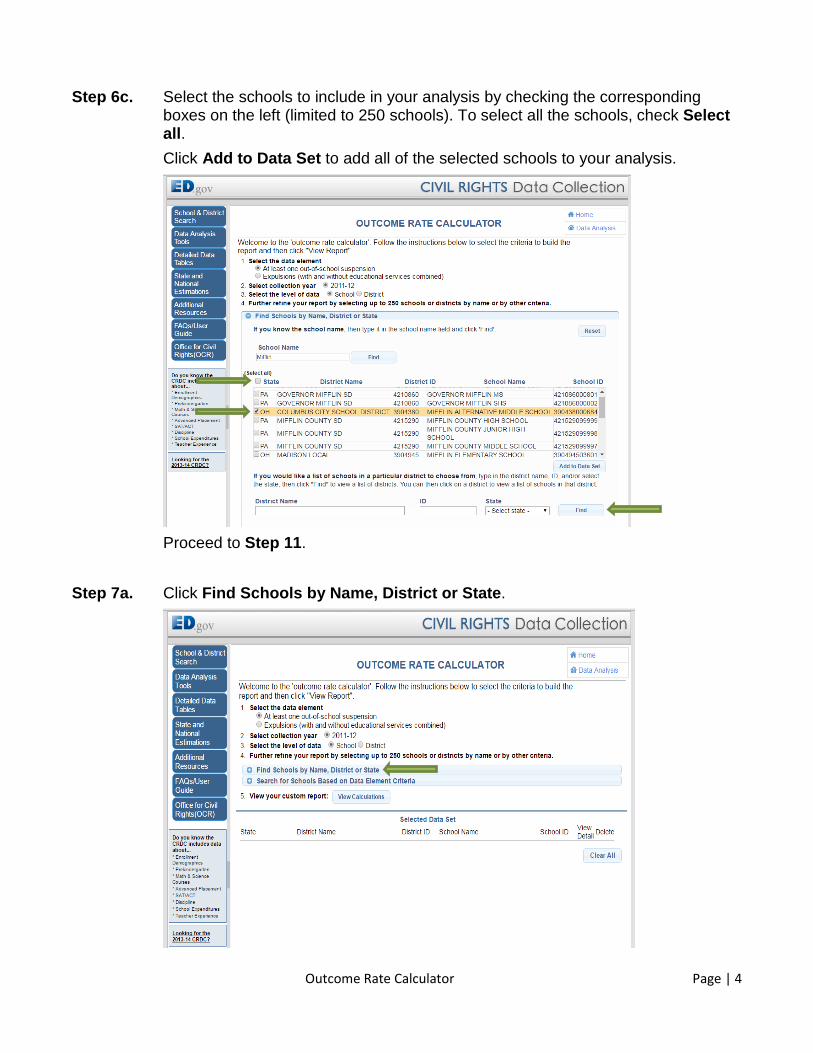
Step 6c. Select the schools to include in your analysis by checking the corresponding boxes on the left (limited to 250 schools). To select all the schools, check Select all. Click Add to Data Set to add all of the selected schools to your analysis.
Proceed to Step 11.
Step 7a. Click Find Schools by Name, District or State.
Outcome Rate Calculator Page | 5
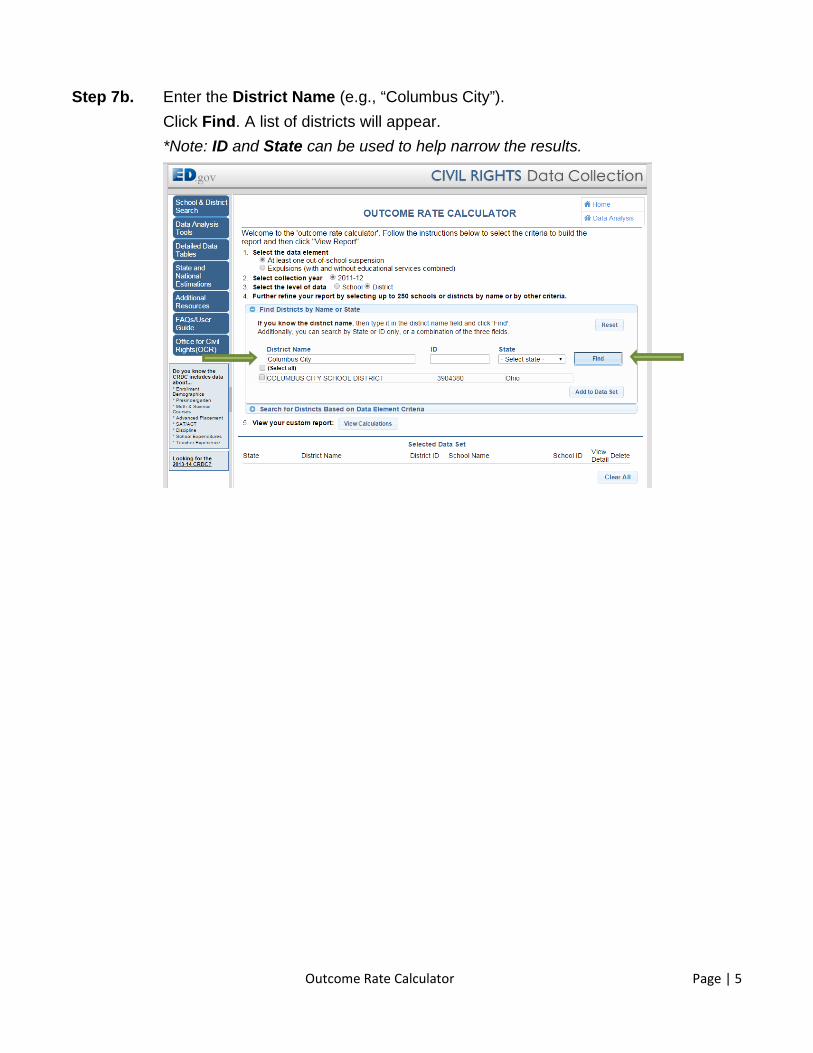
Step 7b. Enter the District Name (e.g., “Columbus City”). Click Find. A list of districts will appear. *Note: ID and State can be used to help narrow the results.
Outcome Rate Calculator Page | 6
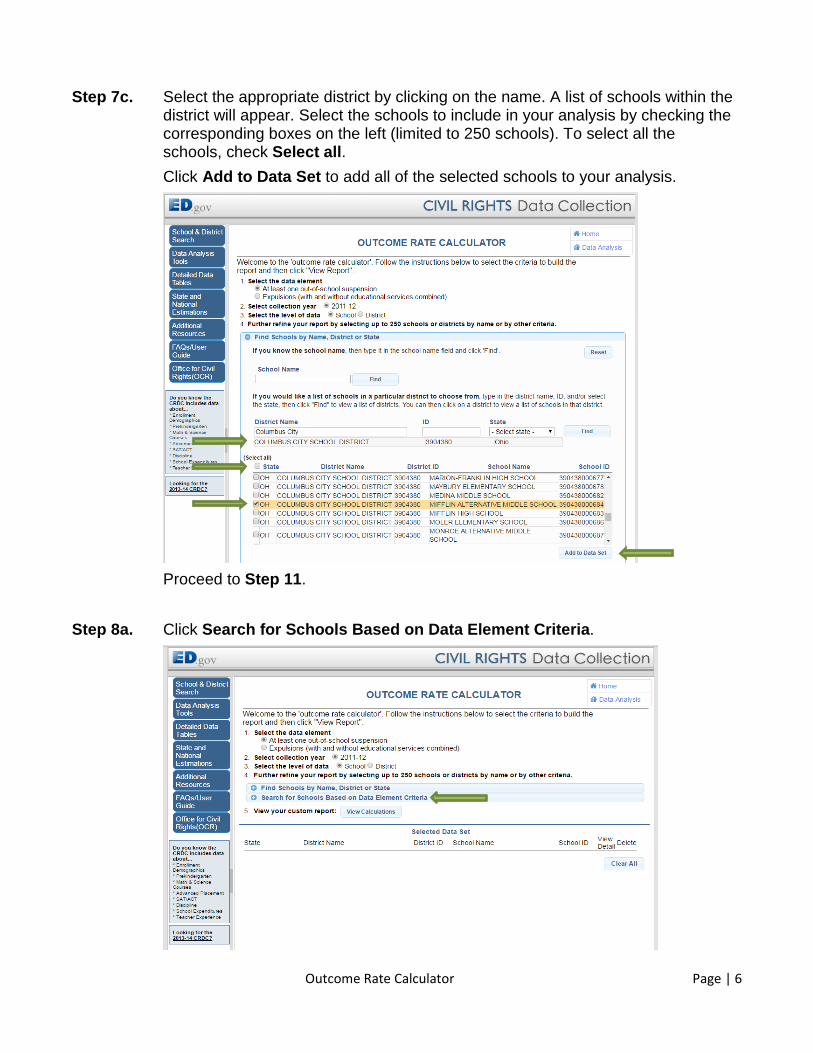
Step 7c. Select the appropriate district by clicking on the name. A list of schools within the district will appear. Select the schools to include in your analysis by checking the corresponding boxes on the left (limited to 250 schools). To select all the schools, check Select all. Click Add to Data Set to add all of the selected schools to your analysis.
Proceed to Step 11.
Step 8a. Click Search for Schools Based on Data Element Criteria.
Outcome Rate Calculator Page | 7
Step 8b.
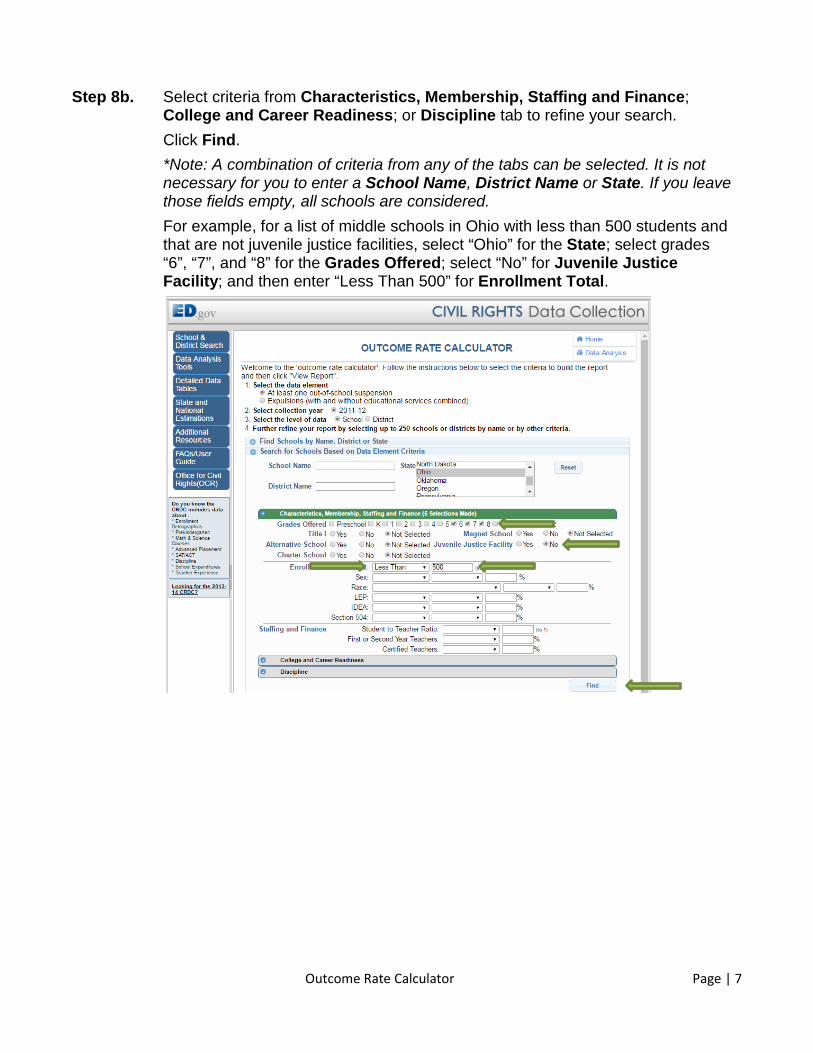
Select criteria from Characteristics, Membership, Staffing and Finance; College and Career Readiness; or Discipline tab to refine your search. Click Find. *Note: A combination of criteria from any of the tabs can be selected. It is not necessary for you to enter a School Name, District Name or State. If you leave those fields empty, all schools are considered. For example, for a list of middle schools in Ohio with less than 500 students and that are not juvenile justice facilities, select “Ohio” for the State; select grades “6”, “7”, and “8” for the Grades Offered; select “No” for Juvenile Justice Facility; and then enter “Less Than 500” for Enrollment Total.
Outcome Rate Calculator Page | 8
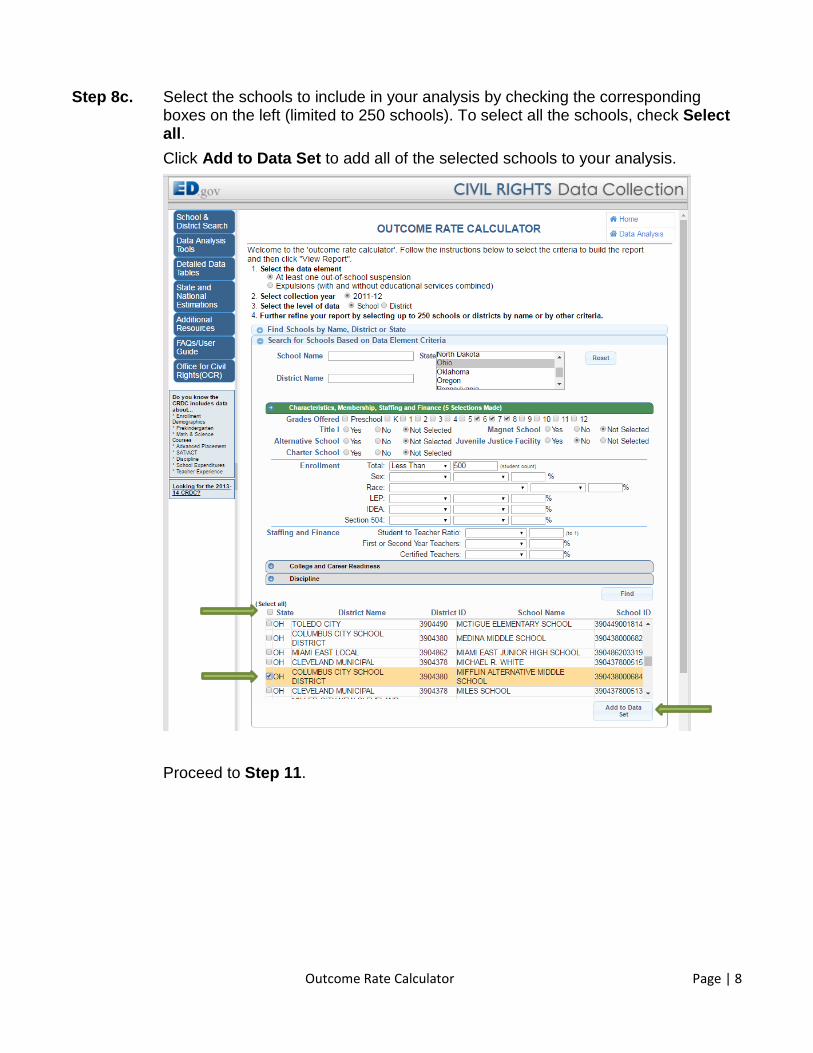
Step 8c. Select the schools to include in your analysis by checking the corresponding boxes on the left (limited to 250 schools). To select all the schools, check Select all. Click Add to Data Set to add all of the selected schools to your analysis.
Proceed to Step 11.
Outcome Rate Calculator Page | 9
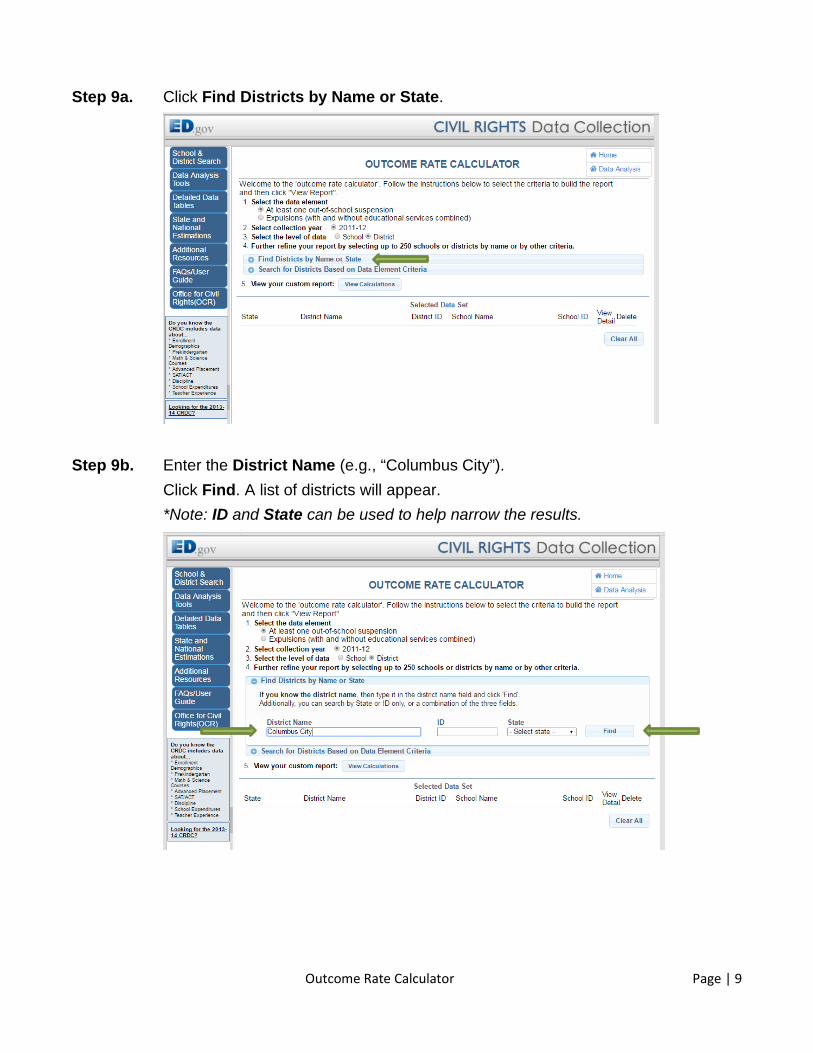
Step 9a. Click Find Districts by Name or State.
Step 9b. Enter the District Name (e.g., “Columbus City”). Click Find. A list of districts will appear. *Note: ID and State can be used to help narrow the results.
Outcome Rate Calculator Page | 10
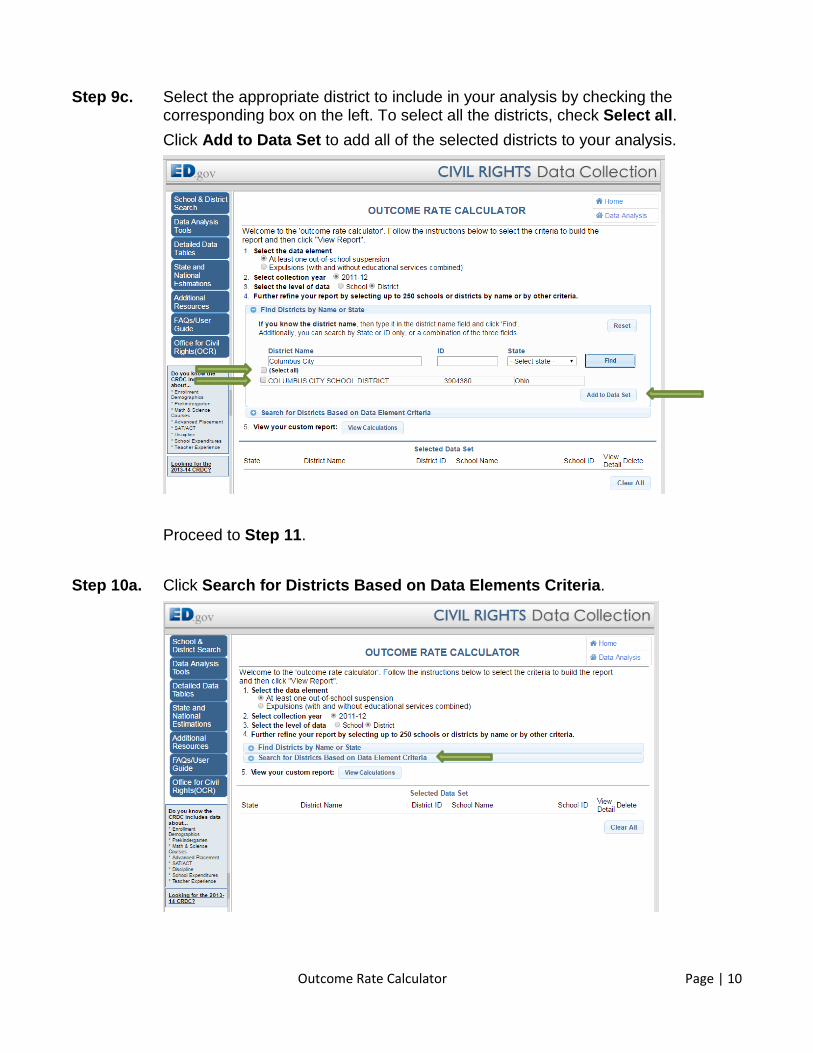
Step 9c. Select the appropriate district to include in your analysis by checking the corresponding box on the left. To select all the districts, check Select all. Click Add to Data Set to add all of the selected districts to your analysis.
Proceed to Step 11.
Step 10a. Click Search for Districts Based on Data Elements Criteria.
Outcome Rate Calculator Page | 11
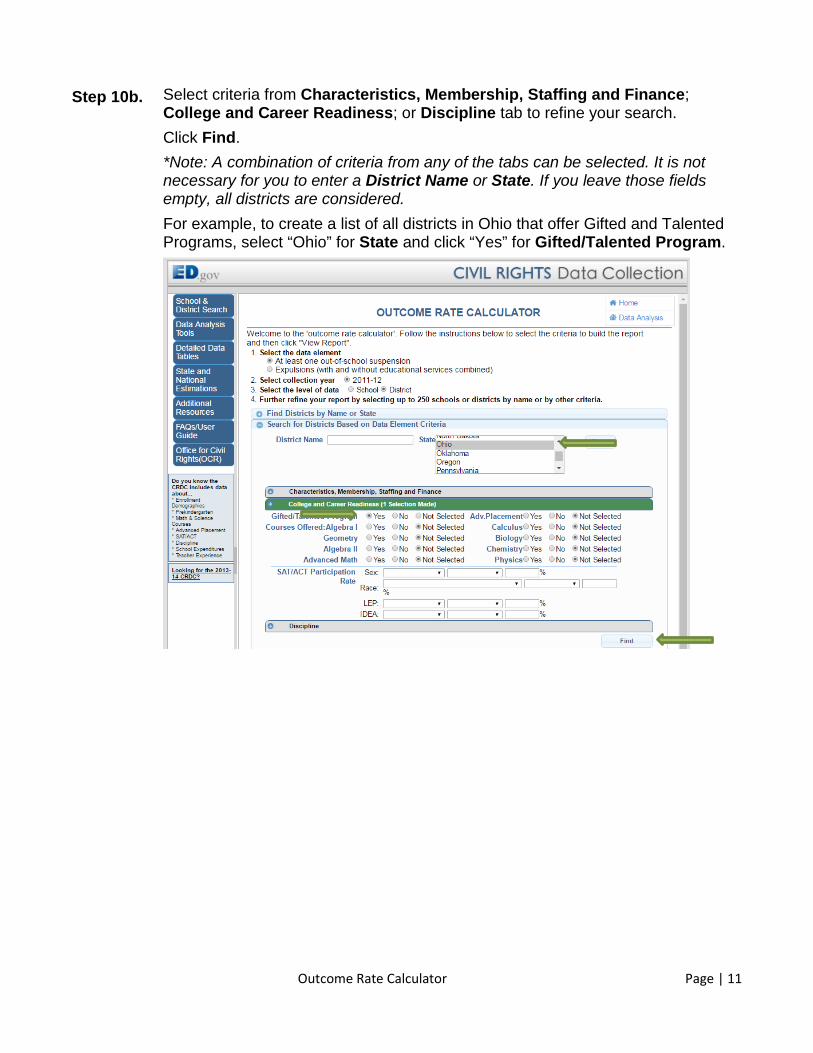
Step 10b. Select criteria from Characteristics, Membership, Staffing and Finance; College and Career Readiness; or Discipline tab to refine your search. Click Find. *Note: A combination of criteria from any of the tabs can be selected. It is not necessary for you to enter a District Name or State. If you leave those fields empty, all districts are considered. For example, to create a list of all districts in Ohio that offer Gifted and Talented Programs, select “Ohio” for State and click “Yes” for Gifted/Talented Program.
Outcome Rate Calculator Page | 12
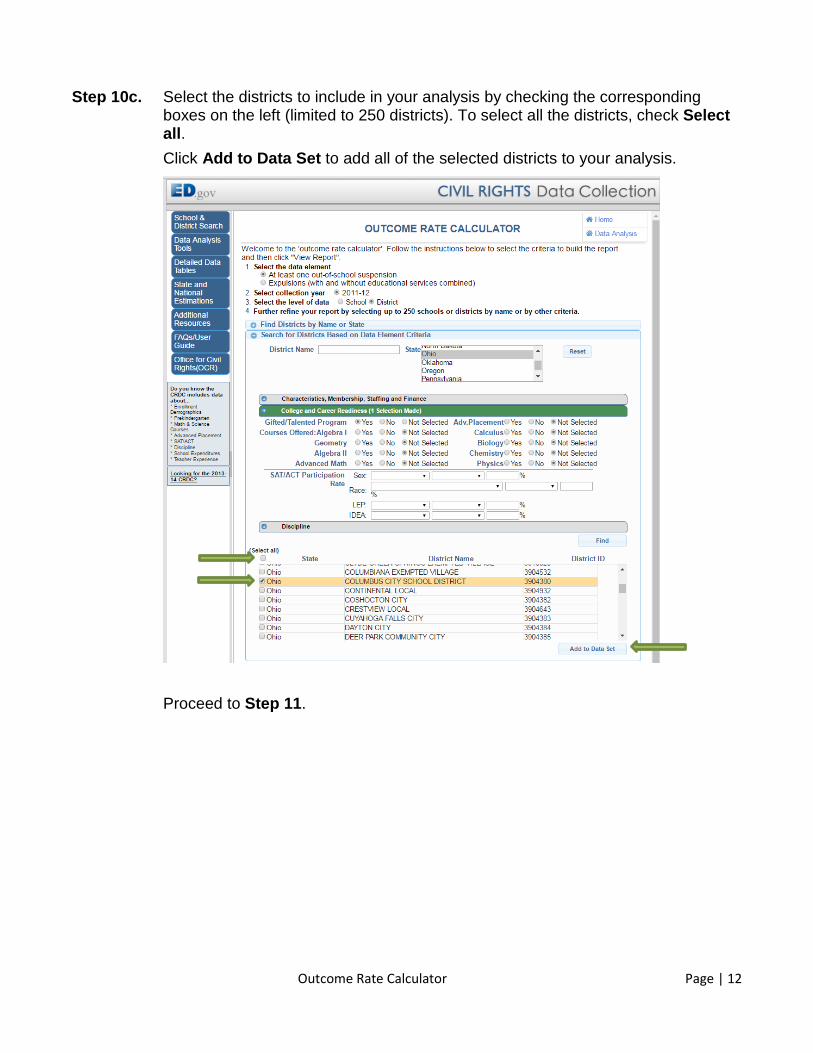
Step 10c. Select the districts to include in your analysis by checking the corresponding boxes on the left (limited to 250 districts). To select all the districts, check Select all. Click Add to Data Set to add all of the selected districts to your analysis.
Proceed to Step 11.
Outcome Rate Calculator Page | 13
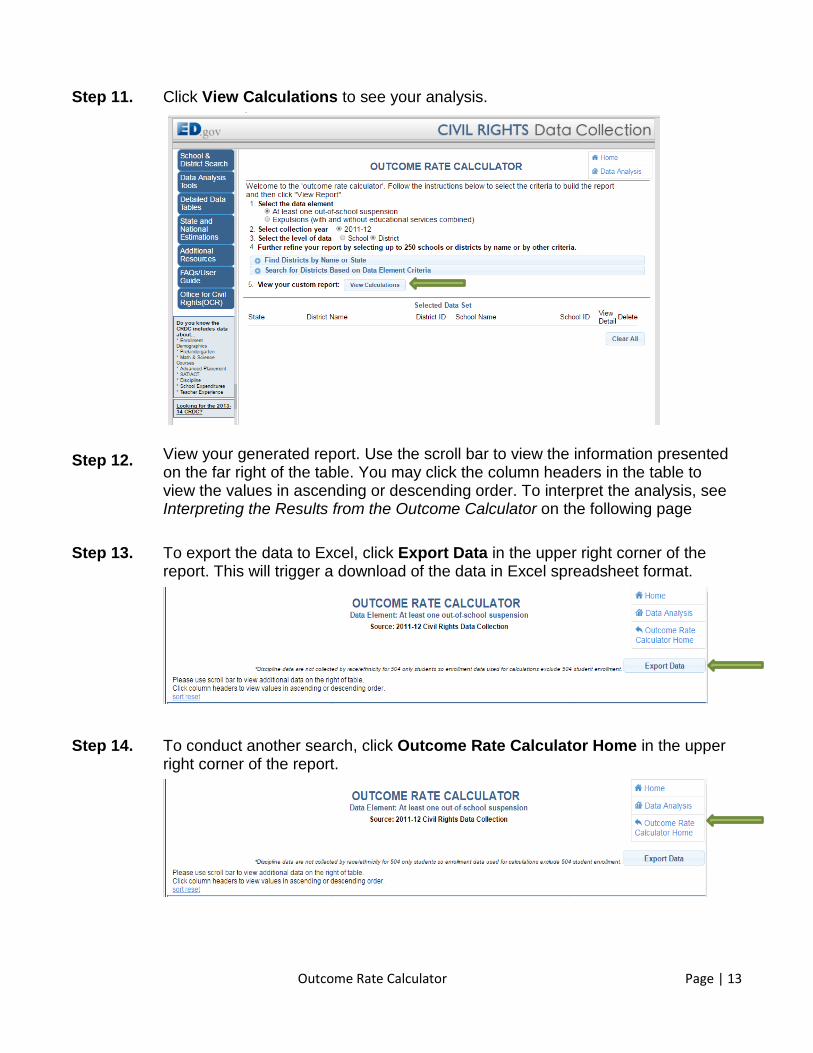
Step 11. Click View Calculations to see your analysis.
Step 12. View your generated report. Use the scroll bar to view the information presented on the far right of the table. You may click the column headers in the table to view the values in ascending or descending order. To interpret the analysis, see Interpreting the Results from the Outcome Calculator on the following page
Step 13. To export the data to Excel, click Export Data in the upper right corner of the report. This will trigger a download of the data in Excel spreadsheet format.
Step 14. To conduct another search, click Outcome Rate Calculator Home in the upper right corner of the report.
Outcome Rate Calculator Page | 14
Interpreting the Results from the Outcome Rate Calculator
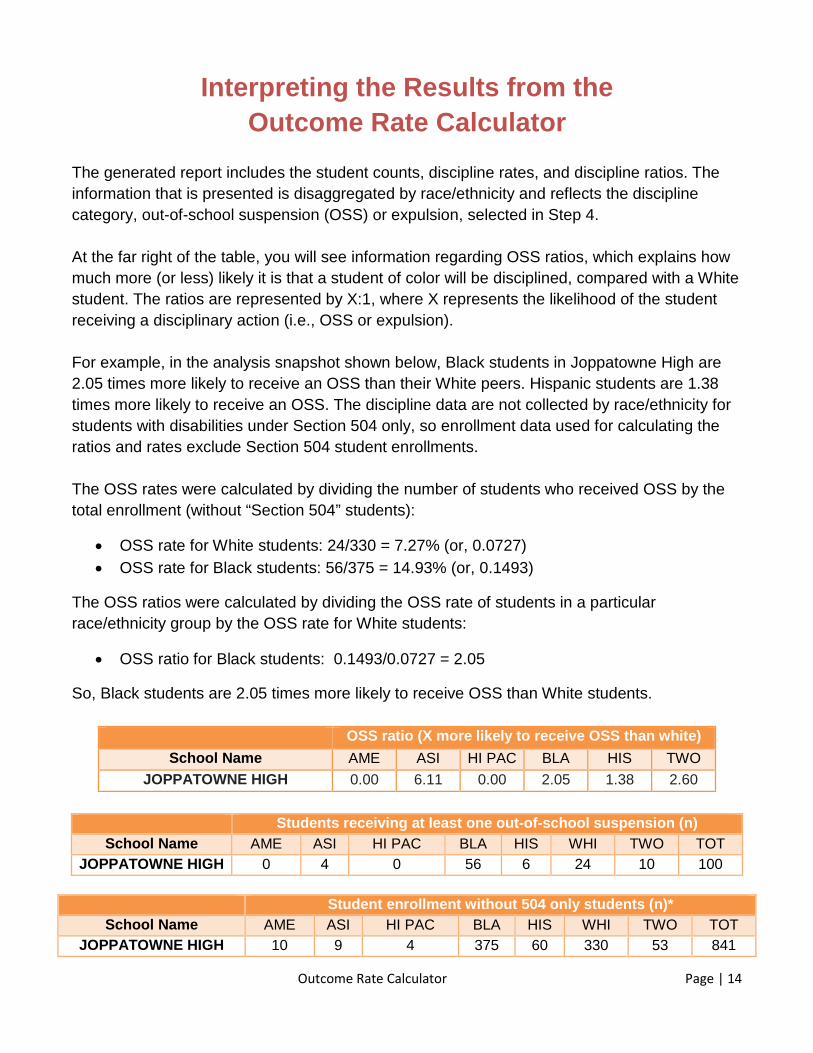
The generated report includes the student counts, discipline rates, and discipline ratios. The information that is presented is disaggregated by race/ethnicity and reflects the discipline category, out-of-school suspension (OSS) or expulsion, selected in Step 4. At the far right of the table, you will see information regarding OSS ratios, which explains how much more (or less) likely it is that a student of color will be disciplined, compared with a White student. The ratios are represented by X:1, where X represents the likelihood of the student receiving a disciplinary action (i.e., OSS or expulsion). For example, in the analysis snapshot shown below, Black students in Joppatowne High are 2.05 times more likely to receive an OSS than their White peers. Hispanic students are 1.38 times more likely to receive an OSS. The discipline data are not collected by race/ethnicity for students with disabilities under Section 504 only, so enrollment data used for calculating the ratios and rates exclude Section 504 student enrollments. The OSS rates were calculated by dividing the number of students who received OSS by the total enrollment (without “Section 504” students):
• OSS rate for White students: 24/330 = 7.27% (or, 0.0727) • OSS rate for Black students: 56/375 = 14.93% (or, 0.1493)
The OSS ratios were calculated by dividing the OSS rate of students in a particular race/ethnicity group by the OSS rate for White students:
• OSS ratio for Black students: 0.1493/0.0727 = 2.05
So, Black students are 2.05 times more likely to receive OSS than White students.
OSS ratio (X more likely to receive OSS than white) School Name AME ASI HI PAC BLA HIS TWO
JOPPATOWNE HIGH 0.00 6.11 0.00 2.05 1.38 2.60
Students receiving at least one out-of-school suspension (n) School Name AME ASI HI PAC BLA HIS WHI TWO TOT
JOPPATOWNE HIGH 0 4 0 56 6 24 10 100
Student enrollment without 504 only students (n)* School Name AME ASI HI PAC BLA HIS WHI TWO TOT
JOPPATOWNE HIGH 10 9 4 375 60 330 53 841
Outcome Rate Calculator Page | 15
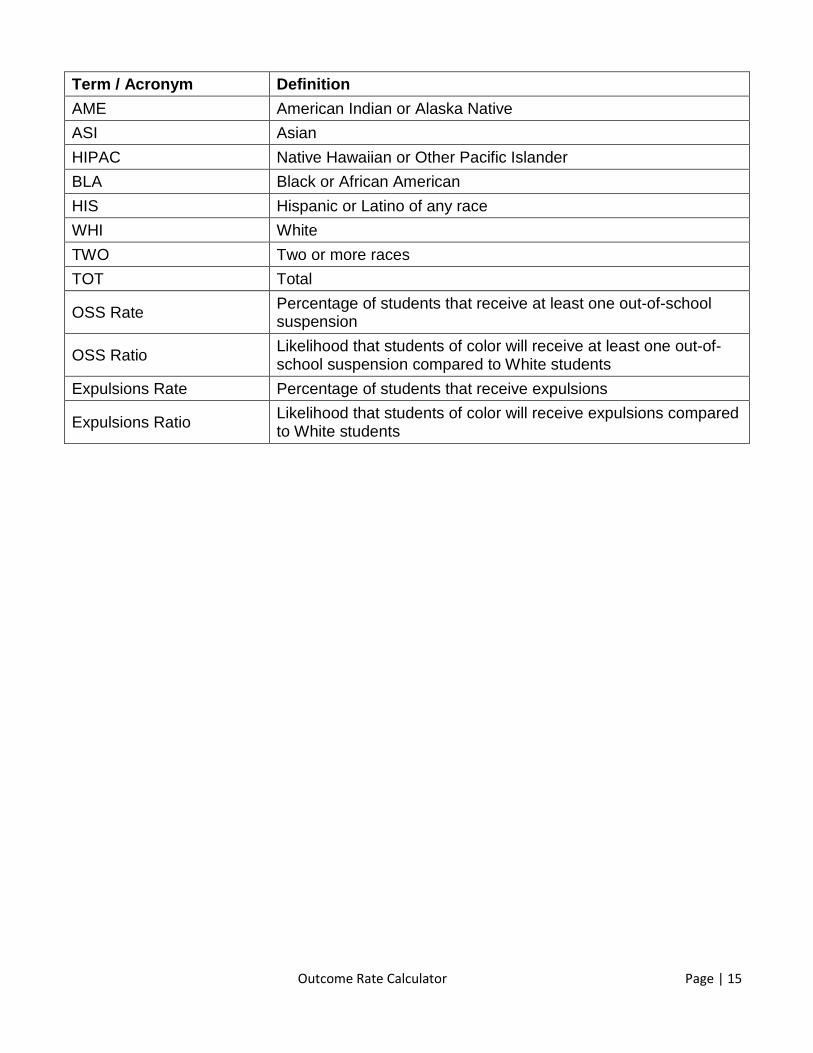
Term / Acronym Definition AME American Indian or Alaska Native ASI Asian HIPAC Native Hawaiian or Other Pacific Islander BLA Black or African American HIS Hispanic or Latino of any race WHI White TWO Two or more races TOT Total
OSS Rate Percentage of students that receive at least one out-of-school suspension
OSS Ratio Likelihood that students of color will receive at least one out-of-school suspension compared to White students
Expulsions Rate Percentage of students that receive expulsions
Expulsions Ratio Likelihood that students of color will receive expulsions compared to White students


![Calculator Tutorial[1]](https://img.pdfslide.us/doc/110x75/577d23081a28ab4e1e98cec1/calculator-tutorial1.jpg)
