Embed Size (px)
Citation preview

1
Tute 3 on Ratios
16.2.4
Question 1 Annastacia Nicholls has requested your assistance with assessing her business’ performance. The following performance indicators have been calculated for the years ended 30
September 2015 and 2016.
30 September 2015
30 September
2016
Working Capital Ratio 2.43:1 4.97:1 Quick Assets Ratio 1.67:1 0.72:1 Cash Flow Ratio 3.45 times 5.98 times Debtors Turnover 62 days 49 days
Stock Turnover 38 days 67 days Annastacia has recently applied for a loan from the bank, however the bank advised her that she
was unlikely to have the loan approved due to the business’ poor liquidity. Annastacia doesn’t
understand how this is possible as she claims her cash sales have increased, and she has more
money in the bank than she has ever had before.
a. Analyse the performance indicators above and explain to Annastacia the key concern
which has led to the bank being concerned about her business’ liquidity.
b. Suggest one strategy Annastacia can implement to improve her liquidity and efficiency. c. State three non-financial indicators that Annastacia could use to further evaluate
her entity’s performance.

2
d. Using the information in the graph below, explain how it is possible that the Net Profit
Margin can rise, despite the Gross Profit Margin falling in 2016.
60% 55%
49%
50%
35%
40%
25%
30%
17% 19%
20%
10%
0%
Net Profit Margin Gross Profit Margin Return on Assets
2015
2016
30 September 2015 30 September 2016 Industry Average
Asset Turnover 4.65 times 2.06 times 3.36 times
(c) Using the information in the graph and table above, suggest one strategy the owner
could implement to improve the business’ Return on Assets.
f. Describe two limitations of using performance indicators to assess an entity’s
performance.
3
16.2.may.4
Question 2
At 31 December 2016 the accountant provided the following information:
Graph 1
12%
10%
8%
%
6%
4%
2%
0%
2014
2015
2016
Return on Owner's Investment
5%
8%
10%
Return on Total Assets
3%
6%
9%
Graph 2
2016
2015
2014
0 200,000 400,000 600,000 800,000 1,000,000 1,200,000
2014 2015 2016
Sales
650,000
680,000
710,000
Cost of Goods Sold
422,500
442,000
461,500
The owner commented that he was pleased with the results shown because the
improvement in Sales has led to a higher Net Profit and hence the higher return.
Using the information in Graphs 1 and 2, discuss the owner’s statement.
4
2016.sample.4
Question 3 Elizabeth La Trobe is an investor that analyses businesses using performance indicators prior
to making a decision whether to invest in them or not. Her investments are usually in the
form of loans to small businesses. Elizabeth has the option of investing in any of the three businesses below:
Business A Business B Business C Gearing Ratio 25% 65% 90%
Elizabeth is risk-averse, meaning that she would rather invest in businesses with lower risk,
compared to those taking on a greater risk.
a. Identify which of the three businesses above would be preferable for Elizabeth?
b. Interpret the performance indicator you selected in part a.
c. Compare and contrast vertical and horizontal analysis. In your response describe one
advantage of each.
d. Describe the DuPont method of assessment, and provide an example of a
performance indicator where this inter-relationship is evident.
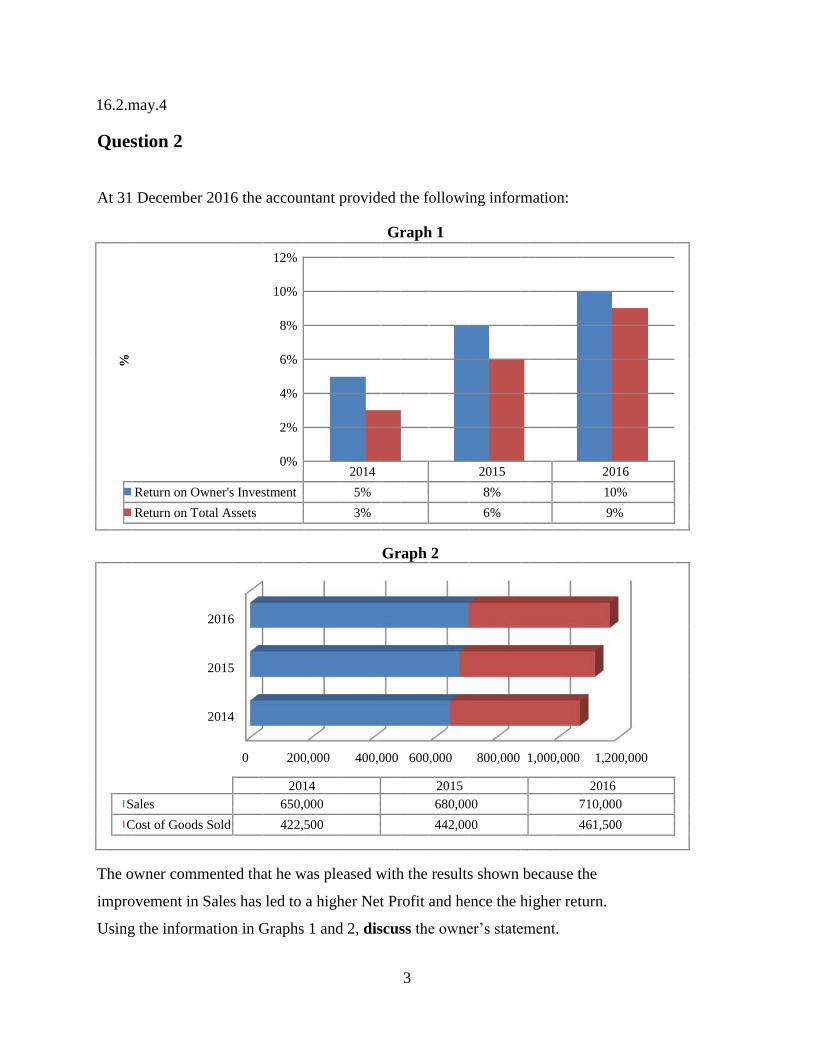
William Spring’s business Spring’s Exhibition has provided you with the following information.
Return on Owner’s Return on Owner’s Return on Return on Investing Return on
Investment Investment Investing in Shares in Property Investing in Cash 2015 2016 2016 2016 2016 4% 6% 8.5% 7% 2%
William is considering investing an amount of $150 000 from his personal savings into the
business.
e. Based on the information in the table above, would you advise him to do this? In
your response, you should discuss the reasoning behind your recommendation.
Since 2014, William’s business has ended the year with a Debtors Turnover of 43 days, 65
days and 92 days respectively. In response to this alarming trend, William has increased
the discount offered to debtors for early payment from 2% to 10%.
f. State three suggestions, other than providing a discount for early repayment, that
William could implement to improve the entity’s Debtors Turnover.
5
15.2.2
Question 4
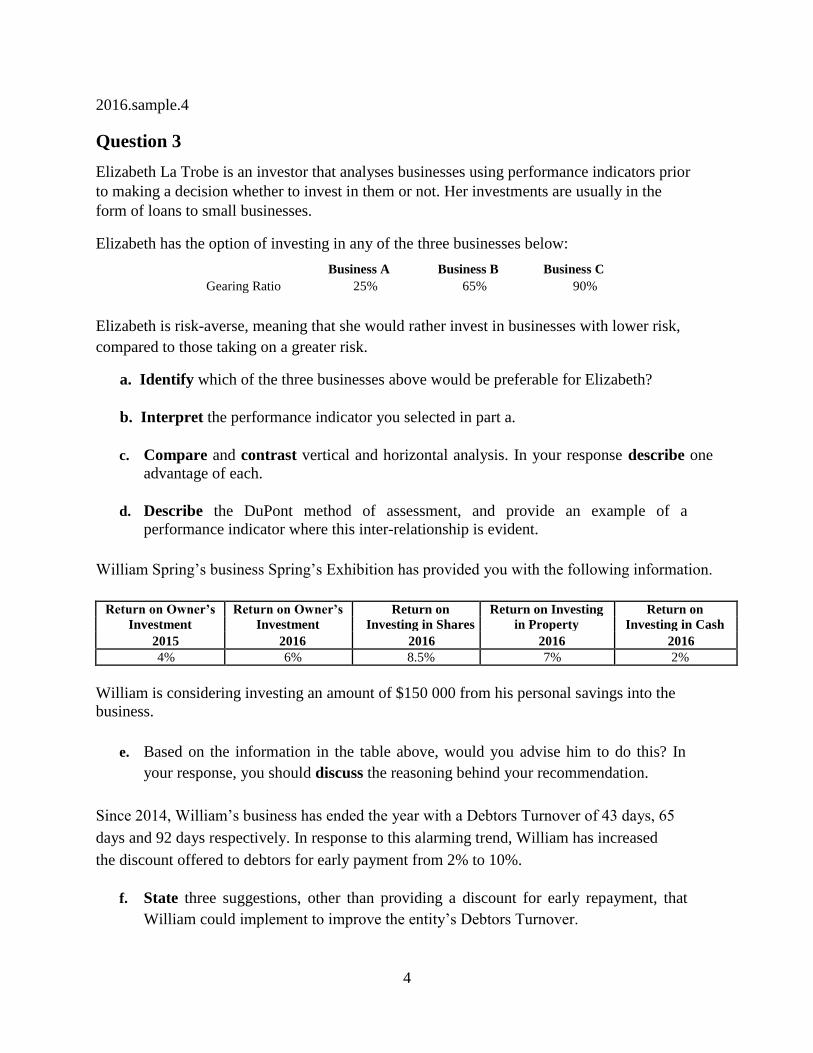
The accountant has provided the following information for the last 2 reporting periods:
Indicator Calculation 6 months ended 30 6 months ended 31
June 2015 December 2015
Net Profit Margin Net Profit 8% 9%
Sales
Gross Profit Margin Gross Profit 45% 49%
Sales
f. Define profitability.
g. Comment on the change in the profitability position of the business.
15.1.2
Question 5
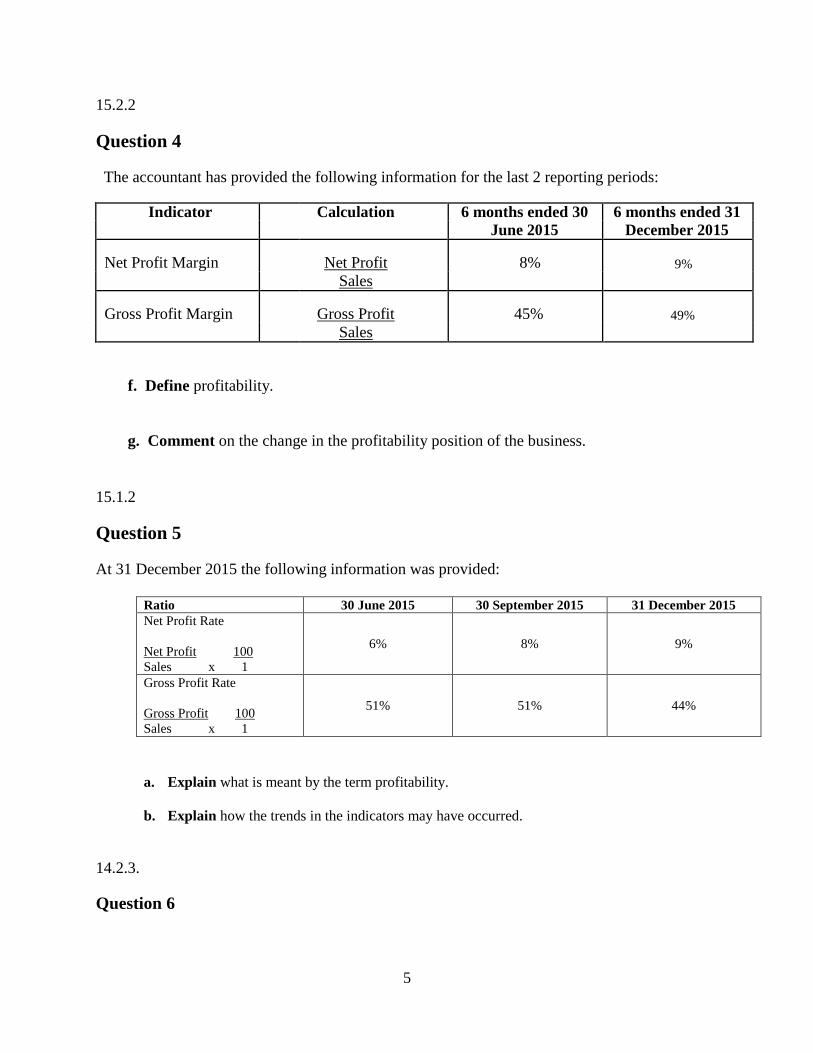
At 31 December 2015 the following information was provided:
Ratio 30 June 2015 30 September 2015 31 December 2015
Net Profit Rate
Net Profit 100
Sales x 1
6% 8% 9%
Gross Profit Rate
Gross Profit 100
Sales x 1
51% 51% 44%
a. Explain what is meant by the term profitability.
b. Explain how the trends in the indicators may have occurred.
14.2.3.
Question 6
6
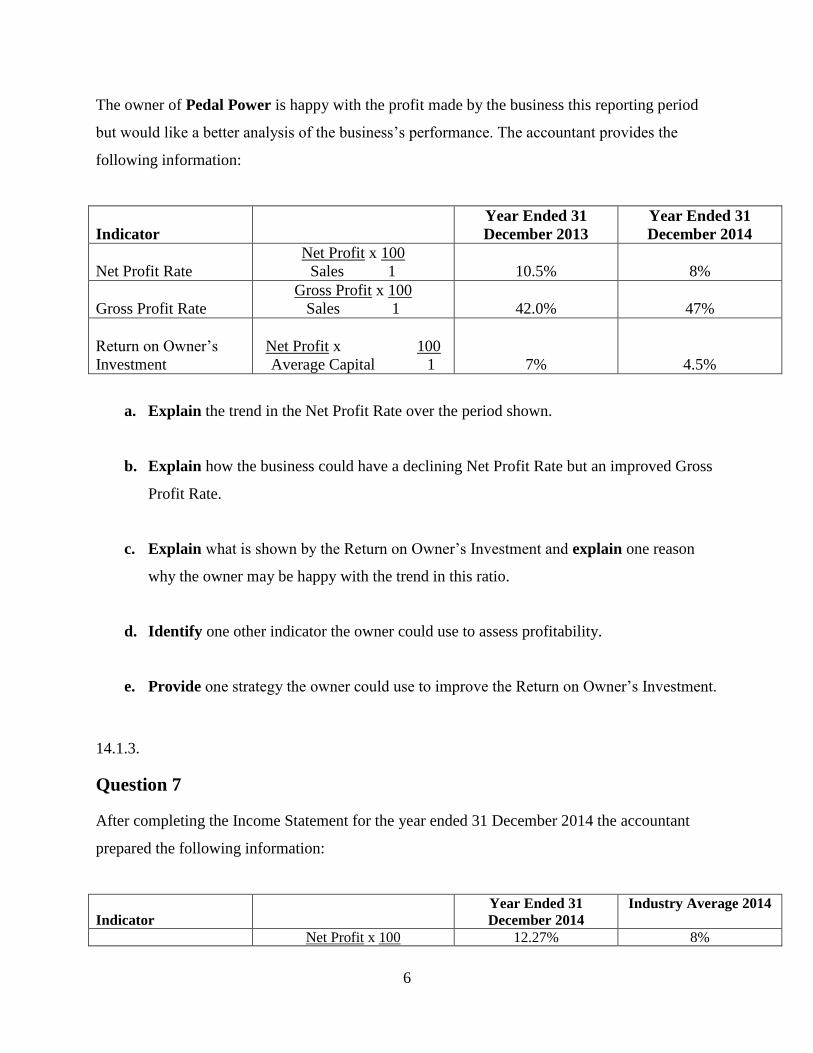
The owner of Pedal Power is happy with the profit made by the business this reporting period
but would like a better analysis of the business’s performance. The accountant provides the
following information:
Indicator
Year Ended 31
December 2013
Year Ended 31
December 2014
Net Profit Rate
Net Profit x 100
Sales 1 10.5% 8%
Gross Profit Rate
Gross Profit x 100
Sales 1 42.0% 47%
Return on Owner’s
Investment
Net Profit x 100
Average Capital 1 7% 4.5%
a. Explain the trend in the Net Profit Rate over the period shown.
b. Explain how the business could have a declining Net Profit Rate but an improved Gross
Profit Rate.
c. Explain what is shown by the Return on Owner’s Investment and explain one reason
why the owner may be happy with the trend in this ratio.
d. Identify one other indicator the owner could use to assess profitability.
e. Provide one strategy the owner could use to improve the Return on Owner’s Investment.
14.1.3.
Question 7
After completing the Income Statement for the year ended 31 December 2014 the accountant
prepared the following information:
Indicator
Year Ended 31
December 2014
Industry Average 2014
Net Profit x 100 12.27% 8%
7
Net Profit Rate Sales 1
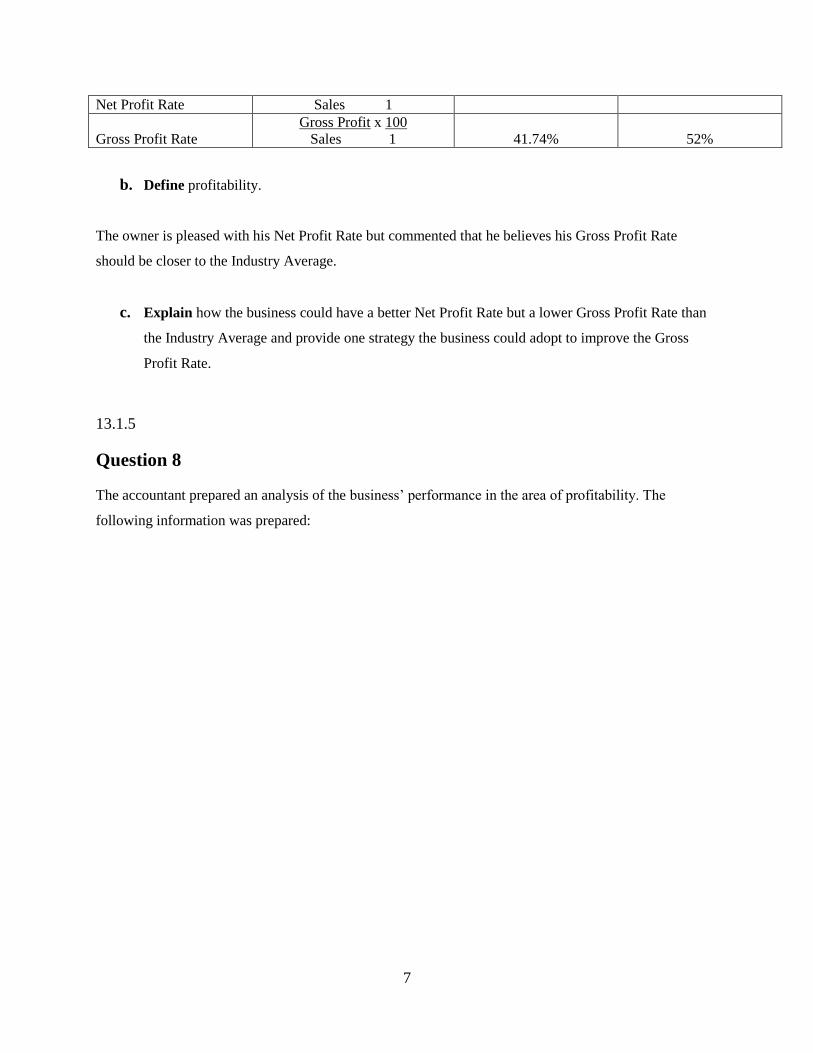
Gross Profit Rate
Gross Profit x 100
Sales 1 41.74% 52%
b. Define profitability.
The owner is pleased with his Net Profit Rate but commented that he believes his Gross Profit Rate
should be closer to the Industry Average.
c. Explain how the business could have a better Net Profit Rate but a lower Gross Profit Rate than
the Industry Average and provide one strategy the business could adopt to improve the Gross
Profit Rate.
13.1.5
Question 8
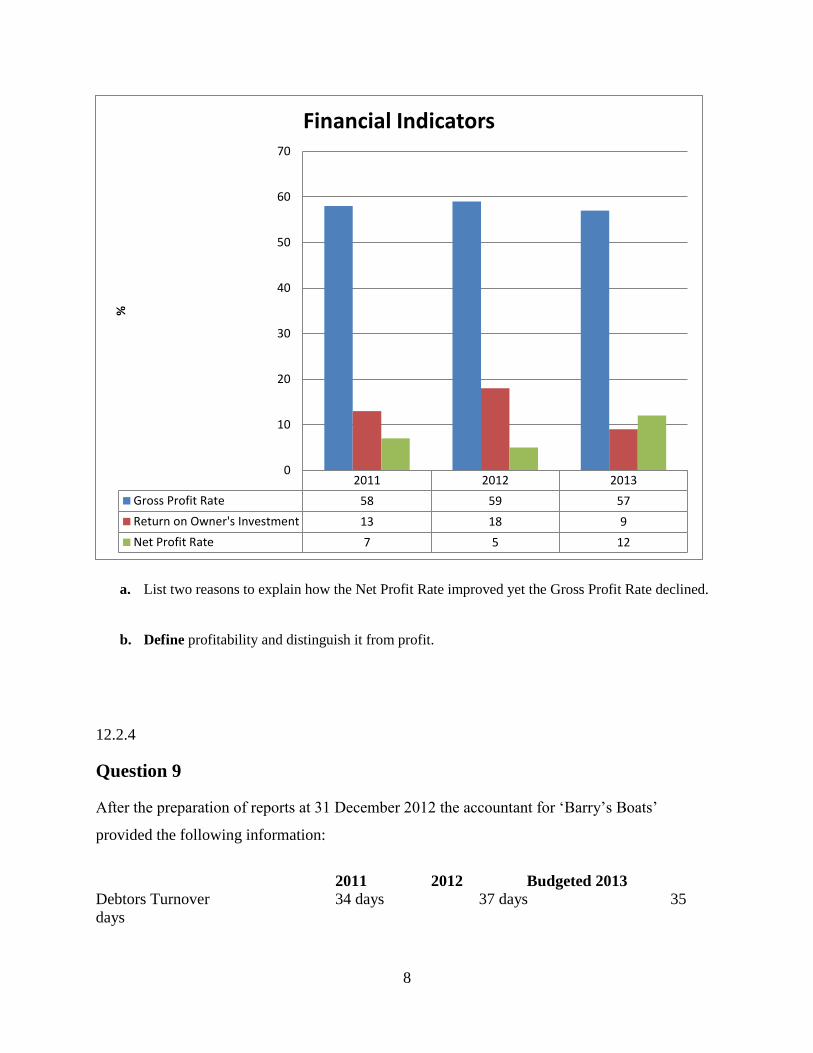
The accountant prepared an analysis of the business’ performance in the area of profitability. The
following information was prepared:
8
a. List two reasons to explain how the Net Profit Rate improved yet the Gross Profit Rate declined.
b. Define profitability and distinguish it from profit.
12.2.4
Question 9
After the preparation of reports at 31 December 2012 the accountant for ‘Barry’s Boats’
provided the following information:
2011 2012 Budgeted 2013
Debtors Turnover 34 days 37 days 35
days
2011 2012 2013
Gross Profit Rate 58 59 57
Return on Owner's Investment 13 18 9
Net Profit Rate 7 5 12
0
10
20
30
40
50
60
70
%
Financial Indicators
9
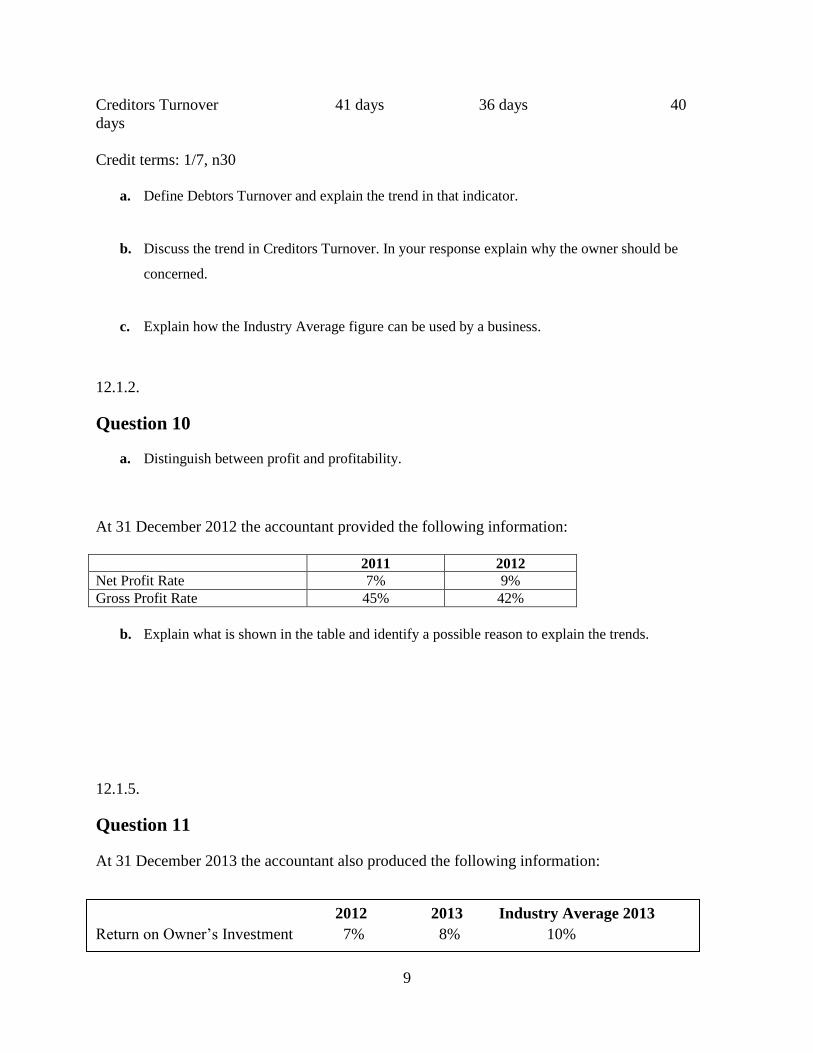
Creditors Turnover 41 days 36 days 40
days
Credit terms: 1/7, n30
a. Define Debtors Turnover and explain the trend in that indicator.
b. Discuss the trend in Creditors Turnover. In your response explain why the owner should be
concerned.
c. Explain how the Industry Average figure can be used by a business.
12.1.2.
Question 10
a. Distinguish between profit and profitability.
At 31 December 2012 the accountant provided the following information:
2011 2012
Net Profit Rate 7% 9%
Gross Profit Rate 45% 42%
b. Explain what is shown in the table and identify a possible reason to explain the trends.
12.1.5.
Question 11
At 31 December 2013 the accountant also produced the following information:
2012 2013 Industry Average 2013
Return on Owner’s Investment 7% 8% 10%
10
a. Explain why the owner may not need to be concerned with the profitability of the business.
11.2.4
QUESTION 12 Michael Walters owns and operates a small business – ‘Walter’s Water Tanks’ - selling water
tanks to local businesses and households. Michael maintains a perpetual stock recording system and uses the FIFO cost assignment
method. He also uses the accrual accounting method of recording and reporting and maintains
control accounts and subsidiary records for Debtors, Creditors and Stock. Michael prepares annual financial reports on 31 December each year.
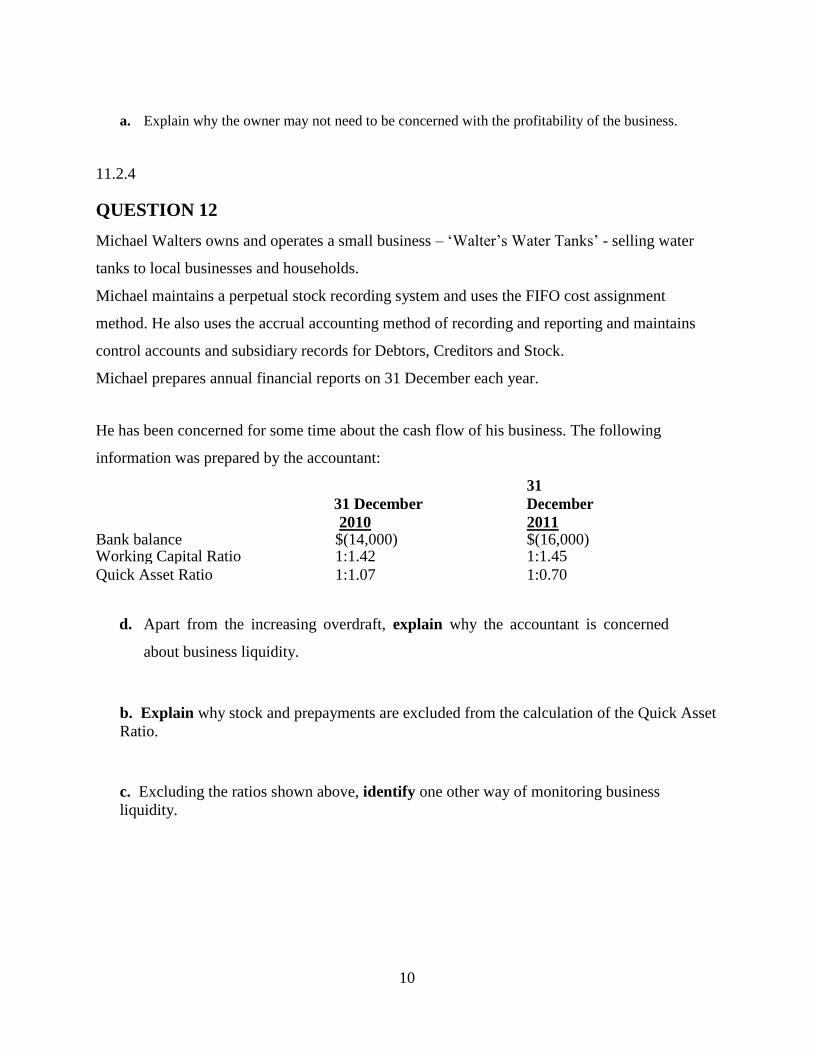
He has been concerned for some time about the cash flow of his business. The following
information was prepared by the accountant:
31 December
31
December 2010 2011 Bank balance $(14,000) $(16,000) Working Capital Ratio 1:1.42 1:1.45
Quick Asset Ratio 1:1.07 1:0.70
d. Apart from the increasing overdraft, explain why the accountant is concerned
about business liquidity.
b. Explain why stock and prepayments are excluded from the calculation of the Quick Asset
Ratio.
c. Excluding the ratios shown above, identify one other way of monitoring business
liquidity.
11
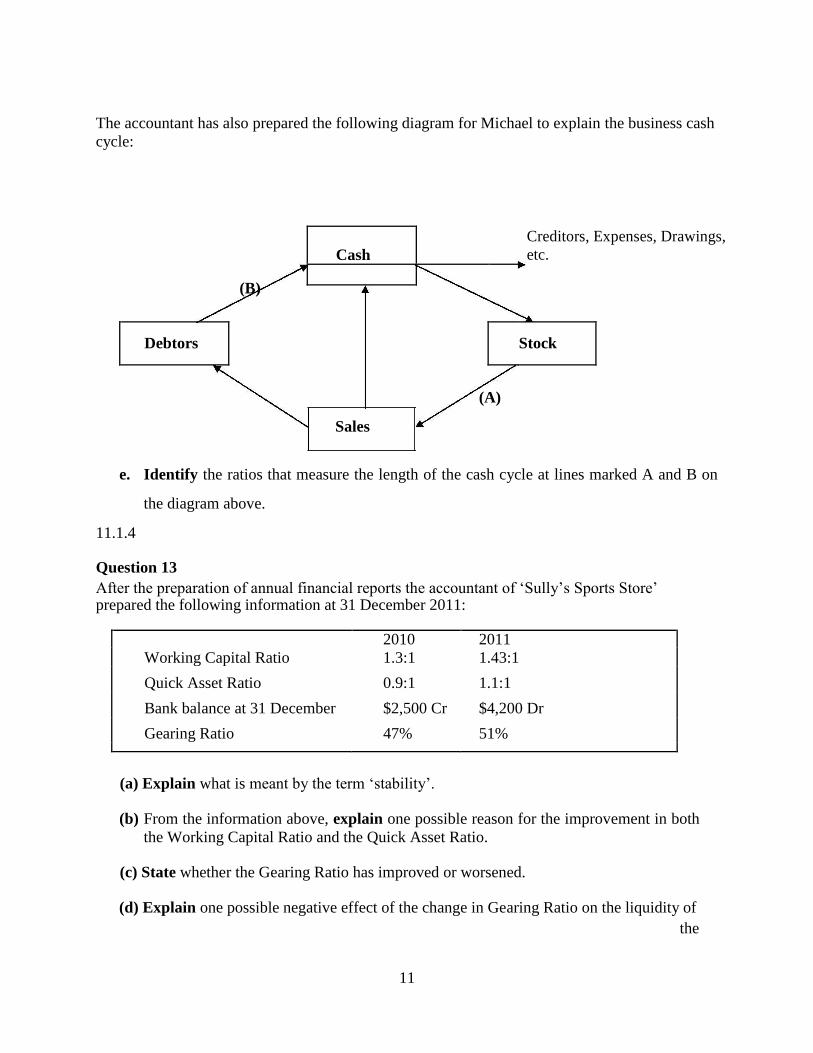
The accountant has also prepared the following diagram for Michael to explain the business cash
cycle:
(B)
Cash
Creditors, Expenses, Drawings,
etc.
Debtors Stock
(A)
Sales
e. Identify the ratios that measure the length of the cash cycle at lines marked A and B on
the diagram above. 11.1.4
Question 13 After the preparation of annual financial reports the accountant of ‘Sully’s Sports Store’ prepared the following information at 31 December 2011:
2010 2011
Working Capital Ratio 1.3:1 1.43:1
Quick Asset Ratio 0.9:1 1.1:1
Bank balance at 31 December $2,500 Cr $4,200 Dr
Gearing Ratio 47% 51%
(a) Explain what is meant by the term ‘stability’.
(b) From the information above, explain one possible reason for the improvement in both
the Working Capital Ratio and the Quick Asset Ratio.
(c) State whether the Gearing Ratio has improved or worsened.
(d) Explain one possible negative effect of the change in Gearing Ratio on the liquidity of
the
12
busi
ness.
(e) Identify one other measure that could be used to assess the stability of the business.
10.2.3
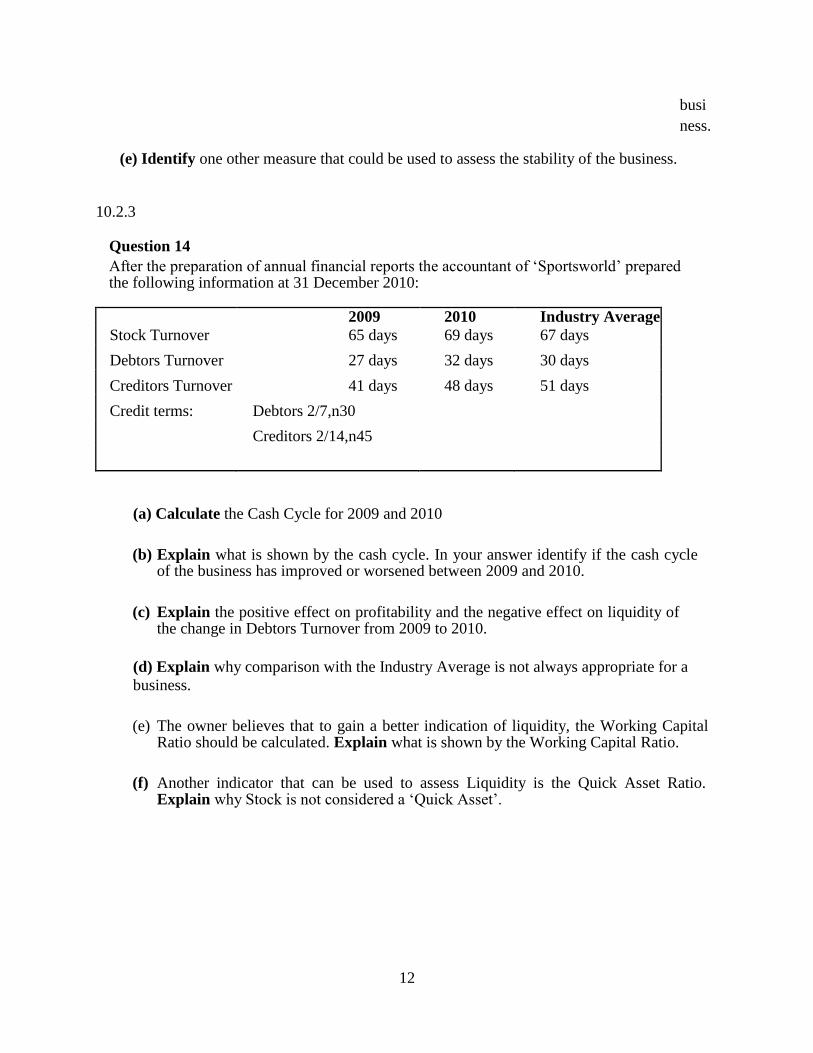
Question 14 After the preparation of annual financial reports the accountant of ‘Sportsworld’ prepared the following information at 31 December 2010:
2009 2010 Industry Average
Stock Turnover 65 days 69 days 67 days
Debtors Turnover 27 days 32 days 30 days
Creditors Turnover 41 days 48 days 51 days
Credit terms: Debtors 2/7,n30
Creditors 2/14,n45
(a) Calculate the Cash Cycle for 2009 and 2010
(b) Explain what is shown by the cash cycle. In your answer identify if the cash cycle
of the business has improved or worsened between 2009 and 2010.
(c) Explain the positive effect on profitability and the negative effect on liquidity of
the change in Debtors Turnover from 2009 to 2010.
(d) Explain why comparison with the Industry Average is not always appropriate for a
business.
(e) The owner believes that to gain a better indication of liquidity, the Working Capital
Ratio should be calculated. Explain what is shown by the Working Capital Ratio.
(f) Another indicator that can be used to assess Liquidity is the Quick Asset Ratio.
Explain why Stock is not considered a ‘Quick Asset’.
13
The following questions are from unit 1
10.2.4
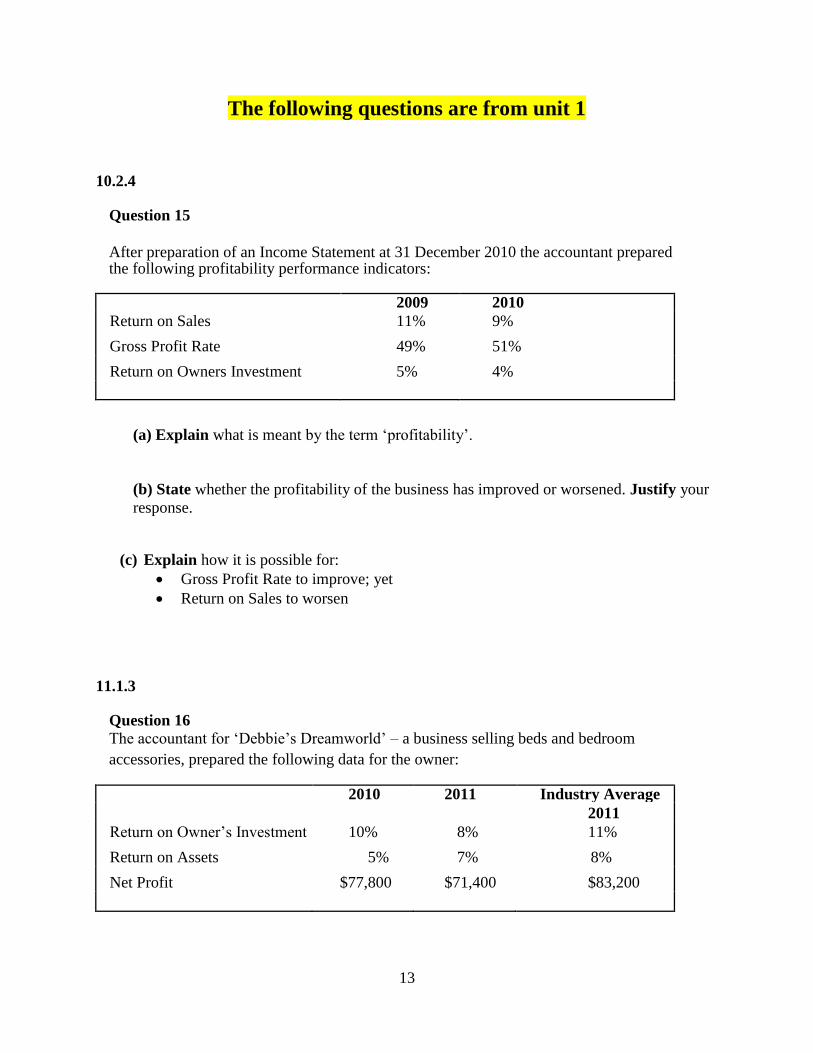
Question 15
After preparation of an Income Statement at 31 December 2010 the accountant prepared the following profitability performance indicators:
2009 2010
Return on Sales 11% 9%
Gross Profit Rate 49% 51%
Return on Owners Investment 5% 4%
(a) Explain what is meant by the term ‘profitability’.
(b) State whether the profitability of the business has improved or worsened. Justify your
response.
(c) Explain how it is possible for: Gross Profit Rate to improve; yet
Return on Sales to worsen
11.1.3
Question 16 The accountant for ‘Debbie’s Dreamworld’ – a business selling beds and bedroom
accessories, prepared the following data for the owner:
2010 2011 Industry Average
2011
Return on Owner’s Investment 10% 8% 11%
Return on Assets 5% 7% 8%
Net Profit $77,800 $71,400 $83,200
14
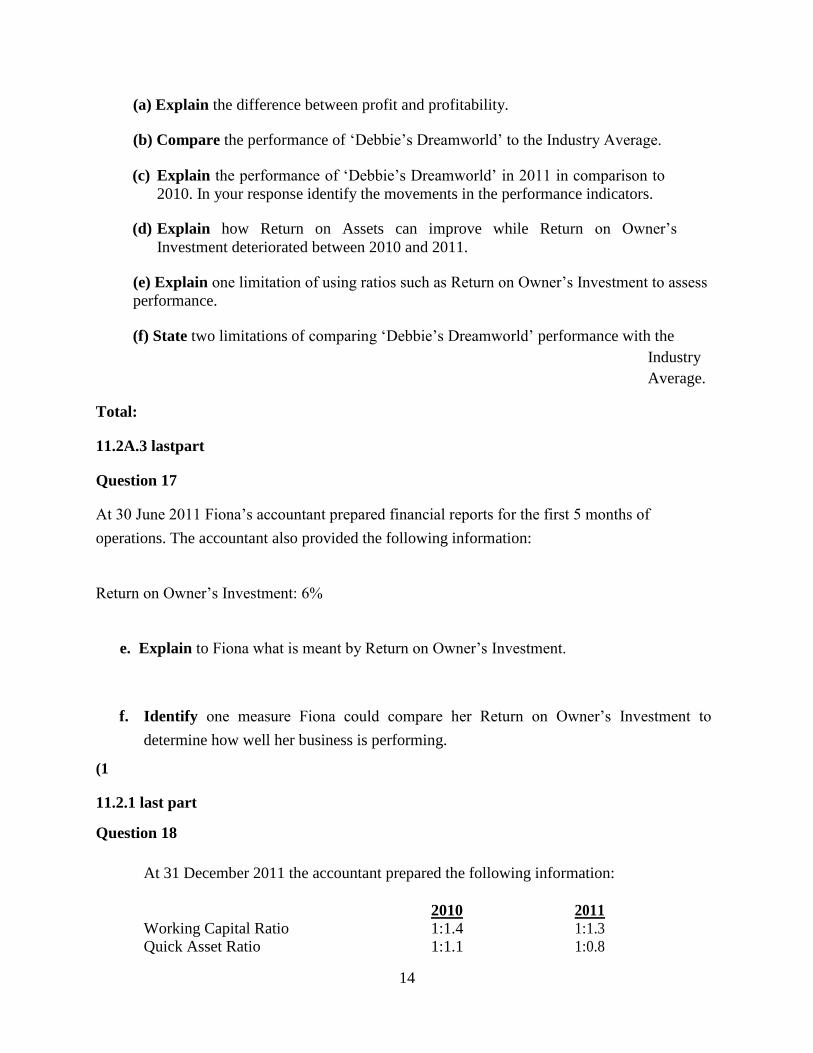
(a) Explain the difference between profit and profitability.
(b) Compare the performance of ‘Debbie’s Dreamworld’ to the Industry Average.
(c) Explain the performance of ‘Debbie’s Dreamworld’ in 2011 in comparison to
2010. In your response identify the movements in the performance indicators.
(d) Explain how Return on Assets can improve while Return on Owner’s
Investment deteriorated between 2010 and 2011.
(e) Explain one limitation of using ratios such as Return on Owner’s Investment to assess
performance.
(f) State two limitations of comparing ‘Debbie’s Dreamworld’ performance with the
Industry
Average. Total:
11.2A.3 lastpart
Question 17
At 30 June 2011 Fiona’s accountant prepared financial reports for the first 5 months of
operations. The accountant also provided the following information:
Return on Owner’s Investment: 6%
e. Explain to Fiona what is meant by Return on Owner’s Investment.
f. Identify one measure Fiona could compare her Return on Owner’s Investment to
determine how well her business is performing. (1
11.2.1 last part
Question 18
At 31 December 2011 the accountant prepared the following information:
2010 2011 Working Capital Ratio 1:1.4 1:1.3 Quick Asset Ratio 1:1.1 1:0.8
15
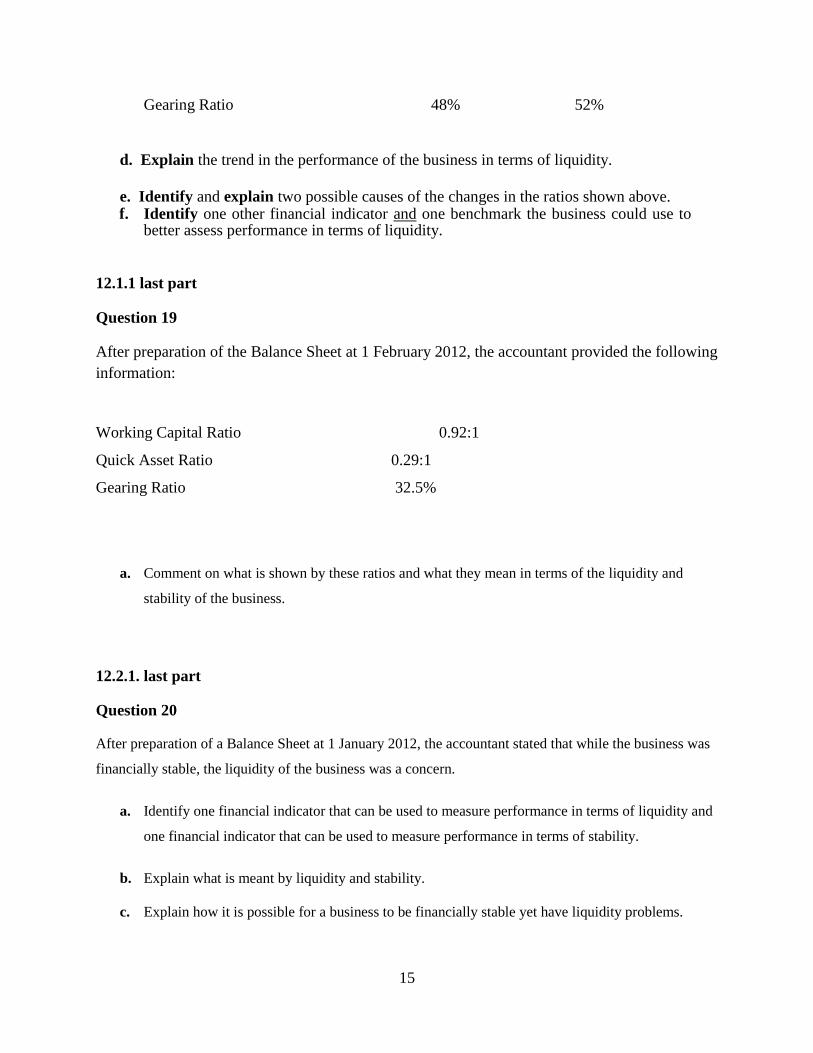
Gearing Ratio 48% 52%
d. Explain the trend in the performance of the business in terms of liquidity.
e. Identify and explain two possible causes of the changes in the ratios shown above. f. Identify one other financial indicator and one benchmark the business could use to
better assess performance in terms of liquidity.
12.1.1 last part
Question 19
After preparation of the Balance Sheet at 1 February 2012, the accountant provided the following
information:
Working Capital Ratio 0.92:1
Quick Asset Ratio 0.29:1
Gearing Ratio 32.5%
a. Comment on what is shown by these ratios and what they mean in terms of the liquidity and
stability of the business.
12.2.1. last part
Question 20
After preparation of a Balance Sheet at 1 January 2012, the accountant stated that while the business was
financially stable, the liquidity of the business was a concern.
a. Identify one financial indicator that can be used to measure performance in terms of liquidity and
one financial indicator that can be used to measure performance in terms of stability.
b. Explain what is meant by liquidity and stability.
c. Explain how it is possible for a business to be financially stable yet have liquidity problems.
16
13.1.1 last part
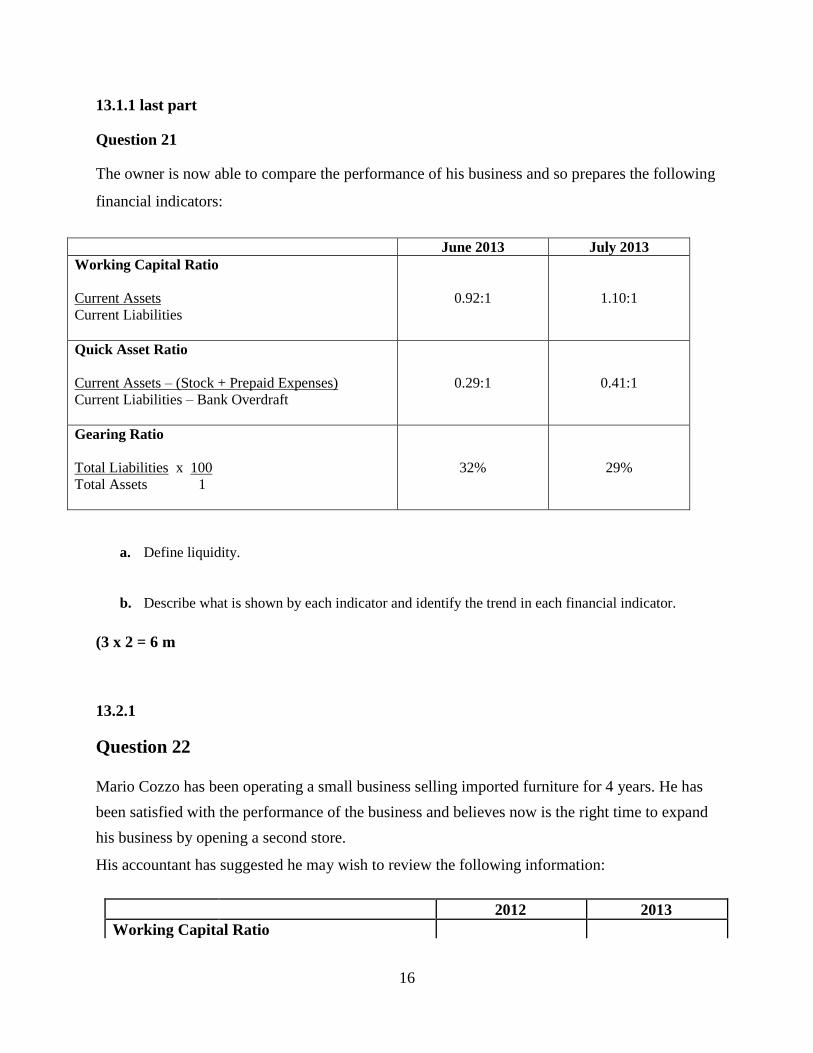
Question 21
The owner is now able to compare the performance of his business and so prepares the following
financial indicators:
June 2013 July 2013
Working Capital Ratio
Current Assets
Current Liabilities
0.92:1
1.10:1
Quick Asset Ratio
Current Assets – (Stock + Prepaid Expenses)
Current Liabilities – Bank Overdraft
0.29:1
0.41:1
Gearing Ratio
Total Liabilities x 100
Total Assets 1
32%
29%
a. Define liquidity.
b. Describe what is shown by each indicator and identify the trend in each financial indicator.
(3 x 2 = 6 m
13.2.1
Question 22
Mario Cozzo has been operating a small business selling imported furniture for 4 years. He has
been satisfied with the performance of the business and believes now is the right time to expand
his business by opening a second store. His accountant has suggested he may wish to review the following information:
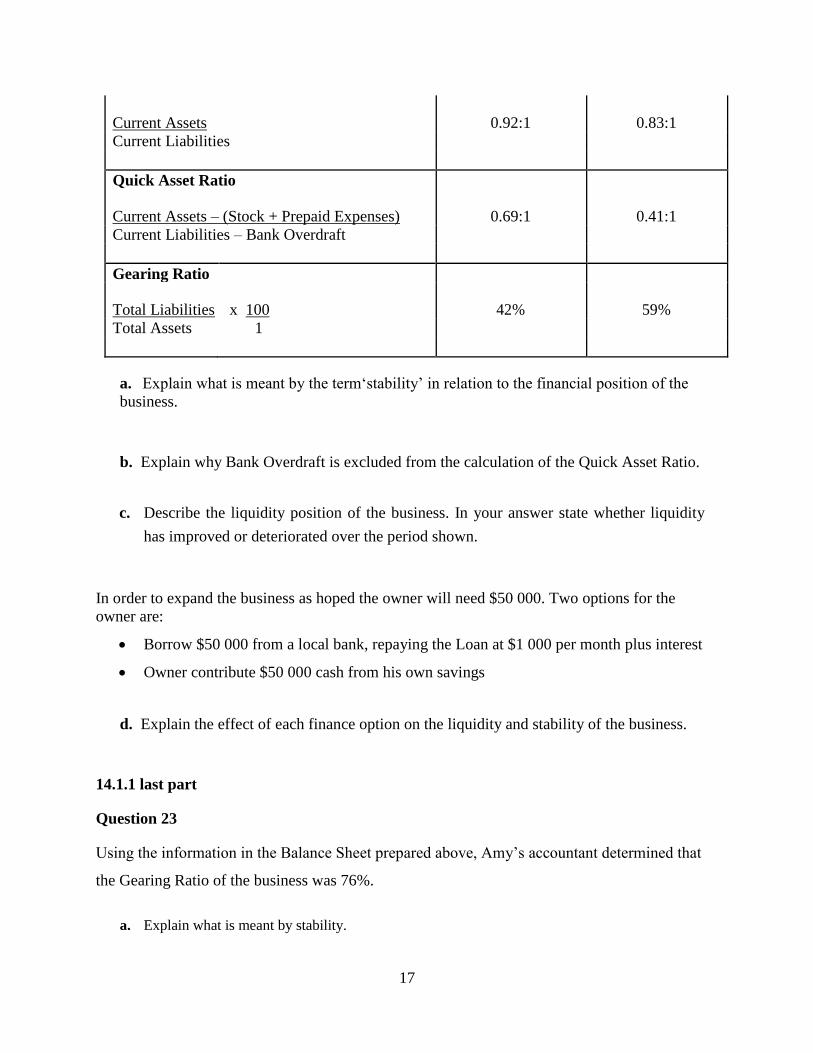
2012 2013
Working Capital Ratio
17
Current Assets 0.92:1 0.83:1
Current Liabilities
Quick Asset Ratio
Current Assets – (Stock + Prepaid Expenses) 0.69:1 0.41:1
Current Liabilities – Bank Overdraft
Gearing Ratio
Total Liabilities x 100 42% 59%
Total Assets 1
a. Explain what is meant by the term‘stability’ in relation to the financial position of the
business.
b. Explain why Bank Overdraft is excluded from the calculation of the Quick Asset Ratio.
c. Describe the liquidity position of the business. In your answer state whether liquidity
has improved or deteriorated over the period shown.
In order to expand the business as hoped the owner will need $50 000. Two options for the
owner are:
Borrow $50 000 from a local bank, repaying the Loan at $1 000 per month plus interest
Owner contribute $50 000 cash from his own savings
d. Explain the effect of each finance option on the liquidity and stability of the business.
14.1.1 last part
Question 23
Using the information in the Balance Sheet prepared above, Amy’s accountant determined that
the Gearing Ratio of the business was 76%.
a. Explain what is meant by stability.
18
b. Explain what a Gearing Ratio of 76% means.
14.1.5 last part
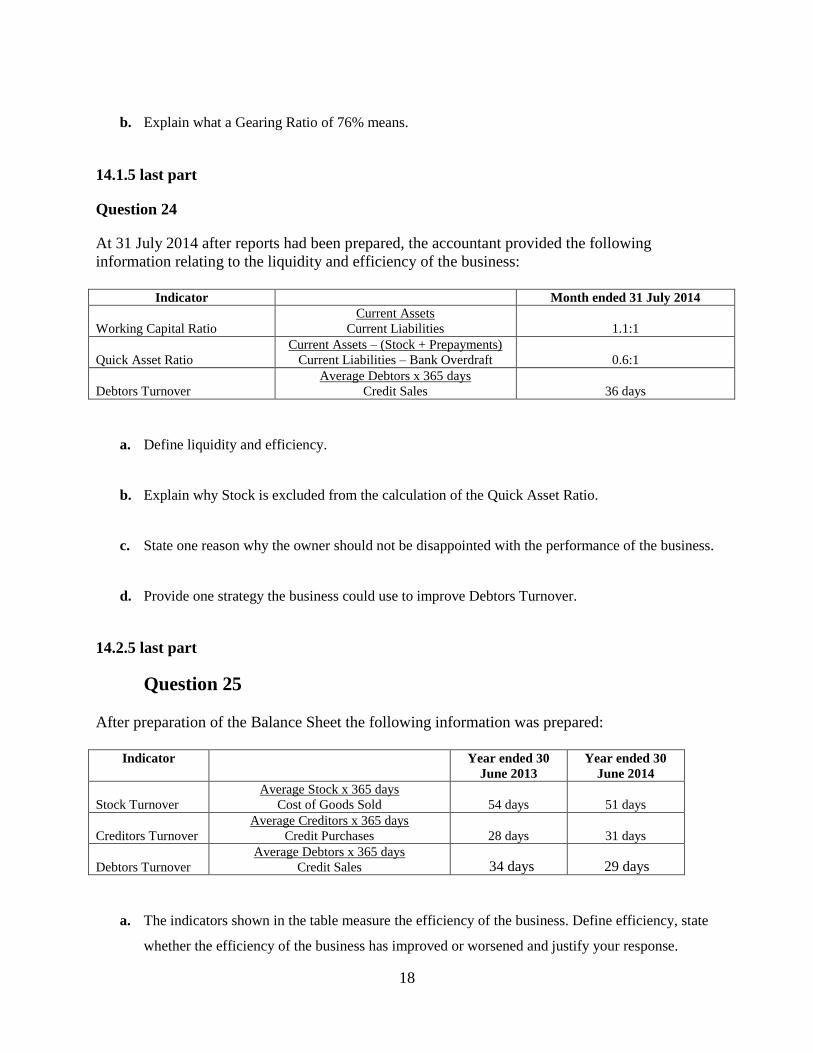
Question 24
At 31 July 2014 after reports had been prepared, the accountant provided the following
information relating to the liquidity and efficiency of the business:
Indicator Month ended 31 July 2014
Working Capital Ratio
Current Assets
Current Liabilities 1.1:1
Quick Asset Ratio
Current Assets – (Stock + Prepayments)
Current Liabilities – Bank Overdraft 0.6:1
Debtors Turnover
Average Debtors x 365 days
Credit Sales 36 days
a. Define liquidity and efficiency.
b. Explain why Stock is excluded from the calculation of the Quick Asset Ratio.
c. State one reason why the owner should not be disappointed with the performance of the business.
d. Provide one strategy the business could use to improve Debtors Turnover.
14.2.5 last part
Question 25
After preparation of the Balance Sheet the following information was prepared:
Indicator Year ended 30
June 2013
Year ended 30
June 2014
Stock Turnover
Average Stock x 365 days
Cost of Goods Sold 54 days 51 days
Creditors Turnover
Average Creditors x 365 days
Credit Purchases 28 days 31 days
Debtors Turnover
Average Debtors x 365 days
Credit Sales 34 days 29 days
a. The indicators shown in the table measure the efficiency of the business. Define efficiency, state
whether the efficiency of the business has improved or worsened and justify your response.
19
15.1.1 last part
Question 26
At 30 April 2015 the accountant prepared the following information Indicator Month ended 30 April 2015
Working Capital Ratio
Current Assets
Current Liabilities 1.4:1
Quick Asset Ratio
Current Assets – (Stock + Prepayments)
Current Liabilities – Bank Overdraft 0.85:1
a. Explain what is meant by the term liquidity and what is indicated by the two indicators provided.
b. State whether the transaction on 2 April 2015 would have improved or worsened the Working
Capital Ratio.
15.1.5 last part
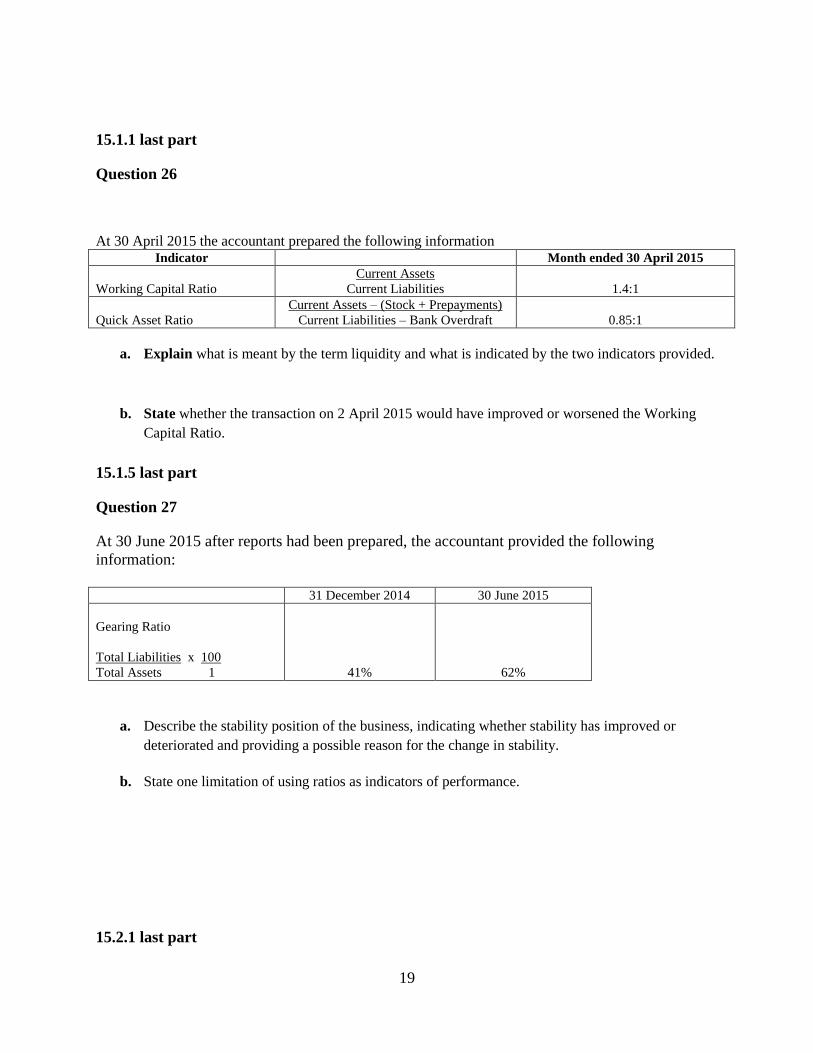
Question 27
At 30 June 2015 after reports had been prepared, the accountant provided the following
information:
31 December 2014 30 June 2015
Gearing Ratio
Total Liabilities x 100
Total Assets 1 41% 62%
a. Describe the stability position of the business, indicating whether stability has improved or
deteriorated and providing a possible reason for the change in stability.
b. State one limitation of using ratios as indicators of performance.
15.2.1 last part
20
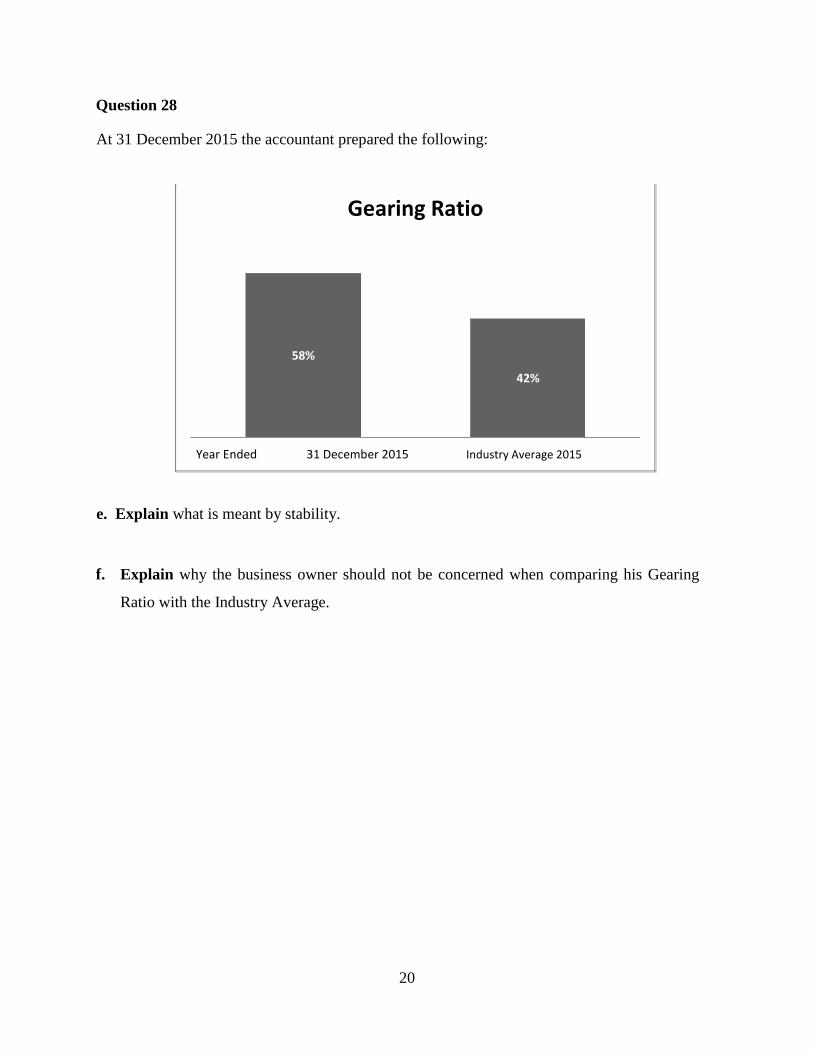
Question 28
At 31 December 2015 the accountant prepared the following:
Gearing Ratio
58%
42%
Year Ended 31 December 2015 Industry Average 2015
e. Explain what is meant by stability.
f. Explain why the business owner should not be concerned when comparing his Gearing
Ratio with the Industry Average.