Embed Size (px)
Citation preview

Turning Point for the Delta
Critical changes leading up to the 2002 crash of
pelagic fish populations
Deirdre Des Jardins
Friends of Trinity River Revive the San Joaquin
Overview
Collapse of pelagic fish populations in 2002 happened after several years of decline in Delta health
Decreases in phytoplankton production in Suisun Bay started in 1999, also toxic algal blooms in the Central Delta
Changes associated with large reduction in Delta ouflow in late spring through fall
Suisun Bay
Invasion of Corbula in 1987 Phytoplankton production crashed in 1987,
but increased from 1995-1998 Second decrease in 1999 associated with
reduced Delta outflow, increasing salinity
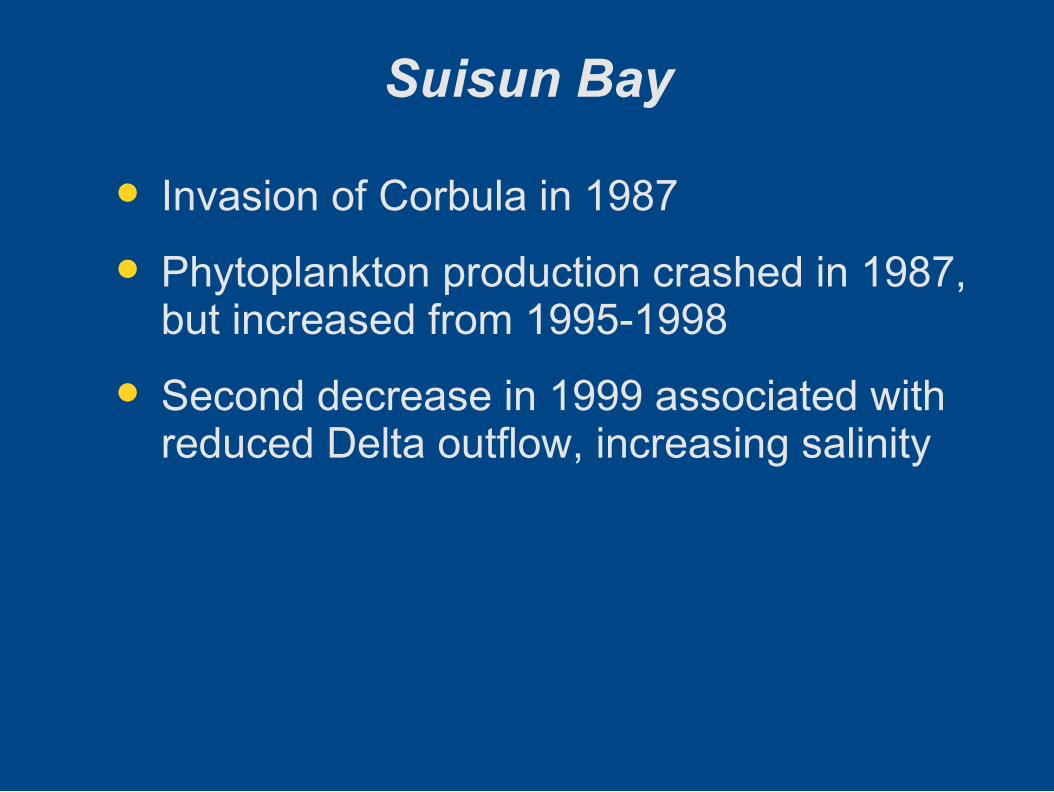
Source: J. Cloern, 2007, from presentation by Jerry Johns at California Wetlands Conference
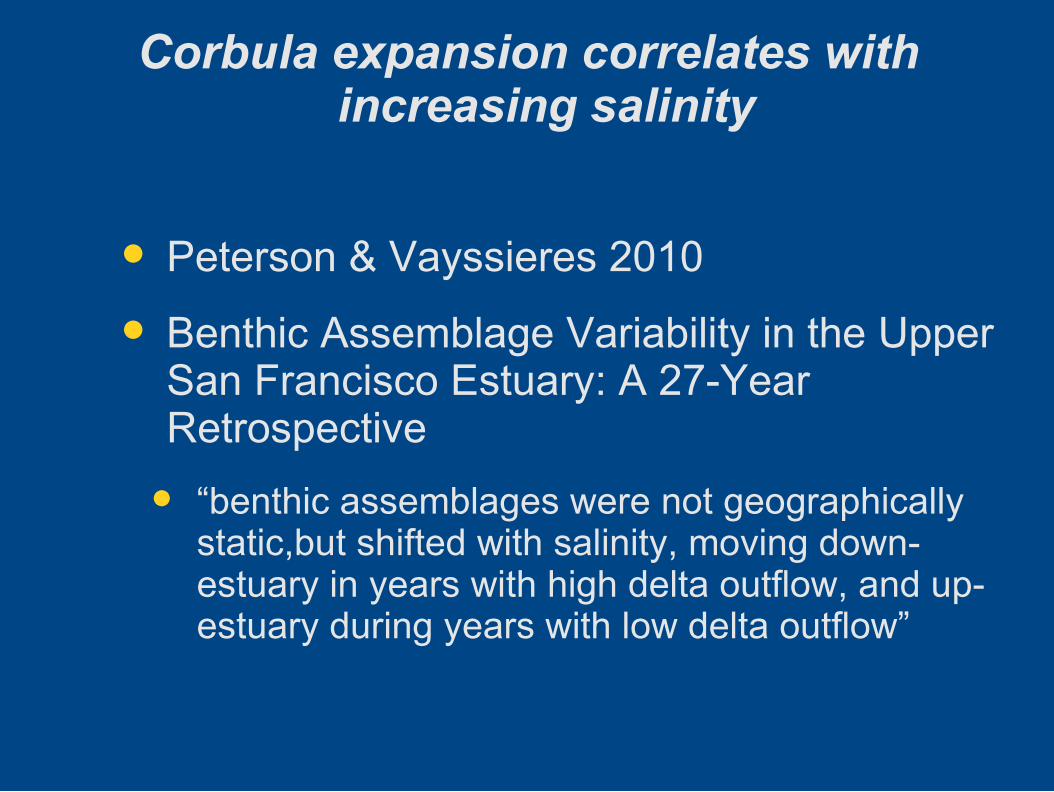
Corbula expansion correlates with increasing salinity
Peterson & Vayssieres 2010 Benthic Assemblage Variability in the Upper
San Francisco Estuary: A 27-Year Retrospective
“benthic assemblages were not geographically static,but shifted with salinity, moving down-estuary in years with high delta outflow, and up-estuary during years with low delta outflow”
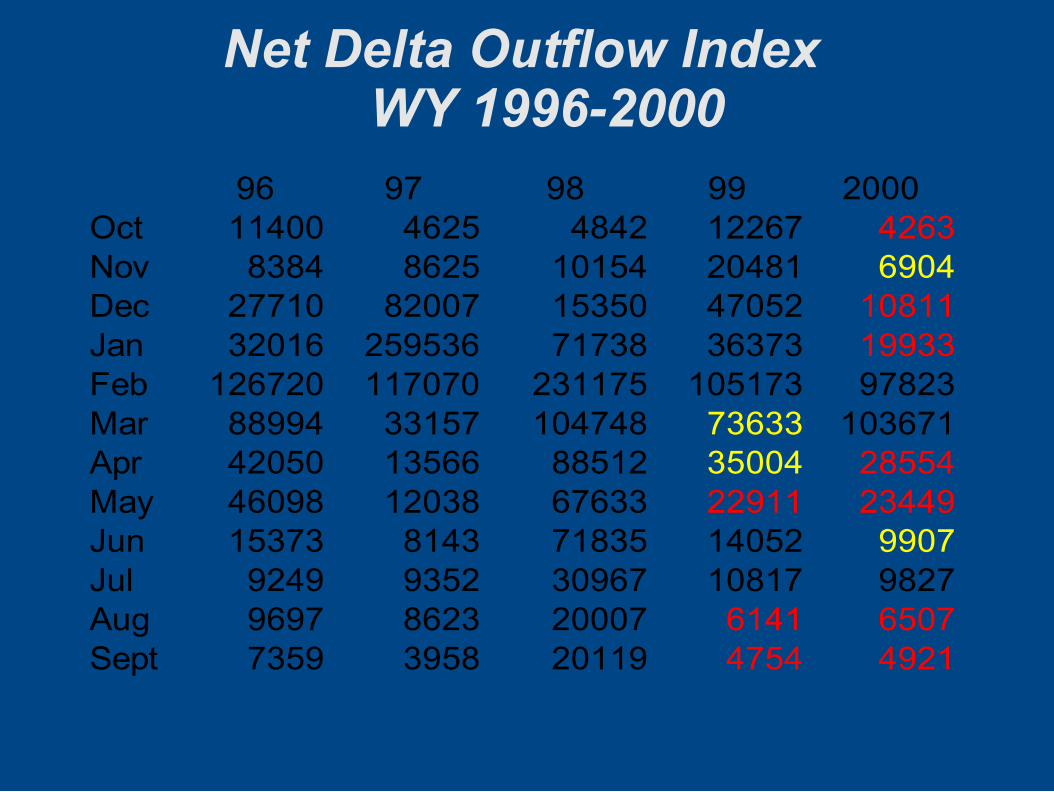
Net Delta Outflow Index WY 1996-2000
96 97 98 99 2000Oct 11400 4625 4842 12267 4263Nov 8384 8625 10154 20481 6904Dec 27710 82007 15350 47052 10811Jan 32016 259536 71738 36373 19933Feb 126720 117070 231175 105173 97823Mar 88994 33157 104748 73633 103671Apr 42050 13566 88512 35004 28554May 46098 12038 67633 22911 23449Jun 15373 8143 71835 14052 9907Jul 9249 9352 30967 10817 9827Aug 9697 8623 20007 6141 6507Sept 7359 3958 20119 4754 4921
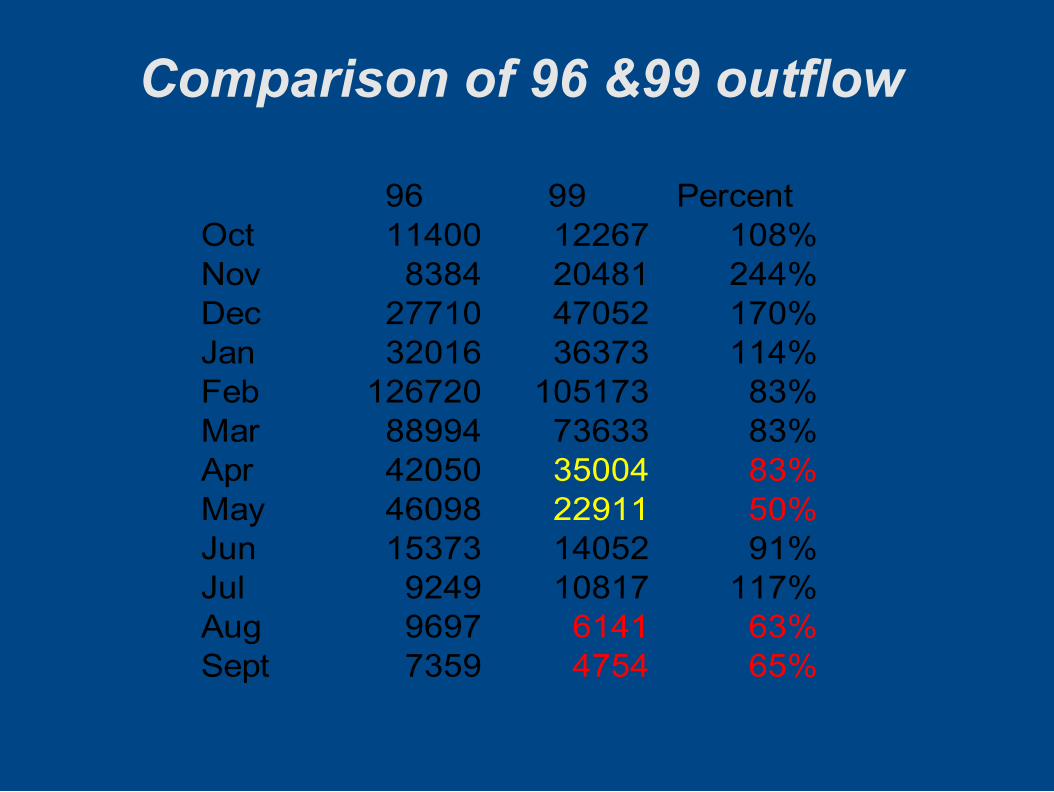
Comparison of 96 &99 outflow
96 99 PercentOct 11400 12267 108%Nov 8384 20481 244%Dec 27710 47052 170%Jan 32016 36373 114%Feb 126720 105173 83%Mar 88994 73633 83%Apr 42050 35004 83%May 46098 22911 50%Jun 15373 14052 91%Jul 9249 10817 117%Aug 9697 6141 63%Sept 7359 4754 65%
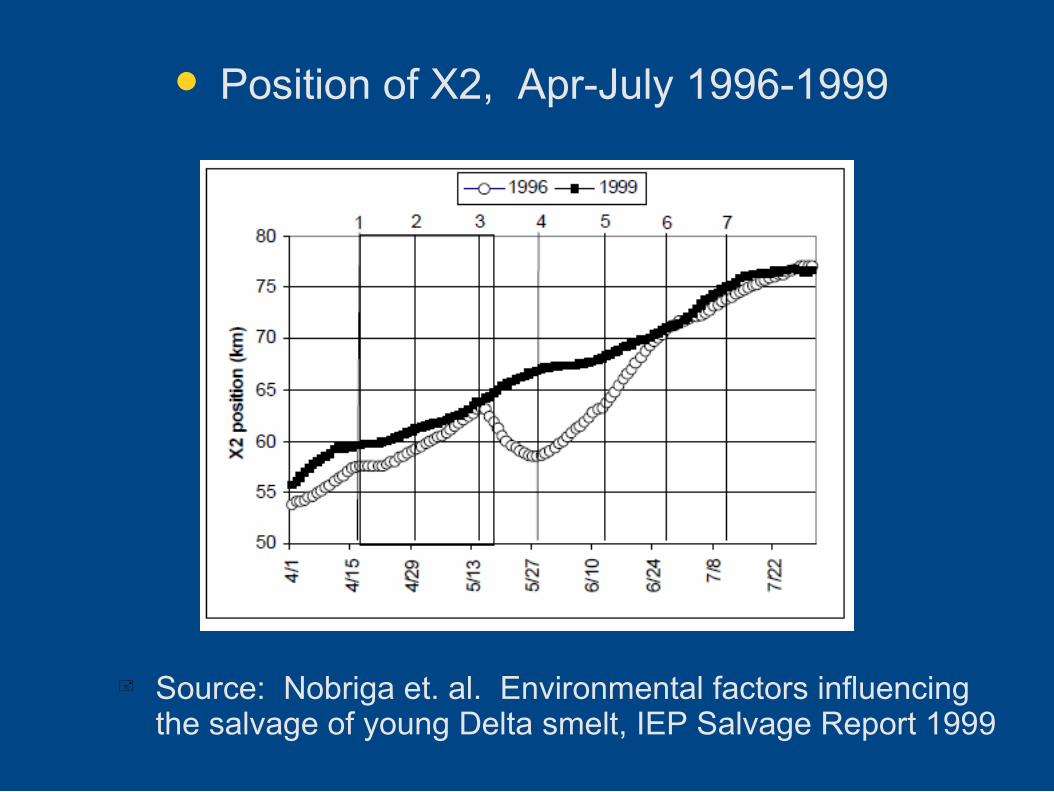
Position of X2, Apr-July 1996-1999
Source: Nobriga et. al. Environmental factors influencing the salvage of young Delta smelt, IEP Salvage Report 1999
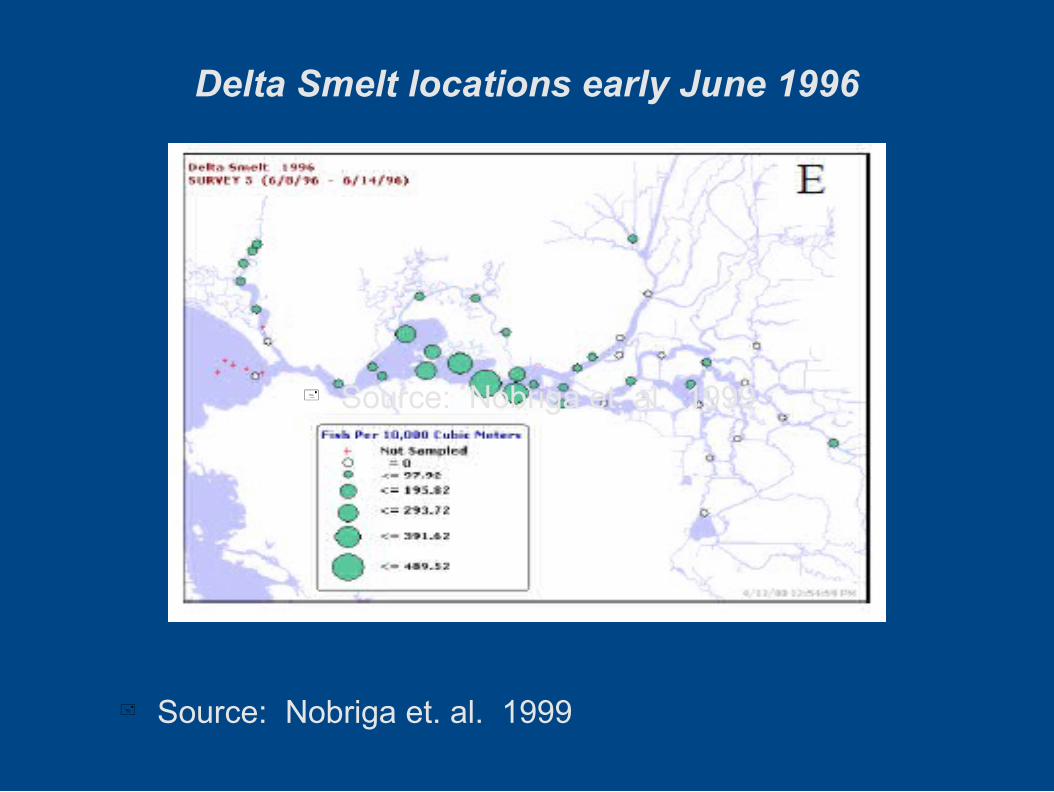
Delta Smelt locations early June 1996
Source: Nobriga et. al. 1999
Source: Nobriga et. al. 1999
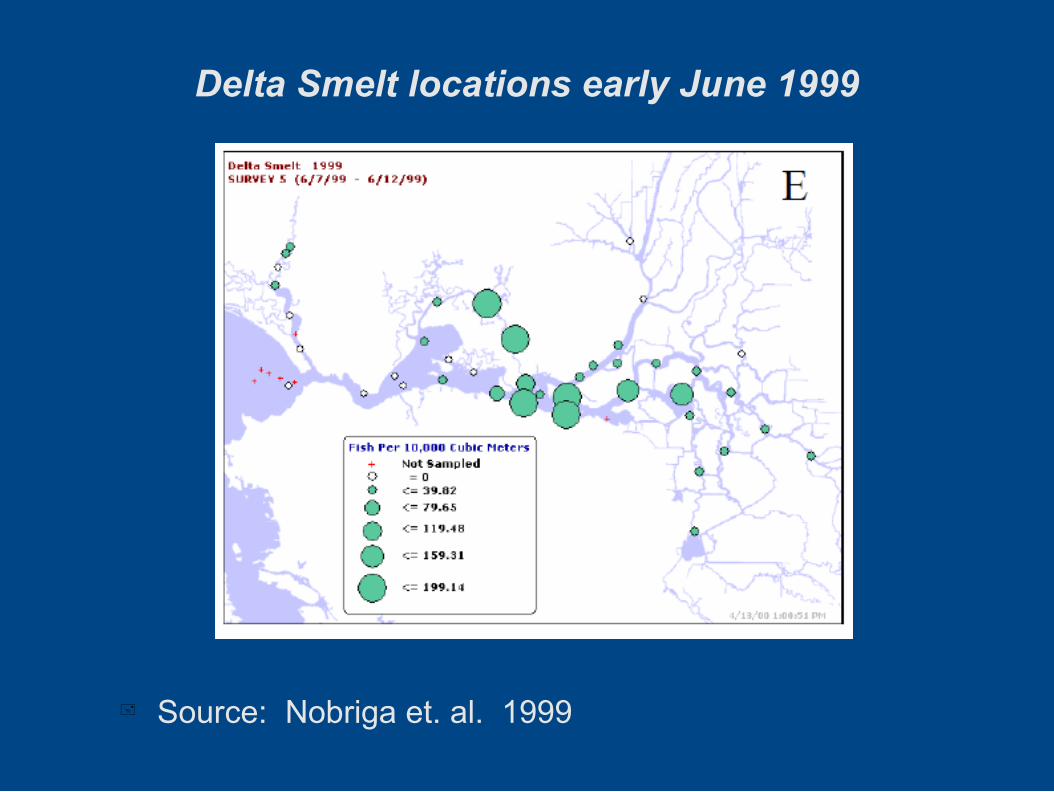
Delta Smelt locations early June 1999
Source: Nobriga et. al. 1999
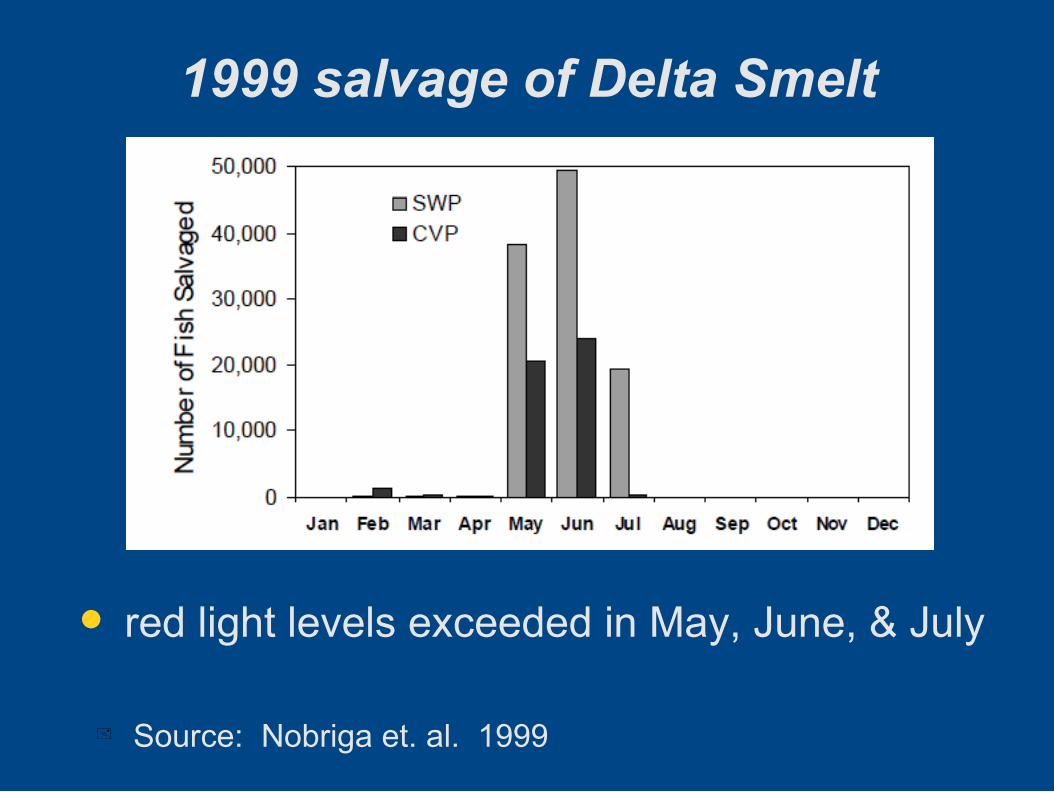
1999 salvage of Delta Smelt
red light levels exceeded in May, June, & July
Source: Nobriga et. al. 1999
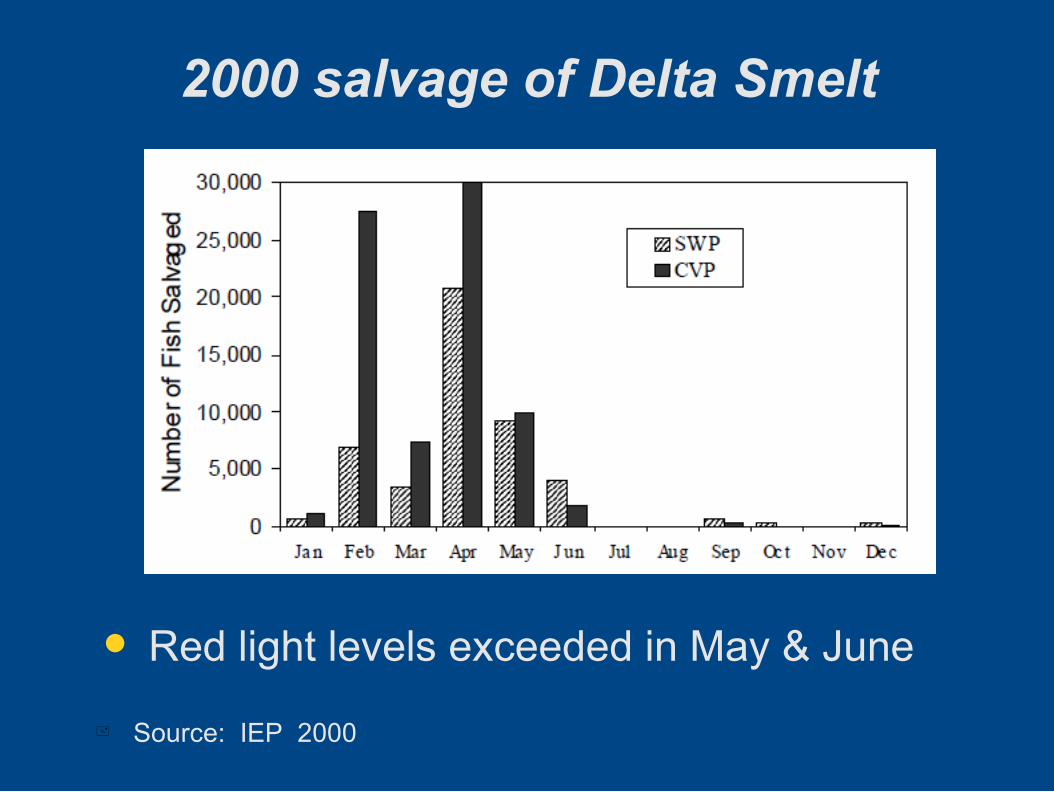
2000 salvage of Delta Smelt
Red light levels exceeded in May & June
Source: IEP 2000
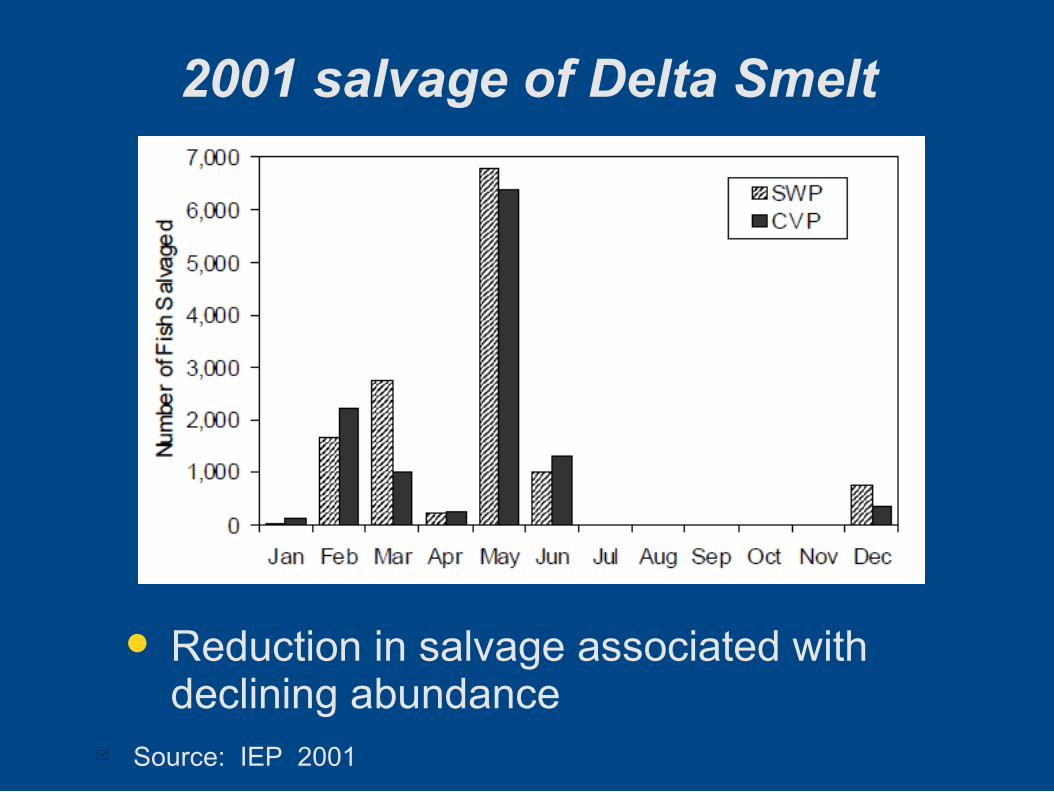
2001 salvage of Delta Smelt
Reduction in salvage associated with declining abundance
Source: IEP 2001
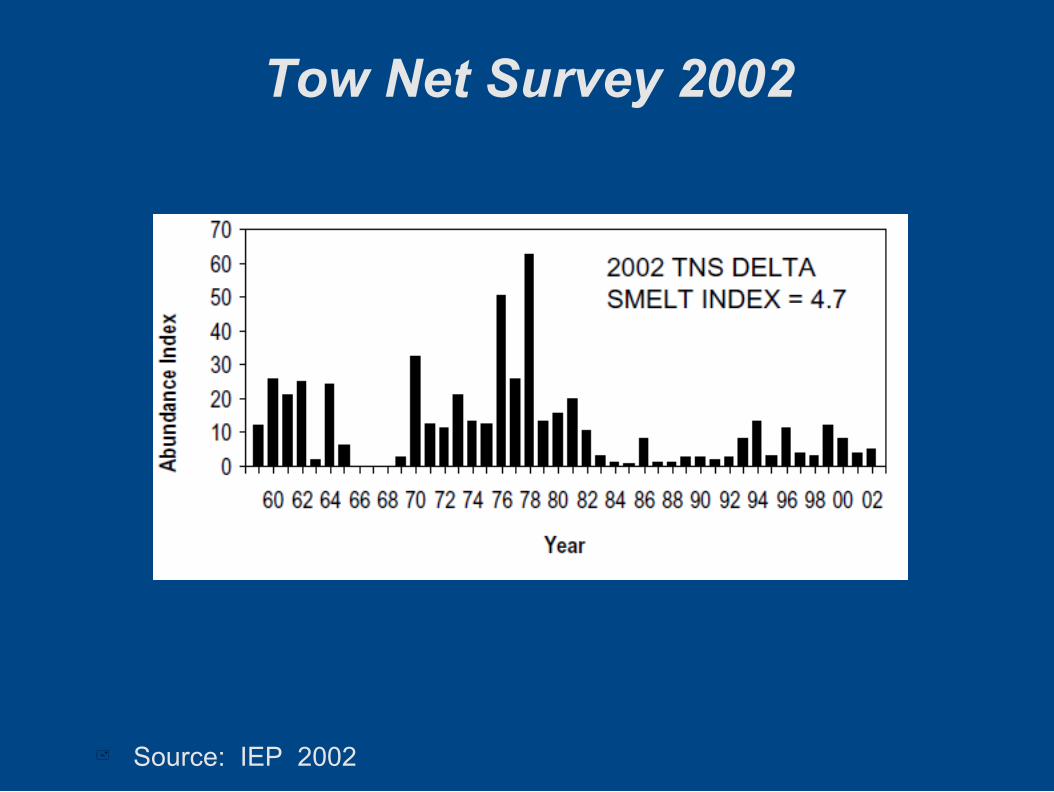
Tow Net Survey 2002
Source: IEP 2002
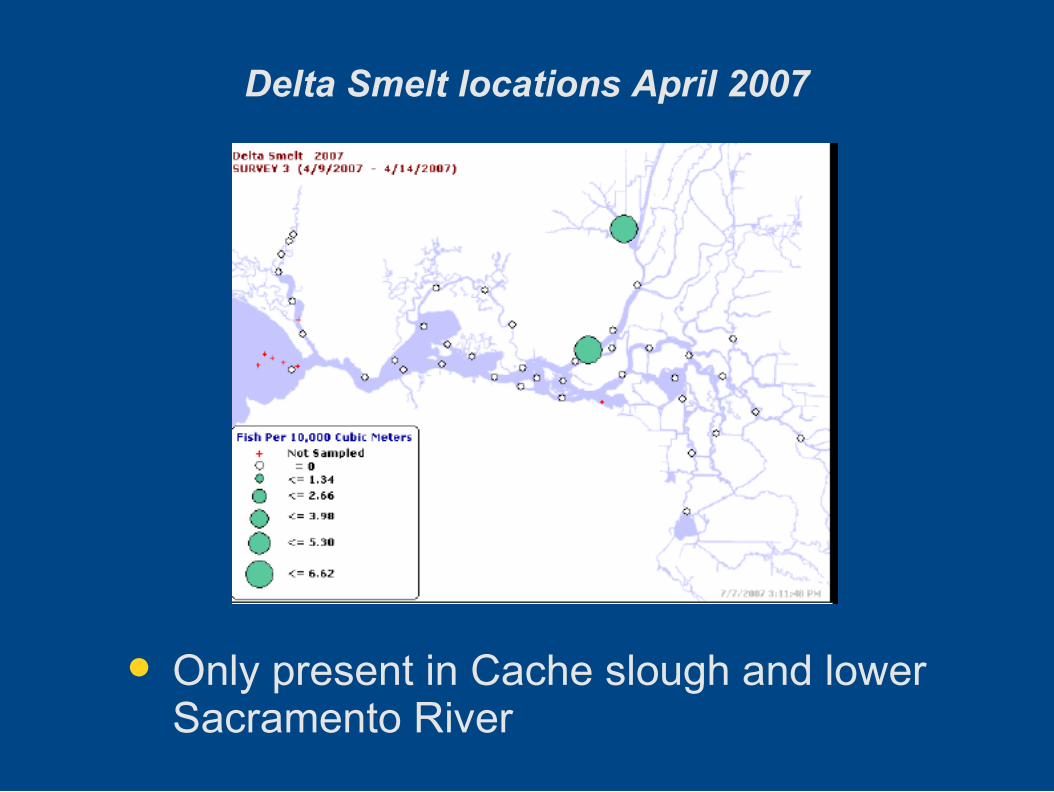
Delta Smelt locations April 2007
Only present in Cache slough and lower Sacramento River
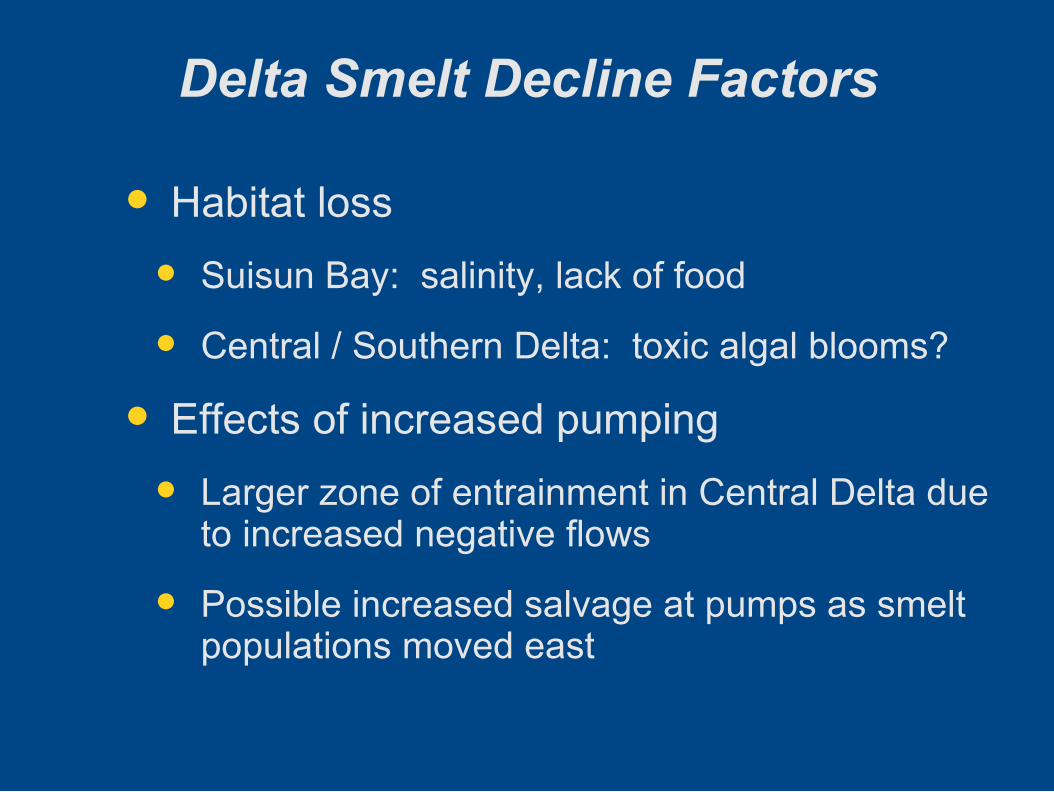
Delta Smelt Decline Factors
Habitat loss Suisun Bay: salinity, lack of food
Central / Southern Delta: toxic algal blooms?
Effects of increased pumping Larger zone of entrainment in Central Delta due
to increased negative flows
Possible increased salvage at pumps as smelt populations moved east
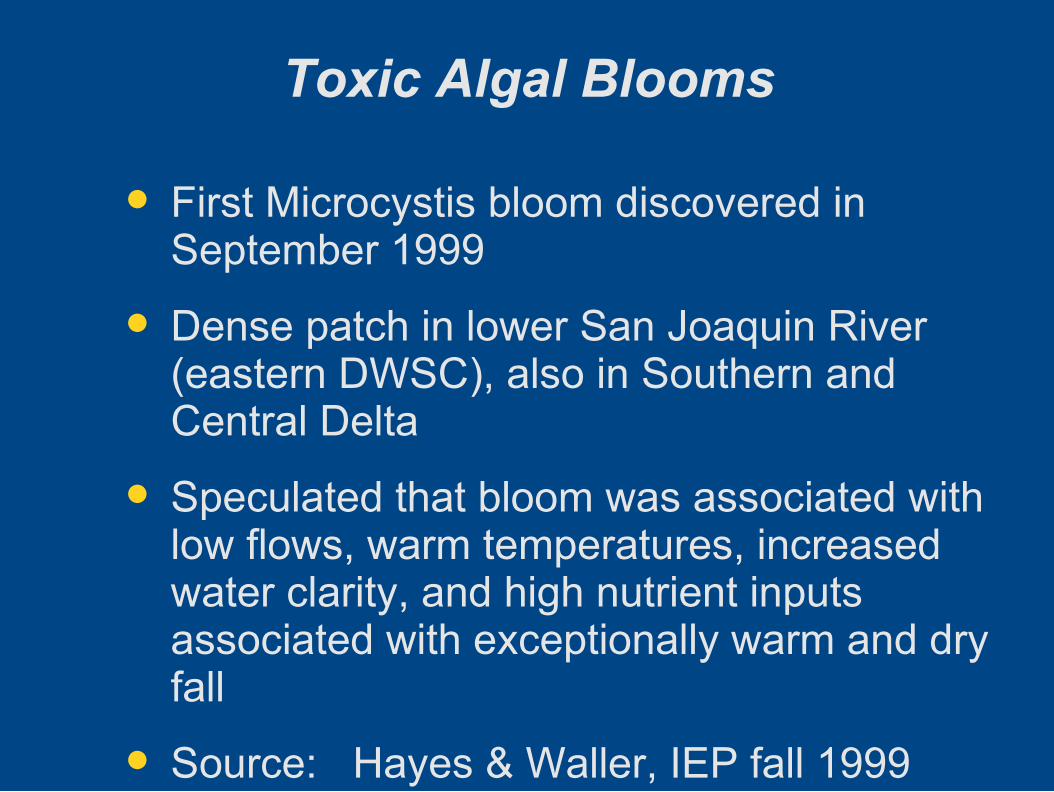
Toxic Algal Blooms
First Microcystis bloom discovered in September 1999
Dense patch in lower San Joaquin River (eastern DWSC), also in Southern and Central Delta
Speculated that bloom was associated with low flows, warm temperatures, increased water clarity, and high nutrient inputs associated with exceptionally warm and dry fall
Source: Hayes & Waller, IEP fall 1999
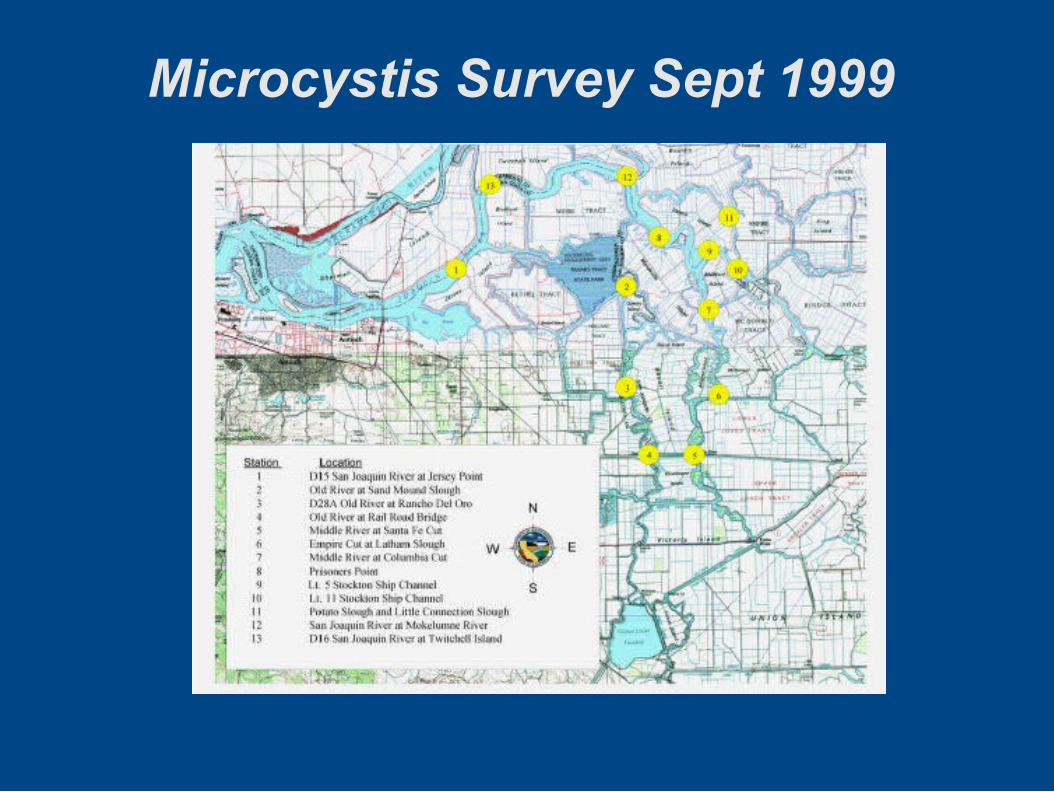
Microcystis Survey Sept 1999
Mycrocystis sampling 2005
Blooms have continued every year Extensive sampling and testing by Lehman
et. al. in 2005 as part of POD task force Reported in 2010 in Hydrobiologica:
“Initial impacts of Microcystis aeruginosa blooms on the aquatic food web in the San Francisco Estuary”
P. W. Lehman • S. J. Teh • G. L. Boyer • M. L. Nobriga • E. Bass • C. Hogle
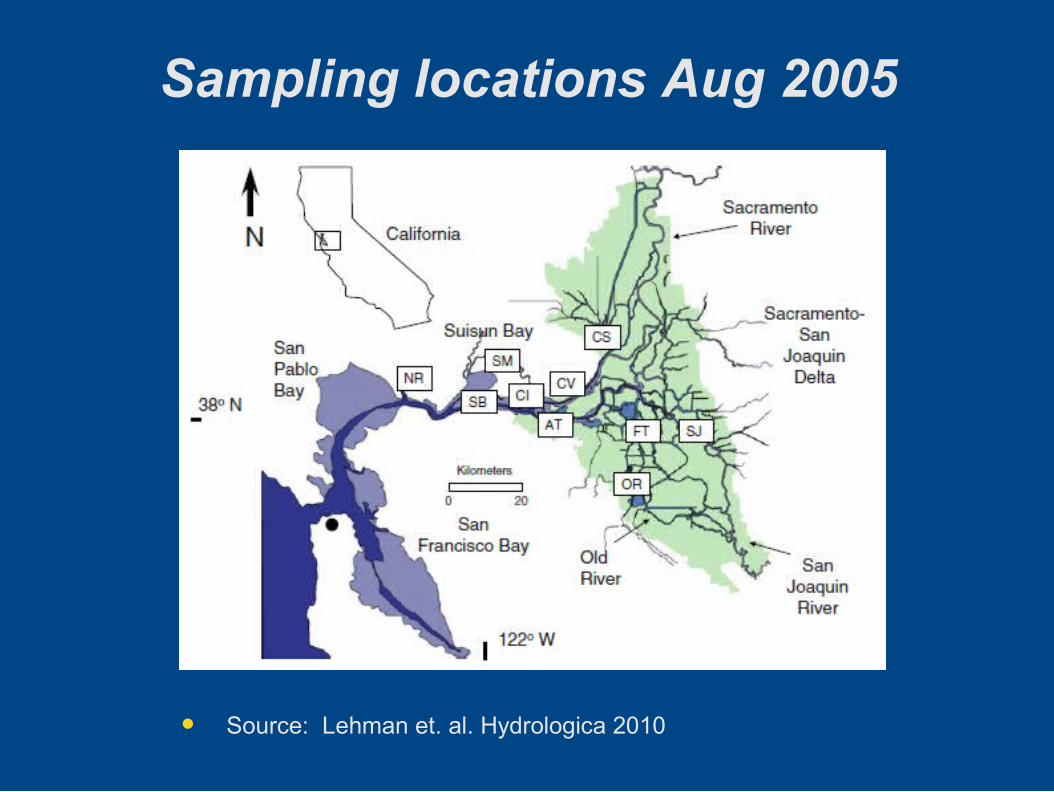
Sampling locations Aug 2005
Source: Lehman et. al. Hydrologica 2010
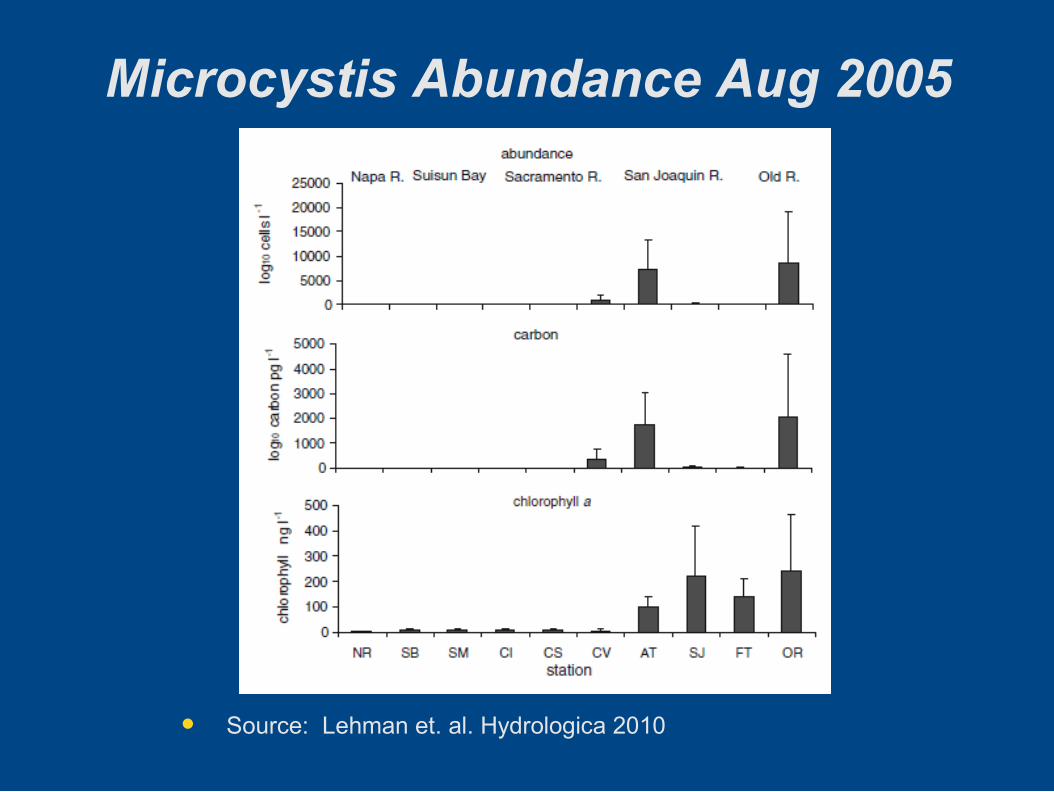
Microcystis Abundance Aug 2005
Source: Lehman et. al. Hydrologica 2010
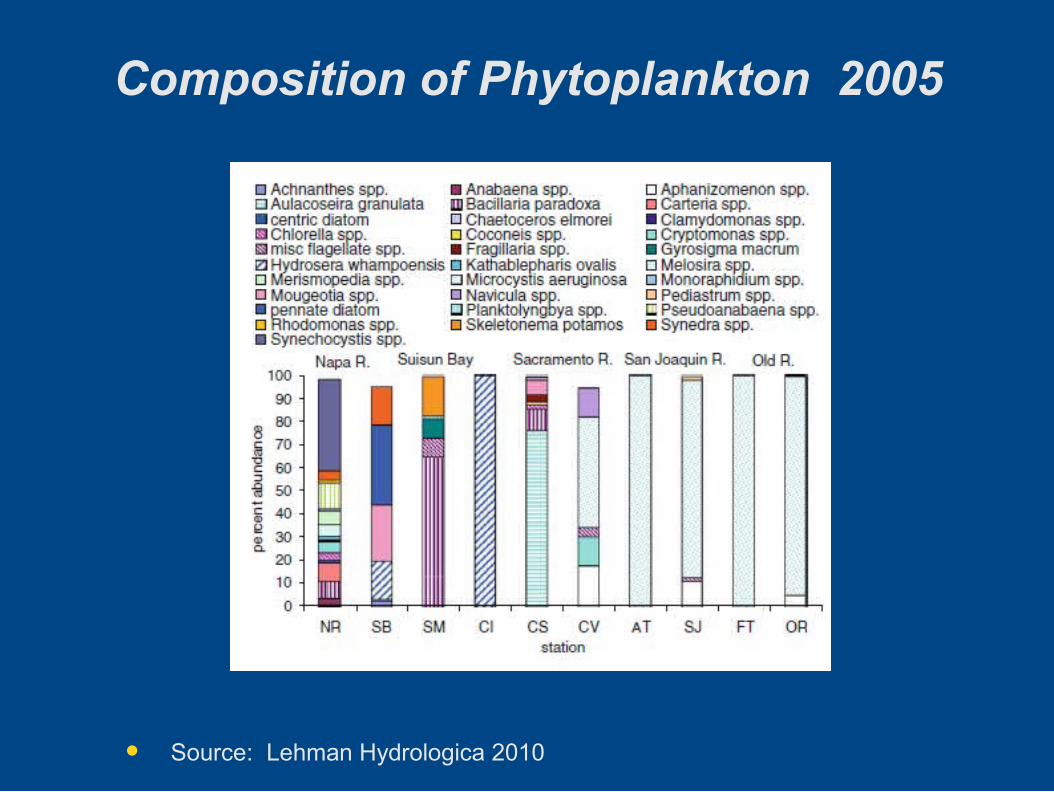
Composition of Phytoplankton 2005
Source: Lehman Hydrologica 2010
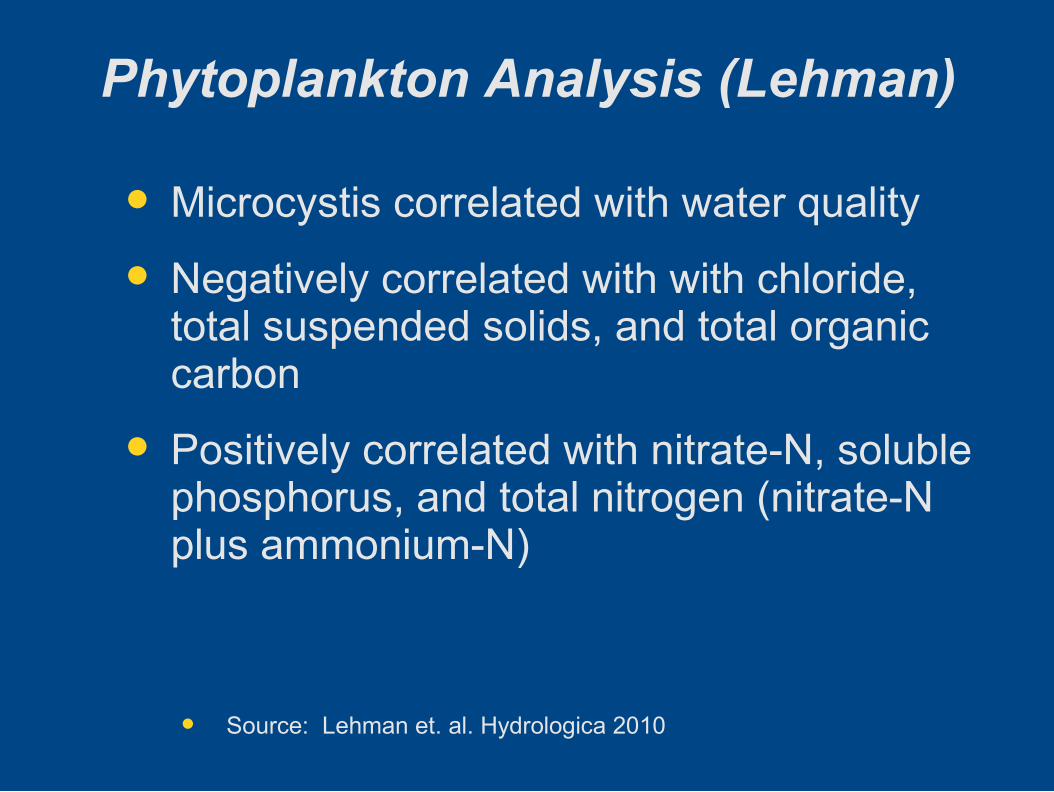
Phytoplankton Analysis (Lehman)
Microcystis correlated with water quality Negatively correlated with with chloride,
total suspended solids, and total organic carbon
Positively correlated with nitrate-N, soluble phosphorus, and total nitrogen (nitrate-N plus ammonium-N)
Source: Lehman et. al. Hydrologica 2010
Phytoplankton Analysis (Lehman)
Not significantly correlated with ammonium “Although ammonium-N concentration was
elevated at some stations in the western and central delta and the neither it nor the total nitrogen (nitrate-N and nitrite-N plus ammonium-N) to soluble phosphorus molar ratio (NP) was significantly correlated with Microcystis abundance across all regions or within the western and central delta separately.”
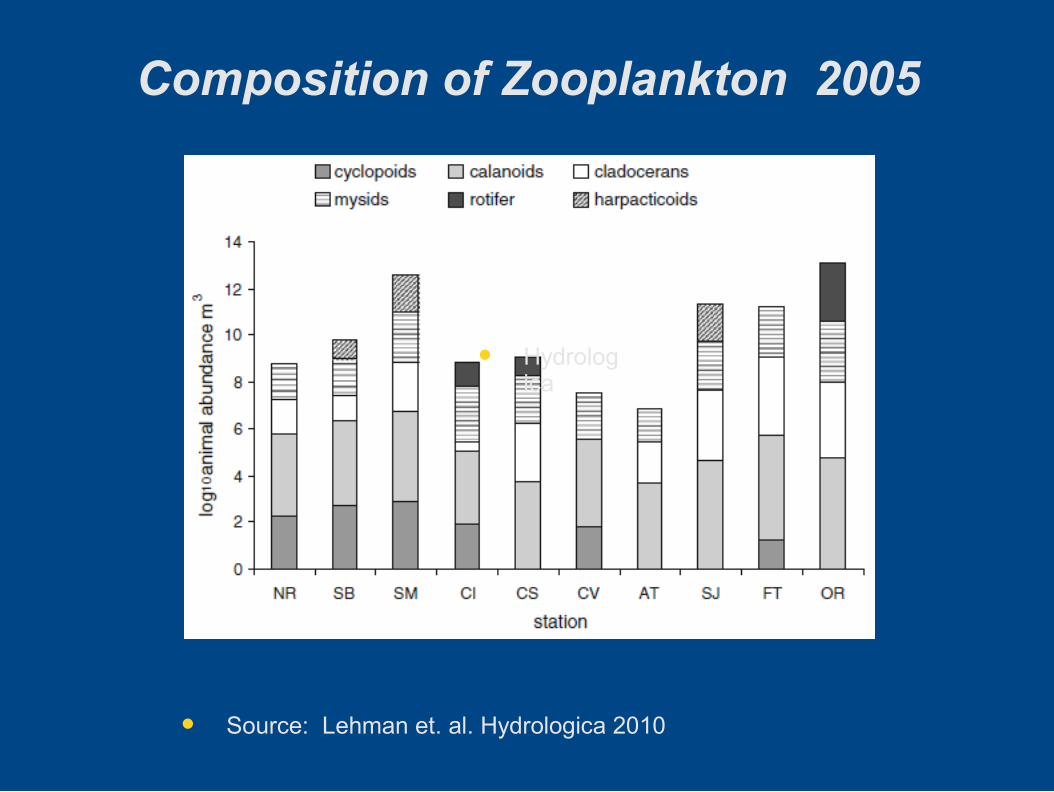
Composition of Zooplankton 2005
Hydrologica
Source: Lehman et. al. Hydrologica 2010
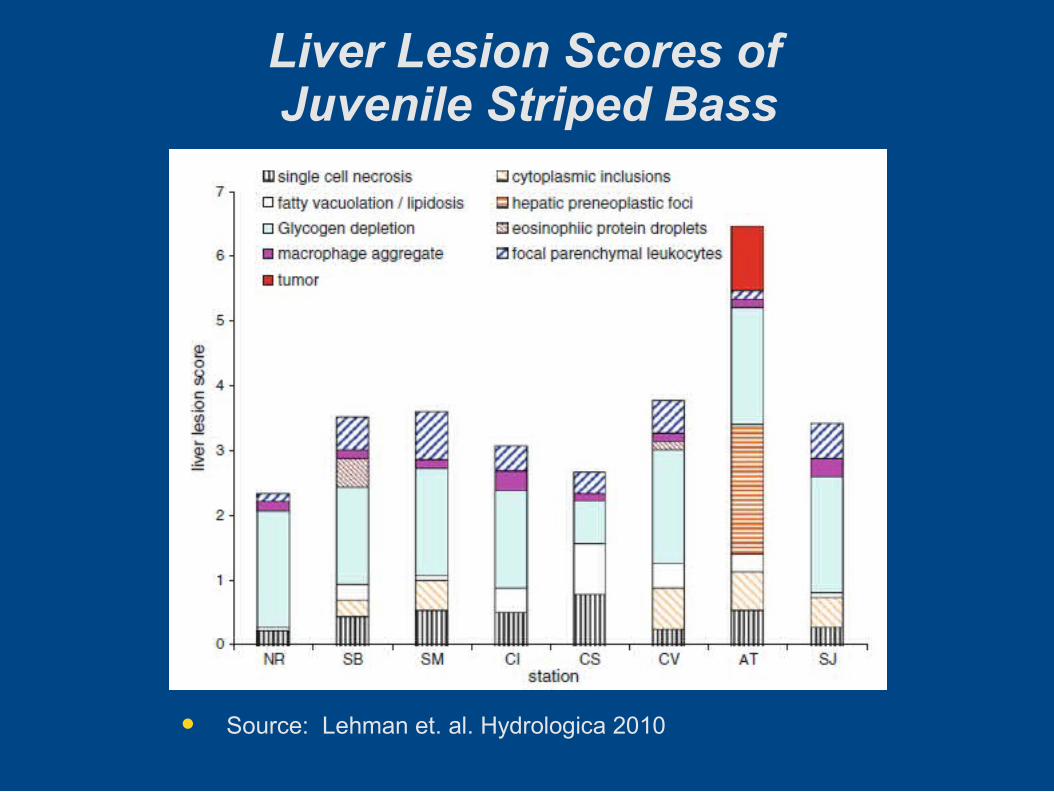
Liver Lesion Scores of Juvenile Striped Bass
Source: Lehman et. al. Hydrologica 2010
Toxic Algal Bloom Summary
Dense Microcystis blooms at Old River and Antioch
Correlated with nutrient levels (total nitrogen) and increased water clarity
May also be associated with low flows Cancer in juvenile Striped Bass thought to
be associated with toxins in San Joaquin River
Deep Water Ship Channel
San Joaquin River below Stockton, severe water quality problems
Fish kills in 2003 and 2007, associated with low DO
May be associated with upstream agricultural discharges as well as Stockton WWTP
Modeling showed that flows of San Joaquin River above 2000 cfs will solve problem
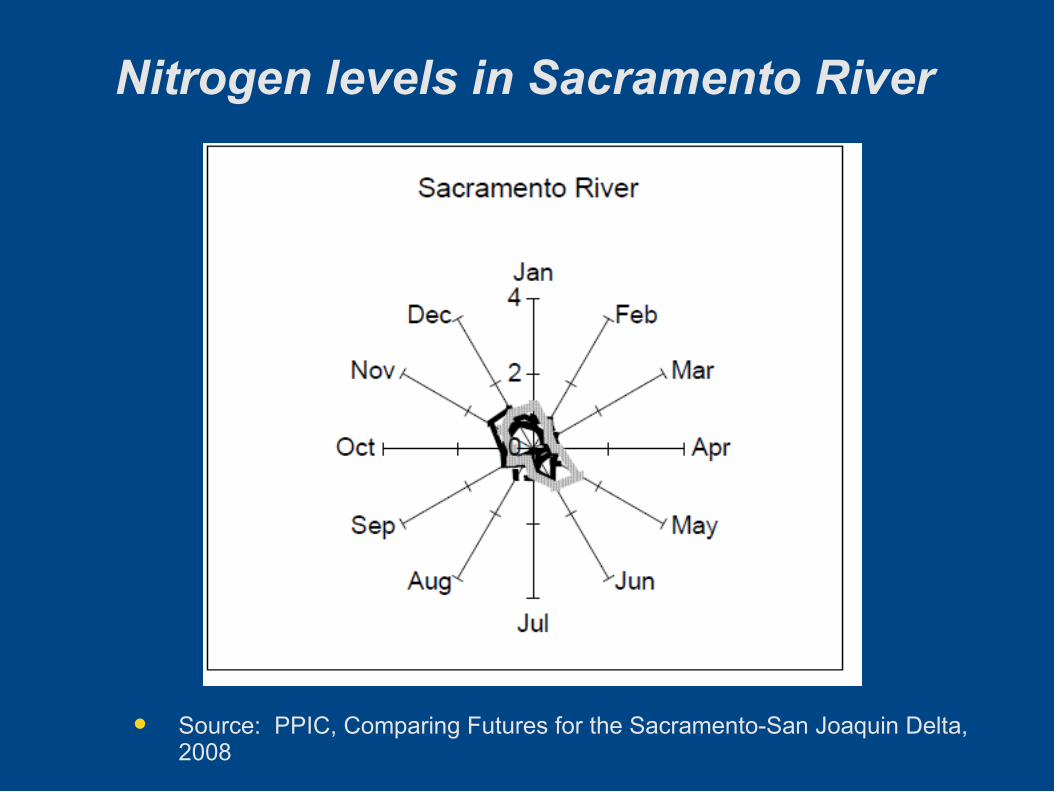
Nitrogen levels in Sacramento River
Source: PPIC, Comparing Futures for the Sacramento-San Joaquin Delta, 2008
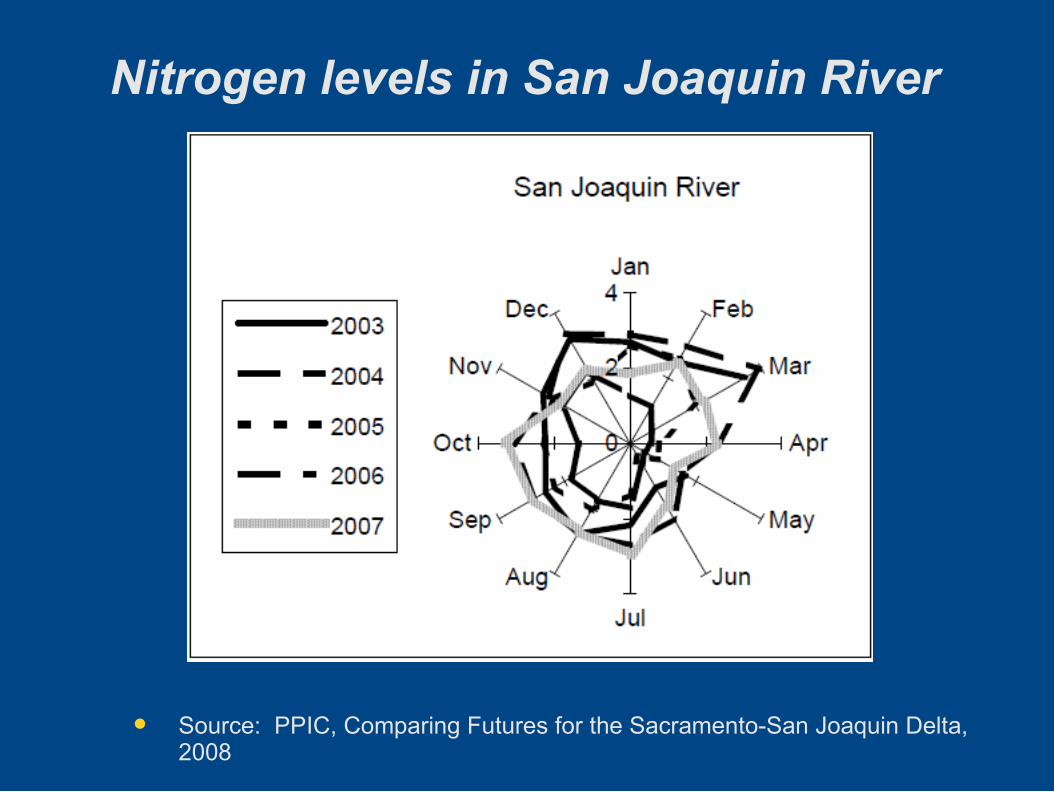
Nitrogen levels in San Joaquin River
Source: PPIC, Comparing Futures for the Sacramento-San Joaquin Delta, 2008
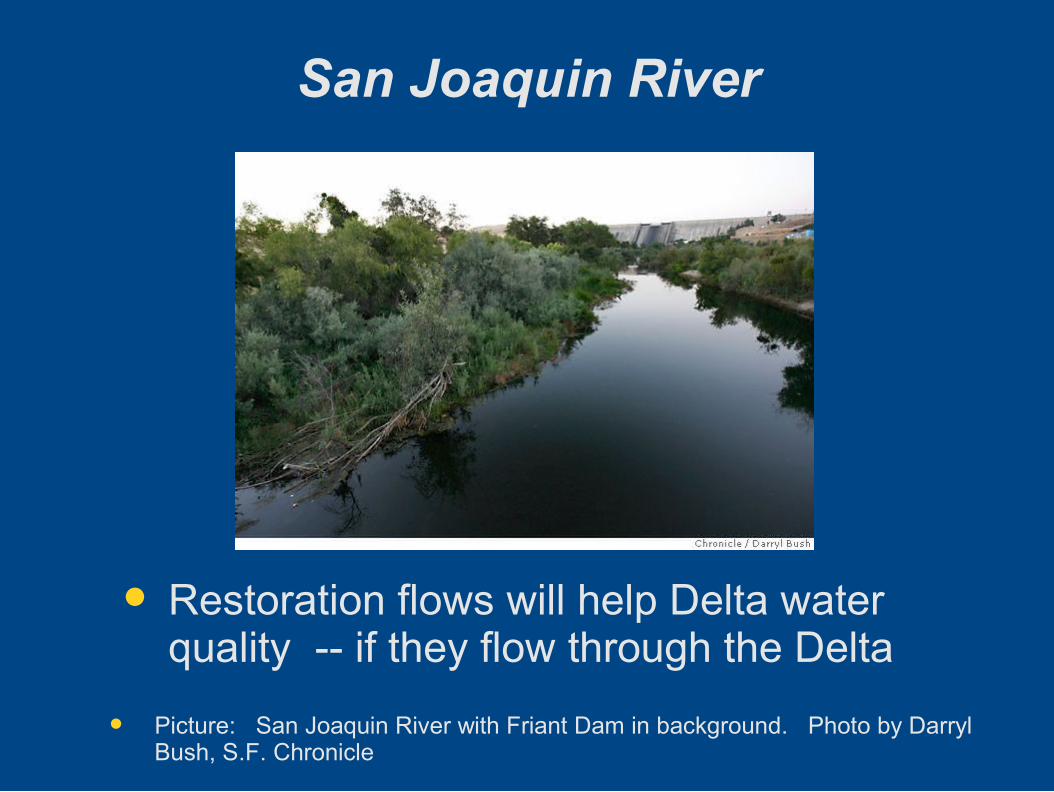
San Joaquin River
Restoration flows will help Delta water quality -- if they flow through the Delta
Picture: San Joaquin River with Friant Dam in background. Photo by Darryl Bush, S.F. Chronicle