Embed Size (px)
Citation preview

Turner, Paul and Liu, Tao and Zeng, Xuesen (2015) Dynamic response of orthogonal 3D woven carbon composites under soft impact. Journal of Applied Mechanics . ISSN 0021-8936
Access from the University of Nottingham repository: http://eprints.nottingham.ac.uk/29716/1/Dynamic%20response%20of%20orthogonal%203D%20woven%20carbon%20composites%20under%20soft%20impact.pdf
Copyright and reuse:
The Nottingham ePrints service makes this work by researchers of the University of Nottingham available open access under the following conditions.
· Copyright and all moral rights to the version of the paper presented here belong to
the individual author(s) and/or other copyright owners.
· To the extent reasonable and practicable the material made available in Nottingham
ePrints has been checked for eligibility before being made available.
· Copies of full items can be used for personal research or study, educational, or not-
for-profit purposes without prior permission or charge provided that the authors, title and full bibliographic details are credited, a hyperlink and/or URL is given for the original metadata page and the content is not changed in any way.
· Quotations or similar reproductions must be sufficiently acknowledged.
Please see our full end user licence at: http://eprints.nottingham.ac.uk/end_user_agreement.pdf
A note on versions:
The version presented here may differ from the published version or from the version of record. If you wish to cite this item you are advised to consult the publisher’s version. Please see the repository url above for details on accessing the published version and note that access may require a subscription.
For more information, please contact [email protected]

1
Dynamic Response of Orthogonal 3D Woven Carbon Composites Under Soft Impact 1
P.Turnera,b,c, T.Liua,b,c* and X.Zengb 2
aCentre for Structural Engineering and Informatics 3 bComposites Research Group, 4
cDepartment of Civil Engineering 5
Faculty of Engineering, The University of Nottingham, 6
University Park, Nottingham, NG7 2RD, U.K. 7
*[email protected] Tel: + 44 (0)1159 5 84059 Fax: +44 (0) 115 74 84059 8
Abstract 9
This paper presents an experimental and numerical investigation into the dynamic response of 3D orthogonal 10
woven carbon composites undergoing soft impact. Composite beams of two different fibre architectures, 11
varying only by the density of through-thickness reinforcement, were centrally impacted by metallic foam 12
projectiles. Using high speed photography, the centre-point back-face deflection was measured as a function 13
of projectile impulse. Qualitative comparisons are made with a similar uni-directional laminate material. No 14
visible delamination occurred in orthogonal 3D woven samples, and beam failure was caused by tensile fibre 15
fracture at the gripped ends. This contrasts with uni-direction carbon fibre laminates, which exhibit a 16
combination of wide-spread delamination and tensile fracture. Post-impact clamped-clamped beam bending 17
tests were undertaken across the range of impact velocities tested in order to investigate any internal damage 18
within the material. Increasing impact velocity caused a reduction of beam stiffness: this phenomenon was 19
more pronounced in composites with a higher density of through-thickness reinforcement. A three-20
dimensional finite element modelling strategy is presented and validated, showing excellent agreement with 21
the experiment in terms of back-face deflection and damage mechanisms. The numerical analyses confirm 22
negligible influence from though-thickness reinforcement in regards to back-face deflection, but significant 23
reductions in delamination damage propagation. Finite element modelling was used to demonstrate the 24
significant structural enhancements provided by the through-the-thickness weave. The contributions to the 25
field made by this research include the characterisation of 3D woven composite materials under high-speed 26
soft impact, and the demonstration of how established finite element modelling methodologies can be applied 27
to the simulation of orthogonal woven textile composite materials undergoing soft impact loading. 28
Keywords 29
High speed impact, 3D woven composite, Finite element, Delamination, Material rate-dependence 30

2
1 Introduction 31
The search for materials with enhanced protection against impact loading such as air blast or sand impact is of 32
major concern in the design of military vehicles. Both rapidly expanding radial shockwaves and sand ejecta 33
from shallow buried landmines or Improvised Explosive Devices (IEDs) can cause widespread damage of 34
structures. There have been several experimental methodologies developed for blast-loading of structures. The 35
first methodology was that of using explosives to load structures. This technique has the benefit of having the 36
same loading profiles of actual dynamic loading likely to be experienced by structures, however, it adds 37
difficulties as the wave fronts are spherical and the complex pressure signatures generated are difficult to 38
model. Another experimental technique developed to enable the reproduction of shock waves in the 39
laboratory, but to move away from the use of explosives, is the shock tube [1, 2]. It provides the advantage of 40
plane wave-front generation and easily controlled experimental parameters. However, it requires large 41
bespoke equipment, with calibration required that is unique for each shock tube system [1]. A more simplistic 42
and economical method to load structures with a well-defined dynamic distributed impulse was introduced by 43
Radford et al. [3], in which cylindrical metallic foam projectiles are accelerated into samples by a laboratory 44
scale pressurised gas gun. This method has often been referred to as “soft impact” loading. The projectiles are 45
highly compressible, exerting pressure pulses on structures in the order of 100 MPa for a duration of 46
approximately 200 ȝs. The pressure pulses have characteristics remarkably similar to that observed in fluid 47
shock loading; almost instantaneously rising pressure peaks diminishing with a rough exponential shape [3]. 48
For a more detailed discussion of the mechanisms of blast loading, the readers are referred to Smith and 49
Hetherington [4] for air blasts and Liu et al. [5] for sand impact. 50
The dynamic inertial response of a variety of monolithic and sandwich panels of composite and metal 51
materials have been investigated via the metallic foam projectile methodology by Radford et al. [6], Radford 52
et al. [7], McShane et al. [8] and more recently Russell et al. [9] and Kandan et al. [10]. Monolithic carbon 53
fibre laminate beams have been shown to provide superior performance in regards to back-face deflection 54
during dynamic shock loading than that of stainless steel beams of equal areal mass [9]. Evidence was also 55
presented that composites with lower strength matrix can exhibit increased performance whilst undergoing 56
dynamic soft impact loading, for both carbon fibre reinforced polymer composites and ultra-high molecular 57
weight polyethylene (UHMWPE) composites [10]. However, laminated composites have been shown to 58
exhibit delamination damage, even when no catastrophic longitudinal fibre fracture is observed [9]. This is a 59
performance-limiting quality inherent within all laminate composites, and will become more exaggerated if 60
the composite matrix strength is reduced. Delamination damage can be particularly dangerous as it is not 61
always present during visual inspection of structures [11], and can severely reduce bending stiffness and 62

3
compressive strength [12] after impact. A more comprehensive overview of the negative effects of 63
delamination of fibre-reinforced composites is presented by Wisnom [13]. 64
There are various different techniques that have been developed in order to allow for enhanced protection 65
against delamination of fibre reinforced composites, readers are referred to Tong et al. [14] for a 66
comprehensive description of these techniques. For brevity, only three of the most prominent techniques will 67
be mentioned here; stitching, weaving, and z-pinning. The stitching process is used extensively in industry, 68
due to its highly automated fabrication and short set-up time. They have also been proven to have good 69
damage-resistance properties during high intensity blast loading [15]. However, due to the inherent brittle 70
nature of carbon and glass yarns, fibre breakages and other microstructural defects can occur during the 71
stitching process [14]. Z-pinning is another method commonly used for improving the through-thickness 72
properties of composite materials. This is when high strength, relatively small diameter cylindrical rods are 73
inserted through the composite, increasing the fracture toughness and delamination resistance of the material. 74
A comprehensive review of z-pinning is given by Mouritz [16]. Z-pinned composites have been proven to 75
provide good protection against delamination during soft-body impact loading [17-19]. However, due to the 76
pinning process, damage of in-plane fibres is inevitable, and reduction of in-plane properties can be quite 77
severe. For z-pinned laminates, this can be around 27% reduction for tensile strength and at least 30% 78
reduction for compressive strength [20]. 79
3D orthogonal woven composites have been developed in order to address the issue of delamination damage 80
of fibre-reinforced composite materials, without significant disturbance of the in-plane fibre architecture 81
during the manufacturing process. 3D reinforced composites include through-the-thickness tows which wrap 82
around the orthogonal warp and weft tows, binding them together [21]. The through-the-thickness tows 83
provide crack bridging, and a reduction in size of continuous interfaces. This translates to a greatly improved 84
resistance to delamination [22-25]. There have been numerous studies conducted into the ballistic impact 85
performance of 3D woven composite materials, in particular, in the development and validation of numerical 86
modelling strategies [26-29]. They indicate the enhanced structural performance of the 3D weave and the 87
reduction of damage within the material. However, as of yet, there are no studies which investigate the 88
application of the superior delamination damage resistance of 3D woven composite materials to dynamic soft 89
impact loading. The objective of this research is to provide a comprehensive investigation into the potential of 90
3D woven composites to resist soft impact loading without inducing widespread damage within the material. 91
In this study, two different densities of orthogonal through-the-thickness reinforcement are compared via soft 92
impact experimental testing and finite element simulation. A qualitative comparison is made with a similar 93
UD-laminate material in regards to the damage sustained. Post-impacted beams were tested in a clamped-94
clamped beam bending setup in order to ascertain the development of any internal damage within the beams. 95

4
For numerical modelling of composite materials undergoing soft impact, inclusive of rate-dependency, the 96
constitutive and damage laws for composite materials provided by Hashin [30] and Matzenmiller et al. [31] 97
can be used to accurately predict the dynamic transient deflection of composite laminate materials undergoing 98
shock loading [32]. This paper combines this modelling strategy with explicit modelling of the through-the-99
thickness reinforcement, allowing for a detailed examination of the exact role in which it plays during shock 100
loading. Finite element analyses compare the transient deformation and damage predictions between a 3D 101
woven composite and an equivalent UD-laminate material are made. In order to further investigate the 102
structural enhancements provided by through-the-thickness reinforcement, simulations of pre-delaminated 103
composite beams with and without though-the-thickness reinforcement are undertaken. The novelty of this 104
research is to develop understanding of orthogonal 3D woven composite beams under high-speed soft impact, 105
and the demonstration of the efficacy of a full-scale finite element modelling strategy for simulation of the 106
dynamic response of the beams. 107
The outline of the study is as follows. Section 1 presents an overview of the literature regarding the impact 108
testing of composite materials. Section 2 presents the material geometry, manufacturing technique, and quasi-109
static material tests. Sections 3 and 4 present a description of the soft impact test methodology and finite 110
element modelling strategy, respectively. Section 5 presents a discussion of the soft impact experiment results, 111
aided with finite element predictions. Section 5 also reports the post impact clamped-clamped beam tests that 112
were conducted in order to investigate any internal damage within the composite beams. Section 6 presents a 113
summary of the main findings of the research, and states the limitations of the work. 114
2 Materials, manufacturing and quasi-static tests 115
Materials 116
Two 3D orthogonal woven carbon fibre reinforcements with different through-the-thickness (TTT) 117
reinforcement densities were used within this study. The first reinforcement, referred to as Full TTT, had a 118
binder-to-warp-stack ratio of 1:1 (i.e. each binder tow is separated by one vertical stack of warp tows). The 119
second reinforcement, referred to as Half TTT, had a binder-to-warp-stack-ratio of 1:2 (i.e. each binder tow is 120
separated by two vertical stacks of warp tows). Figure 1 (b) presents sketches of the two architectures. Cross 121
sectional microscopic images of the cured composite, such as the one presented in Figure 1(a), were used to 122
measure the average values for dimensions of the fibre architecture. Both materials contained an alternating 123
stack of 9 weft layers and 8 warp layers, and a cured composite thickness of 3.5 mm. Top and bottom tows 124
were orientated along the weft direction, and were the only tows with an induced crimp due to localised 125
influence of the TTT-reinforcement. As shown in Figure 1(a), the induced crimp angle was 7º from the 126
horizontal. 127

5
As shown in Figure 1(b), the average width and thickness of warp tows were 1.70 mm and 0.177 mm, 128
respectively. Average width and thickness of weft tow were 1.40 mm and 0.230 mm, respectively. Average 129
width and thickness of TTT-reinforcement were 0.5 mm and 0.1 mm, respectively. Spacing between TTT-130
reinforcement was 1.74 mm in the Full TTT material and 3.48 mm in the Half TTT material. Total fibre 131
volume fraction for the Full TTT and Half TTT cured composite were 0.56 and 0.55, respectively. In order to 132
extract the material properties for tows for use in the finite element model (presented later, in Section 4), it is 133
necessary to calculate the tow volume fraction in the warp and weft directions. The tow volume fraction is 134
calculated by taking the measured total tow cross sectional area in a specific direction, and dividing into the 135
total area of the cross section. More detail of this is presented in Section 4.3. For the Full TTT material, the 136
tow volume fraction was measured as 0.285 along the warp direction, and 0.531 along the weft direction. 137
The fibre reinforcement consisted of 7 ȝm diameter AKSACA A-38 carbon fibre tows, with 6K filaments for 138
the warp and weft tows, and 3K filaments for the through-the-thickness reinforcement tows. The tow fibre 139
volume fractions, i.e. the ratio of the area of fibres into the area of the tow, were 0.785, 0.692, and 0.795 for 140
warp, weft, and TTT-reinforcement tows, respectively. A co-ordinate system is defined in Figure 1(b) and 141
utilised throughout this paper; the direction running parallel to the warp tows is referred to as x-direction, the 142
direction running parallel to the weft tows as y-direction, and the though-thickness direction is referred to as 143
the z-direction. 144
Manufacturing 145
Gurit Prime 20LV epoxy resin, with a slow hardener to resin ratio by weight of 26:100, was used. Resin 146
injection within a steel mould tool followed standard vacuum infusion methodology. The outlet port was 147
located at the centre of the tool, and four inlet ports were located at each corner. 8 bolts tightened around the 148
edge of the tool provided sufficient compaction of the dry fabric. A pressure pot was filled with compressed 149
air, with the pressure gradually increased throughout the infusion process from 0 to 6 bars. Simultaneously to 150
this, a vacuum was drawn through the outlet port at the centre of the tool in order to pull the resin through the 151
preform. To cure, the infused panel was left in an oven set at 65ºC for 7 hours. The cured panel had 152
dimensions of 250 x 250 mm2 and a thickness of 3.5 mm. Approximately 10 mm was removed from each 153
edge of the panel in order to remove any flaws due to cutting of the preform. The final cured areal density of 154
the composite material was 5300 g m-2 and 5210 g m-2 for the Full TTT and Half TTT, respectively. 155
Quasi-static tension and compression coupon tests 156
Quasi-static (2mm /min) uniaxial coupon tests were conducted on the Full TTT reinforcement composite 157
material in order to categorise the material response during tension and compression. Tensile experiments 158

6
adopted EN ISO 527-4 methodology, using dog bone shaped samples. Compression testing utilised ASTM 159
D3410/B test methods. A screw-driven Instron© 5581 test machine with a static 50 kN load cell was used for 160
testing. An Instron© 2630 clip-on extensometer was used to measure the nominal axial strain; this was 161
confirmed by a single Stingray F-146B Firewire Camera video gauge with Imentrum© post processing Video 162
Gauge software. The nominal stress was read directly from the load cell of the test rig. Tension and 163
compression tests for both warp and weft directions each had a minimum of five repeats. 164
Tensile and compressive tests with ±45º orientation were conducted in such a way that the warp and weft tows 165
laid at ±45º to the loading axis. Samples orientated along warp tows, weft tows, or with fibres at ±45º had a 166
width of 12 mm. Tensile tests had a length of 60 mm, compressive tests had a gauge length of 12 mm in order 167
to prevent global buckling. 168
Figure 2 (a) and (b) presents the tensile and compressive stress-strain curves of the Full TTT 3D woven 169
carbon composite material. The tensile Young’s moduli were 44.4 GPa and 74.6 GPa for warp and weft 170
directions, respectively. Tensile and compressive testing along both the warp and weft directions exhibited 171
elastic-brittle fracture. Fracture of the sample was predominately governed by the fracture of the in-plane fibre 172
reinforcement. This was confirmed from scanning electron microscope (SEM) images of fracture surfaces. For 173
tensile and compressive samples orientated along the y-direction (weft), fracture occurred at the locations of 174
through-thickness reinforcement. The fracture location was attributed to stress concentrations due to the 175
crimping of the longitudinal weft tows. 176
Tension and compression tests conducted with fibres orientated at ±45º show a more ductile, yet weaker 177
response, as the tests are governed by the relatively soft matrix material. This behaviour is consistent to the 178
ductile, matrix dominated response observed for other 3D orthogonal woven carbon composites tested at ±45º 179
to the loading direction, conducted by Gerlach et al. [33]. 180
Quasi-static (2mm /min) compression tests were also undertaken on the Alporas aluminium foam material that 181
was used for the projectiles in the soft impact test. The foam material exhibits a plateau at a stress of 182
approximately 2.2 MPa, corresponding to the plastic buckling of cell walls. The foam exhibits densification 183
behaviour at higher strains. The compressive stress-strain response of the aluminium foam material is 184
presented in Figure 2(c). 185
3 Dynamic soft impact test protocol 186
Figure 3 presents a sketch of the experimental set up for soft impact tests. Samples of width w = 40 mm and 187
length L = 250 mm were cut from the fully cured composite panels. The beams were fixed into a steel sample 188
fixture, which in turn was bolted into an aluminium alloy frame by a total of 8 M6 bolts. Clamped beams had 189

7
a gauge length of l0 = 170 mm. The distance from the gas gun muzzle to the front edge of composite samples 190
was s = 200 mm. The single-stage gas-gun system developed at the University of Nottingham was used in the 191
experiment. The gas gun pressurises a 3-litre diving cylinder up to a maximum pressure of 45 bars. Pressure 192
was released via a fast-acting solenoid valve, accelerating projectiles down a 3.5 m long barrel. The barrel 193
material was hardened steel, with an outer diameter of 40 mm and a bore diameter of 28 mm. Projectiles were 194
circular cylindrical of length mm50pl and diameter mm5.27pd . Projectiles were electro-discharge 195
machined from a block of Alporas aluminium foam material of density 3mkg310 p . Exit velocity of 196
projectile 0v was measured in two ways; by two laser gates at the muzzle end of the barrel and high speed 197
photography. Exit velocity of projectiles fell within the range 10
1 ms270ms160 v . This corresponded 198
to a projectile momentum per unit area 000 vlI p range of s kPa19.4s kPa48.2 0 I High speed 199
photography was employed in order to measure the back face deflection of the beams. The high speed camera 200
model Phantom Mercury HS v12.1 with a global electronic shutter was used. Typical recordings had a frame 201
rate of 22,000 fps and an exposure time of 35 ȝs. 202
4 Finite Element Analysis 203
Finite element (FE) modelling of soft impact events was utilised in order to aid interpretation of the 204
experimental tests and provide further insight into the results. The modelling strategy employed the 205
constitutive model of Matzenmiller et al. [31] and Hashin [30] for fibre composites, implemented within the 206
commercial finite element code ABAQUS. The primary aims of the numerical calculations were: 207
To develop a full scale FE modelling strategy to predict the response of 3D woven composite 208
materials undergoing soft impact. 209
To further investigate the role of TTT-reinforcement within 3D woven composites undergoing 210
dynamic soft impact. 211
4.1 Description of the finite element model 212
Three-dimensional (3D) finite element modelling was conducted using the explicit solver of ABAQUS 213
(Version 6.12). Each of the 17 layers of the composite beam was modelled individually, with each layer 214
composed of tows and inter-tow matrix channels. See Figure 4 for a sketch of the modelling strategy. The in-215
plane tows, through-thickness reinforcement, and matrix channels were modelled using 4-noded quadrilateral 216
shell elements with reduced integration (S4R in ABAQUS notation), with 5 integration points through the 217
thickness. The element size of in-plane tows were approximately 1.1 mm, and the inter-tow matrix elements 218
were approximately 0.15 mm. The ABAQUS orientation assignment control was used to assign local fibre 219

8
orientations for individual tows. Cross sectional microscopic images, e.g. Figure 1(a), were used to acquire the 220
geometrical data such as tow/matrix sizes and locations. The surface-based cohesive contact interaction within 221
ABAQUS was employed to simulate the interaction between layers through the thickness of the beam, by 222
which delamination under dynamic impact can be simulated. The through-the-thickness reinforcement was 223
explicitly modelled, independently to the in-plane fibre architecture, with geometric parameters again taken 224
from cross-sectional microscopic images. The translational and rotational nodal degrees of freedom (DoF) of 225
the through-the-thickness reinforcement were tied to the translational and rotational nodal DoF of the in-plane 226
fibre architecture via the tie constraint option within ABAQUS. The element size of through-thickness 227
reinforcement was approximately 0.7 mm. Fixed boundary conditions were employed at the two edges of the 228
composite sample, giving a gauge length of 170 mm. All material properties, except the in-plane shear 229
stiffness of tow reinforcement, were estimated from uniaxial tension/compression coupon tests performed on 230
the composite material. The constitutive models for the tows and the matrix channels are presented in Section 231
4.2. The constitutive model for the surface-based cohesive contact interaction is presented in the Appendix to 232
this paper. The aluminium foam projectile was modelled with 8-node brick elements with reduced integration 233
(C3D8R in ABAQUS notation), using the isotropic constitutive model for metal foam described in Section 234
4.2. The “general contact” option in ABAQUS was employed to simulate the interaction between the metal 235
foam and the composite beam. A total of 210,000 shell elements were used for the composite material, and 236
14,100 solid elements for the projectile. A numerical study demonstrated that this mesh density can provide 237
converged results. All numerical simulations were conducted in 8 CPUs parallel mode using the High 238
Performance Computing (HPC) system at the University of Nottingham. 239
The numerical study included the two different material geometries used within the experimental investigation 240
i.e. Full TTT and Half TTT. In order to study the effect of the TTT reinforcement, simulations were 241
undertaken with the through-the-thickness reinforcement removed. The in-plane geometry for this model was 242
based upon that of the either the Full TTT or Half TTT material. This model is referred to as No TTT 243
throughout this paper, and is identical to non-crimp composite materials. To investigate the influence of the 244
in-plane fibre architecture, an equivalent UD-laminate material was utilised. The equivalent UD-laminate does 245
not explicitly model the geometry of each individual tow and matrix channel; the tows and matrix channels 246
are homogenised into one effective laminate, and the TTT reinforcement is removed. For clarification, Figure 247
4 (a), (b), and (c) presents sketches of the top layer of the Full TTT, No TTT, and Equivalent UD-laminate 248
material FE models, respectively. 249
4.2 The constitutive models employed in the FE simulations 250
4.2.1 The constitutive models for each tow, TTT reinforcement and matrix channel 251

9
The constitutive models of Hashin [30] and Matzenmiller et al. [31] were employed to simulate the behaviour 252
of the in-plane tows, the TTT reinforcement, and the inter-tow matrix channels during soft impact loading. As 253
indicated in Figure 4, both the tow and the matrix regions were modelled as 4-node quadrilateral shell 254
elements (S4R in ABAQUS notation). In order to describe the constitutive models, we will introduce a local 255
co-ordinate system denoted by numbers, with 11 being longitudinal to fibre direction, and 22 being transverse 256
to fibre direction. The tow and matrix elements were modelled as an orthotropic material under plane stress 257
conditions i.e. 0231333 . The undamaged in-plane stress strain relationship is given as; 258
12
22
11
12
222221
111211
12
22
11
100
01
01
G
EE
EE
(1) 259
where )2,1,( jiij are the in-plane stress components. 11 and 22 are the normal strains in the x1 and x2 260
directions, respectively. 11E , 22E , 12G , 12 and 21 are longitudinal and transverse Young’s modulus, shear 261
modulus, and Poisson’s ratios following 12112221 / EE . 262
Damage model 263
The four primary damage modes exhibited by fibre reinforced composites (fibre rupture under tension, fibre 264
kinking and buckling under compression, matrix cracking under transverse tension and shear, and matrix 265
crushing under transverse compression and shearing) were incorporated via the anisotropic damage initiation 266
and progression models developed by Hashin [30] and Matzenmiller et al. [31]. The damage locus can be 267
defined by a stress-space, as set out by the Hashin criteria. As long as the stress state remains within the 268
damage locus, the material is classified as undamaged. Undamaged material follows the stress-strain 269
relationship defined in Equation (1). When the stress state reaches or exceeds that of the damage locus, 270
damaged is initiated, and four scalar damage variables are introduced into the stress-strain relationship. Thus, 271
the response of the material after damage initiation becomes; 272
12
22
11
12
222212
112111
12
22
11
)1(/100
0)1(/1)1(/
0)1(/)1(/1
s
mm
ff
dG
dEdE
dEdE
(2) 273
where otherwise
0jifand
otherwise
0jif 2211
cm
tm
mcf
tf
fd
dd
d
dd (3) 274

10
tfd , c
fd , tmd and c
md are the tensile fibre, compressive fibre, tensile matrix, and compressive matrix damage 275
variables, respectively. A useful “resultant” shear damage variable, which combines all four of the damage 276
modes, is defined by 277
)1)(1)(1)(1(1 cm
tm
cf
tfs ddddd (4) 278
Prior to damage initiation, these four damage variables have zero values. As damage is initiated and 279
progresses within the material, these variables progress from zero up to a maximum value of unity controlled 280
by the strain of the material. The damage evolution law follows utilises a critical stress surface proposed by 281
Matzenmiller et al. [31], and is defined as; 282
1)1(
11 Tt
f Xd
(5) 283
1)1(11
Cc
f Xd
(6) 284
1)1(
2
)1(
2
12
2
11
YdYd stm
(7) 285
1)1(
2
)1(
2
12
2
22
YdYd scm
(8) 286
where the symbol represents the Macaulay brackets with the usual interpretation. TX and CX denotes the 287
longitudinal tensile and compressive strength for damage initiation. Y denotes the transverse tensile and 288
compressive strength. 289
If the current state of stress within the material exceeds the critical space defined by Equations (5) to (8), the 290
four independent damage variables (tfd , c
fd , tmd and c
md ) evolve and induce a linear reduction in stress with 291
increasing strain. These damage variables are continually updated following the relationship; 292

11
1
2
2
1111
1111
EXXl
J
EXXl
J
dT
Te
tf
TT
e
tf
tf
(9) 293
1
2
2
1111
1111
EXXl
J
EXXl
J
dC
ce
cf
Cc
e
cf
cf
(10) 294
12
2
22212
2
22
22212
2
22
EY
Yl
J
EYYl
J
d
e
m
e
m
tm
(11) 295
12
2
22212
2
22
22212
2
22
EY
Yl
J
EYYl
J
d
e
m
e
m
cm
(12) 296
tfJ , c
fJ and mJ are the tensile fibre fracture energy, compressive fibre fracture energy and matrix fracture 297
energy, respectively. In order to alleviate mesh dependency, a characteristic length scale,el , is utilised. The 298
matrix channels are modelled with the same constitutive law as the tows. However, for the matrix material, 299
the longitudinal and transverse properties are identical, i.e. the longitudinal fibre tensile and compressive 300
properties required in the model are taken to be the same as the material properties of the matrix. 301
Rate dependency 302
Numerous studies have demonstrated the importance of the strain-rate dependent behaviour of 3D woven 303
carbon fibre reinforced composites [33, 34]. Preliminary simulations of soft impact events indicated that 304
without the inclusion of rate dependency within the composite material, the predictions of the onset and 305
propagation of damage were inaccurate. In order to simulate rate dependency within the materials, a viscous 306
regularisation scheme is employed for in-plane tows, TTT reinforcement, and matrix material. A viscosity 307
coefficient, , following Duvaunt and Lions [35], is introduced to further update each of the four previously-308
defined damage variables (tfd , cfd , t
md and cmd ). The viscous damage variables are defined as; 309

12
vii
vi ddd
1 (13) 310
where represents the relaxation time of the system, with id as the previously defined inviscid damage 311
variable, with i denoting one of the four damage modes (I through IV for tfd , c
fd , tmd and c
md , respectively). 312
The term vid is used to compute the damaged stiffness matrix and is updated by; 313
000 t
vittitt
vi d
td
t
td
(14) 314
The viscous regularisation effectively slows down the rate of damage evolution, with increasing rates of 315
deformation leading to increasing fracture energies. A numerical calibration study led to the value たs5 . 316
This value was assumed to be identical for tension and compression for both longitudinal and transverse 317
damage modes. The viscosity coefficient employed within this study corresponds well with previously 318
calibrated values of for carbon fibre reinforced epoxy materials, such as the one presented by Russell et al. 319
[9]. 320
4.2.2 Constitutive model for the metal foam projectile 321
The isotropic continuum constitutive model for metal foams developed by Deshpande and Fleck [36] was 322
used to model the Alporas aluminium foam projectiles. The von Mises effective stress, defined as 323
2/3 ijije ss (15) 324
with ijs as the usual deviatoric stress. The yield surface for the metal foam is isotropic and follows the yield 325
function by 326
0ˆ Y (16) 327
where the equivalent stress is given by 328
2222
2
])3/(1[
1ˆ me
(17) 329
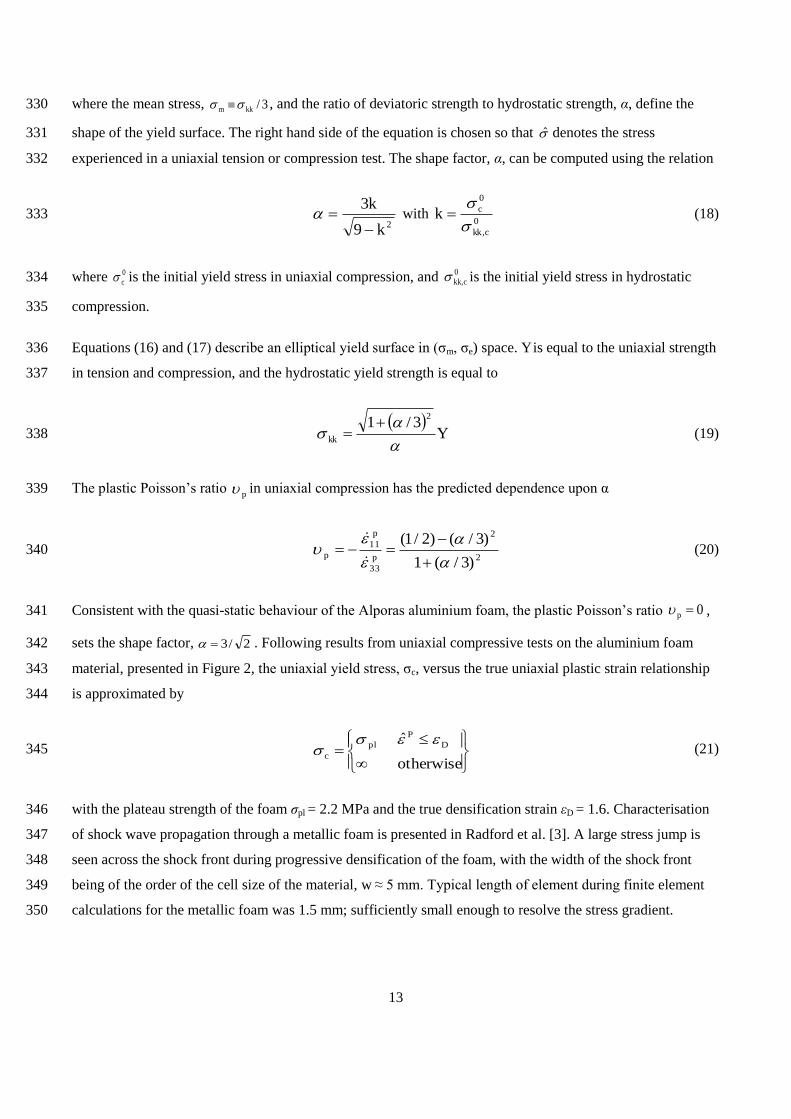
13
where the mean stress, 3/kkm , and the ratio of deviatoric strength to hydrostatic strength, Į, define the 330
shape of the yield surface. The right hand side of the equation is chosen so that denotes the stress 331
experienced in a uniaxial tension or compression test. The shape factor, Į, can be computed using the relation 332
29
3
k
k
with
0,
0
ckk
ck
(18) 333
where 0c is the initial yield stress in uniaxial compression, and 0
,ckk is the initial yield stress in hydrostatic 334
compression. 335
Equations (16) and (17) describe an elliptical yield surface in (jm, je) space. Y is equal to the uniaxial strength 336
in tension and compression, and the hydrostatic yield strength is equal to 337
Ykk
23/1
(19) 338
The plastic Poisson’s ratio p in uniaxial compression has the predicted dependence upon g 339
2
2
33
11
)3/(1
)3/()2/1(
p
p
p
(20) 340
Consistent with the quasi-static behaviour of the Alporas aluminium foam, the plastic Poisson’s ratio 0p , 341
sets the shape factor, 2/3 . Following results from uniaxial compressive tests on the aluminium foam 342
material, presented in Figure 2, the uniaxial yield stress, jc, versus the true uniaxial plastic strain relationship 343
is approximated by 344
otherwise
ˆ DP
plc
(21) 345
with the plateau strength of the foam ıpl = 2.2 MPa and the true densification strain İD = 1.6. Characterisation 346
of shock wave propagation through a metallic foam is presented in Radford et al. [3]. A large stress jump is 347
seen across the shock front during progressive densification of the foam, with the width of the shock front 348
being of the order of the cell size of the material, w ≈ 5 mm. Typical length of element during finite element 349
calculations for the metallic foam was 1.5 mm; sufficiently small enough to resolve the stress gradient. 350
14
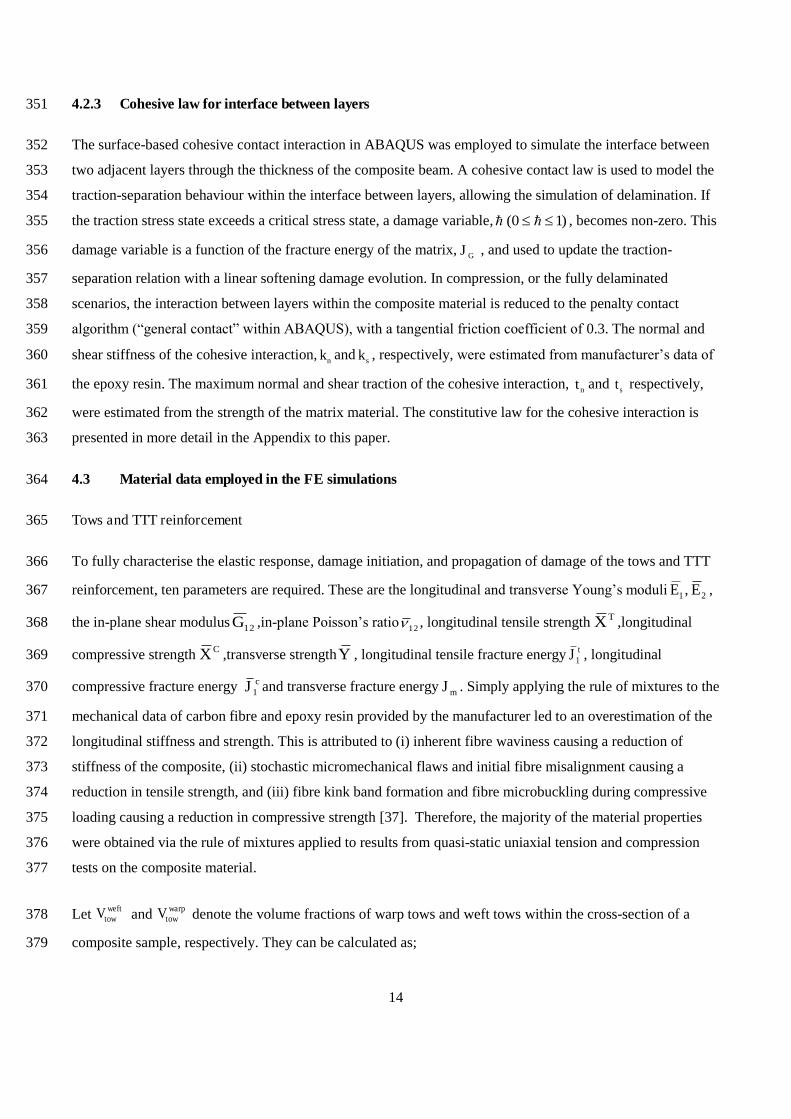
4.2.3 Cohesive law for interface between layers 351
The surface-based cohesive contact interaction in ABAQUS was employed to simulate the interface between 352
two adjacent layers through the thickness of the composite beam. A cohesive contact law is used to model the 353
traction-separation behaviour within the interface between layers, allowing the simulation of delamination. If 354
the traction stress state exceeds a critical stress state, a damage variable, )10( , becomes non-zero. This 355
damage variable is a function of the fracture energy of the matrix,GJ , and used to update the traction-356
separation relation with a linear softening damage evolution. In compression, or the fully delaminated 357
scenarios, the interaction between layers within the composite material is reduced to the penalty contact 358
algorithm (“general contact” within ABAQUS), with a tangential friction coefficient of 0.3. The normal and 359
shear stiffness of the cohesive interaction,nk and sk , respectively, were estimated from manufacturer’s data of 360
the epoxy resin. The maximum normal and shear traction of the cohesive interaction, nt and st respectively, 361
were estimated from the strength of the matrix material. The constitutive law for the cohesive interaction is 362
presented in more detail in the Appendix to this paper. 363
4.3 Material data employed in the FE simulations 364
Tows and TTT reinforcement 365
To fully characterise the elastic response, damage initiation, and propagation of damage of the tows and TTT 366
reinforcement, ten parameters are required. These are the longitudinal and transverse Young’s moduli 1E , 2E , 367
the in-plane shear modulus12G ,in-plane Poisson’s ratio 12 , longitudinal tensile strength TX ,longitudinal 368
compressive strength CX ,transverse strengthY , longitudinal tensile fracture energytJ1 , longitudinal 369
compressive fracture energy cJ1 and transverse fracture energymJ . Simply applying the rule of mixtures to the 370
mechanical data of carbon fibre and epoxy resin provided by the manufacturer led to an overestimation of the 371
longitudinal stiffness and strength. This is attributed to (i) inherent fibre waviness causing a reduction of 372
stiffness of the composite, (ii) stochastic micromechanical flaws and initial fibre misalignment causing a 373
reduction in tensile strength, and (iii) fibre kink band formation and fibre microbuckling during compressive 374
loading causing a reduction in compressive strength [37]. Therefore, the majority of the material properties 375
were obtained via the rule of mixtures applied to results from quasi-static uniaxial tension and compression 376
tests on the composite material. 377
Let wefttowV and warp
towV denote the volume fractions of warp tows and weft tows within the cross-section of a 378
composite sample, respectively. They can be calculated as; 379

15
,,y
wefttowweftweft
towx
warptowwarpwarp
tow A
AnV
A
AnV (22) 380
where warptowA and weft
towA denote the average transverse cross sectional areas for warp and weft tows, respectively. 381
and are the quantities of warp tows and weft tows within the composite cross-section and and 382
are the areas of cross sections of the composite along the x (warp) and y (weft) axis, respectively. Based 383
on the rule of mixtures we have; 384
warptow
mwarp
towTx
V
EVEE
)1(1
,
warptow
mwarp
towxy
V
vVvv
)1(12
(23) 385
Tx
Tx
warptow
mwarp
towTxT
E
X
V
EVEX
)1(,
Cx
Cx
warptow
mwarp
towCxC
E
X
V
EVEX
)1( (24) 386
For warp tows, and 387
wefttow
mweft
towTy
V
EVEE
)1(1
,
wefttow
mweft
towxy
V
vVvv
)1(12
(25) 388
Ty
Ty
wefttow
mweft
towTyT
E
X
V
EVEX
)1(,
Cy
Cy
wefttow
mweft
towTyC
E
X
V
EVEX
)1( (26) 389
for weft tows. Cx
Tx
Cx
Tx XXEE ,,, and C
yTy
Cy
Ty XXEE ,,, are the measured material tensile Young’s 390
modulus, compressive Young’s modulus, tensile strength and compressive strength along the x-direction 391
(warp) and y-direction (weft), respectively, is the measured in-plane Poisson’s ratio. 0/90o uni-axial 392
tension/compression tests, described in Section 2, were used to obtain these values. LetxyG represent the in-393
plane shear modulus obtained by matrix dominated ±45º coupon tests. In Equations (24) and (26) it is 394
assumed that the strain to failure of the longitudinal tows is identical to that of the composite sample. 395
Regarding the in-plane shear modulus,12G , application of the rule of mixtures to mechanical test data, i.e. 396
xyG , yielded a value lower than that of pure matrix. This was deemed unrealistic. It is argued that the 397
pronounced shear nonlinearity exhibited in ±45° coupon test data, i.e. Figure 2, is probably the main reason 398
that the simple rule of mixtures provides an unrealistic tow shear modulus based on coupon test data. In order 399
warpn weftnx
A
yA
xyv

16
to calculate the tow shear modulus, the rule of mixtures was applied to manufacturer’s data of fibre and cured 400
epoxy resin. Consider a warp or weft tow with fibre volume fraction,tV , we have; 401
mtmt
mf
EVGV
GGG
112
12 (27) 402
The A-38 carbon fibres of diameter 7 ȝm were assumed to be isotropic. In-plane shear modulus GPa9612 fG403
was calculated from an assumed fibre Poisson’s ratio 25.0f . The in-plane warp and weft tows each 404
contained 6000 fibres, and the TTT reinforcement contained 3000 fibres. Microscopic cross sectional images, 405
such as those presented in Figure 1(a), were used to measure the volume fractions of the warp, weft and TTT 406
reinforcement. They were measured as 0.785, 0.692 and 0.795, respectively. In the current research, as the 407
beam deflection during soft impact is normally greater than the thickness of the beam the deformation 408
mechanism within the composite material is stretch-dominated rather than bending dominated. A parameter 409
study has demonstrated that the shear modulus is not a critical parameter influencing the dynamic response of 410
the composite beam under soft impact. 411
The transverse strength of tows,Y , is matrix dominated. It was determined from quasi-static uni-axial tensile 412
material coupon tests with the fibres orientated at ±45º from the loading axis. The longitudinal tensile and 413
compressive tow fracture energies, tJ1 and cJ1 were calculated using the following equations; 414
2.15.0
1
2
1 E
XlJ
Tet (28) 415
and 416
2.15.01
2
1 E
XlJ
Cec (29) 417
where el is the typical length of line across an element for a first order element, introduced in order to help 418
alleviate mesh dependency. The multiplication factor of 1.2 is incorporated in order to include the fracture 419
energy contribution from post-damage behaviour of the composites materials. It was obtained through 420
calibration against experimental measurement using detailed FE simulation on quasi-static uniaxial 421
tension/compression coupon tests [38]. The fibre volume fraction of the though-the-thickness reinforcement 422
was calculated as 0.795, and is almost identical to that of warp tows. Therefore, warp tow properties were 423
17
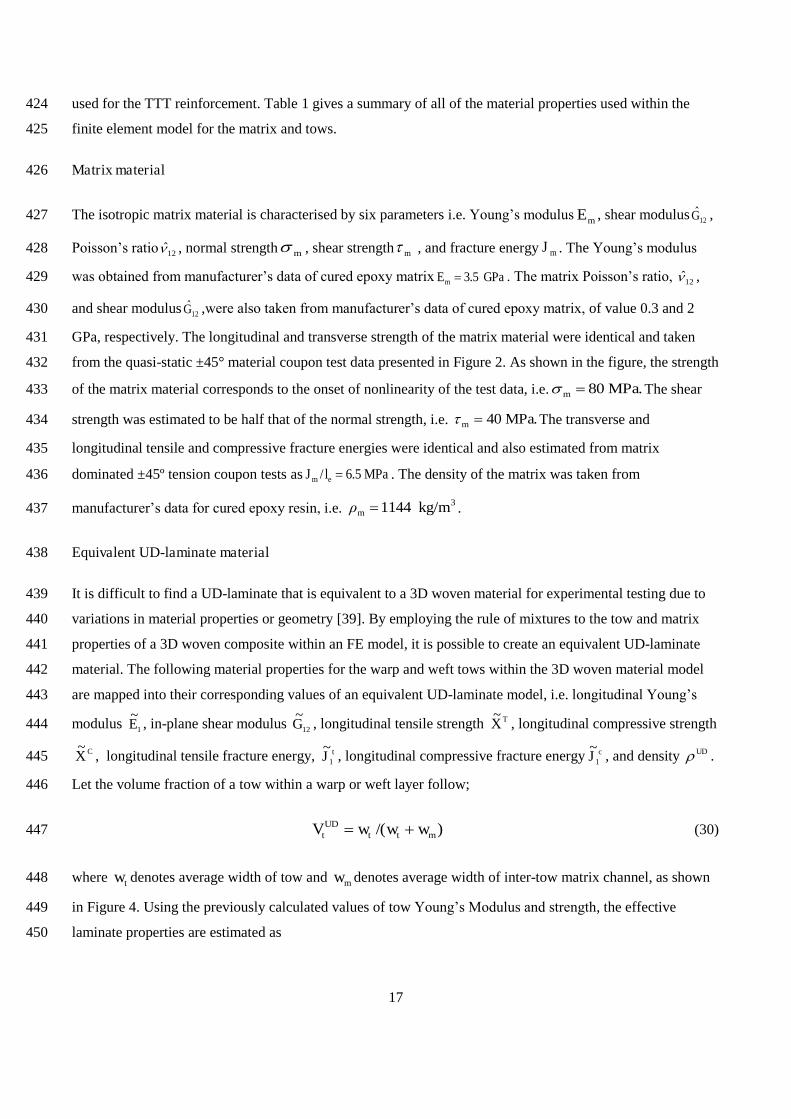
used for the TTT reinforcement. Table 1 gives a summary of all of the material properties used within the 424
finite element model for the matrix and tows. 425
Matrix material 426
The isotropic matrix material is characterised by six parameters i.e. Young’s modulus mE , shear modulus12G , 427
Poisson’s ratio 12 , normal strength m , shear strengthm , and fracture energymJ . The Young’s modulus 428
was obtained from manufacturer’s data of cured epoxy matrix GPa5.3mE . The matrix Poisson’s ratio, 12 , 429
and shear modulus12G ,were also taken from manufacturer’s data of cured epoxy matrix, of value 0.3 and 2 430
GPa, respectively. The longitudinal and transverse strength of the matrix material were identical and taken 431
from the quasi-static ±45° material coupon test data presented in Figure 2. As shown in the figure, the strength 432
of the matrix material corresponds to the onset of nonlinearity of the test data, i.e. MPa.80m The shear 433
strength was estimated to be half that of the normal strength, i.e. MPa.40m The transverse and 434
longitudinal tensile and compressive fracture energies were identical and also estimated from matrix 435
dominated ±45º tension coupon tests as MPa5.6/ em lJ . The density of the matrix was taken from 436
manufacturer’s data for cured epoxy resin, i.e. 3kg/m 1144mȡ . 437
Equivalent UD-laminate material 438
It is difficult to find a UD-laminate that is equivalent to a 3D woven material for experimental testing due to 439
variations in material properties or geometry [39]. By employing the rule of mixtures to the tow and matrix 440
properties of a 3D woven composite within an FE model, it is possible to create an equivalent UD-laminate 441
material. The following material properties for the warp and weft tows within the 3D woven material model 442
are mapped into their corresponding values of an equivalent UD-laminate model, i.e. longitudinal Young’s 443
modulus 1
~E , in-plane shear modulus 12
~G , longitudinal tensile strength TX
~, longitudinal compressive strength 444
CX~
, longitudinal tensile fracture energy, tJ1
~, longitudinal compressive fracture energycJ1
~, and density UD . 445
Let the volume fraction of a tow within a warp or weft layer follow; 446
)/( mttUD
t wwwV (30) 447
where tw denotes average width of tow and mw denotes average width of inter-tow matrix channel, as shown 448
in Figure 4. Using the previously calculated values of tow Young’s Modulus and strength, the effective 449
laminate properties are estimated as 450

18
mUD
tUD
t EVEVE )1(~
11 (31) 451
12
1212 1
~
GVGV
GGG
UDtm
UDt
m
(32) 452
mUD
tTUD
tT XVXVX 1
~ (33) 453
mUD
tCUD
tC XVXVX 1
~ (34) 454
2.1~)
~(
5.0~
1
2
1 E
XlJ
Tet (35) 455
2.1~)
~(
5.0~
1
2
1 E
XlJ
Cec (36) 456
mUD
ttowUD
tUD VV )1( (37) 457
with mE as the Young’s modulus of cured epoxy resin. The modified material properties employed for the 458
equivalent UD-laminate are presented in Table 1. A sketch of the top surface of the Equivalent UD-laminate 459
material is presented in Figure 4(c). 460
5 Results and discussion 461
5.1 Transient deflection of beams 462
Soft impact experiments and FE modelling were conducted on the Full and Half TTT 3D woven composite 463
panels orientated along the x-direction (warp) and y-direction (weft). Due to the lower fibre volume fraction in 464
the warp direction, in comparison to the weft, the warp direction is shown to be unfavourable for resisting the 465
loading. Figure 5 presents the measured and FE predicted normalised back-face deflections of Full TTT 466
composite beams orientated along the y-direction (weft) as a function of normalised time after moment of 467
impact t for impulsive loading of (a) s kPa48.20 I , (b) s kPa64.20 I , (c) s kPa33.30 I , and (d)468
s kPa03.40 I . Also presented are FE predictions of the response of Full TTT material, No TTT material 469
and Equivalent UD-laminate material. In order to characterise the response of the composite beams during 470
impact, the time parameter normalised against the crush time of the projectile is used, i.e. plvtt /ˆ0 with t as 471
time after contact between projectile and beam, v0 as projectile velocity, and lp as length of projectile. In order 472

19
to remain dimensionless, a normalised deflection term 0/ˆ l is also used with as the back-face 473
deflection of the beam at centre-span and mm1700 l as the free length of the beam sample. The peak back-474
face deflection experienced by the beam during the impact event occurs at a normalised time of approximately 475
between 5.1ˆ0.1 t , with 1ˆ t corresponding to the time at which projectile densification has completed. 476
This indicates that the transient deformation of the beam is governed primarily by the crush time of the 477
projectile. 478
FE predictions over the entire range of experimentally tested impulses show excellent fidelity in regards to the 479
peak back-face deflection exhibited by the beam during the test. The FE model also predicts the time at which 480
the peak deflection occurs during the test. The restitution of the beam occurs later than the prediction, due to 481
oscillations within the clamp during the experiment increasing the time taken for reflection of the bending 482
wave. However, the peak deflection of the beams occurred before the oscillations within the clamp, and 483
therefore had no influence from them. Figure 6(a) and (b) present the experimentally recorded and predicted 484
montages of the deformation of a Full TTT 3D woven beam orientated along the y-direction (weft) 485
undergoing an impact event of impulse s kPa64.20 I , respectively. The corresponding locations A-E 486
match with the positions highlighted in Figure 5(b). The FE prediction is shown to model accurately the 487
deformed configuration of the beam, and the crushing of the metal foam material. 488
The FE predicted back-face deflection against time response during a soft impact event for beams orientated 489
along the y-direction (weft) of the 3D woven composite material is compared to an equivalent UD-laminate 490
material in Figure 5. The Equivalent UD-laminate material exhibits the same predicted back-face deflection 491
during the soft impact event as the Full TTT material and the No TTT-reinforcement material. This result may 492
indicate that neither the TTT reinforcement nor the beam in-plane fibre architecture have significant influence 493
on the back-face deflection of composite beams undergoing soft-impact within the range of impulses tested in 494
this study. The small-scale local increases in the back-face deflection demonstrated by the UD-laminate, 495
shown in Figure 5, is attributed to delamination damage allowing relative displacement of the bottom layer 496
due to inertia. The Equivalent UD-laminate material was also predicted to exhibit a similar amount of 497
delamination damage as the No TTT reinforcement material. 498
Effect of TTT reinforcement density on back-face deflection 499
The Full TTT and Half TTT materials have a small variation in material areal density; 5.30 kg m-2 and 5.21 kg 500
m-2, respectively. Therefore, to make a comparison of the response of the samples during a soft impact event, 501
the non-dimensional group suggested by Xue and Hutchinson [40] is used, which is defined as; 502
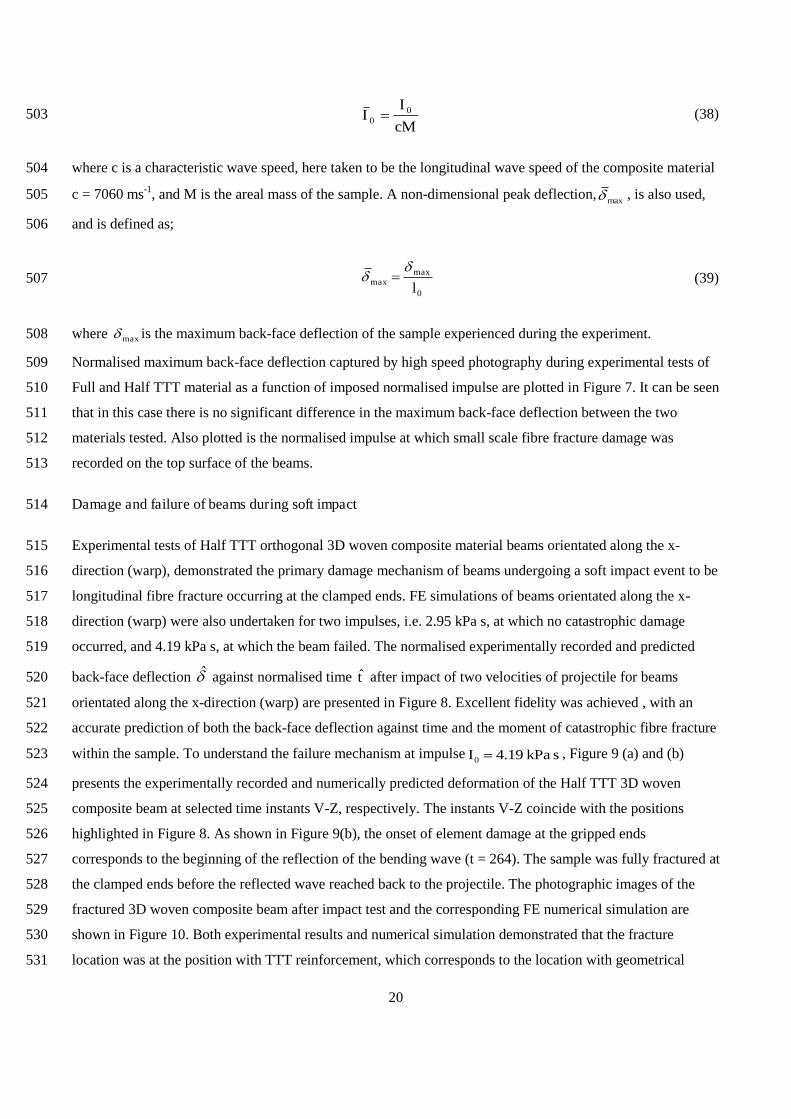
20
cM
II 0
0 (38) 503
where c is a characteristic wave speed, here taken to be the longitudinal wave speed of the composite material 504
c = 7060 ms-1, and M is the areal mass of the sample. A non-dimensional peak deflection,max , is also used, 505
and is defined as; 506
0
maxmax l
(39) 507
where max is the maximum back-face deflection of the sample experienced during the experiment. 508
Normalised maximum back-face deflection captured by high speed photography during experimental tests of 509
Full and Half TTT material as a function of imposed normalised impulse are plotted in Figure 7. It can be seen 510
that in this case there is no significant difference in the maximum back-face deflection between the two 511
materials tested. Also plotted is the normalised impulse at which small scale fibre fracture damage was 512
recorded on the top surface of the beams. 513
Damage and failure of beams during soft impact 514
Experimental tests of Half TTT orthogonal 3D woven composite material beams orientated along the x-515
direction (warp), demonstrated the primary damage mechanism of beams undergoing a soft impact event to be 516
longitudinal fibre fracture occurring at the clamped ends. FE simulations of beams orientated along the x-517
direction (warp) were also undertaken for two impulses, i.e. 2.95 kPa s, at which no catastrophic damage 518
occurred, and 4.19 kPa s, at which the beam failed. The normalised experimentally recorded and predicted 519
back-face deflection against normalised time t after impact of two velocities of projectile for beams 520
orientated along the x-direction (warp) are presented in Figure 8. Excellent fidelity was achieved , with an 521
accurate prediction of both the back-face deflection against time and the moment of catastrophic fibre fracture 522
within the sample. To understand the failure mechanism at impulse s kPa19.40 I , Figure 9 (a) and (b) 523
presents the experimentally recorded and numerically predicted deformation of the Half TTT 3D woven 524
composite beam at selected time instants V-Z, respectively. The instants V-Z coincide with the positions 525
highlighted in Figure 8. As shown in Figure 9(b), the onset of element damage at the gripped ends 526
corresponds to the beginning of the reflection of the bending wave (t = 264). The sample was fully fractured at 527
the clamped ends before the reflected wave reached back to the projectile. The photographic images of the 528
fractured 3D woven composite beam after impact test and the corresponding FE numerical simulation are 529
shown in Figure 10. Both experimental results and numerical simulation demonstrated that the fracture 530
location was at the position with TTT reinforcement, which corresponds to the location with geometrical 531

21
variation in the sample. Clearly, it is the location with stress concentration. Examination of both the 532
experimental and predicted fracture surfaces reveals no visible delamination. 533
In order to compare the failure modes between the 3D woven carbon composite beam and a similar UD carbo 534
laminate beam, Figure 9(c) shows the montage of a similar UD-laminate beam under metal foam soft impact 535
with impulse s kPa90.20 I , reported by Kandan et al. [10]. The UD laminate [(0º/90º)7 0º] had density 536
5.21 kgm-3, in-plane tensile Young’s modulus GPa85lE , tensile strength MPa980tl , and 537
compressive strength MPa630cl , which are similar to those of the 3D woven composite material 538
presented in this study. The UD-laminate beams had a thickness t = 3.75 mm, width w = 35 mm, and gauge 539
length l0 = 200 mm, slightly different from the geometry of the 3D woven carbon composite beam. The UD 540
laminate material exhibited both delamination across the entire length of the beam, and catastrophic 541
longitudinal fibre fracture. An available experimental investigation [9] has also demonstrated that UD-542
laminate composites can experience delamination at impulses lower than catastrophic beam failure. Next, we 543
will demonstrate that at impulses lower than those which caused catastrophic fibre fracture, the 3D woven 544
material exhibited no significant delamination, and only minor surface fibre fracture. 545
Beams orientated along the y-direction (weft) had a higher volume fraction that those orientated along the x-546
direction (warp). Even the highest impulses tested within this study were not high enough to cause fibre 547
fracture of beams orientated along the y-direction (weft). After soft impact of impulse greater than 548
skPa30 I , damage was observed on the front surface of the sample. Microscopic images showing the 549
surface damage of a Half TTT beam orientated along the y-direction (weft) undergoing an impact event of 550
impulse skPa33.30 I are presented in Figure 11(c). The damage consisted of small-scale fibre fractures 551
within the longitudinal surface tows, and was almost entirely restricted to underneath the projectile impact 552
location 553
To investigate the difference in damage mechanisms between the Full and Half TTT materials, numerical 554
predictions of Full and Half TTT material beams orientated along the y-direction (weft) impacted at an 555
impulse of skPa33.30 I were conducted. Both beams resisted delamination equally well, and there was no 556
significant difference in the tensile damage of fibres. However, there were differences in the extent of the 557
compressive damage of the surface weft tows. Figure 11(a) and (b) present the predicted compressive fibre 558
damage initiation on the top surface of beams 800 ȝs after projectile impact of impulse skPa33.30 I . A 559
value of 1 indicates the onset of damage. The localised in-plane compressive fibre damage at the centre of the 560
beam corresponds well to the surface damage observed experimentally, and shown in Figure 11(c). This 561
damage is more pronounced in the Full TTT material in comparison with the Half TTT material. It is 562

22
suggested that the more highly constrained in-plane fibres in the Full TTT material relative to the Half TTT 563
material cause the material to undergo greater damage during impact testing. The damage was observed to be 564
concentrated at the top surface of the beam, and reduced significantly towards the centre of the beam. Next, 565
we will investigate the influence of internal damage on the bending behaviour of the beam via post-impact 566
clamped-clamped beam bending experiments. 567

23
5.2 Post impact quasi-static bending response 568
Beams orientated along the y-direction (weft) exhibited only minor visible damage during the soft impact 569
event, even up to the highest impulse of impact event. However, there still could be internal damage that could 570
reduce the structural capacity of the beam. In order to investigate this, post impact, samples of both TTT 571
reinforcement densities were tested in a quasi-static clamped-clamped beam bending test. Figure 12 presents a 572
sketch of the experimental setup for the quasi-static beam bending test. Results of the experiment are 573
compared to that of an un-impacted virgin sample. The beams were aligned along the y-direction (weft), as 574
co-ordinate system defined in Figure 1. The beams were fixed at both ends in a custom-designed clamp of 575
stainless steel, with the clamp subsequently fixed onto an I-beam. The spans of the beams between the 576
clamped ends was Lb = 180 mm. This free span length was purposefully chosen to be longer than the original 577
impact test beam length in order to capture damage sustained within the clamp position during soft impact 578
testing. The beams were centrally loaded by a roller across their entire width, w. Width of clamped beam 579
tested in this investigation was w = 40 mm, identical to the width of impact samples. A screw-driven Instron© 580
5581 test machine with a static 50 kN load cell provided a constant quasi-static displacement of the roller 581
along the vertical axis (z-direction) of 5 mm/min. Roller displacement along the vertical axis, įb , and load 582
imposed by the roller , P, were measured directly from the load cell of the test rig. The stiffness was 583
calculated from between a vertical roller displacement of 2.5 mm and 7.5 mm, in order to avoid any 584
contributions from initial movement within the clamp. Figure 13 shows the load imposed by the roller, P, 585
against vertical roller displacement įb for the clamped beam test for the Full TTT material. Beams were shown 586
to retain structural integrity even after undergoing relatively high-impulse impacts )skPa0.3( 0 I . Beam 587
response was linear elastic up until a displacement mm12b , when brittle fracture of in-plane 588
reinforcement tows occurred. Beam failure was attributed to fibre fracture at the centre of the samples, 589
directly under the roller position. This position is also the projectile impact location, and location of small-590
scale fibre damage, presented in the previous section. The location of fibre fracture was the same for impacted 591
and un-impacted beams, indicating that the surface damage at this location was not the root cause for failure at 592
this position. 593
The peak load recorded during clamped beam test as a function of impact velocity is presented in Figure 594
14(a). It can be seen that there is no significant reduction in strength of beam for either the Full TTT or Half 595
TTT material even after the highest velocity of impact. The variation shown here is typical as to what is 596
expected due to stochastic flaws within the material. 597
Figure 14(b) presents the stiffness of post-impact clamped-clamped beam experiment as a function of impact 598
velocity. There is a slight reduction in stiffness during post-impact testing, with stiffness reducing linearly 599

24
with increasing impact velocity. The reduction in stiffness is seen to be greater with the Full TTT binder 600
material relative to the Half TTT binder material. It is suggested that this is due to more highly constrained in-601
plane fibres in the Full TTT material cause the material to have more damage during impact testing. FE 602
simulations presented in Section 5.3 confirm that higher TTT reinforcement density can lead to increased 603
damage in the material. 604
5.3 The role of the TTT reinforcement 605
As demonstrated in Figure 5, the presence of the binder has no contribution to the back-face deflection of the 606
beams. However, we will now show that there is a remarkable difference in the delamination damage 607
sustained within the composite material. To investigate this, numerical simulations of Full and No TTT 608
material beams orientated along the y-direction (weft) under soft impact were conducted. Figure 15(a) and (b 609
show the predicted cohesive interaction damage contours within the beam at time t = 700 ȝs after the moment 610
of impact for the beams with and without the TTT reinforcement, respectively. The contours shown in Figure 611
15 represent the value of the cohesive interaction damage variable, , which at a value of 1 represents fully 612
damaged interaction between layers. is defined in the Appendix to this paper. Without the presence of the 613
TTT reinforcement, the delamination damage propagates along the entire length of the beam. Without the 614
presence of the TTT reinforcement, the delamination damage propagates along the entire length of the beam. 615
However, with the presence of the TTT reinforcement, the damage is notably reduced, being almost entirely 616
restricted in location to directly under the projectile. 617
In order to further investigate the role of the through-the-thickness, simulations of soft impact events were 618
undertaken with the cohesive interaction between layers removed, as shown in Figure 16. This removal of the 619
cohesive interaction effectively simulates a fully pre-delaminated case. Inter-penetration between layers was 620
now prevented via a penalty contact algorithm. Through this method, it is possible to simulate the material 621
under severe conditions. It can be seen from Figure 16(a) that even with the cohesive interaction removed, the 622
TTT reinforcement provides structural integrity to the beam, retaining its cross section throughout the test. 623
This is juxtaposed by the predictions with both the TTT-reinforcement and cohesive interaction removed, 624
shown in Figure 16(c), where extensive delamination is shown throughout the entire length of the beam. A 625
transferal of momentum through the beam causes a large relative displacement of the top and bottom layers of 626
the composite. Also presented are simulations for the case of Half TTT material (Figure 16(b)) and the 627
equivalent UD-laminate material (Figure 16(d)). The Half TTT material exhibits a response identical to that of 628
the Full TTT material, indicating that, in regards to the material in this study, halving the TTT reinforcement 629
density provides no reduction in structural integrity. The Equivalent UD-laminate material behaves identically 630
to that of the No TTT material; indicating again that in-plane reinforcement topology provides negligible 631
influence on beam structural integrity during impulsive loading. The results presented in Figure 16 gives 632

25
indications of the superior performance of the 3D woven beams undergoing multi-hit soft impact. For 633
example, a UD-laminate beam which had previously been delaminated by a soft impact event would perform 634
far less favourably in comparison with a 3D woven composite. 635
6 Concluding remarks 636
An experimental investigation was undertaken in conjunction with numerical modelling in order to investigate 637
the dynamic soft impact response of two orthogonal 3D woven composite materials varying only by density of 638
through-the-thickness (TTT) reinforcement. The transient-deflection responses of the composite beams were 639
shown to be primarily governed by the projectile crush time. 3D woven composites demonstrated remarkably 640
reduced delamination damage during soft impact events in comparison with a similar UD-laminate material. 641
The failure mechanism of 3D woven composite beams was longitudinal fibre fracture at the clamped ends. At 642
impulses lower than those which caused catastrophic fibre fracture, only minor, localised fibre fracture on the 643
surface of beams was recorded. The two different densities of through-thickness reinforcement experimentally 644
tested within the study had no difference in the back-face deflection experienced during soft impact. This was 645
confirmed with the use of a finite element modelling strategy which explicitly models the geometry of the 646
through-the-thickness reinforcement. FE modelling also showed that an equivalent UD laminate material will 647
have the same maximum back-face deflection as a 3D woven material during a soft impact event, indicating 648
that the in-plane architecture has no influence on the transient deflection of beams. However, modelling of an 649
equivalent UD-laminate material did reveal greatly increased delamination damage sustained than that of the 650
3D woven material. 651
The 3D woven composite beams were shown to retain structural integrity even during high impulse soft 652
impact tests, with no delamination up to final fibre fracture. In order to investigate potential internal damage 653
within the beam clamped beam bending tests were conducted post-impact. These tests reveal negligible 654
variations in strength and only minor reductions in beam stiffness after soft impact for 3D woven material. 655
This indicates the potential for 3D woven composites to perform well during resistance of multiple soft 656
impacts. The stiffness reduction post-impact was seen to be greater with the composite containing a higher 657
density of though-thickness reinforcement. Finite element simulations of soft impact on 3D woven composites 658
of two different reinforcement densities indicated varying compressive fibre damage on the front surface of 659
the beams; demonstrating the potential for increased damage with higher densities of TTT-reinforcement. 660
Finite element predictions of pre-delaminated beams undergoing soft impact demonstrated significant 661
structural enhancement provided by the TTT-reinforcement. 662
The deterrence of delamination due to the presence of through-the-thickness reinforcement in reality has been 663
attributed to limited frictional forces between through-the-thickness reinforcement and in-plane fibre 664

26
architecture, which may not be able to prevent delamination, especially mode I dominant delamination 665
effectively [39]. The representation of this effect via the element tie methodology is a simplification utilised in 666
order to reduce the numerical difficulties which would arise from the explicit modelling of interactions 667
between the through-the-thickness reinforcement and the in-plane fibre architecture. Further studies will be 668
conducted in order to precisely classify the efficacy of the element tie methodology in regards to modelling 669
the suppression of delamination. 670
The contribution provided by this research is the detailed investigation into the response of an orthogonal 3D 671
woven carbon reinforced epoxy composite material undergoing high speed soft impact loading, and the 672
demonstration of the efficacy of a full-scale finite element modelling strategy utilising an established 673
continuum damage mechanics framework for the simulation of the deflection and damage modes exhibited 674
during soft impact. 675
Acknowledgements 676
3D woven fabrics were provided by Sigmatex UK. The authors acknowledge support from the Engineering 677
and Physical Sciences Research Council, UK (EPSRC EP/P505658/1 and EP/K503101/1) and Early Career 678
Research and Knowledge Transfer Awards from the University of Nottingham. They also acknowledge the 679
use of the High Performance Computing facility at the University of Nottingham for finite element 680
calculations. The authors are grateful for the constructive comments from the reviewer and associate editor. 681
Appendix A. Cohesive interaction constitutive law 682
Cohesive law for interface between layers 683
As shown in Figure 4, there are 17 layers in the composite material. These layers are joined to neighbouring 684
layers via a cohesive contact law. This law is used to model the traction-separation behaviour within the 685
interface between layers, and allows the FE model to simulate inter-laminar delamination. It was at these 686
locations that delamination damage was observed for a UD laminate composite material undergoing soft 687
impact [10]. The undamaged elastic behaviour across the interface is governed by the following traction-688
separation law; 689
t
s
n
t
s
n
t
s
n
k
k
k
t
t
t
00
00
00
(40) 690
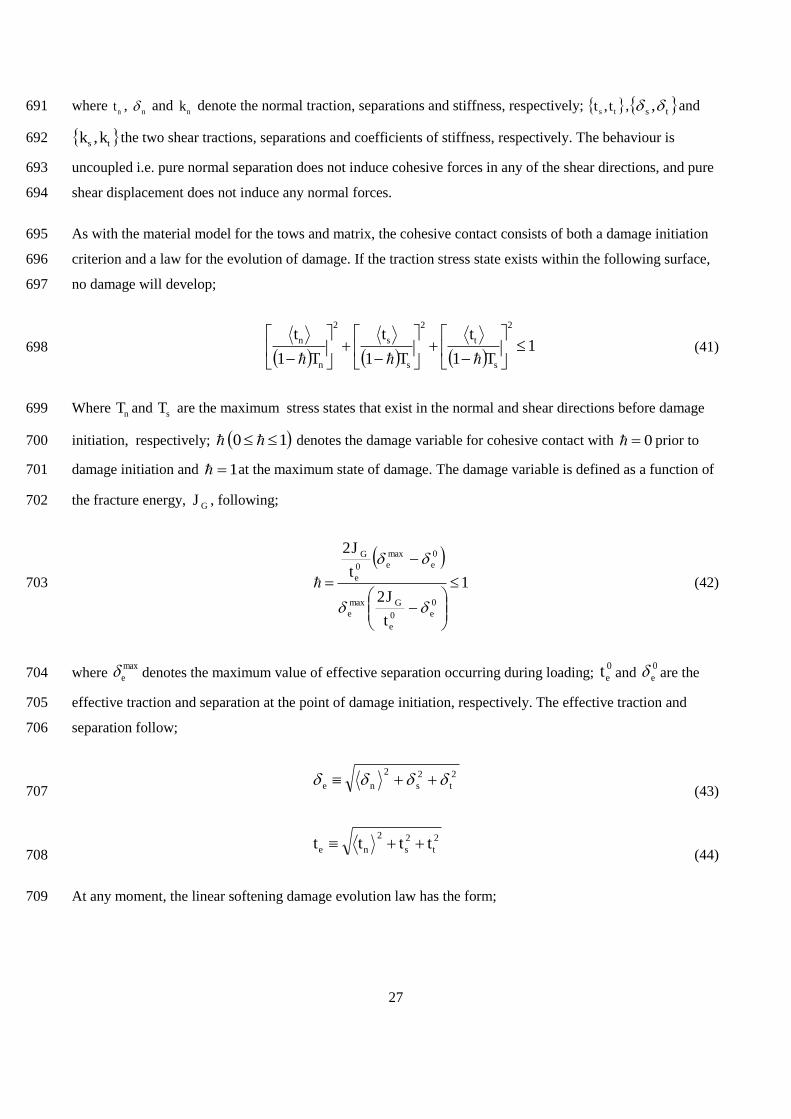
27
where nt , n and nk denote the normal traction, separations and stiffness, respectively; ts tt , , ts , and 691
ts kk , the two shear tractions, separations and coefficients of stiffness, respectively. The behaviour is 692
uncoupled i.e. pure normal separation does not induce cohesive forces in any of the shear directions, and pure 693
shear displacement does not induce any normal forces. 694
As with the material model for the tows and matrix, the cohesive contact consists of both a damage initiation 695
criterion and a law for the evolution of damage. If the traction stress state exists within the following surface, 696
no damage will develop; 697
1111
222
s
t
s
s
n
n
T
t
T
t
T
t
(41) 698
Where nT and sT are the maximum stress states that exist in the normal and shear directions before damage 699
initiation, respectively; 10 denotes the damage variable for cohesive contact with 0 prior to 700
damage initiation and 1 at the maximum state of damage. The damage variable is defined as a function of 701
the fracture energy, GJ , following; 702
1
2
2
0
0
max
0max
0
e
e
Ge
ee
e
G
t
J
t
J
(42) 703
where maxe denotes the maximum value of effective separation occurring during loading;
0et and
0e are the 704
effective traction and separation at the point of damage initiation, respectively. The effective traction and 705
separation follow; 706
222
tsne (43) 707
222
tsne tttt (44) 708
At any moment, the linear softening damage evolution law has the form; 709

28
otherwise
0when 1
nn
nnnn k
kt
(45) 710
sss kt 1 (46) 711
ttt kt 1 (47) 712
When the cohesive contact is undergoing compression, i.e. when 0n , the interaction between layers 713
governed only by a penalty contact algorithm. The “general contact” algorithm within ABAQUS was utilised, 714
with a tangential friction coefficient of 0.3. 715
An initial interface thickness of 0.1 mm was assumed. The normal and shear stiffness, nk and sk , 716
respectively, were estimated from manufacturer’s data regarding the epoxy matrix material. The maximum 717
normal traction, nt , was estimated from the yield stress obtained from tensile composite material tests with 718
fibres aligned at ±45° to the loading axis, i.e. 80 MPa from Figure 2(a). The maximum shear traction, st , was 719
estimated as half of the maximum normal traction. The fracture energy for the cohesive interaction was 720
estimated from the area under the stress-strain curve for the ±45° composite tensile test, i.e. JG = 650 J m-2. 721
This value is similar to that used within other published work, for example Shi et al. [41]. The parameters 722
used for the cohesive interaction are presented in Table 2. 723
References 724
[1] LeBlanc, J., Shukla, A., Rousseau, C., and Bogdanovich, A., 2007, "Shock loading of three-725 dimensional woven composite materials," Composite Structures, 79(3), pp. 344-355. 726
[2] Tekalur, S. A., Bogdanovich, A. E., and Shukla, A., 2009, "Shock loading response of sandwich 727 panels with 3-D woven E-glass composite skins and stitched foam core," Composites Science and 728 Technology, 69(6), pp. 736-753. 729
[3] Radford, D., Deshpande, V., and Fleck, N., 2005, "The use of metal foam projectiles to simulate 730 shock loading on a structure," International Journal of Impact Engineering, 31(9), pp. 1152-1171. 731
[4] Smith, P. D., and Hetherington, J. G., 1994, Blast and ballistic loading of structures, Digital 732 Press. 733
[5] Liu, T., Fleck, N., Wadley, H., and Deshpande, V., 2013, "The impact of sand slugs against 734 beams and plates: Coupled discrete particle/finite element simulations," Journal of the Mechanics 735 and Physics of Solids, 61(8), pp. 1798-1821. 736

29
[6] Radford, D., Fleck, N., and Deshpande, V., 2006, "The response of clamped sandwich beams 737 subjected to shock loading," International Journal of Impact Engineering, 32(6), pp. 968-987. 738
[7] Radford, D., McShane, G., Deshpande, V., and Fleck, N., 2006, "The response of clamped 739 sandwich plates with metallic foam cores to simulated blast loading," International Journal of solids 740 and structures, 43(7), pp. 2243-2259. 741
[8] McShane, G., Radford, D., Deshpande, V., and Fleck, N., 2006, "The response of clamped 742 sandwich plates with lattice cores subjected to shock loading," European Journal of Mechanics-743 A/Solids, 25(2), pp. 215-229. 744
[9] Russell, B., Liu, T., Fleck, N., and Deshpande, V., 2012, "The soft impact of composite sandwich 745 beams with a square-honeycomb core," International Journal of Impact Engineering, 48, pp. 65-81. 746
[10] Kandan, K., Russell, B. P., Fleck, N. A., O’Masta, M., Wadley, H. N. G., and Deshpande, V. S., 747 2013, "The soft impact response of composite laminate beams," International Journal of Impact 748 Engineering, 60(0), pp. 24-36. 749
[11] Shyr, T.-W., and Pan, Y.-H., 2003, "Impact resistance and damage characteristics of composite 750 laminates," Composite Structures, 62(2), pp. 193-203. 751
[12] Cantwell, W., and Morton, J., 1991, "The impact resistance of composite materials—a review," 752 composites, 22(5), pp. 347-362. 753
[13] Wisnom, M., 2012, "The role of delamination in failure of fibre-reinforced composites," 754 Philosophical Transactions of the Royal Society of London A: Mathematical, Physical and 755 Engineering Sciences, 370(1965), pp. 1850-1870. 756
[14] Tong, L., Mouritz, A. P., and Bannister, M., 2002, 3D fibre reinforced polymer composites, 757 Elsevier. 758
[15] Mouritz, A., 2001, "Ballistic impact and explosive blast resistance of stitched composites," 759 Composites Part B: Engineering, 32(5), pp. 431-439. 760
[16] Mouritz, A., 2007, "Review of z-pinned composite laminates," Composites Part A: applied 761 science and manufacturing, 38(12), pp. 2383-2397. 762
[17] Kalwak, G., and Jevons, M., 2012, "Experimental assessment and design of through thickness 763 reinforcement in thick composite laminates subjected to bird strike loading," Proceedings of ECCM 764 15 Conference, 2012. 765
[18] Kalwak, G., Read, S., Jevons, M., and Petrinic, N., 2014, "Investigation of the delamination 766 characteristics of composite specimens with through thickness reinforcement using an inertia 767 constrained soft body beam bend test specimens," ECC16 conference proceedings. 768
[19] Mohamed, G., Kalwak, G., Hallett, S. R., and Jevons, M., 2014, "Modelling soft body impact of 769 through-thickness reinforcement composites," ECCM16. 770
30
[20] Steeves, C. A., and Fleck, N. A., 2006, "In-plane properties of composite laminates with 771 through-thickness pin reinforcement," International Journal of solids and structures, 43(10), pp. 772 3197-3212. 773
[21] Bogdanovich, A., and Mohamed, M., 2009, "Three-dimensional reinforcements for 774 composites," SAMPE journal, 45(6), pp. 8-28. 775
[22] Barrett, D. J., 1996, "The mechanics of z-fiber reinforcement," Composite Structures, 36(1), pp. 776 23-32. 777
[23] Grassi, M., and Zhang, X., 2003, "Finite element analyses of mode I interlaminar delamination 778 in z-fibre reinforced composite laminates," Composites Science and Technology, 63(12), pp. 1815-779 1832. 780
[24] Bahei-El-Din, Y. A., and Zikry, M. A., 2003, "Impact-induced deformation fields in 2D and 3D 781 woven composites," Composites Science and Technology, 63(7), pp. 923-942. 782
[25] Grogan, J., Tekalur, S. A., Shukla, A., Bogdanovich, A., and Coffelt, R. A., 2007, "Ballistic 783 resistance of 2D and 3D woven sandwich composites," Journal of Sandwich Structures and 784 Materials, 9(3), pp. 283-302. 785
[26] Yu, Y., Wang, X., and Lim, C., 2009, "Ballistic impact of 3D orthogonal woven composite by a 786 spherical bullet: experimental study and numerical simulation," International Journal of Engineering 787 and Applied Sciences, 1, pp. 11-18. 788
[27] Li, Z., Sun, B., and Gu, B., 2010, "FEM simulation of 3D angle-interlock woven composite 789 under ballistic impact from unit cell approach," Computational Materials Science, 49(1), pp. 171-790 183. 791
[28] Ghosh, R., and De, S., 2014, "Z-fiber influence on high speed penetration of 3D orthogonal 792 woven fiber composites," Mechanics of materials, 68, pp. 147-163. 793
[29] Jia, X., Sun, B., and Gu, B., 2011, "A numerical simulation on ballistic penetration damage of 794 3D orthogonal woven fabric at microstructure level," International Journal of Damage Mechanics, p. 795 1056789510397078. 796
[30] Hashin, Z., 1980, "Failure criteria for unidirectional fiber composites," Journal of applied 797 mechanics, 47(2), pp. 329-334. 798
[31] Matzenmiller, A., Lubliner, J., and Taylor, R., 1995, "A constitutive model for anisotropic 799 damage in fiber-composites," Mechanics of materials, 20(2), pp. 125-152. 800
[32] Russell, B., Malcom, A., Wadley, H., and Deshpande, V., 2010, "Dynamic compressive 801 response of composite corrugated cores," Journal of mechanics of materials and structures, 5(3), pp. 802 477-493. 803
[33] Gerlach, R., Siviour, C. R., Wiegand, J., and Petrinic, N., 2012, "In-plane and through-thickness 804 properties, failure modes, damage and delamination in 3D woven carbon fibre composites subjected 805 to impact loading," Composites Science and Technology, 72(3), pp. 397-411. 806
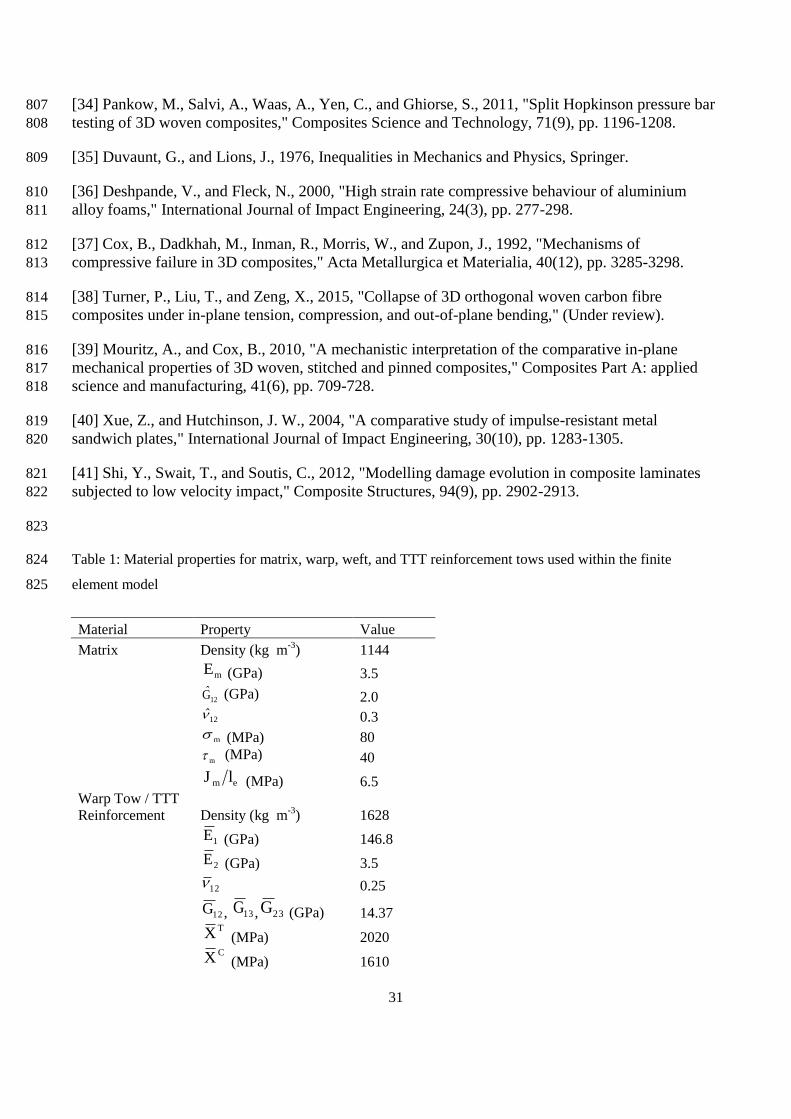
31
[34] Pankow, M., Salvi, A., Waas, A., Yen, C., and Ghiorse, S., 2011, "Split Hopkinson pressure bar 807 testing of 3D woven composites," Composites Science and Technology, 71(9), pp. 1196-1208. 808
[35] Duvaunt, G., and Lions, J., 1976, Inequalities in Mechanics and Physics, Springer. 809
[36] Deshpande, V., and Fleck, N., 2000, "High strain rate compressive behaviour of aluminium 810 alloy foams," International Journal of Impact Engineering, 24(3), pp. 277-298. 811
[37] Cox, B., Dadkhah, M., Inman, R., Morris, W., and Zupon, J., 1992, "Mechanisms of 812 compressive failure in 3D composites," Acta Metallurgica et Materialia, 40(12), pp. 3285-3298. 813
[38] Turner, P., Liu, T., and Zeng, X., 2015, "Collapse of 3D orthogonal woven carbon fibre 814 composites under in-plane tension, compression, and out-of-plane bending," (Under review). 815
[39] Mouritz, A., and Cox, B., 2010, "A mechanistic interpretation of the comparative in-plane 816 mechanical properties of 3D woven, stitched and pinned composites," Composites Part A: applied 817 science and manufacturing, 41(6), pp. 709-728. 818
[40] Xue, Z., and Hutchinson, J. W., 2004, "A comparative study of impulse-resistant metal 819 sandwich plates," International Journal of Impact Engineering, 30(10), pp. 1283-1305. 820
[41] Shi, Y., Swait, T., and Soutis, C., 2012, "Modelling damage evolution in composite laminates 821 subjected to low velocity impact," Composite Structures, 94(9), pp. 2902-2913. 822
823
Table 1: Material properties for matrix, warp, weft, and TTT reinforcement tows used within the finite 824
element model 825
Material Property Value
Matrix Density (kg m-3) 1144
mE (GPa) 3.5
12G (GPa) 2.0
12 0.3
m (MPa) 80
m (MPa) 40
(MPa) 6.5 Warp Tow / TTT Reinforcement Density (kg m-3) 1628 1E (GPa) 146.8
2E (GPa) 3.5
12 0.25
12G , 13G , 23G (GPa) 14.37
TX (MPa) 2020
CX (MPa) 1610
em lJ

32
Y (MPa) 80
sX , sY (MPa) 40
e
t lJ1 (MPa) 16.68
e
c lJ1 (MPa) 10.60
em lJ (MPa) 6.5
Weft Tow Density (kg m-3) 1570
1E (GPa) 135.7
2E (GPa) 3.5
12 0.25
12G , 13G , 23G (GPa) 7.16
TX (MPa) 1720
CX (MPa) 1110
Y (MPa) 80
sX , sY (MPa) 40
e
t lJ1 (MPa) 13.08
e
c lJ1 (MPa) 5.45
em lJ (MPa) 6.5 Equivalent UD-laminate Warp Density (kg m-3) 1525
(Modified values) 1
~E (GPa) 122.2
12
~G (GPa) 5.78
TX
~ (MPa) 1590
CX~
(MPa) 1280
tJ1
~ (MPa) 12.41
cJ1
~ (MPa) 8.04
Equivalent UD-laminate Weft Density (kg m-3) 1530
(Modified values) 1
~E (GPa) 126.4
12
~G (GPa) 4.93
TX
~ (MPa) 1590
CX~
(MPa) 1040
tJ1
~ (MPa) 12.00
cJ1
~ (MPa) 5.13
826

33
Table 2: Material parameters for cohesive contact used to simulate delamination between layers of 3D woven 827
composite material 828
Property Value
nk 3.5 GPa mm-1
ts kk , 2.0 GPa mm-1
nt 80 MPa ts tt , 40 MPa
GJ 650 J m-2

34
829
830
Figure 1.(a) Microscopic image of the composite cross-section along the weft direction, with crimping of the 831
weft tows due to the presence of the TTT reinforcement. (b) Sketch of 3D orthogonal woven carbon 832
composites showing Full through-the-thickness (TTT) reinforcement with the binder-to-warp-stack ratio of 833

35
1:1 on the left and Half TTT reinforcement with the binder-to-warp-stack ratio of 1:2 on the right, with the 834
dimensions as the average measurements of the cured composites. (For interpretation of the colour legend in 835
this figure, the reader is referred to the web version of this article.) 836

36
837
Figure 2. Quasi-static stress strain relationships for 3D woven carbon composite material for (a) tension and 838
(b) compression. (c) Quasi-static uniaxial compression stress-strain curve for the Alporas aluminium foam 839
projectile. 840
841

37
Figure 3 Sketch of experimental set up of dynamic soft impact tests on orthogonal 3D woven composite 842
panels. 843
844
Figure 4. Finite element model for the simulation of orthogonal 3D woven carbon composite beam samples 845
undergoing soft impact, with beam orientated along the x-direction (warp). Arrows indicate direction of fibre 846
orientation. Sketches of top layers for (a) Full TTT (b) No TTT and (c) Equivalent UD-Laminate models are 847
also shown. (For interpretation of the colour legend in this figure, the reader is referred to the web version of 848
this article.) 849

38
850
Figure 5. Comparison of experimental results for Full TTT material and FE prediction for normalised back-851
face deflection 0/ˆ l as a function of normalised time plvtt /ˆ0 . Full TTT beams orientated along the 852
y-direction (weft). Three different case studies for numerical modelling results are presented; Full TTT 853
reinforcement, No TTT, and an Equivalent UD-laminate material. Projectile impulses 0I were (a) 2.5 kPa s, 854
(b) 2.6 kPa s, (c) 3.3 kPa s, and (d) 4.0 kPa s. Points A-E corresponds to the montage images presented in 855
Figure 6. 856

39
857
Figure 6. Deformation montage of 3D orthogonal woven carbon-fibre composites under soft impact of 858
impulse s kPa64.20 I beams orientated along the y-direction (weft) (a) Experiment (b) Finite element 859
prediction. Points A-E refer to the corresponding positions on Figure 5(b). 860
861
Figure 7 Comparison of the normalised maximum back face deflection max during soft impact as a function 862
of normalised impact impulse Ʈ0 upon 3D woven carbon composites of two different TTT reinforcement 863
densities. 864

40
865
Figure 8. Maximum normalised back-face deflection 0/ˆ l against normalised time after impact 866
pltvt /ˆ0 . FE simulation and experimental results for beams orientated along the x-direction (warp). Points 867
V-Z correspond to the montage images presented in Figure 9. 868
869
Figure 9. Deformation montage of carbon-fibre composites under soft impact testing showing (a) Half TTT 870
3D orthogonal woven composite beam orientated along the x-direction (warp) s kPa19.40 I , (b) Finite 871
element prediction of Half TTT 3D orthogonal woven composite beam orientated along the x-direction (warp) 872
s kPa19.40 I , and (c) UD-laminate material presented in Kandan et al. [10]1s kPa90.20 I . Points V-Z 873
correspond to the locations noted in Figure 8. 874

41
875
Figure 10. Photographic images and FE predictions of damage modes exhibited by Half TTT 3D woven 876
carbon composite undergoing soft impact, tested at skPa19.40 I . Beam orientated along the x-direction 877
(warp). 878

42
879
Figure 11. (a) and (b) Finite element simulations of the predicted compressive damage initiation on the front 880
surface of orthogonal 3D woven composite beams undergoing a soft impact event skPa33.30 I for Full 881
TTT and Half TTT material, respectively. Time t is the time after moment of projectile impact upon beam. A 882
value of 1 corresponds to the onset of compressive fibre damage. (c) Optical microscopic images of fibre 883
breakage on the front surface of impact tests of a Half TTT orthogonal 3D woven material after experimental 884
impact of impulse sKPa33.30 I . Beams orientated along the y-direction (weft). (For interpretation of the 885
colour legend in this figure, the reader is referred to the web version of this article.) 886

43
887
Figure 12 Sketch showing the experimental setup of the clamped beam quasi-static bending test. 888
889
Figure 13 Load imposed by the roller P against roller vertical displacement įp for post-impact clamped-890
clamped beam tests for Full TTT material. Beams orientated along y-direction (weft). 891
892
Figure 14 (a) Summary of the peak load during post-impact clamped beam testing verses the velocity of 893
impact v0. (b) Stiffness of post-impact clamped beam testing versus the velocity of impact, v0. 894

44
895
Figure 15. Finite element predicted deformation of an orthogonal 3D woven carbon composite undergoing a 896
soft impact event s kPa03.40 I showing (a) Full TTT and (b) No TTT model. Contour plot shows damage 897
variable of cohesive interaction, , demonstrating locations of delamination within the beam. A value of 1898
indicates fully delaminated regions. t = 0 corresponds to the moment of projectile impact on the sample. 899
Beams orientated along the y-direction (weft). (For interpretation of the colour legend in this figure, the reader 900
is referred to the web version of this article.) 901

45
902
Figure 16. Montage of finite element simulations of a soft impact event of impulse skPa96.20 I with 903
cohesive contact removed on (a) Full TTT orthogonal 3D woven composite (b) Half TTT orthogonal 3D 904
woven composite (c) 3D woven composite with TTT-reinforcement removed, and (d) Equivalent UD-905
laminate material. t = 0 corresponds to the moment of projectile impact upon the beam. Beams orientated 906
along the x-direction (warp). 907