Embed Size (px)
DESCRIPTION
turning number into knowledge
Citation preview

Turning Numbers into Knowledge
MASTERING THE ART OF PROBLEM SOLVING
Second Edition
J O N AT H A N G . KO O M E Y, P H . D.
Analytics PressPO Box 1545
Burlingame, CA 94011-1545http://www.analyticspress.com
http://www.numbersintoknowledge.com

Analytics PressPO Box 1545Burlingame, CA 94011-1545SAN 253-5602Internet: http://www.analyticspress.comemail: [email protected]
© 2008 by Jonathan G. Koomey. All rights reserved. Protected under the Berne Convention.2nd edition, 4th printing, September 2013.
Reproduction or translation of any part of this work in any form orby any means, electronic or mechanical, beyond that permitted bySection 107 or 108 of the 1976 United States Copyright Act with-out the expressed permission of the copyright owner is unlawful.Requests for permission or further information should be addressedto Analytics Press at the address or URL above.
ISBN-13: 9780970601919 (hardcover)ISBN-13: 9780970601926 (paperback)Library of Congress Control Number 2008901124
Production manager: Susanna Tadlock and David PeattieDesigner: Sandy DrookerCompositor: BookMattersCover art: Tom ChenPrinter and binder: Thomson-Shore
Text credits:The graphics characterizing the Cycle of Action in Chapter 3(Information, intention, and action) are adapted from ThePsychology of Everyday Things by Donald A. Norman. © 1988 byDonald A. Norman. Reprinted by permission of Basic Books, amember of Perseus Books Group.
This book is printed on acid-free recycled paper (30% post consumercontent) in the United States of America.10 9 8 7 6 5 4
xiii
From the late 1970s to the early 1990s, I taught a course originally entitled“Tricks of the Trade” for graduate students in UC Berkeley’s interdisciplinarygraduate program in Energy and Resources. The course conveyed lessons thatI wished someone had taught me during my own university education—butwhich I mainly learned in “the real world” afterwards—about how to functioneffectively in a professional life at the intersection of research, analysis, and pub-lic affairs.
Berkeley’s guardians of academic respectability eventually made me changewhat they regarded as too frivolous a title for the course to “ProfessionalMethods for Interdisciplinary Careers”, but the focus remained the same for the15+ years that I taught it. It covered ways of thinking through complex prob-lems; how to find and manage information; how to function in a committee;how to identify and avoid common pitfalls in the interpretation of data; how topresent results clearly in words, graphs, and tables; how to manage one’s time;and even how to avoid jet lag.
Many students over the years suggested that I should write a book teachingthe “Tricks of the Trade”. Notwithstanding my advice to others about timemanagement, however, I never found the time to write it.
With the 2001 publication of the first edition of Jonathan Koomey’s remark-able book, Turning Numbers into Knowledge, I realized that I no longer neededto try. Dr. Koomey, who had taken my course in the 1980s as a Berkeley grad-uate student, had plenty of ideas of his own about the need and how to fill it.And the book that he wrote surpassed what I would have done, if I had foundthe time, in every important respect.
Now Dr. Koomey has produced a second edition of Turning Numbers Into
Knowledge, and it is even better than the original. His collection of illustrative
F O R E WO R D
by John P. Holdren

examples, already splendidly germane and instructive, has been expanded andupdated, as have his references. His excellent material on the intelligent use ofthe Web has been augmented with a new chapter on data-sharing websites—their pitfalls as well as their promise. Other useful additions grace nearly everychapter.
In light of all the updates and improvements, even owners of the first editionshould want the second. And those who missed the pleasure of the first have theopportunity to start with this still better guide to managing data, time, and peo-ple in a problem-solving context. There is nothing else like this book out there.Nobody who deals with problems where numbers matter—and everybody intoday’s world really needs to—should be without it.
John P. Holdren*
Woods Hole, MA, October 2007
*Past President, American Association for the Advancement of Science; Director, The Woods
Hole Research Center; Teresa and John Heinz Professor of Environmental Policy, Kennedy School
of Government, and Professor of Environmental Science and Policy, Department of Earth and
Planetary Sciences, Harvard University; and Professor Emeritus of Energy and Resources, Uni-
versity of California, Berkeley.
xiv • TURNING NUMBERS INTO KNOWLEDGE
1
In 1815, Thomas Jefferson’s library of 6,500 volumes represented an exem-plary collection of works by the world’s great thinkers. A diligent student whoread two books a day, 325 days per year, could peruse the entire collection inten years. At the time, Jefferson’s collection was a large one, and someone whoread the library in its entirety could reasonably claim familiarity with the mostimportant knowledge of western civilization.
The same diligent student would have to spend a bit more time to read all thebooks and manuscripts in the Library of Congress today. At the same rate of 650books per year, it would take more than 27,000 years to read them all (and that’snot even counting the tens of thousands of new books written every year!)4
The two centuries since Jefferson, particularly the last half-century, have beenextraordinary ones for human knowledge. The pace of change has quickenednoticeably, and the rate of information production has increased by manyorders of magnitude,5 driven by rapid progress in science and technology and byvastly improved information transmission, processing, gathering, and storagecapabilities.6 For the first time in human history, information is being created ata rate far faster than humans can assess and use it.
David Shenk, who documents these trends in his book Data Smog, reports(among other things) that
In 1971 the average American was targeted by at least 560 daily advertis-ing messages. Twenty years later that number had risen sixfold, to 3,000messages per day.
Paper consumption per capita in the United States tripled from 1940 to1980 (from 200 to 600 pounds) and tripled again from 1980 to 1990 (to1,800 pounds). In the 1980s the use of third-class mail (for sending publi-cations) grew 13 times faster than the population.
Two-thirds of business managers surveyed report tension with col-
INTRODUCTION
THE INFORMATION EXPLOSION
leagues, loss of job satisfaction, and strained personal relationships as aresult of information overload.7
In recent years, rapid growth in email spam has only exacerbated these trends,with more than 90% of emails made up of unwanted spam in 2007.
People usually react to such information overload in one of two ways:
• They keep reading and never shut down the flow of information in hopesthat something new might emerge to help them solve the problem at hand.In this case, people can be paralyzed by too much information.8
• They shut out new information because it’s overwhelming. People afflictedwith this reaction are handicapped by too little information. They rely onold knowledge and ideology, and make bad decisions because they closeoff the flow.
My goal is to help you plot a middle course between these two extremes, giv-ing you tools and tricks to help you face the onslaught of new information withequanimity. The rest of this book will hone your analytical instincts and prepareyou to prosper in this information-glutted world.
2 • TURNING NUMBERS INTO KNOWLEDGE
5
Our networks are awash in data. A little of it is information. A smid-gen of this shows up as knowledge. Combined with ideas, some of thatis actually useful. Mix in experience, context, compassion, discipline,humor, tolerance, and humility, and perhaps knowledge becomeswisdom. — C L I F F O R D S TO L L

xv
Whatever failures I have known, whatever errors I have committed,whatever follies I have witnessed in private and public life have beenthe consequence of action without thought. — B E R N A R D B A RU C H
Quantitative problem solving is the process by which we take numbers andtransform them into knowledge, using our instincts and experience to fill inwhen we don’t have all the answers. Although the technical aspects of thisprocess are taught at many universities, the art of problem solving is rarely dis-cussed and even more rarely written down. This book teaches the intricacies ofthat art and will help you become a first-rate analyst in your chosen field.
After reading this book, you will be well equipped to make independent judg-ments about analysis used by others. You will know which key questions to ask,so you need never again be at the mercy of those who traffic in “proof by vig-orous assertion.”2 You will also be more effective at conducting and presentingyour own analyses, no matter what the topic.
Mastering the art of problem solving takes more than proficiency with basiccalculations: it requires understanding how people use information and learn-ing about things as diverse as exploring your ideology, telling good stories, anddistinguishing facts from values. To give you a feeling for what to expect, I pres-ent an annotated chapter list below.
A N N OTAT E D C H A P T E R L I S T
This book contains five major sections, separated into 39 short chapters. Eachchapter is compact and self-contained, and each summarizes key lessons I’velearned over the years.
P R E FAC E
INTRODUCTION • THE INFORMATION EXPLOSION: This sectionbriefly describes how analysis can help reduce the information overload thataffects us all.
PART I • THINGS TO KNOW: These chapters summarize ideas to keep inmind as you read the rest of the book. More experienced analysts should delveinto the ones they find most intriguing and skim the rest.
Chapter 1 • Beginner’s Mind: Start fresh and approach any problem like abeginner would and you’ll surely see things that others will miss.
Chapter 2 • Don’t Be Intimidated: The difference between success and fail-ure often depends on whether you are intimidated. By consciously refusing tobe cowed you can stack the odds in your favor.
Chapter 3 • Information, Intention, and Action: This chapter describeshow humans respond to events, exploring the connections between what wemeasure, what we assume, and what we choose to do.
Chapter 4 • Peer Review and Scientific Discovery: Progress in science canbe subject to human frailty, just as can any other human endeavor. The endresult, however, is something you can count on, in large part because of thepeer review process.
PART II • BE PREPARED: A key determinant of your effectiveness is thequality of your preparation. Whether you’re building a house or chairing ameeting, preparation for the analysis tasks at hand can turn a potential disas-ter into a triumph.
Chapter 5 • Explore Your Ideology: Ideology provides a simplified modelof the world that reflects your values and experiences and prevents paralysisin the face of the myriad choices you face every day. Make sure you knowyour own belief system and those of others.
Chapter 6 • Get Organized: Working and living in chaos is like running amarathon with your feet tied together. Get your life in shape and keep it thatway.
Chapter 7 • Establish a Filing System: Few mistakes are more maddeningthan knowing you have seen a relevant article and not being able to find it.By creating a good filing system, you can prevent this annoyance from everhappening again.
xvi • TURNING NUMBERS INTO KNOWLEDGE

PREFACE • xvii
Chapter 8 • Build a Toolbox: My analytical toolbox is the set of tricks andtechniques that I use to solve particular problems. This chapter describessome key tools to consider for your own.
Chapter 9 • Put Facts at Your Fingertips: Every analysis requires data.Unless you’ve memorized the encyclopedia, you’ll want to keep some key ref-erence sources within easy reach. This chapter describes the ones I find mostuseful.
Chapter 10 • Value Your Time: If someone is wasting your time, they arestealing your life. Identify your most productive times of day and protectyourself from interruptions during those periods. Unplug the phone. Go tothe library. Take control of those times!
PART III • ASSESS THEIR ANALYSIS: When faced with the assertions ofothers, it’s good to know the right questions to ask. These chapters summarizehard-won knowledge about deciphering other people’s analyses.
Chapter 11 • The Power of Critical Thinking: Careful critical thinking isat the root of all good analysis. When the steps described in this chapterbecome second nature, you will have mastered its essence.
Chapter 12 • Numbers Aren’t Everything: Not everything that matterscan be quantified, so make sure the unmeasurable doesn’t fall through thecracks.
Chapter 13 • All Numbers Are Not Created Equal: Numbers and calcu-lations characterizing the physical world are almost always more certain thanthose describing human behavior. Many analysts wrongly imply that fore-casts based on economic data are just as solid as science. They aren’t, so beforewarned.
Chapter 14 • Question Authority: This catch phrase of the 1960s is stillapplicable today. Authority figures can be wrong or biased, so investigatetheir assertions in the same way that you’d examine those of someone withwhom you’re not familiar.
Chapter 15 • How Guesses Become Facts: Always remember that “offi-cial” statistics are based on calculations that are often poorly documented,incorrectly cited, or otherwise hazardous to your intellectual health.
xviii • TURNING NUMBERS INTO KNOWLEDGE
Chapter 16 • Don’t Believe Everything You Read: Maintain a healthyskepticism, even of well-established sources. In this age of instant informationtransmission, rumor and error seem to propagate even more quickly thantruth.
Chapter 17 • Go Back to the Questions: Any time you rely on survey datato make an important decision, refer back to the actual questionnaire uponwhich the survey data are based; otherwise, you risk misinterpreting the data.
Chapter 18 • Reading Tables and Graphs: First check for internal consis-tency, then see if the results contradict other facts you know to be true. Searchfor cognitive dissonance; any discrepancy between the author’s results andwhat you already know will help you investigate further.
Chapter 19 • Distinguish Facts From Values: Don’t be fooled by technicalpeople who portray their advice as totally rational, completely objective, andvalue-free. If they have made a choice, they have also made a value judgment.
Chapter 20 • The Uncertainty Principle and the Mass Media: Just as theobserver of a subatomic particle can disturb that particle by the act of obser-vation, the observer of an institution can disturb that institution by observ-ing and reporting on it. Members of the media (and the analysts who informthem) should take responsibility for the power they wield.
PART IV • CREATE YOUR ANALYSIS: Everyone develops his/her owntechniques for creating cogent analyses, and in this section I summarize thoseI’ve learned. The importance of organization, clear thinking, careful definitions,systematic exposition, scrupulous documentation, and consistent comparisonscannot be overestimated. You’ll learn about each of these here.
Chapter 21 • Reflect: Free yourself from interruptions and give yourselftime to reflect. Without such time, you’ll never achieve your full problem-solving potential.
Chapter 22 • Getting Unstuck: Everyone gets stuck sometimes, but this pit-fall need not hobble your efforts if you use the tricks in this chapter.
Chapter 23 • Inquire: When faced with a problem outside your expertise,don’t surrender! It’s an advantage to be unconstrained by the mental shack-les most disciplines place on their practitioners. Some of the most importantinsights in modern thought came from people who could think “outside thebox” (or ignore the box entirely).
Chapter 24 • Be a Detective: Detectives are real-world practitioners of thescientific method. The time-honored techniques of these seasoned problemsolvers should be grist for your analytical mill.
Chapter 25 • Create Consistent Comparisons: People often relate best toanecdotes. A consistent comparison is a well-chosen set of anecdotes thatillustrates your point in a compelling way. It is a powerful technique and onewell worth learning.
Chapter 26 • Tell a Good Story: Scenario analysis is the art of structuredstorytelling, and it’s an essential tool for any good analyst. Most people don’trealize that this art is both highly developed and pertinent to many everydaysituations.
Chapter 27 • Dig into the Numbers: Don’t be shy about delving into theactual numbers even if you’re a highly paid executive. You’ll learn thingsyou’d never see if someone else crunches the numbers.
Chapter 28 • Make a Model: Models are “laboratories for the imagina-tion,” and this chapter explores the subtleties of using them to explain theworld around you.
Chapter 29 • Reuse Old Envelopes: You can calculate almost anythingusing only common knowledge–you just need to learn how to put thisknowledge to use, and this chapter (which focuses on back-of-the-envelopecalculations) is just the thing to help you do it.
Chapter 30 • Use Forecasts with Care: The future is uncertain but peoplekeep trying to forecast it anyway. Numerous pitfalls await, and without akeen eye for the tricks of this trade, you’ll be hard pressed to avoid them.
Chapter 31 • Hear All Sides: In any intellectual dispute, it pays to hear twowell-prepared debaters argue their points before drawing any conclusions.Always make such debates fodder for your deliberations and your decisionswill benefit.
PART V • SHOW YOUR STUFF: Once you’ve done good work you’llwant to present it effectively to readers or listeners. The chapters in this sectiongive insights into making your results “grab” your audience, designing goodtables and figures, and using those tables and figures to convey your key points.The section concludes by exploring effective use of the Internet for publishingyour analysis and sharing your data.
PREFACE • xix
Chapter 32 • Know Your Audience: Most analysts forget that other peopledon’t care nearly as much about their results as they themselves do, so knowyour audience and present compelling information in a form your readerscan easily grasp.
Chapter 33 • Document,Document,Document: An astounding numberof analysts routinely omit vital data and assumptions from their reports, butyou should avoid this pernicious practice. The best analysts document every-thing, giving credit where credit is due, leaving a trail so they can remember,and creating a trail for others to follow. Documentation is also a key stepin checking your work, because it forces you to think clearly about youranalysis.
Chapter 34 • Let the Tables and Graphs Do the Work: When writing tech-nical reports, create the analysis, tables, and graphs first, then write aroundthem. If the analysis is well thought out, the tables and graphs well designed,and the audience clearly defined, the report should practically write itself.
Chapter 35 • Create Compelling Graphs and Figures: Follow EdwardTufte’s rules for graphical excellence, and avoid the most common pitfalls indesigning charts and graphs. Your goal should be to give to the reader “thegreatest number of ideas in the shortest time with the least ink in the small-est space.”3
Chapter 36 • Create Good Tables: A well-designed table is a work of art;a sloppy one is worse than useless. Make your tables a resource that yourreaders will keep as a reference for many years to come.
Chapter 37 • Use Numbers Effectively in Oral Presentations: Even vet-eran presenters show too many of the wrong numbers. Present only thosenumbers that support the story you are telling, and focus on that story, NOTon the numbers themselves.
Chapter 38 • Use the Internet: The old ways of publishing are fast beingsupplanted by web-based approaches. Learn about these new tools and putthem to work for you.
Chapter 39 • Share and Share Alike: Some kinds of information are morevaluable when shared. Although there's still work to be done, web technol-ogy is finally automating the data sharing process, allowing you to capturebenefits in standardization, efficiency, and greater analytical insight.
xx • TURNING NUMBERS INTO KNOWLEDGE
CONCLUSIONS • CREATING THE FUTURE: This chapter gives per-spective on why we use analysis in the first place. Understanding the world is aprerequisite for making it better!
EPILOGUE • SOME PARTING THOUGHTS: After the first edition ofTurning Numbers into Knowledge was published in 2001 I encountered somewidely believed but erroneous statistics, and this epilogue recounts the lessonsI learned in debunking them.
W H O S H O U L D R E A D T H I S B O O K
This book grew out of my experience in training analysts over the past twodecades. It is written for beginning problem solvers in business, government,consulting, and research professions, and for students of business and publicpolicy. It is also intended for supervisors of such analysts, professors, and entre-preneurs (who may not consider themselves analysts but who need to createanalyses to justify their business plans to potential investors). Finally, it coversmany topics that journalists who focus on scientific or business topics will finduseful.
H OW TO U S E T H I S B O O K
There is no need to read the chapters in order. Go straight to those that inter-est you most, but skim the chapters you skip. You just might see something use-ful there that you did not expect.
Most chapters have “links” to other chapters, with graphical signposts indi-cating which chapter or major section to investigate for each link (the relevantchapter number appears inside). These signposts look like the link to Chapter14 that appears in the right margin opposite this line.
All Uniform Resource Locators (URLs) discussed in the book are enclosed intriangular brackets, to set them off from the text. They appear as follows:<http://www.lbl.gov>. The brackets and any punctuation marks that precede orfollow them are not part of the URL.
All URLs, as well as many key data files, are available in electronic form at
PREFACE • xxi
14
xxii • TURNING NUMBERS INTO KNOWLEDGE
<http://www.numbersintoknowledge.com>. If you have questions, comments,or suggestions you can post them at this site. I’ll gladly evaluate them for inclu-sion in the next edition. I’m particularly interested in examples of large and pub-lic analytical blunders by people who should know better, examples of bad orgood tables and graphs, and suggestions for how the book can be improved orexpanded.
The endnotes contain references, attributions, and detailed information forthe interested reader. The Further Reading at the end of the book does notattempt to be comprehensive. Rather, it contains selected sources for each chap-ter that I regard as most crucial for mastering the material. If I mention a book,I include it in the Further Reading section for the chapter in which I refer to it.At the beginning of the Further Reading section, I also include the list of myvery favorite sources on this topic, which (in my opinion) are the “must read”items that all serious problem solvers should have on their shelves.
W H AT ' S N E W I N T H E S E C O N D E D I T I O N
In my revisions for this edition I've focused on tightening up the text, revisingand improving the examples, updating data where appropriate, and updatingand expanding the further reading section. I also added a new chapter on datasharing sites as well as an Epilogue, which describes some of what I've learnedsince the first edition of Turning Numbers into Knowledge was published in2001. Finally, John Holdren graciously consented to write a new foreword. Ihope you enjoy reading this book as much as I enjoyed writing it!
Like all other arts, the science of deduction and analysis is one thatcan only be acquired by long and patient study.
— S H E R L O C K H O L M E S
FOREWORD . . . . . . . . . . . . . . . . . . . . . . . . . . . . . . . . . . . . . . . . xiii
PREFACE . . . . . . . . . . . . . . . . . . . . . . . . . . . . . . . . . . . . . . . . . . . xv
ACKNOWLEDGMENTS . . . . . . . . . . . . . . . . . . . . . . . . . . . . . . xxiii
I N T R O D U C T I O N • THE INFORMATION EXPLOSION . . . . . . . . . . . . 1
PA RT I • THINGS TO KNOW . . . . . . . . . . . . . . . . . . . . . . 3
1 • Beginner’s Mind . . . . . . . . . . . . . . . . . . . . . . . . . . . . . . . . . 5
2 • Don’t Be Intimidated . . . . . . . . . . . . . . . . . . . . . . . . . . . . 7
3 • Information, Intention, and Action . . . . . . . . . . . . . . . . . 9
4 • Peer Review and Scientific Discovery . . . . . . . . . . . . . 22
PA RT I I • BE PREPARED . . . . . . . . . . . . . . . . . . . . . . . . . . . . . . . . . 29
5 • Explore Your Ideology . . . . . . . . . . . . . . . . . . . . . . . . . . 31
6 • Get Organized . . . . . . . . . . . . . . . . . . . . . . . . . . . . . . . . .34
7 • Establish a Filing System . . . . . . . . . . . . . . . . . . . . . . . . . 38
8 • Build a Toolbox . . . . . . . . . . . . . . . . . . . . . . . . . . . . . . . . 41
9 • Put Facts at Your Fingertips . . . . . . . . . . . . . . . . . . . . . . 44
10 • Value Your Time . . . . . . . . . . . . . . . . . . . . . . . . . . . . . . . .52
PA RT I I I • ASSESS THEIR ANALYSIS . . . . . . . . . . . . . . . . . . . . 57
11 • The Power of Critical Thinking . . . . . . . . . . . . . . . . . . . 59
12 • Numbers Aren’t Everything . . . . . . . . . . . . . . . . . . . . . .62
13 • All Numbers Are Not Created Equal . . . . . . . . . . . . . .65
14 • Question Authority . . . . . . . . . . . . . . . . . . . . . . . . . . . . .68
15 • How Guesses Become Facts . . . . . . . . . . . . . . . . . . . . .73
16 • Don’t Believe Everything You Read . . . . . . . . . . . . . . . .76
C O N T E N T S

17 • Go Back to the Questions . . . . . . . . . . . . . . . . . . . . . . .81
18 • Reading Tables and Graphs . . . . . . . . . . . . . . . . . . . . . . .84
19 • Distinguish Facts from Values . . . . . . . . . . . . . . . . . . . . .87
20 • The Uncertainty Principle and the Mass Media . . . . . .90
PA RT I V • CREATE YOUR ANALYSIS . . . . . . . . . . . . . . . . . . . . 93
21 • Reflect . . . . . . . . . . . . . . . . . . . . . . . . . . . . . . . . . . . . . . . .95
22 • Get Unstuck . . . . . . . . . . . . . . . . . . . . . . . . . . . . . . . . . . .97
23 • Inquire . . . . . . . . . . . . . . . . . . . . . . . . . . . . . . . . . . . . . . . .99
24 • Be a Detective . . . . . . . . . . . . . . . . . . . . . . . . . . . . . . . .102
25 • Create Consistent Comparisons . . . . . . . . . . . . . . . . .105
26 • Tell a Good Story . . . . . . . . . . . . . . . . . . . . . . . . . . . . .107
27 • Dig into the Numbers . . . . . . . . . . . . . . . . . . . . . . . . .111
28 • Make a Model . . . . . . . . . . . . . . . . . . . . . . . . . . . . . . . .125
29 • Reuse Old Envelopes . . . . . . . . . . . . . . . . . . . . . . . . . .129
30 • Use Forecasts with Care . . . . . . . . . . . . . . . . . . . . . . .136
31 • Hear All Sides . . . . . . . . . . . . . . . . . . . . . . . . . . . . . . . . .143
PA RT V • SHOW YOUR STUFF . . . . . . . . . . . . . . . . . . . . . . . . . 145
32 • Know Your Audience . . . . . . . . . . . . . . . . . . . . . . . . . . .147
33 • Document, Document, Document . . . . . . . . . . . . . . .149
34 • Let the Tables and Graphs Do the Work . . . . . . . . . .161
35 • Create Compelling Graphs and Figures . . . . . . . . . . .166
36 • Create Good Tables . . . . . . . . . . . . . . . . . . . . . . . . . . .177
37 • Use Numbers Effectively in Oral Presentations . . . . .186
38 • Use the Internet . . . . . . . . . . . . . . . . . . . . . . . . . . . . . .189
39 • Share and Share Alike . . . . . . . . . . . . . . . . . . . . . . . . . .201
C O N C L U S I O N • CREATING THE FUTURE . . . . . . . . . . . . . . . . . . . . 209
E P I L O G U E • SOME PARTING THOUGHTS . . . . . . . . . . . . . . . . 213
FURTHER READING . . . . . . . . . . . . . . . . . . . . . . . . . . . . . . . . . 223
NOTES . . . . . . . . . . . . . . . . . . . . . . . . . . . . . . . . . . . 241
INDEX . . . . . . . . . . . . . . . . . . . . . . . . . . . . . . . . . . . . 245

3
Before we begin our explorations, there are a few preliminary items to workthrough that can help increase your problem-solving proficiency. You may needto read these chapters a couple of times, but they are worth mastering.
THINGS TO KNOW
PART
I
Don’t allow yourself to be intimidated by know-it-alls who thrive onbestowing their knowledge on insecure people. Put cotton in your earsand blinders next to your eyes, and trudge ahead with the confidencethat whether or not someone else “knows it all” isn’t really relevant;the only thing that’s relevant is what YOU know and what YOU do.
— RO B E RT R I N G E R
5
BEGINNER’S MINDIn the course of my life I have often had to eat my words, and I mustconfess I have always found it a wholesome diet.
— W I N S TO N C H U R C H I L L
Most people attack a new problem by relying heavily on the tools and skillsthat are most familiar to them. While this approach can work well for problemsthat are similar to those previously solved, it often fails, and fails miserably,when a new problem is particularly novel or vexing. In these circumstances, itis best to assume nothing and treat the problem as if you have never seen any-thing like it before.
In martial arts, this sense of looking freshly at something is known as“Beginner’s Mind.” Beginners to any art don’t know what is important andwhat is irrelevant, so they try to absorb every detail. Experienced martial artistsuse their experience as a filter to separate the essential from the irrelevant. Whenthat filter mistakenly screens out something essential, then even seasoned mas-ters can err.
The phrase “Beginner’s Mind” is a reminder that experience is a two-edgedsword. It eliminates unnecessary detail and allows a focus on what are ostensi-bly the most important elements of a problem. It can also lead you astray whena new problem is sufficiently outside your experience (Chip and Dan Heath callthis problem “the curse of knowledge”). The art is in knowing when experienceis not applicable to the problem at hand.
The ideal is to combine the curiosity and the non-judgmental observation ofa beginner with the experience of a senior analyst. Together, these skills can bean immensely powerful combination.
BEGINNER’S MIND
CHAPTER
1

A Japanese Zen master received a university professor who cameto inquire about Zen. It was obvious to the master from the start ofthe conversation that the professor was not so much interested inlearning about Zen as he was in impressing the master with his ownopinions and knowledge. The master listened patiently and finallysuggested they have some tea. The master poured his visitor’s cupfull and then kept on pouring.The professor watched the cup over-flowing until he could no longer restrain himself. “The cup is overfull,no more will go in.”
“Like this cup”, the master said, “you are full of your own opinionsand speculations. How can I show you Zen unless you first empty yourcup?” — B RU C E L E E
6 • TURNING NUMBERS INTO KNOWLEDGE

7
DON’T BE INTIMIDATED
Brenda Ueland, in her classic treatise on creative writing (If You Want to
Write), explicitly advocates thumbing your nose at “know-it-alls, jeerers, crit-ics, doubters,” several times a day. These intimidators murder talent and crushcreativity, and you shouldn’t let them get away with it.
Most of us have experienced people who confidently toss out statistics to bol-ster their arguments. Although there are those who speak only when they aresure of their facts, there are many more who express their opinions even whentheir ideas are ill founded. They do so secure in the knowledge that most peo-ple will not see through this game.
In 1974, Robert J. Ringer first published his book titled Winning Through
Intimidation. In it, he described how he developed his own philosophy for suc-cess in his chosen field of real estate sales. The core of this philosophy is whatRinger calls “The Theory of Intimidation,” which has wide application to everyfield of human endeavor. In summary, it states that
The rewards a person obtains are inversely proportional to the degree to which that person is intimidated.9
In other words, people do worse in work, life, and love when they are intimi-dated by others.
To avoid being intimidated, Ringer developed a strong posture. He first cre-ated a professional image that would prevent others from intimidating him(for example, he created a lavish “calling card” that was so nicely producedthat anyone receiving it would immediately be convinced that Ringer was“somebody”). He then perfected the use of legal tools that would ensure hisright to claim rewards for his efforts. Finally, he was so good at his professionthat no one could legitimately conclude that his performance was anything butexcellent.
CHAPTER
2

Ringer’s refusal to be intimidated resulted in spectacular financial rewardsrelatively quickly. The important lessons to take from his book are that
• many people use intimidation to accomplish their goals even when theyare not in the right;
• these people often use (and abuse) analysis to commit these acts of intim-idation, and
• someone who knows the right question to ask about how such analysis iscreated can often deflect acts of intimidation before any damage is done.
With the right preparation, you can beat the intimidators at their own game.
8 • TURNING NUMBERS INTO KNOWLEDGE
Part III
Why do people who know the least know it the loudest?— G E O R G E C A R L I N
9
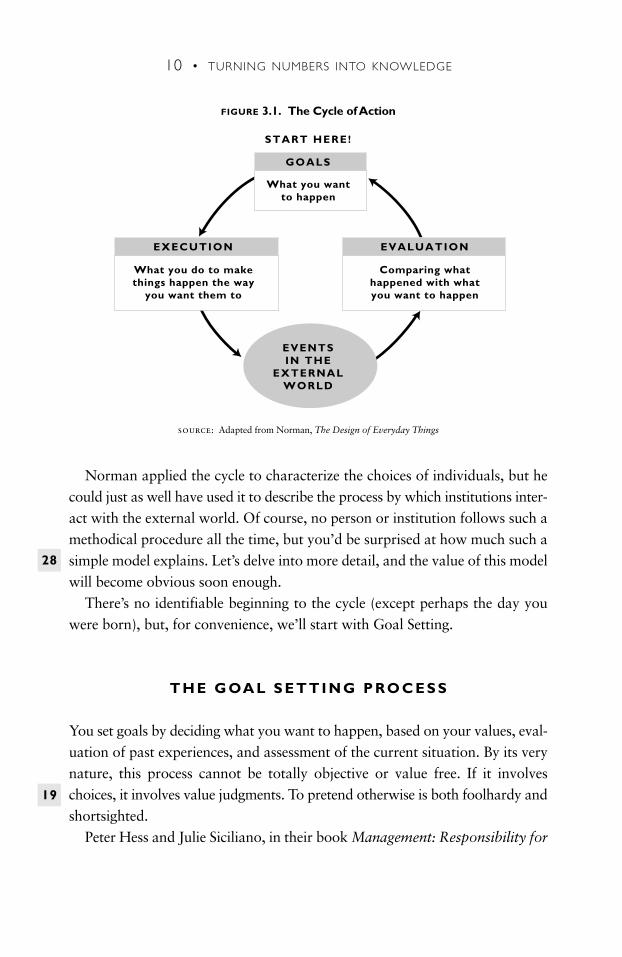
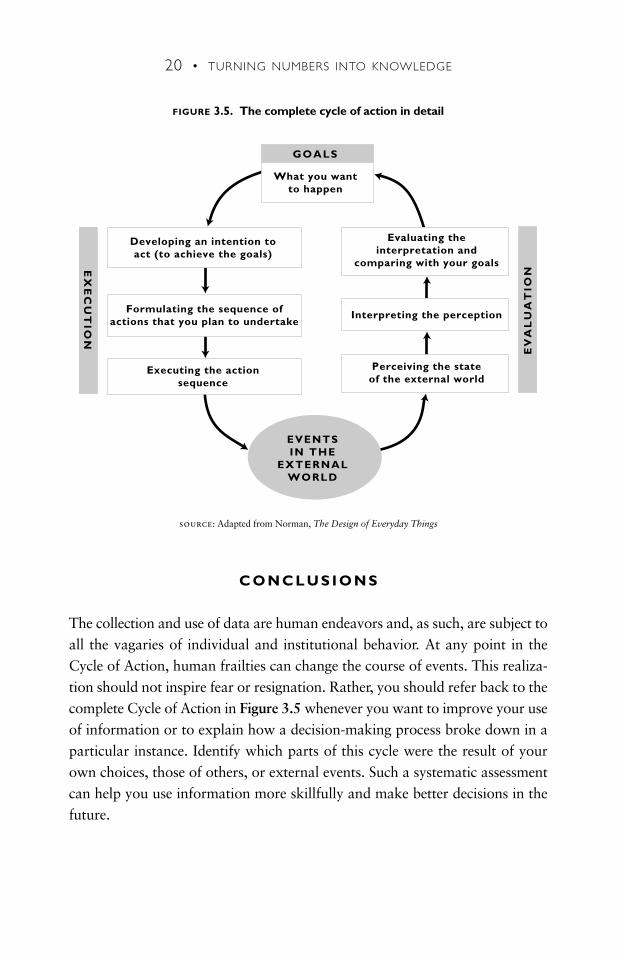
In spite of people’s differences, there are common threads in the way each ofus makes decisions and carries them out. The “Cycle of Action” described inthis chapter is not an all-encompassing model, but it can help you understandthe role of information in your decision making. It can also help you make bet-ter decisions in the future.
Donald Norman, in his book The Design of Everyday Things, first intro-duced the concept of the Cycle of Action (see Figure 3.1) and applied it to howpeople interact with technology. He separated human responses to events intoGoal Setting, Execution, and Evaluation. Say, for example, that you want tohear some music. Goal setting involves deciding which outcome is most desir-able (listening to a Beatles tune). Execution is the process of influencing exter-nal events so that they move more closely to that outcome (you find the com-pact disc, put it into the player, and turn the player on). Evaluation is theprocess of observing the resulting external events and determining whetherthose events are consonant with your goals (if the music starts and you likewhat you hear, then you’ve successfully achieved your goal; if not, you need tochose a new song; if the music doesn’t play, you’ll need to fix the stereo).
Your decisions are a function both of your past experiences, evaluated afterthe fact, and your current needs and desires. Your past experience enjoying par-ticular recordings, for example, combined with your current goals of hearingmusic, will help you decide whether to choose one compact disc over another.
The major steps in the cycle can be summarized as follows:
• Decide what to do, based on your goals;
• Do it (execution);
• Assess the results (evaluation);
• Decide what to do next, and then repeat the process
INFORMATION, INTENTION,
AND ACTION
CHAPTER
3
10 • TURNING NUMBERS INTO KNOWLEDGE
Norman applied the cycle to characterize the choices of individuals, but hecould just as well have used it to describe the process by which institutions inter-act with the external world. Of course, no person or institution follows such amethodical procedure all the time, but you’d be surprised at how much such asimple model explains. Let’s delve into more detail, and the value of this modelwill become obvious soon enough.
There’s no identifiable beginning to the cycle (except perhaps the day youwere born), but, for convenience, we’ll start with Goal Setting.
T H E G OA L S E T T I N G P RO C E S S
You set goals by deciding what you want to happen, based on your values, eval-uation of past experiences, and assessment of the current situation. By its verynature, this process cannot be totally objective or value free. If it involveschoices, it involves value judgments. To pretend otherwise is both foolhardy andshortsighted.
Peter Hess and Julie Siciliano, in their book Management: Responsibility for
28
What you wantto happen
What you do to makethings happen the way
you want them to
Comparing whathappened with whatyou want to happen
GOALS
START HERE!
EXECUTION EVALUATION
EVENTSIN THE
EXTERNALWORLD
source: Adapted from Norman, The Design of Everyday Things
FIGURE 3.1. The Cycle of Action
19
PART I : THINGS TO KNOW • 11
Performance, define key characteristics of effective goal setting in the manage-ment context, but these criteria apply more generally. The goals must be spe-cific, meaningful to and accepted by the participants, and “realistic yet chal-lenging.” Finally, effective goals have a clearly defined deadline and ways ofmeasuring progress toward the goal.10
The goal can be as simple as satisfying your hunger or as complicated asinfluencing the future direction of the computer industry. Once you’ve decidedwhat outcome you desire, you take action (execute).
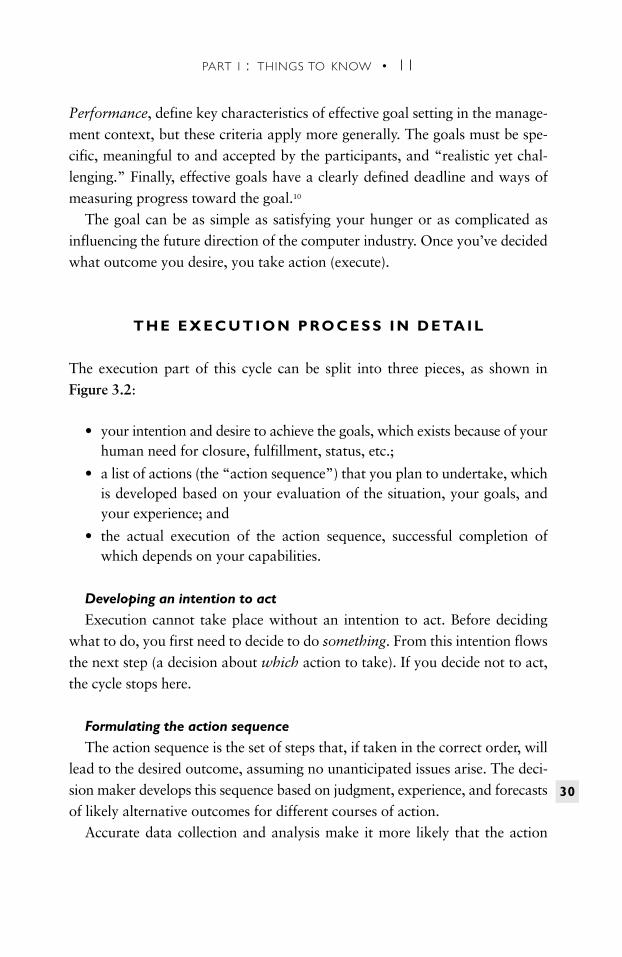
T H E E X E C U T I O N P RO C E S S I N D E TA I L
The execution part of this cycle can be split into three pieces, as shown inFigure 3.2:
• your intention and desire to achieve the goals, which exists because of yourhuman need for closure, fulfillment, status, etc.;
• a list of actions (the “action sequence”) that you plan to undertake, whichis developed based on your evaluation of the situation, your goals, andyour experience; and
• the actual execution of the action sequence, successful completion ofwhich depends on your capabilities.
Developing an intention to actExecution cannot take place without an intention to act. Before deciding
what to do, you first need to decide to do something. From this intention flowsthe next step (a decision about which action to take). If you decide not to act,the cycle stops here.
Formulating the action sequenceThe action sequence is the set of steps that, if taken in the correct order, will
lead to the desired outcome, assuming no unanticipated issues arise. The deci-sion maker develops this sequence based on judgment, experience, and forecastsof likely alternative outcomes for different courses of action.
Accurate data collection and analysis make it more likely that the action
30
12 • TURNING NUMBERS INTO KNOWLEDGE
sequence will be developed in a sensible way in any particular instance. Onlyrarely does the decision maker have complete knowledge of all relevant factors,so she relies on instinct, experience, ideology, and whatever relevant data havebeen brought to bear on the topic. Any decision is usually one of dozens to bemade on a given day, and there are few such decisions that do not also face timeconstraints. Poor judgment can result as much from tight time constraints asfrom data that are compiled inaccurately.
Because all information is uncertain in one way or another, it is important todevelop strategies to cope with that uncertainty when formulating the actionsequence (for more details, see Morgan and Henrion’s book Uncertainty). Oneof the most effective coping strategies involves thinking through alternative sce-narios in advance of a particular decision.
26
EX
EC
UT
ION
Developing an intention toact (to achieve the goals)
Formulating the sequence ofactions that you plan to undertake
Executing the actionsequence
What you wantto happen
GOALS
EVENTSIN THE
EXTERNALWORLD
FIGURE 3.2. The execution part of the cycle of action
source: Adapted from Norman, The Design of Everyday Things
PART I : THINGS TO KNOW • 13
When evaluating how information was used to develop the action sequencein a particular instance, always explore the interests and training of the peopleinvolved. Such an exploration will almost certainly be fruitful. In his book How
to Drive Your Competition Crazy, Guy Kawasaki points out that “a managerwho has been through years of price wars will interpret an opponent’s pricereduction differently from a Harvard MBA, who’s never been closer to a pricewar than a lecture hall, or a Wharton MBA, who has to formulate an econo-metric model to buy a pack of gum.”11
Executing the action sequenceAfter deciding what to do, you must follow through with action. Good data
documentation practice, accurate analysis, and critical thinking can help ensurethat the outcome of execution is what you intend. The perceptions of others canbe key to success, and a decision maker backed up by credible analysis can influ-ence those perceptions to her advantage.
The execution process itself can also affect goal setting. For example, thevery process of taking action can cause you to realize more precisely what youwant. It will also give you better information on what it will take to achieveyour goal and help you decide whether it’s worth continuing to pursue.
E F F E C T S O N T H E E X T E R N A L WO R L D
After the action sequence is executed, the decisions affect the external world insome way. For the Cycle of Action, the relevant external world is everythingexternal to the decision process of the individual or institution that might beaffected by the action sequence. These effects can be confined to physical ones(i.e., you turn on the stereo after determining the correct action sequence to do it)or to personal/emotional ones (e.g., you decide to play a song on the stereo thatreminds you of a long-lost love and brings back your feelings for that person).Usually, though, the effects are both physical and emotional. Often there aremany distinct effects of a given action sequence, some of which cannot easily beforeseen. You assess these effects in the evaluation stage of the Cycle of Action.
1133
14 • TURNING NUMBERS INTO KNOWLEDGE
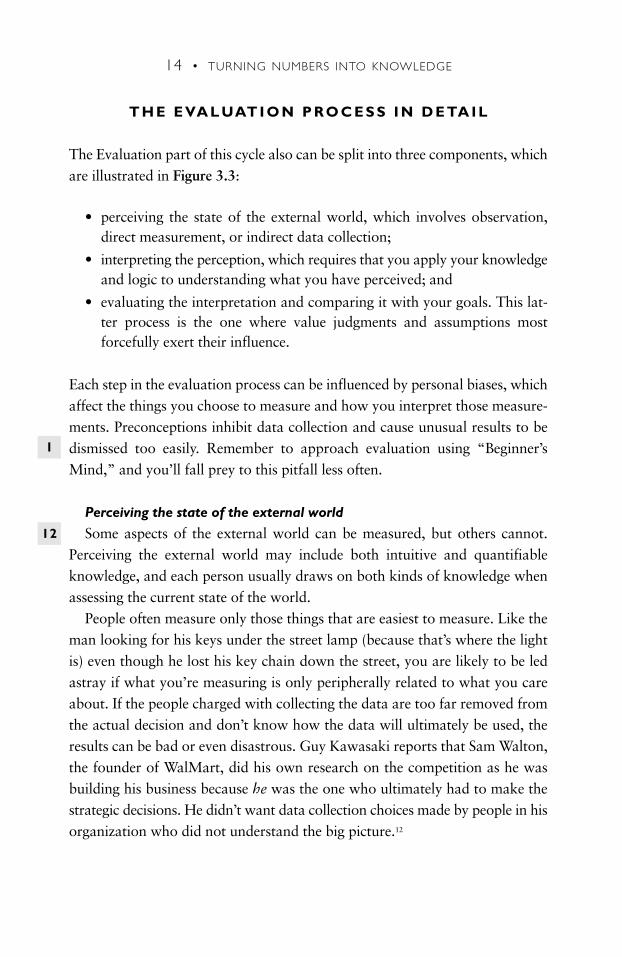
T H E E VA L UAT I O N P RO C E S S I N D E TA I L
The Evaluation part of this cycle also can be split into three components, whichare illustrated in Figure 3.3:
• perceiving the state of the external world, which involves observation,direct measurement, or indirect data collection;
• interpreting the perception, which requires that you apply your knowledgeand logic to understanding what you have perceived; and
• evaluating the interpretation and comparing it with your goals. This lat-ter process is the one where value judgments and assumptions mostforcefully exert their influence.
Each step in the evaluation process can be influenced by personal biases, whichaffect the things you choose to measure and how you interpret those measure-ments. Preconceptions inhibit data collection and cause unusual results to bedismissed too easily. Remember to approach evaluation using “Beginner’sMind,” and you’ll fall prey to this pitfall less often.
Perceiving the state of the external worldSome aspects of the external world can be measured, but others cannot.
Perceiving the external world may include both intuitive and quantifiableknowledge, and each person usually draws on both kinds of knowledge whenassessing the current state of the world.
People often measure only those things that are easiest to measure. Like theman looking for his keys under the street lamp (because that’s where the lightis) even though he lost his key chain down the street, you are likely to be ledastray if what you’re measuring is only peripherally related to what you careabout. If the people charged with collecting the data are too far removed fromthe actual decision and don’t know how the data will ultimately be used, theresults can be bad or even disastrous. Guy Kawasaki reports that Sam Walton,the founder of WalMart, did his own research on the competition as he wasbuilding his business because he was the one who ultimately had to make thestrategic decisions. He didn’t want data collection choices made by people in hisorganization who did not understand the big picture.12
1
12
PART I : THINGS TO KNOW • 15
Kawasaki also describes how businesses can sometimes deliberately skew theircompetitors’ perceptions of the external world. In the late 1960s, Wilson Harrelused his knowledge of Proctor & Gamble’s (P&G’s) test marketing plans (whichwere public knowledge) first to make P&G believe that its new cleaning productwould be a big success. He temporarily withdrew his own competing product(Formula 409) from Denver, the test market city, which made P&G’s test prod-uct sell well. P&G then decided to roll out the product nationwide, based on the“success” in Denver. To thwart this launch, Harrell promoted an extremely lowprice for a large amount of Formula 409 just as P&G launched its national cam-paign. Harrel’s promotion effectively removed a large number of consumers fromthe national market for cleaning fluid, because the special price applied toenough cleaning fluid to last a typical household for half a year. P&G discon-tinued its product less than a year later, because of disappointing sales.13
Evaluating theinterpretation and
comparing with your goals
Interpreting the perception
Perceiving the stateof the external world
EV
AL
UT
ION
What you wantto happen
GOALS
EVENTSIN THE
EXTERNALWORLD
FIGURE 3.3. The evaluation part of the cycle of action
source: Adapted from Norman, The Design of Everyday Things
16 • TURNING NUMBERS INTO KNOWLEDGE
Information technology has made it easier to collect data on events we couldonly dream about tracking twenty years ago. In 1997, Peter Coffee, a columnistat PC Week magazine, advocated that businesses collect data on sales of prod-ucts by day of the week and even by time of day.14 The benefits of such track-ing include improved customer service, inventory management, cash flowtracking, and staff allocation, but it has only been during the past decade thatsuch data collection has become possible on a large scale.
Even with new technology, however, collecting the relevant data is not alwaysstraightforward. The ranking of different Internet web sites in terms of numbersof visitors is critical for web advertisers and other businesses, but small differ-ences in measurement methodology can lead to large differences in these rank-ings. Internet companies are still struggling to define appropriate measurementmethodologies, and these difficulties are unlikely to be resolved soon.15
Inside an institution, the process of perceiving the state of the external worldcan be subverted by the complexities of office politics. The busiest decisionmakers (CEOs, Presidents, Cabinet Secretaries) are often protected from newideas by their legions of “handlers,” from their Chiefs of Staff to their secre-taries. Robert Reich discovered this truth when he became Secretary of Laborin 1993:
My cavernous office is becoming one of those hermetically sealed, germ-freebubbles they place around children born with immune deficiencies. What-ever gets through to me is carefully sanitized. Telephone calls are pre-screened, letters are filtered, memos are reviewed. Those that don’t getthrough are diverted elsewhere.16
The Cycle of Action can thus become the Cycle of Inaction when informationis diverted from its intended audience. Never forget that, within institutions, themost important decision makers virtually always face some variant of Reich’s“bubble.” Reich himself tried to puncture the bubble now and then, to the con-sternation of his staff.
Interpreting the perceptionOnce data are collected, they almost always require “massaging” into a use-
ful form. This step can involve as little as minor reformatting or as much asdetailed calculations and analysis. The choice of how much to manipulate data27
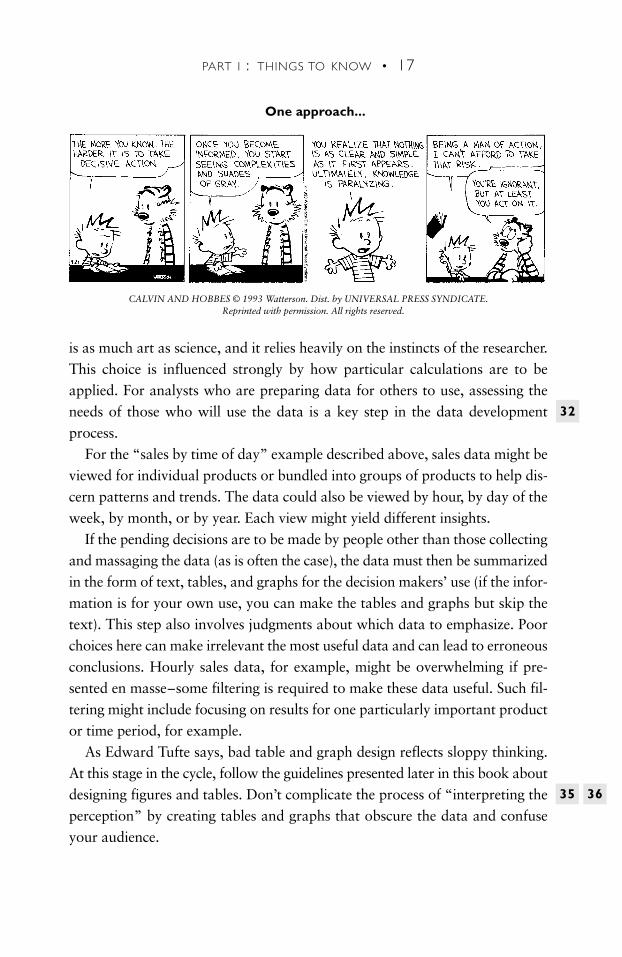
PART I : THINGS TO KNOW • 17
is as much art as science, and it relies heavily on the instincts of the researcher.This choice is influenced strongly by how particular calculations are to beapplied. For analysts who are preparing data for others to use, assessing theneeds of those who will use the data is a key step in the data developmentprocess.
For the “sales by time of day” example described above, sales data might beviewed for individual products or bundled into groups of products to help dis-cern patterns and trends. The data could also be viewed by hour, by day of theweek, by month, or by year. Each view might yield different insights.
If the pending decisions are to be made by people other than those collectingand massaging the data (as is often the case), the data must then be summarizedin the form of text, tables, and graphs for the decision makers’ use (if the infor-mation is for your own use, you can make the tables and graphs but skip thetext). This step also involves judgments about which data to emphasize. Poorchoices here can make irrelevant the most useful data and can lead to erroneousconclusions. Hourly sales data, for example, might be overwhelming if pre-sented en masse–some filtering is required to make these data useful. Such fil-tering might include focusing on results for one particularly important productor time period, for example.
As Edward Tufte says, bad table and graph design reflects sloppy thinking.At this stage in the cycle, follow the guidelines presented later in this book aboutdesigning figures and tables. Don’t complicate the process of “interpreting theperception” by creating tables and graphs that obscure the data and confuseyour audience.
35
32
36
One approach...
CALVIN AND HOBBES © 1993 Watterson. Dist. by UNIVERSAL PRESS SYNDICATE. Reprinted with permission. All rights reserved.
Evaluating the interpretationThe evaluation of data involves drawing conclusions, developing assertions,
and deciding which of these assertions to emphasize. These assertions can takeseveral forms, but the choice of which ones to make from a given set of data isat the discretion of the analyst (that means YOU!) or the people presenting infor-mation to the decision maker. Even among the set of assertions that can be log-ically supported by a particular set of data, there is no single correct choice here.
At this point in the cycle, the analyst must make explicit assumptions aboutrelevant unknowns (based on experience, values, instinct, and ideology), or sim-ply ignore them. Usually, these issues are noted and put aside for future work.Ignoring these unknowns can lead to serious analytical errors, as can makingbad assumptions about them. Unfortunately, there’s no way to avoid this risk,but you can insulate yourself from it by creating credible scenarios.
The evaluation at this stage can be affected by power relationships betweenthe analyst and the source of the data. Jeffrey Laderman, writing in Business
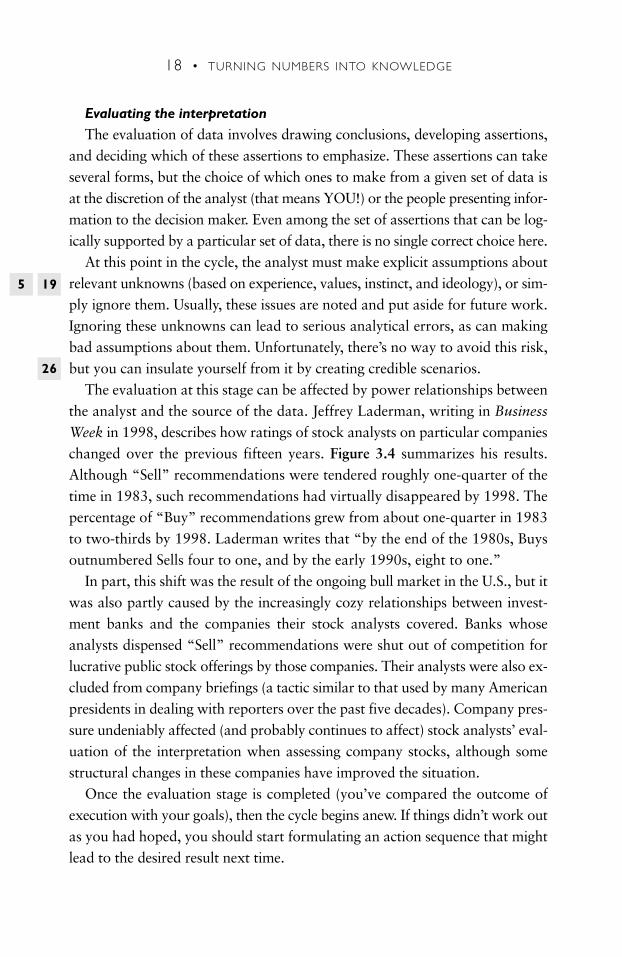
Week in 1998, describes how ratings of stock analysts on particular companieschanged over the previous fifteen years. Figure 3.4 summarizes his results.Although “Sell” recommendations were tendered roughly one-quarter of thetime in 1983, such recommendations had virtually disappeared by 1998. Thepercentage of “Buy” recommendations grew from about one-quarter in 1983to two-thirds by 1998. Laderman writes that “by the end of the 1980s, Buysoutnumbered Sells four to one, and by the early 1990s, eight to one.”
In part, this shift was the result of the ongoing bull market in the U.S., but itwas also partly caused by the increasingly cozy relationships between invest-ment banks and the companies their stock analysts covered. Banks whoseanalysts dispensed “Sell” recommendations were shut out of competition forlucrative public stock offerings by those companies. Their analysts were also ex-cluded from company briefings (a tactic similar to that used by many Americanpresidents in dealing with reporters over the past five decades). Company pres-sure undeniably affected (and probably continues to affect) stock analysts’ eval-uation of the interpretation when assessing company stocks, although somestructural changes in these companies have improved the situation.
Once the evaluation stage is completed (you’ve compared the outcome ofexecution with your goals), then the cycle begins anew. If things didn’t work outas you had hoped, you should start formulating an action sequence that mightlead to the desired result next time.
18 • TURNING NUMBERS INTO KNOWLEDGE
26
5 19
PART I : THINGS TO KNOW • 19
T H E B OT TO M L I N E
The Cycle of Action reminds us that making decisions and taking action rely onchoices about which data to ignore and which to address explicitly. It also illus-trates that unknown and unknowable data, as well as experience, intuition, andassumptions, affect every choice. No decision is immune from these facts, andyou would do well to keep them in mind.
Time constraints can influence all the steps in the Cycle of Action. Rarely dodecision makers have enough time to evaluate all the options, so they rely onjudgment and ideology to help them assess a situation. Execution of plans alsooccurs in a time-constrained environment because other people and institutionsare making changes that can negate the beneficial effects of your own changes,creating pressure to act quickly.
Refer to the Cycle of Action whenever your choices make events go awry. Itcan be applied to most decisions in your life, from those about what clothing towear to those about which college to attend. Systematic assessment of how youuse information to make decisions will help you do better in the future.
Hold
Buy
Sell
Sell
Hold
Buy
100%
80%
60%
40%
20%
0%1983 1998
FIGURE 3.4. Percentage of “buy,” “sell,” and “hold” stockrecommendations by U.S. analysts in 1983 and 1998
source: Laderman, Jeffrey M. 1998. “Wall Street’s Spin Game: Stock Analysts Often Have a Hidden Agenda.” In Business Week. October 5. pp. 148-156.
20 • TURNING NUMBERS INTO KNOWLEDGE
C O N C L U S I O N S
The collection and use of data are human endeavors and, as such, are subject toall the vagaries of individual and institutional behavior. At any point in theCycle of Action, human frailties can change the course of events. This realiza-tion should not inspire fear or resignation. Rather, you should refer back to thecomplete Cycle of Action in Figure 3.5 whenever you want to improve your useof information or to explain how a decision-making process broke down in aparticular instance. Identify which parts of this cycle were the result of yourown choices, those of others, or external events. Such a systematic assessmentcan help you use information more skillfully and make better decisions in thefuture. Fig.3.5hereCart2here(Calvin&Hobbes)
Developing an intention toact (to achieve the goals)
Formulating the sequence ofactions that you plan to undertake
Executing the actionsequence
Evaluating theinterpretation and
comparing with your goals
Interpreting the perception
Perceiving the stateof the external world
What you wantto happen
GOALS
EV
AL
UA
TIO
NEX
EC
UT
ION
EVENTSIN THE
EXTERNALWORLD
FIGURE 3.5. The complete cycle of action in detail
source: Adapted from Norman, The Design of Everyday Things

PART I : THINGS TO KNOW • 21
It is not the critic who counts, not the man who points out how thestrong man stumbled, or where the doer of deeds could have donethem better. The credit belongs to the man who is actually in thearena; whose face is marred by dust and sweat and blood; who strivesvaliantly; who errs and comes short again and again; who knows thegreat enthusiasms, the great devotions, and spends himself in a wor-thy cause; who, at the best, knows in the end the triumph of highachievement; and who, at worst, if he fails, at least fails while daringgreatly, so that his place shall never be with those cold and timid soulswho know neither victory nor defeat.
— T H E O D O R E RO O S E V E LT
EXERCISE
Think about three decisions you made in the past week. Did your deci-sion process follow the Cycle of Action in all cases? Where did yourbiases affect the outcome? How did you decide what your goals were?Did you have enough time to interpret and evaluate your perceptionsof the external world before making the decision?
Science is a human process that advances in fits and starts. The end result ofthis process is generally something you can count on, but the intermediate stepsto this result do not advance in a linear progression as science textbooks mightlead you to believe (see Kuhn’s Structure of Scientific Revolutions). Under-standing the process by which scientific knowledge is created can help you bet-ter assess its implications and relevance to your own analysis.
Most people (especially nonscientists) don’t recognize the large role that intu-ition and instinct play in scientific discovery, particularly in the process of devel-oping hypotheses. A scientist’s desires for recognition and status, enthusiasm forsolving a problem, and attitudes towards authority are all motivations rootedin human needs and emotions.
These human inclinations all affect the progress of science, but the end resultof the scientific process is one that is rational to the core. Science has an inter-nal coherence and predictive power that is unique among human endeavors.Historian of science Gerald Holton identifies the “apparent contradictionbetween the seemingly illogical nature of actual personal discovery and the log-ical nature of well-developed scientific concepts.”17
This stark contrast between the messy business of scientific discovery and theend result, which is the most accurate description possible of how the physicalworld operates given current knowledge, comes about in part because of a processknown as “peer review.” It is important for nonscientists to understand how thisprocess works, because accurate peer review, more than any other part of thescientific process, determines whether a particular set of research results is credi-ble. For a detailed look at peer review, go to <http://en.wikipedia.org/wiki/peer_review>.
22
PEER REVIEW AND
SCIENTIFIC DISCOVERY
CHAPTER
4
PART I : THINGS TO KNOW • 23
T H E I M P O RTA N C E O F P E E R R E V I E W
The formal process of peer review is most often conducted for articles submit-ted to scholarly (“peer-reviewed”) journals or for research proposals submittedto funding agencies (such as the National Science Foundation). In journalreviews, the author submits the article to the editor, who then distributes thearticle to between one and four reviewers. The reviews are sometimes “blind”so that the reviewers don’t know the names of the authors and their affiliations(it is however often possible for knowledgeable reviewers to infer the identitiesof the authors from a paper’s citations and the authors’ approach in presentingthe results). More often, the authors’ names are known to the reviewer. Onlyrarely is the reviewer’s name revealed to the authors when comments are deliv-ered. Both the number of reviewers and whether the reviews are blind are at thediscretion of the journal editor.
Reviews of scientific project proposals are usually more formalized than arejournal reviews as befits a process upon which research funding depends di-rectly. In addition, some journals and most funding agencies require researchersto declare any potential conflicts of interest before the review process begins.
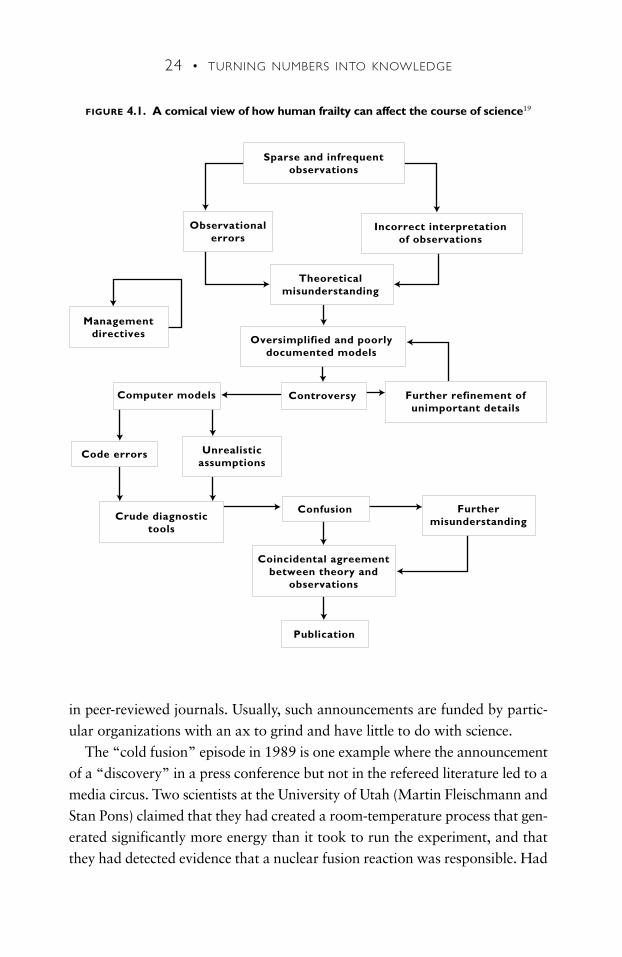
The purpose of peer review is to judge whether the work is based on principlesand judgments that represent the current scientific consensus. When such a con-sensus exists in a particular field, it reflects the paradigm accepted by scientists inthat field and gives practitioners a standard set of tools with which to evaluatenew ideas (see Kuhn’s Structure of Scientific Revolutions for more details). Whena paradigm is challenged by anomalous observations and experiments, a crisisensues. The crisis continues until a new paradigm emerges that encompasses theanomalous results. During periods of crisis (or in non-scientific fields) peer reviewis generally less reliable because the foundations upon which the reviewers judgeresearch results in the field are being questioned in fundamental ways.Fig
Adequate documentation is a pillar of the peer review process. Without it,scientists could not verify or reproduce results, and scientific progress wouldgrind to a halt. The best scientists are fanatical about documentation and youshould be also.
Peer review does not guarantee accuracy. In fact, papers containing major sci-entific blunders have been published in peer-reviewed journals.18 However, theformal peer review process makes it more likely that a paper will avoid majorflaws. Be skeptical of “research” results that are not peer reviewed. There aresome “scientists” who announce their results to the media but do not publish
33
24 • TURNING NUMBERS INTO KNOWLEDGE
in peer-reviewed journals. Usually, such announcements are funded by partic-ular organizations with an ax to grind and have little to do with science.
The “cold fusion” episode in 1989 is one example where the announcementof a “discovery” in a press conference but not in the refereed literature led to amedia circus. Two scientists at the University of Utah (Martin Fleischmann andStan Pons) claimed that they had created a room-temperature process that gen-erated significantly more energy than it took to run the experiment, and thatthey had detected evidence that a nuclear fusion reaction was responsible. Had
Sparse and infrequentobservations
Observationalerrors
Incorrect interpretationof observations
Theoreticalmisunderstanding
Managementdirectives Oversimplified and poorly
documented models
Controversy Further refinement ofunimportant details
Computer models
Code errors Unrealisticassumptions
Crude diagnostictools
Confusion
Coincidental agreementbetween theory and
observations
Furthermisunderstanding
Publication
FIGURE 4.1. A comical view of how human frailty can affect the course of science19
PART I : THINGS TO KNOW • 25
the press been more skeptical of a research result announced only in a press con-ference, its pronouncements might have been more cautious. Instead, the claimof limitless cheap energy resounded loudly around the world, only to fall to theground with a sickening “thud” when experiments by other scientists failed tocorroborate the results.
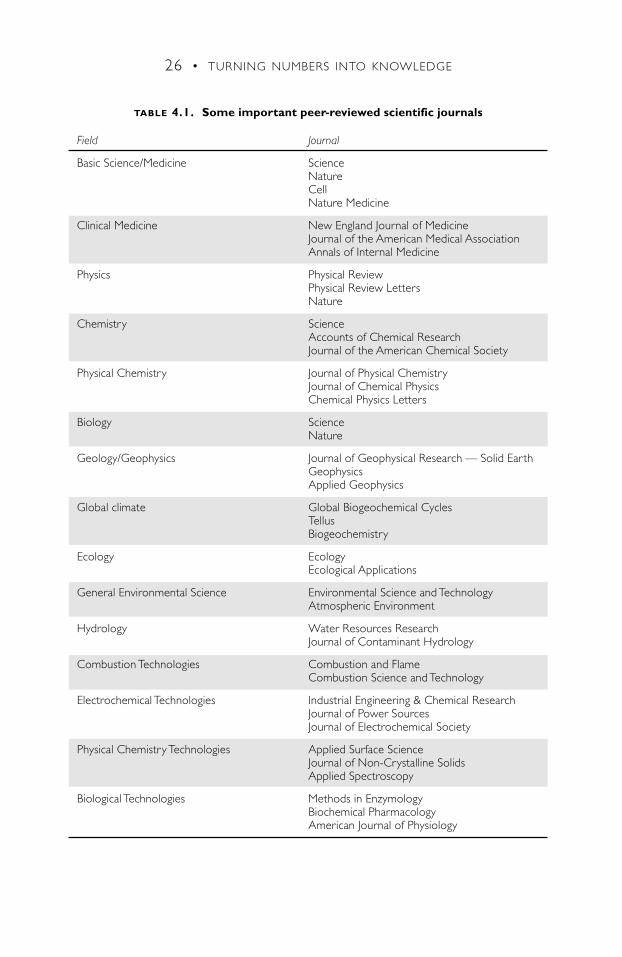
How can you tell if a scientific study has been peer reviewed? Table 4.1 listssome important peer-reviewed journals for key scientific fields. If the study ispublished in one of these journals, it’s passed the first hurdle of basic scientificcredibility. For a long (but still probably incomplete) list of peer-reviewed jour-nals, check out <http://adswww.harvard.edu/abs_doc/refereed.html>. For aranking of the importance of different journals in virtually all scientific fields,see the Science Citation Index, put out annually by the Institute for ScientificInformation or ISI <http://www.isinet.com>. These rankings are based on thenumber of citations to papers in a given journal by the scientists in that field, sothey are a relatively objective measure of journal quality (although no index isperfect and this one is no exception, as Wikipedia points out: <http://en.wikipedia.org/wiki/impact_factor>). In its electronic database, ISI’s web sitealso has a large searchable list of journals, as well as other related products.
S C I E N T I F I C R E A S O N I N G
There are two kinds of reasoning accepted in scientific research. The first, basedon deductive logic, relies on assumptions and general principles to derive impli-cations and predictions of specific events.20 If I leave my bicycle outside and itrains, I deduce from my experience and the laws of chemistry that parts of thebicycle will rust. Deductive inferences rely on a set of initial assumptions(“axioms”), which are analyzed using rules of logic. If the initial assumptionsare correct, the rules of logic are followed, and no logical contradictions arisein the analysis, then the conclusions must be correct.Table4.1here
The second kind of reasoning–inductive logic, on which many inferences inscience and other forms of human endeavors are based–relies on compilationsof specific instances to infer general laws from the specifics (see Hughes,Critical Thinking). If I leave my bicycle unlocked outside for a hundred days andit is never stolen, I could use inductive reasoning to infer that it will not be stolentomorrow, but I cannot be sure. I can only say that it is unlikely to be stolen,
11
26 • TURNING NUMBERS INTO KNOWLEDGE
TABLE 4.1. Some important peer-reviewed scientific journals
Field Journal
Basic Science/Medicine ScienceNatureCellNature Medicine
Clinical Medicine New England Journal of MedicineJournal of the American Medical AssociationAnnals of Internal Medicine
Physics Physical ReviewPhysical Review LettersNature
Chemistry ScienceAccounts of Chemical ResearchJournal of the American Chemical Society
Physical Chemistry Journal of Physical ChemistryJournal of Chemical PhysicsChemical Physics Letters
Biology ScienceNature
Geology/Geophysics Journal of Geophysical Research — Solid EarthGeophysicsApplied Geophysics
Global climate Global Biogeochemical CyclesTellusBiogeochemistry
Ecology EcologyEcological Applications
General Environmental Science Environmental Science and TechnologyAtmospheric Environment
Hydrology Water Resources ResearchJournal of Contaminant Hydrology
Combustion Technologies Combustion and FlameCombustion Science and Technology
Electrochemical Technologies Industrial Engineering & Chemical ResearchJournal of Power SourcesJournal of Electrochemical Society
Physical Chemistry Technologies Applied Surface ScienceJournal of Non-Crystalline SolidsApplied Spectroscopy
Biological Technologies Methods in EnzymologyBiochemical PharmacologyAmerican Journal of Physiology
based on my extrapolation of past experience. Inductive reasoning is less certainthan deductive logic (in rare instances it can be as certain, but never more so).
The Encyclopedia of Philosophy defines inductive argument to include “allcases of nondemonstrative argument, in which the truth of the premises, whilenot entailing the truth of the conclusion, purports to be a good reason for beliefin it.”21 In plain English, an inductive argument shows that the conclusion ishighly probable but not demonstrably true in the same way that a correctdeductive argument is. Induction is the link between mathematics, deductivelogic, and our experience of the physical world.
Deduction by itself is impotent because it depends only on assumptions andits own internal logic. Without induction to enrich the set of data and assump-tions upon which deductions can be based, the world of deduction would be aspare one, indeed. When inductive reasoning was first formalized, the goal of itsdevotees was to show that its results were demonstrably true, in the same wayconclusions based on deductive reasoning were true. According to theEncyclopedia of Philosophy, “not until the end of the 19th Century did a moremodest conception of inductive argument and scientific method, directedtoward acquiring probability rather than certainty, begin to prevail.” 22
The limitations of induction are offset in part by the peer review process.Outside reviewers uncover errors of fact, logic, and omission, and report themto the authors and the journal. Obvious errors are weeded out quickly whilemore fundamental flaws may take years, decades, or even centuries to be uncov-ered. Eventually, though, even these errors will be discovered as scientistsattempt to build on previous work. Serious flaws will result in logical inconsis-tencies (discovered through deduction) that will inevitably surface and becorrected.
T H E S C I E N T I F I C O U T L O O K
The physicist Alan Sokal points out that science is predicated on two key attitudes:
• being willing to accept what you find; and
• being willing to discover that you are wrong.
Human nature being what it is, these two attitudes are rare. Next time you find
PART I : THINGS TO KNOW • 27
11
yourself resisting a new idea, take a deep breath and try to see the other pointof view. Ask yourself why this idea might make you uncomfortable (often it’sbecause it clashes with your ideology). If you can step back from a situation inthis way, you will have achieved what I like to call the true “scientific outlook.”
C O N C L U S I O N S
Science and technology are a critical part of modern life. You owe it to yourselfto understand at least the basics of how scientific knowledge is created andused.
Remember always that science is a human endeavor. Learn about the processso you can better appreciate how to interpret scientific findings. Finally, alwaysgive more weight to peer-reviewed research than to results announced solely inthe media.
28 • TURNING NUMBERS INTO KNOWLEDGE
EXERCISE
Find a newspaper story summarizing a scientific study that interests you.Find out where the author of the study works. Who funded theresearch? What’s the name of the journal in which the research wasoriginally published? Is it a refereed journal? Send for the report andcompare it to the newspaper article’s summary of its conclusions. Is thenewspaper summary accurate?
5
The supreme task . . . is to arrive at those universal elementary lawsfrom which the cosmos can be built up by pure deduction.There is nological path to these laws; only intuition, resting on sympathetic under-standing of experience, can reach them. — A L B E RT E I N S T E I N

29
Few people are so brilliant that they need never prepare, and even they woulddo far better with a little work beforehand. Preparation is one of the founda-tions for success in any field. The six short chapters in this section describeimportant preparation that any good analyst should consider. Prepare well, andyou’ll never regret it.
BE PREPARED
PART
II
If I had eight hours to cut down a tree, I’d spend six hours sharpeningmy ax. — A B R A H A M L I N C O L N
31
Anyone who states that ideology has no effect on decisions is lying,deluded, or woefully ill-informed. Everyone has an ideology whether explicit ornot. Ideology provides a simplified model of the world that reflects our values,biases, and experiences. It helps people make decisions in the face of imperfectknowledge.
Anton Flew’s Dictionary of Philosophy defines ideology as “any system ofideas and norms directing political and social action,” indicating the key role itplays in mediating between ideas and choices. Ideologies are often explicitlypolitical (libertarian, conservative, liberal) but may also relate to preferencesabout material things.
Even technical subjects can be affected by ideology. In late summer 1997, cer-tain hackers with a libertarian ideology actually protected a recently releasedversion of the Apple Macintosh operating system from being illegally copied(even booby trapping or removing copies from public newsgroups) because theywanted to strike a blow against Microsoft, one of the dominant companies inthe computer industry.
Computer users each see themselves in ways that reflect their ideologies.Apple Macintosh users, for example, often see themselves as going against theconventional wisdom–resisting the crowd mentality by choosing a computerthey regard as technically superior (in the late 1990s, Apple fed that perceptionin its advertising, associating, for example, Albert Einstein’s unconventionalbrilliance with its products). Microsoft Windows users, on the other hand,stereotypically see themselves as realists who are adopting the standard becausethey perceive its complete dominance to be inevitable, because they believe it ischeaper, because they value the greater availability of software for Windows, orbecause they are forced to use it at work.
Ideology is one connection between the world of ideas and the world ofchoices. It impinges upon the Cycle of Action in the assessment of unknown or
EXPLORE YOUR IDEOLOGY
CHAPTER
5
3
unknowable aspects of events and in the collection and interpretation of datafor events that can be measured. Ideology guides the assumptions and valuechoices you make in the course of any analysis, and it can be particularly help-ful (or particularly misleading) in situations where your knowledge is limited.
There’s no guarantee that your ideology, which has been developed in an iter-ative process between your predispositions and your experience, will work wellin the future even if it’s worked well in the past. That’s why ideologies thatmaintain their relevance over time must allow for adaptation and evolutionwhen confronted with new data and experience.
My own ideology, based on reason, pragmatism, environmental conscious-ness, and social responsibility, has not changed much during the past twodecades. One core part of this ideology is, in the physicist Alan Sokal’s words,“a respect for evidence and logic, and for the incessant confrontation of theo-ries with the real world.”23 My ideology is constantly challenged by friends whofind my rock-solid belief in reason distasteful, but thus far I have not been con-vinced to modify that part of my ideology in a significant way. Over the years,I have changed positions on particular issues, but my core belief in logic and evi-dence has never wavered.
The ideology held by an individual can change radically over the course of alifetime. Eldridge Cleaver, one of the original Black Panthers in the 1960s,became a conservative Republican as he grew older. Such shifts can be triggeredby a watershed event, or can happen gradually as a person’s experience affectshis or her outlook.
It is essential to think through your ideology so that it will be consistent. Youcan check its external consistency by examining how its assumptions and con-clusions stack up against facts you know for sure. Sometimes there is no way tocheck external consistency, and we say in this case that the assumptions behindthe ideology are not falsifiable, testable, or provable. We can always test inter-
nal consistency, however. If there are internal inconsistencies, we know there’ssomething wrong.
To help think about your ideology, ask yourself these questions:24
• Where do you get your information?
• Whom do you trust? Why do you trust them?
• With whose opinions do you normally agree? Do you agree with all their
32 • TURNING NUMBERS INTO KNOWLEDGE
19

opinions? Why do you agree? Do you believe in their values or do youtrust their judgment?
• To whom do you give the benefit of the doubt? Why?
• Are there events that outrage you? Why do they make you mad?
• What motivates you to work hard? From where did those motivationscome?
• Could one part of your ideology lead you to take actions that would beinconsistent with another part of your ideology?
Ideology is the filter through which you view the world. By exploring yourown body of beliefs, you can more reliably make choices that are consistentwith your values, and you will also be better prepared to use numbers respon-sibly and effectively in your analyses, writing, and presentations.
PART II : BE PREPARED • 33
EXERCISE
After you’ve asked yourself the questions above about your own ide-ology and distilled the answers into a coherent credo, try to answer thesame questions for a few people whose ideology is quite different fromyour own (or ask them the questions directly!).This may help you under-stand them better, which is the first step toward true communication.
Only the supremely wise and the ignorant do not alter.— C O N F U C I U S
Many people garner high scores on standardized tests but are unable toapply themselves in a way that gives results. Raw intelligence is the ability tothink quickly and accurately; useful intelligence is raw intelligence as enhancedby hard work, common sense, instinct, experience, discipline, and organization.A person of moderate raw intelligence who possesses high useful intelligencewill virtually always be more productive than a brilliant person who lacks thepersonality traits needed to make that brilliance useful in the world.
Organization is the single most important factor in creating useful intelli-gence, and it is a learned skill. By consciously becoming more organized, youcan substantially increase your effectiveness in virtually any endeavor.
Julie Morgenstern, in her book Organizing from the Inside Out, givessound and practical advice for getting organized. By following her systematicapproach for assessing your goals and analyzing your current state of disorder,you can begin to get control of the chaos. After you’ve used Morgenstern’stricks and tips for assessing and addressing the situation, you can take the fol-lowing additional steps to achieve effective personal organization:
• Control information flows: Decide which information streams are relevantand which are detrimental to your professional effectiveness. Cancel mag-azine and newspaper subscriptions except those you use regularly. Limityour use of the World Wide Web to get news updates–with few excep-tions, checking more than once a day is a waste of time and effort. Setaside specific times to answer mail and email (there’s usually no need torespond to emails as they arrive). Recycle junk mail without opening it.
• Buy a paper or electronic organizer: Track to-do tasks, appointments,addresses, phone numbers, and notes in an orderly way. Get rid of themyriad slips of paper that confuse and confound.
A trick I recently discovered to keep track more effectively of to-do tasks
34
GET ORGANIZED
CHAPTER
6

is to create a blank page with different types of actions (like “call,” “do,”“email,” “fax,” “investigate,” “find,” “visit”) and to write down your tasksunder the appropriate category (see Figure 6.1). This approach immediatelycreates a task-oriented hierarchy that helps you prioritize. I keep separatepages like this for work and home to-do tasks. If things are really busy, youcan even keep separate pages for different projects.
• Clean your office: Throw out extraneous stuff and store rarely used books.Make frequently used materials easily accessible. Keep only current workon your desk and put other materials in drawers and filing cabinets.Identify those items that are important to you and make them accessible.Morgenstern says “keep what you use and what you love. Toss the rest.”Spend fifteen minutes at the end of each day to tidy up your office, so youcan start fresh in the morning.
• Develop a filing system: Filing is for retrieval, not storage. Create a filingsystem that helps you (or others) retrieve stored information in a timelyfashion. If you can’t find an article or electronic file, it’s worse than uselessbecause you waste time looking for it. Be selective about the items you file.
• Take time to reflect: Make sure you give yourself at least a half-hour perday of solid thinking time, with no interruptions. Unplug the phone andturn off the radio.
• Prioritize tasks and focus on the essential: Too often, our days are con-sumed by “urgent tasks that are not important.” For at least part of theday, focus on the “important tasks that are not urgent.”25
• Document, document, document: Documentation creates a trail for youand others to follow after the fact. It is essential to any intellectual work,but is often neglected. By making it a priority, you ensure that your intel-lectual contribution will remain important and useful for years to come.
You have control over each of these steps. Do them, and you’ll make the mostof every opportunity. Avoid them, and you’ll never be as effective as you couldbe. Even the most creative people, who often view organization as inimical totheir personal style, would benefit greatly from making it part of their dailyroutine.
PART II : BE PREPARED • 35
7
21
10
33

36 • TURNING NUMBERS INTO KNOWLEDGE
EXERCISE
Think of three important goals in your life that you were unable toachieve because you were disorganized. Remember those missedopportunities when you feel overwhelmed by the clutter, and use thoseexamples to motivate your cleanup.
EXERCISE
Copy the example to-do list (Figure 6.1) and give it a try in your dailylife. Alternatively, create a similar list that more closely reflects yourneeds.
In human endeavor, chance favors the prepared mind.— L O U I S PA S T E U R

FIGURE 6.1. An Example Task List
Do Date Due
Get Date Due
Find Date Due
Investigate Date Due
Delegate Date Due
Arrange Date Due
Call Date Due
Give/Deliver Date Due
Email/Search on Web Date Due
Fax Date Due
Mail Date Due
Talk to/Visit Date Due
A key part of being organized is creating a filing system that helps youretrieve stored information in a timely fashion. Such a system is critical for bothprinted documents and (increasingly) computer files. If you can’t find a file, itdoesn’t matter if you have it or not, and looking for it distracts from other morevital tasks.
Be selective about the items you file. For years I clipped articles from news-papers on subjects in which I maintained an active interest, thinking that some-day I might write papers on those topics. In most cases I never did, and all thateffort was for naught. There was one example where the files came in handy fora research project, but I can only think of that one. I stopped clipping mostnewspaper articles years ago, but I still save a few articles and reports that I findparticularly valuable for current projects.
The futurist Peter Schwartz also gave up an elaborate filing system becausehe never used it. His approach is one to emulate: “I concentrate on educatingmyself; on passing information through my mind so it affects my outlook; ontuning my attention as if it were an instrument.” He recognizes that with thisapproach he may not be able to draw upon previously compiled materials, butthat can be a benefit in disguise: “Sometimes I must go back and re-create all theresearch I did several years before. But that, in itself, is valuable, because in thefields I care about, the facts have changed since I last went to look for them.”Moreover, he saves time by only filing those items most crucial to his work.26
Paper should pass through your hands only once on the way to the file, to therecycling bin, or to the outbox. You may never achieve this ideal in practice, butstrive for it and you will save time and be more effective.
Never clip anything you can easily find later, especially if you can search forit electronically. As more newspaper articles and reports have become availableon the Internet, my need for hard copy storage has decreased. Current eventsare well documented on the World Wide Web, and you need only call up one ofthe many competent search engines to get a nice listing of recent articles on par-
38
ESTABLISH A FILING SYSTEM
CHAPTER
7
9
ticular topics. Many newspapers even offer CD-ROMS or web retrieval of olderarticles, which makes clipping articles even less worthwhile. Such electronicretrieval sure beats clipping and filing articles! If you need to create your owndatabase of electronic clippings, there are many capable sheet scanners that willquickly and efficiently put these clippings on your computer.
All reports that my former group creates at Lawrence Berkeley National Lab-oratory are put on the World Wide Web, in a file format (Portable DocumentFormat, or PDF) that will allow all types of computers to read it (Adobe dis-tributes their Acrobat Reader Program for free to anyone who wants to down-load it, at <http://www.adobe.com/products/acrobat/readstep.html>). Otherscan then download these reports without the time and expense of having tosend the hard copies. I also don’t have to worry about where the copies of theprinted reports are–I can just call them up in my web browser and view them.Often this is easier than hunting around in the filing cabinet for an old report.To supplement this electronic storage, I organized by subject area three-ringbinders that contain our most recent reports, for ready reference.
Order files by active projects and by major subject areas. Also have file draw-ers for people, institutions, and for administrative issues. My “People” drawerholds files for particular individuals who work in my field (it is usually easier forme to remember who worked on a particular report than to remember the sub-ject heading where I filed that report–having a file for individuals gets aroundthat problem). The “Institutions” drawer is analogous to the People drawer.Create an archive for old projects that is in one of the less accessible filing cab-inets, and put the most widely used “active” files near your workspace. Makeyour electronic file structure mirror that of your hard copy files.
Allocate one part of a file drawer to “Travel and events” and create one filefolder per trip or event, with destinations and dates clearly marked on each tab.Keep financial, logistical, and substantive information for each event in thesefolders. Order them chronologically and save them for a long time. Years later,you may need to know details of a certain event for tax or other purposes.
A key trick to making any filing system work is to go through your files peri-odically to familiarize yourself with where things are. This occasional sortingwill give you the opportunity to discard archaic materials and refile items thatbelong somewhere else. No filing system is ever finished. Periodic sorting helpskeep your system current and useful.
The process of developing a filing system will teach you something about yourwork. To create such a system, you will need to analyze and categorize the kinds
PART II : BE PREPARED • 39
38
of work that you do, and you will surely learn something from this effort. Youwill also need to think carefully about the kind of information you most oftenretrieve from your files. If others must also be able to access your filing system,you might adopt a slightly different organization than if you are the only user.
In a World Wide Web browser like Mozilla Firefox, Safari, or Microsoft Ex-plorer, it is easy to record “bookmarks” for sites that you frequently visit. It’simportant to organize these well, so create a structure that parallels your hard-copy and electronic filing systems. These bookmarks are crucial to fast infor-mation retrieval.
Computerized reference databases like EndNote can make any filing systemmore effective. Each report is one entry in the database, and it is a trivial matterto add a sentence in the notes section of each reference entry that indicates the filedrawer in which the hard copy is stored. These databases can be searched elec-tronically, which can be a godsend when you’re looking for a crucial report.
To preserve access to your stored articles and papers, DON’T lend them outto others unless this lending is recorded in a notebook or computer file devotedto this chore. I routinely reach for a document on my shelves only to find thatsomeone has borrowed it. Such a written record can help you track down miss-ing reports when this happens.
Most people borrow reports and then forget they have them. You shouldinsist that someone borrowing a report copy the relevant pages (obeying copy-right laws, of course) and return it to you promptly. This insistence will save youprecious hours in the long run.
There’s nothing remarkable about it. All one has to do is hit the rightkeys at the right time and the instrument plays itself.
— J O H A N N S E B A S T I A N B AC H
40 • TURNING NUMBERS INTO KNOWLEDGE
EXERCISE
List major topic areas for your current work. Compare these topics tothe headings of your filing system. How well do they match up? Do thesame comparison for your computer files, electronic folders, and book-marks saved in your web browser. Is it time to reorganize things?

41
A problem solver needs a toolbox as much as a machinist needs a lathe. Mytoolbox contains tricks and techniques for efficient and effective problem solv-ing. Each person’s toolbox is a product of education and experience—it growsand evolves over time.
No toolbox is ever complete because every problem has its own unexpectedsubtleties; the toolbox that worked for past problems may need to be updatedto face new challenges. The learning process never ends.
L A N G UAG E
Each field has its own language. You must at least develop working familiaritywith basic concepts in a given field before attempting to decipher a problem. Ifyou are delving into a field for the first time, obtain a textbook and begin yourreading there. Textbooks conveniently summarize the core information in agiven field and usually provide a nice glossary and lists of further references.Another good place to begin is the list of frequently asked questions (FAQs) ona particular topic that is available on the Internet for virtually any issue you canname <http://www.faqs.org>. Talk to people you trust who know somethingabout the topic because they can often point you to the best reference sourcesand save you time.
C A L C U L AT I O N S
An important part of any analyst’s toolbox is the ability to create simple back-of-the-envelope calculations at a moment’s notice, using approximations andmemorized data. Such calculations are a quick way to check the quantitativeassertions of others and are invaluable in both business and science.
BUILD A TOOLBOX
CHAPTER
8
23
29
Part I

Darrell Huff’s book, The Complete How to Figure It, is a beautiful compi-lation of hundreds of ways to calculate numbers important to daily life. Huff isthe fellow who blessed the world with the book How to Lie with Statistics.Some of the major headings in the book, just to give you a flavor, are as follows:
Lifetime money strategySome personal things (like life expectancy)Interest and savingInvestingOther people’s moneyHouse planningBuilding things (like additions to your house)Your carTravelConversions
The book is chock-full of specific examples (more than 350!) that you can copywhen doing your own calculations. I recommend adding it to your toolbox.
Another nice source of math techniques is a book written by Clifford Swartzcalled Used Math. It is more advanced than Huff’s book, and summarizes thebasics of calculus and other essential mathematical tools, mainly for students ofscience. If you find yourself needing to refresh your knowledge of moreadvanced math, this book is a great place to start.
For an accessible and entertaining book about statistics, try Larry Gonickand Woollcott Smith’s The Cartoon Guide to Statistics. Don’t let its title foolyou. It’s a solid introduction to statistical concepts and methods.
C A L C U L AT I O N A L C O M P U T E R TO O L S
To investigate any particular software package, I recommend that you browsein your local bookstore. Writing computer books has become a cottage indus-try, and within weeks of the release of new software a book appears on theshelves to assist you with its use.
Spreadsheets and databases are the two most common computer tools usedfor calculations. The first spreadsheet was VisiCalc, which was created in the
42 • TURNING NUMBERS INTO KNOWLEDGE
late 1970s and was a great innovation compared to the programming languagesthat had been commonly used for business applications before that. I usespreadsheets every day. They are fine for simple analyses and powerful enoughfor moderately complex modeling tasks. They are also handy for graphingresults and creating formatted tables for reports.
Databases are useful when you have large amounts of data that all have thesame format. For example, if you have a mailing list of three hundred names,with addresses, phone numbers, and email addresses, a database is the right toolfor organizing it. A database will allow you to export the data in any format.You may want names and addresses in one case, but names and email addressesin another. Once entered into the database, you can extract them any way youwant. Spreadsheets can often serve as simple databases as well.
A more advanced set of tools is available for statistical analysis of data. Thesesoftware packages can be quite expensive and are generally for expert use only.They are worth investigating if you need the horsepower and have the knowl-edge to use them effectively. They can help you divine relationships between fac-tors that are related in a complex way. Many of these complex analysis func-tions are also available in spreadsheets, which can be useful for such analysis ifthe data sets aren’t too large and the number of variables to analyze is small.
PART II : BE PREPARED • 43
28
EXERCISE
Browse through the computer help section at the bookstore and readabout software you don’t currently use. Think about a problem thatyou’re wrestling with now, and see if there’s a way to apply some ofthese unfamiliar tools to solve it.
Applying computer technology is simply finding the right wrench topound in the correct screw. — A N O N Y M O U S

My college buddies used to object to my tactics in our numerous discus-sions about public affairs because I would be the first to pull out a referencebook to check their sometimes wild assertions.27 While your friends may alsothink it unfair, your discussions will be far more fruitful.
G E N E R A L
The single most important document for a U.S.-based researcher in virtually anyquantitative field is the Statistical Abstract of the U.S. It is available every yearfrom the U.S. Superintendent of Documents and other sources for around $40.You can also buy a CD-ROM with all the Statistical Abstract’s tables in elec-tronic form or you can download those data for free from the web. It’s a treas-ure trove, containing about 1,500 tables summarizing everything from air pol-lutant emissions to population, average temperatures to voter registration, andhunting licenses to federal budget outlays. The CD-ROM version is especiallynice because it allows easy access to tables in spreadsheet format, giving you ahead start on your analysis.
The Statistical Abstract is the best source for items (such as population andeconomic activity) needed to normalize any data you get from other sources (forexample, absolute growth in cement production over time is not easily under-standable until you normalize it on a per capita or per dollar of GDP basis). Italso contains the latest information on inflation over time, for use in convertingany current dollar statistics to constant (inflation-adjusted) dollars. The data aretaken from a variety of sources and are carefully documented. The footnotes tothe tables will give you leads on sources that you never knew existed. The
44
PUT FACTS AT YOUR FINGERTIPS
CHAPTER
9
27
33
Statistical Abstract is a great place to start any investigation, and you shouldhave a recent electronic or hard copy version available at all times. Alllibraries will have the latest one. To order The Statistical Abstract or to down-load tables from it go to <http://www.census.gov/compendia/statab/>.
A companion to the Statistical Abstract is a good almanac. Although somedata in these two sources overlap, the almanac contains many useful items thatThe Statistical Abstract doesn’t have, such as zip codes, postal rates, tax rates, his-torical events, sociopolitical facts about states and countries, and other infor-mation that you didn’t know you really needed (but you really do). There aremany almanacs; the one I have is The World Almanac and Book of Facts <http://www.worldalmanac.com>. Time Magazine, The New York Times, and The
Wall Street Journal also publish almanacs, some of which are more specializedthan others. An almanac of some kind will be available in any bookstore orlibrary, or you can access the Information Please Almanac on the web at <http://www.infoplease.com/>.
Many newspapers and magazines offer searchable archives of past issues onthe web or on CD-ROM. Using such archives makes initial research on newtopics relatively easy. The New York Times, for example, allows web readers tosearch the past 150+ years of archived articles and to see the results of thesearch in summary form <http://www.nytimes.com>. Many public libraries offeraccess to similar CD-ROMS and on-line databases, so check your local librarybefore buying.
Another excellent source of data is a book by Mary Blocksma called Reading
the Numbers. This book summarizes the meaning of numbers we encounter ineveryday life, like the codes found on the side of tires or the conventions usedin describing fluorescent light bulbs. It is unfortunately out of print but can beobtained at used bookstores, <http://www.alibris.com>, and some libraries.
A similar book that is more readily available is Andrea Sutcliffe’s Numbers:
How Many, How Long, How Far, How Much. The variety of data containedin this book is truly astounding. In one section there are estimates of safe foodstorage times in the refrigerator and freezer, and in another there is a list of thenumber of different types of instruments in a typical symphony orchestra. Themajor sections include money, food and nutrition, health, travel, daily life,transportation, time, weather, people and places, the universe, conversion
PART II : BE PREPARED • 45
tables, and everyday math. The book contains more than 600 pages of data,and it’s well worth having on your shelf.
Worldwatch, in Vital Signs 2007–2008, presents essential information relatedto resource consumption and environmental effects around the world. Thesedata include pollutant emissions, freshwater resources, land use, population andhealth, food and agriculture, wildlife and habitat, energy, atmosphere and cli-mate, and policies and institutions. The data in Vital Signs are also available elec-tronically from the Worldwatch Institute <http://www.worldwatch.org>.
W E B / I N T E R N E T DATA
More data appear on the Internet every day. It is an impossible task to reportthe latest developments in a book like this one (things change too quickly), butthere are a few key sites of which you should be aware. All URLs and changesto them can be found at <http://www.numbersintoknowledge.com>.
• The Library of Congress site <www.loc.gov> is an invaluable source. Youcan search the library’s databases with little effort. Many local librarieshave also placed their catalogs on the Internet, which can save you a tripnext time you want to do research.
• The U.S. Bureau of the Census site <http://www.census.gov> is beautifullydesigned and is a treasure trove of social, demographic, and economicdata. You can search by key word, by place, by clicking on maps, and inmany other ways. Most of the data on this site are free or available atnominal cost. This site also houses the on-line version of the StatisticalAbstract of the U.S. <http://www.census.gov/compendia/statab/>.
• The National Technical Information Service (NTIS) is still, as of this writ-ing, the official source of many U.S. government reports. NTIS sells almostthree million titles, and you can search on its nicely designed web site<http://www.ntis.gov> to find the one you want.
• The U.S. Department of Energy’s Energy Information Administration site<http://www.eia.doe.gov> is the right place to find energy and some envi-ronmental data for the U.S. The site also has limited information on cer-tain international topics, such as nuclear power or energy use in other
46 • TURNING NUMBERS INTO KNOWLEDGE
countries. Most of the data on this site are free or available at nominalcost.
• The U.S. Environmental Protection Agency’s site <http://www.epa.gov>contains huge quantities of environmental data, as well as access to theEPA’s reports.
• The Fed Stats site is a treasure trove for U.S. economic and other data<http://www.fedstats.gov>. It allows easy access via the World Wide Webto data from more than 50 federal agencies.
• The Economagic web site, which has both U.S. and international eco-nomic data, is located at <http://www.economagic.com>. This site claimsto offer access to 200,000 data files (many of them for free), with specialservices for subscribers (fees for subscribers range from small to moderatedepending on the level of service).
• The National Center for Health Statistics site <http://www.cdc.gov/nchs>contains data and reports on U.S. health that can be downloaded for free.
• The U.S. Geological Survey produces a superb on-line atlas for the UnitedStates, which can be found at <http://www.nationalatlas.gov>. This siteallows the user to map standard political boundaries, identify the locationsof airports and dams, and overlay the routes of roads and railroads. It alsocontains maps of Super-fund sites, air pollution emissions, mining opera-tions, industrial facilities, and selected data from the U.S. Census.
• Frequently Asked Questions (FAQs) exist on the Internet for almost anytopic <http://www.faqs.org>. Because these FAQs are compiled by expertsin each field, they are a great place to begin your inquiries. Use Internetsearch engines to find the FAQs that will help you most.
• There are hundreds of newsgroups on everything from Star Trek to sta-tistical analysis. By posting an email to the relevant newsgroup, you canoften get answers to questions from people all over the globe in a matterof hours or days. You can generally access these newsgroups using yourweb browser (consult your Internet service provider for details, or go to<http://groups.google.com>).
There’s a real art to searching for information on the Internet. Each differentsearch engine brings to you only a subset of the information actually available,so you’ll need to use several to be certain you’ve done a thorough search. For
PART II : BE PREPARED • 47
23
example, when I searched for the words “information overload” (in quotationmarks) on the Google search engine, it returned about two million items. WhenI used Ask.com, it returned about 560 thousand. Not all of the items on theGoogle list were in the Ask.com list, and vice versa. Skill is also involved in nar-rowing down your search so that you have at most dozens of documents to sortthrough, instead of the thousands or millions that these engines commonly pro-duce for you. Search engines try to rank their results by relevance, but the rank-ing algorithms also differ.
In recent years, Google has become the dominant search engine, followedby Yahoo and MSN. Also check out <http://dir.yahoo.com/Computers_and_Internet/Internet/World_Wide_Web/Searching_the_Web> or <http://www.searchenginewatch.com>, which give search strategies and details on specific searchengines. Each search engine uses different algorithms and syntax for defining asearch. It's worth mastering your favorite search engine's tricks so that you canfind information quickly and efficiently.
C O N T E X T
Sometimes in presenting the results of analysis, you’ll want to know the intel-lectual history behind a certain concept. For example, if you are giving a talkabout energy policy to a general audience, you might want to open with a briefsummary of how the concept of energy was developed and how our modernconception differs from that common in the 1800s. In this circumstance, twoessential works are The Encyclopedia of Philosophy and The Oxford English
Dictionary. The former is helpful in tracing the genesis of a particular conceptthrough the ages while the latter tracks the origins of particular words. Each ofthese sources can be useful in writing a speech or a paper and are both foundin most libraries.
An alternative to the conventional Encyclopedia of Philosophy is The Stanford
Encyclopedia of Philosophy, which is a web-based encyclopedia of comparablescope to the hard-copy version, on line at <http://plato.stanford.edu>. It is con-
48 • TURNING NUMBERS INTO KNOWLEDGE
stantly being updated and evaluated by its editorial board (they call it a dynamicencyclopedia). The creators of this new tool felt that the old way of creating anencyclopedia was too slow to capture the rapid developments in philosophicalthinking (particularly developments related to scientific concepts). For a moregeneral on-line encyclopedia, go to <http://www.wikipedia.org>.
A good book of quotations is essential to liven up your writing and presen-tations, and a standard dictionary and thesaurus will make your writing moreprecise. These are available in myriad incarnations in any bookstore. You canalso search Roget’s thesaurus at <http://humanities.uchicago.edu/forms_unrest/ROGET.html> or the Merriam Webster thesaurus at <http://www.m-w.com/thesaurus.htm>.
For many academic topics, excellent summaries of the current state ofresearch are contained in Annual Reviews. These reviews are published for 27different fields, including political science, public health, the environment, andthe physical and biological sciences. They are often the best place to start whenyou’re trying to learn about a new field.
C O N V E R S I O N FAC TO R S
For physical constants and conversions, there’s nothing better than The
Handbook of Chemistry and Physics. It comes out every year, but because phys-ical laws and constants rarely change even an old version of this work is handy.Pick one up at a used bookstore. Virtually all libraries have a copy of this bookon the shelf.
There are certain facts that I use frequently. For example, I often need to con-vert English units to metric units and vice versa. To help this process along, Imemorize the most commonly used conversions and keep the rest on a one-pagedata sheet for ready reference. I recommend compiling such a sheet for yourown use that contains the conversions most useful to your work. The hour orso of work needed to compile this page will be repaid many times over in theconvenience of not having to dig deeply into obscure reference books wheneveryou need to do a calculation. See Figure 9.1 for an example data sheet.
PART II : BE PREPARED • 49

50 • TURNING NUMBERS INTO KNOWLEDGE
EXERCISE
Compile a data sheet for your own use after thinking for a week or twoabout the numbers you use most frequently. Pass it around to your co-workers to get their suggestions. Print copies for them when you’redone, to share the wealth.
Data, Data, Data! I can’t make bricks without clay!— S H E R L O C K H O L M E S

FIGURE 9.1. Example Data SheetPhysical Constants and Conversions (underlined values are exact)
Reprinted with permission from J. P. Holdren, January 2000.
1 ton (t) = 1,000 kg = 2204.6 lb = 1.102 short ton * 1 lb = 453.6 g * 1 oz = 28.35 g1 atomic mass unit = 1.6606e-24 g * 1 grain = 6.480e-2 g * 1 carat (metric) = 0.20 g1 m = 3.281 ft = 39.37 in = 1e6 micron = 1e10 angstrom = 1e15 fermi * 1 in = 2.54 cm1 km = 0.6214 mi = 0.5400 naut mi * 1 ft = 0.3048 m * 1 parsec = 3.0857e16 m1 m2 = 10.76 ft2 = 1e28 barn * 1 km2 = 100 hectare (ha) = 247.1 acre = 0.3861 mi21 mi2 = 2.590 km2 = 640 acres * 1 ft2 = 929.03 cm2 * 1 in2 = 6.452 cm21 m3 = 999.97 liter = 35.31 ft3 = 264.2 gal * 1 ac-ft = 1233 m3 * 1 km3 = 0.2399 mi3(1 liter = 1 kg of H2O at 4 degrees C; density of H2O at this T is 0.99997 g/cm3.)1 cord = 128 ft3 = 3.625 m3 * 1 bushel = 3.524e-2 m3 * 1 Imp. gal = 4.546e-3 m31 m/s = 3.281 ft/s = 2.237 mph = 1.944 knots * 1 mph = 0.869 knots = 1.467 ft/s1 cfs = 0.0283 m3/s = 449 gpm = 724 ac-ft/yr * 1 m3/s = 35.3 cfs = 25.6e3 ac-ft/yr
1 J = 1e7 erg = 1 W-s = 6.241e18 eV = 0.7376 ft-lb * 1 Btu(IT) = 1055.1 J (InternatTable Btu&cal = 1.00067x thermo Btu&cal) * 1 cal(th) = 4.184 J, 1 cal(IT) = 4.187 J1 kWh = 3.6 MJ = 3412 Btu(IT) = 859.8 kcal(IT) = 1.341 hp-hr * 1 hp = 550 ft-lb/sec1 t TNT = 1e9 cal = 4.184e9 J (TNT explosive energy = 900-1100 cal/g)1 a.m.u. converted to energy = 1.492e-10 J * 1 quad = 1e15 Btu = 1.0551e18 J1 TW = 31.536 EJ/yr = 29.89 quads/yr = 14.12 Mbbl(US oil)/day = 1.076 Gt(UN coal)/yr
1 t coal equivalent (tce) [UN,WrldBnk,Shell] = 7,000 Mcal(IT) (low heat) = 29.31 GJ1 t oil equiv (toe) [BP,Shell] = 10,000 Mcal(IT) (low ht) = 41.87 GJ —> 5.7 GJ/bbl1 bbl crude oil [USDOE] = 5.8e6 Btu (IT, high heat) = 6.12 GJ —> 44.9 GJ/ton1 t crude oil [UN] = 1.454 tce = 42.6 GJ * 1 t crude oil = 7.33 bbl = 1.166 m31 bbl petroleum products [USDOE] = 5.48 MBtu = 5.78 GJ * 1 bbl gasoline = 5.54 GJ1 tce [BP] = 0.667 toe = 27.9 GJ = 26.5 MBtu * 1 t utility coal [DOE] = 24.76 GJ1,000 m3 natural gas [BP,WorldBnk] = 9,000 Mcal(IT) (low ht) = 37.68 GJ; [Shell] =9,500 Mcal(IT) (high heat) = 39.77 GJ; [UN] = 1.332 tce = 39.0 GJ * 1 t = 1,084 m31,000 ft3 nat’l gas [USDOE] = 1.028 MBtu -> 38.3 MJ/m3 * 1,000 kWhe [BP] = 0.25 toe= 10.47 GJ (low); [DOE] = 10.47 Mbtu (11.0 GJ) hydro, 11.02 Mbtu (11.6 GJ) nucl (high)1 t U3O8 @ 0.5% utilization = 336e3 GJ —> 30.3 GWh(e) if converted at 32.5%10 m3 water/sec x 10 m head = 0.98 MW * 1 t air-dried wood (1.39 m3) or dung = 15 GJ1 t charcoal = 29.3 GJ (produced @ 25% effic. in dirt kiln, 50% in masonry kiln)1 t crop wastes (20% moisture) = 13 GJ * 1,000 liter kerosene = 37.6 GJC02 emissions 25 kgC/GJ coal, 20 kgC/GJ oil, 15 kgC/GJ natural gas
1 newton (N) = 1e5 dynes = 0.2248 lb(force) * 1 pascal (Pa) = 1 N/m2 = 1e-5 bar1 atm = 101,325 Pa = 10.33 t(force)/m2 = 14.696 lb/in2 = 760 mm Hg (0 C) = 760 torr1 curie (Ci) = 3.7e10 dis/s = 3.7e10 becquerel (Bq) * 1 rad = 100 erg/g = 0.01 gray1 gray (Gy) = 1 J/kg * 1 roentgen (R) —> 2.58e-4 coulomb(+ or -)/kg dry airroentgen-equivalent-man (rem) = rads x quality factor * 1 sievert (Sv) = 100 rem
EARTH: R = 6357/6378(po/eq) km; A = 510.1e6 km2 (oc 361.3, ld 148.8, ice-free ld 133Asia 50.0, Africa 30.3, N. America 22.4, S. America 17.8, Oceania 8.5, Europe 4.9);M = 5.97e21 t (oc 1.4e18, ice 2.9e16, atm 5.2e15, lks/str 1.3e14, dry biom 1.8e12);E @ top of atm = 172,000 TW (surf 88,000, evap 41,000, wind 2,000, GPP 200, NPP 100)Highest elev = 8848 m; avg elevation = 840 m; deepest ocean = 11,000 m.1 degree of latitude = 111 km; 1 minute = 1.85 km. Solar constant = 1368 W/m2.
ATM: @ sea lvl 1.225 kg/m3, 288 K, mol wt 28.96, 2.55e19 molecules/cm3, sound speed331.4 m/s; percent by vol N2 78.09%, O2 20.95%, A 0.93%; ppm—CO2 340, Ne 18, He 5.2,CH4 2.9, Kr 1.1, N2O 0.5, CO 0.1, O3 0.01; atm water vapor & clouds 1.3e13 t.Heat cap of air = 1 J/g-K. Tropopause: h = 11 km, p = 0.23 atm, T = 217 K. Wet-airadiabatic lapse rate = 6.5 K/km, dry = 10 K/km. Viscosity = 1.8e-4 dyne-sec/cm2.
H2O: heat fusn = 79.7 cal/g; heat cap = 1 cal/g-K; heat vapn = 539.6 cal/g (100 C),584 cal/g (21 C), 597 cal/g (0 C). Ocn vol = 1.35e9 km3; avg depth = 3.7 km; mixedlayer depth = 80 m; sea wtr density (15 C) = 1.026 g/cm3, salinity = 35,000 ppm (Na10,500, Cl 19,000, S 885, C 28, N 15, Li 0.17, P 0.07, Fe 0.01, U 0.003, Au 0.00001)Viscosity = 0.01 dyne-sec/cm2.
g = 9.807 m/s2 * R = 8.3144 J/mole-K * N = 6.022e23/mole * c = 2.998e10 cm/sk = 1.3806e-23 J/K * s = 5.670e-8 W/m2-K4 * K = C + 273.15 * F = 1.8xC + 32AMU = 1.661e-27 kg = 931.5 MeV * e = 1.602e-19 coulomb * h = 6.626e-34 J-sec

Mr. Casals, you are 95 and the greatest cellist that ever lived,” a youngreporter commented. “Why do you still practice six hours a day?”Casals replied, “Because I think I’m making progress.”
Americans always seem to rush around. There’s never enough time to doeverything you want to do, see everyone you want to see, or travel everywhereyou want to go. In part, this busyness is an inherent part of modern-day life, butit is also partly self-imposed.
Your time is your life, and it is precious. If someone is wasting it, they arestealing it from you, and YOU are allowing that theft. Many people don’t thinkabout this equation, and they allow people and institutions to monopolize theirtime and sap their energy without commensurate rewards. You must manageyour time to reflect your priorities (no one else will do this for you).
The most articulate statement of this principle is found in Your Money or
Your Life. In this book, Joe Dominguez and Vicki Robin describe a set of sim-ple techniques to help people internalize this equation and make it part of theirdaily decision making. They encourage people to evaluate their spending by cal-culating how many hours of labor (“life energy”) will need to be spent for eachpurchase. The value of money becomes more real after you ask yourself two keyquestions:
• “Did I receive fulfillment, satisfaction, and value [from this purchase] inproportion to life energy spent?”
• “Is the expenditure of life energy on this purchase in alignment with myvalues and stated life purpose?”
52
VALUE YOUR TIME
CHAPTER
10
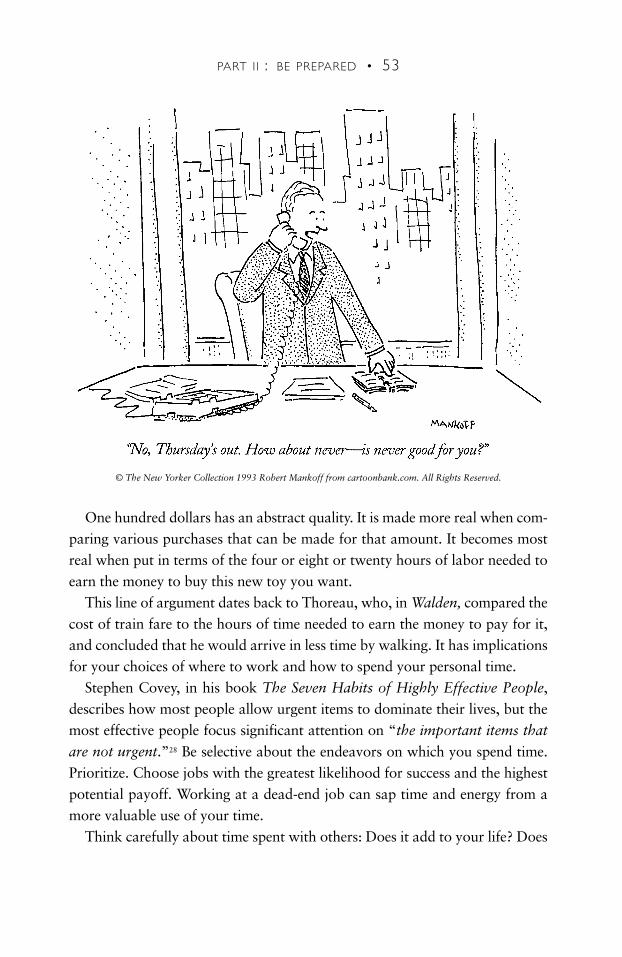
One hundred dollars has an abstract quality. It is made more real when com-paring various purchases that can be made for that amount. It becomes mostreal when put in terms of the four or eight or twenty hours of labor needed toearn the money to buy this new toy you want.
This line of argument dates back to Thoreau, who, in Walden, compared thecost of train fare to the hours of time needed to earn the money to pay for it,and concluded that he would arrive in less time by walking. It has implicationsfor your choices of where to work and how to spend your personal time.
Stephen Covey, in his book The Seven Habits of Highly Effective People,describes how most people allow urgent items to dominate their lives, but themost effective people focus significant attention on “the important items that
are not urgent.”28 Be selective about the endeavors on which you spend time.Prioritize. Choose jobs with the greatest likelihood for success and the highestpotential payoff. Working at a dead-end job can sap time and energy from amore valuable use of your time.
Think carefully about time spent with others: Does it add to your life? Does
PART II : BE PREPARED • 53
© The New Yorker Collection 1993 Robert Mankoff from cartoonbank.com. All Rights Reserved.
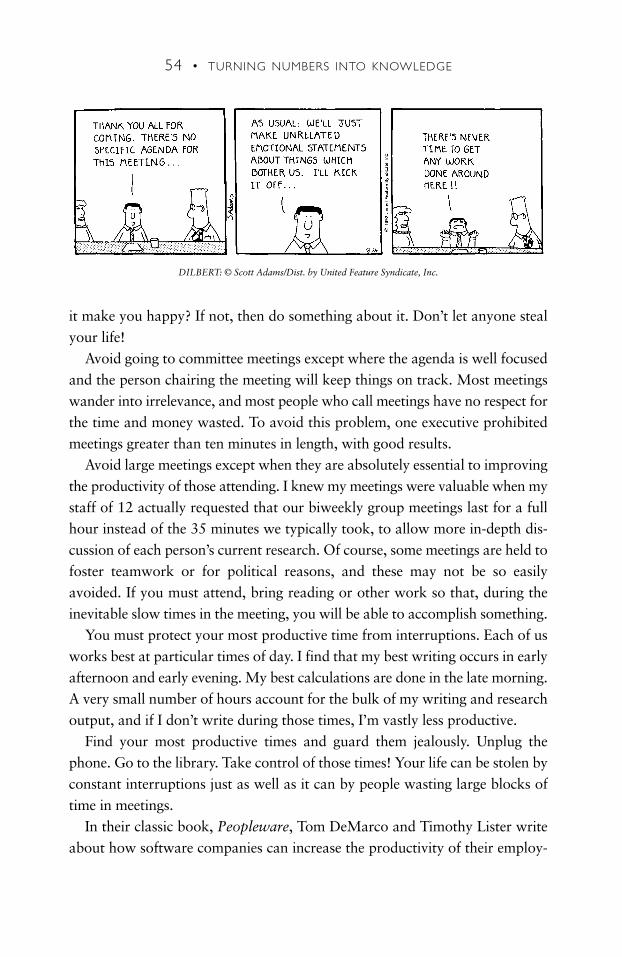
it make you happy? If not, then do something about it. Don’t let anyone stealyour life!Cartoon3(Mankoff)here
Avoid going to committee meetings except where the agenda is well focusedand the person chairing the meeting will keep things on track. Most meetingswander into irrelevance, and most people who call meetings have no respect forthe time and money wasted. To avoid this problem, one executive prohibitedmeetings greater than ten minutes in length, with good results.
Avoid large meetings except when they are absolutely essential to improvingthe productivity of those attending. I knew my meetings were valuable when mystaff of 12 actually requested that our biweekly group meetings last for a fullhour instead of the 35 minutes we typically took, to allow more in-depth dis-cussion of each person’s current research. Of course, some meetings are held tofoster teamwork or for political reasons, and these may not be so easilyavoided. If you must attend, bring reading or other work so that, during theinevitable slow times in the meeting, you will be able to accomplish something.
You must protect your most productive time from interruptions. Each of usworks best at particular times of day. I find that my best writing occurs in earlyafternoon and early evening. My best calculations are done in the late morning.A very small number of hours account for the bulk of my writing and researchoutput, and if I don’t write during those times, I’m vastly less productive.
Find your most productive times and guard them jealously. Unplug thephone. Go to the library. Take control of those times! Your life can be stolen byconstant interruptions just as well as it can by people wasting large blocks oftime in meetings.
In their classic book, Peopleware, Tom DeMarco and Timothy Lister writeabout how software companies can increase the productivity of their employ-
54 • TURNING NUMBERS INTO KNOWLEDGE
DILBERT: © Scott Adams/Dist. by United Feature Syndicate, Inc.

ees. Software designers are among the most creative people anywhere, and theirproductivity and accuracy are dependent in part on a workplace that isn’t sonoisy that it interrupts their work. Peopleware describes how programmers whofound their workplace “acceptably quiet were one-third more likely to deliverzero defect work.”29
Protect your work area from stray noise. If your office is close to others whoare distracting you, perhaps you can negotiate with them. If that’s not possible,then work in the library or at home. Don’t force yourself to work under noisyconditions: you’ll be wasting your time and your life.
If you are feeling unproductive, do something that takes little mental energyor effort but will yield dividends later (like sorting your files, reading mail, oranswering phone calls). Even “down time” can be useful if you match the taskto your mental energy level.
Finally, value other people’s time just like you value your own. Don’t sched-ule needless meetings. Rarely hold long meetings. Be prepared for all meetings.No one ever complains when meetings finish early.Cartoon4(Dilbert)here0
PART II : BE PREPARED • 55
EXERCISE
Keep a log tracking your time for two or three typical days, writing downthe topics you worked on. Record all interruptions as well as the dura-tion of uninterrupted time. Are you making the most of your produc-tive hours? Are you surprised by how many interruptions there are?
Furious activity is no substitute for understanding.— H . H . W I L L I A M S
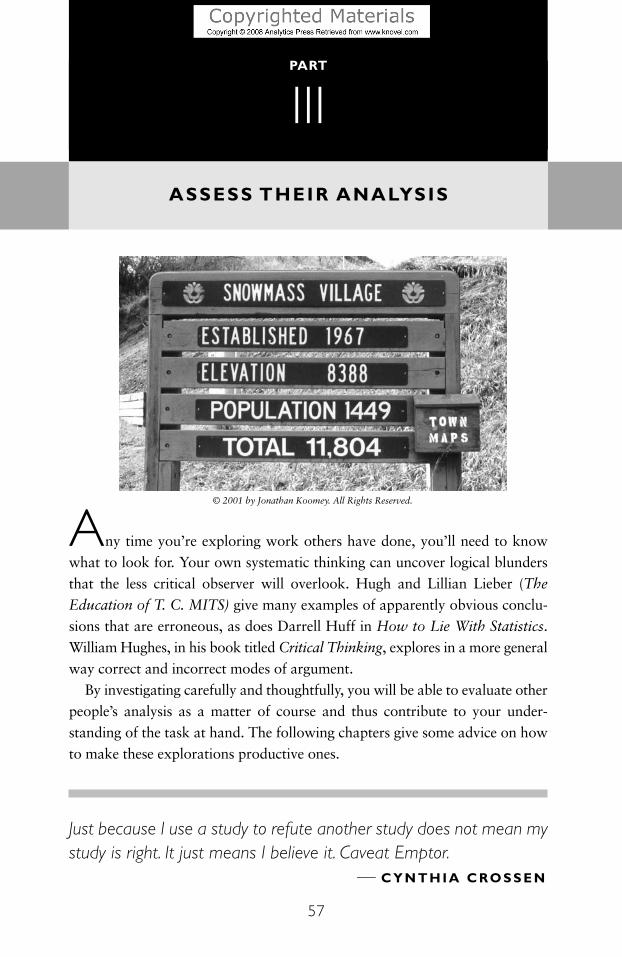
Any time you’re exploring work others have done, you’ll need to knowwhat to look for. Your own systematic thinking can uncover logical blundersthat the less critical observer will overlook. Hugh and Lillian Lieber (The
Education of T. C. MITS) give many examples of apparently obvious conclu-sions that are erroneous, as does Darrell Huff in How to Lie With Statistics.William Hughes, in his book titled Critical Thinking, explores in a more generalway correct and incorrect modes of argument.
By investigating carefully and thoughtfully, you will be able to evaluate otherpeople’s analysis as a matter of course and thus contribute to your under-standing of the task at hand. The following chapters give some advice on howto make these explorations productive ones.
Just because I use a study to refute another study does not mean mystudy is right. It just means I believe it. Caveat Emptor.
— C Y N T H I A C RO S S E N Cart.5(notacartoon...Snowmass)here
ASSESS THEIR ANALYSIS
PART
III
57
© 2001 by Jonathan Koomey. All Rights Reserved.
59
Years ago, Dr. Norman Vincent Peale became famous for proclaiming thepower of positive thinking. His claim was that each of us has control of how wefeel about our lives, and, by using that control, we can create a better future forourselves.
For assessing the analysis of others, critical thinking is at least as importantas positive thinking. Critical thinking implies the ability to assess the true mean-ing of arguments and the skill to determine whether those arguments are cred-ible and compelling. William Hughes, in his excellent book Critical Thinking,defines some of the key terms for understanding this important skill:
When we express an inference in words, we do so by means of statements.A statement is a sentence (i.e. a set of words) that is used to make a claimthat is capable of being true or false.... An argument is a set of statementsthat claims that one or more of those statements, called the premises, sup-port another of them, called the conclusion. Thus, every argument claimsthat its premises support its conclusion.30
A logically strong argument, according to Hughes, is one “whose premises, iftrue, support its conclusion.” A sound argument is “a logically strong argumentwhose premises are true.” Critical thinking is the way to identify and createsound arguments, which is the main goal of all analysts.
Hughes describes the key steps a critical thinker uses to assess arguments anddecide whether they are sound.31 I summarize his steps below:
• “Identify the main conclusion”: Rephrase the main conclusion in yourown words, to be sure you understand it. Think about the context inwhich the argument is being made. Finally, if the argument is not statedclearly, interpret the argument in the way that is most charitable to youropponent’s views (Hughes calls this “the principle of charity”).
THE POWER OF CRITICAL THINKING
CHAPTER
11
60 • TURNING NUMBERS INTO KNOWLEDGE
• “Identify the premises”: Rephrase the premises in your own words. Listthe unstated premises and assumptions. Discard distracting and irrelevantexamples that are not really premises. Don’t forget that context is impor-tant, and that the principle of charity should guide your interpretations atthis stage as well.
• Identify the logical structure of the argument and determine how the prem-ises support the conclusion: Determine whether one premise depends onanother one, or, alternatively, if premises are independent of each other.Determine whether the argument contains sub-arguments that support theultimate conclusion. Hughes presents a way of describing the structure ofarguments, known as a tree diagram, that can help with this step.
• Ask whether you’d be justified in accepting the premises: In most cases, astrict proof of the premises is impossible, so we must be satisfied with theless stringent standard of “acceptability.” Hughes suggests two criteria forevaluating acceptability:
— If the statement is common knowledge, we should regard it as acceptable,unless the context requires a higher standard of proof.
— If the statement is not common knowledge, we should ask for, or be pre-pared to offer, the evidence upon which it is based, and accept it only ifthe evidence meets the appropriate standard, for example, personalexperience, appeal to a recognized authority, or strict proof.
Hughes also points out that “common knowledge” is often wrong, so usecare when relying on any measure of acceptability less than a true proof.
Key questions to ask when determining acceptability include: Are thepremises common knowledge? What is the context of the argument? Whois making the argument? Are they experts? Do they have a vested interest inthe outcome? Are the premises backed up by credible research published inpeer-reviewed journals? Are the premises based on consistent comparisons?
• Ask whether the premises are relevant: Many arguments are peppered withpremises that are irrelevant to the conclusion but appear to support it.Usually the previous steps will make it obvious which premises don’t apply,but it’s worth asking the question again at this stage just to be sure.
• Ask whether the premises “adequately” support the conclusions: Certainstatements lend some support to the conclusion but are not sufficientlycompelling to make the argument adequate (appeals to authority often fallinto this trap). Inadequacy is a key weak point of many arguments. This
14 16
14
4
25
14
PART II I : ASSESS THEIR ANALYSIS • 61
step is mainly an exercise in common sense and in figuring out whether aparticular argument accounts for all of the many possibilities.
• Look for missing arguments: Omitting a valid comparison is one com-monly used way to make an argument seem stronger, so try to find theseomissions in other people’s arguments. People often look for the best-casecomparisons to support their own position and ignore comparisons thatmight weaken their case.
• Finally, “Look for counter arguments”: Try to find a sound argument thatleads to a conclusion contradictory to the one reached by the argumentbeing evaluated. If you find such a counter argument, you know thatsomething’s wrong, because two sound arguments cannot contradict eachother (unless one is not truly sound).
Careful critical thinking is at the root of all good analysis. When these stepsbecome second nature, you will have mastered its essence. The many subtletiesof assessing arguments will always keep you on your toes though. There’s noend to the ways that arguments can be flawed.
EXERCISE
In a newspaper, find a letter to the editor on a topic you care about.Identify the conclusion and the main premises. Assess each premise,determining whether each is acceptable, relevant, and adequate to sup-port the conclusion. How easy was it to carry out Hughes’s process?
The fascinating impressiveness of rigorous mathematical analysis, withits atmosphere of precision and elegance, should not blind us to thedefects of the premises that condition the whole process.There is per-haps no beguilement more insidious and dangerous than an elaborateand elegant mathematical process built upon unfortified premises.
— T. C . C H A M B E R L A I N
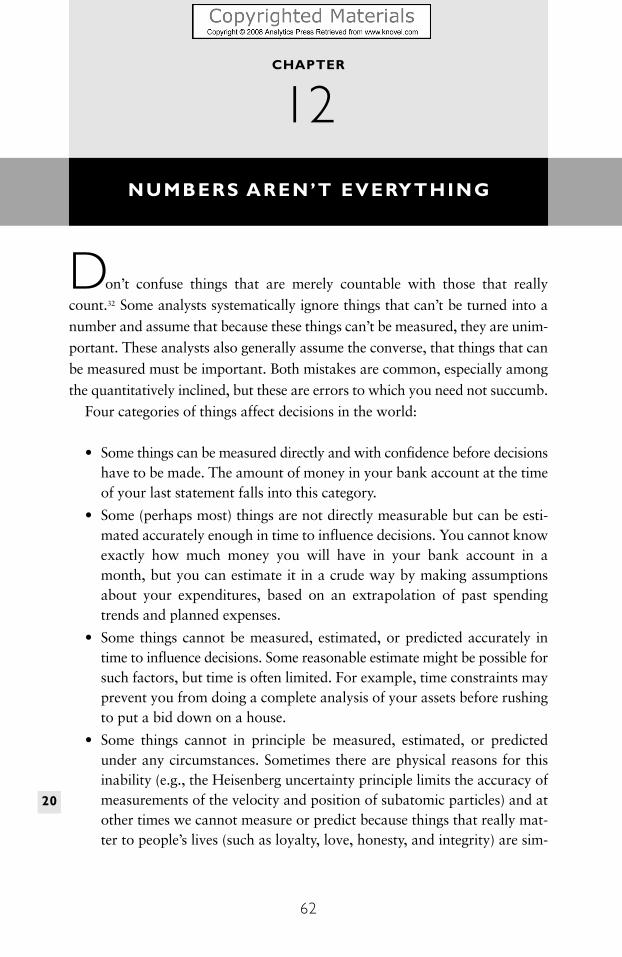
Don’t confuse things that are merely countable with those that reallycount.32 Some analysts systematically ignore things that can’t be turned into anumber and assume that because these things can’t be measured, they are unim-portant. These analysts also generally assume the converse, that things that canbe measured must be important. Both mistakes are common, especially amongthe quantitatively inclined, but these are errors to which you need not succumb.
Four categories of things affect decisions in the world:
• Some things can be measured directly and with confidence before decisionshave to be made. The amount of money in your bank account at the timeof your last statement falls into this category.
• Some (perhaps most) things are not directly measurable but can be esti-mated accurately enough in time to influence decisions. You cannot knowexactly how much money you will have in your bank account in amonth, but you can estimate it in a crude way by making assumptionsabout your expenditures, based on an extrapolation of past spendingtrends and planned expenses.
• Some things cannot be measured, estimated, or predicted accurately intime to influence decisions. Some reasonable estimate might be possible forsuch factors, but time is often limited. For example, time constraints mayprevent you from doing a complete analysis of your assets before rushingto put a bid down on a house.
• Some things cannot in principle be measured, estimated, or predictedunder any circumstances. Sometimes there are physical reasons for thisinability (e.g., the Heisenberg uncertainty principle limits the accuracy ofmeasurements of the velocity and position of subatomic particles) and atother times we cannot measure or predict because things that really mat-ter to people’s lives (such as loyalty, love, honesty, and integrity) are sim-
62
NUMBERS AREN’T EVERYTHING
CHAPTER
12
20
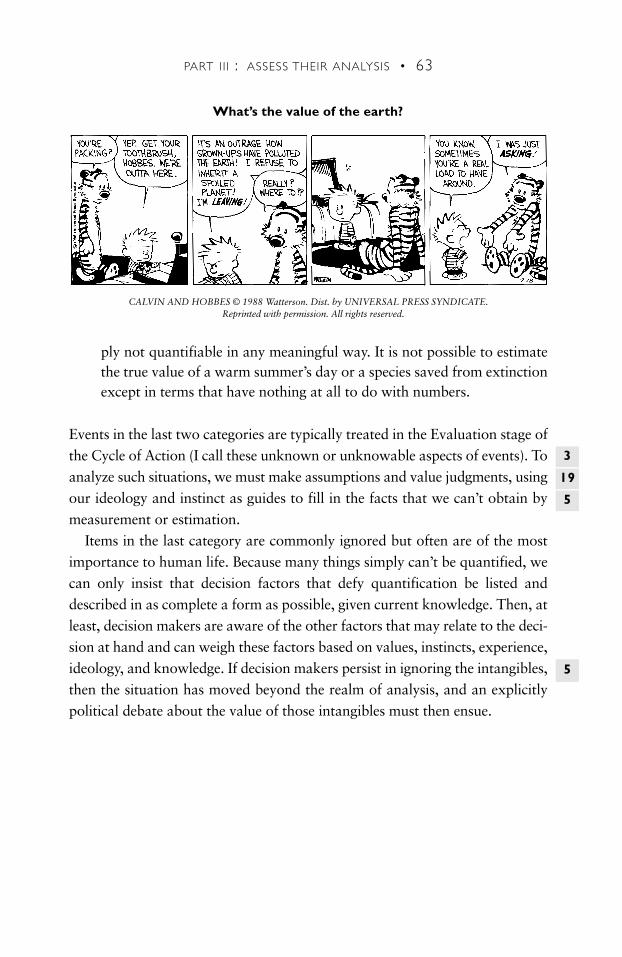
ply not quantifiable in any meaningful way. It is not possible to estimatethe true value of a warm summer’s day or a species saved from extinctionexcept in terms that have nothing at all to do with numbers.
Events in the last two categories are typically treated in the Evaluation stage ofthe Cycle of Action (I call these unknown or unknowable aspects of events). Toanalyze such situations, we must make assumptions and value judgments, usingour ideology and instinct as guides to fill in the facts that we can’t obtain bymeasurement or estimation.
Items in the last category are commonly ignored but often are of the mostimportance to human life. Because many things simply can’t be quantified, wecan only insist that decision factors that defy quantification be listed anddescribed in as complete a form as possible, given current knowledge. Then, atleast, decision makers are aware of the other factors that may relate to the deci-sion at hand and can weigh these factors based on values, instincts, experience,ideology, and knowledge. If decision makers persist in ignoring the intangibles,then the situation has moved beyond the realm of analysis, and an explicitlypolitical debate about the value of those intangibles must then ensue.
PART II I : ASSESS THEIR ANALYSIS • 63
CALVIN AND HOBBES © 1988 Watterson. Dist. by UNIVERSAL PRESS SYNDICATE. Reprinted with permission. All rights reserved.
What’s the value of the earth? Cart6(Calvin)here
3
19
5
5

To laugh often and much; to win the respect of intelligent people andthe affection of children; to earn the appreciation of honest critics andendure the betrayal of false friends; to appreciate beauty; to find thebest in others; to leave the world a bit better, whether by a healthychild, a garden patch or a redeemed social condition; to know evenone life has breathed easier because you have lived. This is to havesucceeded. — B E S S I E A . S TA N L E Y
64 • TURNING NUMBERS INTO KNOWLEDGE
EXERCISE
Think again about the three recent decisions that you explored in theCycle of Action chapter. Which of the data affecting those decisionscould be measured directly? Which could be estimated and which couldnot? How did you treat the intangibles that could not be quantified?What assumptions did you make to treat the unknowables?
65
A common fallacy to which even sophisticated analysts sometimes fall preyis to look for immutable laws of human behavior, in much the same way as thephysicist discovers physical laws through experiment. Such generalizationsabout human and economic systems fail because these systems are adaptable inways that physical systems are not.
Physicists conduct replicable experiments to uncover fixed natural laws. Ascientist measuring the speed of light in a vacuum, for example, would find thevelocity the same in the U.S. or Tahiti. If another scientist conducted a similarlyaccurate experiment in Russia, that test would produce the same result.
On the other hand, relationships between cause and effect for individuals andhuman institutions are dependent on institutional, social, and economic con-text. Furthermore, these relationships change over time. A market researcherattempting to predict consumer acceptance for a new toothpaste would findthat a market test in San Francisco would likely yield quite different results thanin Tahiti even though the speed of light remains the same in both places. In addi-tion, if the same experiment had been conducted in the 1950s, the results wouldhave presumably varied wildly from those of the current day.
In the mid-1970s and early 1980s, conventional wisdom held that modernsocieties could not reduce energy use without also reducing gross domesticproduct (GDP) and harming their economies. For example, Gordon Corey, vice-chairman of Chicago’s Commonwealth Edison, stated in 1981 that “there is anunbreakable tie between economic prosperity and energy use.” Similarly, theChase Manhattan Bank stated, in its 1976 Energy Report, that
there is no documented evidence that indicates the long-lasting, consistentrelationship between energy use and GDP will change in the future. There
ALL NUMBERS ARE NOT
CREATED EQUAL
CHAPTER
13
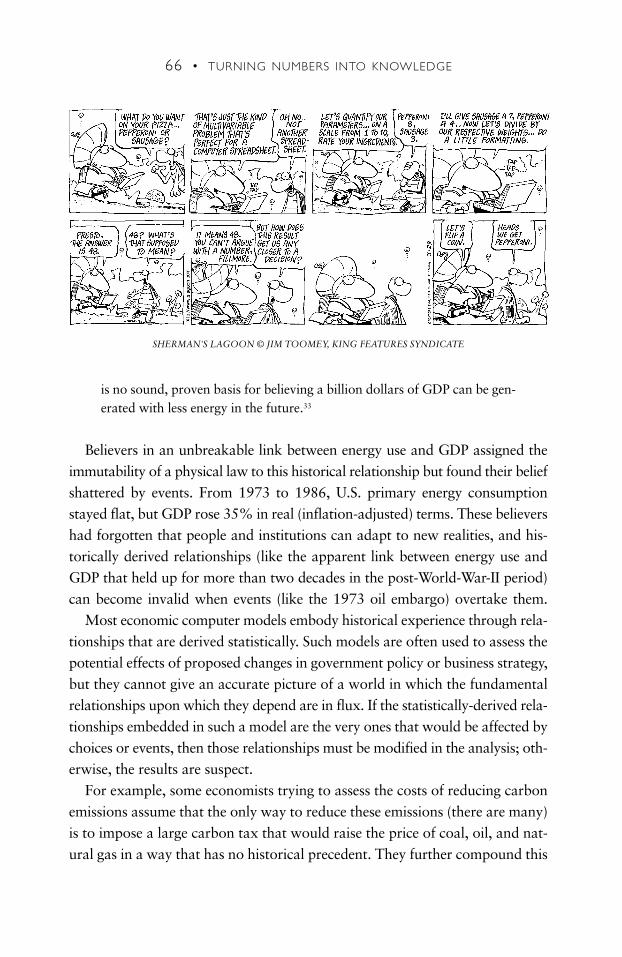
is no sound, proven basis for believing a billion dollars of GDP can be gen-erated with less energy in the future.33
Believers in an unbreakable link between energy use and GDP assigned theimmutability of a physical law to this historical relationship but found their beliefshattered by events. From 1973 to 1986, U.S. primary energy consumptionstayed flat, but GDP rose 35% in real (inflation-adjusted) terms. These believershad forgotten that people and institutions can adapt to new realities, and his-torically derived relationships (like the apparent link between energy use andGDP that held up for more than two decades in the post-World-War-II period)can become invalid when events (like the 1973 oil embargo) overtake them.
Most economic computer models embody historical experience through rela-tionships that are derived statistically. Such models are often used to assess thepotential effects of proposed changes in government policy or business strategy,but they cannot give an accurate picture of a world in which the fundamentalrelationships upon which they depend are in flux. If the statistically-derived rela-tionships embedded in such a model are the very ones that would be affected bychoices or events, then those relationships must be modified in the analysis; oth-erwise, the results are suspect.
For example, some economists trying to assess the costs of reducing carbonemissions assume that the only way to reduce these emissions (there are many)is to impose a large carbon tax that would raise the price of coal, oil, and nat-ural gas in a way that has no historical precedent. They further compound this
66 • TURNING NUMBERS INTO KNOWLEDGE
SHERMAN'S LAGOON © JIM TOOMEY, KING FEATURES SYNDICATE
error by using models that embody historical relationships to do long-term fore-casts without altering those relationships to reflect the unprecedented natureand size of these taxes or the likely effects of other policy choices (see DeCanio2003).
Creating a world with vastly lower carbon emissions presupposes massivebehavioral and institutional changes that render past relationships betweenenergy use and economic activity largely irrelevant (just like what happenedafter 1973). It also presupposes alterations in government policies. It is laugh-able to use computer models based on historical relationships for one-hundred-year forecasts in the face of such changes. Instead, scenario analysis is a moreappropriate tool for exploring the key relationships and how the future mightunfold if those relationships change.
If you are confronted by results of computer-generated forecasts, always askwhether the analysts changed the key historical relationships to reflect the pos-sibility that those relationships will be affected by institutional choices or otherdevelopments. If not, then you’ve identified a key failing of the analysis and theresults are suspect.
I have found that many physical scientists, computer modelers, and econo-mists are susceptible to this mistake. I am not certain why forecasters from thesedisciplines fall into this trap, but I have noticed it often. It may be what mysocial-science-oriented friends call “physics envy,” or it may be that most analy-ses are conducted in a mechanical way without significant reflection. In anycase, once forewarned, you need not let them get away with it.
It is fashionable today to assume that any figures about the future arebetter than none.To produce figures about the unknown, the currentmethod is to make a guess about something or other–called an“assumption”–and to derive an estimate from it by subtle calculation.The estimate is then presented as the result of scientific reasoning,something far superior to mere guesswork.This is a pernicious prac-tice that can only lead to the most colossal planning errors, becauseit offers a bogus answer where, in fact, an entrepreneurial judgmentis required. — E . F. S C H U M AC H E R
Cartoon6bhere(Sherman’sLagoon)
PART II I : ASSESS THEIR ANALYSIS • 67
26
30

Sacred cows make the best hamburger. — M A R K T WA I N
Question Authority” is one of the favorite T-shirt and bumper sticker slo-gans in Berkeley, California. It dates back to the 1960s when students engagedin well-publicized defiance of authority figures in the campus administrationand the state government. Although some aspects of these emotion-chargedtimes are best left in the past, it is time to dust off “Question Authority” for the21st Century.
Of course there are excellent reasons for following authority in manyinstances. People can become authority figures by virtue of hard work, uniqueexperience, special insight, and long training. In some situations, such as mili-tary maneuvers, obedience to authority is essential to completing missions suc-cessfully. Following authority in a business setting can also be important andcan allow people to act in a concerted and collective way to achieve the com-mon goal of increased profit for a firm.
However, most situations in everyday life are not as dangerous as militarymaneuvers. There are two main reasons why questioning authority is often ahealthy response:
• Even brilliant people affiliated with well-respected institutions are notalways right. History is littered with examples of wrong-headed conven-tional wisdom and misjudgments by otherwise outstanding individuals.Recall what a Yale University management professor said about FredSmith’s paper proposing reliable overnight delivery service: “The concept isinteresting and well formed, but in order to earn better than a “C,” the ideamust be feasible.” Smith went on to found Federal Express Corporation,
68
QUESTION AUTHORITY
CHAPTER
14
which in 2007 did more than 35 billion dollars in business carrying over-night packages.
• Many salespeople and marketing professionals use deference to authorityto gain advantage and influence consumer behavior. Robert Cialdini, in hisbook Influence, documents dozens of amusing and sometimes disturbingexamples of how these “compliance professionals” use authority figuresand pseudo-authority figures to sell products. Cialdini describes onefamous example where the actor Robert Young, who used to play MarcusWelby, M.D. on television, advises people to buy Sanka coffee for itshealth benefits: Cialdini concludes “objectively, it doesn’t make sense to beswayed by the comments of a man we know to be just an actor who usedto play a doctor. But, as a practical matter, that man moved the Sanka.”
So long as there is time to reflect and consider the dictates of authority, it’shealthy to question it. Hughes, in his book Critical Thinking, proposes five cri-teria to use when assessing the assertions of an ostensible authority figure.34 Isummarize them below:
• “The authority must be identified”: Appeals to anonymous authorities areimmediately suspect. You can’t assess the strength of an appeal to author-ity without knowing who the authority is.
• “The authority must be generally recognized by the experts in the field”:At a minimum, the authority must possess an academic degree, a profes-sional license, or an institutional position that indicates acceptance by therelevant expert community.
• “The particular matter in support of which an authority is cited must liewithin his or her field of expertise”: The authority must be a real expert onthe topic at hand, but it is common for experts in one field to express opin-ions about another field, and be taken seriously whether their opinions arewell founded or not (the Robert Young example described above is a casein point).
• “The field must be one in which there is genuine knowledge”: Hughesdefines genuine knowledge as “a systematically ordered body of facts andprinciples that are objective in nature.” Beware of appeals to authority infields that don’t fall under this definition.
• “There should be a consensus among the experts in the field regarding theparticular matter in support of which the authority is cited”: Even in
PART II I : ASSESS THEIR ANALYSIS • 69
11
21
physics, there are issues that remain a subject of controversy. Appeals toauthority are only relevant on topics that are not controversial.
Unless these criteria are satisfied, an appeal to authority is not adequate tosupport a particular argument and should probably be disregarded.
Cialdini also suggests asking one more question, namely “how truthful canwe expect the expert to be here?” By asking whether the authority figure (or theinstitution funding her) stands to benefit from the advice she is supplying, wegain insight into the trustworthiness of that advice. If experts have a vestedinterest in one or more potential outcomes of your decision, their adviceshould be discounted and you should seek corroborating information. Theadvice may nonetheless be sound, but it is worth special care in this case.
If the expert’s interests coincide with yours or the expert is demonstrablyimpartial, then more weight should be ascribed to his or her opinions. Even inthis case, however, it is best to seek corroborating evidence because experts canbe mistaken.
One recent example where the interests of the researchers and their fundinginstitutions led to widespread (and well-justified) public skepticism is the furorover research on the health effects of smoking. For years, the tobacco compa-nies funded research ostensibly demonstrating that smoking did not causeadverse health effects, all the while knowing that it did (for details, see The
Cigarette Century). Investigating who is paying for the expert’s work is a par-ticularly fruitful line of inquiry when such cynical manipulation of research isso common.
Some authority figures unknowingly promote the messages of self-interestedinstitutions. In Diet for a New America, John Robbins marvels at the way thatthe dairy and meat industries have for decades promoted attitudes favorable totheir products by contributing educational materials to schools. All of us whogrew up in the 1960s and 1970s remember the advice from our teachers todrink milk and eat meat to promote good health, but those nice charts describ-ing the basic “food groups” were part of a brilliant marketing campaign, inspite of how official they looked.
The flood of facts and falsehoods in this data-laden age puts greater respon-sibility on us to question “information” that appears to be from authority fig-
70 • TURNING NUMBERS INTO KNOWLEDGE
11

ures. Information found on the Internet is less subject to institutional validitychecks than are stories published by more established information sources likeThe New York Times or The New Republic, but any source can propagate non-sense. Proceed with caution, and always corroborate what you hear or readwith multiple independent sources before taking action.
PART II I : ASSESS THEIR ANALYSIS • 71
16
Loyalty to petrified opinion never yet broke a chain or freed a humansoul. — M A R K T WA I N
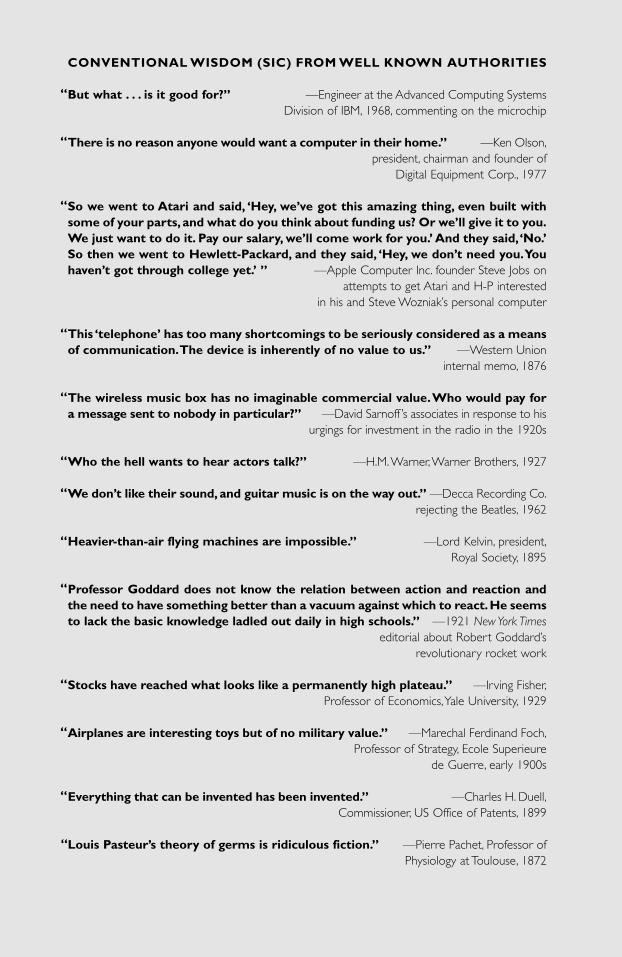
—
CONVENTIONAL WISDOM (SIC) FROM WELL KNOWN AUTHORITIES
But what . . . is it good for?” —Engineer at the Advanced Computing Systems Division of IBM, 1968, commenting on the microchip
There is no reason anyone would want a computer in their home.” —Ken Olson,president, chairman and founder of
Digital Equipment Corp., 1977
So we went to Atari and said, ‘Hey, we’ve got this amazing thing, even built withsome of your parts, and what do you think about funding us? Or we’ll give it to you.We just want to do it. Pay our salary, we’ll come work for you.’ And they said,‘No.’So then we went to Hewlett-Packard, and they said, ‘Hey, we don’t need you.Youhaven’t got through college yet.’ ” —Apple Computer Inc. founder Steve Jobs on
attempts to get Atari and H-P interested in his and Steve Wozniak’s personal computer
This ‘telephone’ has too many shortcomings to be seriously considered as a meansof communication.The device is inherently of no value to us.” —Western Union
internal memo, 1876
The wireless music box has no imaginable commercial value.Who would pay fora message sent to nobody in particular?” —David Sarnoff ’s associates in response to his
urgings for investment in the radio in the 1920s
Who the hell wants to hear actors talk?” —H.M.Warner,Warner Brothers, 1927
We don’t like their sound, and guitar music is on the way out.” —Decca Recording Co.rejecting the Beatles, 1962
Heavier-than-air flying machines are impossible.” —Lord Kelvin, president,Royal Society, 1895
Professor Goddard does not know the relation between action and reaction andthe need to have something better than a vacuum against which to react.He seemsto lack the basic knowledge ladled out daily in high schools.” —1921 New York Times
editorial about Robert Goddard’s revolutionary rocket work
Stocks have reached what looks like a permanently high plateau.” —Irving Fisher,Professor of Economics,Yale University, 1929
Airplanes are interesting toys but of no military value.” —Marechal Ferdinand Foch,Professor of Strategy, Ecole Superieure
de Guerre, early 1900s
Everything that can be invented has been invented.” —Charles H. Duell,Commissioner, US Office of Patents, 1899
Louis Pasteur’s theory of germs is ridiculous fiction.” —Pierre Pachet, Professor of Physiology at Toulouse, 1872
“
“
“
“
“
“
“
“
“
“
“
“
“
73
All data should be treated with skepticism. Here is one example of howofficial statistics get created, as recounted by Alan Meier, a long-time friend andcolleague of mine at Lawrence Berkeley National Laboratory (LBNL):
In 1987, Steve Greenberg and I wrote an article in an energy magazineabout the rising amount of energy use that did not fit into the traditionalcategories.35 As part of the article, we created three tables showing owner-ship of these small appliances (like fish tanks and power tools) and their esti-mated annual energy consumption. These values were based on very limitedmonitored data, back-of-the-envelope calculations, and hunches. The tableswere assembled in one evening. (Many of the envelopes with calculationswere then discarded.)
In 1989, the U.S. Department of Energy’s Energy Information Admin-istration (EIA) published its official Household Energy Consumption andExpenditures, including the results of their 1987 survey and additional analy-sis.36 The EIA published the Meier and Greenberg data in a new table, “U.S.End-Use Consumption of Electricity for Selected Appliances.” Whereas wepublished ranges in our estimates, the EIA just calculated and printed theaverages from the high and low values. The word “estimated” appearednowhere in the EIA table, so the reader was led to believe that these numberswere exact (curiously, the EIA is careful to give confidence bounds and otherstatistical parameters for its own survey data). To add insult to injury, the EIAmisspelled my name in the citation.
Alan’s example is more the rule than the exception. When little information isavailable about a particular topic, any moderately credible source gets cited byeveryone concerned with the topic and becomes the new conventional wisdom.This happens frequently even though such estimates are often based onextremely crude assumptions.37 I now sometimes joke that ALL estimates ofenergy use of appliances somehow originate with Alan.
HOW GUESSES BECOME FACTS
CHAPTER
15
29

Another colleague, Chris Calwell, was hired in 1996 to write a researchreport about the energy and safety problems with halogen torchieres, thoseinexpensive floor lamps that have become so popular in recent years.38 Here ishis story:
In order to write the report, I needed to figure out how many halogentorchieres had been sold. The trouble was, nobody knew. The CensusBureau knew how many halogen bulbs had been imported but not howmany were in fixtures. California utilities had counted how many were in asmall sample of houses, but that was before the lamp had become popular.Market researchers had asked how many people bought halogen lamps ofall types but didn’t know how many were torchieres. The library was notmuch help, either, because only two articles had ever been published on thissubject before I set out to write mine.
I called the author of those two articles and got the names and numbersof her sources (the manufacturers). Then I called the manufacturers andasked how many they thought had been sold in total the previous year. I alsoasked them how average prices for the lamps had changed over time andabout when they began selling the lamps in the United States. Taking allthese different pieces of information under consideration, I created a tableof sales of torchieres per year and the number of fixtures still in use at thepresent time. It was pure guesswork, informed by the information I couldfind, but guesswork nonetheless, with a fancy spreadsheet and graphs toback it up.
The U.S. Consumer Product Safety Commission, a federal agency, wasabout to put out a press release on the problems with halogen torchieres atthe same time I was finishing my report, but they also had no idea howmany had been sold. They asked for my number (40 million), which mypublisher reported to them as 35 to 40 million to be conservative. The CPSCthought that range seemed high, so it used 30 to 40 million in its pressrelease to be even more conservative. During the next year, dozens of news-paper articles and TV programs cited the CPSC estimate of 30 to 40 millionand attributed it to the federal agency, ignoring the original source and neverbothering to examine the eight-line footnote in my original report docu-menting how the original estimate of 40 million was determined. The num-ber had taken on a life of its own, proof of truth by institutional adoptionand media repetition.
Your best defense against these sanctified guesses is to read the documentationfor any data, including the footnotes. Track down cited sources and read them,
74 • TURNING NUMBERS INTO KNOWLEDGE
33

too. You should be able to figure out the methods used to create any data. If thedocumentation is not up to this task, you should regard the data with extremesuspicion. Don’t ever use data unless you know how they were derived, youtrust the cited sources, and you agree with the stated methods.
PART II I : ASSESS THEIR ANALYSIS • 75
EXERCISE
Find an official statistic that sounds plausible and explore its origins. Doyou still find it plausible after you’ve investigated?
27
The Government are very keen on amassing statistics. They collectthem, add them, raise them to the nth power, take the cube root andprepare wonderful diagrams. But you must never forget that every oneof these figures comes in the first instance from the village watchman,who just puts down what he damn pleases.
— S I R J O S I A H S TA M P,
Inland Revenue Department of England,
1 8 9 6 - 1 9 1 9
Never act solely on information you read in the newspaper, hear on theradio, or learn on the Internet. News stories are often wrong either because thereporter misunderstood her sources or because the sources themselves were mis-leading or incorrect. Reporters sometimes report fiction as fact. Email claimingto contain valuable information can easily be a hoax.
One example is that of Stephen Glass, who wrote about 40 articles for The
New Republic in the mid-1990s. Almost three-quarters of those stories were“partly or totally bogus,” and the editor of that magazine was forced in mid-1998 to print a contrite mea culpa when Glass’s deceptions were discovered.39
The standard fact-checking process was not equipped to detect deliberatedeception.
Some reporters even attribute quotations to those they have interviewed,when the person being interviewed never said any such thing. Erik Brynjolfsson,a professor at MIT’s Sloan School of Management, had this experience in thespring of 1999. After I showed him a newspaper article in which he was cited,he said “I think I actually said about 25% of the quotes that were attributed tome. At least they didn’t make me say anything too embarrassing.” No oneknows how frequently this happens, but it’s common enough that you shouldnot assume the veracity of quotations until you’ve verified them with the actualsource.
Sometimes the sources themselves are at fault. Through the mid-1990s, theSoftware Publishers Association (SPA, now known as the Software & Infor-mation Industry Association, <http://www.siia.net>) periodically released esti-mates of the size of the software markets for Microsoft Windows and AppleMacintosh systems. In 1995 and 1996, the SPA proclaimed that Macintosh soft-ware sales had declined in both years relative to the prior year’s estimates. Theproblem is that the SPA compared preliminary data in 1995 and 1996 to final
76
DON’T BELIEVE EVERYTHING
YOU READ
CHAPTER
16
data in the previous year, but the final data in a given year contained substantialadjustments relative to the preliminary data (in the 1995 data, the adjustmentwas 45%!). The data series used by SPA was therefore not a consistent one, butthe SPA’s analyst felt confident enough to conclude that “the Mac platform is indecay.” In fact, if final 1995 numbers are compared to final 1994 numbers, thereal change in Mac software sales was about a 25% increase from 1994 to 1995,not a 14% decline as initially reported by the SPA. This result is not surprising,because Apple shipped record numbers of Macs in 1995.
The details of why the SPA made these appalling errors are not really thatimportant for our purposes. The main lesson is that even respected institutionscan distribute junk data to the world and pass it off as legitimate. If some Maczealots had not delved into these numbers and compared the results year toyear, unsuspecting software developers might have been led to the wrong con-clusion. In fact, these widely reported estimates probably damaged Apple’s busi-ness. How much damage they did no one can say for sure.
In the face of the public furor over its obvious mistakes, the SPA finally sus-pended its data program in September 1997. In hindsight, the SPA should havesubjected its methodology to external peer review and been much more cautiousin its conclusions about Macintosh software sales.
The most famous book on ways to misuse numbers is Darrell Huff’s How to
Lie with Statistics. Huff documents dozens of examples where people, throughincompetence or malicious intent, mislead readers with numbers, graphs, andother tools of the numerate. These tricks include biased samples, carefullychosen averages, graphs with chopped scales, and faulty logic in all its manymanifestations.
You owe it to yourself to read Huff’s book. It is justly revered both becauseof its accessible tone and its message: lying with statistics is commonplace, andit’s wise to be aware of the most widely used tricks.40
What should you do to protect yourself and others from such shenanigans?
• First, go back to the questions. Read the questionnaire. Find out whoasked the survey questions and how they settled on the survey sample.Also determine when the questions were asked, because that can some-times affect people’s responses.
• Be a detective and determine the potential motives of the surveyingorganization. Identify the funding sources for the research.
PART II I : ASSESS THEIR ANALYSIS • 77
4
17
24

• Dig into the numbers, and compare results to other numbers you know tobe true. Are results consistent with other sources? Can you find internalinconsistencies that cast doubt on the results? Answers to these latter twoquestions made it obvious that the SPA results were nonsense.
• Finally, don’t email information to dozens of people unless you are confi-dent it is true. I’ve received dozens of email warnings about computerviruses that will erase my hard drive or have some other terrible effect. Iknow most of these are bogus because they usually don’t mention whichkinds of computers they affect, and all genuine warnings are very clearabout the software that is affected by a given virus. Viruses (with a fewexceptions) afflict Macs, PCs, or UNIX machines, but one type of machinecan’t generally “catch” the virus from another type. Before forwardingANY email about computer viruses, check out the latest information at theSymantec Anti-Virus Research Center, <http://www.symantec.com/avcenter/index.html>.
Because of the ease with which information can be sent to dozens of people,news (or falsehoods) can spread quickly around the world. One example of thisphenomenon is a collection of advice purported to be a commencement speechgiven by Kurt Vonnegut at MIT. The advice was witty, thoughtful, and alto-gether in keeping with Vonnegut’s curmudgeonly but lovable take on theworld. In fact, his own wife passed it around to her friends, thinking it was hiswork. It was widely distributed on email in the days following the MITCommencement on 5 June 1997, and attributed to Vonnegut.
The essay included such gems as:
Wear sunscreen. If I could offer you only one tip for the future, sunscreenwould be it. The long-term benefits of sunscreen have been proved by sci-entists, whereas the rest of my advice has no basis more reliable than myown meandering experience. I will dispense this advice now.
Do one thing every day that scares you.
Sing.
Don’t be reckless with other people’s hearts. Don’t put up with people whoare reckless with yours.
Be kind to your knees. You’ll miss them when they’re gone.
Live in New York City once, but leave before it makes you hard. Live inNorthern California once, but leave before it makes you soft.
Floss.
78 • TURNING NUMBERS INTO KNOWLEDGE
27
The only problem was that Kurt Vonnegut didn’t speak at that MIT Com-mencement, nor did he write those delightful words of wisdom. The essay wasa newspaper column by Mary Schmich, who writes for the Chicago Tribune.The column had somehow been stamped with Vonnegut’s name and then sentmerrily on its way to thousands of unsuspecting email readers.
This last example is a reminder of how quickly and easily misinformation canbe passed off as fact in the digital age. Remember it as you venture forth intocyberspace.
PART II I : ASSESS THEIR ANALYSIS • 79
EXERCISE
Find three popular articles on a topic you know a lot about. Make a listof the various misstatements you can identify based on your knowledgeof the topic. Now go and read a few other articles on topics you knowless about.Assume you find just as many mistakes.Worrisome? You bet!
The surest way to corrupt a youth is to instruct him to hold in higherregard those who think alike than those who think differently.
— N I E T Z S C H E
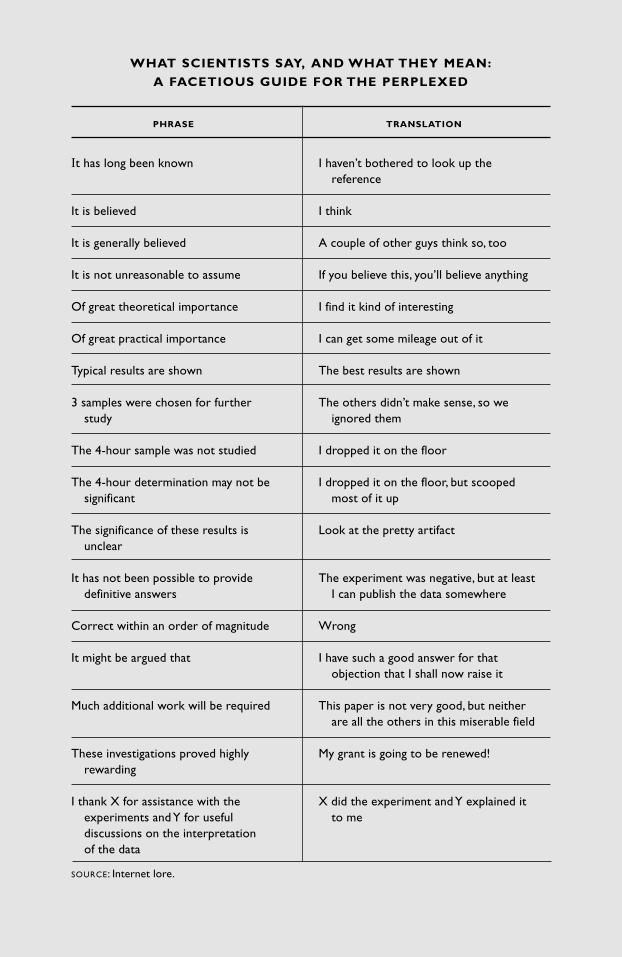
80 • TURNING NUMBERS INTO KNOWLEDGEWHAT SCIENTISTS SAY, AND WHAT THEY MEAN:
A FACETIOUS GUIDE FOR THE PERPLEXED
PHRASE TRANSLATION
It has long been known I haven’t bothered to look up the reference
It is believed I think
It is generally believed A couple of other guys think so, too
It is not unreasonable to assume If you believe this, you’ll believe anything
Of great theoretical importance I find it kind of interesting
Of great practical importance I can get some mileage out of it
Typical results are shown The best results are shown
3 samples were chosen for further The others didn’t make sense, so we study ignored them
The 4-hour sample was not studied I dropped it on the floor
The 4-hour determination may not be I dropped it on the floor, but scooped significant most of it up
The significance of these results is Look at the pretty artifactunclear
It has not been possible to provide The experiment was negative, but at least definitive answers I can publish the data somewhere
Correct within an order of magnitude Wrong
It might be argued that I have such a good answer for that objection that I shall now raise it
Much additional work will be required This paper is not very good, but neither are all the others in this miserable field
These investigations proved highly My grant is going to be renewed!rewarding
I thank X for assistance with the X did the experiment and Y explained it experiments and Y for useful to mediscussions on the interpretation of the data
SOURCE: Internet lore.
81
It is common practice for companies to make decisions about marketing newproducts based on surveys of consumer behavior and preferences. In 1996, Ispent about four hours filling out such a survey, and it got me to think about thelimitations of such data.
The Survey of American Consumers is conducted by the American Instituteof Consumer Studies.41 An engaging young woman came to my door, explainedwhat her job was, and started asking me questions. After about 15 minutes ofquestions she said that she had a booklet with more detailed questions, and thatif I filled it out and returned it in the postage-paid envelope, I would be sent acheck for $20.
The survey itself was 96 pages long, and it contained questions on everyaspect of my purchasing behavior, from what kind of toothpaste I buy to howmany miles I drive my car per year. The sheer endurance needed to fill out thesurvey was substantial, and I suspect that I was among the more thoroughrespondents. I dug through my cabinets to identify the brands of various foodsand other household supplies. Sometimes I just didn’t have the brand name butI knew I had used some form of the product during the specified time period,so I guessed (the instructions to the survey said to “estimate as best you can”).
One thing that struck me was the number of times that the question did notallow me to explain my situation. For example, the survey asked about mynewspaper reading habits (“Which sections of the daily newspaper do youread?”) but did not allow me to explain that I read the news on-line and did notat that time receive a hard copy newspaper.
Another question asked whether I use talcum powder. I do use it, but not tofreshen up after a shower. Instead, I put it on ants that have invaded my kitchen;it drives them away, without using poison.42 The makers of talcum powdermight try to infer something from the results of this survey, but it tells themnothing about my non-conventional use of that product.
GO BACK TO THE QUESTIONS
CHAPTER
17
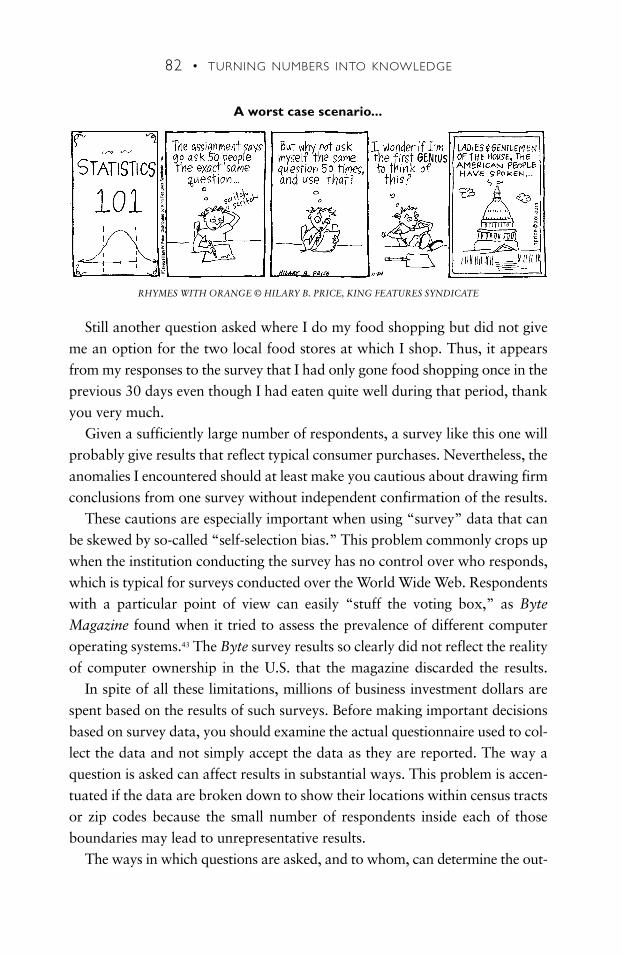
Still another question asked where I do my food shopping but did not giveme an option for the two local food stores at which I shop. Thus, it appearsfrom my responses to the survey that I had only gone food shopping once in theprevious 30 days even though I had eaten quite well during that period, thankyou very much.
Given a sufficiently large number of respondents, a survey like this one willprobably give results that reflect typical consumer purchases. Nevertheless, theanomalies I encountered should at least make you cautious about drawing firmconclusions from one survey without independent confirmation of the results.
These cautions are especially important when using “survey” data that canbe skewed by so-called “self-selection bias.” This problem commonly crops upwhen the institution conducting the survey has no control over who responds,which is typical for surveys conducted over the World Wide Web. Respondentswith a particular point of view can easily “stuff the voting box,” as Byte
Magazine found when it tried to assess the prevalence of different computeroperating systems.43 The Byte survey results so clearly did not reflect the realityof computer ownership in the U.S. that the magazine discarded the results.
In spite of all these limitations, millions of business investment dollars arespent based on the results of such surveys. Before making important decisionsbased on survey data, you should examine the actual questionnaire used to col-lect the data and not simply accept the data as they are reported. The way aquestion is asked can affect results in substantial ways. This problem is accen-tuated if the data are broken down to show their locations within census tractsor zip codes because the small number of respondents inside each of thoseboundaries may lead to unrepresentative results.
The ways in which questions are asked, and to whom, can determine the out-
82 • TURNING NUMBERS INTO KNOWLEDGE
RHYMES WITH ORANGE © HILARY B. PRICE, KING FEATURES SYNDICATE
A worst case scenario... Cartoon7(RhymeswithOrange)here
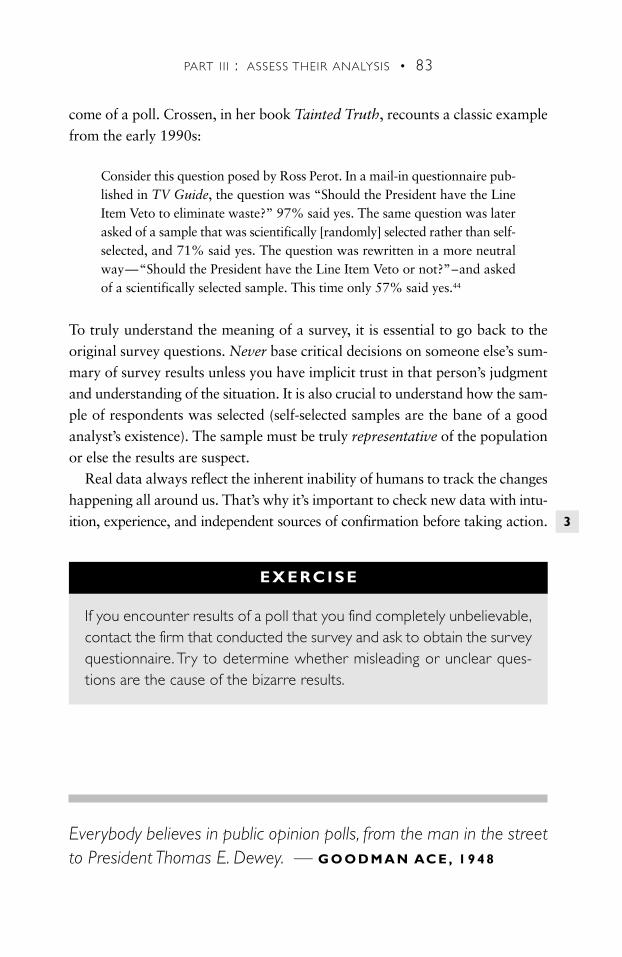
come of a poll. Crossen, in her book Tainted Truth, recounts a classic examplefrom the early 1990s:
Consider this question posed by Ross Perot. In a mail-in questionnaire pub-lished in TV Guide, the question was “Should the President have the LineItem Veto to eliminate waste?” 97% said yes. The same question was laterasked of a sample that was scientifically [randomly] selected rather than self-selected, and 71% said yes. The question was rewritten in a more neutralway—“Should the President have the Line Item Veto or not?”–and askedof a scientifically selected sample. This time only 57% said yes.44
To truly understand the meaning of a survey, it is essential to go back to theoriginal survey questions. Never base critical decisions on someone else’s sum-mary of survey results unless you have implicit trust in that person’s judgmentand understanding of the situation. It is also crucial to understand how the sam-ple of respondents was selected (self-selected samples are the bane of a goodanalyst’s existence). The sample must be truly representative of the populationor else the results are suspect.
Real data always reflect the inherent inability of humans to track the changeshappening all around us. That’s why it’s important to check new data with intu-ition, experience, and independent sources of confirmation before taking action.
PART II I : ASSESS THEIR ANALYSIS • 83
EXERCISE
If you encounter results of a poll that you find completely unbelievable,contact the firm that conducted the survey and ask to obtain the surveyquestionnaire. Try to determine whether misleading or unclear ques-tions are the cause of the bizarre results.
3
Everybody believes in public opinion polls, from the man in the streetto President Thomas E. Dewey. — G O O D M A N AC E , 1 9 4 8
When reading a new report, I go straight for the tables and graphs. I dothis for two reasons:
• I want to determine whether I find the author credible, and
• I like to understand the bottom-line results.
These two goals are quickly served by rummaging through tables andgraphs for half an hour. If the tables and graphs are good enough, I read thepaper to follow the author’s reasoning more closely.
If the tables and graphs are poorly designed or confusing, I lose respect forthe author. It is essential that tables and graphs summarizing analysis results beclear, accurate, and well documented. If they aren’t, including them is worsethan useless because they hurt your argument and your credibility.
First check for internal consistency. I always begin at the bottom-line tableand work backwards. I examine the column and row headings to be sure Iunderstand what each one represents (I read the footnotes if I have questions).I then assess whether the components of the total add up to the total. This pro-cedure shows me whether the calculations are accurate, and it helps me becomefamiliar with the different parts of the analysis.
Next, look over the numbers in the table and identify those that are abnor-mally small or large. Typographical errors are quite common in tables (partic-ularly in tables that summarize results from other, more detailed tables), and aquick scan can help you find them. For example, if you’re reading a table sum-marizing hours worked per week by different team members on a project, anentry from one person that’s ten times larger than the entries for others shouldcatch your attention and prompt you to investigate further. The number maynot be wrong, but checking it will increase your confidence in the analysis andhelp you understand it more fully.
84
READING TABLES AND GRAPHS
CHAPTER
18
33
27
27
Sometimes numbers don’t add up exactly because of rounding errors, notbecause there is a mistake in the calculations. Say you’ve formatted a spread-sheet table so that there are no decimal places for the entries in the table. Theseentries might be 9.4 and 90.4, but in the table they are shown as 9 and 90,because a common convention is to round numbers down to the next wholenumber when the decimal remainder is less than 0.5 (the remainder in both casesis 0.4 in this example). The sum is 99.8, which rounds to 100 and is shown inthe spreadsheet as the total. The sum of 9 and 90 is 99, which makes the totalof 100 look wrong even though there’s a perfectly sensible explanation. If you’renot aware of this potential pitfall, you could be misled by these apparent errors.
Read the footnotes carefully. They should convey the logic of the calculationsand the sources of key input data. If you can’t determine the methods used fromthe footnotes, you should be especially suspicious of the results and investigatefurther.
Check for ambiguous definitions and terminology. For example, there are atleast five distinct definitions of the word “ton,” and analysts often neglect tospecify which definition they are using. If it isn’t crystal clear what the labelmeans, you are likely to be led astray in interpreting the numbers. Anotherslightly different example involves the number of hours in a year. Many analystsassume it is 8,760 hours, but on average it is 8,766 hours because of leap years.This difference is essentially a definitional one, but it can lead to small inaccu-racies in calculations.
The next step is to check consistency with independent external sources toensure that the data in the tables and graphs are roughly right (use back-of-the-envelope calculations as needed). Compare growth over time to growth in otherkey data like population and Gross Domestic Product to get perspective on howfast something is growing relative to these commonly used indicators.
Does the information in the tables or graphs contradict other informationyou know to be true? That table of hours worked may list Joe as someone whoworked little on the project at hand, but if you know for a fact that Joe slavedover this project for many weeks because it was his idea, then you’ll need tocheck the calculation. Similarly, if there’s an entry of 175 hours for one week,it must be a typo or a miscalculation, because there are only 168 hours in aweek.
Take ratios of results and determine whether the relationships they embodymake sense. If one component of the total is growing much faster than other
PART II I : ASSESS THEIR ANALYSIS • 85
33
27
29
27
components over time, or if it is especially large compared to others, then inves-tigate further. Look for large discrepancies and investigate when you uncoverthem.
Follow up when you encounter cognitive dissonance–any contradictionbetween your knowledge and the information in the table will lead to greaterunderstanding, one way or the other. If there is a logical explanation for thecontradiction, you’ve learned about the relationships between the informationin the table and what you knew before. If the contradiction indicates a realproblem, you’ve identified a flaw in the analysis. Root out the causes of cogni-tive dissonance, and you will enhance your knowledge without fail.
86 • TURNING NUMBERS INTO KNOWLEDGE
EXERCISE
Find several reports that you’ve either used or written over the past fewyears, and dissect the tables and graphs. Can you find all the informationyou need to use and to reference the results in the reports? How manyunexplained discrepancies did you find? Have your tables and graphsimproved over the years?
Although we often hear that data speak for themselves, their voicescan be soft and sly.
— F R E D E R I C K M O S T E L L E R , S T E P H E N E . F I E N B E R G ,
and RO B E RT E . K . RO U R K E
87
Every human choice embodies certain values. When technical people advo-cate a technology choice (e.g., whether or not to build more nuclear powerplants) they often portray their advice as totally rational, completely objective,and value free. This portrayal cannot be correct—if an analyst makes a choice,he has also made a value judgment. For example, Bernard L. Cohen45 portrayshis support for a revival of nuclear power as the result solely of scientific analy-sis when in fact it is a public policy judgment that is based both on his valuesand his scientific understanding.
Robert Reich’s public policy students often forgot that values (and hence pol-itics) are always intertwined with public policy choices:
Some of my students used to regard public policy-making as a matter offinding the “right” answer to a public problem. Politics was a set of obsta-cles which had to be circumvented so the “right” answer could be imple-mented. Policy was clean–it could be done on a computer. Politics wasdirty–unpredictable, passionate, sometimes mean spirited or corrupt. Policywas good; politics, a necessary evil.46
One purpose of analysis is to support public or private choices; in this con-text, it cannot be “clean” or value-free. It can, however, illuminate the conse-
quences of choices so that the people and institutions making them can evalu-ate the alternative outcomes.
When Victor Fuchs et al. analyzed economists’ positions on policy issues,they found that those positions were strongly correlated with each economist’svalues. Economists with a conservative political ideology viewed policy issuesone way while those with a more liberal bent generally viewed them in a dif-ferent way. Jonathan Marshall summarized the results nicely:
DISTINGUISH FACTS FROM VALUES
CHAPTER
19
What the authors found was that economists’ views on policy questions cor-respond more closely to their values than to the [facts].
To some extent, in other words, mere facts don’t change their mind onissues. Keep that in mind the next time you see an ad, signed by 200 econ-omists, supporting some candidate or piece of legislation. The ad may tellyou less about their expertise than their ideology.47
I define facts as assertions about the physical world that can be verifiedthrough experiment, direct measurement, or observation. Events can also befacts although the interpretation of the meaning of those events is usuallystrongly colored by ideology and attitudes. Values, on the other hand, areexplicitly subjective and are an expression of the ideas and feelings that are mostimportant to us. As the philosopher Ken Wilber points out, the only way totruly understand values (or other beliefs) in all their complexity is to engage ina dialogue with the person who holds them.
Understanding the relationship between facts and values can aid decision-making.48 If people agree about both the facts and the values related to a par-ticular decision, reaching an acceptable solution becomes merely an issue ofcomputation. A situation in which people concur about values but disagreeabout facts presents another easy choice: in this case, experimentation is theorder of the day. If the facts are not in question, but people’s values are in con-flict, then they can negotiate to solve the problem. The most complicated anddifficult choices are those where both facts and values are in dispute. In such sit-uations, paralysis or chaos results. Most difficult public policy choices are prob-lems of this type, and the best approach here is to experiment and bring thefacts to a point where people no longer dispute them; people can then start tonegotiate about values. Fig.19.1here
In any of these discussions, it is a common rhetorical trick to link an osten-sibly demonstrable fact with a value judgment. Such statements are of the form“Fact A is true, therefore we should take Action B.” By linking facts and valuesin this manner, the speaker is explicitly or implicitly hiding the value judgmentshe has made.
Let the reader beware: Fact A may or may not be true, and Action B may ormay not be a good idea whether Fact A is true or not. Too often these glib state-ments are allowed to pass without proper scrutiny. By being aware of this com-
88 • TURNING NUMBERS INTO KNOWLEDGE
5

monplace rhetorical technique (and by using your critical thinking skills), youcan prepare yourself to respond.
The purpose of analysis is to help you illuminate the facts so that you canunderstand the choices of others and best use your values to make good choicesof your own. Value choices are inescapable, which is why separating demon-strable facts from value judgments is so essential. Do so, and you are sure to beon a solid footing.
PART II I : ASSESS THEIR ANALYSIS • 89
11
The significant problems we face cannot be solved by the same levelof thinking that created them. — A L B E RT E I N S T E I N
One of Werner Heisenberg’s major contributions to quantum theory wasthe so-called “uncertainty principle.” This principle governs the relationshipbetween the observer and the physical world at the subatomic level. To meas-ure the velocity and position of a particle (an electron, for example) an observermust bounce something off that particle but by that action will change the elec-tron’s velocity and location. The more the observer tries to pinpoint the locationof the electron, the more the measurement disturbs the velocity. Similarly, if theobserver attempts to measure the velocity of the electron, its position becomesless and less certain. The level of certainty with which the observer can knowthe position and velocity of the electron is constrained by this physical law.
This principle can be loosely summarized for use in the everyday world as“the observer disturbs the system.” Any time a measurement is made, thatmeasurement changes the system being measured, usually in some minisculeway. Measuring the temperature of a liquid, for example, requires that a smallamount of heat be extracted from the liquid and transferred to the thermome-ter. In physical terms, a good measurement is one that disturbs the system as lit-tle as possible. Things are a bit more complicated with social systems, especiallywhen observations by influential members of the mass media can disrupt suchsystems in a significant way. The recent historical record is rife with both inten-tional and unintended disturbances of this kind.
The phenomenon of publicly available ranking systems is one example ofhow making new information available can lead to institutional change. Before1984, when Milton Moskowitz and Robert Levering first wrote their book The
100 Best Companies to Work for in America, people had difficulty learningabout family issues related to job choices because systematically compiled infor-mation was not yet available. When this work was published, the rankingsbecame a force for change that had not previously existed.49 The same effect
90
THE UNCERTAINTY PRINCIPLE
AND THE MASS MEDIA
CHAPTER
20
occurs whenever pollution emissions or campaign contributions are madepublic in an accessible way: embarrassment, education, or enlightened self-interest cause people and institutions to modify their behaviors (check out theScorecard web site at <http://www.scorecard.org> for a good example of howdata and analysis tools can be designed to affect institutional behavior).
Another example of intentional disruption of observed systems is the set ofopinion polls that influence the opinions they attempt to measure.50 The poll-sters ask questions of a carefully selected sample of individuals and then createa press release summarizing some of the key results. These “promotional sur-veys” are increasingly common. They can be conducted by a company for itsown marketing, a non-profit institution for its own fundraising, or by a “neu-tral” third party like a trade magazine. For example, Kiwi Brands (a shoe pol-ish company) polls people on a regular basis on such important topics as therelationship between ambitious people and shiny shoes and what the biggestgrooming mistakes are: not surprisingly, badly shined shoes come out near thetop.51 Another company well known for this tactic makes sugarless gum (“Fourout of five dentists surveyed prefer . . .”). In any case, read the fine print andlearn who was surveyed, how and when they were surveyed, and what ques-tions they were asked. It is easy to create a survey that will give the desired resultand there’s no way to know the truth without going back to the survey ques-tions.
When the mass media report on companies wrestling with financial prob-lems, they often cause unintended harm. Reporters repeat again and again thetime-worn opinions of pundits, both well- and ill-informed. A whirlwind of badpublicity creates uncertainty and doubt among a company’s customers, therebyinfluencing the very event on which the news people are reporting. Thereporters create, in Cialdini’s words, a kind of “social proof” that a companywill fail, thereby making it more likely that it will.
An unintended result of polls can be that their results, taken out of context,often make headlines. People read the headlines and rethink their opinionsbased on them (if “thinking” is the right word to describe this process). The pollitself becomes news, and, in so doing, it influences the outcome of elections andchanges public opinion.52 The exact effect polls have on elections is uncertain,but clearly they can influence the results, as shown by the 1948 U.S. Presidentialelection. Crossen quoted Burns Roper (son of the founder of the Roper pollingorganization) as saying that the 1948 polls “lulled the Republican supporters
PART II I : ASSESS THEIR ANALYSIS • 91
38
17
into a false sense of confidence and scared the bejesus out of organized labor.”The pollsters also believed that people had decided on their presidential choiceweeks before the election, so they stopped regular polling. In addition, tele-phone polls only reached people with telephones, who were generally wealth-ier than the population at large and were therefore more likely to voteRepublican. One famous result was the erroneous Chicago Tribune headline“Dewey defeats Truman!”
Mass media amplify the effect of such observations, and this tendency willonly become more prevalent as the cost of transmitting information continuesto plummet. Corroborate mass media reports with independent informationbefore using them or passing them to others. If you repeat such reports withoutanalysis, you enlighten no one and may cause harm to people and institutionsthat you do not intend. Finally, do your utmost to ensure that your ownresearch results are reported correctly so that you yourself do not fall prey tothis pitfall.
92 • TURNING NUMBERS INTO KNOWLEDGE
Intro
Public opinion is a compound of folly, weakness, prejudice, wrongfeeling, right feeling, obstinacy, and newspaper paragraphs.
— RO B E RT P E E L

93
Now that you’ve gleaned what you can from the analysis of others, it’s timeto roll up your sleeves and get to work. Each of these short chapters offers keyinsights to help you get started. The order in which you read them is not soimportant, so first choose the ones that interest you most, but do read them allbefore you’re through.
CREATE YOUR ANALYSIS
PART
IV
It is a mark of educated people, and a proof of their culture, that inaddressing any problem they seek only so much precision as its naturedemands or its solution requires.
— A R I S TOT L E , in N I C H O M AC H E A N E T H I C S

95
REFLECT
Any successful problem solver develops an array of techniques to spark hercreative process. Bryan Mattimore describes dozens of such techniques in hisbook 99% Inspiration, every single one of which involves reflection on thenature of the problem and the possible solutions.
This reflection can be conscious, unconscious, intellectual, intuitive, planned,unplanned, or all of the above. The key is to give yourself time to reflect on theproblem and let a solution bubble to the top of your consciousness.
Reading books like Mattimore’s can be helpful, but each person mustdevelop techniques that mesh best with her own problem-solving style. WhenI am faced with a particularly thorny issue, I go for a walk or a run, which stirsmy creative juices and removes me from other distractions. You should do whatworks for you: many people listen to music, make pottery, take a bath, or cleanhouse to attain the focus they need for true reflection.
I begin my reflections by listing what I know about the problem and what asatisfactory solution would entail (without knowing the exact solution you canstill define the kind of information that would solve the problem at hand). I thentry alternative approaches in my mind, analyzing each one in terms of likelyeffort expended and probability of success, considering the available data. I letmy mind wander as I walk, which often leads to important insights. By the endof my walk (assuming I haven’t been hit by a car during my reveries) I have atleast one possible way to attack the problem.
It is a rare person who can think creatively in the face of constant interrup-tions. I can’t do it and I suspect most others can’t either. Put aside some timeevery day to reflect a bit. Turn off the phone, close the door, and put up a “Donot disturb” sign. Schedule this reflection period during your particularly pro-ductive times of day.
Brenda Ueland, in her book If You Want to Write, asserts that creativity onlybursts forth when we are idle and thinking on our own, uninterrupted. The con-
10
CHAPTER
21

stant busyness we often experience in modern life just gets in the way of ourown creativity. That’s why she advocates at least half an hour per day of thissort of idleness.
Joe Hyams, in Zen in the Martial Arts, reports how one martial artist(Bronislaw Kaper) takes this idea to its logical extreme and consciously sched-ules entire days to do nothing. By taking time to reflect, you too can use suchpauses to your advantage.
96 • TURNING NUMBERS INTO KNOWLEDGE
Music is the space between the notes. — C L AU D E D E BU S S Y
97
GET UNSTUCK
Sometimes, try as I might, I just can’t push past a seemingly insurmountableobstacle. The problem itself may be especially difficult, or it may pose personalchallenges. Any successful problem solver develops tricks for “getting unstuck”in the face of such obstacles.
One of my most successful tricks is to break my normal routine. Some of mybest insights have come on airplanes where I have time to reflect and have fewof my normal distractions. Go for a walk or a run, ride your bike, or go on atrip. Call a friend you haven’t seen in a while. Do something out of the ordinaryand forget about the problem for a few hours. Brilliant insights often occurwhen you’re relaxed and not thinking about the problem at all.
You can also try working on a related problem or one that’s entirely differ-ent. Either way, you’ll be able to start fresh with the more vexing problem afteryou’ve attacked something a bit more tractable.
An artist I met once described how, once he had an idea for a painting, hewould start on the canvas immediately. Once he got “inside the picture,” thedifficulties would often just melt away. The same technique works for otherkinds of problem solving. If a problem remains daunting, ask if there’s somesmall question that you can answer (jump “into the picture”). Answering thatquestion often results in some obvious follow-up questions that can also beanswered, and addressing these usually puts you on the road to a solution.
A time-tested technique for breaking logjams is to describe the problem tosomeone else. One friend recalled for me how her mother helped her solve mathproblems in junior high school. “Mom couldn’t remember the details about spe-cific math techniques but suggested that I explain the problem to her. By thetime I had given her the details I virtually always had a new insight for a solu-tion. Explaining the problem forced me to think clearly.”
The converse of this approach is also true, which is that clear and preciseexplanations of results indicate clear and precise thinking on the part of an ana-
21
CHAPTER
22
98 • TURNING NUMBERS INTO KNOWLEDGE
lyst. Those who can’t explain their own analysis in an understandable way arenot clear thinkers, and you should steer clear of their work.
There is a series of questions that flow through my mind whenever I’m facedwith a problem unlike any I’ve seen before. These questions, largely based onG. Polya’s book (How to Solve It), are as follows:
• “What is the unknown” (i.e., the number I am trying to calculate)?
• What data are given, and which can be estimated using knowledge Ialready have? Are the given data correct based on other knowledge I have?Are there any additional data I can bring to bear on the problem?
• Can I restate the problem in different words?
• Can I draw a picture or graph framing the problem?
• Is there another similar problem I have already solved that could give methe key to a solution? Can I solve a related problem?
• Can I make some simple assumptions that might help me solve the prob-lem more easily? Can I solve just one part of the problem? Can I solve asimplified version of the problem, using round numbers that are roughlyright?
• Are there any answers that I know are wrong? (Sometimes you can getcloser to an answer by eliminating those that cannot be correct.)
The study of problem solving, which Polya calls “heuristic,” is still a nascentart. Each obstacle is an opportunity to create and refine your own heuristicprocess. Examine your problem solving style, and create techniques for gettingunstuck that work for you.
A mistake is an event that has not yet been fully turned to youradvantage. — E DW I N L A N D
EXERCISE
Ask people whose judgment you respect how they get unstuck; then,try their techniques.Were you surprised at any of their answers?
24
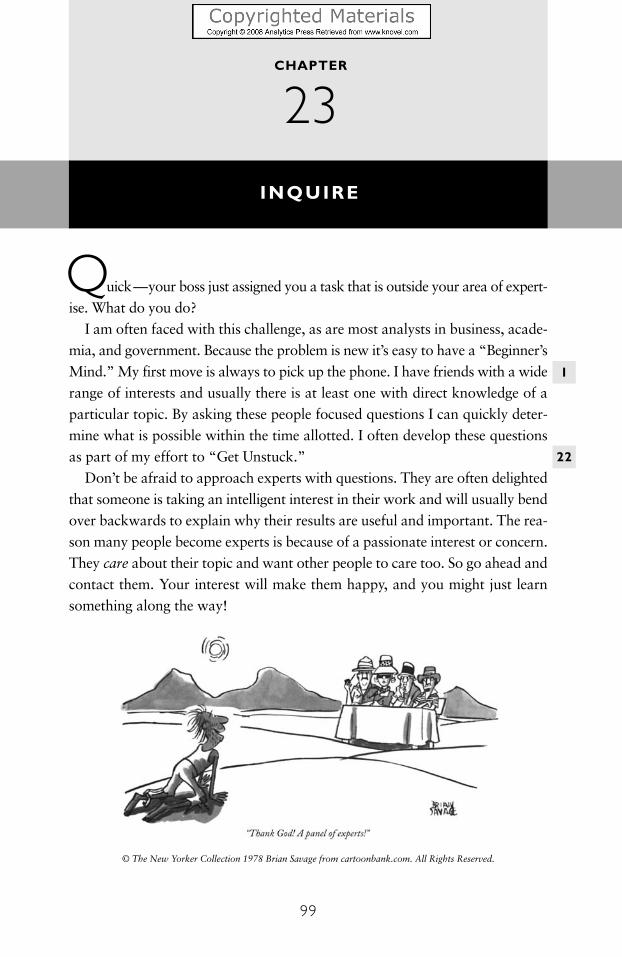
99
Quick—your boss just assigned you a task that is outside your area of expert-ise. What do you do?
I am often faced with this challenge, as are most analysts in business, acade-mia, and government. Because the problem is new it’s easy to have a “Beginner’sMind.” My first move is always to pick up the phone. I have friends with a widerange of interests and usually there is at least one with direct knowledge of aparticular topic. By asking these people focused questions I can quickly deter-mine what is possible within the time allotted. I often develop these questionsas part of my effort to “Get Unstuck.”
Don’t be afraid to approach experts with questions. They are often delightedthat someone is taking an intelligent interest in their work and will usually bendover backwards to explain why their results are useful and important. The rea-son many people become experts is because of a passionate interest or concern.They care about their topic and want other people to care too. So go ahead andcontact them. Your interest will make them happy, and you might just learnsomething along the way!Cart8here
© The New Yorker Collection 1978 Brian Savage from cartoonbank.com. All Rights Reserved.
INQUIRE
CHAPTER
23
1
22
100 • TURNING NUMBERS INTO KNOWLEDGE
If you don’t know anyone who knows about the topic, try the Internet. Useone of the many search engines available for this task (try several, because theyare all virtually guaranteed to give different results). Some search engines (e.g.,<http://www.ask.com>) allow you to ask questions in plain English andreceive focused results that number ten or twenty links (instead of the thou-sands you normally get from such searches). To hone your Internet researchskills, consult some of the recent work that teaches these skills (e.g., <http://dir.yahoo.com/Computers_and_Internet/Internet/World_Wide_Web/Searching_the_Web>).
As discussed earlier, an important tip in Internet research is to consult theFrequently Asked Question sites (FAQs) that exist on the Internet for a trulyamazing number of topics <http://www.faqs.org>. FAQs are compiled byexperts and are often a superb place to begin your research. Use one of the manyexcellent Internet search engines to find FAQs that are relevant to your inquiry.
The web site <http://www.Amazon.com> is a surprisingly good place to doresearch. The main purpose of this site is to sell books, but its search routinesare easy to use, and the site presents for each book a list of other books com-monly purchased by people who bought the featured book. It also allows youto see other books by the same author with one click of the mouse. There aremillions of books in the Amazon.com database, which is more than enough tocover most topics thoroughly. Even out-of-print books are included. I spent aninstructive couple of hours exploring the site early one morning, and I cameaway impressed.
Another place to begin is a major reference work. For example, you can findsomething related to virtually any query in The Statistical Abstract of the U.S.
or in an encyclopedia. The general information contained in these works canoften be enough to get you started untangling even the thorniest research prob-lem. For many social and physical science topics, check out the many differentAnnual Reviews that summarize the latest work in these fields.
If you are still stymied, talk to the reference librarian at the local library.Librarians have an uncanny knack for tackling just this sort of inquiry, and theyare highly skilled professionals. They also love the challenge of finding new andinteresting information. At a minimum, the librarian should be able to pointyou to the standard reference work in any area of knowledge as well as to therelevant trade journals (which can be treasure troves of information about real-world markets and technologies).
9
9
9
Librarians play a crucial role in research. The importance of these profes-sionals came to the fore in a reporter’s tale of searching for information in thespanking new Main Library in the city of San Francisco.53 The reporter triedsearching for books on a probably mythical Christian king who was the impe-tus for several important missions of exploration during medieval times.Although his topic may seem obscure, the reporter’s experience will ring famil-iar to most. He tried first to use the library’s electronic card catalog and cameup with two listings on his subject, one of which seemed irrelevant. On theadvice of the reference librarian, he then logged onto the library’s on-line data-base and found seven new listings that didn’t show up in the first search. Thenhe found another new listing by changing the order of his search terms from“Prester John” to “John, Prester.” Finally, he consulted the old card catalog thatthe computer terminals had largely displaced and found an additional reference(a book that was so old that it hadn’t been entered into the computerized data-base and was kept not in the main collection but in a storage annex).
Without the help of a librarian, this reporter might have missed some keysources. Only a librarian could tell him the tricks that revealed the sources hesought in an expeditious manner. Trial and error can yield results, but yoursearch will be far quicker if you consult a librarian first.
Working outside your area of expertise is difficult, but can be rewarding. Aswe know from the history of science, some of the most important discoverieswere made by scientists formally trained in another discipline. Developing theskills to explore new fields will serve you well in any endeavor you undertake.
PART IV : CREATE YOUR ANALYSIS • 101
Minds think with ideas, not information. No amount of data, band-width, or processing power can substitute for inspired thought.
— C L I F F O R D S TO L L
One of the defining features of the literary character Sherlock Holmes is hisscientific approach to solving mysteries. He has an immense store of knowledgeof past criminal activity upon which he can rely. He systematically collectsinformation from the scene of the crime and notes seemingly trivial details thatmight bear upon his case. He does not prejudge the case in advance of the facts.Finally, he is skilled in weaving alternative theories that might fit the facts.
Holmes’ approach is not unlike that required to solve problems in the mod-ern world. Any problem solver worth her salt knows as much as possible aboutdata and previous work on the problem at hand (if you’re new to it, then go thelibrary and read). Attention to detail is also essential, as is not allowing your ini-tial snap judgments to color your interpretation of parts of the puzzle. Andweaving alternative theories to fit the facts is perhaps the most important skillof a seasoned problem solver.
Spreadsheets54 are my favorite problem-solving tool because they allow me tocreate many different scenario calculations easily and quickly. Business peopleuse them to create financial projections for their business plans. Scientists usethem to analyze data from their experiments. Policy analysts use them to proj-ect the effects of proposed government policies on people’s lives and on theeconomy as a whole. In each case, spreadsheets enable both quick scoping cal-culations and extremely detailed analysis.
Sometimes in creating a spreadsheet you discover an intermediate or finalresult that is either internally inconsistent with another such result from thesame calculations or that cannot be right based on first principles. An exampleof the first kind of inconsistency would be to have a business plan that showedoperating losses for the first five years of the forecast but that showed no expen-ditures of startup capital after five years (the company would need to use thestartup capital to pay for the operating losses until the company became prof-itable). An example of the latter inconsistency would be to project that a small
102
BE A DETECTIVE
26
CHAPTER
24
PART IV : CREATE YOUR ANALYSIS • 103
startup company would gain 99% market share within a few years and attractno competitors (any time an important business niche appears, competitorsalmost always pop up to contest it).
When you discover such inconsistencies in your spreadsheets, Holmes’ tech-nique of systematically investigating alternative theories comes into play. Beginby making a list of possible reasons to explain why the calculation is in error;then, trace the flow of data through the calculations, starting from the point atwhich you noticed the inconsistency. Look at each and every input to a partic-ular calculation to see whether you’ve made any obvious errors in entering for-mulas or data; trace the calculations all the way back to the beginning. If, as iscommonly the case with complicated calculations, you still can’t figure outwhat’s wrong, recreate your calculation in a new spreadsheet, usually using asimplified version of the calculation and plugging in data that are roughly right(and that are nice round numbers like 100 or 1,000). This approach allows youto begin with a clean slate. Often when you are immersed in calculations youcan forget small details. Starting fresh in this way helps you catch those errors.
One quick check you can do on your spreadsheet calculations is to vary a keyinput number, and see if the results change as you expect. If you increase thatnumber by 50%, do you expect the result to increase or decrease by a compa-rable amount, or by half that amount? If you make that number close to zeroor extremely large, do the results behave as anticipated? If your results vary inan unexpected way or in unusual proportions, your calculation is wrong oryour conceptualization of the problem is flawed in some way. Either way,you’ve learned something.
If two complex calculations should yield the same result but do not, breakdown each calculation into its component parts and compare each part of thefirst calculation to the corresponding one in the second. This technique willmake it obvious where in the calculations any differences lay. For example,assume that a formula in a spreadsheet has three terms that add to a total (Total= A + B + C) and that an independent calculation has three terms that shouldalso add to that total (Total = X + Y + Z). Assume also that the value of eachterm in the first calculation should correspond to the value of each term in thesecond calculation (A should equal X, for example). If the result of the two cal-culations is different, then compare A to X, B to Y, C to Z, and see if the dif-ferences in the overall total can be explained by differences between any of theindividual components. You can usually narrow down the discrepancy to one
or more of the terms in the equation and eliminate some possibilities. Althoughtedious, this technique can help you identify the potential explanations for suchdiscrepancies. It is especially useful when each of the terms is, by itself, a com-plex calculation.
When working with spreadsheets, many people copy and paste data fromone sheet into another. This practice is a pernicious one because it makes updat-ing your calculations later a difficult task and makes it nearly impossible todetermine how the calculations flow once they are no longer fresh in your mind.Obey this golden rule: Never paste values from one spreadsheet into another.Link spreadsheets together directly so that when you change your calculationsin the first spreadsheet, the other one is automatically updated. Following thisrule helps you track down errors in the calculation much more quickly. It alsosaves you time if you have to change input assumptions later, and it creates aspecial kind of documentation of your calculations.
If your results look too good to be true, they probably are. Be suspicious ofyour own calculations when you first create them. Dig into the numbers todetermine whether you can trust them.
Another common technique used by detectives is to consider the motives orinterests of the person or institution putting forth a particular viewpoint. I sus-pect, for example, that a lobbyist for the tobacco industry might be prone tooverlook evidence that smoking is harmful. Seek out sources whose interestscoincide with the truth, and discount somewhat the opinions of those with avested interest. However, remember that having an interest or an opinion is notevidence of being biased any more than not having an opinion is evidence ofbeing unbiased: some people (a rare few) are honest even to their own detriment.
104 • TURNING NUMBERS INTO KNOWLEDGE
33
27
14
When you have eliminated the impossible, whatever remains, howeverimprobable, must be the truth. — S H E R L O C K H O L M E S
105
In the real world, so many things change at once that it is often difficult todecipher cause and effect. One of the most compelling techniques for making apoint in the face of this complexity is to find or create a consistent comparisonthat eliminates the complicating factors and illustrates your point in an unam-biguous way. A pure consistent comparison is one where the only feature dif-fering between two examples is the one that illustrates your point. Even whenthere are some minor differences, you can often correct for these and still cre-ate a powerful comparison.
Isolating the root cause by creating an experiment is one of the most funda-mental techniques of modern science. When medical researchers create “controlgroups” to compare to people being given an experimental drug, they are cre-ating a consistent comparison or as near to one as is humanly possible.Although you can’t always create such an experiment, you can often uncoverone if you look carefully. I discovered such a case in the early 1990s, which ledme to write one of my favorite papers. Since the 1970s, U.S. automakers hadinsisted that they were unable to increase the fuel efficiency of passenger cars ina cost-effective way. In 1992, Honda introduced a new Civic hatchback thatwas the same size and had the same engine power as the model it replaced, butit was 56% more fuel efficient than the previous year’s model. I read news arti-cles about this new car and badgered various friends who work on transporta-tion issues to investigate this case further. After several months of fruitless nag-ging I decided to explore it myself, in collaboration with two colleagues fromthe Union of Concerned Scientists.
The two cars differed slightly in features but were essentially identicalexcept for their fuel economy. The case was therefore a good one to use to esti-mate the actual retail costs of improving fuel economy in the real world. Aftercorrecting for the costs of the different features (based on dealer cost and listprices), the more efficient Civic (the 1992 VX) cost about $700 more than the
CREATE CONSISTENT COMPARISONS
CHAPTER
25

1991 Civic DX, and saved about 110 gallons of gasoline per year for typicaldrivers. The added cost would pay for itself in about five years at then prevail-ing fuel prices, making it a cost-effective investment.
The example was an exceptionally powerful one because the size and enginepower of the two vehicles were identical, and the feature list was nearly so. Asa check on the calculation of the retail cost, we also investigated the projectedretail cost of the technologies used to improve the VX’s fuel economy, based onindependent engineering estimates and found that these estimates were quiteclose to our calculation of the actual retail cost difference between the 1991 DXand the 1992 VX. This independent check gave us confidence that we were onthe right track.
The 1993 Civic VX gets about fifty miles per gallon on the freeway yet holdsfour passengers comfortably. It’s not a luxury vehicle by any means, but it’s atestament to what automakers can do if they put their minds to it. The paperdocumenting this case subsequently won a prize from the National ResearchCouncil, which is an indication of the compelling nature of a well-chosen con-sistent comparison.
106 • TURNING NUMBERS INTO KNOWLEDGE
The cure for boredom is curiosity. There is no cure for curiosity.— D O ROT H Y PA R K E R
18
107
Life is about making choices in the face of uncertainty. One oft-neglectedapproach to such decision making is the art of building scenarios. The purposeof scenario analysis, as explained by Peter Schwartz in his now classic book The
Art of the Long View, is to explore several possible futures in a systematic way.No matter how things turn out, the analyst will have on the shelf a scenario (orstory) that resembles that future and will have thought through in advance thelikely consequences of that scenario on the decisions at hand. Such a story “res-onates in some ways with what [people] already know and leads them from thatresonance to reperceive the world.”
The steps for successful scenario development are as follows:
• Define the question: Scenarios should be developed in advance of somemajor strategic decision so that when the time to decide arrives, theoptions are laid out in detail and the implications of each decision path aremade manifest. Such a decision might be ‘Should our company expandinto new markets next year, or should we focus on expanding our marketshare in our current markets?’
• Determine the key factors affecting the system: The next step is to identifythe key factors determining whether the focal decision will succeed or fail.These factors might include such things as customer acceptance of a newtechnology or competitor response to the new strategy. They could alsoinclude demographics, inflation, commodity prices, technological change,public policies, or political instability. Some of them are beyond the con-trol of any individual or institution (“predetermined elements”), and oth-ers are subject to human influence.
• Evaluate factors by importance and uncertainty: Of the trends and drivingforces identified in the previous step, a small number will be both highly
TELL A GOOD STORY
3
CHAPTER
26
108 • TURNING NUMBERS INTO KNOWLEDGE
important and highly uncertain (see also Morgan and Henrion’s bookUncertainty). These are the issues upon which differences in the scenarioswill be based. Predetermined elements don’t differ among scenarios.
• Choose the scenario set: The most important and uncertain factors shouldbe combined in various ways to define the set of scenarios to be considered.These factors are the dimensions of uncertainty that the scenarios willexplore. For example, the scenario set for an analysis of the costs of reduc-ing carbon emissions might include variations in fuel prices and costs of dif-ferent technologies, which are two of the key sources of uncertainty. Onescenario (a worst case for carbon reductions) might combine low fossil fuelprices with pessimistic technology costs for non-fossil sources. Another sce-nario might combine high fossil fuel prices with optimistic technology costs.The set of scenarios chosen also frames the story lines that will emerge fromthe scenarios.
• Add detail to the scenarios: Each of the key driving forces and factorsfrom the second step should be assessed for each of the main scenarios.Usually, these factors can be assigned relative rankings (e.g., ‘Inflationshould be higher than average in scenario 1 and lower than average inscenario 2’), which can then be translated into actual numbers. The exactnumbers are not so important as long as they reflect in a credible waypeople’s expectations about how the future might unfold in a particularscenario. The scenario must then be woven into a plausible story describ-ing a course of events that would result in the scenario’s final outcome.Each scenario must be named in a way that vividly reminds people of itsessence.
• Determine the implications: Revisit the decision identified in step 1, andassess how that decision would fare in each of the different scenarios. If thedecision (e.g., expanding into new markets) would lead to success (asdefined in step 2) for all or most of the scenarios considered, that decisionis probably a wise one. If it is likely to be successful in only one scenario,the decision is “a high-risk gamble . . . especially if the company has littlecontrol over the likelihood of the required scenario coming to pass.”
• Define metrics for success: Once the scenarios have been developed, it iscrucial to identify a few key indicators by which decision makers can mon-itor the evolution of events. These indicators are used to determine whichof the different scenarios best matches up with actual events and can beused to trigger an institutional response (e.g., ‘if inflation gets up to 7%
and the stock market goes down 15%, then do X’). If you can’t measureit, you can’t manage it, so defining appropriate indicators is crucial tosuccess.
Schwartz believes that scenarios are successful when “they are both plausibleand surprising; when they have the power to break old stereotypes; and whenthe makers assume ownership of them and put them to work.” The institutionalprocess of creating scenarios (what Schwartz calls “holding a strategic conver-sation”) can also reveal new opportunities for an organization and promoteteam building among its employees.
Another name for scenario analysis is the commonly used scientific techniqueof creating a thought experiment. All scientists use this technique, in which theyimagine certain real-world complexities to be absent and then think through theconsequences for the situation they are investigating. For example, Galileo imag-ined a world in which the complicating effects of friction did not exist and, bydoing so, was able to make great strides in what would come to be called the fieldof kinetics (the study of moving objects). Such thought experiments are as valu-able in business as in science. Instead of limiting your imagination by current cir-cumstances and constraints, imagine a world in which some key constraints don’texist, and ask yourself how you or your institution might respond.
Most of Schwartz’s examples of scenario analysis have only a small quanti-tative component, but many other futurists are obsessed with numbers andcomputer models. Most explorations of the future with which I am directlyfamiliar err by focusing too much on the mechanics of forecasting and quanti-tative analysis (e.g. on particular modeling tools) and far too little on carefulscenario development based on the procedures described above. Quantitativeanalysis can lend coherence and credence to scenario exercises by elaborating onconsequences of future events, but modeling tools should support that processrather than drive it, as is so often the case.
The relationship between data, anecdotes, models, and scenarios is summarizedin Figure 26.1, adapted from Ghanadan and Koomey (2005). Raw data are dif-ficult both to analyze and interpret, so people rely more on anecdotes (which illus-trate concepts well but have little quantitative rigor) or models (the results ofwhich often don't tell a coherent story but are at least easy to evaluate in a quan-titative way). Good scenarios combine the narrative power of anecdotes with theadditional quantitative rigor that comes from the use of models (even simple ones).
PART IV : CREATE YOUR ANALYSIS • 109
30
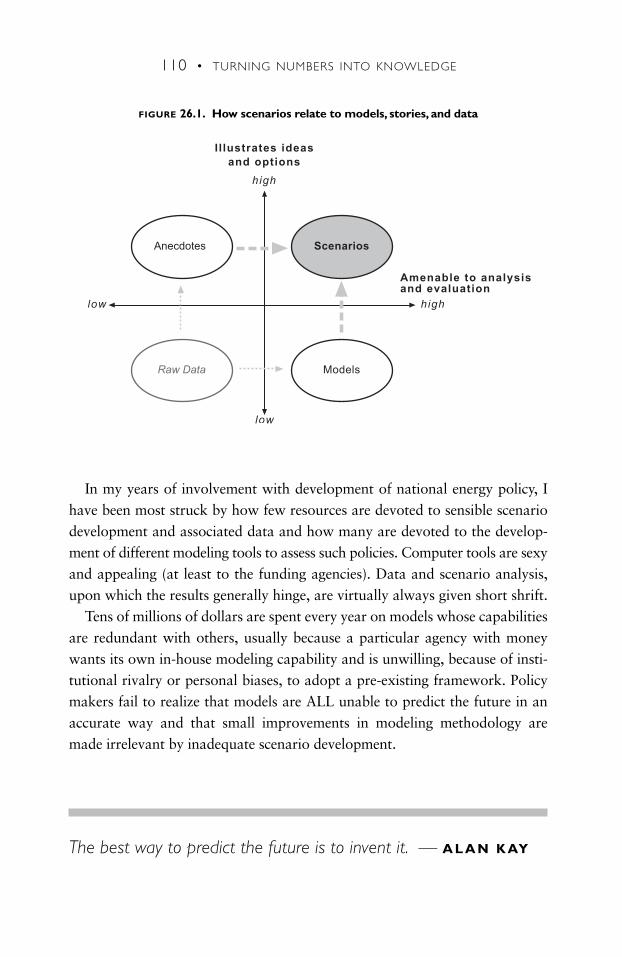
In my years of involvement with development of national energy policy, Ihave been most struck by how few resources are devoted to sensible scenariodevelopment and associated data and how many are devoted to the develop-ment of different modeling tools to assess such policies. Computer tools are sexyand appealing (at least to the funding agencies). Data and scenario analysis,upon which the results generally hinge, are virtually always given short shrift.
Tens of millions of dollars are spent every year on models whose capabilitiesare redundant with others, usually because a particular agency with moneywants its own in-house modeling capability and is unwilling, because of insti-tutional rivalry or personal biases, to adopt a pre-existing framework. Policymakers fail to realize that models are ALL unable to predict the future in anaccurate way and that small improvements in modeling methodology aremade irrelevant by inadequate scenario development.
110 • TURNING NUMBERS INTO KNOWLEDGE
The best way to predict the future is to invent it. — A L A N K AY
I l lustrates ideasand options
Amenable to analysis and evaluatio n
Anecdotes
high
high
low
low
Scenarios
ModelsRaw Data
FIGURE 26.1. How scenarios relate to models, stories, and data

111
Anyone who has delved into data from the real world knows that they’remessy. Survey takers can write down the wrong response. People entering datainto a computer can type in the wrong numbers. Computers sometimes garbledata because of software bugs (especially when converting one file format toanother). Data formats become obsolete as software changes. Electronic data
DIG INTO THE NUMBERS
© 2001 by Tom Chen. All Rights Reserved.
CHAPTER
27
112 • TURNING NUMBERS INTO KNOWLEDGE
recorders break or go out of adjustment. Analysts mislabel units and make cal-culational errors.
“Cleaning the data” to correct for such problems is almost always necessary,but this step is often ignored. Always ask about the process used to clean thedata. If the response is just a blank stare or worse, you know you’re in trouble.Many companies (like AT&T and Sega of America) now assign people to checkfor data quality in the face of all the problems associated with real data.
Some of the more famous examples of how small mistakes in data process-ing can have disastrous results are found in the space program. The Mariner Ispacecraft went off course soon after launch and had to be destroyed. The causeof the malfunction was a missing hyphen in a single line of Fortran code. ArthurC. Clarke later quipped that this $80 million launch was ruined by “the mostexpensive hyphen in history.”55 More recently, NASA’s Mars Climate Orbiterwas lost in space because engineers on the project forgot to convert Englishunits to metric units in a key data file, a mistake that cost scientists years ofwork and taxpayers $125 million.56
Bad data can have a real cost for a business. If a 500,000-piece mailing usesan address list with an error rate of 20%, the company wastes $300,000 bysending mailings to incorrect addresses. It loses even more money becauseamong those 100,000 missed prospects are about 1,500 people who wouldhave become customers and purchased thousands of dollars worth of the com-pany’s products over their lifetime. The losses from these missed customers canbe many times greater than the immediate direct losses.57
It is crucial to pore over raw survey data to check for anomalies before doingextensive analyses. For example, typographical errors can lead numbers to beten, one hundred, or one million times bigger than they should be. Looking overthe raw data can help you identify such problems before you waste time doinganalysis using incorrect numbers.
Bad data can ruin your credibility and call your work into question. Even ifthere’s only one small mistake, it makes your readers or listeners wonder howmany other mistakes have crept into your analysis. It’s difficult to restore yourcredibility after some obvious mistake is revealed, so avoid this problem in thefirst place. Dig into your numbers and root out these problems before you final-ize your paper or talk.
PART IV : CREATE YOUR ANALYSIS • 113
S O M E S P E C I F I C A DV I C E
If your data come from a non-electronic source, type the numbers into the
spreadsheet yourself (assuming the amount of data is manageable). There’s nosubstitute for this effort, even if you are a highly paid executive, because it willhelp you identify inconsistencies and problems with the data and give you ideasfor how to interpret them. This technique also gives you a feeling for the datathat can’t be replicated in any other way. You will almost surely see patterns andgain unexpected insights from this effort.
Check that the main totals are the sum of the subtotals. Most documents arerife with typographical errors and incorrect calculations. You should thereforenot rely blindly on any data source’s summations but calculate them from thebase data. You can check your typing accuracy by comparing the sums to thosein the source of data. If they match exactly, it is unlikely that your typing is inerror. Even if you don’t check these sums, you can bet that some of your read-ers or listeners will. Do it yourself, and avoid that potential embarrassment.
Check that the information is current. Don’t forget that business and govern-ment statistics are revised all the time. Make sure you know the vintage of theinput data used in the analysis. For example, don’t compare analysis results gen-erated using one year’s census data with those based on another year’s data(unless your sole purpose is to analyze trends over time).
Check relationships between numbers that should be related in a predictable way.
Such comparisons can teach valuable lessons. For example, when examining dataon carbon emissions of different countries, a newcomer to the field of greenhousegas emissions analysis might expect that the amount of carbon emitted per per-son would not differ much among industrialized countries. In examining suchdata for 2004, however, we find large differences in carbon emitted per person,from less than 1.6 metric tons/person/yr in Switzerland to about 7 metric tons/person/yr in Luxembourg. Determining why such differences exist is the logicalnext step, which will inevitably lead to further analysis and understanding.
Check that you can trace someone else’s calculation in a logical way. If youcan’t, you can at least begin listing the questions you need to answer to start
114 • TURNING NUMBERS INTO KNOWLEDGE
tracing the calculation. Ultimately, if you can’t reproduce the calculation, theauthor has broken a fundamental rule of good data presentation and his analy-sis is suspect.
Compare the numbers to something else with which you are familiar, as a “first-
order” sanity check. These comparisons can show you whether or not you areon the right track. Presenting such comparisons in reports and talks can alsoincrease your credibility with your readers or listeners because it shows thatyour results “pass the laugh test.”
Normalize numbers to make comparisons easier. For example, the true size oftotal U.S. gross national product (GNP) in trillions of dollars per year is difficultto grasp for most people but if normalized to dollars per person per year will bea bit more understandable. Common bases for such normalizations are popula-tion (per person or per capita), economic activity (per dollar of GNP), or phys-ical units of production (per kilowatt hour or per kilogram of steel produced).
If you have information that extends over time (“time series data”), normalize
it to a base year to enhance comparisons. By expressing such data as an index(e.g., 1940 = 1.0), you can compare trends to those of other data that might berelated. For example, if you plot U.S. raw steel production (Figure 27.1), pop-ulation (Figure 27.2), and GNP (Figure 27.3) in separate graphs, it is difficultto gain perspective on how fast steel production is changing over time relativeto these other two important determinants of economic and social activity.However, if you plot steel production over time as an index with 1940 = 1.0 (seeFigure 27.4), you can plot population and GNP on the same graph. Such agraph will instantly show whether growth rates in the data differ.
In this example, real GNP grew by a factor of more than five from 1940 to1990. U.S. steel production roughly doubled by 1970 and then declined by1990 to roughly 50% above 1940 levels. The population in 1990 just aboutdoubled from 1940 levels.
The trends for U.S. steel production in Figure 27.4 dramatically illustrate thechanging fortunes of steel in a postindustrial economy. Just after World War II,steel use per capita increased as automobile ownership expanded and use ofsteel for bridges and other construction also increased. After 1970, the steelindustry began to face serious competition from foreign steel makers as well as
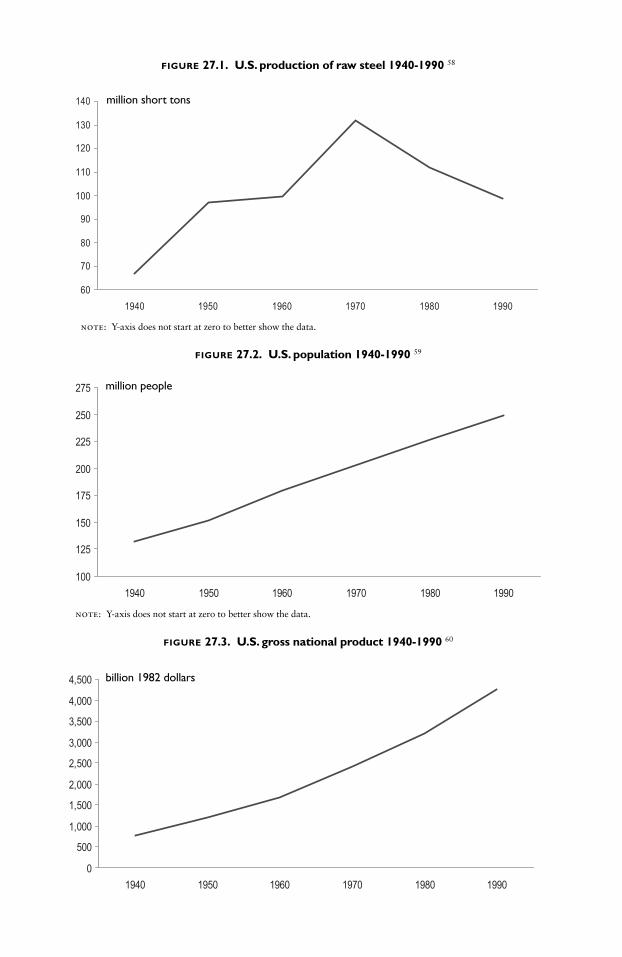
FIGURE 27.1. U.S. production of raw steel 1940-1990 58
FIGURE 27.2. U.S. population 1940-1990 59
FIGURE 27.3. U.S. gross national product 1940-1990 60
60
70
80
90
100
110
120
130
140
1940 1950 1960 1970 1980 1990
( )
0
500
1,000
1,500
2,000
2,500
3,000
3,500
4,000
4,500
1940 1950 1960 1970 1980 1990
(billions of 1982 dollars)
100
125
150
175
200
225
250
275
1940 1950 1960 1970 1980 1990
(millions of people)
million short tons
million people
billion 1982 dollars
note: Y-axis does not start at zero to better show the data.
note: Y-axis does not start at zero to better show the data.
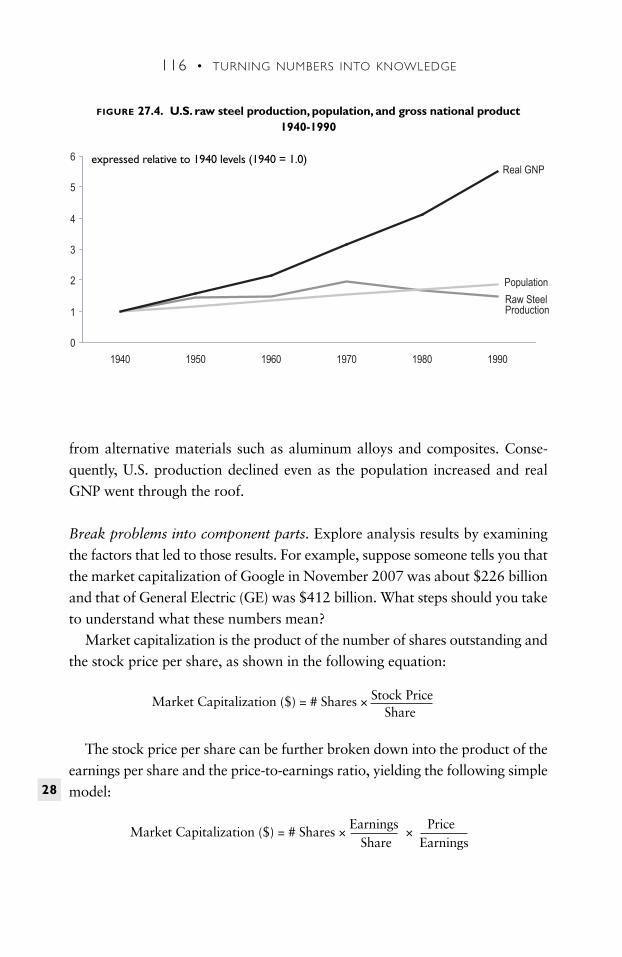
116 • TURNING NUMBERS INTO KNOWLEDGE
from alternative materials such as aluminum alloys and composites. Conse-quently, U.S. production declined even as the population increased and realGNP went through the roof.
Break problems into component parts. Explore analysis results by examiningthe factors that led to those results. For example, suppose someone tells you thatthe market capitalization of Google in November 2007 was about $226 billionand that of General Electric (GE) was $412 billion. What steps should you taketo understand what these numbers mean?
Market capitalization is the product of the number of shares outstanding andthe stock price per share, as shown in the following equation:
Market Capitalization ($) = # Shares × Stock PriceShare
The stock price per share can be further broken down into the product of theearnings per share and the price-to-earnings ratio, yielding the following simplemodel:
Market Capitalization ($) = # Shares × Earnings
×Price
Share Earnings
28
FIGURE 27.4. U.S. raw steel production, population, and gross national product 1940-1990
Raw Steel Production
Population
Real GNP
0
1
2
3
4
5
6
1940 1950 1960 1970 1980 1990
expressed relative to 1940 levels (1940 = 1.0)
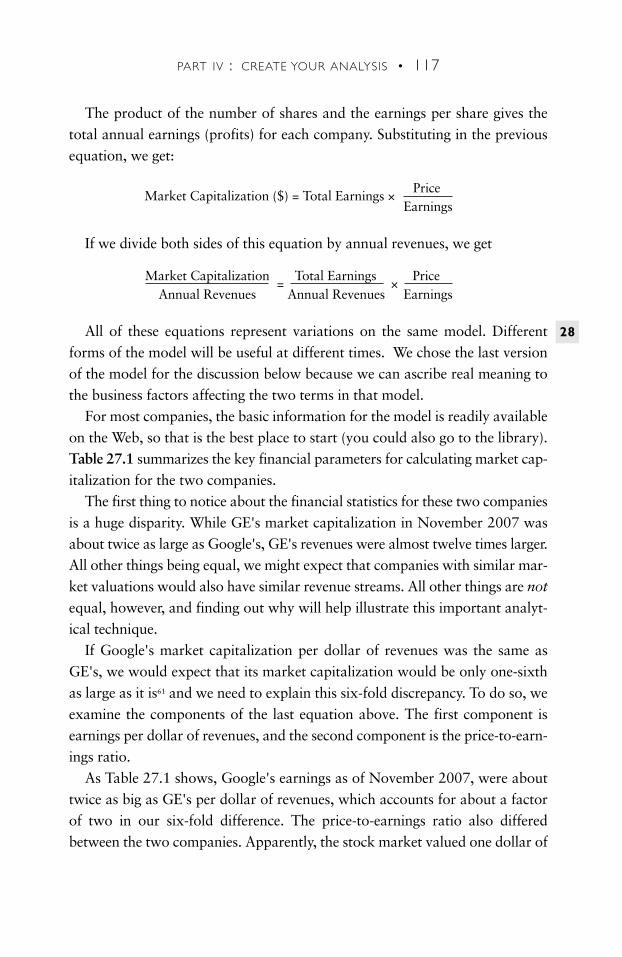
PART IV : CREATE YOUR ANALYSIS • 117
The product of the number of shares and the earnings per share gives thetotal annual earnings (profits) for each company. Substituting in the previousequation, we get:
Market Capitalization ($) = Total Earnings × Price
Earnings
If we divide both sides of this equation by annual revenues, we get
Market Capitalization=
Total Earnings×
PriceAnnual Revenues Annual Revenues Earnings
All of these equations represent variations on the same model. Differentforms of the model will be useful at different times. We chose the last versionof the model for the discussion below because we can ascribe real meaning tothe business factors affecting the two terms in that model.
For most companies, the basic information for the model is readily availableon the Web, so that is the best place to start (you could also go to the library).Table 27.1 summarizes the key financial parameters for calculating market cap-italization for the two companies.
The first thing to notice about the financial statistics for these two companiesis a huge disparity. While GE's market capitalization in November 2007 wasabout twice as large as Google's, GE's revenues were almost twelve times larger.All other things being equal, we might expect that companies with similar mar-ket valuations would also have similar revenue streams. All other things are not
equal, however, and finding out why will help illustrate this important analyt-ical technique.
If Google's market capitalization per dollar of revenues was the same asGE's, we would expect that its market capitalization would be only one-sixthas large as it is61 and we need to explain this six-fold discrepancy. To do so, weexamine the components of the last equation above. The first component isearnings per dollar of revenues, and the second component is the price-to-earn-ings ratio.
As Table 27.1 shows, Google's earnings as of November 2007, were abouttwice as big as GE's per dollar of revenues, which accounts for about a factorof two in our six-fold difference. The price-to-earnings ratio also differedbetween the two companies. Apparently, the stock market valued one dollar of
28
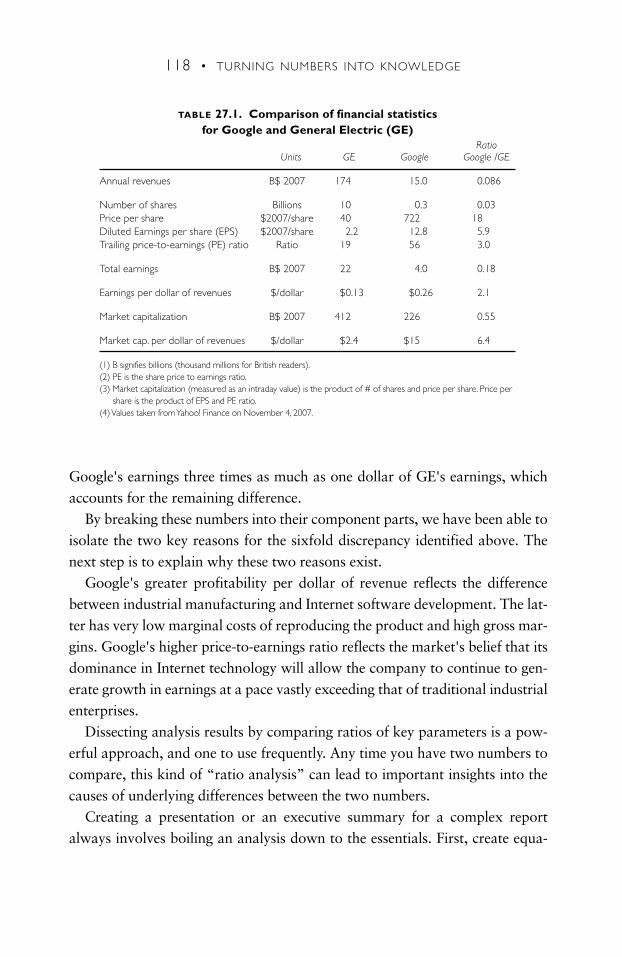
118 • TURNING NUMBERS INTO KNOWLEDGE
Google's earnings three times as much as one dollar of GE's earnings, whichaccounts for the remaining difference.
By breaking these numbers into their component parts, we have been able toisolate the two key reasons for the sixfold discrepancy identified above. Thenext step is to explain why these two reasons exist.
Google's greater profitability per dollar of revenue reflects the differencebetween industrial manufacturing and Internet software development. The lat-ter has very low marginal costs of reproducing the product and high gross mar-gins. Google's higher price-to-earnings ratio reflects the market's belief that itsdominance in Internet technology will allow the company to continue to gen-erate growth in earnings at a pace vastly exceeding that of traditional industrialenterprises.
Dissecting analysis results by comparing ratios of key parameters is a pow-erful approach, and one to use frequently. Any time you have two numbers tocompare, this kind of “ratio analysis” can lead to important insights into thecauses of underlying differences between the two numbers.
Creating a presentation or an executive summary for a complex reportalways involves boiling an analysis down to the essentials. First, create equa-
TABLE 27.1. Comparison of financial statistics for Google and General Electric (GE)
RatioUnits GE Google Google /GE
Annual revenues B$ 2007 174 15.0 0.086
Number of shares Billions 10 0.3 0.03Price per share $2007/share 40 722 18Diluted Earnings per share (EPS) $2007/share 2.2 12.8 5.9Trailing price-to-earnings (PE) ratio Ratio 19 56 3.0
Total earnings B$ 2007 22 4.0 0.18
Earnings per dollar of revenues $/dollar $0.13 $0.26 2.1
Market capitalization B$ 2007 412 226 0.55
Market cap. per dollar of revenues $/dollar $2.4 $15 6.4
(1) B signifies billions (thousand millions for British readers).(2) PE is the share price to earnings ratio.(3) Market capitalization (measured as an intraday value) is the product of # of shares and price per share. Price per
share is the product of EPS and PE ratio.(4) Values taken from Yahoo! Finance on November 4, 2007.
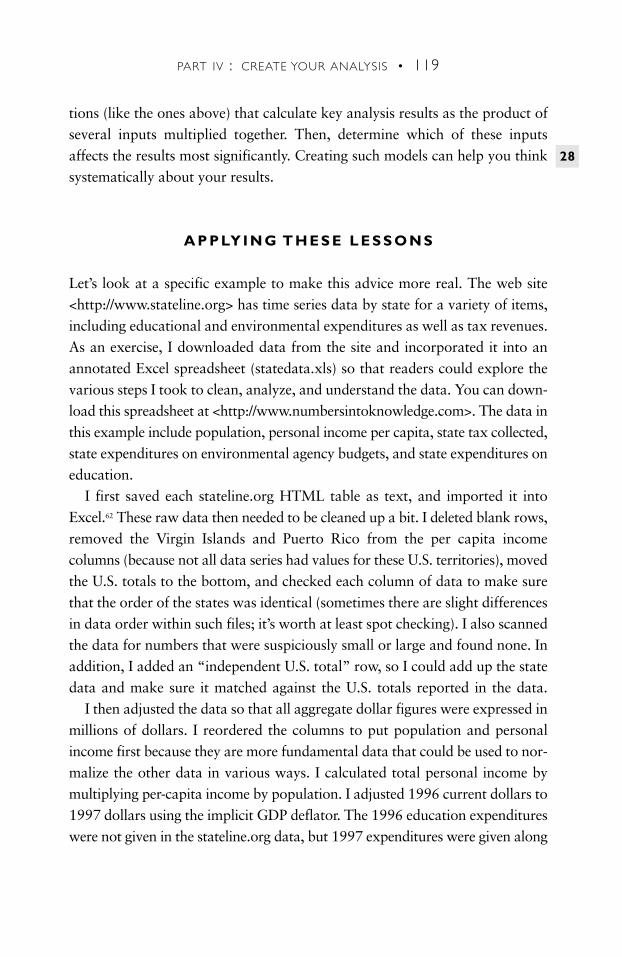
PART IV : CREATE YOUR ANALYSIS • 119
tions (like the ones above) that calculate key analysis results as the product ofseveral inputs multiplied together. Then, determine which of these inputsaffects the results most significantly. Creating such models can help you thinksystematically about your results.
A P P LY I N G T H E S E L E S S O N S
Let’s look at a specific example to make this advice more real. The web site<http://www.stateline.org> has time series data by state for a variety of items,including educational and environmental expenditures as well as tax revenues.As an exercise, I downloaded data from the site and incorporated it into anannotated Excel spreadsheet (statedata.xls) so that readers could explore thevarious steps I took to clean, analyze, and understand the data. You can down-load this spreadsheet at <http://www.numbersintoknowledge.com>. The data inthis example include population, personal income per capita, state tax collected,state expenditures on environmental agency budgets, and state expenditures oneducation.
I first saved each stateline.org HTML table as text, and imported it intoExcel.62 These raw data then needed to be cleaned up a bit. I deleted blank rows,removed the Virgin Islands and Puerto Rico from the per capita incomecolumns (because not all data series had values for these U.S. territories), movedthe U.S. totals to the bottom, and checked each column of data to make surethat the order of the states was identical (sometimes there are slight differencesin data order within such files; it’s worth at least spot checking). I also scannedthe data for numbers that were suspiciously small or large and found none. Inaddition, I added an “independent U.S. total” row, so I could add up the statedata and make sure it matched against the U.S. totals reported in the data.
I then adjusted the data so that all aggregate dollar figures were expressed inmillions of dollars. I reordered the columns to put population and personalincome first because they are more fundamental data that could be used to nor-malize the other data in various ways. I calculated total personal income bymultiplying per-capita income by population. I adjusted 1996 current dollars to1997 dollars using the implicit GDP deflator. The 1996 education expenditureswere not given in the stateline.org data, but 1997 expenditures were given along
28
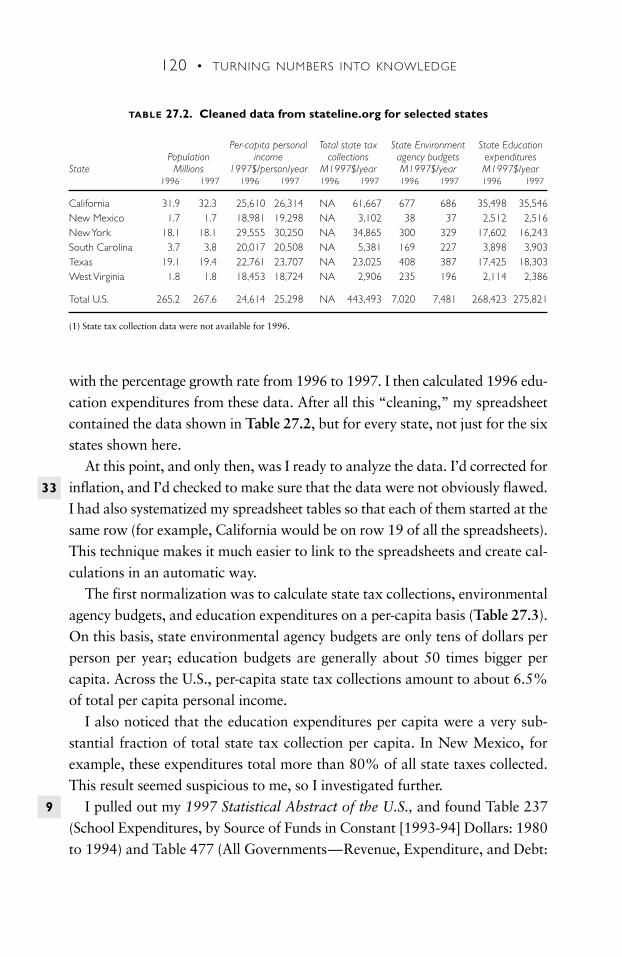
120 • TURNING NUMBERS INTO KNOWLEDGE
with the percentage growth rate from 1996 to 1997. I then calculated 1996 edu-cation expenditures from these data. After all this “cleaning,” my spreadsheetcontained the data shown in Table 27.2, but for every state, not just for the sixstates shown here.
At this point, and only then, was I ready to analyze the data. I’d corrected forinflation, and I’d checked to make sure that the data were not obviously flawed.I had also systematized my spreadsheet tables so that each of them started at thesame row (for example, California would be on row 19 of all the spreadsheets).This technique makes it much easier to link to the spreadsheets and create cal-culations in an automatic way.Table27.2here.
The first normalization was to calculate state tax collections, environmentalagency budgets, and education expenditures on a per-capita basis (Table 27.3).On this basis, state environmental agency budgets are only tens of dollars perperson per year; education budgets are generally about 50 times bigger percapita. Across the U.S., per-capita state tax collections amount to about 6.5%of total per capita personal income.Table27.3here
I also noticed that the education expenditures per capita were a very sub-stantial fraction of total state tax collection per capita. In New Mexico, forexample, these expenditures total more than 80% of all state taxes collected.This result seemed suspicious to me, so I investigated further.
I pulled out my 1997 Statistical Abstract of the U.S., and found Table 237(School Expenditures, by Source of Funds in Constant [1993-94] Dollars: 1980to 1994) and Table 477 (All Governments—Revenue, Expenditure, and Debt:
TABLE 27.2. Cleaned data from stateline.org for selected states
Per-capita personal Total state tax State Environment State EducationPopulation income collections agency budgets expenditures
State Millions 1997$/person/year M1997$/year M1997$/year M1997$/year1996 1997 1996 1997 1996 1997 1996 1997 1996 1997
California 31.9 32.3 25,610 26,314 NA 61,667 677 686 35,498 35,546New Mexico 1.7 1.7 18,981 19,298 NA 3,102 38 37 2,512 2,516New York 18.1 18.1 29,555 30,250 NA 34,865 300 329 17,602 16,243South Carolina 3.7 3.8 20,017 20,508 NA 5,381 169 227 3,898 3,903Texas 19.1 19.4 22,761 23,707 NA 23,025 408 387 17,425 18,303West Virginia 1.8 1.8 18,453 18,724 NA 2,906 235 196 2,114 2,386
Total U.S. 265.2 267.6 24,614 25,298 NA 443,493 7,020 7,481 268,423 275,821
(1) State tax collection data were not available for 1996.
33
9
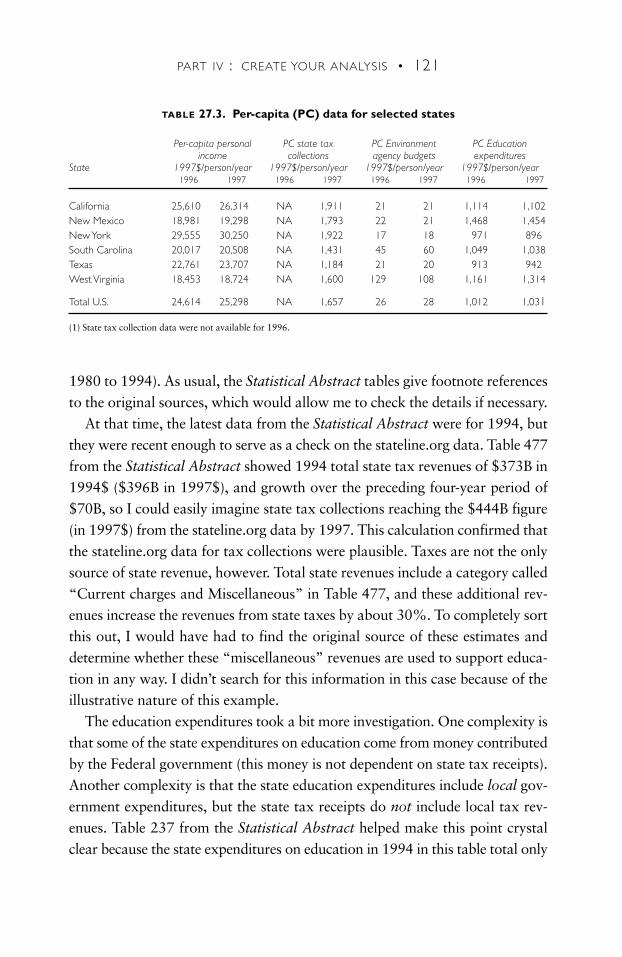
PART IV : CREATE YOUR ANALYSIS • 121
1980 to 1994). As usual, the Statistical Abstract tables give footnote referencesto the original sources, which would allow me to check the details if necessary.
At that time, the latest data from the Statistical Abstract were for 1994, butthey were recent enough to serve as a check on the stateline.org data. Table 477from the Statistical Abstract showed 1994 total state tax revenues of $373B in1994$ ($396B in 1997$), and growth over the preceding four-year period of$70B, so I could easily imagine state tax collections reaching the $444B figure(in 1997$) from the stateline.org data by 1997. This calculation confirmed thatthe stateline.org data for tax collections were plausible. Taxes are not the onlysource of state revenue, however. Total state revenues include a category called“Current charges and Miscellaneous” in Table 477, and these additional rev-enues increase the revenues from state taxes by about 30%. To completely sortthis out, I would have had to find the original source of these estimates anddetermine whether these “miscellaneous” revenues are used to support educa-tion in any way. I didn’t search for this information in this case because of theillustrative nature of this example.
The education expenditures took a bit more investigation. One complexity isthat some of the state expenditures on education come from money contributedby the Federal government (this money is not dependent on state tax receipts).Another complexity is that the state education expenditures include local gov-ernment expenditures, but the state tax receipts do not include local tax rev-enues. Table 237 from the Statistical Abstract helped make this point crystalclear because the state expenditures on education in 1994 in this table total only
TABLE 27.3. Per-capita (PC) data for selected states
Per-capita personal PC state tax PC Environment PC Education income collections agency budgets expenditures
State 1997$/person/year 1997$/person/year 1997$/person/year 1997$/person/year1996 1997 1996 1997 1996 1997 1996 1997
California 25,610 26,314 NA 1,911 21 21 1,114 1,102New Mexico 18,981 19,298 NA 1,793 22 21 1,468 1,454New York 29,555 30,250 NA 1,922 17 18 971 896South Carolina 20,017 20,508 NA 1,431 45 60 1,049 1,038Texas 22,761 23,707 NA 1,184 21 20 913 942West Virginia 18,453 18,724 NA 1,600 129 108 1,161 1,314
Total U.S. 24,614 25,298 NA 1,657 26 28 1,012 1,031
(1) State tax collection data were not available for 1996.
122 • TURNING NUMBERS INTO KNOWLEDGE
$165B in 1994$ ($175B in 1997$), which is significantly lower than the $276Bshown in Table 27.2. The local expenditures must account for the rest.
If the local tax revenues are added to the state tax receipts, the fraction of taxreceipts represented by education would be much lower than it appears fromTable 27.3. We solved the puzzle, but it took comparison with an independentsource to do it.
Another way to normalize the data is as a fraction of the national average, asshown in Table 27.4. This approach shows quickly which states are higher orlower than the mean. In this sample, California and New York have per-capitapersonal incomes above the national average (their state tax collections per
TABLE 27.4. Per-capita (PC) data normalized to the national average for selected states
Per-capita personal PC state tax PC Environment PC Education income collections agency budgets expenditures
State Natl average = 1.0 Natl average = 1.0 Natl average = 1.0 Natl average = 1.01996 1997 1996 1997 1996 1997 1996 1997
California 1.04 1.04 NA 1.15 0.80 0.76 1.10 1.07New Mexico 0.77 0.76 NA 1.08 0.84 0.77 1.45 1.41New York 1.20 1.20 NA 1.16 0.63 0.65 0.96 0.87South Carolina 0.81 0.81 NA 0.86 1.71 2.16 1.04 1.01Texas 0.92 0.94 NA 0.71 0.81 0.71 0.90 0.91West Virginia 0.75 0.74 NA 0.97 4.88 3.85 1.15 1.28
Total U.S. 1.00 1.00 NA 1.00 1.00 1.00 1.00 1.00
(1) State tax collection data were not available for 1996.
TABLE 27.5. Per-capita (PC) tax collection and expenditure data as a percentage of per-capita personal income (PI) for selected states
Per-capita personal PC state tax PC Environment PC Education income collections agency budgets expenditures
State PC PI = 100% PC PI = 100% PC PI = 100% PC PI = 100%1996 1997 1996 1997 1996 1997 1996 1997
California 100% 100% NA 7.3% 0.1% 0.1% 4.4% 4.2%New Mexico 100% 100% NA 9.3% 0.1% 0.1% 7.7% 7.5%New York 100% 100% NA 6.4% 0.1% 0.1% 3.3% 3.0%South Carolina 100% 100% NA 7.0% 0.2% 0.3% 5.2% 5.1%Texas 100% 100% NA 5.0% 0.1% 0.1% 4.0% 4.0%West Virginia 100% 100% NA 8.5% 0.7% 0.6% 6.3% 7.0%
Total U.S. 100% 100% NA 6.6% 0.1% 0.1% 4.1% 4.1%
(1) State tax collection data were not available for 1996.
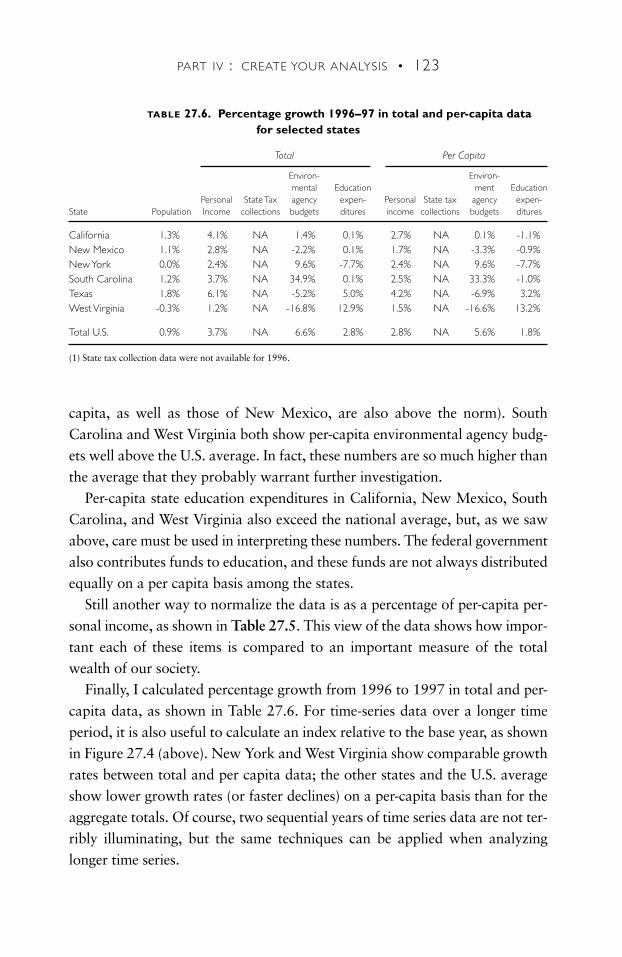
PART IV : CREATE YOUR ANALYSIS • 123
TABLE 27.6. Percentage growth 1996–97 in total and per-capita data for selected states
Total Per Capita
Environ- Environ-mental Education ment Education
Personal State Tax agency expen- Personal State tax agency expen-State Population Income collections budgets ditures income collections budgets ditures
California 1.3% 4.1% NA 1.4% 0.1% 2.7% NA 0.1% -1.1%New Mexico 1.1% 2.8% NA -2.2% 0.1% 1.7% NA -3.3% -0.9%New York 0.0% 2.4% NA 9.6% -7.7% 2.4% NA 9.6% -7.7%South Carolina 1.2% 3.7% NA 34.9% 0.1% 2.5% NA 33.3% -1.0%Texas 1.8% 6.1% NA -5.2% 5.0% 4.2% NA -6.9% 3.2%West Virginia -0.3% 1.2% NA -16.8% 12.9% 1.5% NA -16.6% 13.2%
Total U.S. 0.9% 3.7% NA 6.6% 2.8% 2.8% NA 5.6% 1.8%
(1) State tax collection data were not available for 1996.
capita, as well as those of New Mexico, are also above the norm). SouthCarolina and West Virginia both show per-capita environmental agency budg-ets well above the U.S. average. In fact, these numbers are so much higher thanthe average that they probably warrant further investigation.Table27.4here
Per-capita state education expenditures in California, New Mexico, SouthCarolina, and West Virginia also exceed the national average, but, as we sawabove, care must be used in interpreting these numbers. The federal governmentalso contributes funds to education, and these funds are not always distributedequally on a per capita basis among the states.
Still another way to normalize the data is as a percentage of per-capita per-sonal income, as shown in Table 27.5. This view of the data shows how impor-tant each of these items is compared to an important measure of the totalwealth of our society.
Finally, I calculated percentage growth from 1996 to 1997 in total and per-capita data, as shown in Table 27.6. For time-series data over a longer timeperiod, it is also useful to calculate an index relative to the base year, as shownin Figure 27.4 (above). New York and West Virginia show comparable growthrates between total and per capita data; the other states and the U.S. averageshow lower growth rates (or faster declines) on a per-capita basis than for theaggregate totals. Of course, two sequential years of time series data are not ter-ribly illuminating, but the same techniques can be applied when analyzinglonger time series.Table27.5and27.6here
C O N C L U S I O N S
When John Holdren was a professor at UC Berkeley, he taught a class called“Tricks of the Trade,” in which he listed key pitfalls to avoid in data acquisitionand handling. I have aggregated them below into four golden rules:
• Avoid information that is mislabeled, ambiguous, badly documented, orotherwise of unclear pedigree. Ambiguity and poor documentation are anindication that the quality control for such data is uneven at best andappalling at worst. Dig into the numbers a bit and find out whether it’scarelessness or incompetence; make sure you believe the numbers beforeusing them.
• Discard unreliable information that is invented, cooked, or incompetentlycreated. If you find major inconsistencies, conceptual flaws, and omissionsin the data, you’ll need to discard that information, no matter how muchit might help your analysis.
• Beware of illusory precision. Don’t represent or interpret information asmore accurate than it is. Carefully characterize uncertainty and variabilityin your data, and insist that others do so with their own.
• Avoid spurious comparability. Beware of numbers that are ostensiblycomparable but are actually inconsistent. Create and use only consistentcomparisons.
Holdren’s advice when dealing with data is “Be suspicious, skeptical, and cyn-ical. Assume nothing.” Though it may sound paranoid to the uninitiated, suchcaution is an absolute necessity for the seasoned problem solver.
124 • TURNING NUMBERS INTO KNOWLEDGE
25
For every foolproof system, there is a bigger fool.— E DWA R D T E L L E R
33

125
MAKE A MODEL
In this book, the term “model” refers to any conceptual (usually mathemati-cal) model that can be used to understand the world. Models can range in scopefrom the back of an envelope to millions of lines of computer code. AnthonyStarfield et al., in their book How to Model It, summarize nicely when theystate “An explicit model is a laboratory for the imagination.” Models allow youto experiment, test, and learn about the world in a systematic way without leav-ing your office. Comp:seehardcopyforequationsbelow
S I M P L E M O D E L S A N D BU R I E D A S S U M P T I O N S
A model is an equation or set of equations that describe how something youcare about changes when other things change. Below is a useful model thatallows you to estimate gasoline consumption as a function of how many milesyou drive and the efficiency of your car:
Gas used per week (gallons) = Miles driven
×Gallon
Week Miles
You can estimate your car’s average fuel efficiency based on past experiencein a typical week. If you drive 100 miles per week, and your car consumes fivegallons of gasoline in that period, your car gets 20 miles per gallon (mpg) onaverage. For every additional 100 miles you drive, you will consume anotherfive gallons of gasoline.
This model is perfectly adequate for many purposes, but a more detailedmodel may be required in some cases. Say that you want to estimate your gasconsumption for a special week-long, 1,000 mile trip that will involve much
CHAPTER
28
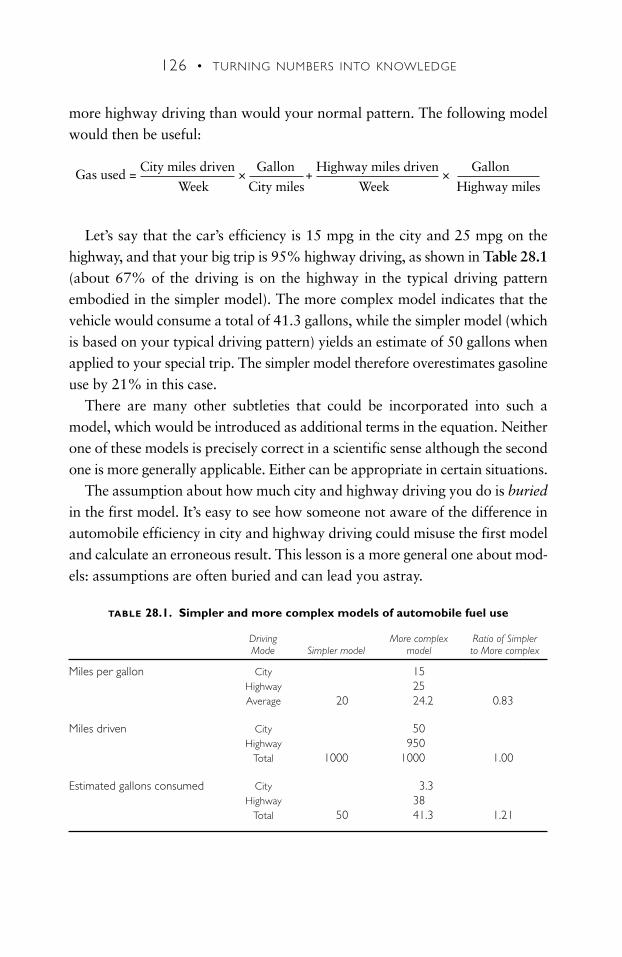
126 • TURNING NUMBERS INTO KNOWLEDGE
more highway driving than would your normal pattern. The following modelwould then be useful:
Gas used = City miles driven
×Gallon
+Highway miles driven
×Gallon
Week City miles Week Highway miles
Let’s say that the car’s efficiency is 15 mpg in the city and 25 mpg on thehighway, and that your big trip is 95% highway driving, as shown in Table 28.1(about 67% of the driving is on the highway in the typical driving patternembodied in the simpler model). The more complex model indicates that thevehicle would consume a total of 41.3 gallons, while the simpler model (whichis based on your typical driving pattern) yields an estimate of 50 gallons whenapplied to your special trip. The simpler model therefore overestimates gasolineuse by 21% in this case.
There are many other subtleties that could be incorporated into such amodel, which would be introduced as additional terms in the equation. Neitherone of these models is precisely correct in a scientific sense although the secondone is more generally applicable. Either can be appropriate in certain situations.
The assumption about how much city and highway driving you do is buried
in the first model. It’s easy to see how someone not aware of the difference inautomobile efficiency in city and highway driving could misuse the first modeland calculate an erroneous result. This lesson is a more general one about mod-els: assumptions are often buried and can lead you astray.Table28.1here
TABLE 28.1. Simpler and more complex models of automobile fuel use
Driving More complex Ratio of Simpler Mode Simpler model model to More complex
Miles per gallon City 15Highway 25Average 20 24.2 0.83
Miles driven City 50Highway 950
Total 1000 1000 1.00
Estimated gallons consumed City 3.3Highway 38
Total 50 41.3 1.21
PART IV : CREATE YOUR ANALYSIS • 127
S I M P L I F Y, S I M P L I F Y, S I M P L I F Y
People are often intimidated by the use of computer models to conduct ananalysis, but never forget that these models depend on data and assumptionsthat are based in large part on analysts’ judgment. It is a rare model that doesnot contain dozens or hundreds of such assumptions; in fact, these data andassumptions determine the outcome in many cases. This heavy reliance onassumptions for parameters that are unknown is most prevalent in models usedin business and public policy, but even models of the physical world can rely onassumptions that influence or determine the outcome.
In his real estate practice, Robert J. Ringer encountered sellers with fantasticexpectations for the investment value of their buildings:
As a general but very consistent rule, owners are so unrealistic when itcomes to vacancy factors, replacement costs, and other expense items thatare not readily ascertainable that I normally considered their projections andoperating statements to be virtually meaningless.63
Using his electronic calculator and his knowledge of real estate, Ringer was ableto determine quickly whether the building was salable at or near the owner’sasking price. His simple conceptual model allowed him to create a quick esti-mate of net cash flow on the proverbial back of an envelope. This screeningtechnique allowed him to avoid wasting time on deals that would never closebecause of the huge gap between the reality of the project’s net cash flow andthe fantasy of the owner’s expectations.
The technique of using a simple and transparent model to evaluate the resultsof a more complex calculation is immensely powerful. Analysts at theInternational Institute for Applied Systems Analysis (IIASA) found this out totheir chagrin when Will Keepin, a Visiting Scholar at IIASA, was able to almostexactly reproduce the results of a multiyear, multimillion dollar study usingsome of the study’s key input assumptions and a hand calculator. Keepinshowed that the study’s results followed directly from the input assumptions.He concluded that the study’s projections of future energy supply “are opinion,
29
128 • TURNING NUMBERS INTO KNOWLEDGE
rather than credible scientific analysis, and they therefore cannot be relied uponby policy makers seeking a genuine understanding of the energy choices fortomorrow.”
Beware of big complicated models and the results they produce. Generallythey involve so much work to keep them current that not enough time is spenton data compilation and scenario analysis. Morgan and Henrion, in their bookUncertainty, devoted an entire chapter to such models and began by summa-rizing this fundamental truth:
There are some models, especially some science and engineering models,that are large or complex because they need to be. But many more are largeor complex because their authors gave too little thought to why and howthey were being built and how they would be used.64
Such large models are essential only for the most complex and esoteric analy-ses, and a simpler model will usually serve as well (and be more understandableto your intended audience).
The importance of transparency cannot be overestimated. A model that youraudience can actually grasp is inherently more persuasive than a “black box”that no one outside of a small circle of analysts understands. Transparent mod-els for which the input data and assumptions are also well documented are evenmore compelling, but are, sadly, all too rare.
Don’t be too impressed by a model’s complexity. Instead, ask about the dataand assumptions used to create scenarios. Focus on the coherence of the sce-narios and their relevance to your decisions, and ignore the marketing double-speak of those whose obsession with tools outweighs their concern with usefulresults. Sadly, many modelers fall into this latter camp, and you would do wellto avoid their work.
Programming today is a race between software engineers trying tobuild bigger and better idiot-proof programs, and the universe tryingto produce bigger and better idiots. So far, the universe is winning.
— R I C H C O O K
26
33
26

129
Ross and Ross, Mattimore, and von Baeyer describe how the physicistEnrico Fermi used to dole out exam problems but not supply all the informa-tion necessary for a solution. His students (my former professor Art Rosenfeldwas among them) were expected to make educated guesses about the missingparameters to solve these so-called “Fermi problems.” This technique is notoften taught in school, but it is one well worth learning. For virtually any prob-lem, it is possible to create an approximate solution using information youknow or can estimate from daily life experience. Most people don’t believe thisuntil they try it a few times, but it’s true.
F RO M O I L TO WAT E R
I read an article once that described how Global Water Corp. of Vancouver hadsigned a contract with an Alaskan city (Sitka) that would allow the company toharvest water from glacial runoff.65 The company was going to take converted oiltankers and ship the water to China, where it would then be bottled and sold. Iinitially thought that this venture was absurd, but a few back-of-the-envelopecalculations made it clear that there was method to this apparent madness.
The company signed a fifteen-year contract covering 4.8 billion gallons ofwater a year. The article claimed that half-liter bottles of water from Europecurrently cost Chinese consumers about $5.25 while this new source of waterwould cost about $0.70 per half liter bottle ($1.40 per liter).
The oil tanker was originally meant to carry crude oil, which, at the time,was selling for about $20 per barrel. There are 42 gallons per barrel of oil, yield-ing a cost per gallon of about $0.50 (gasoline typically sold for twice thatamount in the U.S. at that time because of the additional refining and trans-
REUSE OLD ENVELOPES
CHAPTER
29
portation costs to bring the fuel to gas stations, as well as federal and statetaxes). There are about 4 liters per gallon (a liter is a bit more than a quart), sothe price of oil per liter was about $0.12.
The bottled water would (assuming the article was correct) sell for $1.40 perliter, as described above, which is about ten times greater than the price of theoriginal cargo for the tanker (oil). This calculation showed that the companycould make some serious money shipping water to China, assuming that themarket for bottled water was large enough to sell the tanker’s contents. Ofcourse, there are costs of cleaning and converting the tanker to hold purewater, and costs of packaging the bottled water that a gasoline vendor wouldnot incur, but the costs of transport would be comparable. The one-time costof converting the tanker would be relatively small when amortized over manytrips. I guessed that the costs of packaging and marketing the water would atmost amount to between ten and fifty cents per liter. These costs would reducethe profits of the venture, but it still seemed likely to be profitable after theseadjustments.66
M O R E C A L C U L AT I O N S
I once sat outside an air-conditioned store in Cambridge, Massachusetts thathad its door propped open on a very hot day. Using some simple assumptionsand conversion factors I had memorized, I calculated how many dollars perhour the store was wasting by refrigerating the outside world. That calculationwas enough to convince the store manager to close the door (he probably neverhad anyone badger him about that before, even with all the crazy scientists wan-dering around Cambridge!).
Another calculation I did about ten years ago was to figure out the wattageof a candle. All I needed to assume was that wax is similar to petroleum (I hadthe energy content of petroleum memorized) and note the time it took for thecandle to burn away. I also needed to know some conversions to turn Englishunits into metric units. It turns out that typical dinner candles dissipate energyat a rate comparable to that of a 60 to 100 watt light bulb (of course, candlesare much less efficient in creating light than are electric lamps, so they don’t cre-ate nearly as much light as a bulb).
130 • TURNING NUMBERS INTO KNOWLEDGE
9

PART IV : CREATE YOUR ANALYSIS • 131
U S I N G T H E B AC K S O F E N V E L O P E S
Such “back-of-the-envelope” calculations, supplemented by what Mattimorecalls “smart guessing,” are not just for scientists. A business plan for a new ven-ture, for example, usually involves dozens of such smart guesses about sales ofa product, costs of sales, overhead, and other parameters. The first draft of sucha plan is essentially a back-of-the-envelope calculation that will later be refinedand improved in discussions with experienced business people.
People involved in fast-moving new ventures usually don’t have time toresearch issues thoroughly and don’t have money to hire someone to do it forthem (sometimes even the people they hire don’t have time either!). Often, back-of-the-envelope calculations are the best that can be done in the time allotted.The law of averages keeps the accuracy of such calculations from deterioratingtoo much because you are just as likely to overestimate as to underestimate(assuming that you’re not biased one way or another). Across all the assump-tions you make, these deviations average out.
T H I N K I N G A B O U T T H E P RO C E S S
There are many ways to create these quick calculations, but the first step isalways to create a one-equation model by breaking the problem into its compo-nent parts. This equation might look like the relationship between market cap-italization and earnings per share in the chapter titled “Dig into the numbers”:Comp:seehardcopyforequations
below!
Market Capitalization ($) = # Shares × Earnings
×Price
Share Earnings
28 27
27
EXERCISE
Estimate how many cobblers there are in the U.S., using just informa-tion you have in your head. Check your answer and method against thatused in the first chapter of John Harte’s book Consider a Spherical Cow.
132 • TURNING NUMBERS INTO KNOWLEDGE
It might also look like the model of automobile fuel economy shown in thechapter titled “Make a model”:
Gas used = City miles driven
×Gallon
+Highway miles driven
×Gallon
Week City miles Week Highway miles
An important part of this process is balancing accuracy against the timeneeded to create the calculation. Back-of-the-envelope calculations are meant tobe quick, so they usually rely on relatively simple models.
Once the relationships between key inputs and the desired output are estab-lished, you’ll need to determine which of the inputs you know and which you’llhave to assume for purposes of the initial calculations. Don’t get hung up on a
particular number. The best thing to do is to carry out the calculation using thevery roughest of approximations for those things you don’t know, and refine theinputs later.
B O U N D I N G T H E P RO B L E M
When you’ve set up your calculation with your best guesses for the variousinput parameters, it’s often instructive to identify those that are least certain andto determine a plausible range for them. You then carry through the calculationusing the upper and lower ends of the ranges for all the inputs.
For example, if you only knew the fuel economy of your car very roughly,you might specify a range of 12 to 18 miles per gallon in the city and 22 to 30miles per gallon on the highway for the “gas used” equation above. By com-bining the lower ends of both efficiency ranges in your calculation, you coulddetermine an “upper bound” to how much gasoline you might use on the trip.This calculation could be useful in making sure that you don’t ever run out ofgas along the way or that you have enough money to pay for gas in yourbudget. Using the upper ends of the efficiency ranges would give you the min-imum cost for gas that is likely for the trip.
These kinds of bounding calculations actually represent simple scenarioanalyses. If you compute ranges for the inputs and the results don’t vary muchfrom your best estimate, you’ve learned that the calculation is insensitive to theuncertainties you’ve identified, which is an important result. There are, of
26
28
28
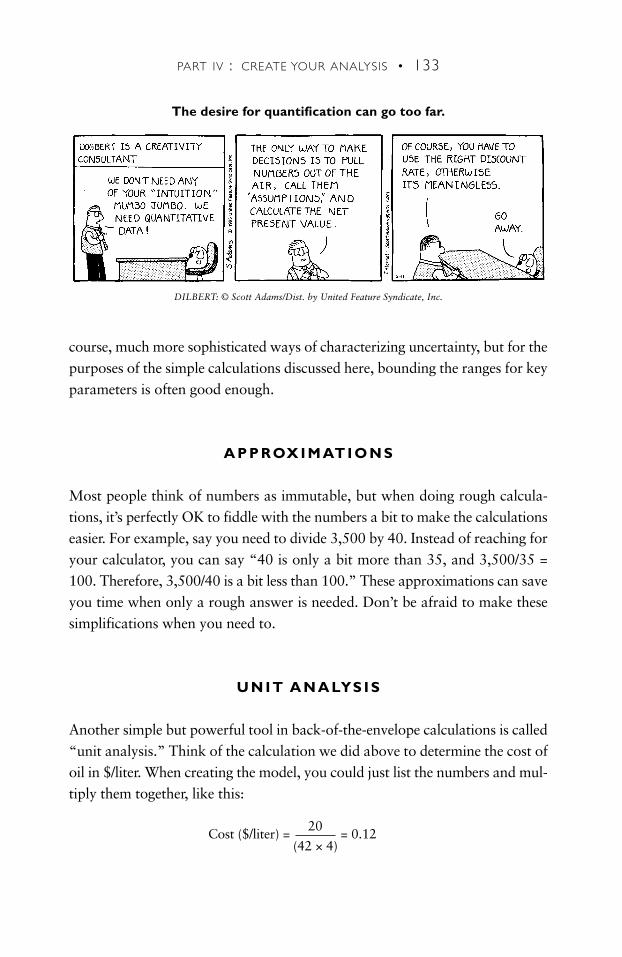
PART IV : CREATE YOUR ANALYSIS • 133
course, much more sophisticated ways of characterizing uncertainty, but for thepurposes of the simple calculations discussed here, bounding the ranges for keyparameters is often good enough.
A P P ROX I M AT I O N S
Most people think of numbers as immutable, but when doing rough calcula-tions, it’s perfectly OK to fiddle with the numbers a bit to make the calculationseasier. For example, say you need to divide 3,500 by 40. Instead of reaching foryour calculator, you can say “40 is only a bit more than 35, and 3,500/35 =100. Therefore, 3,500/40 is a bit less than 100.” These approximations can saveyou time when only a rough answer is needed. Don’t be afraid to make thesesimplifications when you need to.
U N I T A N A LYS I S
Another simple but powerful tool in back-of-the-envelope calculations is called“unit analysis.” Think of the calculation we did above to determine the cost ofoil in $/liter. When creating the model, you could just list the numbers and mul-tiply them together, like this:Comp:seehardcopyforequationsbelow!
Cost ($/liter) = 20
= 0.12(42 × 4)
The desire for quantification can go too far.
DILBERT: © Scott Adams/Dist. by United Feature Syndicate, Inc.

134 • TURNING NUMBERS INTO KNOWLEDGE
Alternatively, you could list each of the terms with units attached so that itis obvious that they cancel out and yield the end result in units we desire:
Cost ($/liter) = $20
×1 barrel
×1 gallon
=$0.12
barrel 42 gallons 4 liters liter
I initially scoffed when my high school chemistry teacher taught this method-ical way of carrying through and checking our calculations. At the time, the cal-culations were so simple that I didn’t need to be methodical and could just dothem in my head. I’ve learned through experience, however, that calculationsare rarely that simple in practice, and, even if they are simple, I still make mis-takes because I’m tired or rushed. It pays to write out the units for your calcu-lation to make sure you are calculating correctly.
OT H E R H I N T S
To become truly proficient at these techniques, memorize key conversion fac-tors, at least in a rough way. Which ones you memorize depend on your chosenfield. Energy and environmental conversion factors are most useful in my work,but I have also memorized many other conversions because they often come inhandy.
If you simply can’t memorize such items, then create a small page with com-mon conversion factors and keep it in your wallet. Graduate students at theEnergy and Resources Group at UC Berkeley are routinely supplied with severalof these pages during their course of study, and one of these is reprinted in“Facts at your fingertips.” While creating such a “cheat sheet” may brand youas a nerd in the eyes of your compadres, it will surely impress them when youcan answer questions while only consulting your data sheet.
One modern tool that is invaluable for such calculations is the spreadsheet(proving that you don’t need an envelope to create back-of-the-envelope calcu-lations). Create quick calculations using a spreadsheet and plug in guesses forthose parameters you don’t know at the time. This approach allows you tothink through the calculations without hindrance, and then go back later tocheck the input assumptions. Later modifications to these assumptions tricklethrough the calculations nicely without requiring much additional work.
9
9
PART IV : CREATE YOUR ANALYSIS • 135
C O N C L U S I O N S
Hans Christian von Baeyer points out that doing such calculations instead ofrelying on authority engenders self-confidence and independence. Achievingeven occasional success in back-of-the-envelope estimation increases your incli-nation to tackle such problems in the future, thereby ensuring that you will gainfurther experience and self-assurance. To know in your heart that you canroughly estimate just about anything is a marvelous feeling of mastery.
Cart10(Dilbert)here
EXERCISE
Find three quantitative assertions in today’s newspaper, and do back-of-the-envelope calculations to check them. Did you find anything surprising?
Whether the problem concerns cooking, automobile repair, or personalrelationships, there are two basic types of responses: the faintheartedturn to authority–to reference books, bosses, expert consultants, physi-cians, ministers–while the independent of mind delve into that privatestore of common sense and limited factual knowledge that everyonecarries, make reasonable assumptions, and derive their own, admit-tedly approximate, solutions.
— H A N S C H R I S T I A N VO N B A E Y E R
The future is uncertain, but people keep trying to forecast it anyway. In anarticle with an ironically humorous and utterly extraneous subtitle—“Few WallStreet Analysts said that ’96 would be this good: Forecasts for ’97 may or maynot be just as inaccurate”—Chet Currier of the Associated Press assessed thesorry record of most financial analysts in predicting the huge increase in stockprices in 1996.67
After describing how virtually all analysts predicted modest gains or littlechange from end-of-1995 levels, Currier states that the major market indicesracked up gains of 20% or more in 1996. His conclusions about the value ofsuch forecasts are particularly insightful:
None of the errant prognostications cited above were wild guesses or inter-pretations of the leaf patterns in some hallucinogenic tea. They were thecarefully considered projections of respected commentators who enjoywide followings as financial analysts. All of them remain in their same jobs,or comparable positions of prominence, a year later, and are presumablybusy right now preparing to make their projections for another year.
As usual, these commentaries may well provide a useful point of depar-ture for your own investment planning in 1997. The reasoning behind a pre-diction is often the most interesting and useful thing about it (italics added).But the experience of this year dramatizes how skeptically you may take allforecasts of something as unpredictable as the stock market—even frompeople who know what they are talking about.
Newspapers always trumpet the results of such forecasts, but, as the stock mar-ket example shows, you should be wary.
Steven Schnaars, in his book Megamistakes: Forecasting and the Myth of
Rapid Technological Change, gives many examples of forecasts of the popu-larity of new products that were totally off the mark. In fact, about 80% of the
136
USE FORECASTS WITH CARE
CHAPTER
30
forecasts he examines were grossly inaccurate, which made him question theentire basis for predicting adoption of new technologies. He concluded, afterreviewing dozens of examples, that explicit scenario analysis is far superior tomost conventional ways of exploring the future.
Forecasts are used
• for planning (either institutional or personal);
• for advocacy (to lend credence or context to concern over a particularissue);
• for research (to assess the potential effects of current or expected futuretrends).
Most institutions create forecasts for their own budget planning. Such a forecastattempts to capture recent trends and allows the institution to plan for expectedgrowth or declines in revenues. A typical forecast in this context would look oneor two years ahead, sometimes three or four years in exceptional cases. Longer-term forecasts are used for government institutions (like Social Security) thathave obligations spread over many years. Forecasts can also serve as part of ascenario-planning exercise.
An institution concerned with a particular issue will sometimes create a fore-cast that validates concern for that issue, as part of its effort to create free pub-licity. One edition of The Sunday San Francisco Chronicle/Examiner containedtwo separate examples where a forecast was cited for this purpose.68 In one case,a California real estate investor and analyst predicted that housing prices inCalifornia would double over the next eight years. In another, the CremationAssociation of America predicted that the rate of cremation, measured as the %of deaths that lead to cremation, would increase from 21% in 1997 to 38% in2010. In both cases, a person or institution developed forecasts that showedwhy a particular issue of concern should also be of interest to the public.
The investor who predicted a doubling of California home prices wasroundly criticized by his colleagues, but he succeeded in getting the attention ofthe press, in part because his prognostication conflicted so glaringly with theconventional wisdom. That strategy is a successful one that is widely used: pre-dict something just a tad outrageous, and use your credibility from previouswork to lend credence to your prediction; then talk to as many reporters as willlisten in hopes they will mention you and your company in their columns. In
PART IV : CREATE YOUR ANALYSIS • 137
26
this particular case, the prediction was right on the mark—median Californiahome prices more than doubled in nominal terms from 1997 to 2004 (see<http://www.realestateabc.com/graphs/calmedian.htm>).
More complex issues can require detailed forecasts to truly understand them,which usually involves computer modeling. In these applications, researcherswill create a baseline forecast that attempts to predict how the world will evolveassuming current trends continue. This forecast is often called a “business-as-usual” case. Then, one or more alternative forecasts are created, to assess thepotential effects of changes in key factors on the results. For example, an eco-nomic forecaster might use such an analysis to assess the likely effects of achange in property taxes on economic growth in a particular state.
T H E WO N D E R S O F E X P O N E N T I A L G ROW T H
One of the most basic concepts in forecasting is that of exponential growth.This concept generally applies to population forecasts because the rate of pop-ulation growth is proportional to the number of people who are alive at anytime (the more people there are, the more babies are born). Similarly, money ina bank account grows exponentially because the interest earned is related tohow much money is in the account at any time.
Forecasts of population or economic activity are often summarized in theform of annual exponential growth rates. For example, the annual growth ingross domestic product was roughly 3.5% in 1996. If this growth continued at3.5% per year for five years, total growth would be 1.035 x 1.035 x 1.035 x1.035 x 1.035 - 1, or 19%.
Exponential growth can lead to surprising results in the longer term. Table30.1 compares three countries of 100 million people, one of which (Country A)grows two million people per year every year, and another of which (Country B)grows 2% every year (two million in the first year). After one hundred years,Country A will have grown to 300 million people, while Country B will havegrown to more than 700 million! The differences become even more pronouncedfor higher growth rates. If Country C grew at 4%/year, its population wouldgrow to more than five billion people a hundred years hence. A doubling of theexponential growth rate leads to a sevenfold increase in total population!Table30.1here
The famous futurist Julian Simon once made the statement that “We have the
138 • TURNING NUMBERS INTO KNOWLEDGE
technology to house, feed, and clothe a growing population for six billionyears.”69 When told that any reasonable population growth rate would lead tothe mass of all people exceeding the mass of the known universe over thatperiod, he revised his statement to six million years. Even this revision wasn’tenough to get Simon out of trouble, though. In six million years at modestgrowth rates, the number of people would exceed the number of electrons in theknown universe!
Forecasts projecting exponential growth can lead to trouble when the rate ofgrowth changes dramatically. During the 1950s and 1960s, growth in U.S. elec-tricity use increased at a roughly constant 7%/year. Power planners had an easyjob until the 1970s when the oil crisis, increasing energy efficiency, and prob-lems with large power plants led to price increases and slowing demand forpower. Growth rates in electricity demand slowed to 2–3% per year, and util-ities were forced to cancel the planned construction of hundreds of power plantsbecause of the drastically reduced growth in power use.
A K E Y T R I C K O F T H E T R A D E
In evaluating forecasts of exponential growth rates, an important trick isknown as “the rule of 70.” If you have an annual growth rate (say 2% per yearfor U.S. population) then the time it will take (in years) for population to dou-ble is roughly 70
2 or thirty-five years. Growth of 7% per year implies a doublingtime of about ten years. You don’t need to know why this works, you just needto remember it.Comp:seehardcopyforequation(70/2)below!
Why is a doubling time useful? It is much easier to calculate multiples of two
PART IV : CREATE YOUR ANALYSIS • 139
TABLE 30.1. Exponential growth and population
Units Country A Country B Country C
Annual growth Millions of people/yr or %/yr 2 2% 4%
Initial population Millions 100 100 100Population in 100 years Millions 300 724 5050
Total growth over 100 years Millions 200 624 4950Average growth per year Millions/year 2 6 50
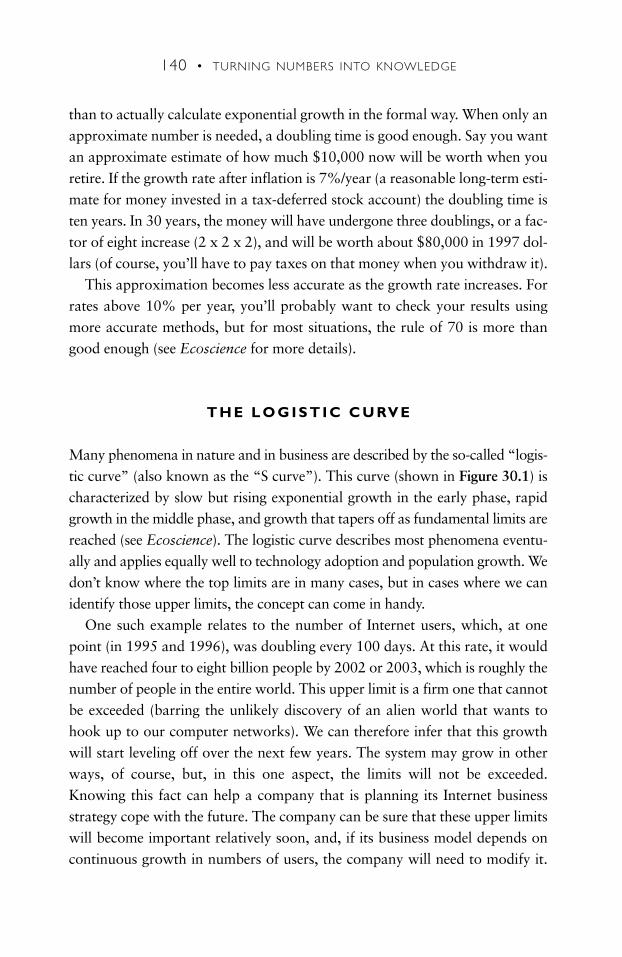
than to actually calculate exponential growth in the formal way. When only anapproximate number is needed, a doubling time is good enough. Say you wantan approximate estimate of how much $10,000 now will be worth when youretire. If the growth rate after inflation is 7%/year (a reasonable long-term esti-mate for money invested in a tax-deferred stock account) the doubling time isten years. In 30 years, the money will have undergone three doublings, or a fac-tor of eight increase (2 x 2 x 2), and will be worth about $80,000 in 1997 dol-lars (of course, you’ll have to pay taxes on that money when you withdraw it).
This approximation becomes less accurate as the growth rate increases. Forrates above 10% per year, you’ll probably want to check your results usingmore accurate methods, but for most situations, the rule of 70 is more thangood enough (see Ecoscience for more details).
T H E L O G I S T I C C U RV E
Many phenomena in nature and in business are described by the so-called “logis-tic curve” (also known as the “S curve”). This curve (shown in Figure 30.1) ischaracterized by slow but rising exponential growth in the early phase, rapidgrowth in the middle phase, and growth that tapers off as fundamental limits arereached (see Ecoscience). The logistic curve describes most phenomena eventu-ally and applies equally well to technology adoption and population growth. Wedon’t know where the top limits are in many cases, but in cases where we canidentify those upper limits, the concept can come in handy.
One such example relates to the number of Internet users, which, at onepoint (in 1995 and 1996), was doubling every 100 days. At this rate, it wouldhave reached four to eight billion people by 2002 or 2003, which is roughly thenumber of people in the entire world. This upper limit is a firm one that cannotbe exceeded (barring the unlikely discovery of an alien world that wants tohook up to our computer networks). We can therefore infer that this growthwill start leveling off over the next few years. The system may grow in otherways, of course, but, in this one aspect, the limits will not be exceeded.Knowing this fact can help a company that is planning its Internet businessstrategy cope with the future. The company can be sure that these upper limitswill become important relatively soon, and, if its business model depends oncontinuous growth in numbers of users, the company will need to modify it.
140 • TURNING NUMBERS INTO KNOWLEDGE
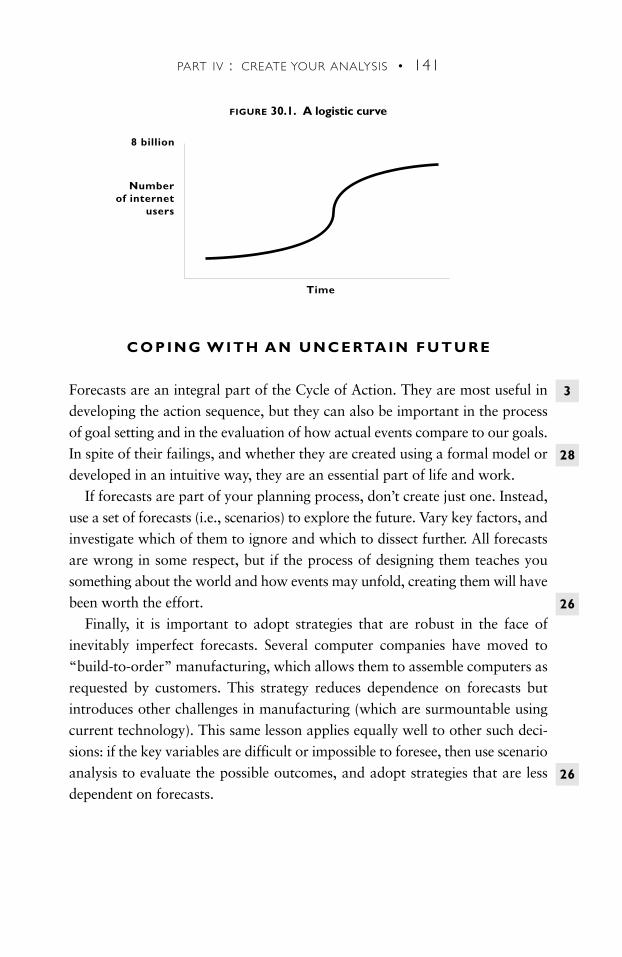
C O P I N G W I T H A N U N C E RTA I N F U T U R E
Forecasts are an integral part of the Cycle of Action. They are most useful indeveloping the action sequence, but they can also be important in the processof goal setting and in the evaluation of how actual events compare to our goals.In spite of their failings, and whether they are created using a formal model ordeveloped in an intuitive way, they are an essential part of life and work.
If forecasts are part of your planning process, don’t create just one. Instead,use a set of forecasts (i.e., scenarios) to explore the future. Vary key factors, andinvestigate which of them to ignore and which to dissect further. All forecastsare wrong in some respect, but if the process of designing them teaches yousomething about the world and how events may unfold, creating them will havebeen worth the effort.
Finally, it is important to adopt strategies that are robust in the face ofinevitably imperfect forecasts. Several computer companies have moved to“build-to-order” manufacturing, which allows them to assemble computers asrequested by customers. This strategy reduces dependence on forecasts butintroduces other challenges in manufacturing (which are surmountable usingcurrent technology). This same lesson applies equally well to other such deci-sions: if the key variables are difficult or impossible to foresee, then use scenarioanalysis to evaluate the possible outcomes, and adopt strategies that are lessdependent on forecasts.
PART IV : CREATE YOUR ANALYSIS • 141
Numberof internet
users
Time
8 billion
FIGURE 30.1. A logistic curveFig.31.1here
3
28
26
26

142 • TURNING NUMBERS INTO KNOWLEDGE
EXERCISE
Find a forecast on a topic you care about, and learn how it was created.Talk to the author and read any supporting documentation. Do you stillfind it plausible?
In the space of 176 years, the Lower Mississippi has shortened itself242 miles.That is an average of a trifle over one mile and a third peryear. Therefore, any calm person who is not blind or idiotic can seethat in the Old Oolitic Silurian Period, just a million years ago nextNovember, the Lower Mississippi was upward of 1,300,000 mileslong. By the same token, any person can see that 742 years from now,the Lower Mississippi will be only a mile and three-quarters long.There is something fascinating about science. One gets such whole-sale returns of conjecture out of such a trifling investment of fact.
— M A R K T WA I N

143
One of the first rules of management in dealing with a conflict betweencoworkers is to listen carefully to all sides of the story before saying or doinganything. The same lesson applies in evaluating any two courses of action orpoints of view. It almost always pays to hear eloquent supporters of divergentviewpoints address each other’s criticisms in a discussion or debate format. Ifyou do not include such discussions as regular fodder for your deliberations,you are missing out on one of the most potent ways to clarify any set of issues.In rare cases, of course, such debates can muddy the waters still further, but theyare almost always helpful as long as the participants are well intentioned, wellmatched, and prepared.
President John F. Kennedy knew this when he created a cadre of advisorswho held widely divergent viewpoints during the Cuban Missile crisis. After theBay of Pigs debacle, Kennedy vowed never to rely solely on his military advisorsagain. He created an ad hoc group of advisors, led by his brother Robert, tobring to his attention other alternatives. One of these options was the blockadeof Cuba, which was ultimately the strategy that Kennedy adopted.
Such debates need not be formally structured, but structure can sometimes bean advantage. Formal debates in the Oxford style, sponsored by a British orga-nization called “Intelligence Squared” and its US counterpart, have becomepopular recently (circa 2007). Each debate addresses a specific proposition like“global warming is not a crisis” with two skilled debate teams taking oppositesides of the issue. The audience is polled before and after the debate, and theteam that manages to move more of the audience to its side than it had beforethe debate is declared the winner. Of course, the way that the proposition is ini-tially framed can have a big influence on the quality of the discussion.
In the academic world, there is a tradition of “brown bag lunches” whereresearchers present work-in-progress to friends and close colleagues. Theselunches help identify problems with analysis before a paper is written or pre-
HEAR ALL SIDES
CHAPTER
31
sented to a wider group. They work best when all concerned are on friendly termsand the objective of clarifying the key argument is accepted by all participants.
The business world does not generally encourage the kind of interactionfound in such “brown bags,” to its detriment.70 One acquaintance of mineworks for a large mutual fund company. She lamented to me that the peopleunder her supervision did not possess the ability or inclination to check theirown work, which often led them to produce analysis that did not answer themanagement questions at hand. These analysts were responsible for creatingreports that the firm used to assess financial fitness, so the reports were impor-tant. Unfortunately, her analysts had not learned what constituted good analy-sis, in part because the firm had no tradition of constructive intellectual criticism.
If you have reached a conclusion, it still pays to have a critic review yourwork. In fact, such review is virtually always a good idea (even at early stagesof your analysis). Confirm your results using as many independent sources asyou can find, just like you would test computer equipment before you put it inthe field.
144 • TURNING NUMBERS INTO KNOWLEDGE
14
It is a capital mistake to theorize before you have all the evidence. Itbiases the judgment. — S H E R L O C K H O L M E S

145
Don’t forget the final step in any analysis: making your results useful to oth-ers. Your reports should be treasured by your colleagues as classics full of per-tinent data, exhaustive documentation, and clear thinking. If they’re not, youshould follow the advice contained in these chapters and change your ways.
If you follow this advice, you’ll soon gain a reputation for analytical integrityand clear thinking that can’t be beat. If you don’t, you’ll be contributing to thepiles of mediocre and barely used reports that inhabit bookshelves everywhere,and you most certainly don’t want to do that.
SHOW YOUR STUFF
PART
V
They say that 90% of television is garbage. But 90% of EVERYTHINGis garbage. — G E N E RO D D E N B E R RY

147
KNOW YOUR AUDIENCE
How results are expressed is at least as important as what the results are.Most analysts are so involved in their calculations that they forget that otherpeople don’t care nearly as much about the results of the analysis as they them-selves do. Good analysis is often handicapped in its presentation because theauthors have not taken the vital last step of thinking about what the audiencecares about and expressing the results in those terms.
One of my favorite professors from graduate school, Art Rosenfeld, is a mas-ter at making complex analysis results understandable to the lay person. Artpresented his estimates of energy savings from the latest efficient gadget (a newrefrigerator, for example) for many different people. Sometimes he would tes-tify before congress, other times he would address public utility commissioners,and still other times he would tell his story for a general audience. He wouldalways tailor his talk to the listeners. If oil drilling in the Arctic NationalWildlife Refuge was a hot topic before congress that day, he would express hisenergy savings estimates in terms of “Arctic Refuges saved.” If the public util-ity commissioners were concerned about canceling a power plant constructionproject, Art would calculate how much the savings were worth in terms of“avoided power plants.” And for the lay audience, Art would show how muchmoney people would save per household if they bought the better fridge. In eachcase, Art’s message gained resonance because he thought seriously about theconcerns of the audience.
In both talks and papers, your audience will only retain a few key pointsfrom your work. You must decide what those few points should be, and ham-mer them home. If you don’t, you risk not reaching the people you set out toconvince. So step back and reflect after you’ve completed your analysis. Thinkabout what you’ve learned, and explain it in three or four simple sentences. Dig
into the numbers to support your main points, but don’t overwhelm your audi-ence with numbers. Instead, focus on the conclusions, describe why your
27
21
CHAPTER
32

analysis makes such a compelling case, and explain it in ways specifically tai-lored to reach your audience.
This lesson is particularly important when the analysis results are intended toaffect public opinion or a public policy debate. Journalists generally latch on toonly a few key results of a complex study when deciding what “angle” to takewith a story. Express these results to reach out to the desired audience, and youreffectiveness will increase many times over.
148 • TURNING NUMBERS INTO KNOWLEDGE
In order to achieve victory, you must place yourself in your opponent’sskin. If you don’t understand yourself, you will lose one hundred per-cent of the time. If you understand yourself you will win fifty percentof the time. If you understand yourself and your opponent you will winone hundred percent of the time. — T S U TO M U O S H I M A

149
DOCUMENT, DOCUMENT, DOCUMENT
Over the years, friends have clipped dozens of articles for me on topics inwhich they knew I had an interest. In almost all cases, they neglected to writeon the clipping the full reference, thus rendering it unusable for research pur-poses. An article without a reference is useless except as background info. Anarticle with a reference is a citable source.
Documentation lends credibility to any intellectual effort. It also recognizesthe previous work of others and allows readers to follow your thought processes(it also allows YOU to recreate your thinking months after you have achievedsome conceptual breakthrough). Any competent analyst ought to be able torecreate your analysis from the documentation you provide, and you must beable to do the same more quickly than others can. Finally, the process of docu-menting your results can help you check those results and ensure accuracy.
G I V I N G C R E D I T W H E R E C R E D I T I S D U E 71
Progress in intellectual endeavors depends on prior work being fairly acknowl-edged. When you have relied on a particular fact or insight that you got fromanother source, you must reference it. You can put this reference in a footnote,you can use the (Author Date) method (e.g., (Koomey 1995)), or you can con-sult The Chicago Manual of Style for more reference formats.
If you quote from another source, cite the source (and go back to the origi-nal source if you can). If it is an extensive quotation, if the quotation representsthe “heart” of the work, or if using the quotation might affect the commercialvalue of the cited work, it may be appropriate to obtain the author’s permissionfor using it. “Fair use” has a specific legal definition, but there are many grayareas. You are allowed to quote excerpts from other people’s copyrighted workto illustrate, clarify, or comment on their work. Whether an excerpt constitutes
CHAPTER
33
150 • TURNING NUMBERS INTO KNOWLEDGE
fair use depends on the context in which the excerpt is used and on a variety ofother factors. One common-sense test to apply is to ask yourself “If the citedsource were my work, how would I feel if someone else cited it in the way I citeit here?”
For more details on copyrights in the digital age, see the Copyright Office website for the Library of Congress <http://www.copyright.gov>, and the Nolo.comsite devoted to this topic <http://www.nolo.com/>. For information on obtainingpermission for the use of copyright protected material, see Richard Stim’s excel-lent book titled Getting Permission, also available from Nolo.com.
The Internet has made issues of credit and authorship more complex. Onefriend of mine occasionally teaches a class on environmental science, and hefound that in term papers submitted by his students, three-quarters of all thesources cited were World Wide Web addresses (called Uniform ResourceLocators, or URLs), with little or no explanation given for how the informationwas derived or whether it was credible. For the students, the mere existence ofa URL was enough reason to cite it when in fact more investigation and docu-mentation is really required to ensure that the web site gives proper credit andaccurately reports results.
If you do rely on a web site for a research project, don’t forget to make anelectronic file (PDF) or a hard copy printout of the site. Web sites change all thetime, and their impermanence places special responsibility on the researcher torecord the information in a permanent way. Another important detail is to setyour web browser to include the actual URL in the header or footer of anyprinted copies of web sites. Some browsers do this automatically, but yours maynot, so make sure this setting is saved as the default option.
L E AV I N G A T R A I L F O R YO U TO R E M E M B E R
The fancy technical name for data documentation is “source tagging.”Researchers who specialize in data quality focus on how to decide which infor-mation about a source is appropriate for electronic data and how to attach thiskey information to those data. I refer to data without attached sources as “dis-embodied.” I also call them useless, because without the sources, they are littlebetter than rumors.
Don’t underestimate the importance of good archiving practice: Archiving is theprocess by which older data and records are stored for retrieval if needed. Com-panies neglect this process at their peril because mission-critical information mustbe accessible to those making strategic decisions. This task takes on greaterimportance in the electronic age because the “paper trail” that existed previouslyis now commonly absent (see Cook’s 1995 Technology Review article for details).
Keep a notebook for each major project: Record in this book importantinsights you have, notes from meetings, reports to track down, or any otheritems related to the progress of your work. An electronic organizer serves thisfunction, but if you haven’t adopted one of these handheld devices, then a papernotebook will serve just fine. These notes may come in handy later if you wantto build on previous work.
Always date your work, even your roughest handwritten notes: Reconstructingthe evolution of your thoughts often requires knowing when you wrote some-thing down.
Always write down the full reference to an article that you’ve copied, as soon
as you’ve copied it: Write it on the first page of the copied article. No excep-tions! Until I learned this lesson, I can’t tell you how many times I had to goback and find the source because I had not written down the reference at themoment I copied the article.
Always write down why you think a particular article is significant for your
work, because in six months you probably will have forgotten: Any longer-termresearch project involves more details than you can keep in your head, so keepgood notes on articles you decide to clip.
Be selective about the articles you clip and file, but clip the important ones with-
out fail: In this age of ubiquitous web access, electronic databases of most pub-lications are widely available. Save time and avoid clipping articles unless theyare immediately useful for a current research project. Do print and file thosearticles you actually use, so you can refer to them later.
PART V : SHOW YOUR STUFF • 151
7
9

152 • TURNING NUMBERS INTO KNOWLEDGE
If you create computer code or spreadsheets, put extensive explanations of your
logic into the code in comments and footnotes: Describe your reasoning as ifsomeone else will be reading that code and trying to understand it because thatis literally the case: in six months, you will be a very different person who has for-gotten the details that led you to structure your calculations in the way you did.
If you work with spreadsheets, never type data directly into spreadsheet for-
mulas: For example, some people enter formulas that look like this into aspreadsheet cell: = 2 x 457.3/9415 + 24. Instead, enter these numbers into cells,then create formulas that use these cells for calculations, like this: = F2 x F3/F4+ F5 (in this case, the various numbers are in cells F2 through F5). You can eas-ily change the data later without having to fiddle with the formulas, plus youcan see the input data for the calculation without having to poke around in thecell containing the formula. Such planning ahead can save you time and makeit easier to spot mistakes in the data and calculations.
Segregate input data in one part of the spreadsheet and results in another part:
Be systematic and you will be able to recreate your calculations even a year fromnow, after you’ve forgotten the assumptions that are now so fresh in your mind.
Define units: Make sure your documentation is clear about exactly which unitsyou are using. For example, the word “ton” has at least five different possiblemeanings. There are short tons (2,000 pounds or 907 kg), long or deadweighttons (2,240 pounds or 1,016 kg), metric tons (sensibly defined as 1,000 kg),tons of cooling (defined as 12,000 Btus/hour of cooling capacity) and registertons, which are (oddly enough) defined in units of volume! Also beware of def-initions that vary by country. The word “billion” means 1,000,000,000 (109) inthe U.S., but in much of Europe that same number is written as “thousandmillion.” In Europe, a billion is 1,000,000,000,000 or 1012 (which in the U.S.is called a “trillion”). For the sometimes confusing history of the word “bil-lion,” see the Wall Street Journal’s “Numbers Guy” column of March 30, 2006.For an excellent on-line dictionary of units, see <http://www.unc.edu/~rowlett/units>.
Define constants: Constants and conventions must be carefully defined, or con-fusion can result. For example, analysts typically assume that a year is equal to
PART V : SHOW YOUR STUFF • 153
8,760 hours, which is 365 days times twenty-four hours per day. In reality, theaverage year is 8,766 hours, because of leap years (every fourth year has anadditional day). The small difference in these two numbers may lead to slightdiscrepancies, but other such conventions may have larger effects.
Go metric: Use metric units in any analysis reports that may be useful to read-ers outside the U.S. If your U.S. audience would find those units confusing,include both English and metric units. Because the World Wide Web is an inter-national medium, you should ensure that your work will gain wide use by thosein other countries who use different (and in this case more logical) conventionsthan you do. Tailoring your results for the ease of these readers will help yourmessage spread more quickly than it would otherwise.
C R E AT I N G A T R A I L F O R OT H E R S TO F O L L OW
The importance of documenting your work comes to the fore when there issome kind of a crisis. In August 1997 my former boss, Mark Levine, was calledbefore the President’s Council of Economic Advisors to testify about a report wehad recently completed. I had created most of the calculations summarizing theresults and had written a detailed description of how the calculations weredone. I crafted the documentation for a technical analyst who wanted to repro-duce my calculations and who had time to delve into depth. While Mark is atechnical analyst, it soon became obvious that he needed something a little dif-ferent because his time was so limited. I talked him through the calculations,and the testimony went well. The lesson was not lost on me, however.
Assume that the person reading your documentation has limited time to fig-ure it out. This is the right approach when documenting because it will ensurethat you take appropriate care. You may think that your task won’t require suchthoroughness, but what if someone else has to pick up where you left off?
Describe the calculations in such excruciating detail that, even in the worstcase, an intelligent reader could understand and reproduce your calculations asquickly as possible. Put a clear description of your methods in the main body ofyour report; then, relegate the complete documentation to appendices. Suchdetail may seem like overkill at the time, but you will never regret it. You maynot be able to anticipate how your calculations will be used in the future.
38
32
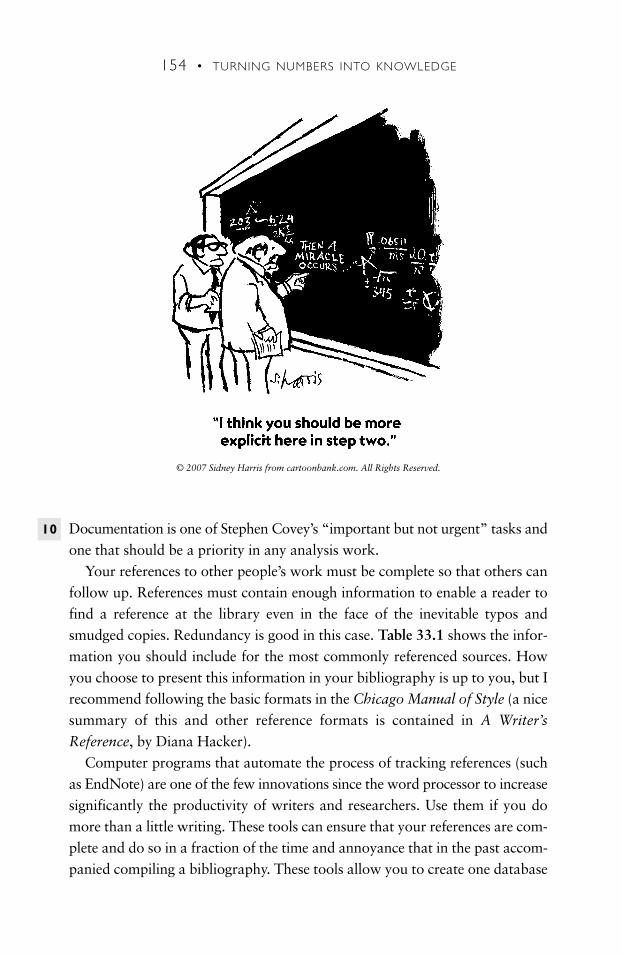
154 • TURNING NUMBERS INTO KNOWLEDGE
Documentation is one of Stephen Covey’s “important but not urgent” tasks andone that should be a priority in any analysis work.Cartoon11here
Your references to other people’s work must be complete so that others canfollow up. References must contain enough information to enable a reader tofind a reference at the library even in the face of the inevitable typos andsmudged copies. Redundancy is good in this case. Table 33.1 shows the infor-mation you should include for the most commonly referenced sources. Howyou choose to present this information in your bibliography is up to you, but Irecommend following the basic formats in the Chicago Manual of Style (a nicesummary of this and other reference formats is contained in A Writer’s
Reference, by Diana Hacker).Computer programs that automate the process of tracking references (such
as EndNote) are one of the few innovations since the word processor to increasesignificantly the productivity of writers and researchers. Use them if you domore than a little writing. These tools can ensure that your references are com-plete and do so in a fraction of the time and annoyance that in the past accom-panied compiling a bibliography. These tools allow you to create one database
© 2007 Sidney Harris from cartoonbank.com. All Rights Reserved.
10
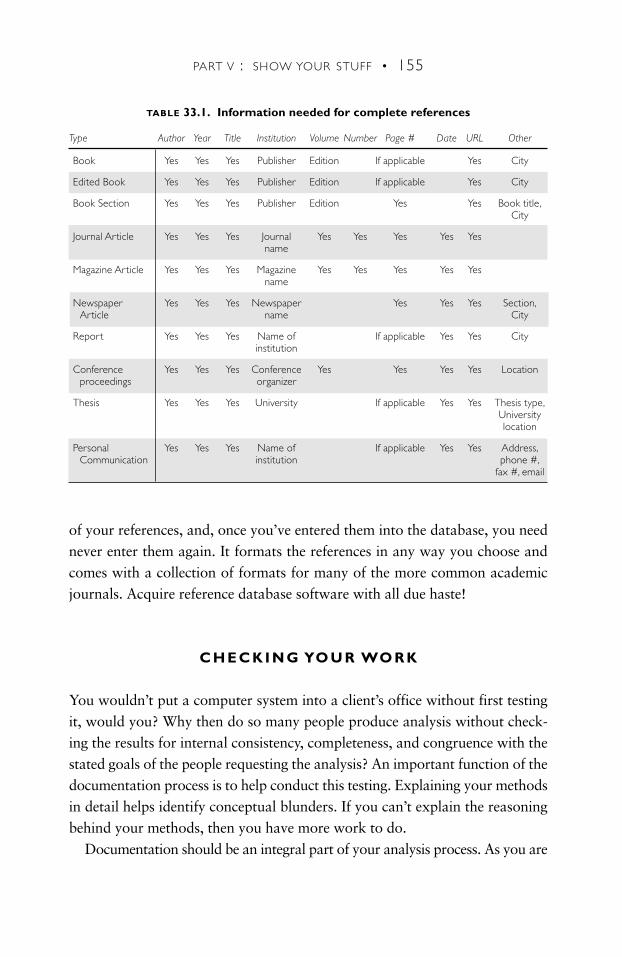
TABLE 33.1. Information needed for complete references
Type Author Year Title Institution Volume Number Page # Date URL Other
Book Yes Yes Yes Publisher Edition If applicable Yes City
Edited Book Yes Yes Yes Publisher Edition If applicable Yes City
Book Section Yes Yes Yes Publisher Edition Yes Yes Book title,City
Journal Article Yes Yes Yes Journal Yes Yes Yes Yes Yesname
Magazine Article Yes Yes Yes Magazine Yes Yes Yes Yes Yesname
Newspaper Yes Yes Yes Newspaper Yes Yes Yes Section,Article name City
Report Yes Yes Yes Name of If applicable Yes Yes Cityinstitution
Conference Yes Yes Yes Conference Yes Yes Yes Yes Locationproceedings organizer
Thesis Yes Yes Yes University If applicable Yes Yes Thesis type,University location
Personal Yes Yes Yes Name of If applicable Yes Yes Address,Communication institution phone #,
fax #, email
PART V : SHOW YOUR STUFF • 155
of your references, and, once you’ve entered them into the database, you neednever enter them again. It formats the references in any way you choose andcomes with a collection of formats for many of the more common academicjournals. Acquire reference database software with all due haste!
C H E C K I N G YO U R WO R K
You wouldn’t put a computer system into a client’s office without first testingit, would you? Why then do so many people produce analysis without check-ing the results for internal consistency, completeness, and congruence with thestated goals of the people requesting the analysis? An important function of thedocumentation process is to help conduct this testing. Explaining your methodsin detail helps identify conceptual blunders. If you can’t explain the reasoningbehind your methods, then you have more work to do.Table33.1here
Documentation should be an integral part of your analysis process. As you are
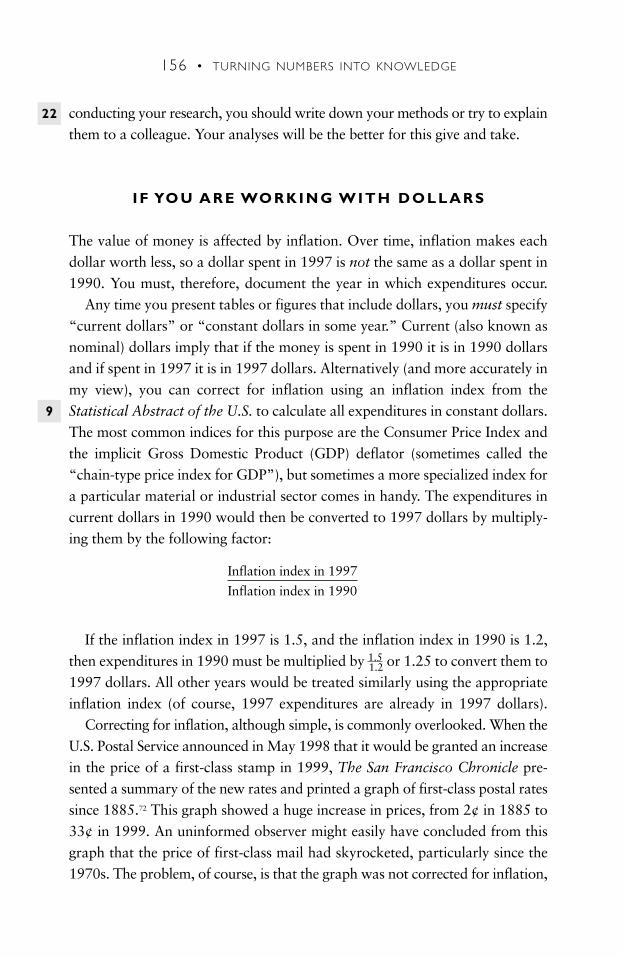
156 • TURNING NUMBERS INTO KNOWLEDGE
conducting your research, you should write down your methods or try to explainthem to a colleague. Your analyses will be the better for this give and take.
I F YO U A R E WO R K I N G W I T H D O L L A R S
The value of money is affected by inflation. Over time, inflation makes eachdollar worth less, so a dollar spent in 1997 is not the same as a dollar spent in1990. You must, therefore, document the year in which expenditures occur.
Any time you present tables or figures that include dollars, you must specify“current dollars” or “constant dollars in some year.” Current (also known asnominal) dollars imply that if the money is spent in 1990 it is in 1990 dollarsand if spent in 1997 it is in 1997 dollars. Alternatively (and more accurately inmy view), you can correct for inflation using an inflation index from theStatistical Abstract of the U.S. to calculate all expenditures in constant dollars.The most common indices for this purpose are the Consumer Price Index andthe implicit Gross Domestic Product (GDP) deflator (sometimes called the“chain-type price index for GDP”), but sometimes a more specialized index fora particular material or industrial sector comes in handy. The expenditures incurrent dollars in 1990 would then be converted to 1997 dollars by multiply-ing them by the following factor:
Inflation index in 1997
Inflation index in 1990
If the inflation index in 1997 is 1.5, and the inflation index in 1990 is 1.2,then expenditures in 1990 must be multiplied by 1.5
1.2 or 1.25 to convert them to1997 dollars. All other years would be treated similarly using the appropriateinflation index (of course, 1997 expenditures are already in 1997 dollars).
Correcting for inflation, although simple, is commonly overlooked. When theU.S. Postal Service announced in May 1998 that it would be granted an increasein the price of a first-class stamp in 1999, The San Francisco Chronicle pre-sented a summary of the new rates and printed a graph of first-class postal ratessince 1885.72 This graph showed a huge increase in prices, from 2¢ in 1885 to33¢ in 1999. An uninformed observer might easily have concluded from thisgraph that the price of first-class mail had skyrocketed, particularly since the1970s. The problem, of course, is that the graph was not corrected for inflation,
9
22
PART V : SHOW YOUR STUFF • 157
and nowhere did the Chronicle article mention this omission. The Oakland
Tribune story on the same topic73 correctly reproduced two graphs, one in cur-rent dollars and one in inflation-adjusted dollars. The second graph showed thatthe 33¢ price of first class mail in 1999 actually represented a decline in con-stant dollars from 35¢ in 1885.
A more recent example appeared in the investor newspaper Barron’s inSeptember 200774 (the Barron’s graph plotted the spot price of Saudi light crudeoil, but the picture is about the same using the acquisition price for crude oilimported to US refineries, which is what I’ve plotted in Figure 33.1). I will havea lot more to say about the incorrect and misleading attributes of this graph inthe chapter on improving graph design, but for now, just note that the reader wasasked to compare two segments of the time series of oil prices and marvel at howsimilar they looked. “I’ve seen this movie before,” said the person being inter-viewed about his predictions about future oil prices, implying that the similarityin the two graphs made a subsequent drop in oil prices likely. Regardless of themerits of that argument (and there are some) it is in this case based on false prem-
FIGURE 33.1. Nominal refinery acquisition cost for imported crude oil to the US
note: Price data taken from the US Energy Information Administration.
0
5
10
15
20
25
30
35
40
Jan-73 Jan-75 Jan-77 Jan-79 Jan-81 Jan-83 Jan-85 Jan-87
No
min
al U
S d
olla
rs p
er b
arre
l
10
20
30
40
50
60
70Overlay of Q1 '99 - Q1 '07
(right axis)
Q1 '73- Q3 '86(left axis)
11

158 • TURNING NUMBERS INTO KNOWLEDGE
ises: It is simply incorrect to compare nominal prices from two different timeperiods without correcting for inflation. Even a normally excellent business pub-lication like Barron’s can fall into this trap, but you need not be misled.
I once found a report that contained information on the costs of computingpower in the 1950s and 1960s, and at first I was delighted. My delight turnedto dismay when I realized that the report did not document whether the costswere current or constant dollars, and I was unable to use the informationbecause I couldn’t determine how to treat the costs. What a waste! Don’t let thishappen to your work.
From The Big Book of Hell © 1990 by Matt Groening. All Rights Reserved. Reprinted by permission of Pantheon Books, a division of Random House, Inc., NY. Courtesy of Acme Features Syndicate.
There are similar (but even more intricate) subtleties regarding the use of cur-rency exchange rates to convert foreign currencies to dollars or vice versa.Because such rates fluctuate over time, you must document which exchangerates you are using; otherwise your calculations are useless to the reader.75
TA K E R E S P O N S I B I L I T Y F O R YO U R WO R K
When documenting or writing reports, take responsibility by using the activevoice. For example, say “I estimated the following parameters” instead of “thefollowing parameters were estimated.” Make it crystal clear who did what, sothere is no ambiguity. The passive voice is the tool of people who want to avoidresponsibility for their actions, but the purpose of documentation is to assignresponsibility, for all the reasons listed above. Don’t thwart your efforts by usingthe often ambiguous passive voice.Cart12here(LifeinHell)
D O C U M E N TAT I O N PAYS O F F
Any time there is a new “hot” analysis topic, people with little prior knowledgejump in. You can perform an immense service to any debate (and garner atten-tion for your point of view) simply by being systematic in identifying and inves-tigating such topics and documenting them in a careful way.
A case in point is the raucous debate over the cost of pollution to societyfrom power plants during the late 1980s and early 1990s. In 1990, I wrote apaper that was not a conceptual breakthrough but simply created consistentcomparisons among different estimates of these social costs. I received hundredsof requests from all over the world for this admittedly rather dry technicalreport as well as offers to speak at conferences and opportunities to contributeto other reports on the topic. It garnered attention in large part because of itssystematic and careful documentation. You too can use this approach to youradvantage.
The same sort of intellectual chaos that pervaded that debate now charac-terizes the emerging demand for advertising and commerce on the web.Businesses want hard numbers about the effectiveness of web advertising in sell-ing their products, but solid statistics are still scarce and controversy reignsabout different methodologies. Systematic thinking in this area could be of
PART V : SHOW YOUR STUFF • 159
25
immense value to the companies deciding on advertising budgets. As of thiswriting, the decisions are being driven more by hype than data.
B AC K U P YO U R DATA !
Many analysts don’t routinely back up their electronic files. This oversight ispotentially disastrous, as the otherwise technology-savvy Stanford BusinessSchool found out in April 1998. Two large computers were moved before theoperators verified that all data had been backed up, and almost a dozenresearchers lost years of work.76 Hard disks, floppy disks, and data tapes don’tlast forever, and they are guaranteed to fail at the least opportune time (they canalso become obsolete as technology changes). I have many colleagues who havelost data from such failures, and it’s never fun. So after you’ve gone to the trou-ble of carefully documenting your work, make sure that there are at least a cou-ple of electronic copies, and put a paper version in a safe place. One trick is toemail electronic files to yourself, which places them on the server of yourInternet service provider and adds an additional layer of redundancy. Also don’tforget that data formats change over time, so if you have some older files, con-vert them to a new format before trashing the program that created them.
C O N C L U S I O N S
Ignorance of good data documentation practices is widespread. These skillsshould be taught in high school, yet technically trained college graduates rou-tinely do not identify their data sources or the methods they used for their cal-culations. Don’t fall into this trap. Make sure that any intelligent person(including YOU!) can reproduce your analysis from the footnotes. With this onesimple step, you will vault above 95% of the world’s analysts. Leaping over theother 5% depends on the quality of your content.
160 • TURNING NUMBERS INTO KNOWLEDGE
Results! Why, man, I have gotten a lot of results. I know severalthousand things that won’t work. — T H O M A S A . E D I S O N

161
In any writing that relies on quantitative analysis, the calculations are the bulkof the work. First, create the tables documenting data and presenting results;then, write the text describing the inputs and analysis. For particularly impor-tant results, make graphs that best emphasize the points you want to make.
The text should call out only the most important numbers in the table forease of comprehension. The numbers junkies can delve into the table for anydetails they feel compelled to unearth.
The following passage is an example of the right way to summarize techni-cal analysis, taken from the section “Dig into the numbers” above:
Table 34.1 summarizes the key financial parameters for calculating marketcapitalization for the two companies.
The first thing to notice about the financial statistics for these two com-panies is a huge disparity. While GE’s market capitalization in November2007 was about twice as large as Google’s, GE’s revenues were almosttwelve times larger. All other things being equal, we might expect that com-panies with similar market valuations would also have similar revenuestreams. All other things are not equal, however, and finding out why willhelp illustrate this important analytical technique.
If Google’s market capitalization per dollar of revenues was the same asGE, we would expect that its market capitalization would be only one-sixthas large as it is and we need to explain this six-fold discrepancy. To do so,we examine the components of the last equation above. The first component
LET THE TABLES AND GRAPHS
DO THE WORK
Don’t just write to be understood; write so that you cannot be mis-understood. — RO B E RT L O U I S S T E V E N S O N
CHAPTER
34
36
35
27
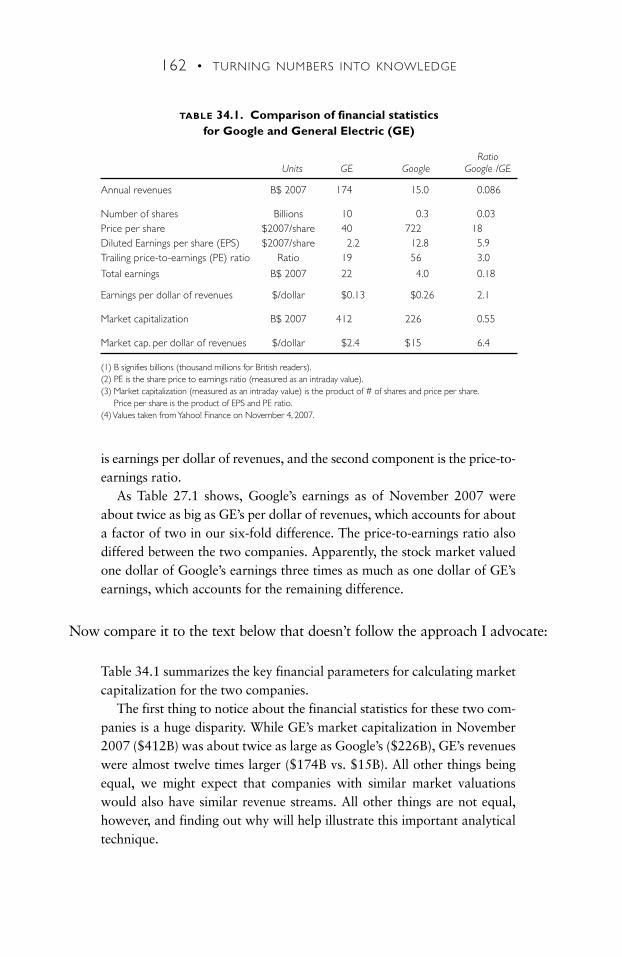
162 • TURNING NUMBERS INTO KNOWLEDGE
is earnings per dollar of revenues, and the second component is the price-to-earnings ratio.
As Table 27.1 shows, Google’s earnings as of November 2007 wereabout twice as big as GE’s per dollar of revenues, which accounts for abouta factor of two in our six-fold difference. The price-to-earnings ratio alsodiffered between the two companies. Apparently, the stock market valuedone dollar of Google’s earnings three times as much as one dollar of GE’searnings, which accounts for the remaining difference.
Now compare it to the text below that doesn’t follow the approach I advocate:
Table 34.1 summarizes the key financial parameters for calculating marketcapitalization for the two companies.
The first thing to notice about the financial statistics for these two com-panies is a huge disparity. While GE’s market capitalization in November2007 ($412B) was about twice as large as Google’s ($226B), GE’s revenueswere almost twelve times larger ($174B vs. $15B). All other things beingequal, we might expect that companies with similar market valuationswould also have similar revenue streams. All other things are not equal,however, and finding out why will help illustrate this important analyticaltechnique.
TABLE 34.1. Comparison of financial statistics for Google and General Electric (GE)
RatioUnits GE Google Google /GE
Annual revenues B$ 2007 174 15.0 0.086
Number of shares Billions 10 0.3 0.03Price per share $2007/share 40 722 18Diluted Earnings per share (EPS) $2007/share 2.2 12.8 5.9Trailing price-to-earnings (PE) ratio Ratio 19 56 3.0
Total earnings B$ 2007 22 4.0 0.18
Earnings per dollar of revenues $/dollar $0.13 $0.26 2.1
Market capitalization B$ 2007 412 226 0.55
Market cap. per dollar of revenues $/dollar $2.4 $15 6.4
(1) B signifies billions (thousand millions for British readers).(2) PE is the share price to earnings ratio (measured as an intraday value).(3) Market capitalization (measured as an intraday value) is the product of # of shares and price per share.
Price per share is the product of EPS and PE ratio.(4) Values taken from Yahoo! Finance on November 4, 2007.
PART V : SHOW YOUR STUFF • 163
If Google’s market capitalization per dollar of revenues ($15) was thesame as GE’s ($2.4), we would expect that its market capitalization wouldbe only one-sixth as large as it is, and we need to explain this six-fold dis-crepancy. To do so, we examine the components of the last equationabove. The first component is earnings per dollar of revenues, and the sec-ond component is the price-to-earnings ratio.
As Table 27.1 shows, Google has 0.3 billion shares outstanding, withearnings of $12.8 per share. GE has about 10 billion shares in the hands ofstockholders, with earnings of $2.2 per share. The product of the numberof shares and the earnings per share gives the total annual profits for eachcompany. For Google, profits are about $4B on revenues of $15B, and forGE, profits are about $22B on revenues of $174B.
Every dollar of Google’s revenues therefore yields twice as much profit asdoes a dollar of GE’s revenues ($0.26 compared to $0.13 per dollar of rev-enues). So the increased profitability of Google per dollar of revenuesaccounts for about a factor of two in our six-fold difference.
The price-to-earnings ratio also differed between the two companies.Apparently, the stock market valued one dollar of Google’s earnings (PE =56) three times as much as one dollar of GE’s earnings (PE = 19), whichaccounts for the remaining difference.
This text is potentially intimidating to the reader who is less comfortable withnumbers, it is less compact, and it repeats data that are already presented in thetable itself. It also requires much more exacting proofreading
In addition, if the calculations change, you’ll have to manually change thetext to reflect those calculations. If the calculations are in a table printed orcopied from a spreadsheet, you merely change the calculations in the table, printit out again or copy it into your text, and change the few key numbers in thetext that refer to the table. This approach is far less labor intensive when youneed to make changes (and you almost always need to make changes at somepoint).
If you omit the table and just include the more numbers-heavy text, as iscommonly done, you make it even harder for readers to assess the validity ofyour assertions. The table organizes the information and makes it convenientlyavailable to the reader. It also makes it easier to write the text.
The main purpose of writing of this type is to present, in as clear a fashionas possible, the logic of the calculations, the main input data, and the key
results. Any competent analyst ought to be able to reproduce your analysisusing the documentation contained in your report. If they can’t, your work isn’tdone. An astounding number of analysts routinely omit vital data and assump-tions from their reports, a practice for which there can be no excuse.
If the analysis is well conceived, the tables and graphs well designed, and theaudience clearly defined, the report should practically write itself. I normally usethe following main headings in technical reports (your specific needs may dic-tate a slightly different structure):
Introduction
Methodology and Data
Results
Discussion
Limitations of this analysis
Future work
Conclusions
References
Appendices
Using this method, the writing task becomes one of straightforward description,except in the “Discussion” and “Conclusions” sections, where you describewhy the results are important.
Place detailed calculations and supporting data in appendices. Only putessential information in the main body of the report. When possible, write rel-atively short technical reports that summarize the analysis results and relegatecomplete documentation to appendices. It is then a simple matter to take theshort report, eliminate all but the three to five of the most crucial graphs andtables, change some text, and send it off to a journal for publication.
One trick that helps the reader of longer articles and reports is to put in boldface the first mention of tables and graphs in the text so it is obvious where theyare discussed and explained. For example: “Table 1 shows the results . . .” Thistrick makes it easier for readers who jump straight to the results and want tocomprehend the analysis quickly. There are many such readers, which alsomakes it essential that each table and figure have footnotes that document thekey elements of the supporting calculations.
164 • TURNING NUMBERS INTO KNOWLEDGE
33
33
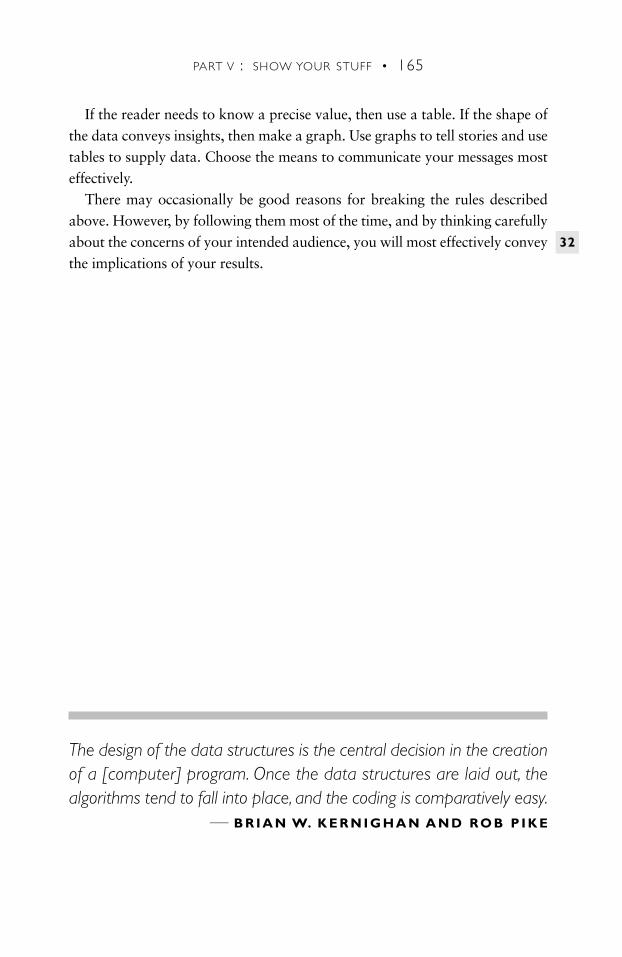
If the reader needs to know a precise value, then use a table. If the shape ofthe data conveys insights, then make a graph. Use graphs to tell stories and usetables to supply data. Choose the means to communicate your messages mosteffectively.
There may occasionally be good reasons for breaking the rules describedabove. However, by following them most of the time, and by thinking carefullyabout the concerns of your intended audience, you will most effectively conveythe implications of your results.
PART V : SHOW YOUR STUFF • 165
32
The design of the data structures is the central decision in the creationof a [computer] program. Once the data structures are laid out, thealgorithms tend to fall into place, and the coding is comparatively easy.
— B R I A N W. K E R N I G H A N A N D RO B P I K E

166
Modern graphs are largely an eighteenth-century creation. Edward Tufte,one of the modern masters of graphical display, states that Playfair, Lambert,and others developed the first graphs that broke away from a geographical rep-resentation. In the two centuries since, such charts have become commonplace.Modern computer tools make creating graphs from data simple—in fact, it hasprobably become too easy. Graphs are often produced without thought for theirmain purpose: to enlighten and inform the reader.
Tufte defines graphical excellence as “that which gives to the viewer thegreatest number of ideas in the shortest time with the least ink in the smallestspace.”77 He promotes several rules that will help you avoid the most commonpitfalls, which I summarize below:
• “Above all else show the data”: Make sure the graphs highlight yourresults instead of hiding them as many graphs do. Use the graphs to tellstories about your analysis, and make those stories leap out at the reader.
• “Maximize the data-to-ink ratio, within reason”: Tufte defines the data-ink ratio as the amount of ink that conveys information divided by thetotal amount of ink used for the graph. Many graphs have low data-inkratios, and you should avoid this pitfall. To maximize the data-ink ratio,“erase non-data-ink and redundant data-ink.”
• “Eliminate chart junk”: Remove clashing fill patterns (Moiré patterns),which are hard on the eyes. Eliminate extraneous gridlines, which obscurethe data. Delete graphical elements that decorate but convey no informa-tion, such as 3-dimensional (3-D) chart elements on 2-D graphs.
This latter mistake is a common one, particularly in “slick” brochuresand company annual reports. Although there are legitimate uses for 3-Dgraphs, a bar chart is not one of them. I adapted Figure 35.1 from the1999 annual report of a company with $6 billion in sales in 1999.Fig35.1here
CREATE COMPELLING GRAPHS
AND FIGURES
CHAPTER
35
3218
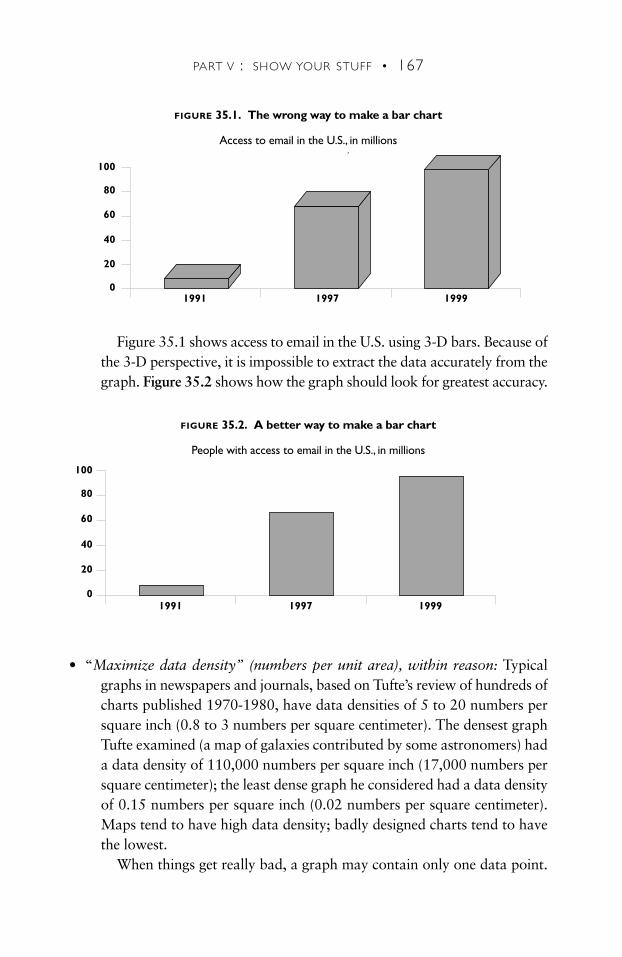
PART V : SHOW YOUR STUFF • 167
Figure 35.1 shows access to email in the U.S. using 3-D bars. Because ofthe 3-D perspective, it is impossible to extract the data accurately from thegraph. Figure 35.2 shows how the graph should look for greatest accuracy.Fig.35.2here
• “Maximize data density” (numbers per unit area), within reason: Typicalgraphs in newspapers and journals, based on Tufte’s review of hundreds ofcharts published 1970-1980, have data densities of 5 to 20 numbers persquare inch (0.8 to 3 numbers per square centimeter). The densest graphTufte examined (a map of galaxies contributed by some astronomers) hada data density of 110,000 numbers per square inch (17,000 numbers persquare centimeter); the least dense graph he considered had a data densityof 0.15 numbers per square inch (0.02 numbers per square centimeter).Maps tend to have high data density; badly designed charts tend to havethe lowest.
When things get really bad, a graph may contain only one data point.
100
80
60
40
20
01991 1997 1999
Access to e-mail in the US, in millions
FIGURE 35.1. The wrong way to make a bar chart
Access to email in the U.S., in millions
100
80
60
40
20
01991 1997 1999
FIGURE 35.2. A better way to make a bar chart
People with access to email in the U.S., in millions
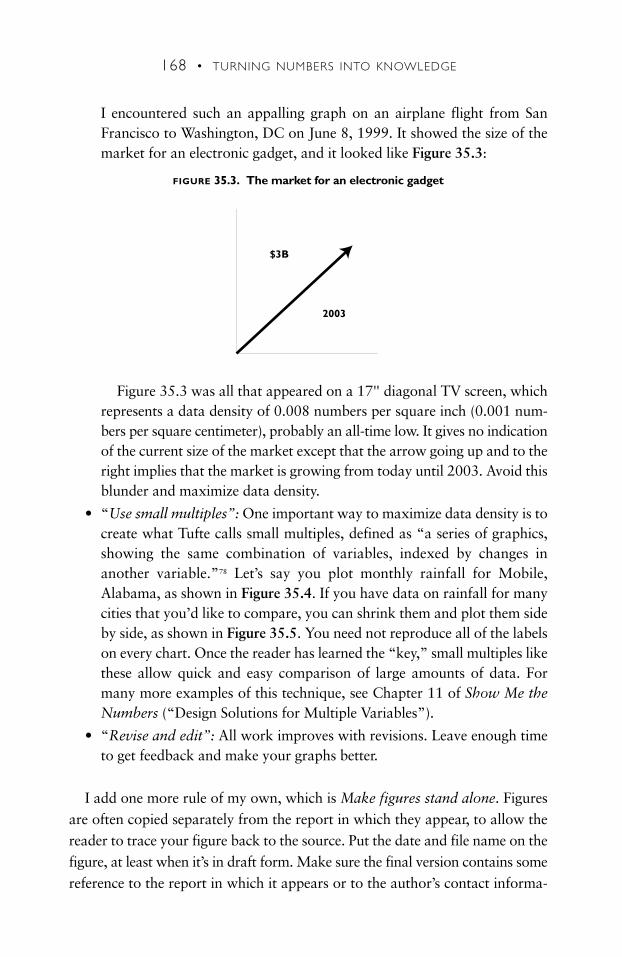
168 • TURNING NUMBERS INTO KNOWLEDGE
I encountered such an appalling graph on an airplane flight from SanFrancisco to Washington, DC on June 8, 1999. It showed the size of themarket for an electronic gadget, and it looked like Figure 35.3:Fig.35.3here
Figure 35.3 was all that appeared on a 17'' diagonal TV screen, whichrepresents a data density of 0.008 numbers per square inch (0.001 num-bers per square centimeter), probably an all-time low. It gives no indicationof the current size of the market except that the arrow going up and to theright implies that the market is growing from today until 2003. Avoid thisblunder and maximize data density.
• “Use small multiples”: One important way to maximize data density is tocreate what Tufte calls small multiples, defined as “a series of graphics,showing the same combination of variables, indexed by changes inanother variable.”78 Let’s say you plot monthly rainfall for Mobile,Alabama, as shown in Figure 35.4. If you have data on rainfall for manycities that you’d like to compare, you can shrink them and plot them sideby side, as shown in Figure 35.5. You need not reproduce all of the labelson every chart. Once the reader has learned the “key,” small multiples likethese allow quick and easy comparison of large amounts of data. Formany more examples of this technique, see Chapter 11 of Show Me theNumbers (“Design Solutions for Multiple Variables”).
• “Revise and edit”: All work improves with revisions. Leave enough timeto get feedback and make your graphs better.
I add one more rule of my own, which is Make figures stand alone. Figuresare often copied separately from the report in which they appear, to allow thereader to trace your figure back to the source. Put the date and file name on thefigure, at least when it’s in draft form. Make sure the final version contains somereference to the report in which it appears or to the author’s contact informa-
$3B
2003
FIGURE 35.3. The market for an electronic gadget
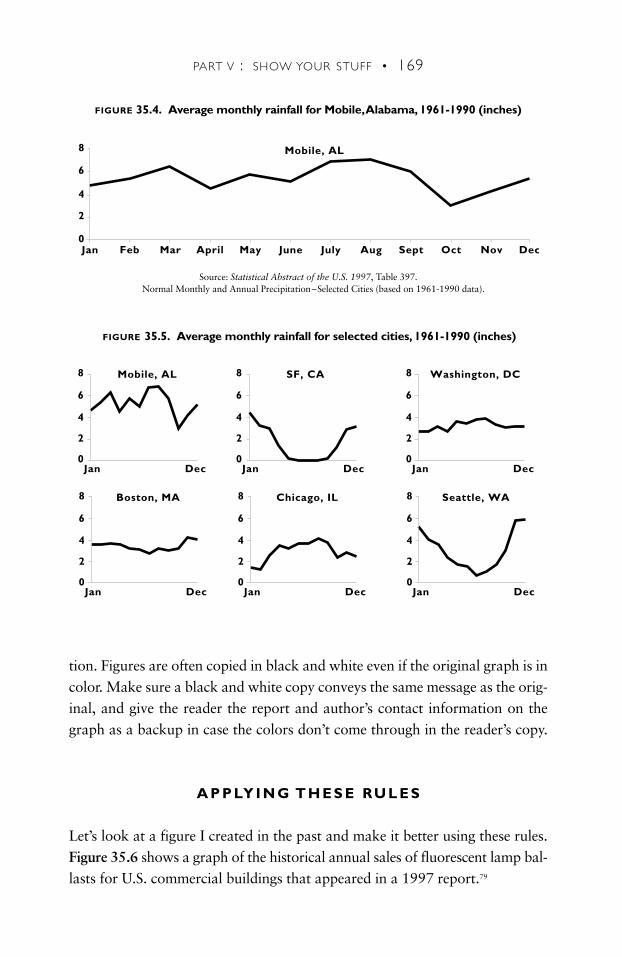
PART V : SHOW YOUR STUFF • 169
tion. Figures are often copied in black and white even if the original graph is incolor. Make sure a black and white copy conveys the same message as the orig-inal, and give the reader the report and author’s contact information on thegraph as a backup in case the colors don’t come through in the reader’s copy.
A P P LY I N G T H E S E RU L E S
Let’s look at a figure I created in the past and make it better using these rules.Figure 35.6 shows a graph of the historical annual sales of fluorescent lamp bal-lasts for U.S. commercial buildings that appeared in a 1997 report.79
8
6
4
2
0Jan Feb Mar April May June July Aug Sept Oct Nov Dec
Mobile, AL
Source: Statistical Abstract of the U.S. 1997, Table 397. Normal Monthly and Annual Precipitation–Selected Cities (based on 1961-1990 data).
FIGURE 35.4. Average monthly rainfall for Mobile,Alabama, 1961-1990 (inches)
8
6
4
2
0Jan Dec
Mobile, AL 8
6
4
2
0Jan Dec
SF, CA 8
6
4
2
0Jan Dec
Washington, DC
FIGURE 35.5. Average monthly rainfall for selected cities, 1961-1990 (inches)
8
6
4
2
0Jan Dec
Seattle, WA8
6
4
2
0Jan Dec
Chicago, IL8
6
4
2
0Jan Dec
Boston, MA
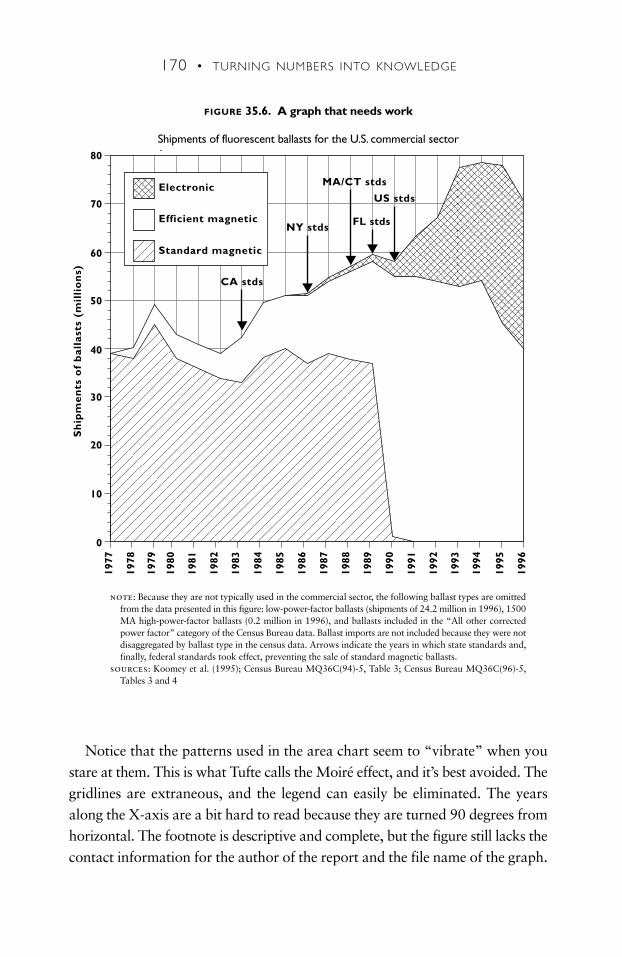
170 • TURNING NUMBERS INTO KNOWLEDGE
p
Electronic
Efficient magnetic
Standard magnetic
CA stds
NY stds
MA/CT stds
FL stds
US stds
80
70
60
50
40
30
20
10
0
Sh
ipm
en
ts o
f b
alla
sts
(mil
lio
ns)
1977
1978
1979
1980
1981
1982
1983
1984
1985
1986
1987
1988
1989
1990
1991
1992
1993
1994
1995
1996
FIGURE 35.6. A graph that needs work
Shipments of fluorescent ballasts for the U.S. commercial sector
note: Because they are not typically used in the commercial sector, the following ballast types are omittedfrom the data presented in this figure: low-power-factor ballasts (shipments of 24.2 million in 1996), 1500MA high-power-factor ballasts (0.2 million in 1996), and ballasts included in the “All other correctedpower factor” category of the Census Bureau data. Ballast imports are not included because they were notdisaggregated by ballast type in the census data. Arrows indicate the years in which state standards and,finally, federal standards took effect, preventing the sale of standard magnetic ballasts.
sources: Koomey et al. (1995); Census Bureau MQ36C(94)-5, Table 3; Census Bureau MQ36C(96)-5,Tables 3 and 4
Notice that the patterns used in the area chart seem to “vibrate” when youstare at them. This is what Tufte calls the Moiré effect, and it’s best avoided. Thegridlines are extraneous, and the legend can easily be eliminated. The yearsalong the X-axis are a bit hard to read because they are turned 90 degrees fromhorizontal. The footnote is descriptive and complete, but the figure still lacks thecontact information for the author of the report and the file name of the graph.
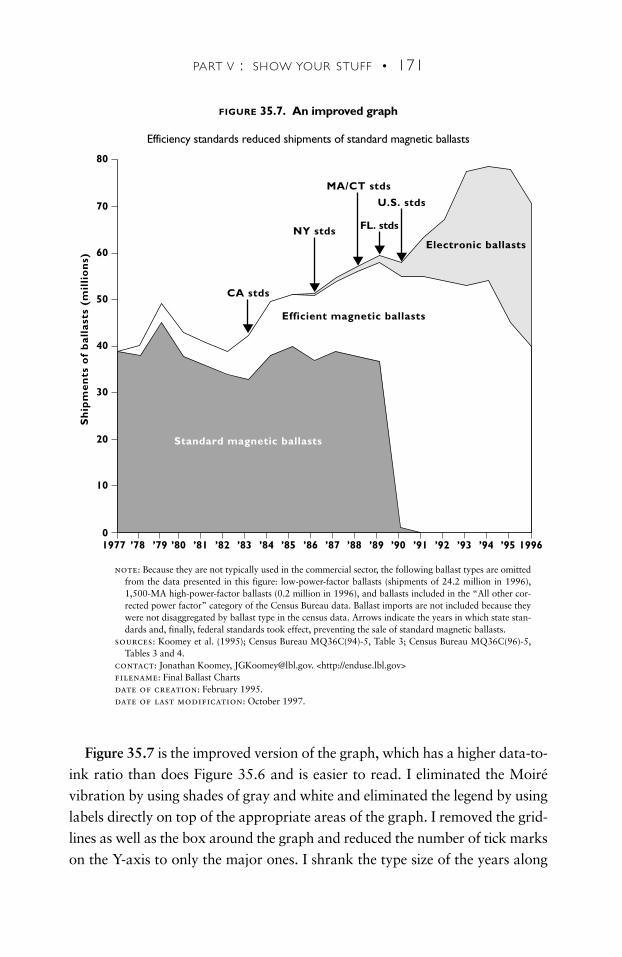
PART V : SHOW YOUR STUFF • 171
Figure 35.7 is the improved version of the graph, which has a higher data-to-ink ratio than does Figure 35.6 and is easier to read. I eliminated the Moirévibration by using shades of gray and white and eliminated the legend by usinglabels directly on top of the appropriate areas of the graph. I removed the grid-lines as well as the box around the graph and reduced the number of tick markson the Y-axis to only the major ones. I shrank the type size of the years along
CA stds
NY stds
MA/CT stds
U.S. stds
FL. stds
Electronic ballasts
Efficient magnetic ballasts
Standard magnetic ballasts
80
70
60
50
40
30
20
10
0
Sh
ipm
en
ts o
f b
alla
sts
(mil
lio
ns)
1977 ’78 ’79 ’80 ’81 ’82 ’83 ’84 ’85 ’86 ’87 ’88 ’89 ’90 ’91 ’92 ’93 ’94 ’95 1996
FIGURE 35.7. An improved graph
Efficiency standards reduced shipments of standard magnetic ballasts
note: Because they are not typically used in the commercial sector, the following ballast types are omittedfrom the data presented in this figure: low-power-factor ballasts (shipments of 24.2 million in 1996),1,500-MA high-power-factor ballasts (0.2 million in 1996), and ballasts included in the “All other cor-rected power factor” category of the Census Bureau data. Ballast imports are not included because theywere not disaggregated by ballast type in the census data. Arrows indicate the years in which state stan-dards and, finally, federal standards took effect, preventing the sale of standard magnetic ballasts.
sources: Koomey et al. (1995); Census Bureau MQ36C(94)-5, Table 3; Census Bureau MQ36C(96)-5,Tables 3 and 4.
contact: Jonathan Koomey, [email protected]. <http://enduse.lbl.gov> filename: Final Ballast Chartsdate of creation: February 1995. date of last modification: October 1997.
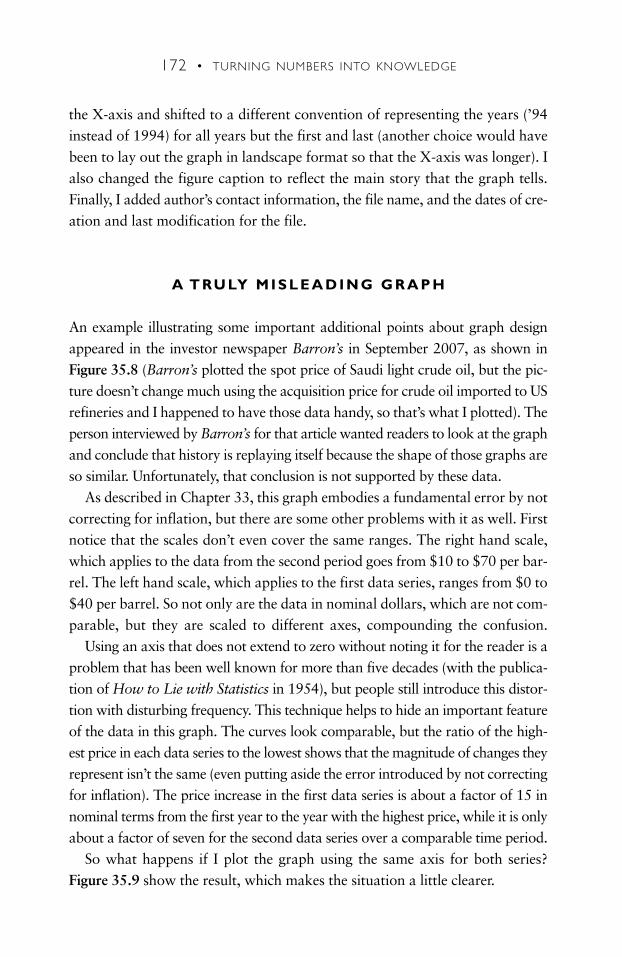
the X-axis and shifted to a different convention of representing the years (’94instead of 1994) for all years but the first and last (another choice would havebeen to lay out the graph in landscape format so that the X-axis was longer). Ialso changed the figure caption to reflect the main story that the graph tells.Finally, I added author’s contact information, the file name, and the dates of cre-ation and last modification for the file.
A T RU LY M I S L E A D I N G G R A P H
An example illustrating some important additional points about graph designappeared in the investor newspaper Barron’s in September 2007, as shown inFigure 35.8 (Barron’s plotted the spot price of Saudi light crude oil, but the pic-ture doesn’t change much using the acquisition price for crude oil imported to USrefineries and I happened to have those data handy, so that’s what I plotted). Theperson interviewed by Barron’s for that article wanted readers to look at the graphand conclude that history is replaying itself because the shape of those graphs areso similar. Unfortunately, that conclusion is not supported by these data.
As described in Chapter 33, this graph embodies a fundamental error by notcorrecting for inflation, but there are some other problems with it as well. Firstnotice that the scales don’t even cover the same ranges. The right hand scale,which applies to the data from the second period goes from $10 to $70 per bar-rel. The left hand scale, which applies to the first data series, ranges from $0 to$40 per barrel. So not only are the data in nominal dollars, which are not com-parable, but they are scaled to different axes, compounding the confusion.
Using an axis that does not extend to zero without noting it for the reader is aproblem that has been well known for more than five decades (with the publica-tion of How to Lie with Statistics in 1954), but people still introduce this distor-tion with disturbing frequency. This technique helps to hide an important featureof the data in this graph. The curves look comparable, but the ratio of the high-est price in each data series to the lowest shows that the magnitude of changes theyrepresent isn’t the same (even putting aside the error introduced by not correctingfor inflation). The price increase in the first data series is about a factor of 15 innominal terms from the first year to the year with the highest price, while it is onlyabout a factor of seven for the second data series over a comparable time period.
So what happens if I plot the graph using the same axis for both series?Figure 35.9 show the result, which makes the situation a little clearer.
172 • TURNING NUMBERS INTO KNOWLEDGE
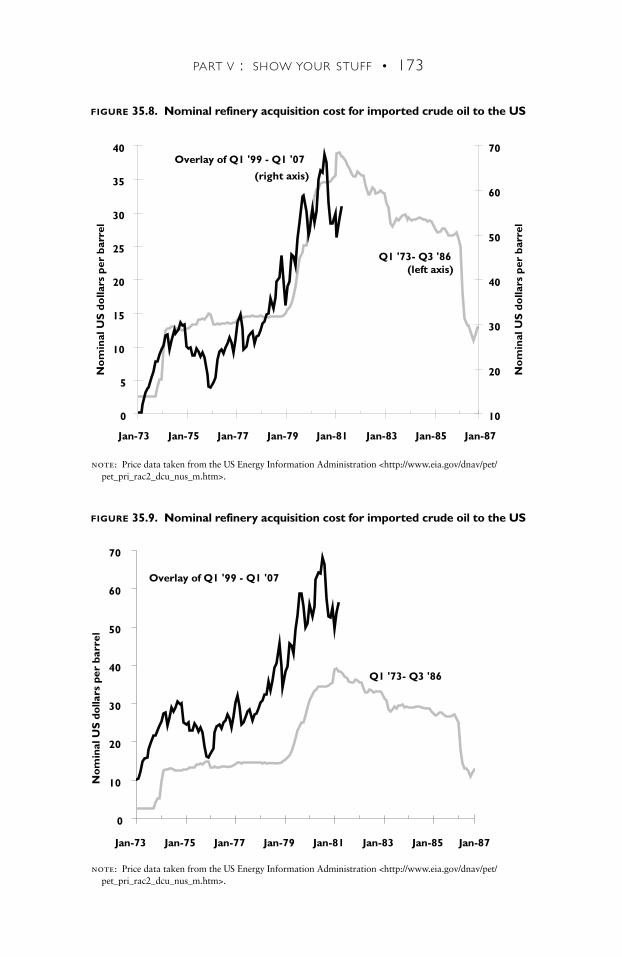
PART V : SHOW YOUR STUFF • 173
0
10
20
30
40
50
60
70
Jan-73 Jan-75 Jan-77 Jan-79 Jan-81 Jan-83 Jan-85 Jan-87
Nom
inal
US
dol
lars
per
bar
rel
Overlay of Q1 '99 - Q1 '07
Q1 '73- Q3 '86
FIGURE 35.8. Nominal refinery acquisition cost for imported crude oil to the US
FIGURE 35.9. Nominal refinery acquisition cost for imported crude oil to the US
note: Price data taken from the US Energy Information Administration <http://www.eia.gov/dnav/pet/pet_pri_rac2_dcu_nus_m.htm>.
0
5
10
15
20
25
30
35
40
Jan-73 Jan-75 Jan-77 Jan-79 Jan-81 Jan-83 Jan-85 Jan-87
No
min
al U
S d
olla
rs p
er b
arre
l
10
20
30
40
50
60
70
No
min
al U
S d
olla
rs p
er b
arre
l
Overlay of Q1 '99 - Q1 '07
(right axis)
Q1 '73- Q3 '86(left axis)
note: Price data taken from the US Energy Information Administration <http://www.eia.gov/dnav/pet/pet_pri_rac2_dcu_nus_m.htm>.
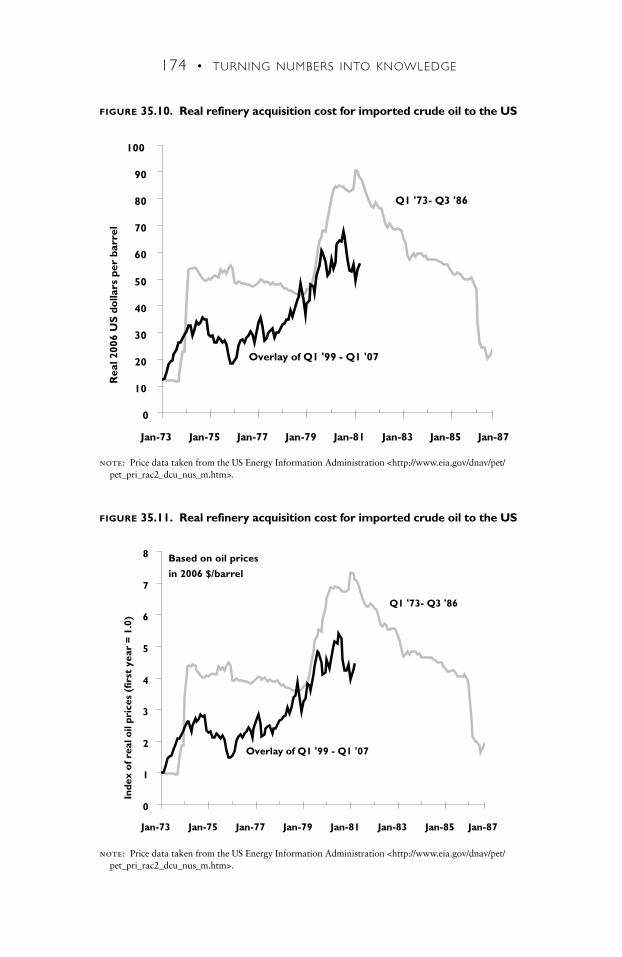
174 • TURNING NUMBERS INTO KNOWLEDGE
FIGURE 35.11. Real refinery acquisition cost for imported crude oil to the US
0
10
20
30
40
50
60
70
80
90
100
Jan-73 Jan-75 Jan-77 Jan-79 Jan-81 Jan-83 Jan-85 Jan-87
Rea
l 200
6 U
S d
olla
rs p
er b
arre
l
Q1 '73- Q3 '86
Overlay of Q1 '99 - Q1 '07
FIGURE 35.10. Real refinery acquisition cost for imported crude oil to the US
note: Price data taken from the US Energy Information Administration <http://www.eia.gov/dnav/pet/pet_pri_rac2_dcu_nus_m.htm>.
0
1
2
3
4
5
6
7
8
Jan-73 Jan-75 Jan-77 Jan-79 Jan-81 Jan-83 Jan-85 Jan-87
Inde
x of
rea
l oil
pric
es (
first
yea
r =
1.0
)
Q1 '73- Q3 '86
Overlay of Q1 '99 - Q1 '07
Based on oil prices
in 2006 $/barrel
note: Price data taken from the US Energy Information Administration <http://www.eia.gov/dnav/pet/pet_pri_rac2_dcu_nus_m.htm>.
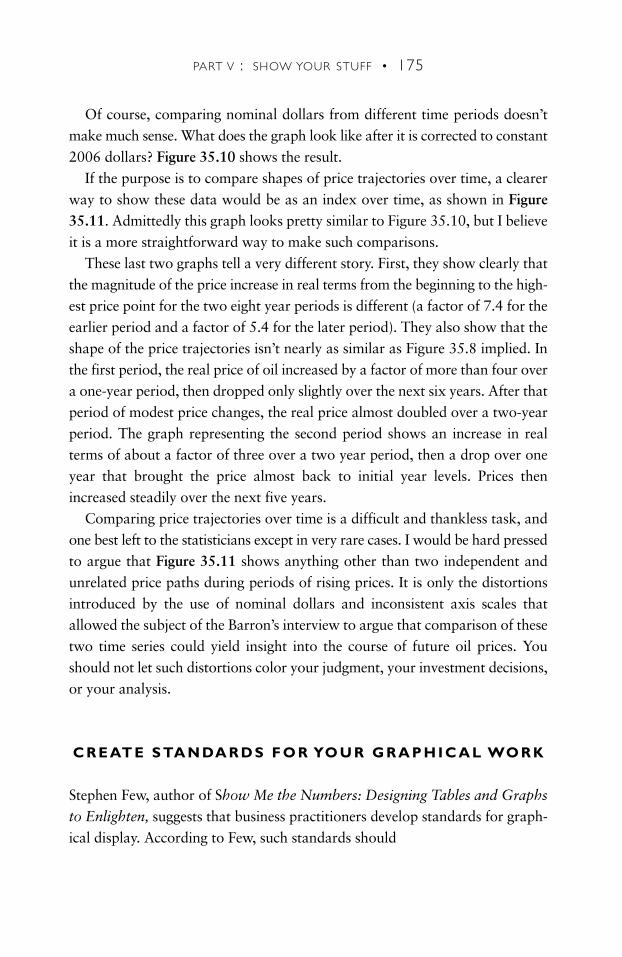
Of course, comparing nominal dollars from different time periods doesn’tmake much sense. What does the graph look like after it is corrected to constant2006 dollars? Figure 35.10 shows the result.
If the purpose is to compare shapes of price trajectories over time, a clearerway to show these data would be as an index over time, as shown in Figure35.11. Admittedly this graph looks pretty similar to Figure 35.10, but I believeit is a more straightforward way to make such comparisons.
These last two graphs tell a very different story. First, they show clearly thatthe magnitude of the price increase in real terms from the beginning to the high-est price point for the two eight year periods is different (a factor of 7.4 for theearlier period and a factor of 5.4 for the later period). They also show that theshape of the price trajectories isn’t nearly as similar as Figure 35.8 implied. Inthe first period, the real price of oil increased by a factor of more than four overa one-year period, then dropped only slightly over the next six years. After thatperiod of modest price changes, the real price almost doubled over a two-yearperiod. The graph representing the second period shows an increase in realterms of about a factor of three over a two year period, then a drop over oneyear that brought the price almost back to initial year levels. Prices thenincreased steadily over the next five years.
Comparing price trajectories over time is a difficult and thankless task, andone best left to the statisticians except in very rare cases. I would be hard pressedto argue that Figure 35.11 shows anything other than two independent andunrelated price paths during periods of rising prices. It is only the distortionsintroduced by the use of nominal dollars and inconsistent axis scales thatallowed the subject of the Barron’s interview to argue that comparison of thesetwo time series could yield insight into the course of future oil prices. Youshould not let such distortions color your judgment, your investment decisions,or your analysis.
C R E AT E S TA N DA R D S F O R YO U R G R A P H I C A L WO R K
Stephen Few, author of Show Me the Numbers: Designing Tables and Graphs
to Enlighten, suggests that business practitioners develop standards for graph-ical display. According to Few, such standards should
PART V : SHOW YOUR STUFF • 175
• have effective communication as their primary objective;
• evolve freely as conditions change or new insights are gained;
• be easy to learn;
• save time;
• be applied to the software that is used to produce tables and graphs in theform of specific guidelines and design templates.
In particular, he advocates that users of Microsoft Excel limit the types ofcharts they use to those that are truly effective and develop custom charts thatimprove upon Excel’s default formats (which are typically appalling) to conformto standards that reflect their preferred design practices.
C O N C L U S I O N S
Tufte reminds us that rules should not be followed slavishly and that our focusshould be on the key goal: “to give visual access to the subtle and the diffi-cult.”80 Graphics should serve your arguments. If they don’t support your analy-sis in a direct and understandable way, they should be ruthlessly deleted or dras-tically modified. As Tufte says, graphs and figures that don’t contribute to the“revelation of the complex”81 have no place in your work.
Read Tufte’s books. Review his guidelines periodically, and apply them toyour current work. Small changes in graphics design can vastly improve theeffectiveness of your figures and graphs.
176 • TURNING NUMBERS INTO KNOWLEDGE
Visual representations of evidence should be governed by principlesof reasoning about quantitative evidence. For information displays,design reasoning must correspond to scientific reasoning. Clear andprecise seeing becomes as one with clear and precise thinking.
— E DWA R D T U F T E
177
CREATE GOOD TABLES
A good table is a work of art while a bad one is worse than useless. I haveworked to refine my table-making skills over the years, and I am constantlyamazed at the perfectly dreadful tables created by authors who should knowbetter. Tables are the heart of a technical report, and care in their creation is onesign of a clear-thinking analyst. A little care can make your tables a resourcethat your readers keep as a reference for many years.
I follow several key principles in creating a table:
• Make them stand alone: Tables are often copied separately from the reportfrom which they came. Make sure the reader can trace your table back tothe source (or at least to the author) and that your calculations areexplained clearly in the footnotes.
• Create extensive footnotes: This aspect of documentation is crucial.Footnotes to the table should explain the methodology, list the keysources, and describe how each source was used. Any intelligent personshould be able to recreate the table from your footnotes. Tufte says thatfootnotes indicate “care and craft,” and readers will be grateful when youcreate them.
Of course, for tables appearing in more popular publications (like news-papers) the standards for footnote documentation are often lower, buteven if the footnotes don’t appear in the printed version, the person whocreated the table should still have the footnotes filed away in case there’sa need to check the calculations later.
• “Maximize the data-ink ratio,” within reason: Edward Tufte’s guidance isjust as relevant for tables as for graphs. Make sure that every part of thetable conveys information. Avoid extraneous gridlines (only include themwhen they enhance reader comprehension). Use carefully chosen whitespace to separate and group results.
CHAPTER
36
33
35
178 • TURNING NUMBERS INTO KNOWLEDGE
• Some redundancy is good: Unlike in graphs, where redundancy shouldgenerally be avoided, showing additional columns or rows for totals andsubtotals is essential. These ostensibly redundant sums help the reader fol-low the calculation and assure that the table is internally consistent. Thesums can also help in troubleshooting your own calculations.
Another important redundancy relates to percentages. If you have a col-umn of percentages, label the column heading “% of total” AND put apercent symbol in every cell (e.g., 1.37%, not 1.37). Sometimes peoplemake mistakes in their calculations and forget to divide by 100 to make areal percentage. By enforcing this redundancy, you guarantee that readerswill interpret your results correctly and you’ll save them time. Having the% symbol in every cell makes the meaning unambiguous.
Finally, all numbers between zero and one should have a leading zero(e.g., 0.35, NOT .35). Copies become smudged and decimal points can beobscured. With a leading zero, there will never be ambiguity about the sizeof the number in question.
• Enhance readability with font, style, and orientation choices: In her Non-Designer’s Design Book, Robin Williams demonstrates the principles ofproximity, alignment, repetition, and contrast, and applies them toeveryday design problems. Use spacing, justification (center, left, or right),grid lines, italics, and bold-facing to implement these principles withinthe table. Align decimal points within each column to add even moreinformation.
Choose a font that is easy on the eyes and doesn’t deteriorate as a doc-ument is copied. Tufte recommends using the font used in telephone books(Bell Centennial) whenever you have tables that have high informationdensity because the phone companies have researched this topic exten-sively, and there’s no point in reinventing the wheel.
• Enhance reader comprehension: The single most important tool to in-crease usefulness of tabular data is to add rows or columns containingindices relative to a total or subtotal, which will show the relative impor-tance of specific numbers relative to these totals (see the examples below).Most readers will calculate such indices themselves in their effort to under-stand the table. Do it for them, and they will thank you for it. Another
18 27
27

PART V : SHOW YOUR STUFF • 179
trick is to order table entries by size, thus allowing the reader the easilydetermine which are the most important. Another trick is to order tableentries by size, thus allowing the reader to easily determine which are themost important.
• Normalize data to facilitate comparisons: It’s often helpful to normalizeresults on a per capita or per GDP basis, so the reader can compare themto more familiar quantities.
• Create the table first; then, write your text from the tables: Creating thetables helps you think through the analysis and ensures that your logicis both correct and reproducible. Ask yourself questions about theanalysis and check your work. If you can’t explain it in writing, then youdon’t understand it. Clear tables and clear writing come from clearthinking.
• Avoid spurious precision: Only show the appropriate number of signifi-cant figures. Adding extra decimal places is distracting and pernicious. Forexample, results of calculations that use inputs reliable to one or two sig-nificant figures (e.g., 100 divided by 51) should not then be reported tofive decimal places (1.93453). The correct value to use in this case is 2. Thecalculation is only as accurate as the least accurate input parameter (formore details on treating significant figures, see <http://www.chem.sc.edu/faculty/morgan/resources/sigfigs>).
• Revise and edit: Show your tables to colleagues before publication, andyou will surely learn something. What is clear and obvious to you maynot be so obvious to them. Give yourself time to revise and improve thetables.
A few specific examples will help illustrate some of these principles (AMicrosoft Excel file [improvingtables2nded.xls] containing the original andimproved tables can be downloaded at <http://www.numbersintoknowledge.com>).
The first example, in Table 36.1, is one contributed by Stephen Few,author of Show Me the Numbers. It illustrates some typical errors. First,
34
27
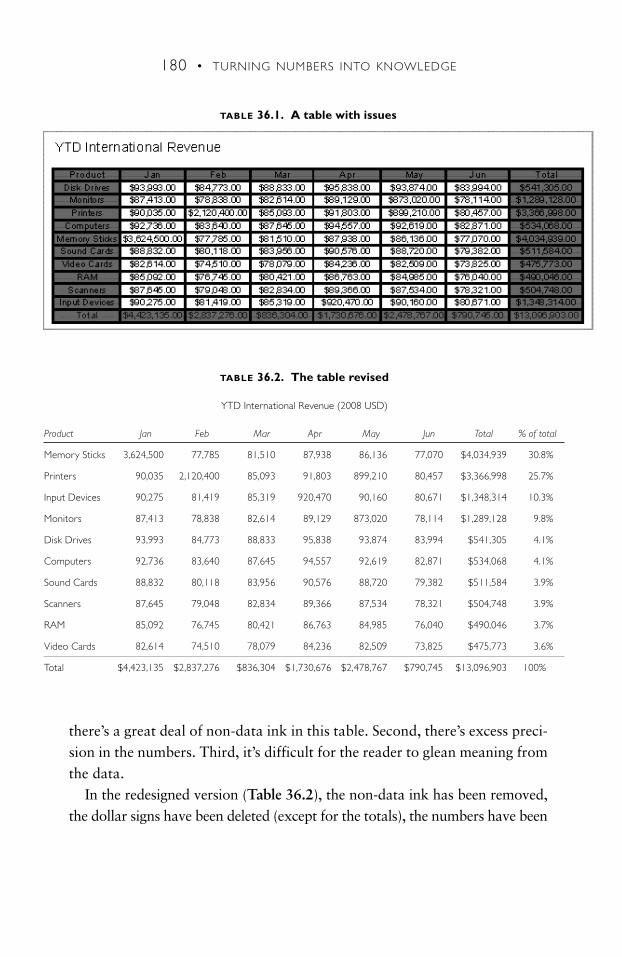
180 • TURNING NUMBERS INTO KNOWLEDGE
TABLE 36.1. A table with issues
there’s a great deal of non-data ink in this table. Second, there’s excess preci-sion in the numbers. Third, it’s difficult for the reader to glean meaning fromthe data.
In the redesigned version (Table 36.2), the non-data ink has been removed,the dollar signs have been deleted (except for the totals), the numbers have been
TABLE 36.2. The table revised
YTD International Revenue (2008 USD)
Product Jan Feb Mar Apr May Jun Total % of total
Memory Sticks 3,624,500 77,785 81,510 87,938 86,136 77,070 $4,034,939 30.8%
Printers 90,035 2,120,400 85,093 91,803 899,210 80,457 $3,366,998 25.7%
Input Devices 90,275 81,419 85,319 920,470 90,160 80,671 $1,348,314 10.3%
Monitors 87,413 78,838 82,614 89,129 873,020 78,114 $1,289,128 9.8%
Disk Drives 93,993 84,773 88,833 95,838 93,874 83,994 $541,305 4.1%
Computers 92,736 83,640 87,645 94,557 92,619 82,871 $534,068 4.1%
Sound Cards 88,832 80,118 83,956 90,576 88,720 79,382 $511,584 3.9%
Scanners 87,645 79,048 82,834 89,366 87,534 78,321 $504,748 3.9%
RAM 85,092 76,745 80,421 86,763 84,985 76,040 $490,046 3.7%
Video Cards 82,614 74,510 78,079 84,236 82,509 73,825 $475,773 3.6%
Total $4,423,135 $2,837,276 $836,304 $1,730,676 $2,478,767 $790,745 $13,096,903 100%
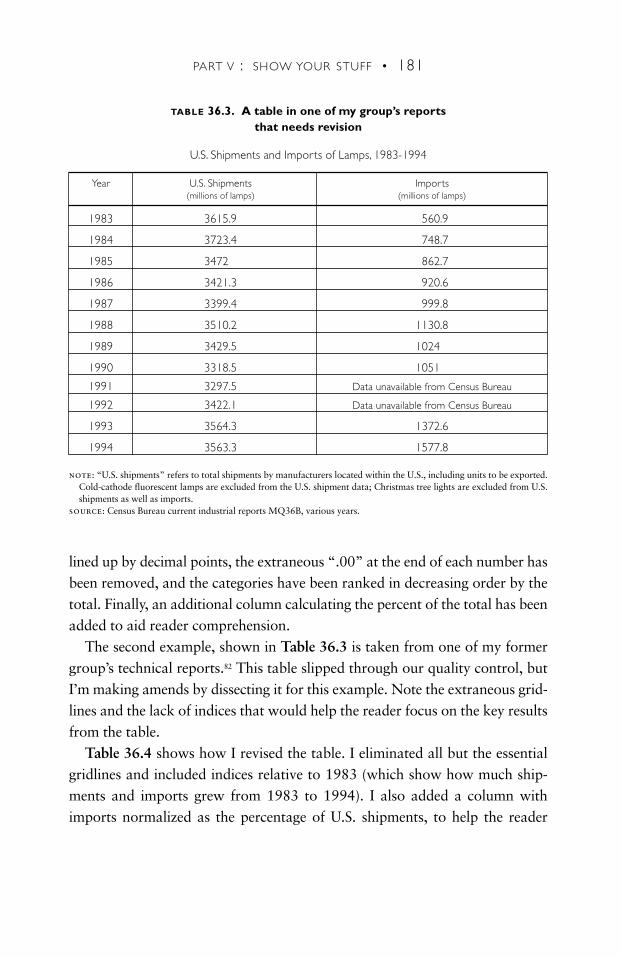
PART V : SHOW YOUR STUFF • 181
lined up by decimal points, the extraneous “.00” at the end of each number hasbeen removed, and the categories have been ranked in decreasing order by thetotal. Finally, an additional column calculating the percent of the total has beenadded to aid reader comprehension.
The second example, shown in Table 36.3 is taken from one of my formergroup’s technical reports.82 This table slipped through our quality control, butI’m making amends by dissecting it for this example. Note the extraneous grid-lines and the lack of indices that would help the reader focus on the key resultsfrom the table.
Table 36.4 shows how I revised the table. I eliminated all but the essentialgridlines and included indices relative to 1983 (which show how much ship-ments and imports grew from 1983 to 1994). I also added a column withimports normalized as the percentage of U.S. shipments, to help the reader
TABLE 36.3. A table in one of my group’s reports that needs revision
U.S. Shipments and Imports of Lamps, 1983-1994
Year U.S. Shipments Imports(millions of lamps) (millions of lamps)
1983 3615.9 560.9
1984 3723.4 748.7
1985 3472 862.7
1986 3421.3 920.6
1987 3399.4 999.8
1988 3510.2 1130.8
1989 3429.5 1024
1990 3318.5 1051
1991 3297.5 Data unavailable from Census Bureau
1992 3422.1 Data unavailable from Census Bureau
1993 3564.3 1372.6
1994 3563.3 1577.8
note: “U.S. shipments” refers to total shipments by manufacturers located within the U.S., including units to be exported.Cold-cathode fluorescent lamps are excluded from the U.S. shipment data; Christmas tree lights are excluded from U.S.shipments as well as imports.
source: Census Bureau current industrial reports MQ36B, various years.
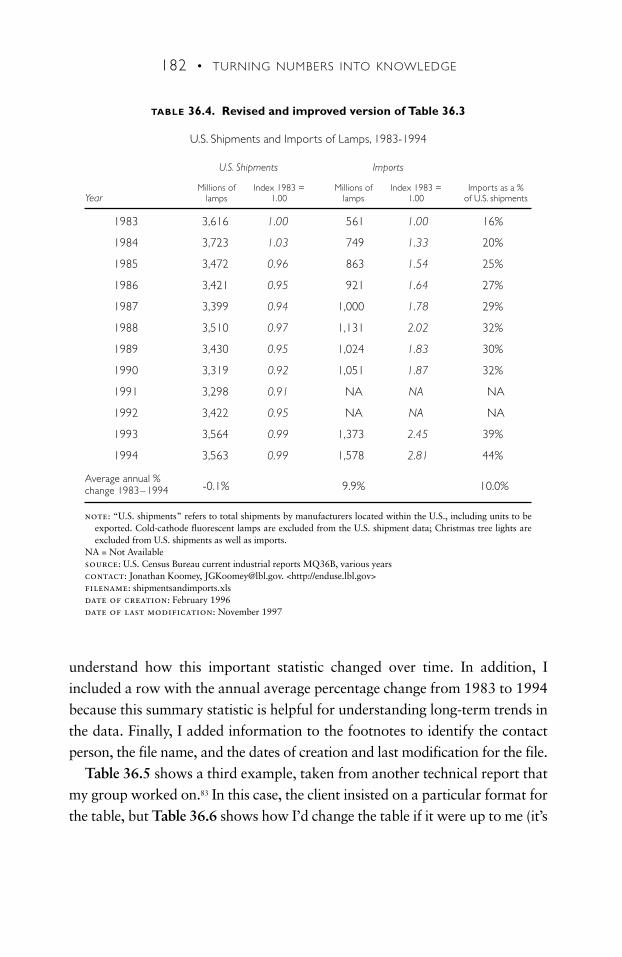
182 • TURNING NUMBERS INTO KNOWLEDGE
understand how this important statistic changed over time. In addition, Iincluded a row with the annual average percentage change from 1983 to 1994because this summary statistic is helpful for understanding long-term trends inthe data. Finally, I added information to the footnotes to identify the contactperson, the file name, and the dates of creation and last modification for the file.
Table 36.5 shows a third example, taken from another technical report thatmy group worked on.83 In this case, the client insisted on a particular format forthe table, but Table 36.6 shows how I’d change the table if it were up to me (it’s
TABLE 36.4. Revised and improved version of Table 36.3
U.S. Shipments and Imports of Lamps, 1983-1994
U.S. Shipments Imports
Millions of Index 1983 = Millions of Index 1983 = Imports as a % Year lamps 1.00 lamps 1.00 of U.S. shipments
1983 3,616 1.00 561 1.00 16%
1984 3,723 1.03 749 1.33 20%
1985 3,472 0.96 863 1.54 25%
1986 3,421 0.95 921 1.64 27%
1987 3,399 0.94 1,000 1.78 29%
1988 3,510 0.97 1,131 2.02 32%
1989 3,430 0.95 1,024 1.83 30%
1990 3,319 0.92 1,051 1.87 32%
1991 3,298 0.91 NA NA NA
1992 3,422 0.95 NA NA NA
1993 3,564 0.99 1,373 2.45 39%
1994 3,563 0.99 1,578 2.81 44%
Average annual % change 1983–1994 -0.1% 9.9% 10.0%
note: “U.S. shipments” refers to total shipments by manufacturers located within the U.S., including units to beexported. Cold-cathode fluorescent lamps are excluded from the U.S. shipment data; Christmas tree lights areexcluded from U.S. shipments as well as imports.
NA = Not Availablesource: U.S. Census Bureau current industrial reports MQ36B, various yearscontact: Jonathan Koomey, [email protected]. <http://enduse.lbl.gov>filename: shipmentsandimports.xlsdate of creation: February 1996date of last modification: November 1997
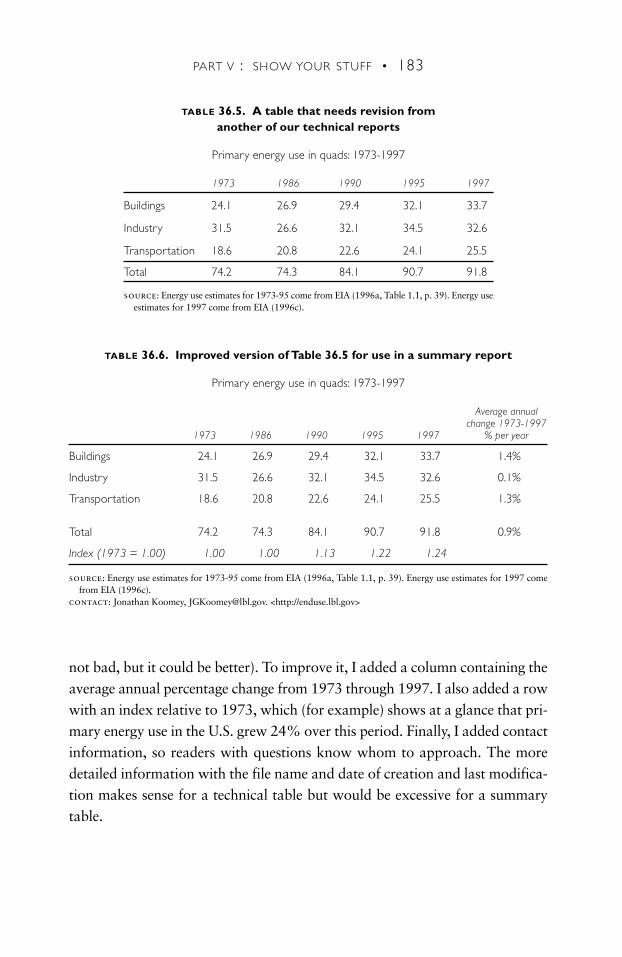
PART V : SHOW YOUR STUFF • 183
not bad, but it could be better). To improve it, I added a column containing theaverage annual percentage change from 1973 through 1997. I also added a rowwith an index relative to 1973, which (for example) shows at a glance that pri-mary energy use in the U.S. grew 24% over this period. Finally, I added contactinformation, so readers with questions know whom to approach. The moredetailed information with the file name and date of creation and last modifica-tion makes sense for a technical table but would be excessive for a summarytable.
TABLE 36.5. A table that needs revision from another of our technical reports
Primary energy use in quads: 1973-1997
1973 1986 1990 1995 1997
Buildings 24.1 26.9 29.4 32.1 33.7
Industry 31.5 26.6 32.1 34.5 32.6
Transportation 18.6 20.8 22.6 24.1 25.5
Total 74.2 74.3 84.1 90.7 91.8
source: Energy use estimates for 1973-95 come from EIA (1996a, Table 1.1, p. 39). Energy useestimates for 1997 come from EIA (1996c).
TABLE 36.6. Improved version of Table 36.5 for use in a summary report
Primary energy use in quads: 1973-1997
Average annualchange 1973-1997
1973 1986 1990 1995 1997 % per year
Buildings 24.1 26.9 29.4 32.1 33.7 1.4%
Industry 31.5 26.6 32.1 34.5 32.6 0.1%
Transportation 18.6 20.8 22.6 24.1 25.5 1.3%
Total 74.2 74.3 84.1 90.7 91.8 0.9%
Index (1973 = 1.00) 1.00 1.00 1.13 1.22 1.24
source: Energy use estimates for 1973-95 come from EIA (1996a, Table 1.1, p. 39). Energy use estimates for 1997 comefrom EIA (1996c).
contact: Jonathan Koomey, [email protected]. <http://enduse.lbl.gov>
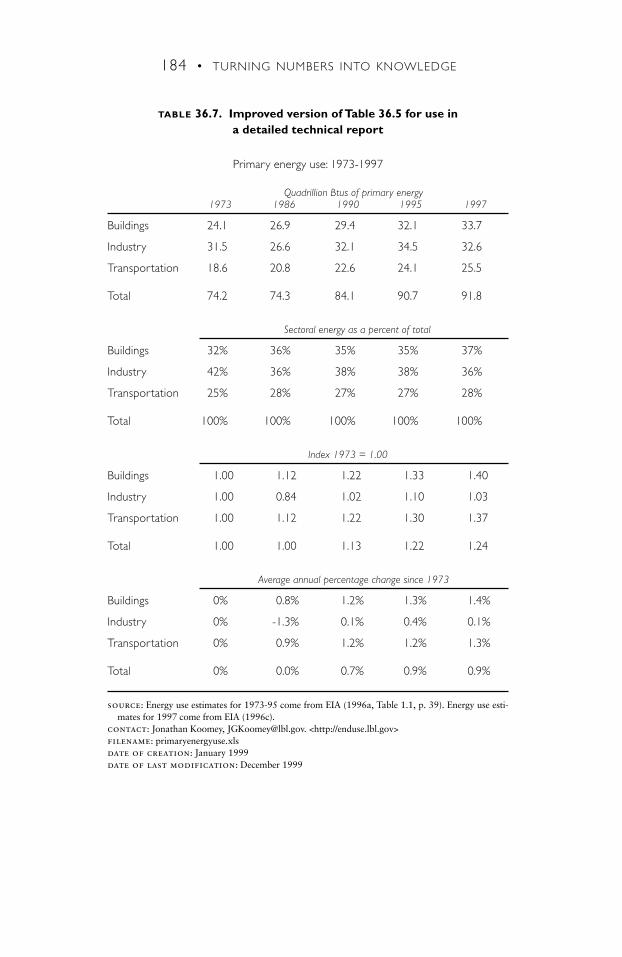
184 • TURNING NUMBERS INTO KNOWLEDGE
TABLE 36.7. Improved version of Table 36.5 for use in a detailed technical report
Primary energy use: 1973-1997
Quadrillion Btus of primary energy1973 1986 1990 1995 1997
Buildings 24.1 26.9 29.4 32.1 33.7
Industry 31.5 26.6 32.1 34.5 32.6
Transportation 18.6 20.8 22.6 24.1 25.5
Total 74.2 74.3 84.1 90.7 91.8
Sectoral energy as a percent of total
Buildings 32% 36% 35% 35% 37%
Industry 42% 36% 38% 38% 36%
Transportation 25% 28% 27% 27% 28%
Total 100% 100% 100% 100% 100%
Index 1973 = 1.00
Buildings 1.00 1.12 1.22 1.33 1.40
Industry 1.00 0.84 1.02 1.10 1.03
Transportation 1.00 1.12 1.22 1.30 1.37
Total 1.00 1.00 1.13 1.22 1.24
Average annual percentage change since 1973
Buildings 0% 0.8% 1.2% 1.3% 1.4%
Industry 0% -1.3% 0.1% 0.4% 0.1%
Transportation 0% 0.9% 1.2% 1.2% 1.3%
Total 0% 0.0% 0.7% 0.9% 0.9%
source: Energy use estimates for 1973-95 come from EIA (1996a, Table 1.1, p. 39). Energy use esti-mates for 1997 come from EIA (1996c).
contact: Jonathan Koomey, [email protected]. <http://enduse.lbl.gov>filename: primaryenergyuse.xlsdate of creation: January 1999date of last modification: December 1999
PART V : SHOW YOUR STUFF • 185
Table 36.5 appeared in a summary chapter of a larger report, so the recom-mended revisions are slightly different than if the table were to appear in a moredetailed technical chapter (Table 36.7 shows a version that would be appro-priate in that situation). The same information on primary energy use in the dif-ferent sectors is shown in that table, supplemented by several indices. First, thetable shows energy use by sector expressed as a fraction of the total. Next, itshows indices relative to 1973, making growth over the analysis period readilyapparent. The table also includes average annual percentage rates of changesince 1973 for the sectors and the total. Finally, the additional detail about thefile name and dates of creation and last modification are appropriate here.
Although some aspects of creating good tables are matters of style and pref-erence, the principles described above should remain foremost in your mind,because they are valid for almost every table. Readers should treasure yourtables for their accuracy and completeness. Sloppy tables sap your credibility—avoid them at all costs.
There are two ways of constructing a software design [or a table]: oneway is to make it so simple that there are obviously no deficiencies;the other is to make it so complicated that there are no obviousdeficiencies. — C . A . R . H OA R E
Table36.3through36.7here
186
Charles Osgood has a simple rule about using numbers in oral presenta-tions: DON’T!
I disagree. You can use them sparingly, in carefully chosen settings. It is true,however, that most people can’t absorb numbers and their implications withoutconsiderable hand-holding.
If you feel that numbers will enhance your argument, then summarize the fewkey numbers in graphic form. Only rarely use a table, and only then when it’sa small one that contains the key information in large, readable type. If youhave detailed data and calculations supporting your analysis, then give hard-copy handouts to your listeners. Summarize the conclusions from the resultsand focus on the conclusions and the story you are trying to tell, not on thenumbers themselves.
Common doctrine is that data are dull. But as Edward Tufte points out, “ifthe statistics are boring, then you’ve got the wrong numbers” (or perhaps youare conveying them in a boring way). You should use numbers to tell a story ormake an important point. If your audience is not yet convinced, then you areresponsible for presenting the relevant information in a way that is engaging tothem. Data are dull only when chosen poorly and presented badly.
Chip and Dan Heath, in their book Made to Stick, describe how some mes-sages resonate and others fall flat. The ones that people remember are simple,unexpected, concrete, credible, emotional stories. They cite President Kennedy’sgoal of having a man walk on the moon within a decade and returning himsafely to earth as the archetypal sticky idea. It was simple for people to under-stand, unexpected in its audacity, concrete and specific, credible because of thePresident’s commitment of resources, and emotionally resonant with Ameri-cans’ vision of themselves as intrepid explorers. Focus on using numbers to con-vey a few truly sticky ideas and your audience will thank you for it.
CHAPTER
37USE NUMBERS EFFECTIVELY IN
ORAL PRESENTATIONS
32
PART V : SHOW YOUR STUFF • 187
Make sure your numbers are correct! Nothing destroys your credibility fasterthan presenting numbers that are internally contradictory or obviously wrong.Once you lose credibility, it’s nearly impossible to regain it during the course ofa presentation. It won’t matter how good the rest of your work is if you’ve pre-sented bad data during the talk. So before you finalize your presentation, dig
into the numbers and make sure they are both relevant and correct. Practice thetalk before a friendly audience of colleagues, so they can catch any errors inadvance.
Never display unreadable, densely packed tables or charts in presentations.I’ve seen numerous veteran professors do it, but it’s insulting to the audience,and it’s guaranteed to make your listeners tune out. These speakers are not try-ing to be disrespectful, they just assume that others find raw numbers as com-pelling as they do. Don’t fall into this trap. You’re the expert, and you shouldpre-digest the information and put it in an understandable form. It’s not justcommon courtesy, it’s also the best way to ensure that your main points aremost effectively conveyed. If you want the audience to have the detailed num-bers for reference, print and distribute well-documented handouts for your lis-teners so they can follow up at their leisure.
Gerald Jones, in his book How to Lie with Charts, gives guidelines on thesize and kind of text to use in presentations and describes the conventions formeasuring font size and spacing. He quotes the Society of Motion Picture andTelevision Engineers, who recommend that the minimum height of small lettersused in on-screen text should be 2.5 percent of the height of the screen. Typicalpresentation screens are 1.5 meters (5 feet) in height, so the minimum font sizein such a screen should be about 4 centimeters (1.5 inches). These guidelinesdon’t just apply to text presentations. Make sure the labels on your tables andgraphs are just as readable as your bullet points.
Another way to judge type size of an overhead projector slide is to place it atyour feet. If you have good eyesight and can’t read it while standing, the type istoo small.
A successful speaker always thinks carefully about the following questions:
• Who will be in the audience?
• What is important to them?
• What are the three key messages you want people to learn from your talk?(With rare exceptions, that’s all they will ever take away.)
32
27
188 • TURNING NUMBERS INTO KNOWLEDGE
Although Ross Perot’s use of charts and tables did not earn him electoral victoryin 1992, he demonstrated that a speaker who addresses issues the audiencecares about can be effective and entertaining even if he uses more graphs perminute than in any television show in history.
C O M M E N T I N G O N T H E P R E S E N TAT I O N S O F OT H E R S
If you participate in conferences, you will occasionally be called upon (or mayfeel obliged) to comment on results presented in the oral presentation ofanother analyst. The same rules apply, but there are some subtleties.
Use back-of-the-envelope calculations to assess their analysis during the talk,but take extra care that your calculations are correct before speaking becauseyou will likely be doing these calculations under time pressure.
Be polite! Not everyone accepts public criticism gracefully, even when it’s gen-tle criticism. It’s often difficult to engage in reasoned debate in a public forum,so in some cases it will be more fruitful to talk in private with the speaker afterthe presentation.
C O N C L U S I O N S
Effective presentations tell a story. Use carefully chosen numbers to tell thatstory in a compelling and succinct way. Consider what the audience cares aboutas you prepare your remarks, and make sure your talk gives your listeners theinformation they need and the means to find out more.
29
When speakers use a lot of numbers, the audience most always slumbers. — C H A R L E S O S G O O D
189
USE THE INTERNET 84
Anyone publishing analysis results in the 21st century had better take heedof the Internet. It is fast changing the way information is collected, processed,distributed, and used. Those who put the new medium to use will reap tremen-dous benefits; others ignore it at their peril.
F E AT U R E S O F T H E N E T
In some ways, recent developments in electronic information distribution are alogical outgrowth and extension of the advent of mechanical type and printingpresses five centuries ago. As James Burke points out in his book Connections, thetrends reinforced by mechanical printing included rapid and accurate reproduc-tion of texts, the specialization of knowledge and the responsibility of scholars forits accuracy, the first steps towards our current conception of intellectual property,and a sharp decline in the cost of reproducing and distributing information. TheInternet accentuates each of these trends, but it also has its revolutionary aspects:
• Near-zero marginal cost of reproduction and distribution: Conventionalprinting vastly reduced the incremental costs of reproducing and distrib-uting books, but the Internet reduces this cost to nearly zero. This shiftfrom low marginal cost of reproduction to nearly zero cost is forcinganother redefinition of our concept of intellectual property.
Many companies are using the near-zero marginal cost of the Internetto reduce the cost of delivering customer support for their products.Frequently asked questions and product literature are now commonlymade available electronically, which reduces the number of phone calls tocustomer support and therefore minimizes costs of fielding these inquiries.It also allows the technical support staff to focus on difficult problems with
CHAPTER
38
190 • TURNING NUMBERS INTO KNOWLEDGE
fewer distractions. Shipping companies like Federal Express and UPS usethe Internet for on-line package tracking, which vastly reduces their needfor phone support.
• Quicker publishing: The barriers to publishing are now much lowerbecause publishing materials on the net (and changing them) is relativelycheap, easy, and quick. The author Robin Williams summarizes Internetpublishing as being “like a commercial print shop saying ‘We’ll print yourrecipe book this month for $30. Use as many colors and pages as you like.Change the recipes every day if you want, and we’ll reprint it for youeveryday, for free.’” This kind of flexibility does not exist in the world ofconventional printing.
On the other hand, lower barriers to entry in Internet publishing place ahigher responsibility on each publisher. The Internet is a more freewheelingplace than conventional media sources, and it lacks the institutional credi-bility checks that are prevalent in newspapers, radio, television, and con-ventional publishing. It is therefore incumbent on each web publisher toestablish and maintain its credibility in any way it can. Testimonials fromestablished organizations with credibility can help with this effort, as canclear and exhaustive documentation of sources and methodology.
• Easier sharing of data: One of the most interesting recent developments isthe advent of web sites that make it easier to share data, including (by theend of 2007) Swivel, Freebase, Numberpedia.org, Data360, Graphwise,and Many Eyes. Each takes a slightly different approach to the problem,but they all share a common theme: giving users the tools to post, down-load, search, and (often) graph data. These sites haven’t really solved theproblem of assigning accurate credibility rankings to the data and theircreators (it isn’t sufficient to be ‘the Youtube of data’, for example—eval-uating credibility is a lot more complicated than a five star ranking). Theyalso have shown mixed success at promoting standardized data formatsand complete documentation for data. But it’s early days yet, and thesesites are clearly the wave of the future in the data world.
• Quicker review of technical material: For analysis projects, makingspreadsheets and draft reports available to readers on the Internet is a realboon. If readers have the spreadsheets containing the complete calcula-tions, they can delve into the analysis much more easily and quickly thanif they merely received a copy of the report. Full electronic access by endusers speeds up the rate at which analysis can be reviewed, which reducesthe time needed to create a final analysis.
16
33
39
PART V : SHOW YOUR STUFF • 191
• Easier ordering and distribution: Selling hard copy books and reports iseasier and cheaper than in the days before the Internet. For certain kindsof books, at least, it is no longer necessary to have them stocked in localbookstores: people can find and order them on line, and receive them in afew days. This feature of the Internet eliminates a major hurdle forauthors and small publishers.
• Direct feedback from suppliers to consumers: For manufactured products,many companies give an estimate of shipping time for a particular prod-uct on their web sites. The most sophisticated companies have a direct linkbetween their computerized inventory management system and the webstore that contains the product, which always reflects the current productsupply. Never before have consumers known details about product supplyand timing, and this capability gives them more flexibility in their pur-chasing decisions.
• Direct feedback from consumers to suppliers: Some companies are exper-imenting with using the Internet to allow their customers to supply specificinformation about company performance. The on-line auctioneer Ebay<http://www.ebay.com>, for example, has what it calls a “FeedbackForum,” where buyers and sellers can comment on each other and onEbay itself.
• Indirect feedback from consumers to suppliers: The Internet offers moreand cheaper information about customers than ever before. Customers canspecify the exact products they want, and this information is automaticallycollected in a database that can be “mined” by the company to learn aboutits customers. The company can also use information about who accessesits web site to create more targeted marketing campaigns. In addition, thecompany can track how people are using the search engine on the site tofind out what kinds of questions people are trying to answer when theyvisit the site. This information can help the site developer improve the sitebut may also lead to ideas for new products to meet user needs.
• Collaboration among users: Well-designed collaborative web sites canallow customers and users to comment on the information distributed bythe web publisher and to have those comments visible to others who visitthe site. Such sites can also help users help each other by setting up dis-cussion forums on topics related to the company’s products. Interestedusers who have a specific question can visit such forums and have theirquestions answered by other interested customers, at little cost to the com-pany itself beyond initially setting up the site. These user forums can also
3
192 • TURNING NUMBERS INTO KNOWLEDGE
be a fertile source of ideas for the company’s product designers onimproving existing products and creating new ones.
• Access to information 24 hours per day: Many information requests nolonger need be made during business hours. Searching on the net cananswer many questions at any time of the day or night. This flexibilityreduces costs for all companies and saves users time, which benefits every-one. It is particularly beneficial when the company and the customer areseparated by many time zones.
• Universal searching: The Internet allows access to vast storehouses ofknowledge from all over the world and gives automated ways (searchengines) to explore it. Never before has it been feasible to search such a vastnetwork containing so much information. Finding essential data is often asmuch art as science, but experience with and study of search engine algo-rithms can help users find information quickly.
• Easier and more widespread public access to technical information:Technical information is often buried in impenetrable and obscure reports.Interactive links between the Internet and relational database managementsystems help those who possess detailed technical knowledge to make ituseful to a wider audience.
Lawrence Berkeley National Laboratory (LBNL), for example, has fordecades been the preeminent center on energy use in homes, but much ofthe information LBNL generated never reached the general public until theadvent of the World Wide Web. LBNL’s Home Energy Saver web site<http://HomeEnergySaver.lbl.gov> was the first Internet-based homeenergy analysis tool; it embodies the technical expertise of dozens of peo-ple throughout LBNL. A user of this site has confidence that the tool accu-rately characterizes energy use in her home because of the expertise andcredibility of those who created it.
The Scorecard web site <http://www.scorecard.org> allows anyone tolocate the sources of pollution in his own community merely by enteringa zip code. It identifies the companies that produce the pollution and evenlets users send a fax to the polluters complaining about it. The technicalcontent of the site was created by people whose expertise in environmen-tal issues is well known. They relied on publicly available data and com-piled it in a form that any non-technical person could use to get immedi-ate and understandable results. The information was available before theScorecard team pulled it together, but no one had ever made it accessiblein such an easy-to-use form.
9
PART V : SHOW YOUR STUFF • 193
The increasing availability of information about pollution, energy costs,political decisions, campaign contributions, and the spending habits of all typesof institutions will have a larger and larger influence on our society during thenext few decades. Once the data are compiled, they can be widely distributedat near-zero marginal cost. People need no longer take at face value the assur-ances of community leaders about topics of current interest. They can see anddecide for themselves how to respond.
These features of the Internet present opportunities for analysts who are will-ing to seize them. The next section presents some specific advice for those whowant to use the Internet to distribute data and analysis results with greatesteffectiveness.
P U B L I S H I N G A N A LYS I S I N T H E I N T E R N E T AG E
There are three essential books on web publishing for analysts to read. The firstis The Non-Designer’s Web Book, by Robin Williams and John Tollett <http://www.peachpit.com/>, which contains reams of practical advice about makingthe Internet work for you. It gives information about color, file formats, type-faces, searching strategies, and graphics, and describes how Williams’ designprinciples (from The Non-Designer’s Design Book) should be applied to websites. The second is Philip and Alex’s Guide to Web Publishing, by PhilipGreenspun <http://philip.greenspun.com/panda/>, which is a relativelyadvanced guide to the mechanics of web publishing, focusing heavily on tech-niques to enable collaboration between people and institutions. It is a bit datednow, but it is exemplary for its no-nonsense, sensible approach to dealing withcomplex issues, and it is also amusing. The third book is a more technical, text-book-style, and up-to-date follow-on to Greenspun’s book, titled Software
Engineering for Internet Applications by Anderson, Greenspun, and Grumet. Istrongly recommend you read the first book cover to cover and browse theother two for relevant material.
In the section that follows, I assume familiarity with the basics of web pub-lishing, so I can focus on key lessons of most relevance to analysts. For an intro-duction to the basics of the Internet, refer to Parts 1 and 2 in the Williams andTollett book as well as the following page on Yahoo.com, which presents
194 • TURNING NUMBERS INTO KNOWLEDGE
resources for beginning web designers: <http://dir.yahoo.com/computers_and_internet/internet/beginner_s_guides/>. Here’s my specific advice:
Know your audience: This is the first rule of all presentations, whether writtenor oral, and it applies just as well to web sites. Decide who will use your site,and make sure they can find what they want easily and quickly.
Focus on content, not graphics and fancy gimmicks: Many web designers areobsessed with graphics and the latest programming tricks. Including lots ofgraphics ensures that people using slower connections will spend a lot of timewaiting. Relying on the latest web programming tricks ensures that people witholder browsers won’t be able to use your site (it also ensures that you will haveto field technical support questions from users who can’t get your web page towork on their computers).
Web sites should convey information, not display technical virtuosity.Determine the simplest approach to get your message out, and stick to it. Valueyour user’s time and design your site so that anyone can quickly and efficientlylearn what you have to teach. One way to maintain this focus on the user’sneeds is to assign responsibility for content and usability to someone differentfrom the web designer.
Do usability testing: Web sites are more like software than printed material.Even if you think you know your audience, you need to test the site in action.Greenspun recommends that you observe a few selected people using your siteto accomplish specific tasks, which can help you “anticipate user questions andmake sure your site answers them.” Follow the guidance on “Involving users inthe design process” found in the Macintosh Human Interface Guidelines
(which is a time-tested source on how to make computers work well forhumans). User testing is the best way to ensure that documentation is sufficientand that your user interface design is smooth as silk.
Document like crazy: Documentation is just as important for web pages as forbooks and hard-copy reports. Each page should have a “Date last modified” atthe bottom as well as links that send email to the person who made it and toothers responsible for the technical material described on the site. Don’t forget
10
33
32
PART V : SHOW YOUR STUFF • 195
that web sites need to be backed up just like all other electronic information,both to safeguard the current version and to document past versions.
Use PDF: Portable Document Format (PDF) is a universally available andwidely used format for distributing documents electronically. Readers canprint PDF files that are exactly the same as the original report, which makes dis-tributing reports electronically practically the same as mailing the reports (par-ticularly as high-speed duplexing laser printers become more common). Moresophisticated PDF files contain internal hypertext links, so you could jump froma listing in a table of contents directly to the relevant place in the document.PDF files can and should be made available for download from your web site.
Adobe Acrobat, one program used to create such files, is available for Windowsand Macintosh computer platforms <http://www.adobe.com/products/acrobat/>.The Acrobat reader is free and it allows users of almost every type of computer,including Windows, Macintosh, Linux, and most forms of UNIX, to read andprint PDF files <http://www.adobe.com/products/acrobat/readstep.html>.
Schemes for selling electronic content are still in nascent form, so there is a ten-sion in the Internet world between free distribution (wide availability) and beingrewarded for your efforts. To date, no proposed methods for addressing theseissues have caught on. One clever approach was championed by the now defunctcompany called Softlock.com. Its system allowed anyone to view and email a sam-ple of a given PDF document. To see the full document, the reader had to go to theSoftlock.com web site and pay for access. Once the fee was paid, the full versionof the PDF file was unlocked for use on the user’s computer. If the file was emailedor copied to another computer, it reverted back to the sample so that the recipientof the file could evaluate it and decide whether it was worth buying. The creatorof the file could specify the level of access that purchase of the file grants (read only,read and print only, read/print/copy text, etc.). Unfortunately, the technology didnot achieve market success (which is an oft-repeated story for such schemes).
Assign one web page per publication: Assign every new publication a uniqueweb page, and write the URL on the title page of the document. This web pageshould include related data, analysis spreadsheets, related links to other people’ssites, errata discovered after publication, and (in many cases) downloadablePDF files of the report itself. Owners of the hard-copy report know that they
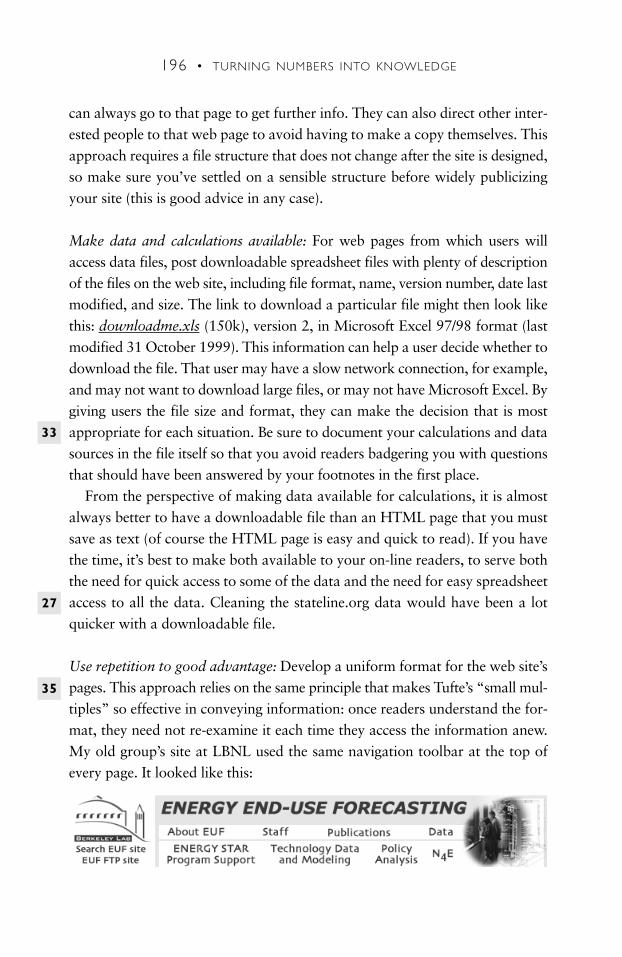
196 • TURNING NUMBERS INTO KNOWLEDGE
can always go to that page to get further info. They can also direct other inter-ested people to that web page to avoid having to make a copy themselves. Thisapproach requires a file structure that does not change after the site is designed,so make sure you’ve settled on a sensible structure before widely publicizingyour site (this is good advice in any case).
Make data and calculations available: For web pages from which users willaccess data files, post downloadable spreadsheet files with plenty of descriptionof the files on the web site, including file format, name, version number, date lastmodified, and size. The link to download a particular file might then look likethis: downloadme.xls (150k), version 2, in Microsoft Excel 97/98 format (lastmodified 31 October 1999). This information can help a user decide whether todownload the file. That user may have a slow network connection, for example,and may not want to download large files, or may not have Microsoft Excel. Bygiving users the file size and format, they can make the decision that is mostappropriate for each situation. Be sure to document your calculations and datasources in the file itself so that you avoid readers badgering you with questionsthat should have been answered by your footnotes in the first place.
From the perspective of making data available for calculations, it is almostalways better to have a downloadable file than an HTML page that you mustsave as text (of course the HTML page is easy and quick to read). If you havethe time, it’s best to make both available to your on-line readers, to serve boththe need for quick access to some of the data and the need for easy spreadsheetaccess to all the data. Cleaning the stateline.org data would have been a lotquicker with a downloadable file.
Use repetition to good advantage: Develop a uniform format for the web site’spages. This approach relies on the same principle that makes Tufte’s “small mul-tiples” so effective in conveying information: once readers understand the for-mat, they need not re-examine it each time they access the information anew.My old group’s site at LBNL used the same navigation toolbar at the top ofevery page. It looked like this:Cart12bhere(jpeg)
33
27
35
PART V : SHOW YOUR STUFF • 197
The site also had a text toolbar at the bottom of every page that replicatedmany of the functions of the graphical toolbar, for people with slow connectionswho browse the web with graphics turned off.
The text toolbar looked like this:
About EUF | Staff | Publications | Project Areas | Data | End-Use FTP Site | Search
Wherever readers found themselves on the site they always had these toolbarsavailable and could access the information they needed quickly and effectively.
The same principle applies to the content of the pages themselves. That sitealso had unique pages for each distinct project and each project page had con-sistent headings:
Project Description, which gave a few paragraphs describing the work andan occasional figure to illustrate important results;
Project Staff, which was a list of those who worked on the project with adirect link to each person’s biography page and contact info;
Key Data, which included downloadable files that contain inputs andresults for the analysis;
Publications, with full references to the reports as well as links so that thecomplete PDF files could be downloaded by the reader;
Other Resources, which included links to external sites related to the project;
Sponsors, which listed the people and institutions responsible for fundingthe project.
Readers knew that the project pages all had these headings; this familiaritymade it easier to find relevant information quickly.
Pack your site with carefully chosen text: Search engines look for text, so themore text on your site, the better (this is another reason to focus on textual con-tent and not on graphics). Of course, your pages should attract readers and helpthem find the information they need, so follow Williams’ advice about prox-imity, alignment, and contrast in this effort. Don’t overwhelm readers, but doput as much content on your site as makes sense. Greenspun suggests that youconsider purchasing the rights to text that is related to the purpose of your siteand posting it. This approach is cheaper and more likely to attract visitors thanpurchasing on-line advertisements on other sites (anyone using a search engine
198 • TURNING NUMBERS INTO KNOWLEDGE
to find information on a topic related to that of your site will have many linksto your site pop up from their search query).
If you want to attract search engines to a page that is predominantly graph-ical, HTML allows programmers to include “meta-tags” that contain keywords summarizing the purpose of the page and site. Another trick is to put texton the bottom of that page that is white on white background. It won’t appearto those viewing the page with a browser, but the search engine will use that textto index the page.
Enable collaboration: One of the most intriguing and powerful aspects of Inter-net publishing is the potential for on-line collaboration. Web sites that encour-age readers to add comments, ask questions, and answer queries become atreasure trove of information, not just for the users of the site, but for the pub-lisher as well.
Another kind of collaboration is enabled by the use of “Project sites”<http://www.secretsites.com/>, which contain the project’s prospective schedule,an email trail, the historical chronology of project developments, and the rele-vant electronic documents. Creating such a password-protected site makes thekey information available to all participants in the project and allows them towork together more effectively. For one quick and easy way to set up such a site,go to <http://www.basecamphq.com>.
Still another form of web-enabled collaboration taps the innovative spirit andsubject knowledge of a company’s employees. As documented in a HarvardBusiness School Case, a Rhode Island–based firm called Rite-Solutions <http://www.ritesolutions.com> pioneered this idea in January 2005 by creating itsown internal marketplace for ideas, called “Mutual Fun”. Ideas listed asstocks on the exchange could involve saving money for the company, usingexisting technologies to create new products, or striking out in entirely newdirections. To get a stock listed, an employee with an idea would need to enlista sponsor (one of 40 high level managers approved by the company’s leaders)who would help foster the idea. Each employee was allocated $10,000 in vir-tual “money” that could be allocated to any stocks on the Mutual Funexchange. Then the fun began. The best ideas quickly rose to the top as theirstock prices increased. People who wanted to help improve an idea had a for-mal online process for submitting their thoughts, which helped make their inter-actions with the creators of the stock as productive way as they could be.
PART V : SHOW YOUR STUFF • 199
Mutual Fun worked so well that Rite Solutions now licenses the technology toother companies for their own internal use.
Interact with users: Greenspun says “User feedback might be annoying at times,but if you want to be insulated from your readers, why publish on the Web atall?” The Internet allows closer connection between customers and businessesthan previously possible. Use those connections to your advantage, and learnabout your customers to serve them better. Collaborative services can help inthis learning process, as can analysis of server logs and direct email interaction.Give users the ability to comment on your site and your products, and you arecertain to learn things you could not have learned on your own.
Set up an internal search engine and site index: A search engine devoted to yoursite will save your readers time and frustration. Greenspun suggests that youprogram it to send you email if a search returns no items or is repeated severaltimes: “As soon as two users ask the same question, you should beef up yoursite to answer it unattended.” Thus, the search engine can help you improveyour site, assist your users, and teach you about their needs all at the same time.A site index, which lists keywords with links to the related part of the site, willalso help readers find the information they need.
Get listed in external search engines: Make sure you’re registered with the majorsearch engines and directories because these services are likely to be your mostimportant source of web traffic (there are companies that do this registration foryou, for free or for a nominal fee). Such registration insures that people search-ing for the information you have will be able to find you quickly. Some of themost important search engines (in alphabetical order) are Altavista, Excite,Google, HotBot, Infoseek, Lycos, Webcrawler, and Yahoo. For the latest infor-mation on this process, check out the advice available at <http://www.searchenginewatch.com>. Williams and Tollett point out that some search enginesspecialize in certain types of technical information. If there’s one for your spe-cialty, then make sure you register with that one as well.
Use printed material when appropriate: One downside to the Internet is thatreading text on a computer screen is still not as convenient or as pleasant asreading a book. Printed documents can be read anywhere and have a clarity and
permanence that electronic media cannot yet match. Until the technology forelectronic books becomes better developed, paper books and reports willremain important (though distribution of some of these documents will surely bereplaced by PDF files that can be electronically distributed).
Link to other sites: Reports that only reference the author’s own work rightfullyencourage skepticism, and web sites that don’t refer to other kindred sites deservesimilar treatment. Add value to your site by helping readers find other sites thatprovide complementary information and data. Access to comprehensive lists ofrelated links is one of the reasons web surfers return to a site again and again.
Bring in the big guns: When you have a lot of data that you want to make avail-able, call in the experts on database-backed web sites. Greenspun describes thetrials, tribulations, and triumphs of the people who make these complex siteshappen. The Home Energy Saver and Scorecard web sites are two good exam-ples of how this kind of programming can make complex data and analysisresults accessible to a wide audience. These sites can be quite expensive todevelop and maintain but can be indispensable for certain applications.
C O N C L U S I O N S
Seize the opportunities the Internet presents. After defining your audience, cre-ate content that matters to them and make it available on a well-designed andwell-tested site. Avoid fancy graphics because they consume bandwidth and con-tribute little to getting your message across. Make sure your site is accessible topeople using modems, older browsers, and all major operating systems. Set upcomment pages and discussion forums to help your readers teach you and eachother. Finally, remember that the Internet is just another tool and that it’s notalways the right tool for the job. Non-electronic publishing still has its place.
When I am working on a problem I never think about beauty. I onlythink about how to solve the problem. But when I have finished, if thesolution is not beautiful, I know it is wrong.
— BU C K M I N S T E R F U L L E R
200 • TURNING NUMBERS INTO KNOWLEDGE
201
One of the biggest problems with data is that they often aren’t linked to thecritical information needed to make the data useful, and thus are “disembod-ied”. For example, a downloaded spreadsheet will usually not contain a com-plete citation for the data itself or a description of the methods and sources usedto compile it.
Disembodied data are also commonplace on the World Wide Web. Considera fictional address: 54321 Broadway Avenue, Sometown, NY 12345. If itappeared on a normal web page, search engines or software agents could onlyrely on the pattern of characters to match against a search query, using “natu-ral language processing”. They could not know for sure that 12345 is a zipcode, or that 54321 Broadway Avenue is a street address.
In both cases, the data lack metadata, described by Wikipedia as “data aboutdata” <http://en.wikipedia.org/wiki/Metadata>. The American Library Associ-ation more precisely defines it as “structured, encoded data that describe char-acteristics of information-bearing entities to aid in the identification, discovery,assessment, and management of the described entities.” Most computer usersare familiar with the vCard format for address book data, which allows soft-ware to import and export contact information. vCards associate all parts ofaddresses with correct metadata (for example, all zip codes are correctlylabeled as such).
Lack of metadata prevents software from making more intelligent use of dataon the web. To solve this problem, Tim Berners-Lee and other web pioneershave developed the “Semantic Web”. This innovation would allow web pagecreators to associate metadata with important data types, and to make the char-acteristics of and the relationships between such metadata universally accessi-ble to users of the web. In practice this would allow the web to continue to
SHARE AND SHARE ALIKE
CHAPTER
39
grow rapidly at the same time enhancing the abilities of software tools to accessand use relevant data. Berners-Lee summarizes his big-picture view of the poten-tial as follows:
Human endeavor is caught in an eternal tension between the effectiveness ofsmall groups acting independently and the need to mesh with the widercommunity. A small group can innovate rapidly and efficiently, but this pro-duces a subculture whose concepts are not understood by others.Coordinating actions across a large group, however, is painfully slow andtakes an enormous amount of communication. The world works across thespectrum between these extremes, with a tendency to start small—from thepersonal idea—and move toward a wider understanding over time.
An essential process is the joining together of subcultures when a widercommon language is needed. Often two groups independently develop verysimilar concepts, and describing the relation between them brings great ben-efits. Like a Finnish-English dictionary, or a weights-and-measures conver-sion table, the relations allow communication and collaboration even whenthe commonality of concept has not (yet) led to a commonality of terms.
The Semantic Web, in naming every concept simply by a UniformResource Identifier (URI), lets anyone express new concepts that theyinvent with minimal effort. Its unifying logical language will enable theseconcepts to be progressively linked into a universal Web. This structure willopen up the knowledge and workings of humankind to meaningful analy-sis by software agents, providing a new class of tools by which we can live,work and learn together.
Inadequate metadata also presents a challenge to good analytical practicethat is in some ways more complicated than that for the web itself. Data sharedamong analysts is even more diverse in its structure and format than the bulkof those posted on the web. Full documentation requires deep conceptualunderstanding and a level of attention to detail that is rare. And gleaning mean-ing from data often requires expert contextual knowledge that is time consum-ing and difficult to summarize for those who are not familiar with the practicesand terminology of the relevant expert community.
In spite of those challenges, the potential benefits of more efficient, effective,and accurate data sharing could be substantial, and that has led to a profusionof new web sites devoted to sharing data and helping users graph it.Unfortunately, the current sites have at best a mixed record of capturing these
202 • TURNING NUMBERS INTO KNOWLEDGE
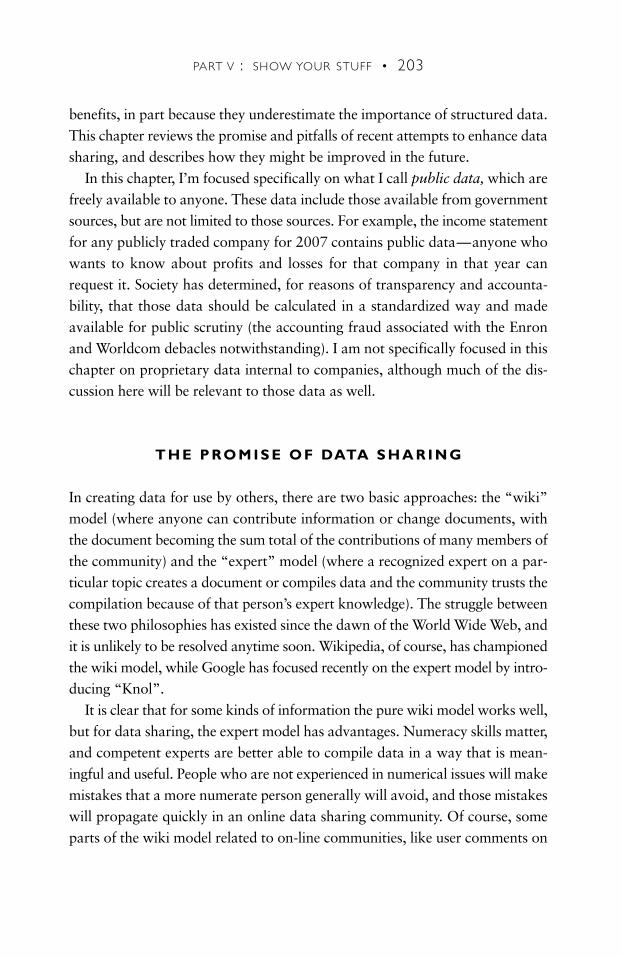
benefits, in part because they underestimate the importance of structured data.This chapter reviews the promise and pitfalls of recent attempts to enhance datasharing, and describes how they might be improved in the future.
In this chapter, I’m focused specifically on what I call public data, which arefreely available to anyone. These data include those available from governmentsources, but are not limited to those sources. For example, the income statementfor any publicly traded company for 2007 contains public data—anyone whowants to know about profits and losses for that company in that year canrequest it. Society has determined, for reasons of transparency and accounta-bility, that those data should be calculated in a standardized way and madeavailable for public scrutiny (the accounting fraud associated with the Enronand Worldcom debacles notwithstanding). I am not specifically focused in thischapter on proprietary data internal to companies, although much of the dis-cussion here will be relevant to those data as well.
T H E P RO M I S E O F DATA S H A R I N G
In creating data for use by others, there are two basic approaches: the “wiki”model (where anyone can contribute information or change documents, withthe document becoming the sum total of the contributions of many members ofthe community) and the “expert” model (where a recognized expert on a par-ticular topic creates a document or compiles data and the community trusts thecompilation because of that person’s expert knowledge). The struggle betweenthese two philosophies has existed since the dawn of the World Wide Web, andit is unlikely to be resolved anytime soon. Wikipedia, of course, has championedthe wiki model, while Google has focused recently on the expert model by intro-ducing “Knol”.
It is clear that for some kinds of information the pure wiki model works well,but for data sharing, the expert model has advantages. Numeracy skills matter,and competent experts are better able to compile data in a way that is mean-ingful and useful. People who are not experienced in numerical issues will makemistakes that a more numerate person generally will avoid, and those mistakeswill propagate quickly in an online data sharing community. Of course, someparts of the wiki model related to on-line communities, like user comments on
PART V : SHOW YOUR STUFF • 203
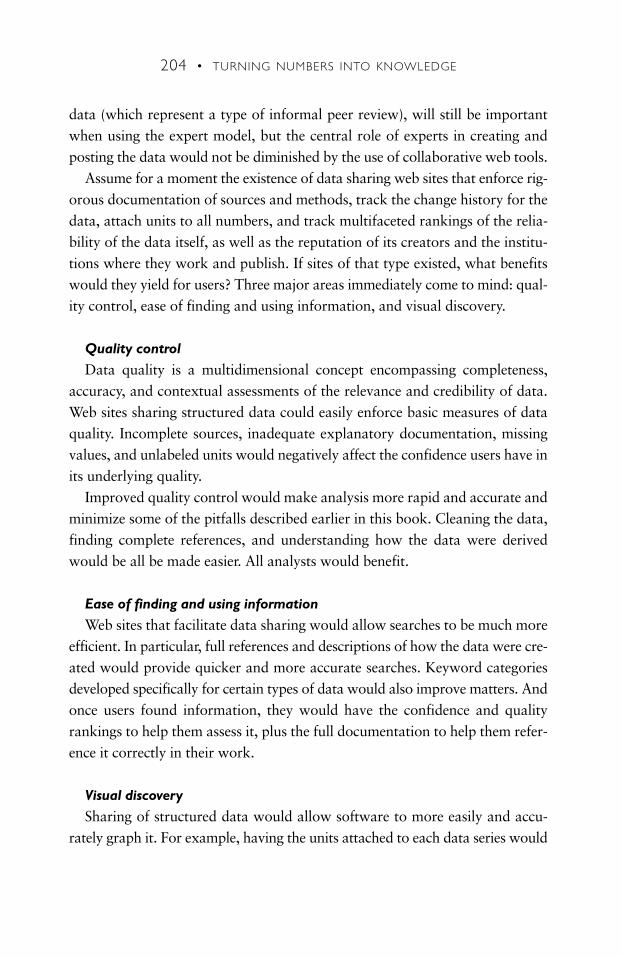
data (which represent a type of informal peer review), will still be importantwhen using the expert model, but the central role of experts in creating andposting the data would not be diminished by the use of collaborative web tools.
Assume for a moment the existence of data sharing web sites that enforce rig-orous documentation of sources and methods, track the change history for thedata, attach units to all numbers, and track multifaceted rankings of the relia-bility of the data itself, as well as the reputation of its creators and the institu-tions where they work and publish. If sites of that type existed, what benefitswould they yield for users? Three major areas immediately come to mind: qual-ity control, ease of finding and using information, and visual discovery.
Quality controlData quality is a multidimensional concept encompassing completeness,
accuracy, and contextual assessments of the relevance and credibility of data.Web sites sharing structured data could easily enforce basic measures of dataquality. Incomplete sources, inadequate explanatory documentation, missingvalues, and unlabeled units would negatively affect the confidence users have inits underlying quality.
Improved quality control would make analysis more rapid and accurate andminimize some of the pitfalls described earlier in this book. Cleaning the data,finding complete references, and understanding how the data were derivedwould be all be made easier. All analysts would benefit.
Ease of finding and using informationWeb sites that facilitate data sharing would allow searches to be much more
efficient. In particular, full references and descriptions of how the data were cre-ated would provide quicker and more accurate searches. Keyword categoriesdeveloped specifically for certain types of data would also improve matters. Andonce users found information, they would have the confidence and qualityrankings to help them assess it, plus the full documentation to help them refer-ence it correctly in their work.
Visual discoverySharing of structured data would allow software to more easily and accu-
rately graph it. For example, having the units attached to each data series would
204 • TURNING NUMBERS INTO KNOWLEDGE
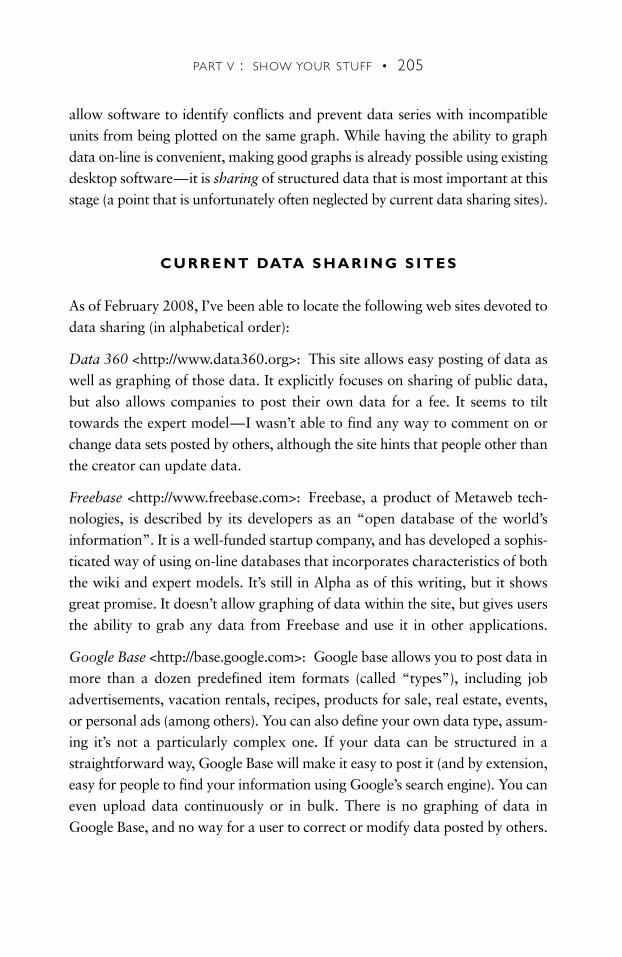
allow software to identify conflicts and prevent data series with incompatibleunits from being plotted on the same graph. While having the ability to graphdata on-line is convenient, making good graphs is already possible using existingdesktop software—it is sharing of structured data that is most important at thisstage (a point that is unfortunately often neglected by current data sharing sites).
C U R R E N T DATA S H A R I N G S I T E S
As of February 2008, I’ve been able to locate the following web sites devoted todata sharing (in alphabetical order):
Data 360 <http://www.data360.org<>: This site allows easy posting of data aswell as graphing of those data. It explicitly focuses on sharing of public data,but also allows companies to post their own data for a fee. It seems to tilttowards the expert model—I wasn’t able to find any way to comment on orchange data sets posted by others, although the site hints that people other thanthe creator can update data.
Freebase <http://www.freebase.com>: Freebase, a product of Metaweb tech-nologies, is described by its developers as an “open database of the world’sinformation”. It is a well-funded startup company, and has developed a sophis-ticated way of using on-line databases that incorporates characteristics of boththe wiki and expert models. It’s still in Alpha as of this writing, but it showsgreat promise. It doesn’t allow graphing of data within the site, but gives usersthe ability to grab any data from Freebase and use it in other applications.
Google Base <http://base.google.com>: Google base allows you to post data inmore than a dozen predefined item formats (called “types”), including jobadvertisements, vacation rentals, recipes, products for sale, real estate, events,or personal ads (among others). You can also define your own data type, assum-ing it’s not a particularly complex one. If your data can be structured in astraightforward way, Google Base will make it easy to post it (and by extension,easy for people to find your information using Google’s search engine). You caneven upload data continuously or in bulk. There is no graphing of data inGoogle Base, and no way for a user to correct or modify data posted by others.
PART V : SHOW YOUR STUFF • 205
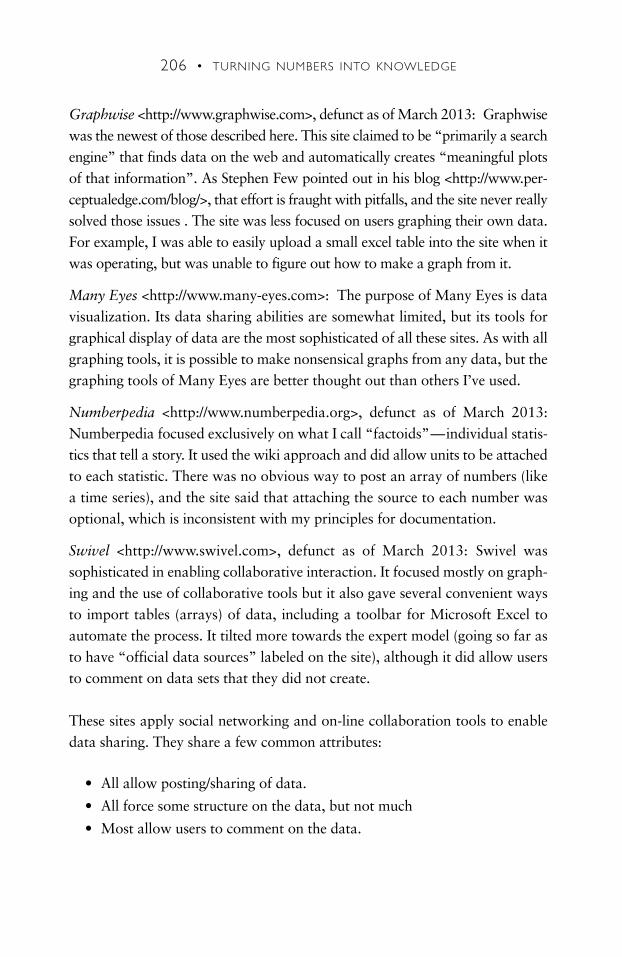
Graphwise <http://www.graphwise.com>, defunct as of March 2013: Graphwisewas the newest of those described here. This site claimed to be “primarily a searchengine” that finds data on the web and automatically creates “meaningful plotsof that information”. As Stephen Few pointed out in his blog <http://www.per-ceptualedge.com/blog/>, that effort is fraught with pitfalls, and the site never reallysolved those issues . The site was less focused on users graphing their own data.For example, I was able to easily upload a small excel table into the site when itwas operating, but was unable to figure out how to make a graph from it.
Many Eyes <http://www.many-eyes.com>: The purpose of Many Eyes is datavisualization. Its data sharing abilities are somewhat limited, but its tools forgraphical display of data are the most sophisticated of all these sites. As with allgraphing tools, it is possible to make nonsensical graphs from any data, but thegraphing tools of Many Eyes are better thought out than others I’ve used.
Numberpedia <http://www.numberpedia.org>, defunct as of March 2013:Numberpedia focused exclusively on what I call “factoids”—individual statis-tics that tell a story. It used the wiki approach and did allow units to be attachedto each statistic. There was no obvious way to post an array of numbers (likea time series), and the site said that attaching the source to each number wasoptional, which is inconsistent with my principles for documentation.
Swivel <http://www.swivel.com>, defunct as of March 2013: Swivel wassophisticated in enabling collaborative interaction. It focused mostly on graph-ing and the use of collaborative tools but it also gave several convenient waysto import tables (arrays) of data, including a toolbar for Microsoft Excel toautomate the process. It tilted more towards the expert model (going so far asto have “official data sources” labeled on the site), although it did allow usersto comment on data sets that they did not create.
These sites apply social networking and on-line collaboration tools to enabledata sharing. They share a few common attributes:
• All allow posting/sharing of data.
• All force some structure on the data, but not much
• Most allow users to comment on the data.
206 • TURNING NUMBERS INTO KNOWLEDGE
• Some allow users to rank or rate data (although what criteria they areusing to rank is usually unclear).
• Some allow easy download of data to Excel or other easily readable formats
• Some allow graphing of data
• None enforce adequate documentation
With the exception of Google Base, which is a somewhat different animalthan the others, these sites have real quality control issues. In particular, I sawmany instances of data with positive or negative ratings but no way to interpretwhat those ratings mean, data without any documentation, data series withquestionable entries, graphs with nonsensical axes, graphs plotting clearly unre-lated data on the same chart, and graphs with incorrectly labeled units.
E N A B L I N G DATA S H A R I N G I S T H E K E Y
The designers of the sites described above have applied the social networking andcollaborative models that have worked well for YouTube and Wikipedia withoutgiving careful thought to what would actually work best for data. The scientificcommunity has taken a different approach, in which the technical, legal, andlogistical issues of data sharing are front and center. Creative Commons, forexample, has addressed ambiguities in current law that impede sharing of data-bases by creating an open access data protocol <http://sciencecommons.org/ projects/publishing/open-access-data-protocol/>, as part of their “Open DataCommons” project <http://www.opendatacommons.org/>. Creative Commonscorrectly (in my view) understands that core issues of data sharing (including legalissues and technical/practical issues about structured data) need to be resolvedbefore data sharing web sites can reach their full potential. This realization is astrue for more popular data sharing sites as it is for their scientific counterparts.
C O N C L U S I O N S
Ideal data sharing sites would allow the community to rank the credibility andquality of data. They would make it easier to find data and to design software
PART V : SHOW YOUR STUFF • 207

tools to graph those data in a way that would yield insights, accelerating bothtechnological and intellectual innovation. There are clear advantages to com-puter-aided sharing of structured data, but at this writing existing data sharingweb sites fall far short of reaching this promise.
208 • TURNING NUMBERS INTO KNOWLEDGE
Whenever I found out anything remarkable, I have thought it my dutyto put down my discovery on paper, so that all ingenious people mightbe informed thereof.
— A N TO N I E VA N L E E U W E N H O E K ( 1 6 3 2 – 1 7 2 3 )

I would like to thank the following people for their comments and encourage-ment throughout the process of writing this book: Todd Baldwin, Eric Bergman,Marcela Bilek, Jeanne Briskin, Erik Brynjolfsson, Johanna Buurman, ChrisCalwell, Sheryl Carter, Cynthia Chaffee, Eva Cohen, Ken Conca, Laura Driussi,Carol Emert, Chris Ertel, Marta Feldmesser, Maria Fink, Karina Garbesi, SteveGreenberg, John Harte, Dianne Hawk, Rick Heede, Ephraim Heller, KarenHeller, Chris Koomey, Gregory Koomey, Richard Koomey, Skip Laitner, TodLoofbourrow, Amory Lovins, Nathan Martin, Alan Meier, Evan Mills, MarjaMogk, Amey Moot, Mark Morland, Laura Nelson, Laura Newcomer, AndrewNicholls, Mary Orland, Joe Romm, Art Rosenfeld, Erika Rosenthal, Marc Ross,Suzanne Samuel, Polly Shaw, Lene Sørensen, Philip Sternberg, and Kim Taylor.
Special thanks to R. Cooper Richey at Centaurus Energy and MicheleBlazek at AT&T, whose careful reading vastly improved this manuscript.
I would also like to express my gratitude to those friends and colleagues whowere most instrumental in teaching me the “tricks of the trade” over the years,including Florentin Krause, Mark Levine, Jim McMahon, Art Rosenfeld, JohnHarte, John Holdren, Barbara Barkovich, Bill Ahern, and Amory Lovins.
Wylie O’Sullivan and Nan Wishner performed careful copy editing of themanuscript, and Veronica Oliva alerted me to possible issues related to permis-sions for copyrighted material cited within (though I made all decisions about theuse of copyrighted material and permissions for that material). Susanna Tadlocksupervised the production and printing of the book (a task for which I owe herspecial thanks), Sandy Drooker is responsible for its lovely design, and DavePeattie and Bea Hartman did a masterful job of typesetting.
Tom Chen’s graphics grace the cover and a couple of the chapters. Hedeserves my thanks for creating art that really works with the book.
Finally, I would like to dedicate the second edition of this book to mybeloved Melissa, who by her very existence has made my world brighter andmore wonderful.
AC K N OW L E D G M E N T S
xxiii

© 2001 by Tom
Chen. A
ll rights reserved.
209
CREATING THE FUTURE
Like the butterfly’s wing beat that ultimately leads to a hurricane, seeminglytrivial actions can have consequences that reverberate through generations.With every action, with every day we live, we create the future. Of course,forces beyond human control also have influence, but it is how our choicesrelate to these external events that determine the outcome.
Mastering the art of problem solving is one important way to ensure that thefuture you create is a hopeful one. Analysis helps you make choices that are con-sonant with your personal values, consistent with your ideology, and reflectiveof the realities imposed by external forces. Whether you are a businessperson,scientist, athlete, or accountant, analyzing your choices in a systematic way willlead to a better life.
Of primary importance from this book are the following lessons:
• Don’t be intimidated by anyone: The key issues surrounding all but themost technical topics can be understood by any intelligent and sufficientlydiligent person.
• Be a critical thinker: Dissect your own arguments and those of others.Identify the premises and the main conclusion of each argument. Make surethe premises are acceptable, relevant, and adequate to support the conclu-sions. Finally, search for missing arguments and for counter arguments.
• Don’t confuse what’s countable with what really counts: Many of the mostimportant things in life can’t be quantified, so don’t focus just on the num-bers–they aren’t everything.
• Get organized: Clean up your office. Establish a filing system that allowsyou to find what you need when you need it. Buy the key books in yourfield, and make them accessible. Above all, remember that organizationoften beats brilliance!
• Question authority: Maintain a healthy skepticism of other people’sanalysis, and ask questions until you understand their points. Clearly dis-
2
11
12
CONCLUSION
6 7
14

210 • TURNING NUMBERS INTO KNOWLEDGE
CALVIN AND HOBBES © 1987 Watterson. Dist. by UNIVERSAL PRESS SYNDICATE. Reprinted with permission. All rights reserved.
tinguish facts from value judgments, and make sure that others do so too.Don’t believe everything you read.
• Dig into the numbers: Look for internal contradictions, large differences,obvious trends, and cognitive dissonance. Compare results to independentsources. Take ratios of numbers, and make sure they relate in a predictableway.
19
16
27

CONCLUSION : CREATING THE FUTURE • 211
• Focus on the essential: In creating your analysis, focus on designing con-sistent comparisons, developing credible scenarios, and using simple andunderstandable models to illustrate the key issues. Avoid complex com-puter tools unless absolutely necessary.
• Document, document, document: Documentation creates a trail for you andothers to follow after the analysis is done. It is essential to any intellectualwork but is oft neglected. By making it a priority, you ensure that your intel-lectual contribution will remain important and useful for years to come.
• Use the Internet: Rely on the Internet to conduct your research, share yourdata, and make your publications widely available. The old ways of pub-lishing and disseminating data are rapidly being swept away by electronicmedia, so use these media to full advantage.
• Remember that others don’t care as much about your work as you do: It’syour responsibility to know your audience, address their concerns, andexplain your work in an understandable way. Make your figures clear andcompelling, your tables well documented, and your reports so valuablethat your colleagues will treasure them for years.
• Synthesis follows analysis: Combining analysis results from differentfields in creative ways often leads to new insights. Such synthesis is onepowerful way to increase your understanding of the world around you.Don’t underestimate its importance.
Finally, the integrity of your calculations and the clarity of their presentationare both critical to your analytical success, but even more important is yourfocus on the issues that really matter. Too many people expend their effort ontopics of only marginal importance. Your time is your life, so make it count!
I leave you with the environmentalist Edward Abbey’s excellent advice forthose who are trying to change the world: “Do not burn yourself out. Be as Iam–a reluctant enthusiast, a part-time crusader, a half-hearted fanatic. Save theother half of yourselves and your lives for pleasure.”
You can’t accomplish your goals unless you yourself are whole. Care foryourself and those around you. Take the time to do those things that replenishyour energy and fill your heart with joy. Your children and our posterity willthank you for it.
The future is where we will spend the rest of our lives.— A N O N Y M O U S
33
2625
28
10
3839
36
32
35
33

For Melissa

. . . I’d always believed that a life of quality, enjoyment, and wisdomwere my human birthright and would be automatically bestowedupon me as time passed. I never suspected that I would have to learnhow to live–that there were specific disciplines and ways of seeing theworld I had to master before I could awaken to a simple, happy,uncomplicated life. — DA N M I L L M A N
213
EPILOGUE
A lie can travel halfway around the world while the truth is putting onits shoes. — M A R K T WA I N
Soon after I completed the first edition of Turning Numbers into Knowledge
in 2001 I investigated a high profile example of bad statistics run amok. In thiscase, the tools and techniques described in this book, if widely applied, wouldhave allowed businesses and investors to recognize these erroneous numbers forwhat they were before any harm was done.
D U B I O U S C L A I M S
Electricity used by computers was in the news awhile back, and some dubiousclaims were making the rounds:
• Claim # 1: The Internet accounted for eight percent of all electricity usedin the United States around the year 2000.
• Claim # 2: Computers and information technology equipment, includingthe Internet, used 13 percent of all U.S. electricity in 2000—and this totalwas expected to grow to half of all electricity use ten to twenty years later.
• Claim #3: The “behind-the-wall” networking, server, and switchingequipment needed to support a wireless personal digital assistant used asmuch electricity as a residential refrigerator.
SOME PARTING THOUGHTS
214 • TURNING NUMBERS INTO KNOWLEDGE
Most major U.S. newspapers and business magazines, many respected insti-tutions, and politicians of both political parties cited these assertions (the firstone even came up in a Doonesbury comic strip at about the same time).Unfortunately, these claims are all incorrect.
These misconceptions originated in an article for Forbes magazine in May1999 (“Dig More Coal—The PCs Are Coming”). They were perpetuated in asupporting report for the Greening Earth Society, in a Wall Street Journal op-edpiece, in congressional testimony, in articles for popular magazines, and innumerous interviews.
The claim that computers use lots of electricity spread quickly, driven by asuperficially plausible story line and an ostensibly related high-profile crisis inthe California electricity sector. Forbes, a respected magazine, lent credibility tothe argument, as did the writer and publisher George Gilder, who published theDigital Power Report (which gave stock recommendations for investors assum-ing that these assertions were true) about one year after the Forbes article cameout.
The trade press, the investment community, and the popular media found thekey claims in the Forbes article irresistible. They repeated those claims fre-quently, often without citing the original source—in effect, enshrining them asconventional wisdom. Leaders in business, government, and academia weremisled by this barrage of media attention and cited the statistics widely, ensur-ing their continued proliferation (Koomey et al. 2002).
For example, reports of six major investment banks published from May toSeptember 2000 accepted the assertions in the Forbes article as fact (see TableEP.1). Each report claimed to present unique insights on this topic, but eachrelied heavily on the Forbes arguments for justification (sometimes attributingtheir stock picks to that source, sometimes not).
T H E R E A L S TO RY
Over several years, my colleagues and I demonstrated in peer-reviewed journalarticles, congressional testimony, conference papers, and technical reports that
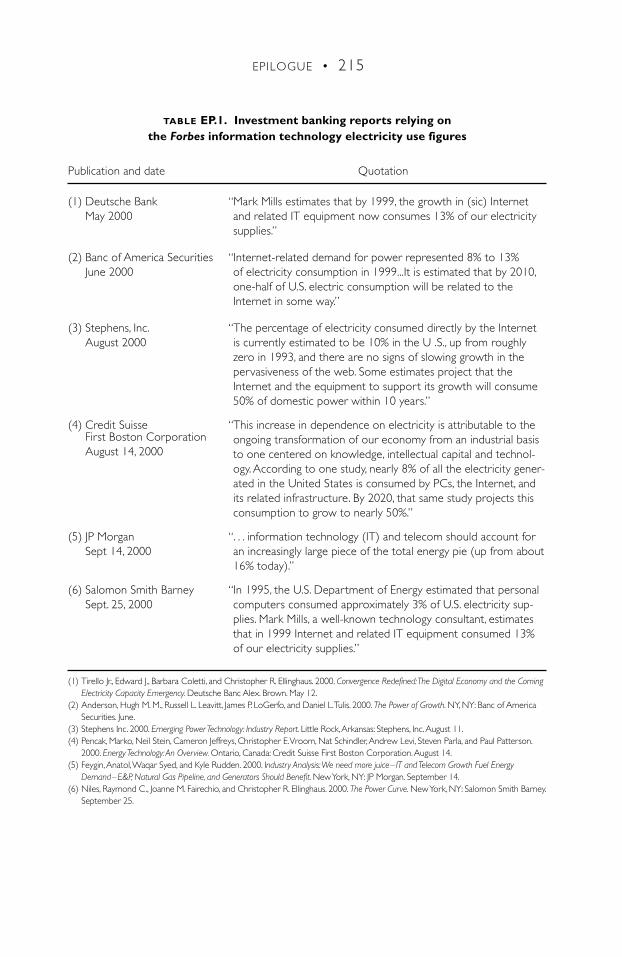
EPILOGUE • 215
“Mark Mills estimates that by 1999, the growth in (sic) Internetand related IT equipment now consumes 13% of our electricitysupplies.”
“Internet-related demand for power represented 8% to 13% of electricity consumption in 1999...It is estimated that by 2010,one-half of U.S. electric consumption will be related to theInternet in some way.”
“The percentage of electricity consumed directly by the Internet is currently estimated to be 10% in the U .S., up from roughlyzero in 1993, and there are no signs of slowing growth in thepervasiveness of the web. Some estimates project that theInternet and the equipment to support its growth will consume50% of domestic power within 10 years.”
“This increase in dependence on electricity is attributable to theongoing transformation of our economy from an industrial basisto one centered on knowledge, intellectual capital and technol-ogy. According to one study, nearly 8% of all the electricity gener-ated in the United States is consumed by PCs, the Internet, andits related infrastructure. By 2020, that same study projects thisconsumption to grow to nearly 50%.”
“. . . information technology (IT) and telecom should account foran increasingly large piece of the total energy pie (up from about16% today).”
“In 1995, the U.S. Department of Energy estimated that personalcomputers consumed approximately 3% of U.S. electricity sup-plies. Mark Mills, a well-known technology consultant, estimatesthat in 1999 Internet and related IT equipment consumed 13% of our electricity supplies.”
TABLE EP.1. Investment banking reports relying on the Forbes information technology electricity use figures
Publication and date Quotation
(1) Deutsche BankMay 2000
(2) Banc of America SecuritiesJune 2000
(3) Stephens, Inc.August 2000
(4) Credit Suisse First Boston CorporationAugust 14, 2000
(5) JP MorganSept 14, 2000
(6) Salomon Smith BarneySept. 25, 2000
(1) Tirello Jr., Edward J., Barbara Coletti, and Christopher R. Ellinghaus. 2000. Convergence Redefined:The Digital Economy and the ComingElectricity Capacity Emergency. Deutsche Banc Alex. Brown. May 12.
(2) Anderson, Hugh M. M., Russell L. Leavitt, James P. LoGerfo, and Daniel L.Tulis. 2000. The Power of Growth. NY, NY: Banc of AmericaSecurities. June.
(3) Stephens Inc. 2000. Emerging Power Technology: Industry Report. Little Rock,Arkansas: Stephens, Inc.August 11.(4) Pencak, Marko, Neil Stein, Cameron Jeffreys, Christopher E.Vroom, Nat Schindler,Andrew Levi, Steven Parla, and Paul Patterson.
2000. Energy Technology:An Overview. Ontario, Canada: Credit Suisse First Boston Corporation.August 14.(5) Feygin,Anatol,Waqar Syed, and Kyle Rudden. 2000. Industry Analysis:We need more juice– IT and Telecom Growth Fuel Energy
Demand–E&P, Natural Gas Pipeline, and Generators Should Benefit. New York, NY: JP Morgan. September 14.(6) Niles, Raymond C., Joanne M. Fairechio, and Christopher R. Ellinghaus. 2000. The Power Curve. New York, NY: Salomon Smith Barney.
September 25.
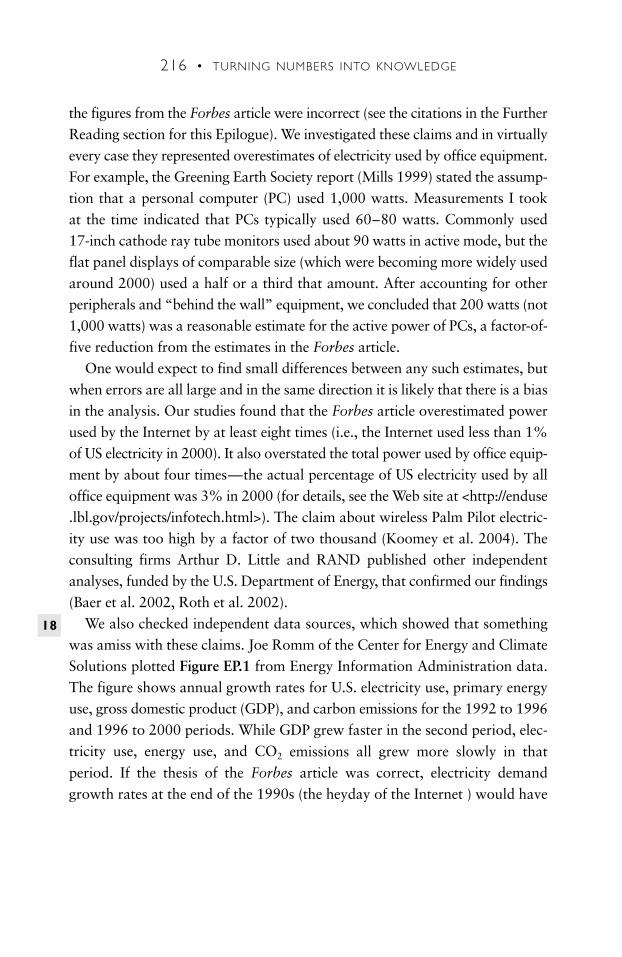
216 • TURNING NUMBERS INTO KNOWLEDGE
the figures from the Forbes article were incorrect (see the citations in the FurtherReading section for this Epilogue). We investigated these claims and in virtuallyevery case they represented overestimates of electricity used by office equipment.For example, the Greening Earth Society report (Mills 1999) stated the assump-tion that a personal computer (PC) used 1,000 watts. Measurements I tookat the time indicated that PCs typically used 60–80 watts. Commonly used17-inch cathode ray tube monitors used about 90 watts in active mode, but theflat panel displays of comparable size (which were becoming more widely usedaround 2000) used a half or a third that amount. After accounting for otherperipherals and “behind the wall” equipment, we concluded that 200 watts (not1,000 watts) was a reasonable estimate for the active power of PCs, a factor-of-five reduction from the estimates in the Forbes article.
One would expect to find small differences between any such estimates, butwhen errors are all large and in the same direction it is likely that there is a biasin the analysis. Our studies found that the Forbes article overestimated powerused by the Internet by at least eight times (i.e., the Internet used less than 1%of US electricity in 2000). It also overstated the total power used by office equip-ment by about four times—the actual percentage of US electricity used by alloffice equipment was 3% in 2000 (for details, see the Web site at <http://enduse.lbl.gov/projects/infotech.html>). The claim about wireless Palm Pilot electric-ity use was too high by a factor of two thousand (Koomey et al. 2004). Theconsulting firms Arthur D. Little and RAND published other independentanalyses, funded by the U.S. Department of Energy, that confirmed our findings(Baer et al. 2002, Roth et al. 2002).
We also checked independent data sources, which showed that somethingwas amiss with these claims. Joe Romm of the Center for Energy and ClimateSolutions plotted Figure EP.1 from Energy Information Administration data.The figure shows annual growth rates for U.S. electricity use, primary energyuse, gross domestic product (GDP), and carbon emissions for the 1992 to 1996and 1996 to 2000 periods. While GDP grew faster in the second period, elec-tricity use, energy use, and CO2 emissions all grew more slowly in thatperiod. If the thesis of the Forbes article was correct, electricity demandgrowth rates at the end of the 1990s (the heyday of the Internet ) would have
18
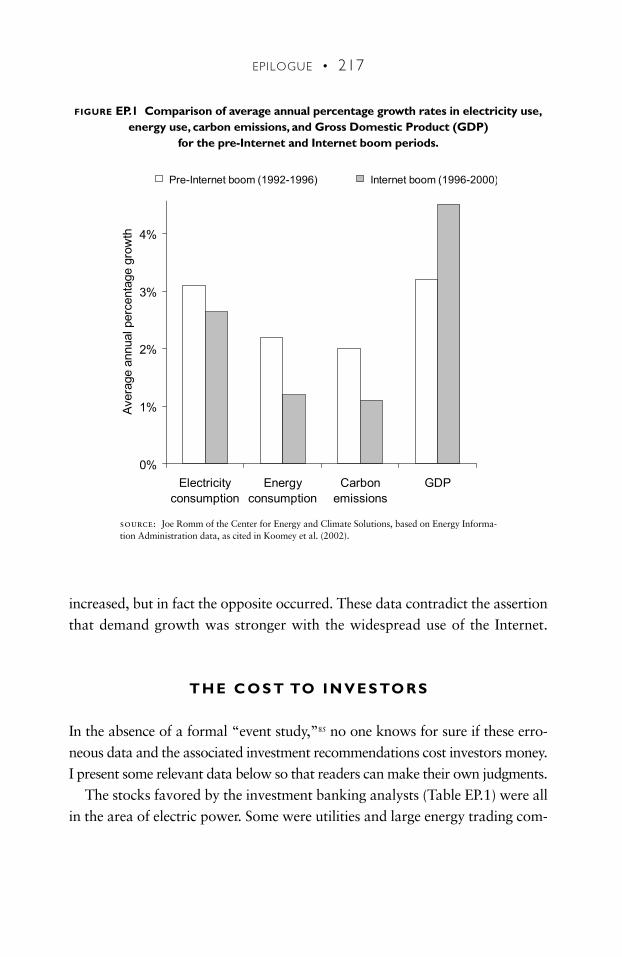
EPILOGUE • 217
increased, but in fact the opposite occurred. These data contradict the assertionthat demand growth was stronger with the widespread use of the Internet.
T H E C O S T TO I N V E S TO R S
In the absence of a formal “event study,”85 no one knows for sure if these erro-neous data and the associated investment recommendations cost investors money.I present some relevant data below so that readers can make their own judgments.
The stocks favored by the investment banking analysts (Table EP.1) were allin the area of electric power. Some were utilities and large energy trading com-
0%
1%
2%
3%
4%
5%
Electricityconsumption
Energyconsumption
Carbonemissions
GDP
Aver
age
annu
al p
erce
ntag
e gr
owth
Pre-Internet boom (1992-1996) Internet boom (1996-2000)
FIGURE EP.1 Comparison of average annual percentage growth rates in electricity use,energy use, carbon emissions, and Gross Domestic Product (GDP)
for the pre-Internet and Internet boom periods.
source: Joe Romm of the Center for Energy and Climate Solutions, based on Energy Informa-tion Administration data, as cited in Koomey et al. (2002).
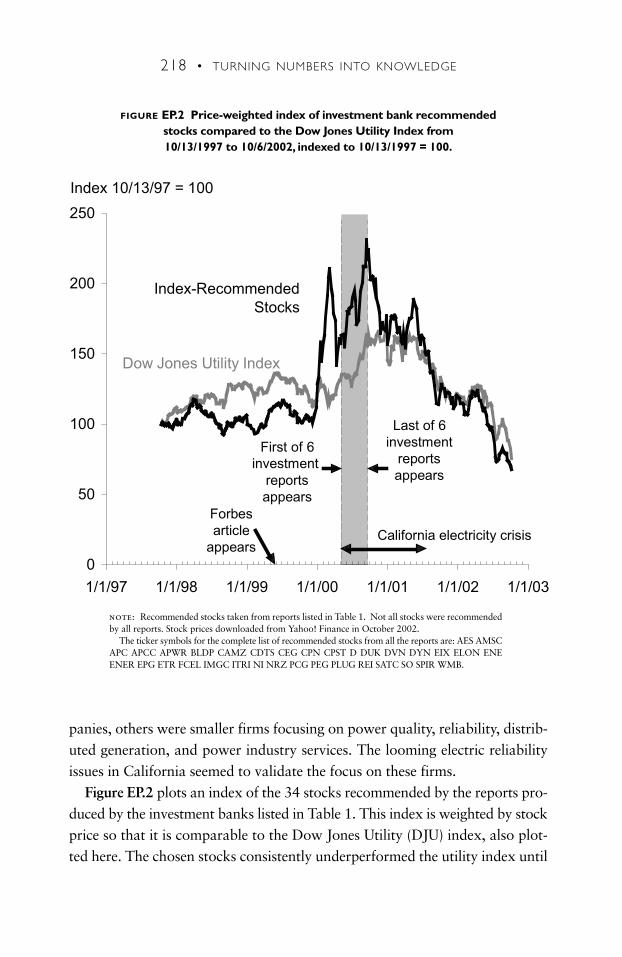
218 • TURNING NUMBERS INTO KNOWLEDGE
panies, others were smaller firms focusing on power quality, reliability, distrib-uted generation, and power industry services. The looming electric reliabilityissues in California seemed to validate the focus on these firms.
Figure EP.2 plots an index of the 34 stocks recommended by the reports pro-duced by the investment banks listed in Table 1. This index is weighted by stockprice so that it is comparable to the Dow Jones Utility (DJU) index, also plot-ted here. The chosen stocks consistently underperformed the utility index until
0
50
100
150
200
250
1/1/97 1/1/98 1/1/99 1/1/00 1/1/01 1/1/02 1/1/03
Index 10/13/97 = 100
Forbesarticle
appears
First of 6
reportsappears
Last of 6 investment
reportsappears
Index-Recommended Stocks
Dow Jones Utility Index
California electricity crisis
investment
FIGURE EP.2 Price-weighted index of investment bank recommended stocks compared to the Dow Jones Utility Index from 10/13/1997 to 10/6/2002, indexed to 10/13/1997 = 100.
note: Recommended stocks taken from reports listed in Table 1. Not all stocks were recommendedby all reports. Stock prices downloaded from Yahoo! Finance in October 2002.
The ticker symbols for the complete list of recommended stocks from all the reports are: AES AMSCAPC APCC APWR BLDP CAMZ CDTS CEG CPN CPST D DUK DVN DYN EIX ELON ENEENER EPG ETR FCEL IMGC ITRI NI NRZ PCG PEG PLUG REI SATC SO SPIR WMB.
EPILOGUE • 219
about January 2000, when over a three month period their prices doubled. Theprice index of the recommended stocks then dropped by about one third, butrose again to make up those losses and more by the end of September 2000. Itis suggestive (but not conclusive) that a large increase in the price of these stocksoccurred over the period in which the aforementioned investment reports werepublished. Of course, the biggest troubles in California’s restructured electric-ity markets also began to manifest themselves over the same period, but thehype generated by those events fed into the hype created by the investmentreports, so they were self reinforcing.
Let’s assume an investor had followed the recommendations in these sixreports and bought 100 shares of each of the 34 touted companies back inSeptember 2000 (when the last of these reports came out). By September 2002he would have lost two-thirds of his investment. For comparison, the DJU indexfell by 44%, and while few stock pickers did well during this period, mostwould regard losing 22 percentage points more than the DJU index over a two-year period as truly dismal investment performance.
T H E A DV E N T U R E C O N T I N U E S
Unfortunately, being refuted in the peer-reviewed literature didn’t stop theauthors of the Forbes article from continuing their crusade. They repeated theirclaims in a 2005 book (Huber and Mills 2005), without acknowledging theirerrors. This is another feature of some peddlers of erroneous statistics: theywon’t fess up to their mistakes. In addition, the quality controls on books areoften far less stringent than those for peer-reviewed journals. And as this exam-ple shows, it takes many paragraphs (and a lot of work) to refute even just anerrant sentence, so debunking of incorrect assertions always lags such claims.
This story is a familiar one. Another example is that of the book The Skepti-
cal Environmentalist, which has been roundly criticized by virtually everyonewho knows anything about the topics it covers, but that hasn’t stopped itsauthor from continuing to repeat his erroneous and misleading statements. Bynot admitting to and correcting their errors, these authors have violated theaccepted code of conduct in science, best summarized by John Holdren, PastPresident of the American Association for the Advancement of Science, in hisrebuttal to The Skeptical Environmentalist:
220 • TURNING NUMBERS INTO KNOWLEDGE
The practice of science, which includes the packaging of findings from sci-ence for use in the public-policy arena, is governed by an unwritten code ofconduct that includes such elements as mastering the relevant fundamentalconcepts before venturing into print in the professional or public arena,learning and observing proper practices for presenting ranges of respectableopinion and uncertainty, avoiding the selection of data to fit pre-conceivedconclusions, reading the references one cites and representing their contentaccurately and fairly, and acknowledging and correcting the errors that havecrept into one’s work (some of which are, of course, inevitable) after theyare discovered by oneself or by others.
Most scientists follow this code of conduct as best they can out of self-respect and respect for the integrity of science itself. For those for whomthese considerations might not be quite enough, there is little that canenforce the code other than concern with the cumulative harm to one’s rep-utation and standing that comes from one’s colleagues’ awareness of a pat-tern of infractions, or fear of the public denunciation by colleagues that mayfollow in the rarer instances of someone’s descending into more massive andwillful disregard of accepted standards.
Violations of this code of conduct are anathema to scientists. Science is rareamong human endeavors in that real progress over decades is easy to show.Better science is more accurate and powerful in its description of the naturalworld, as demonstrated by experiment, data collection, and the embodiment ofscientific knowledge in technology. When serial obfuscators throw sand in theeyes of the scientific and policy process, it is an affront to all those who valuetruth over self-interest and muddy thinking.
I N T E G R I T Y A N D D E C I S I O N M A K I N G
I saw Scott McNealy, Chairman of Sun Microsystems, address the WorldBusiness Forum in October 2007. He returned again and again to the impor-tance of integrity to success in business, because it enhances your ability toachieve measurable results, improves your credibility, and builds trust betweenyou, your colleagues, and your competitors.
Webster’s Ninth New Collegiate dictionary defines integrity as “firm adherenceto a code of especially moral or artistic values: incorruptibility”. Wikipedia (ac-
4
cessed January 31, 2008) defines it as “basing . . . one’s actions on an internallyconsistent set of principles” <http://en.wikipedia.org/wiki/Integrity>. Analystshave integrity when they follow the code of conduct outlined by Holdren and theanalytical principles outlined in this book. At the core of these principles is arespect for truth above all else, even when the truth contradicts long-held beliefs.
Robert Ringer, one of my favorite authors, summarized his theory of realityas follows:
This theory emphasizes, first of all, that reality isn’t the way you wish thingsto be, nor the way they appear to be, but the way they actually are. Secondly,the theory states that you either acknowledge reality and use it to your ben-efit or it will automatically work against you.
Ringer uses the term “reality”, but he could just as well have used the words“the truth” in his theory. He captures an essential lesson for those using analy-sis to improve decision making, and that is, after all, the name of the game.
Getting the numbers right really does matter. All business and policy deci-sions today are based at least in part on quantitative data, and no good cancome of incorrect information being widely accepted. Annoyance, inconven-ience, financial hardship, or even disaster can follow from important decisionsbased on faulty data.
We can’t undo what’s been done, but there is plenty that all of us can do fromnow on to ensure that we aren’t being misled by bogus information. The widelycited but misleading statistics I mention here are just the tip of the iceberg. Yourbest defense against being fooled is to think for yourself and do your home-work. Never make important decisions based on “common knowledge” unlessyou can verify its accuracy independently. Make sure you “follow the money”to determine whether someone has a vested interest in a particular outcome.And be skeptical about recommendations in investment reports, unless youknow and trust the analyst’s integrity and judgment.
You can improve your own analytical integrity by applying the techniquesdescribed in this book. Doing so can be time consuming, but if a set of facts iscentral to an important decision—for example, a business plan, a marketingstrategy, or a new direction in research—then you need to put those principlesto work.
EPILOGUE • 221
4
11
16
14
24
C O N C L U S I O N S
People with integrity are the ones who succeed in the long run. The questionremains, however: how can you best develop analytical and personal integrity?I offer these final thoughts:
• Say what you mean and mean what you say. If you promise something,always follow through—the recipient will reward your diligence when youneed help next time.
• Stick close to the data. Don’t make claims the data don’t support, anddon’t let others do so. Never exaggerate, distort, or dissemble, or theresults will come back to bite you in the butt (which is a more colorful wayof rephrasing Ringer’s “Theory of Reality”).
• Assume that others will replicate your work. If it’s interesting and impor-tant enough they surely will, so document it well and be accurate in theclaims you infer from it.
• Focus on completing the mission. We’ve all encountered people whosepersonal issues, biases, and interests win out over the larger goals, andthose are people to avoid if you can. True professionals can properly han-dle personal interests in a way that still leads to the best outcome for theteam as a whole, but such professionals are the exception rather than therule. You should be such an exception.
Analysis is, at its heart, a tool for building a better world. I wish you greatsuccess in putting it to work!
222 • TURNING NUMBERS INTO KNOWLEDGE
Always do right.This will gratify some people and astonish the rest.
— M A R K T WA I N
33
223
F U RT H E R R E A D I N G
N U M B E R S TO K N OW L E D G E “ TO P E L E V E N ” L I S T
Choosing my eleven favorites from the “Further Reading” section was not an easy task (I couldn’tkeep myself to just ten). I know you won’t be disappointed with any of these:
1. Huff, Darrell. 1993. How to Lie with Statistics. New York, NY: W. W. Norton & Co., Inc.If this book doesn’t make you a skeptical observer of numbers and statistics, nothing will.First published in the 1950s, it’s still fresh and useful today.
2. Booth, Wayne C., Gregory G. Colomb and Joseph M. Williams. 1995. The Craft ofResearch. Chicago, IL: The University of Chicago Press. This superb book presents a frame-work for dissecting arguments that can be applied in most situations.
3. Ueland, Brenda. 2007. If You Want to Write: A Book About Art, Independence, and Spirit. St.Paul, Minnesota: Graywolf Press. There is no better guide to sparking your creative process.
4. Hughes, William. 1997. Critical Thinking: An Introduction to the Basic Skills. 2d Pete-rborough, Ontario: Broadview Press. This clearly written and accessible book is a marvelousintroduction to logical argument.
5. U.S. Bureau of the Census. 2008. The Statistical Abstract of the United States 2008. 127th edi-tion Washington D.C.: U.S. Government Printing Office <http://www.census.gov/compendia/statab>. One of the most important data sources for any U.S. researcher. The plot’s a bit thin,but the content’s superb.
6. Norman, Donald A. 1990. The Design of Everyday Things. New York, NY: Doubleday/Currency. This fascinating book explores how humans interact with technology, and givesguidance to designers on how to make their products a joy to use.
7. Schwartz, Peter. 1996. The Art of the Long View: Planning for the Future in an UncertainWorld. New York, NY: Doubleday. Lively and realistic scenarios are crucial tools for deci-sion makers, and Schwartz describes how to create them in this classic book.
8. Heath, Chip, and Dan Heath. 2007. Made to Stick: Why Some Ideas Survive and OthersDie. New York, NY: Random House. This book contains insightful and practical guidancefor compelling story telling.
9. Tufte, Edward R. Envisioning Information. (1990). Visual Explanations: Images and Quan-tities, Evidence and Narrative. (1997). The Visual Display of Quantitative Information, 2nded. (2001). Cheshire, CT: Graphics Press. OK, I’m cheating a bit by calling these one book,but they are so good you’ll want them all <http://www.edwardtufte.com>.
10. Few, Stephen. 2004. Show Me the Numbers: Designing Tables and Graphs to Enlighten.Oakland, CA: Analytics Press. This book complements Tufte’s work, but is more business-focused and practical.
11. Ringer, Robert J. 1974. Winning Through Intimidation. New York: Funk & Wagnalls. (Re-published in 2004 as “To Be or not to Be Intimidated? That is the Question”.) This book’sphilosophical and practical advice (and its humor) makes it one of my all-time favorites.

224 • TURNING NUMBERS INTO KNOWLEDGE
I N T RO D U C T I O N • T H E I N F O R M AT I O N E X P L O S I O N
Burke, James. 2007. Connection. New York, NY: Simon & Schuster. An outstanding book thatdiscusses the history of technology in a brilliant and accessible way. Among other things,Burke explores the key role of the printing press in fostering later technological and scientificdevelopments.
Cohen, Patricia Cline. 1985. A Calculating People: The Spread of Numeracy in Early America.Chicago, IL: The University of Chicago Press. This marvelous history describes the commer-cial, scientific, and philosophical origins of European and American fascination with numbersand statistics.
de Sola Poole, Ithiel. 1983. Technologies of Freedom. Cambridge, MA: The Belknap Press ofHarvard University Press. This book made a first attempt to quantify the accelerating pace ofinformation generation in modern society.
Koomey, Jonathan, Marshall van Alstyne, and Erik Brynjolfsson. 2007. “You’ve got spam.” TheWall Street Journal. New York, NY. September 6. p. A16. This op-ed cites the statistic that90% of 2007 email is spam and proposes an approach for solving the spam problem.
Shenk, David. 1997. Data Smog: Surviving the Information Glut. New York, NY: HarperCollinsPublishers, Inc. This book documents the symptoms of information overload. It’s worth a readjust for the anecdotes, which are delightful.
PA RT I • T H I N G S TO K N OW
1 • Beginner’s Mind
Heath, Chip, and Dan Heath. 2007. Made to Stick: Why Some Ideas Survive and Others Die.New York, NY: Random House. This wonderful book describes “the curse of expertise” andits implications for how we interpret what’s going on in the world.
Hyams, Joe. 1982. Zen in the Martial Arts. New York, NY: Bantam Books. The story of JoeHyams’ explorations into different martial arts is one of the inspirations for the book you arenow reading. It’s broken up into short sections, each with an important lesson he learned overthe years. A quick read, and a great one.
2 • Don’t Be Intimidated
Ringer, Robert J. 1974. Winning Through Intimidation. New York: Funk & Wagnalls. This bookis one of my favorites. It’s entertaining, interesting, and timeless. It’s also a quick read, and isavailable in most big bookstores (it still sells well). It was republished in 2004 as To Be or Notto Be Intimidated: That is the Question.
Ueland, Brenda. 2007. If You Want to Write: A Book About Art, Independence, and Spirit. St.Paul, Minnesota: Graywolf Press. One of the classic books on creativity. Ueland writes aboutwriting, but her advice applies equally well to most forms of human creation. It’s beautifullywritten and easy to read.
3 • Information, Intention, and Action
Alonso, William, and Paul Starr, ed. 1987. The Politics of Numbers. New York, NY: Russell SageFoundation. Alonso and Starr edit a collection of essays that brilliantly explores the politicaland practical implications of increasing reliance on fact-based decision making in the U.S. inthe Twentieth Century.
FURTHER READING • 225
Brooks Jr., Frederick P. 1982. The Mythical Man-Month: Essays on Software Engineering. Read-ing, MA: Addison-Wesley Publishing Company. This book gives sage and practical advice onprogramming that applies more generally to implementing ideas in the real world. A classic!
Gladwell, Malcolm. 2005. Blink: The Power of Thinking Without Thinking. New York, NY:Little, Brown and Company. This book shows how people use “gut feelings” to make impor-tant decisions (and why some are better at it than others).
Hammond, John S., Ralph L. Keeney, and Howard Raiffa. 1999. Smart Choices: A PracticalGuide to Making Better Decisions. Boston, MA: Harvard Business School Press. A well-written and methodical guide to improving your decision making processes.
Hess, Peter, and Julie Siciliano. 1996. Management: Responsibility for Performance. New York,NY: Mc Graw-Hill, Inc. This book does a fine job of describing how to set goals, make deci-sions, and implement decisions in the business world. It also explicitly discusses the role ofintuition, experience, and values in decision making.
Kawasaki, Guy. 1995. How to Drive Your Competition Crazy: Creating Disruption for Fun andProfit. New York, NY: Hyperion. Kawasaki harkens back to his time as chief evangelist forthe upstart Apple Computer in the late 1970s and early 1980s, and gives some lessons for mar-keting products in the face of competition from huge and well-funded rivals. The book isloaded with great anecdotes.
Kim, Jane J. 2005. “Stock Research Gets More Reliable.” The Wall Street Journal. New York,NY. June. p. D1. Changes in the way research departments are structured in the big investmentfirms have yielded some improvements in their investment research reports.
Laderman, Jeffrey M. 1998. “Wall Street’s Spin Game: Stock Analysts Often Have a HiddenAgenda.” In Business Week. October 5. pp. 148-156.
Morgan, M. Granger, and Max Henrion. 1992. Uncertainty: A Guide to Dealing withUncertainty in Quantitative Risk and Policy Analysis. New York, NY: Cambridge UniversityPress. A “must read” book for anyone trying to understand how uncertainty affects decisionmaking.
Norman, Donald A. 2002. The Design of Everyday Things. New York, NY: Basic Books. Thisfascinating book explores how humans interact with technology, and gives guidance to design-ers on how to make their products a joy to use.
Schwartz, Peter. 1996. The Art of the Long View: Planning for the Future in an Uncertain World.New York, NY: Doubleday. Lively and realistic scenarios are crucial tools for decision mak-ers, and Schwartz describes how to create them in this classic book.
Story, Louise. 2007. “How Many Site Hits? Depends Who’s Counting.” The New York Times(online). New York, NY. October 22. Measurement of site traffic is still difficult, even aftermore than a decade of improvements in the World Wide Web.
4 • Peer Review and Scientific Discovery
Borchert, Donald M., ed. 2006. The Encyclopedia of Philosophy, 2nd ed. New York, NY:Macmillan Reference Books. Volumes 1 through 10. This encyclopedia is the standard refer-ence source for anyone investigating philosophical concepts. It contains articles by leadingscholars on everything from logic to epistimology, energy to truth, liberty to idealism, ethicsto virtue, and almost anything else you can think of.
Hughes, William. 1997. Critical Thinking: An Introduction to the Basic Skills. 2d Peterborough,Ontario: Broadview Press. This clearly written and accessible book is a wonderful introduc-tion to logical argument. Hughes uses myriad examples to illustrate the logical fallacies that

226 • TURNING NUMBERS INTO KNOWLEDGE
bedevil most arguments. He also clearly describes the difference between inductive and deduc-tive logic.
Kuhn, Thomas S. 1996. The Structure of Scientific Revolutions. 3rd ed. Chicago: University ofChicago Press. This book redefined contemporary views of how science progresses, and is alandmark in the history of science.
Murray, David, Joel Schwartz, and S. Robert Lichter. 2001. It Ain’t Necessarily So: How MediaMake and Unmake the Scientific Picture of Reality. Lanham, MD: Rowman & LittlefieldPublishers, Inc. This book offers a nuanced and informative look at how the media reports onscientific research.
Pirsig, Robert M. 2006. Zen and the Art of Motorcycle Maintenance. NY: HarperTorch. Thisbook is a popular excursion into the relationship between science and art. While not alwaysphilosophically rigorous, the book is still entertaining, thoughtful, and provocative.
Sokal, Alan D. 1997. “A Plea for Reason, Evidence, and Logic.” New Politics. vol. 6, no. 2. p.126. This short transcript of a talk by Sokal is a brilliantly clear and concise exposition of thescientific worldview, in the context of his now famous parody of “post-modernist” relativism.Sokal created a controversy in 1996 by submitting an article that he knew was total nonsenseto a journal called Social Text, and the journal published it. Sokal suspected correctly that byliberally sprinkling the article with phrases that flattered the editors’ predispositions, he wouldmake publication likely. He then exposed the hoax. For the complete set of articles and relateddebates, see <http://www.physics.nyu.edu/faculty/sokal>.
Thomson. 2008. Science Citation Index, online version: <http://scientific.thomson.com/products/scie>. This web site is the on-line version of the science citation index.
Wilber, Ken. 1998. The Marriage of Sense and Soul: Integrating Science and Religion. New York,NY: Broadway Books. Wilber is a science-minded philosopher who has real insight into howscientific principles can help humans to more fully explore all aspects of reality.
PA RT I I • B E P R E PA R E D
5 • Explore Your Ideology
Flew, Anton, ed. 1984. Dictionary of Philosophy. London: Pan Books, Ltd.
6 • Get Organized
Covey, Stephen R. 2004. The 7 Habits of Highly Effective People. 15th Anniversary edition. NY,NY: Free Press. Covey got me to think systematically about how I organize my time and mywork.
Culp, Stephanie. 1990. Conquering the Paper Pile-up: How to Sort, Organize, File, and StoreEvery Piece of Paper in Your Home and Office. Cincinnati, Ohio: Writer’s Digest Books.Practical advice for getting organized.
Lively, Lynn. 1996. Managing Information Overload. The WorkSmart Series. New York, NY:AMACOM/American Management Association. This book is brief but important. Its adviceon controlling information flows is especially pertinent in the information age.
Morgenstern, Julie. 2004. Organizing from the Inside Out: The Foolproof System for OrganizingYour Home, Your Office and Your Life. 2nd ed. New York, NY: Holtzbrinck Publishers (nowMacMillan). This is one of the best books on organizing that I’ve found. It’s a top seller.
FURTHER READING • 227
7 • Establish a Filing System
Culp, Stephanie. 1990. Conquering the Paper Pile-up: How to Sort, Organize, File, and StoreEvery Piece of Paper in Your Home and Office. Cincinnati, Ohio: Writer’s Digest Books. Ahelpful book focusing specifically on dealing with paper clutter.
Lively, Lynn. 1996. Managing Information Overload. The WorkSmart Series. New York, NY:AMACOM/American Management Association. Advice on remaining organized in the faceof a flood of information.
Morgenstern, Julie. 2004. Organizing from the Inside Out: The Foolproof System for OrganizingYour Home, Your Office and Your Life. 2nd ed. New York, NY: Holtzbrinck Publishers (nowMacMillan). Has a fine chapter on “traditional offices and filing systems.”
Schwartz, Peter. 1996. The Art of the Long View: Planning for the Future in an Uncertain World.New York, NY: Doubleday. See the section on “Information hunting and gathering”.
8 • Build a Toolbox
The Economist. 2003. Numbers Guide: The Essentials of Business Numeracy. Princeton, NY:Bloomberg Press. This terrific book teaches numerical tools and techniques for businessapplications.
Gonick, Larry, and Woollcott Smith. 1993. The Cartoon Guide to Statistics. New York, NY:Harper Perennial, a division of Harper Collins Publishers. This book is a fun way to learnbasic statistical concepts.
Harte, John. 1985. Consider a Spherical Cow: A Course in Environmental Problem Solving. LosAltos, CA: William Kaufmann, Inc. This beautiful book contains tools relevant to solvingproblems in environmental science. The sequel to it (Consider a Cylindrical Cow: FurtherAdventures in Environmental Problem Solving) was published in 2001 by University ScienceBooks, in Sausalito, California.
Huff, Darrell. 1993. How to Lie with Statistics. New York, NY: W. W. Norton & Co., Inc.Reread this classic book every few years, to keep your toolbox fresh.
Huff, Darrell. 1999. The Complete How to Figure It. New York, NY: W. W. Norton & Co., Inc.An excellent sourcebook, with hundreds of examples of how to solve different problems in thereal world.
Jones, Gerald Everett. 2006. How to Lie with Charts. 2nd ed. Charleston, SC: BookSurgePublishing. A fine source for ideas on graphical and tabular presentation.
Kernighan, Brian W., and Rob Pike. 1999. The Practice of Programming. Reading, MA:Addison-Wesley. This marvelous book on the art of computer programming is somewhat tech-nical, but is exceptional for its advice on programming style and documentation. It also offersmany excellent suggestions for debugging and testing calculations.
Swartz, Clifford E. 1993. Used Math: for the First Two Years of College Science. 2nd ed. CollegePark, MD: American Association of Physics Teachers. Summarizes mathematics that can beuseful for more advanced analysts.
Tal, Joseph. 2001. Reading Between the Numbers: Statistical Thinking in Everyday Life. NewYork, NY: McGraw-Hill. This book offers both conceptual understanding of key statisticalconcepts and intensely practical guidance for real-world use of those concepts.
9 • Put Facts at Your Fingertips
Annual Reviews. 4139 El Camino Way, PO Box 10139. Palo Alto, CA 94303-0139. 650/493-4400 <http://www.annualreviews.org>.
228 • TURNING NUMBERS INTO KNOWLEDGE
Berkman, Robert I. 2000. Find It Fast: How to Uncover Expert Information In Any Subject. 5thed. New York, NY: Harper & Rowe, Publishers. A helpful guide to digging out data from themyriad disparate sources out in the world.
Blocksma, Mary. 1989. Reading the Numbers: A Survival Guide to the Measurements, Numbers,and Sizes Encountered in Everyday Life. New York, NY: Penguin USA. This book is some-what hard to find, but it explains how to interpret and use a variety of data that we encounterin everyday life.
Borchert, Donald M., ed. 2006. The Encyclopedia of Philosophy. 2nd ed. New York, NY:Macmillan Reference Books. Volumes 1 through 10. The best place to go when you need somebackground on an intellectual concept.
Joyce, C. Alan, ed. 2007. The World Almanac and Book of Facts 2008. Mahwah, New Jersey:World Almanac Books. A “must have” reference. It comes out every year, and is chock full ofuseful information <http://www.worldalmanac.com>.
Lide, David R., ed. 2007. CRC Handbook of Chemistry and Physics. 88th ed. Boca Raton,Florida: CRC Press, Inc. The best source for physical constants and conversions. CRC also hasmany other technical and scientific reference works. Earlier editions (still useful) can be boughtused.
Simpson, John and Edmund Weiner, eds. 2002. The Oxford English Dictionary. Oxford, UK:Oxford University Press. 2d edition. This reference work takes up 20 volumes and 22,000pages! This version costs about $1,000 used, but you can get a complete version with verysmall type for about $40 used (it comes with its own powerful magnifying glass). A betterchoice is the CD-ROM version, available for both Windows and Macintosh for about $200.
Sutcliffe, Andrea. 1996. Numbers: How many, How Long, How Far, How Much. New York,NY: Stonesong Press, Inc. Another good sourcebook for all sorts of helpful data.
U.S. Bureau of the Census. 2008. The Statistical Abstract of the United States 2008. 127th edi-tion Washington D.C.: U.S. Government Printing Office. One of the most important datasources for any U.S. researcher.
Worldwatch Institute. 2007. Vital Signs 2007–2008: The Trends That Are Shaping Our Future.New York, NY: W.W. Norton and Co. Tons of good time-series data on environmental andtechnology trends. Worldwatch also sells these data in electronic form in both Windows andMacintosh formats. <http://www.worldwatch.org>
10 • Value Your Time
Covey, Stephen R. 2004. The 7 Habits of Highly Effective People. 15th Anniversary edition. NY,NY: Free Press. Covey is a highly successful “personal growth” guru who doles out advice fora living. His book helps you explore how your life patterns thwart or facilitate success.
DeMarco, Tom, and Timothy Lister. 1999. Peopleware: Productive Projects and Teams. 2nd ed.New York, NY: Dorset House Publishing Company. A superb book that uses real-world expe-rience to explode dozens of management myths. If you manage creative people, you owe it tothem and to yourself to read this book.
Dominguez, Joe and Vicki Robin. 1999. Your Money or Your Life: Transforming Your Relation-ship with Money and Achieving Financial Independence. New York, NY: Penguin Books.Includes a clear and persuasive statement of how money, time, and your life are intimatelyconnected.
Hyams, Joe. 1982. Zen in the Martial Arts. New York, NY: Bantam Books. The chapter titled“Do not disturb” describes how Hyams and his martial arts colleagues take command of theirtime.
FURTHER READING • 229
Thich Nhat Hanh. 1991. Peace is Every Step: The Path of Mindfulness in Everyday Life. NewYork, NY: Bantam Books. This book advocates awareness in every waking moment of everyday, so you never forget how amazing the world is. Sadly, most of us forget this all the time.
Thoreau, Henry David. 1971. Thoreau: Walden and Other Writings. New York, NY: BantamBooks, Inc. Joseph Wood Krutch, ed. Contains Thoreau’s musings during his stay at WaldenPond.
PA RT I I I • A S S E S S T H E I R A N A LYS I S
General
Best, Joel. 2001. Damned Lies and Statistics: Untangling Numbers from the Media, Politicians,and Activists. Berkeley, CA: University of California Press. This brilliant book gives insightinto how to recognize mutant statistics, apples and oranges comparisons, and other commonissues with numbers. It also teaches a critical approach to avoiding such pitfalls.
Huff, Darrell. 1993. How to Lie with Statistics. New York, NY: W. W. Norton & Co., Inc.There’s no better exposé of commonly used tricks that mislead and misrepresent than thisbook.
Hughes, William. 1997. Critical Thinking: An Introduction to the Basic Skills. 2d Peterborough,Ontario: Broadview Press. Hughes presents examples and exercises to explore and categorizethe logical fallacies that befall most arguments.
Lieber, Hugh Gray, and Lillian R. Lieber. 1944. The Education of T. C. MITS. New York: W. W.Norton & Company, Inc. This book is an entertaining excursion into mathematics, logic, andargument. Though it’s dated in some ways, it’s still worth reading.
Moroney, M. J. 1953. Facts From Figures. Harmondsworth, Middlesex, UK: Penguin Books Ltd.Another book from long ago, it’s one of the best I’ve seen at explaining the practice of statis-tical analysis in the real world. It uses dozens of examples to illustrate statistical concepts, andwhile it can be technical at times, even lay readers will learn quickly from it.
11 • The Power of Critical Thinking
Gilovich, Thomas. 1991. How We Know What Isn’t So: The Fallibility of Human Reason inEveryday Life. New York, NY: The Free Press. This book documents, categorizes, andexplains errors of reasoning common to human beings. It also describes how best to challengedubious beliefs once they become manifest.
Hughes, William. 1997. Critical Thinking: An Introduction to the Basic Skills. 2d Peterborough,Ontario: Broadview Press. On pages 108-110 of this outstanding book, Hughes gives his sevenrules for assessing arguments.
Hammond, John S., Ralph L. Keeney, and Howard Raiffa. 1999. Smart Choices: A PracticalGuide to Making Better Decisions. Boston, MA: Harvard Business School Press. A methodi-cal guide to thinking through your choices.
Mayfield, Marlys. 2006. Thinking for Yourself: Developing Critical Thinking Skills ThroughReading and Writing. 7th ed. Belmont, CA: Heinle Publishing. A superb textbook that teachesclear writing and critical thinking using examples and exercises.
Stebbing, L. Susan. 1961. Thinking to Some Purpose. Harmondsworth, Middlesex, UK: Pelican.This book marries critical thinking and rhetoric in an exemplary way.
230 • TURNING NUMBERS INTO KNOWLEDGE
12 • Numbers Aren’t Everything
Bella, David A. 1979. “Technological Constraints on Technological Optimism.” TechnologicalForecasting and Social Change. vol. 14, p. 15. An article that uses the methods of science andmathematics to show why social and environmental problems generated by technology can bedifficult to solve.
Jonas, Hans. 1973. “Technology and Responsibility: Reflections on the New Task of Ethics.”Social Research. vol. 40, no. 1. p. 31. This article addresses ethical issues that affect moderntechnological societies that for the first time have the power to effect changes in the naturalenvironment in a global way. As technology changes what it means to be human, Jonas arguesthat contemporary ethics must keep pace.
13 • All Numbers Are Not Created Equal
DeCanio, Stephen. 2003. Economic Models of Climate Change: A Critique. Basingstoke, UK:Palgrave-MacMillan. A cogent and readable analysis of the problems with economic models.
Schwartz, Peter. 1996. The Art of the Long View: Planning for the Future in an Uncertain World.New York, NY: Doubleday. The classic book on scenario analysis. A “must read” book foranyone trying to think systematically about the future.
14 • Question Authority
Brandt, Allan M. 2007. The Cigarette Century: The Rise, Fall, and Deadly Persistence of theProduct that Defined America. New York, NY: Basic Books. A brilliant and comprehensivehistory of the anti-social behavior of one of America’s most important industries.
Cialdini, Robert B. 2006. Influence: The Psychology of Persuasion. 1st Collins Business Essentialsedition. New York, NY: Collins. An extraordinary book that documents how “complianceprofessionals” influence people’s opinions and actions.
Crossen, Cynthia. 1994. Tainted Truth: The Manipulation of Fact in America. New York, NY:Simon & Schuster. Another eye opener that shows how people and institutions can and doplay with numbers to convince and confuse.
Hughes, William. 1997. Critical Thinking: An Introduction to the Basic Skills. 2d Peterborough,Ontario: Broadview Press. Hughes presents detailed criteria for assessing the strength ofappeals to authority.
Robbins, John. 1998. Diet for a New America. Tiburon, CA: HJ Kramer Inc. Whatever you thinkabout Robbins’ advocacy of a vegetarian diet, his description of how the dairy and meat indus-tries got schools and other public institutions to distribute their marketing materials is a realeye opener.
16 • Don’t Believe Everything You Read
Brandt, Allan M. 2007. The Cigarette Century: The Rise, Fall, and Deadly Persistence of theProduct that Defined America. New York, NY: Basic Books. The stories in this book willmake you skeptical of pronouncements by those with an axe to grind.
Crossen, Cynthia. 1994. Tainted Truth: The Manipulation of Fact in America. New York, NY:Simon & Schuster. Crossen summarizes how the results of research are often manipulated forself-serving ends.
Ewen, Stuart. 1996. PR! A Social History of Spin. New York, NY: Basic Books, a member of thePerseus Books Group. This book recounts the development of public relations and propa-ganda in the Twentieth Century. It is an intriguing and well-told tale.
FURTHER READING • 231
Huff, Darrell. 1993. How to Lie with Statistics. New York, NY: W. W. Norton & Co., Inc. If thisbook doesn’t make you a skeptical observer of numbers and statistics, nothing will. First pub-lished in the 1950s, it’s still fresh and useful today.
17 • Go Back to the Questions
Crossen, Cynthia. 1994. Tainted Truth: The Manipulation of Fact in America. New York, NY:Simon & Schuster. Crossen demonstrates how research has become a tool for hucksters tomake friends and influence people.
Weiss, Michael J. 1994. Latitudes and Attitudes: An Atlas of American Tastes, Trends, Politics,and Passions. New York, NY: Little Brown and Company. This book is a beautiful summaryof consumer and market data. It shows the power of comprehensive consumer surveys todescribe consumer preferences across the U.S.
18 • Reading Tables and Graphs
Tufte, Edward R. 2001. The Visual Display of Quantitative Information. 2nd ed. Cheshire, CT:Graphics Press. Fourteenth printing. Reading this book will change the way you look at tablesand graphs, and it is required reading for those learning this craft.
19 • Distinguish Facts from Values
Booth, Wayne C., Joseph M. Williams and Gregory G. Colomb. 2003. The Craft of Research.2nd ed. Chicago, IL: The University of Chicago Press. This superb book presents a frameworkfor dissecting arguments that can be applied in most situations. The authors were trained inrhetoric and literature, but their way of thinking about claims and evidence applies equallywell to technical topics.
Fuchs, Victor R., Alan B. Krueger and James M. Poterba. 1997. Why Do Economists DisagreeAbout Policy? The Roles of Beliefs About Parameters and Values. Princeton University,Industrial Relations Section. Working Paper #389. August.
Jonas, Hans. 1973. “Technology and Responsibility: Reflections on the New Task of Ethics.” SocialResearch. vol. 40, no. 1. p. 31. This article, more than any other I read in graduate school, gotme to think carefully about how technology can challenge some of our most deeply held values.
Marshall, Jonathan. 1997. “Economists Can’t Seem to Agree on Anything.” The SF Chronicle,August 25, 1997, p. B2.
Reich, Robert. 1997. Locked in the Cabinet. New York, NY: Alfred A. Knopf. Regardless of yourpolitical leanings, you’ll enjoy Reich’s tales of political intrigue, error, and innuendo in theClinton White House.
Wilber, Ken. 1998. The Marriage of Sense and Soul: Integrating Science and Religion. New York,NY: Broadway Books. Wilber provides a philosophical framework for understanding howfacts should relate to values, using the term “exterior” to describe the measurable world offacts and the word “interior” to describe the world of ideas and values.
20 • The Uncertainty Principle and the Mass Media
Cialdini, Robert B. 2006. Influence: The Psychology of Persuasion. 1st Collins Business Essentialsedition. New York, NY: Collins. Cialdini’s book shows how “compliance professionals” usetheir knowledge of the human psyche to influence people’s decisions.
Crossen, Cynthia. 1994. Tainted Truth: The Manipulation of Fact in America. New York, NY:

232 • TURNING NUMBERS INTO KNOWLEDGE
Simon & Schuster. Crossen gives dozens of examples of how the results of research and report-ing can be manipulated for good or ill.
Fuller, Jack. 1996. News Values: Ideas for an Information Age. Chicago, IL: University ofChicago Press. Fuller explores how new technologies continue to change the role of the jour-nalist in modern society.
Levering, Robert, and Milton Moskowitz. 1994. The 100 Best Companies to Work for inAmerica. Plume Publishing. This is the 1994 edition of their book, which was first publishedin 1984.
PA RT I V • C R E AT E YO U R A N A LYS I S
21 • Reflect
Hyams, Joe. 1982. Zen in the Martial Arts. New York, NY: Bantam Books.Mattimore, Bryan W. 1994. 99% Inspiration: Tips, Tales & Techniques for Liberating Your
Business Creativity. New York, NY: AMACOM (A Division of American ManagementAssociation).
Ueland, Brenda. 2007. If You Want to Write: A Book About Art, Independence, and Spirit. St.Paul, Minnesota: Graywolf Press.
22 • Get Unstuck
Elffers, Joost. 2002. Play with Your Food. New York, NY: Metro Books. This book encouragesyou to think about food in a way you never have before. If you really get stuck, get this bookand play until you’re ready to get back to the problem.
Mattimore, Bryan W. 1994. 99% Inspiration: Tips, Tales & Techniques for Liberating YourBusiness Creativity. New York, NY: AMACOM (A Division of American ManagementAssociation). This book is a treasure trove of ideas for becoming more productive.
Polya, G. 2004. How to Solve It: A New Aspect of Mathematical Method. Princeton, N.J.:Princeton University Press. A serious but approachable book about problem solving. It’s a realclassic!
23 • Inquire
Berkman, Robert I. 2000. Find It Fast: How to Uncover Expert Information In Any Subject,Online or in Print. New York, NY: Collins. One researcher’s tricks to digging out informationin the real world.
Borchert, Donald M., ed. 2006. The Encyclopedia of Philosophy. 2nd ed. New York, NY:Macmillan Reference Books. Volumes 1 through 10. This set is an essential desk reference thatdescribes the historical development of ideas. It can lend context to your research availablenowhere else.
U.S. Bureau of the Census. 2008. The Statistical Abstract of the United States 2008. 127th edi-tion Washington D.C.: U.S. Government Printing Office. One of the most important datasources for any U.S. researcher.
The Encyclopedia Brittanica. The hard copy of this encyclopedia costs about $1400, but the elec-tronic versions are a much better deal. A multimedia CD-ROM version costs less than $100 (forboth Windows and Macintosh), and a subscription-based web version <http://www.eb.com> isalso available. Other encyclopedias offer similar deals.
FURTHER READING • 233
24 • Be a Detective
Sir Arthur Conan Doyle. A Study in Scarlet. This novel, in which Conan Doyle created the mod-ern detective, first brought Sherlock Holmes into English literature. It’s a gripping, well-toldstory, and one in which the scientific method features prominently. Contained in Baring-Gould, William S. ed. 1976. The Annotated Sherlock Holmes. Volume I. New York, NY:Clarkson N. Potter, Inc./Publisher. 15th printing. pp. 143-234.
25 • Create Consistent Comparisons
Koomey, Jonathan G., Deborah E. Schechter and Deborah Gordon. 1993. Cost-Effectiveness ofFuel Economy Improvements in 1992 Honda Civic Hatchbacks. Energy and ResourcesGroup, University of California, Berkeley. Presented at the 72nd Annual meeting of theNational Research Council’s Transportation Research Board, January 10-14, 1993,Washington, DC. May 1993. Download the report in PDF format at <http://enduse.lbl.gov/Info/Honda-abstract.html>.
26 • Tell a Good Story
Denning, Stephen. 2005. The Leader’s Guide to Storytelling: Mastering the Art and Discipline ofBusiness Narrative. San Francisco, CA: Jossey-Bass, A Wiley Imprint. Denning spent yearsstudying how stories could help leaders change organizations, and this excellent book sum-marizes what he learned.
Ghanadan, Rebecca, and Jonathan Koomey. 2005. “Using Energy Scenarios to ExploreAlternative Energy Pathways in California.” Energy Policy. vol. 33, no. 9. June. pp. 1117-1142. This refereed journal article gives an extensive description of the scenario creationprocess, accompanied by graphics that help illustrate the approach.
Heath, Chip, and Dan Heath. 2007. Made to Stick: Why Some Ideas Survive and Others Die.New York, NY: Random House. Simple, unexpected, concrete, credible and emotional storiesare the ones that stick, and this book will help you create them.
Morgan, M. Granger, and Max Henrion. 1992. Uncertainty: A Guide to Dealing withUncertainty in Quantitative Risk and Policy Analysis. New York, NY: Cambridge UniversityPress. Analyzing uncertainty is key to technical story telling.
Schwartz, Peter. 1996. The Art of the Long View: Planning for the Future in an Uncertain World.New York, NY: Doubleday. The classic book on building scenarios.
27 • Dig into the Numbers
Cook, Terry. 1995. “It’s 10 O’Clock: Do You Know Where Your Data Are?” Technology Review.January. p. 48. An insightful article that discusses some unprecedented problems with datathat we face in the information age.
28 • Make a Model
Bernstein, Peter L. 1998. Against the Gods: The Remarkable Story of Risk. New York, NY: JohnWiley and Sons. This wonderful book tells how modern society learned to “put the future atthe service of the present” by mastering risk and the tools needed to understand it.
Keepin, William (Bill). 1983. A Critical Appraisal of the IIASA Energy Scenarios. InternationalInstitute for Applied Systems Analysis. WP-83-104. October. The complete documentation forKeepin’s criticisms of the IIASA scenarios.
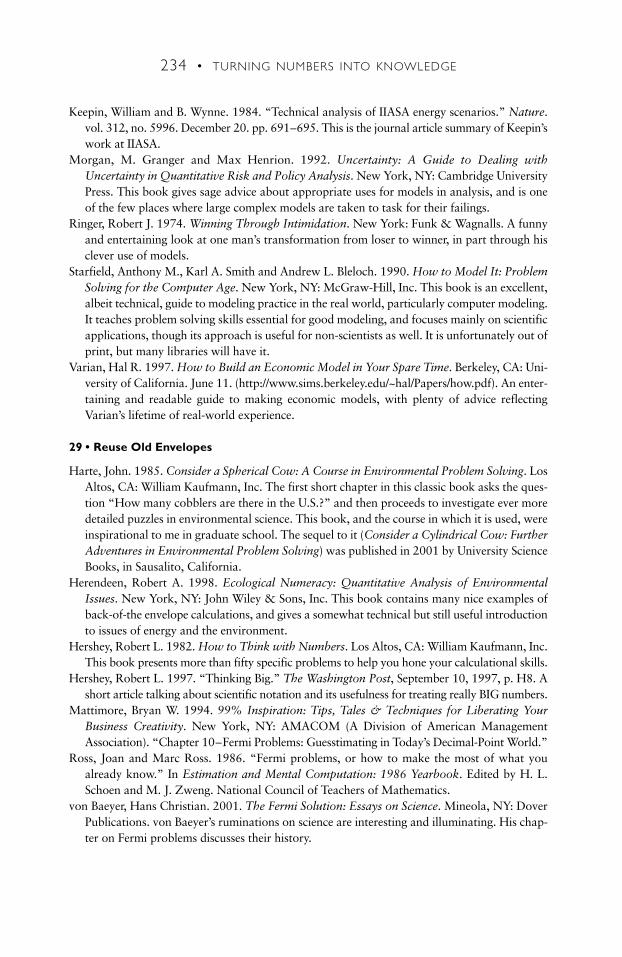
234 • TURNING NUMBERS INTO KNOWLEDGE
Keepin, William and B. Wynne. 1984. “Technical analysis of IIASA energy scenarios.” Nature.vol. 312, no. 5996. December 20. pp. 691–695. This is the journal article summary of Keepin’swork at IIASA.
Morgan, M. Granger and Max Henrion. 1992. Uncertainty: A Guide to Dealing withUncertainty in Quantitative Risk and Policy Analysis. New York, NY: Cambridge UniversityPress. This book gives sage advice about appropriate uses for models in analysis, and is oneof the few places where large complex models are taken to task for their failings.
Ringer, Robert J. 1974. Winning Through Intimidation. New York: Funk & Wagnalls. A funnyand entertaining look at one man’s transformation from loser to winner, in part through hisclever use of models.
Starfield, Anthony M., Karl A. Smith and Andrew L. Bleloch. 1990. How to Model It: ProblemSolving for the Computer Age. New York, NY: McGraw-Hill, Inc. This book is an excellent,albeit technical, guide to modeling practice in the real world, particularly computer modeling.It teaches problem solving skills essential for good modeling, and focuses mainly on scientificapplications, though its approach is useful for non-scientists as well. It is unfortunately out ofprint, but many libraries will have it.
Varian, Hal R. 1997. How to Build an Economic Model in Your Spare Time. Berkeley, CA: Uni-versity of California. June 11. (http://www.sims.berkeley.edu/~hal/Papers/how.pdf). An enter-taining and readable guide to making economic models, with plenty of advice reflectingVarian’s lifetime of real-world experience.
29 • Reuse Old Envelopes
Harte, John. 1985. Consider a Spherical Cow: A Course in Environmental Problem Solving. LosAltos, CA: William Kaufmann, Inc. The first short chapter in this classic book asks the ques-tion “How many cobblers are there in the U.S.?” and then proceeds to investigate ever moredetailed puzzles in environmental science. This book, and the course in which it is used, wereinspirational to me in graduate school. The sequel to it (Consider a Cylindrical Cow: FurtherAdventures in Environmental Problem Solving) was published in 2001 by University ScienceBooks, in Sausalito, California.
Herendeen, Robert A. 1998. Ecological Numeracy: Quantitative Analysis of EnvironmentalIssues. New York, NY: John Wiley & Sons, Inc. This book contains many nice examples ofback-of-the envelope calculations, and gives a somewhat technical but still useful introductionto issues of energy and the environment.
Hershey, Robert L. 1982. How to Think with Numbers. Los Altos, CA: William Kaufmann, Inc.This book presents more than fifty specific problems to help you hone your calculational skills.
Hershey, Robert L. 1997. “Thinking Big.” The Washington Post, September 10, 1997, p. H8. Ashort article talking about scientific notation and its usefulness for treating really BIG numbers.
Mattimore, Bryan W. 1994. 99% Inspiration: Tips, Tales & Techniques for Liberating YourBusiness Creativity. New York, NY: AMACOM (A Division of American ManagementAssociation). “Chapter 10–Fermi Problems: Guesstimating in Today’s Decimal-Point World.”
Ross, Joan and Marc Ross. 1986. “Fermi problems, or how to make the most of what youalready know.” In Estimation and Mental Computation: 1986 Yearbook. Edited by H. L.Schoen and M. J. Zweng. National Council of Teachers of Mathematics.
von Baeyer, Hans Christian. 2001. The Fermi Solution: Essays on Science. Mineola, NY: DoverPublications. von Baeyer’s ruminations on science are interesting and illuminating. His chap-ter on Fermi problems discusses their history.
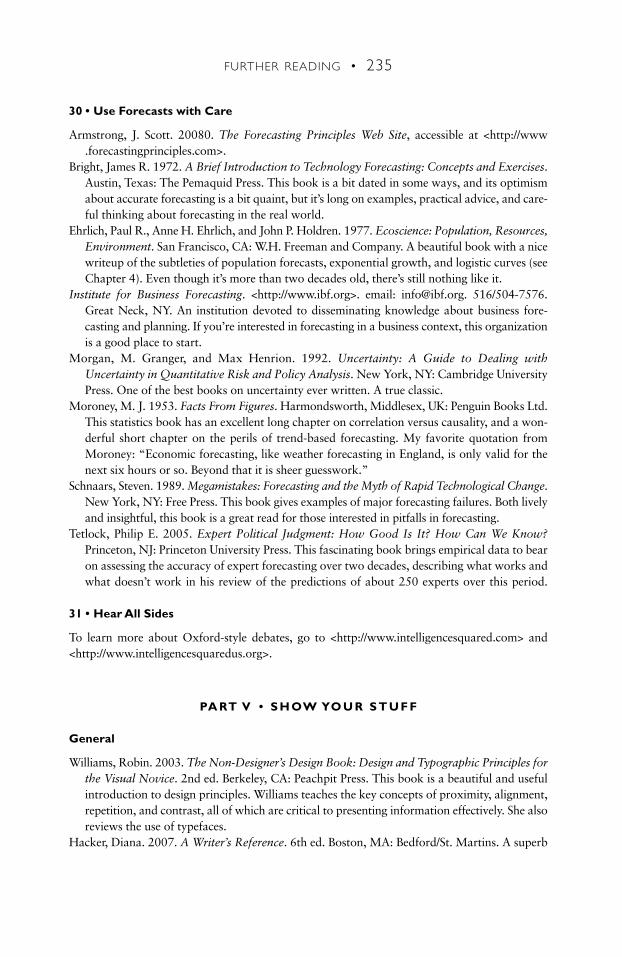
FURTHER READING • 235
30 • Use Forecasts with Care
Armstrong, J. Scott. 20080. The Forecasting Principles Web Site, accessible at <http://www .forecastingprinciples.com>.
Bright, James R. 1972. A Brief Introduction to Technology Forecasting: Concepts and Exercises.Austin, Texas: The Pemaquid Press. This book is a bit dated in some ways, and its optimismabout accurate forecasting is a bit quaint, but it’s long on examples, practical advice, and care-ful thinking about forecasting in the real world.
Ehrlich, Paul R., Anne H. Ehrlich, and John P. Holdren. 1977. Ecoscience: Population, Resources,Environment. San Francisco, CA: W.H. Freeman and Company. A beautiful book with a nicewriteup of the subtleties of population forecasts, exponential growth, and logistic curves (seeChapter 4). Even though it’s more than two decades old, there’s still nothing like it.
Institute for Business Forecasting. <http://www.ibf.org>. email: [email protected]. 516/504-7576.Great Neck, NY. An institution devoted to disseminating knowledge about business fore-casting and planning. If you’re interested in forecasting in a business context, this organizationis a good place to start.
Morgan, M. Granger, and Max Henrion. 1992. Uncertainty: A Guide to Dealing withUncertainty in Quantitative Risk and Policy Analysis. New York, NY: Cambridge UniversityPress. One of the best books on uncertainty ever written. A true classic.
Moroney, M. J. 1953. Facts From Figures. Harmondsworth, Middlesex, UK: Penguin Books Ltd.This statistics book has an excellent long chapter on correlation versus causality, and a won-derful short chapter on the perils of trend-based forecasting. My favorite quotation fromMoroney: “Economic forecasting, like weather forecasting in England, is only valid for thenext six hours or so. Beyond that it is sheer guesswork.”
Schnaars, Steven. 1989. Megamistakes: Forecasting and the Myth of Rapid Technological Change.New York, NY: Free Press. This book gives examples of major forecasting failures. Both livelyand insightful, this book is a great read for those interested in pitfalls in forecasting.
Tetlock, Philip E. 2005. Expert Political Judgment: How Good Is It? How Can We Know?Princeton, NJ: Princeton University Press. This fascinating book brings empirical data to bearon assessing the accuracy of expert forecasting over two decades, describing what works andwhat doesn’t work in his review of the predictions of about 250 experts over this period.
31 • Hear All Sides
To learn more about Oxford-style debates, go to <http://www.intelligencesquared.com> and<http://www.intelligencesquaredus.org>.
PA RT V • S H OW YO U R S T U F F
General
Williams, Robin. 2003. The Non-Designer’s Design Book: Design and Typographic Principles forthe Visual Novice. 2nd ed. Berkeley, CA: Peachpit Press. This book is a beautiful and usefulintroduction to design principles. Williams teaches the key concepts of proximity, alignment,repetition, and contrast, all of which are critical to presenting information effectively. She alsoreviews the use of typefaces.
Hacker, Diana. 2007. A Writer’s Reference. 6th ed. Boston, MA: Bedford/St. Martins. A superb
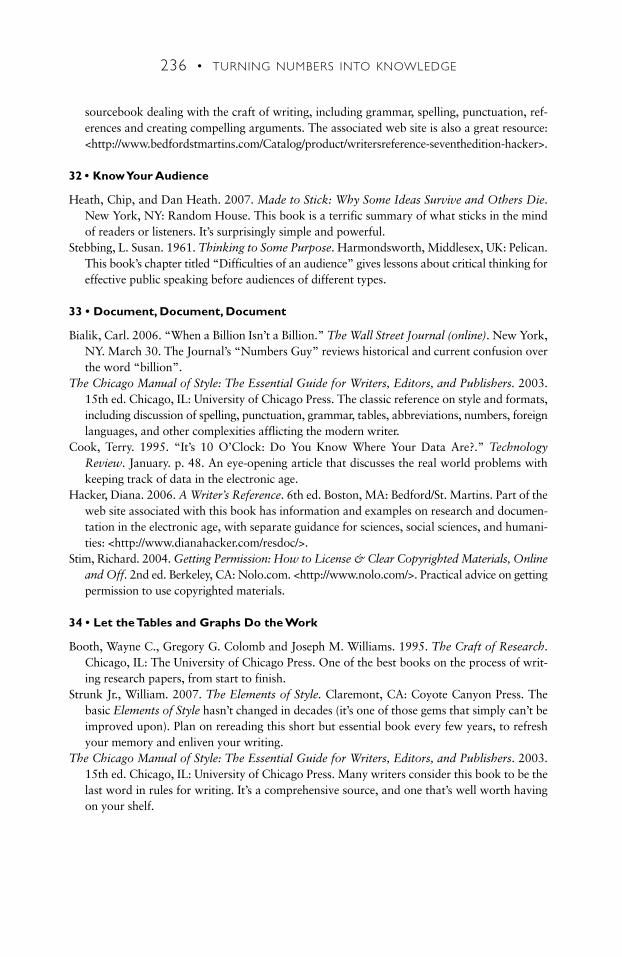
236 • TURNING NUMBERS INTO KNOWLEDGE
sourcebook dealing with the craft of writing, including grammar, spelling, punctuation, ref-erences and creating compelling arguments. The associated web site is also a great resource:<http://www.bedfordstmartins.com/Catalog/product/writersreference-seventhedition-hacker>.
32 • Know Your Audience
Heath, Chip, and Dan Heath. 2007. Made to Stick: Why Some Ideas Survive and Others Die.New York, NY: Random House. This book is a terrific summary of what sticks in the mindof readers or listeners. It’s surprisingly simple and powerful.
Stebbing, L. Susan. 1961. Thinking to Some Purpose. Harmondsworth, Middlesex, UK: Pelican.This book’s chapter titled “Difficulties of an audience” gives lessons about critical thinking foreffective public speaking before audiences of different types.
33 • Document, Document, Document
Bialik, Carl. 2006. “When a Billion Isn’t a Billion.” The Wall Street Journal (online). New York,NY. March 30. The Journal’s “Numbers Guy” reviews historical and current confusion overthe word “billion”.
The Chicago Manual of Style: The Essential Guide for Writers, Editors, and Publishers. 2003.15th ed. Chicago, IL: University of Chicago Press. The classic reference on style and formats,including discussion of spelling, punctuation, grammar, tables, abbreviations, numbers, foreignlanguages, and other complexities afflicting the modern writer.
Cook, Terry. 1995. “It’s 10 O’Clock: Do You Know Where Your Data Are?.” TechnologyReview. January. p. 48. An eye-opening article that discusses the real world problems withkeeping track of data in the electronic age.
Hacker, Diana. 2006. A Writer’s Reference. 6th ed. Boston, MA: Bedford/St. Martins. Part of theweb site associated with this book has information and examples on research and documen-tation in the electronic age, with separate guidance for sciences, social sciences, and humani-ties: <http://www.dianahacker.com/resdoc/>.
Stim, Richard. 2004. Getting Permission: How to License & Clear Copyrighted Materials, Onlineand Off. 2nd ed. Berkeley, CA: Nolo.com. <http://www.nolo.com/>. Practical advice on gettingpermission to use copyrighted materials.
34 • Let the Tables and Graphs Do the Work
Booth, Wayne C., Gregory G. Colomb and Joseph M. Williams. 1995. The Craft of Research.Chicago, IL: The University of Chicago Press. One of the best books on the process of writ-ing research papers, from start to finish.
Strunk Jr., William. 2007. The Elements of Style. Claremont, CA: Coyote Canyon Press. Thebasic Elements of Style hasn’t changed in decades (it’s one of those gems that simply can’t beimproved upon). Plan on rereading this short but essential book every few years, to refreshyour memory and enliven your writing.
The Chicago Manual of Style: The Essential Guide for Writers, Editors, and Publishers. 2003.15th ed. Chicago, IL: University of Chicago Press. Many writers consider this book to be thelast word in rules for writing. It’s a comprehensive source, and one that’s well worth havingon your shelf.
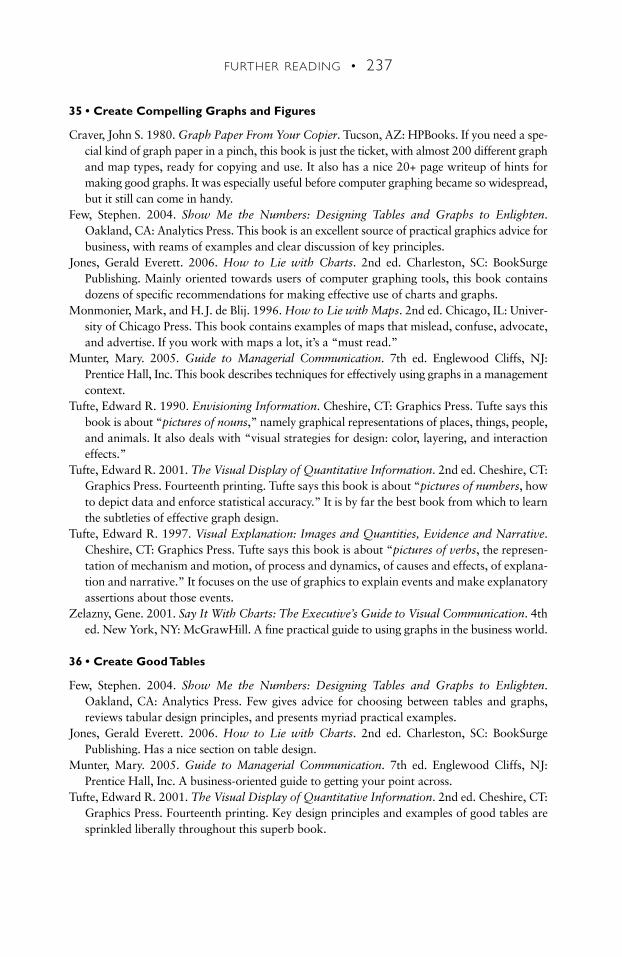
FURTHER READING • 237
35 • Create Compelling Graphs and Figures
Craver, John S. 1980. Graph Paper From Your Copier. Tucson, AZ: HPBooks. If you need a spe-cial kind of graph paper in a pinch, this book is just the ticket, with almost 200 different graphand map types, ready for copying and use. It also has a nice 20+ page writeup of hints formaking good graphs. It was especially useful before computer graphing became so widespread,but it still can come in handy.
Few, Stephen. 2004. Show Me the Numbers: Designing Tables and Graphs to Enlighten.Oakland, CA: Analytics Press. This book is an excellent source of practical graphics advice forbusiness, with reams of examples and clear discussion of key principles.
Jones, Gerald Everett. 2006. How to Lie with Charts. 2nd ed. Charleston, SC: BookSurgePublishing. Mainly oriented towards users of computer graphing tools, this book containsdozens of specific recommendations for making effective use of charts and graphs.
Monmonier, Mark, and H.J. de Blij. 1996. How to Lie with Maps. 2nd ed. Chicago, IL: Univer-sity of Chicago Press. This book contains examples of maps that mislead, confuse, advocate,and advertise. If you work with maps a lot, it’s a “must read.”
Munter, Mary. 2005. Guide to Managerial Communication. 7th ed. Englewood Cliffs, NJ:Prentice Hall, Inc. This book describes techniques for effectively using graphs in a managementcontext.
Tufte, Edward R. 1990. Envisioning Information. Cheshire, CT: Graphics Press. Tufte says thisbook is about “pictures of nouns,” namely graphical representations of places, things, people,and animals. It also deals with “visual strategies for design: color, layering, and interactioneffects.”
Tufte, Edward R. 2001. The Visual Display of Quantitative Information. 2nd ed. Cheshire, CT:Graphics Press. Fourteenth printing. Tufte says this book is about “pictures of numbers, howto depict data and enforce statistical accuracy.” It is by far the best book from which to learnthe subtleties of effective graph design.
Tufte, Edward R. 1997. Visual Explanation: Images and Quantities, Evidence and Narrative.Cheshire, CT: Graphics Press. Tufte says this book is about “pictures of verbs, the represen-tation of mechanism and motion, of process and dynamics, of causes and effects, of explana-tion and narrative.” It focuses on the use of graphics to explain events and make explanatoryassertions about those events.
Zelazny, Gene. 2001. Say It With Charts: The Executive’s Guide to Visual Communication. 4thed. New York, NY: McGrawHill. A fine practical guide to using graphs in the business world.
36 • Create Good Tables
Few, Stephen. 2004. Show Me the Numbers: Designing Tables and Graphs to Enlighten.Oakland, CA: Analytics Press. Few gives advice for choosing between tables and graphs,reviews tabular design principles, and presents myriad practical examples.
Jones, Gerald Everett. 2006. How to Lie with Charts. 2nd ed. Charleston, SC: BookSurgePublishing. Has a nice section on table design.
Munter, Mary. 2005. Guide to Managerial Communication. 7th ed. Englewood Cliffs, NJ:Prentice Hall, Inc. A business-oriented guide to getting your point across.
Tufte, Edward R. 2001. The Visual Display of Quantitative Information. 2nd ed. Cheshire, CT:Graphics Press. Fourteenth printing. Key design principles and examples of good tables aresprinkled liberally throughout this superb book.
Williams, Robin. 2003. The Non-Designer’s Design Book: Design and Typographic Principlesfor the Visual Novice. 2nd ed. Berkeley, CA: Peachpit Press. The design principles in thisbook (including its introduction to typefaces) are especially pertinent to designing goodtables.
37 • Use Numbers Effectively in Oral Presentations
Heath, Chip, and Dan Heath. 2007. Made to Stick: Why Some Ideas Survive and Others Die.New York, NY: Random House. Effective speakers tell stories, and this book teaches how tomake them stick in your listeners’ minds.
Jones, Gerald Everett. 2006. How to Lie with Charts. 2nd ed. Charleston, SC: BookSurgePublishing. Gives specific advice on using tables and graphs in oral presentations.
Osgood, Charles. 1988. Osgood on Speaking: How to Think on Your Feet Without Falling onYour Face. New York, NY: William Morrow and Company, Inc. One of the best books on theart of public speaking.
Tufte, Edward R. 1997. Visual Explanation: Images and Quantities, Evidence and Narrative.Cheshire, CT: Graphics Press. In this book, Tufte derives lessons from magicians and illu-sionists to teach good presentation skills (see pp. 68-70).
38 • Use the Internet
Anderson, Chris. 2006. The Long Tail: Why the Future of Business is Selling Less of More. NewYork, NY: Hyperion. The Internet age has transformed business in many ways, one of whichis the movement away from geography and shelf space as primary determinants of the avail-ability of goods. This shift allows business to profitably deliver low-volume products that weresimply unavailable to consumers when shelf space was at a premium. “The Long Tail”describes this transformation.
Andersson, Eve, Philip Greenspun, and Andrew Grumet. 2006. Software Engineering forInternet Applications. Cambridge, MA: MIT Press. Covers some of the same ground asGreenspun’s earlier book, but is more of a textbook and is more up-to-date. For those design-ing serious Internet applications, it’s a must read.
Apple Computer. 1992. Macintosh Human Interface Guidelines. Reading, MA: Addison-WesleyPublishing Company. This book gives general information on how computers and humanscan most peacefully coexist. The general principles it espouses are useful regardless of whichoperating system you favor.
Barabasi, Albert-Laszlo. 2003. Linked: How Everything is Connected to Everything Else andWhat It Means for Business, Science, and Everyday Life. New York, NY: Plume, a memberof Penguin Group (USA). This brilliant book describes the structural similarities of networksthat appear on the surface to be quite distinct, including the Internet, the World Wide Web,citation networks, human networks, and the genetic code. Barabasi’s brilliant review of the lit-erature describes how “scale-free” networks are transforming the face of business.
Burke, James. 2007. Connections. New York, NY: Simon & Schuster. An outstanding book.Among other things, Burke describes the key role of the printing press in fostering later tech-nological and scientific developments.
Greenspun, Philip. 1999. Phil and Alex’s Guide to Web Publishing. San Francisco, CA: MorganKauffman. While somewhat technical in parts, this is absolutely the best book for people inter-ested in making the web useful. It’s also a beautiful coffee table book. For the on-line version,see <http://philip.greenspun.com/panda/>.
238 • TURNING NUMBERS INTO KNOWLEDGE

Norman, Donald A. 1990. The Design of Everyday Things. New York, NY: Doubleday/Currency. This book yields important lessons for interface design of just about everything.Don’t miss it.
Tapscott, Don, and Anthony D. Williams. 2006. Wikinomics: How Mass Collaboration ChangesEverything. New York, NY: Portfolio, a member of the Penguin Group USA. This fascinat-ing book documents new collaboration technologies and techniques in a highly readable way.
Williams, Robin. 2003. The Non-Designer’s Design Book : Design and Typographic Principlesfor the Visual Novice. 2nd ed. Berkeley, CA: Peachpit Press. This book is a wonderful intro-duction to design principles, many of which apply directly to web design.
Williams, Robin and John Tollett. 2005. The Non-Designer’s Web Book: An Easy Guide toCreating, Designing, and Posting Your Own Web Site. 3rd ed. Berkeley, CA: Peachpit Press.A delightful and easy to read book that gives you the basics of web design and implementa-tion, dealing with nitty-gritty details of file formats, typography, colors, effective design strate-gies, and all sorts of other stuff.
39 • Share and Share Alike
American Library Association. 1999. Task Force on Metadata Summary Report. Committee onCataloging: Description & Access, Association for Library Collections & Technical Services,American Library Association. CC: DA/TF/Metadata/4. June. <http://www.libraries.psu.edu/tas/jca/ccda/tf-meta3.html>. This document gives a precise definition of metadata.
Berners-Lee, Tim, James Hendler, and Ora Lassila. 2001. “The Semantic Web” In ScientificAmerican. May. pp. 34–43. This reference is the seminal one on the Semantic Web. For morebackground and details on the latest developments, go to <http://www.w3.org/2001/sw/>,<http://infomesh.net/2001/swintro/>, and <http://en.wikipedia.org/wiki/Semantic_Web>.
Solove, Daniel J. 2007. The Future of Reputation: Gossip, Rumor, and Privacy on the Internet.New Haven, CT: Yale University Press. The focus of this book is more on personal than pro-fessional reputation, but it’s still an important one on this topic.
E P I L O G U E • S O M E PA RT I N G T H O U G H T S
Baer, Walter S., Scott Hassell, and Ben Vollaard. 2002. Electricity Requirements for a DigitalSociety. RAND Corporation. MR-1617-DOE, ISBN 0-8330-3279-8. <http://www.rand.org/publications/MR/MR1617/>. This report analyzes current and projects future electricity useby electronic devices. It showed that electricity used by computers and office equipment wasonly a few percent of the total in 2000 and could not possibly grow to 50% of the total in tenor twenty years.
Holdren, John P. 2002. “Skepticism toward The Skeptical Environmentalist”. ScientificAmerican.com, April 15. <http://www.sciam.com/>. Holdren summarized his refutation of BjornLomborg’s book in this article.
Huber, Peter, and Mark P. Mills. 1999. “Dig more coal—the PCs are coming.” In Forbes. May31. pp. 70–72. Forbes started the frenzy over electricity used by the Internet by publishing thisarticle.
Huber, Peter, and Mark P. Mills. 2000. “Got a Computer? More Power to You.” Wall StreetJournal. New York, NY. September 7. p. A26. This article contained the assertion about the net-working electricity for a wireless Palm Pilot being equal to that of a residential refrigerator.
Huber, Peter, and Mark P. Mills. 2005. The Bottomless Well: The Twilight of Fuel, the Virtue of
FURTHER READING • 239
Waste, and Why We Will Never Run Out of Energy. New York, NY: Basic Books. This bookrepeats the claims in the Forbes article and adds some others.
Koomey, Jonathan, Kaoru Kawamoto, Bruce Nordman, Mary Ann Piette, and Richard E. Brown.1999. Initial comments on ‘The Internet Begins with Coal’. Berkeley, CA: Lawrence BerkeleyNational Laboratory. LBNL-44698. December 9. (http://enduse.lbl.gov/projects/infotech.html). Our initial response to claims in the Forbes article.
Koomey, Jonathan G. 2000. Rebuttal to Testimony on ‘Kyoto and the Internet: The EnergyImplications of the Digital Economy’. Berkeley, CA: Lawrence Berkeley National Laboratory.LBNL-46509. August. <http://enduse.lbl.gov/Projects/InfoTech.html>. This point-by-pointrebuttal of testimony of Mark Mills reproduces that testimony and intersperses my responses.
Koomey, Jonathan, Huimin Chong, Woonsien Loh, Bruce Nordman, and Michele Blazek.2004. “Network electricity use associated with wireless personal digital assistants.” The ASCEJournal of Infrastructure Systems (also LBNL-54105). vol. 10, no. 3. September. pp. 131–137. This article investigates the claim about network electricity associated with wireless PalmPilots.
Koomey, Jonathan, Chris Calwell, Skip Laitner, Jane Thornton, Richard E. Brown, Joe Eto,Carrie Webber, and Cathy Cullicott. 2002. “Sorry, wrong number: The use and misuse ofnumerical facts in analysis and media reporting of energy issues.” In Annual Review of Energyand the Environment 2002. Edited by R. H. Socolow, D. Anderson and J. Harte. Palo Alto,CA: Annual Reviews, Inc. (also LBNL-50499). pp. 119–158. The electricity used by com-puters is one of the case studies in this article, which examines how the media treat technicalinformation.
Koomey, Jonathan. 2003. “Sorry, Wrong Number: Separating Fact from Fiction in the Informa-tion Age.” In IEEE Spectrum. June. pp. 11–12. This two-page article summarizes ways toidentify and avoid erroneous statistics.
Mills, Mark P. 1999. The Internet Begins with Coal: A Preliminary Exploration of the Impact ofthe Internet on Electricity Consumption. Arlington, VA: The Greening Earth Society. May.Mills documented the claims in the Forbes article in this technical report.
Roth, Kurt, Fred Goldstein, and Jonathan Kleinman. 2002. Energy Consumption by Office andTelecommunications Equipment in Commercial Buildings—Volume I: Energy ConsumptionBaseline. Washington, DC: Prepared by Arthur D. Little for the U.S. Department of Energy.A.D. Little Reference no. 72895-00. January. <http://www.eere.energy.gov>. Roth et al.validated our estimate of total electricity used by office equipment (3% of the US total).
240 • TURNING NUMBERS INTO KNOWLEDGE

Turning Numbers Into Knowledge is a godsend to analysts everywhere. It is thesingle best resource I have encountered on the practice of data analysis inthe real world. Cooper Richey
Trader, Centaurus Energy
This outstanding book teaches the tricks of the analytical trade.There’s nobetter guide to learning how to use numbers to understand the world.
Art RosenfeldCommissioner, California Energy Commission
Professor of Physics Emeritus University of California, Berkeley
I thought I was good at crunching numbers until I read Turning Numbers IntoKnowledge. It’s a great tool for improving your own use of numbers AND forseeing through the smoke screens of others. Lee Schipper, Ph.D.
World Resources Institute
Turning Numbers into Knowledge teaches tricks that most problem solvers onlylearn after years on the job. Give yourself an edge: Read this book!
Barbara Barkovich, Ph.D.Principal
Barkovich and Yap, Inc., Consultants
This gem of a book should be required reading for anyone who analyzesinformation–and that means everyone! Professor Richard F. Hirsh
Department of History and Science &Technology Studies,Virginia Tech
The greatest challenge facing educators, institutions, and businesses is theinculcation of rigor and fact-based analysis into the psyches of future leaders.Turning Numbers Into Knowledge is the tool for organizations to accomplish thisessential task. Ephraim Heller
Founder,Therasense, Inc.
MORE PRAISE FOR TURNING NUMBERS INTO KNOWLEDGE1
Dr. Koomey has produced an absolute home run! A witty, incisive primer oncritical analytical thinking. Required reading for business analysts, planners, andstrategists–critical insight for players in the Internet economy.
Tod LoofbourrowPresident and CEO, Authoria, Inc.
All decision-makers need to read this book. It explains, in clear and usefulterms, how to use the ever-growing flow of data in our society. But that’s onlythe start. Turning Numbers into Knowledge will help the reader become a bet-ter thinker, and it is a rare book that can make that claim.
Hal HarveyWilliam and Flora Hewlett Foundation
Here at last is the definitive guide for beating information overload andresponding to the current anti-science, anti-environment backlash. Thisremarkable book will empower both professionals and neophytes.
Professor John HarteEnergy and Resources Group, University of California, Berkeley
Author of Consider a Spherical Cow:A Course in Environmental Problem Solving
This splendidly clear and concise introduction to the craft should be afoundation of every student’s apprenticeship–and for those who missed it,a toolkit for a salutary retrofit later. How much more quickly and pleasantlywe would discover truth if everyone followed these simple precepts!
Amory B. LovinsCEO, Rocky Mountain Institute
Jon Koomey writes books the old fashioned way: by accumulating experi-ences, anecdotes and examples over a lifetime of hard work, and refiningthem into a compact ingot of pure gold. The reader is offered a rare giftindeed–the essential elements of dozens of fine books, the collective wisdomof countless scientists and commentators, and a handful of the mostinspired comic strips ever to grace the daily newspaper. In an era where somany books, once read, become disposable, Dr. Koomey has created anenduring reference. His focus on the Internet and his commitment to keep-ing its content fresh through an ongoing electronic dialogue with readers arelaudable indeed. Read this book and apply its many lessons not just to schoolor work, but to life! Chris Calwell
Founder, ECOS Consulting, Inc.

241
1. Affiliations listed for informational purposes only. The opinions expressed do not necessar-ily represent those of the institutions listed.
2. I am indebted to Amory Lovins for this phrase.3. Tufte, Edward R. 1995. The Visual Display of Quantitative Information. Cheshire, CT:
Graphics Press. Fourteenth printing. p. 51.4. By January 2007, the LoC collection totaled more than 130 million items, of which 68% are
books and manuscripts <http://www.loc.gov/about/facts.html>. For this calculation I assumethat eighty percent of the books and manuscripts are duplicate copies of existing documents,so that our hapless reader would only have to peruse 18 million volumes.
5. An “order of magnitude” is a factor of ten, two orders of magnitude is a factor of one hun-dred, and so on. This shorthand is commonly used by scientists to summarize large differ-ences in a convenient way.
6. More than half of all scientists who have ever lived are alive today (Stephen Covey, 1992.Principle-Centered Leadership. NY, NY: Simon & Schuster. p.91.), and this fact is reflectedin ever more rapid rates of scientific and technological progress.
7. Shenk, David. 1997. Data Smog: Surviving the Information Glut. New York, NY: Harper-Collins Publishers, Inc. The first two paragraphs of this quotation appeared on p. 30 of DataSmog. The third paragraph appeared in various electronic versions of Shenk’s work, but didnot appear in the book itself.
8. In one survey, 80 percent of respondents “felt driven to gather as much information as pos-sible, but over half of them were unable to handle all the information they accumulated.”“Survey: New ‘dataholics’ generation on rise.” San Jose Mercury News. 8 December 1997.Read on the web at <http://www.sjmercury.com>.
9. Ringer, Robert J. 1974. Winning Through Intimidation. New York: Funk & Wagnalls.10. Hess, Peter, and Julie Siciliano. 1996. Management: Responsibility for Performance. New
York, NY: McGraw-Hill, Inc. See Chapter 4: Developing goals.11. Kawasaki, Guy. 1995. How to Drive Your Competition Crazy: Creating Disruption for Fun
and Profit. New York, NY: Hyperion. p. 46.12. Kawasaki, Guy. 1995. How to Drive Your Competition Crazy: Creating Disruption for Fun
and Profit. pp. 40-41.13. Kawasaki, Guy. 1995. How to Drive Your Competition Crazy: Creating Disruption for Fun
and Profit. pp. 192-193.14. Coffee, Peter. 1997. “Don’t get sidetracked by trifling differences.” PC Week. 24 November
1997. p. 32.15. Hansell, Saul. “In terms of the audience, size matters.” NYT May 11, 1998. Read on the web
at <http://www.nyt.com>. The Audit Central site, launched in 2000 (but now defunct), stan-dardized the ranking process for sites, so that they could be compared consistently. The prob-
NOTES
lems with measurement of site traffic continue to this day, as documented in Story, Louise.2007. “How Many Site Hits? Depends Who’s Counting.” The New York Times (online).New York, NY. October 22.
16. Reich, Robert. 1997. Locked in the Cabinet. New York, NY: Alfred A. Knopf. p. 73. 17. Holton, Gerald. 1973. Thematic Origins of Scientific Thought: Kepler to Einstein. Cam-
bridge, MA: Harvard University Press.18. One famous example is that of Lord Kelvin’s estimate of the age of the earth in the mid to
late 1800s. Joe D. Burchfield, 1990. Lord Kelvin and the Age of the Earth. Chicago, IL:University of Chicago Press. For accounts of dozens of such mistakes, see Youngson, Robert.1998. Scientific Blunders: A Brief History of How Wrong Scientists Can Sometimes Be. NewYork, NY: Carroll & Graf Publishers, Inc.
19. I made significant effort (and documented this effort extensively) to find the reproductionrights holder for Figure 4.1. If that person or institution contacts me with documentation ofownership, we will negotiate suitable remuneration for use of the figure.
20. The general principles can be derived using either deductive or inductive logic.21. Edwards, Paul, ed. 1972. The Encyclopedia of Philosophy. New York, NY: Macmillan
Publishing Co., Inc. & The Free Press. Volume 4, p. 169.22. Edwards, Paul, ed. 1972. The Encyclopedia of Philosophy. Volume 4, p. 169.23. Sokal, Alan. 1997. “A Plea for Reason, Evidence and Logic.” New Politics vol. 6, no. 2, pp.
126-129 (Winter 1997).24. I am indebted to Bill Ahern for prompting me to ask these questions of myself.25. Covey, Stephen R. 1990. The 7 Habits of Highly Effective People. NY, NY: Simon &
Schuster. pp. 150-156.26. Schwartz, Peter. 1996. The Art of the Long View: Planning for the Future in an Uncertain
World. New York, NY: Doubleday. p.62.27. In fairness, I made my share of wild assertions in those days.28. Covey, Stephen R. 1990. The 7 Habits of Highly Effective People. NY, NY: Simon &
Schuster. pp. 150-156.29. DeMarco, Tom, and Timothy Lister. 1987. Peopleware: Productive Projects and Teams. New
York, NY: Dorset House Publishing Company. p. 55.30. Hughes, William. 1997. Critical Thinking: An Introduction to the Basic Skills. 2d edition.
Peterborough, Ontario: Broadview Press. p. 16.31. Hughes, William. 1997. Critical Thinking: An Introduction to the Basic Skills. pp. 108-110.32. I am indebted to Professor John Holdren for this phrase.33. Quoted in Stobough, Robert, Daniel Yergin, I. C. Bupp, Mel Horwitch, Sergio Koreisha,
Modesto A. Maidique and Frank Schuller. 1979. Energy Future. New York, NY: BallantineBooks.
34. Hughes, William. 1997. Critical Thinking: An Introduction to the Basic Skills. pp. 160-161.35. Meier, Alan. 1987. “Saving the ‘Other’ Energy in Homes.” Energy Auditor and Retrofitter.
November/December, p. 13.36. US DOE. 1989. Residential Energy Consumption Survey (RECS): Housing Characteristics 1987.
EIA, Energy Information Administration, U.S. Department of Energy. DOE/EIA-0314(87).May. <http://www.eia.doe.gov>
37. No matter how rough they may be, Alan’s estimates are based on years of experience andprofessional judgment. They prompt further empirical work that more often than not sup-ports his initial guesses.
242 • TURNING NUMBERS INTO KNOWLEDGE

38. Calwell, Chris J. 1996. Halogen Torchieres: Cold Facts and Hot Ceilings. Boulder, CO: E-Source, Inc. TU-96-10. September.
39. If you subscribe to the New Republic, you can read the letter of apology at <http://www.tnr.com/>.
40. For another nice discussion of some common statistical fallacies, check out Barnett, Arnold.1994. “How numbers are tricking you.” Technology Review. October. <http://www.technologyreview.com/>
41. 2 Campus Boulevard, Newtown Square, PA 19073, 800/442-0925. 42. I am told that ants use a scented trail to show the way back to the nest. Any scented prod-
uct (like talcum powder) will confuse them and make them go away.43. Udell, Jon. 1996. “Web Surveys: Helpful Techniques for Web-based Data Collection and
Analysis.” Byte Magazine. October, p. 133.44. Crossen, Cynthia. 1994. Tainted Truth: The Manipulation of Fact in America. New York,
NY: Simon & Schuster, p. 112.45. Cohen, Bernard L. 1990. The Nuclear Energy Option: An Alternative for the 90s. New
York, NY: Plenum Press.46. Reich, Robert. 1997. Locked in the Cabinet. New York, NY: Alfred A. Knopf, p.106.47. Marshall, Jonathan. 1997. “Economists Can’t Seem to Agree on Anything.” The SF
Chronicle, August 25, 1997, p. B2.48. The figure described by this text is contained in “Strategies, Structures, and Processes of
Organizational Decisions,” which is from Comparative Studies in Administration, T. E.Thompson and A. Tuden, (c) 1959. University of Pittsburgh Press.
49. Kunde, Diana. 1998. “Don’t Be Bugged.” The SF Chronicle. Sunday, March 8, 1998, p. J1.50. Crossen 1994, Tainted Truth, p. 106.51. Crossen 1994, Tainted Truth, p. 94.52. Crossen 1994, Tainted Truth, p. 101.53. Dougan, Michael. 1996. “Ancient quest tests new library.” Sunday SF Examiner. December
15, 1996, p. C1.54. For a nice introduction to the concept of a spreadsheet, see Jones, Gerald E. 1995. How to
Lie with Charts. San Francisco, CA: Sybex, in the section titled “Spreadsheets: The CrashCourse,” on pages 154-157.
55. CNET online retells the story of this launch as well as other famous computer glitches in“CNET Features—Digital Life—Bugs” (8/24/2000).
56. Sawyer, Kathy. 1999. “Engineers’ Lapse Led to Loss of Mars Spacecraft: Lockheed Didn’tTally Metric Units.” The Washington Post. October 1, 1999, p. A1.
57. Aragon, Lawrence. 1997. “Down with Dirt.” PC Week. October 27, 1997, p. 83.58. US raw steel production from 1997 World Almanac and Book of Facts, p. 153.59. U.S. population from 1997 World Almanac and Book of Facts, p. 382.60. 1940-1980 GNP from the Statistical Abstract of the US 1990, p. 425. 1990 GNP in current
$ from 1997 World Almanac and Book of Facts, p. 133, adjusted to 1982 dollars using theconsumer price index from p. 132.
61. The easiest way to calculate this number is to take the ratio of market capitalization per dol-lar of annual revenues for GE, and divide by the same ratio for Google. This calculationyields 0.16, which equals 1/6.
62. From the perspective of actually using the data for calculations (as in this example), down-loadable files are almost always preferable to such HTML pages (see Chapter 38: Use theInternet).
NOTES • 243
63. Ringer, Robert J. 1974. Winning Through Intimidation. New York: Funk & Wagnalls.64. Morgan, M. Granger, and Max Henrion. 1992. Uncertainty: A Guide to Dealing with
Uncertainty in Quantitative Risk and Policy Analysis. New York, NY: Cambridge UniversityPress.
65. “Trickle-Down Plan.” The SF Chronicle. December 5 1996, p. E10.66. This calculation highlights a startling fact: gasoline is cheaper than bottled water, in spite of
its extraordinary energy density. For a nice graph demonstrating this result, see Nadis, Steveand James J. MacKenzie. 1993. Car Trouble. World Resources Institute. Washington, DC.
67. Currier, Chet. The SF Chronicle. November 25, 1996, p. E3.68. The San Francisco Chronicle/Examiner. Sunday, August 31, 1997. Housing prices were
examined on p. E1, and cremation was examined on p. D1.69. I am indebted to Mark Nowak for this marvelous anecdote.70. Such intellectual debate is often inhibited between companies because of concerns about pro-
prietary information. These concerns can sometimes be allayed by appropriate use of non-disclosure agreements. Surprisingly, lack of constructive intellectual criticism is the norm evenwithin firms, where proprietary concerns are moot.
71. Thanks to Veronica Oliva for her thoughts and comments on this section.72. “Stamp Price to Rise a Penny to 33 Cents.” The SF Chronicle. May 12, 1998, p. A1+.73. Knutson, Lawrence L. 1998. “U.S. to Rain Pennies on Post Office: 33-cent First-class Stamp
Takes Effect Next Year.” The Oakland Tribune. May 12, 1998, p. NEWS-1+.74. Ward, Sandra. 2007. “Where Is Oil Headed? A Contrarian Says $45.” Barron’s. New York,
NY. Number 38, September 17, 2007. p. 56–57.75. I am indebted to Professor Marcela Bilek for this point. She discovered the importance of it
when examining historical trends in Japanese GDP, expressed in dollars. You can investigatefor yourself at <http://www.economagic.com>.
76. Herhold, Scott. 1998. “Computer Files Erased at Stanford.” San Jose Mercury News. April9, 1998, p. 1A.
77. Tufte, Edward R. 1995. The Visual Display of Quantitative Information, p. 51.78. Tufte, Edward R. 1995. The Visual Display of Quantitative Information, p. 170.79. Vorsatz, Diana, Leslie Shown, Jonathan G. Koomey, Mithra Moezzi, Andrea Denver, and
Barbara Atkinson. 1997. Lighting Market Sourcebook. Ernest Orlando Lawrence BerkeleyNational Laboratory. LBNL-39102. December. p. 38. <http://enduse.lbl.gov/Projects/LMS.html>.
80. Tufte, Edward R. 1995. The Visual Display of Quantitative Information, p. 191.81. Tufte, Edward R. 1995. The Visual Display of Quantitative Information, p. 191.82. Vorsatz, Diana, et al. 1997. Lighting Market Sourcebook. p. 51.83. Interlaboratory Working Group. 1997. Scenarios of U.S. Carbon Reductions: Potential
Impacts of Energy-Efficient and Low-Carbon Technologies by 2010 and Beyond. Oak RidgeNational Laboratory and Lawrence Berkeley National Laboratory. ORNL/CON-444 andLBNL-40533. September. p. 2.12. <http://enduse.lbl.gov/Projects/5Lab.html>
84. I am particularly indebted to Evan Mills for his detailed comments and suggestions on thischapter.
85. Don Cram at MIT summarizes key literature on event study methods at <http://web.mit.edu/doncram/www/eventstudy.html>.
244 • TURNING NUMBERS INTO KNOWLEDGE
W H Y YO U S H O U L D R E A D T H I S B O O K
The world keeps getting more complex, but becoming a better problem solvercan help you make sense of it all. Mastering the art of problem solving takesmore than proficiency with basic calculations: it requires (among other things)understanding how people use information, recognizing the importance of ide-ology, learning the art of story telling, and acknowledging the important dis-tinction between facts and values. Turning Numbers into Knowledge is the firstcomprehensive guide to these and other essential skills. Full of tools, tricks, andtips for solving problems in the real world, it will prepare you well to makeindependent judgments about the numerical assertions of others and to gener-ate cogent and compelling analyses of your own.
To order this book or to download key data files, URLs, and sample chap-ters, go to <http://www.numbersintoknowledge.com>. To find out about relatedseminars and books, go to <http://www.analyticspress.com>.
A B O U T T H E AU T H O R
Jonathan Koomey is a Research Fellow at the Steyer-Taylor Center for EnergyPolicy and Finance at Stanford University. He holds M.S. and Ph.D. degreesfrom the Energy and Resources Group at the University of California atBerkeley, and an A.B. in History of Science from Harvard University. His aca-demic work, summarized in nine books and more than 150 articles andreports, spans engineering, economics, public policy, and environmental science.He holds a fourth degree black belt in the Japanese martial art of Aikido andenjoys hiking, cooking, and playing classical contrabass in his spare time. Formore details go to <http://www.koomey.com>.
Credit: G
rigorieffPhotography

A B O U T T H E A RT I S T
Tom Chen delights in creating sculpture and computerart. You can learn about his sculptures at <http://www.curiousdinosaurs.com>.
A L S O F RO M A N A LY T I C S P R E S S
June 2012 April 2009
Show Me the Numbers: Designing
Tables and Graphs to Enlighten, byStephen Few, is the best selling, sim-plest, most comprehensive and prac-tical guide to table and graph designavailable. If you create table andgraphs or manage those who do,this book will alleviate countlesshours of confusion and frustration.
Now You See It, by Stephen Few,does for visual data analysis whatFew did for data presentation inShow Me the Numbers. It teachespractical techniques that anyone canuse—only this time they’re for mak-ing sense of information, not pre-senting it.
This page has been reformatted by Knovel to provide easier navigation.
INDEX
IndexTerms Links
A
Abbey, Edward 211
Ace, Goodman 83
Annual Reviews 49 100
approximations 132 133
arguments
counter 61 209
deductive 25
inductive 25
logically strong 59
missing 61 209
premises to 27 59 209
sound 59
Aristotle 93
audience, knowing your 147 165 187 194
211
authority, questioning 68 209
B
Bach, Johann Sebastian 40
Barrons 157 172 175
Baruch, Bernard xv
beginner’s mind 5 14 99
Berners-Lee, Tim 201
billion, meaning of 152
breaking logjams 97 99
Brynjolfsson, Erik 76
IndexTerms Links
This page has been reformatted by Knovel to provide easier navigation.
C
calculations, back-of-the-envelope 41 73 127 129
188
Calvin and Hobbes 17 63 210
Calwell, Chris 74
Carlin, George 8
Cartoonbank.com 53 99 154
Casals, Pablo 52
Chamberlain, T. C. 61
Chicago Manual of Style 149 154
Churchill, Winston 5
Cialdini, Robert 69 70 91
Clarke, Arthur C. 112
Cleaver, Eldridge 32
Cohen, Bernard L. 87
cold fusion 24
Confucius 33
consistent comparisons 60 105 124 159
211
Cook, Rich 128
copyright 40 149
Covey, Stephen 53 154
Creative Commons 207
critical thinking 13 25 59 69
89 209
Crossen, Cynthia 57 83 91
Cycle of Action 9 31 63 141
D
data indices 178 181
data
archiving 38 151
backing up 160
bad 112 187
IndexTerms Links
This page has been reformatted by Knovel to provide easier navigation.
data (Cont.)
cleaning 112 196
massaging 16
normalization of 44 114 119 120
122 123 179 181
public 203
sharing 190 201
survey 77 81 91 112
database-backed web sites 200
databases
generic 39 42 43 45
151 191 192
library 46 101
reference 40 154
debates 143
decision-making
general 19 42 52 88
107 151
using information for 2 11 16 62
81
Dilbert 54 133
documentation
avoiding bad 123
creating 13 84 104 149
194 196 211
reading the 74
reasons for 23 36 123 149
164 177 190 211
sources with good 44 128
doubling time 139
E
Economagic 47
Edison, Thomas A. 160
Einstein, Albert 28 31 89
IndexTerms Links
This page has been reformatted by Knovel to provide easier navigation.
Encyclopedia of Philosophy 27 48
estimates. See approximations
exponential growth 138
F
facts vs. values 87 210
Fed Stats 47
Few, Stephen 175 179 206
Fienberg, Stephen E. 86
figures. See graphs
filing systems 35 38 151
footnotes, importance of 44 74 84 85
120 149 152 160
164 177 196
Forbes article on IT electricity use 214 219
forecasting 11 66 109 136
Frequently Asked Questions (FAQs) 41 47 100
Fuller, Buckminster 200
G
General Electric 116 161
Glass, Stephen 76
Google 48 116 161 199
203 205
graphs
making 17 43 161 166
reading 84
Greening Earth Society 216
Greenspun, Philip 193 194 197 199
200
guesses becoming facts 73
H
Handbook of Chemistry and Physics 29
Harte, John 131

IndexTerms Links
This page has been reformatted by Knovel to provide easier navigation.
Heath, Chip and Dan 5 186
Heisenberg, Werner 90
Hoare, C. A. R. 185
Holdren, John xiii 51 124 219
Holmes, Sherlock 50 102 104 144
Holton, Gerald 22
Home Energy Saver 192
How to Lie with Statistics 42 57 77 172
Huff, Darrell 42 57 77
Hughes, William 25 57 59 60
69
Hyams, Joe 96
I
ideology 2 12 18 19
28 31 63 87
inflation, correcting for 44 156
information overload 1
integrity 220
Intelligence Squared debates 143
Internet 16 38 46 47
48 76 100 140
150 189 211 212
intimidation, avoiding 7 126 163 209
J
journalists 76 91 137 148
K
Kawasaki, Guy 13 14 15
Kay, Alan 110
Keepin, Will 127
Kennedy, John F. 143
Kernighan, Brian W. 165
Kuhn, Thomas 22 23

IndexTerms Links
This page has been reformatted by Knovel to provide easier navigation.
L
Land, Edwin 98
Lee, Bruce 6
Levine, Mark 153
librarians, importance of 100
Library of Congress 1 46 150
Lieber, Hugh and Lillian 57
Life in Hell 158
Lincoln, Abraham 29
logistic curve 140
M
Mattimore, Bryan 95 129 131
McNealy, Scott 220
meetings 54
Meier, Alan 73
metadata 201
metric units 49 112 130 153
models
buried assumptions in 125
computer 66 109 125
economic vs. physical science 65
simple 10 116 125 131
Mosteller, Frederick 86
N
National Center for Health Statistics 47
National Technical Information Service 46
New Yorker 53 99 154
newsgroups 31 47
Nietzsche 79
Norman, Donald 9 12 15 20
notebooks 40 151
nuclear power 46 87
IndexTerms Links
This page has been reformatted by Knovel to provide easier navigation.
O
oral presentations, using numbers in 147 186
organization 34 209
Osgood, Charles 186 188
Oshima, Tsutomu 148
P
Parker, Dorothy 106
passive voice, avoiding 158
Pasteur, Louis 36 72
PDF. See Portable Document Format
Peale, Norman Vincent 59
Peel, Robert 92
peer review 22 60 204
peer reviewed journals 26
Peopleware 54
Perot, Ross 83 188
Pike, Rob 165
polling results 91
Polya, G. 98
Portable Document Format (PDF) 39 150 195 197
200
productivity and noise 55
R
references, complete 154
reference database software 40 154
Reich, Robert 16 87
reporters. See journalists
Rhymes with Orange 82
Ringer, Robert 3 7 127 221
222
Robbins, John 70
Roddenberry, Gene 145
IndexTerms Links
This page has been reformatted by Knovel to provide easier navigation.
Romm, Joe 216
Roosevelt, Theodore 21
Rosenfeld, Art 129 147
Rourke, Robert E. 86
rule of seventy 139
S
scenarios
creating 18 107 141 211
justifications for creating 128 137 141
using 12 18 67 107
132 211
Schumacher, E. F. 67
Schwartz, Peter 38 107 108 109
Science Citation Index 25
scientific proof 25
scorecard.org 91 192 200
search engines 38 47 100 191
192 197 199 201
206
Semantic Web 201
Shenk, David 1
Sherman’s Lagoon 66
Show Me the Numbers 168 175 179
Simon, Julian 138
small multiples 168 196
Smith, Fred 68
Software Publishers’ Association 76
Sokal, Alan 27 32
spreadsheets 42 43 85 102
113 134 152 163
190 195 196 201
Stamp, Sir Josiah 75
Stanford Encyclopedia of Philosophy 48
Stanley, Bessie A. 64
IndexTerms Links
This page has been reformatted by Knovel to provide easier navigation.
stateline.org 119 196
Statistical Abstract of the U.S. 44 46 100 120
121 156
Stevenson, Robert Louis 161
Stoll, Clifford 2 101
story telling. See scenarios
survey questions 77 81 91
synthesis 211
T
tables
making 17 43 161 177
reading 84
Teller, Edward 124
Thoreau, Henry David 53
time, valuing your 36 52 95 211
time constraints 12 19 62
tons, meaning of 152
troubleshooting calculations 102 111 178
Tufte, Edward 17 166 167 168
170 176 177 178
186 196
Twain, Mark 68 71 142 213
222
U
U.S. Bureau of the Census 46 47 74
U.S. Department of Energy 46 73
U.S. Environmental Protection Agency 47
U.S. Geological Survey 47
Ueland, Brenda 7 95
Uncertainty Principle 62 90
uncertainty 12 62 107 108
124 128 132 141
unit analysis 133

IndexTerms Links
This page has been reformatted by Knovel to provide easier navigation.
V
value choices 10 18 32 63
87
van Leeuwenhoek, Antonie 208
von Baeyer, Hans Christian 129 135
Vonnegut, Kurt 78
W
Walton, Sam 14
Wikipedia 203 207
Williams, H. H. 55
Williams, Robin 178 190 193 197
199
World Wide Web 34 38 39 40
47 82 150 153
192 201 203
See also Internet
Y
Your Money or Your Life 52
Z
Zen in the Martial Arts 96