Embed Size (px)
Citation preview
Turn Back the Tide Campaign Evaluation
March 26, 2015
Office of Climate Change and Energy Efficiency
Evaluation of the Turn Back the Tide Campaign 1
Table of Contents
Executive Summary ............................................................................................................... 2
Introduction .......................................................................................................................... 5
Campaign Overview .............................................................................................................. 7 Background ......................................................................................................................... 8 Campaign Development – Design Phase ............................................................................ 9
Selection of a Creative Concept .............................................................................. 9 Development of Creative Assets ............................................................................. 9 Development of Digital Assets ................................................................................ 9 Deployment Planning ............................................................................................ 10 Evaluation Planning............................................................................................... 11
Campaign Development – Delivery Phase ........................................................................ 12 Province-Wide Advertising ................................................................................... 12 Maintaining a Social Media Presence ................................................................... 12 Establishing Community Partnerships .................................................................. 12 Participating in Promotional Events ..................................................................... 13
Campaign Evaluation ........................................................................................................... 14 Evaluation Methodology ................................................................................................... 15
Challenges and Limitations ................................................................................... 15 Relevance .......................................................................................................................... 16
Did the campaign contribute to CCEE’s goals? ..................................................... 16 Did the campaign fill an identified public need? .................................................. 16 Did the campaign duplicate or complement existing initiatives? ........................ 17
Design and Delivery .......................................................................................................... 18 Was the campaign effectively designed? ............................................................. 18 Was the campaign effectively delivered? ............................................................. 19
Success .............................................................................................................................. 26 Has the campaign achieved its expected immediate outcomes? ........................ 26 Has the campaign achieved its expected intermediate outcomes? ..................... 28
Conclusion ........................................................................................................................... 30 Summary of Key Findings .................................................................................................. 31 Update on Ongoing Campaign Activities .......................................................................... 32
Annexes .............................................................................................................................. 33 Annex A: Evaluation Methodology ................................................................................... 34 Annex B: Campaign Expenditures ..................................................................................... 37 Annex C: Presentations Delivered .................................................................................... 38 Annex D: Campaign Advertising........................................................................................ 39 Annex E: Website Analytics............................................................................................... 40 Annex F: Facebook Analytics............................................................................................. 42 Annex G: Surveys .............................................................................................................. 43 Annex H: Interview Guides ............................................................................................... 45
Evaluation of the Turn Back the Tide Campaign 2
Executive Summary
Evaluation of the Turn Back the Tide Campaign 3
Executive Summary Turn Back the Tide is a campaign launched by the Government of Newfoundland and Labrador in September 2012 to raise public awareness about climate change and energy efficiency, including why these issues are important for Newfoundland and Labrador and how residents of the province can take action. Budget 2011 provided funding over three fiscal years (2011-12 to 2013-14) for the development of the creative materials for the campaign and the roll out of these materials through advertising. Over the same period, the Office of Climate Change and Energy Efficiency (CCEE) developed other tools and resources on climate change and energy efficiency to deliver on the objectives in CCEE’s 2011-2014 Business Plan. Where possible, these additional resources were promoted through the Turn Back the Tide campaign. This added value to the campaign and raised the profile of the new resources. This report evaluates the effectiveness of this campaign based upon a methodology using seven strategic questions covering three topics, with a total of 19 indicators. This evaluation was completed internally by CCEE, Government of Newfoundland and Labrador. The following is a summary of the evaluation’s key findings: Relevance • The campaign helped achieve CCEE’s goals, specifically the commitment in the 2011 climate
change and energy efficiency action plans to launch a public awareness campaign. • The campaign filled an identified public need, as public consultations held on climate
change and energy efficiency in 2010 indicated the need for government to take a leadership role in increasing awareness and understanding of these issues.
• The campaign did not duplicate existing initiatives and sought to complement initiatives where possible, such as initiatives undertaken by the takeCHARGE program on energy efficiency and the Multi Materials Stewardship Board on waste diversion.
Design and Delivery • The design of the campaign was based upon thorough research during the development of
assets, as well as during deployment and evaluation planning. • The campaign effectively utilized financial resources, levered funding from other
departments and entities and benefited from synergies with other work that was being done by CCEE that could be promoted through the Turn Back the Tide campaign.
• The campaign achieved reach by completing province-wide advertising, maintaining a social media presence, establishing community partnerships and participating in promotional events.
• The campaign achieved all targets established for delivery by achieving over 56,000 website visits by March 31, 2014 (target: 50,000), over 1,700 Facebook Page Likes (target: 1,000) and over 7,000 video views (target: 1,000)
Evaluation of the Turn Back the Tide Campaign 4
Success Immediate Outcomes • The campaign was able to improve the availability of tools and resources through the
launch of the Turn Back the Tide website, which contains over 170 total pages of content, three interactive tools that provide tips on taking action, and three publications developed by CCEE, as well as a number of publications by other organizations.
• Follow-up survey results indicate some progress towards increasing understanding of climate change and energy efficiency and awareness of actions that can be taken.
Intermediate Outcomes • Follow-up survey results indicate only slight progress towards establishing behavioural
change. • The Turn Back the Tide campaign demonstrated provincial government leadership by
receiving two Pinnacle Awards in 2014 from the Newfoundland and Labrador chapter of the International Association of Business Communicators.
While the budget for campaign advertising ended on March 31, 2014, several campaign activities have continued. This includes continued hosting of the campaign website, which was made possible by hosting the website internally. As of March 24, 2015, this website had received 87,329 total visits. The campaign’s Facebook Page continues to be maintained, serving as the primary vehicle through which CCEE is seeking to drive traffic to the campaign’s website. Partnerships with community organizations and participation in promotional events have also continued.

Evaluation of the Turn Back the Tide Campaign 5
Introduction
Evaluation of the Turn Back the Tide Campaign 6
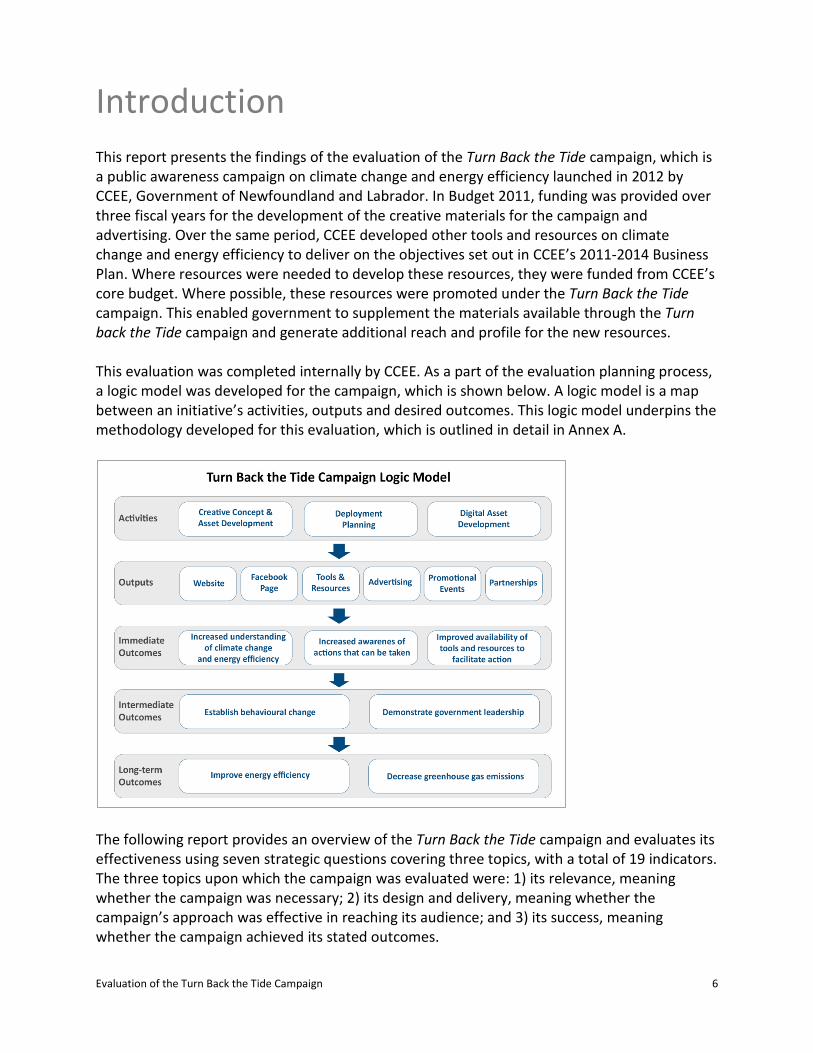
Introduction This report presents the findings of the evaluation of the Turn Back the Tide campaign, which is a public awareness campaign on climate change and energy efficiency launched in 2012 by CCEE, Government of Newfoundland and Labrador. In Budget 2011, funding was provided over three fiscal years for the development of the creative materials for the campaign and advertising. Over the same period, CCEE developed other tools and resources on climate change and energy efficiency to deliver on the objectives set out in CCEE’s 2011-2014 Business Plan. Where resources were needed to develop these resources, they were funded from CCEE’s core budget. Where possible, these resources were promoted under the Turn Back the Tide campaign. This enabled government to supplement the materials available through the Turn back the Tide campaign and generate additional reach and profile for the new resources. This evaluation was completed internally by CCEE. As a part of the evaluation planning process, a logic model was developed for the campaign, which is shown below. A logic model is a map between an initiative’s activities, outputs and desired outcomes. This logic model underpins the methodology developed for this evaluation, which is outlined in detail in Annex A.
The following report provides an overview of the Turn Back the Tide campaign and evaluates its effectiveness using seven strategic questions covering three topics, with a total of 19 indicators. The three topics upon which the campaign was evaluated were: 1) its relevance, meaning whether the campaign was necessary; 2) its design and delivery, meaning whether the campaign’s approach was effective in reaching its audience; and 3) its success, meaning whether the campaign achieved its stated outcomes.

Evaluation of the Turn Back the Tide Campaign 7
Campaign Overview
Evaluation of the Turn Back the Tide Campaign 8
Background The Government of Newfoundland and Labrador recognizes that climate change is one of the most important long-term challenges facing jurisdictions throughout the world. Taking action on climate change requires adapting to the unavoidable impacts of climate change, such as increases in extreme weather and coastal erosion, as well as reducing greenhouse gas (GHG) emissions to avoid more severe impacts in the future. Improving the province’s energy efficiency is a key approach to reducing GHG emissions when energy is generated by burning fossil fuels. However, energy efficiency also presents wider benefits, including reduced utility bills for homeowners and businesses. In 2011, the Provincial Government released two complementary action plans to ensure the province is well positioned to prepare for the impacts of climate change and to seize potential opportunities: Charting Our Course: Climate Change Action Plan and Moving Forward: Energy Efficiency Action Plan. The development of these action plans was informed by province-wide consultations held by CCEE in 2010. During these consultations, participants agreed that climate change and energy efficiency are important issues that require strong government leadership. A key message heard during the consultations was the need for government to take a leadership role in establishing greater public awareness on these issues. As such, a key commitment in the 2011 climate change and energy efficiency action plans was the development and roll out of a new public awareness campaign to increase the province’s understanding of these issues and how Newfoundlanders and Labradorians can take action. The Provincial Government’s Turn Back the Tide campaign was developed as a result, with the goal of achieving the following immediate outcomes:
• Promote a better understanding of climate change and energy efficiency and awareness of actions that can be taken; and
• Increase the availability of tools and resources to help facilitate action. The desired intermediate outcomes of the campaign were to establish behavioural change and demonstrate government leadership, with the desired long-term outcomes of improving energy efficiency and reducing GHG emissions. The development of the Turn Back the Tide campaign was approached in two phases: 1) the design phase, and 2) the delivery phase. An overview of each phase is provided on the following pages.
Evaluation of the Turn Back the Tide Campaign 9
Campaign Development – Design Phase The design phase of the Turn Back the Tide campaign began in fall 2011 and concluded in spring 2012. It was supported by a steering committee of government officials with experience in developing public awareness campaigns, including representatives from CCEE, the Department of Tourism, Culture and Recreation, the Voluntary and Non-Profit Secretariat, the Office of the Chief Information Officer, and the Communications Branch. Expenditures for this phase totaled approximately $276,931 and included five activities: 1) the selection of a creative concept, 2) the development of creative assets, 3) the development of digital assets, 4) deployment planning, and 5) evaluation planning. Annex B provides a detailed breakdown of campaign expenditures.
Selection of a Creative Concept The creative concept for the campaign was developed through a contractual arrangement established in December 2011 with m5 Group. The total contract value was $162,888 (excluding HST), which also included the development of creative assets, as described below. After user testing of three concepts, “Turn Back the Tide” was selected as the creative concept for the campaign. This concept was chosen as it drew upon the province’s emotional and economic attachment to the ocean, highlighted a key impact of climate change (i.e. rising sea levels) and symbolized a call to action, as by working together we can “Turn Back the Tide” on climate change.
Development of Creative Assets The creative assets developed by m5 Group included two 90-second promotional videos – one focusing on the problem of climate change and another focusing on possible solutions. These videos were posted online on the campaign’s website and YouTube channel. From each video, 30-second cuts were produced for television advertisements and 15-second cuts were produced for online pre-roll advertisements. As part of this contract, m5 Group also developed six newspaper advertisements – three focusing on the problem of climate change and three focusing on possible solutions. These advertisements were also repurposed as posters and used during promotional events and on social media. All creative assets were developed to capture a local feel to ensure the campaign was perceived as relevant for Newfoundlanders and Labradorians. This included using local imagery, local actors and local vernacular.
Development of Digital Assets In developing all digital assets, significant emphasis was placed on ensuring the assets had a local look and feel, while containing information that was directly relevant to Newfoundlanders and Labradorians. As such, local imagery was to be used and all written content was drafted in-
Evaluation of the Turn Back the Tide Campaign 10
house by CCEE. In total, digital assets for the Turn Back the Tide campaign were developed through three separate contractual arrangements:
• Website Development – In January 2012, The Pixel Shop Inc. was contracted to develop the campaign website at a cost of $43,840 (excluding HST). The website is the heart of the campaign and was created as a one-stop shop for local information on climate change and energy efficiency, with portals targeting homeowners, businesses and communities. The website was also developed to include interactive tools, including the Interactive House, through which users can find tips to save energy and reduce waste, as well as the Individual Carbon Calculator, which is designed specifically for Newfoundlanders and Labradorians to calculate their carbon footprint and find tips on how to reduce it.
• Facebook Page Development – A contractual arrangement was established with The Pixel Shop Inc. in August 2012 to develop the campaign’s Facebook Page. The purpose of the page was to broaden the campaign’s reach and to drive traffic to the campaign website. The value of this contract was $9,800 (excluding HST), which included creating the creative identity of the Facebook Page, providing guidance on best practices for page operation and adding both interactive tools from the website to the page.
• Municipal Government Carbon Calculator Development – A contractual arrangement was established with m5 Interactive in February 2013 to design the Municipal Government Carbon Calculator for the website. Similar to the Individual Carbon Calculator, this tool allows municipal governments to calculate the carbon footprint of their operations and find tips on how to reduce it. The value of this contract was $11,825 (excluding HST), which covered the design of the digital interface for the tool, as content for the tool was developed in-house by CCEE.
To reduce overall operation and maintenance expenditures, all digital assets were developed to comply with the technology standards of the Office of the Chief Information Officer (OCIO) and were therefore hosted and maintained internally. In addition to helping maximize the cost-effectiveness of the campaign, this was done to ensure the campaign’s digital assets were able to continue beyond the end of funding for campaign advertising. As such, these assets remain in operation as of March 2015.
Deployment Planning In March 2012, SPARK Marketing was contracted to develop a deployment strategy for the campaign. This contract totalled $22,760 (excluding HST) and included the development of a strategy, as well as a draft schedule to guide the media buy and roll-out of the campaign. The strategy highlighted the need for a multi-pronged approach, including television, newspaper, cinema and online advertising, as well as the need for a social media presence and a grassroots-level approach. The strategy’s recommendations were considered, but not all were implemented due to the need to maximize the campaign’s budget while minimizing overlap in
Evaluation of the Turn Back the Tide Campaign 11
the audiences that were reached. For example, cinema advertising was not completed as it was expensive and did not offer sufficient reach. Additionally, CCEE took the strategic decision of completing the media buy for the campaign in-house. Contracting a private company to complete this media buy would have cost $24,000 to $30,000 over two years. By completing the media buy using in-house expertise, CCEE was able to achieve cost savings in the campaign’s advertising budget while procuring additional advertising time.
Evaluation Planning It was determined early in the planning stages that it was important to ensure that the effectiveness of the campaign was evaluated. As such, a performance measurement framework was developed, including a logic model (see Page 6), and a performance measurement strategy was implemented to ensure the ongoing collection of data. Evaluation planning for the campaign included:
• Setting Targets – Targets were established in consultation with officials on the steering group for the campaign. The Provincial Government’s “Who Cares?” campaign was used as a benchmark, as it was a recent campaign that: 1) was a call to action designed to reach the entire province, 2) employed similar activities, and 3) used a comparable budget. This campaign had achieved almost 14,660 website visits and nearly 300 Facebook Page Likes. Based on this, a decision was taken to establish ambitious targets for the Turn Back the Tide campaign, which were as follows:
o Website: 50,000 total visits o Facebook Page: 1,000 total Page Likes o YouTube: 1,000 total video views
• Baseline Survey – It was deemed important to determine whether the campaign was successful in achieving its immediate and intermediate outcomes, including whether the campaign was successful in changing attitudes and behaviours. As such, in advance of the campaign, a baseline survey was developed to measure residents’ awareness and behaviours relating to climate change and energy efficiency. The survey was developed in-house by CCEE. MQO Research was contracted to administer the survey in March 2012 at a cost of $24,276 (excluding HST).
• Follow-Up Survey – In order to determine a change in attitudes and behaviours, a follow-up survey was conducted near the end of the campaign in March to April 2014. The follow-up survey was developed in-house by CCEE and administered by the Newfoundland and Labrador Statistics Agency, Department of Finance.
The results achieved towards meeting targets and achieving outcomes are provided in the “Campaign Evaluation” section of this document.
Evaluation of the Turn Back the Tide Campaign 12
Campaign Development – Delivery Phase The delivery phase of the campaign ran from the launch of the campaign on September 17, 2012 to March 31, 2014, and focused on disseminating the materials developed as part of the design phase. This included completing province-wide advertising, maintaining a social media presence, establishing partnerships with community organizations and attending promotional events. This phase of the campaign was completed using a mix of in-house resources and purchased services. Total expenditures for the delivery phase of the campaign were $208,132 (excluding HST) over two financial years. Annex B provides a detailed breakdown of campaign expenditures.
Province-Wide Advertising The goal of completing advertising was to establish province-wide reach while increasing awareness of the issues of climate change and energy efficiency and driving traffic to the campaign website. This advertising was completed using funding of $100,000 in both fiscal years 2012-13 and 2013-14. This included television advertisements, newspaper advertisements, online banner advertisements and online pre-role advertising. All of these advertising methods were employed in 2012-13. However, the 2013-14 media buy built upon lessons learned in year one and focused increasingly on choosing advertising vehicles that were most effective in driving traffic to the campaign website.
Maintaining a Social Media Presence The goal of maintaining a social media presence was to achieve reach while boosting engagement on these issues and driving more traffic to the campaign website. This required maintaining a three-month Facebook content calendar over the course of the campaign’s delivery, with regular weekly posts and periodic contests to boost engagement. A total of six Facebook contests were held, including a 12-day trivia contest called “12 Days of Climate Change.” Several Facebook contests were held to coincide with the establishment of community partnerships, as listed below.
Establishing Community Partnerships The goal of establishing community partnerships was to expand the reach of the campaign to new audiences. Partnerships undertaken as part of the campaign include:
• IceCaps Go Green, which was a partnership with the St. John's IceCaps that included advertising, Facebook contests and in-game events;
• Municipal Government Carbon Footprint Challenge, which was a partnership with the Department of Municipal and Intergovernmental Affairs to promote uptake of the
Evaluation of the Turn Back the Tide Campaign 13
Municipal Government Carbon Calculator and encourage action among municipal governments;
• Green Restaurants, which was a partnership with the Restaurant Association of Newfoundland and Labrador that focused on implementing a Facebook trivia contest to raise awareness about how local restaurants are taking action to green their operations;
• Youth Challenge, which was a partnership with the Community Youth Network to encourage youth to raise awareness about the importance of taking action, which included a Facebook trivia contest, as well as initiatives that required CYN sites to take action;
• Adding Climate Change to the Tidy Towns Awards, which was a partnership with Municipalities Newfoundland and Labrador that focused on adding a new climate change category to the province’s Tidy Towns Awards;
• Energy Efficiency Pavilion, which was a partnership with the Canadian Home Builders’ Association and takeCHARGE to promote energy efficiency during the 2014 Home Show; and
• A Sea of Change, which was a partnership with the Bonne Bay Marine Station and the Department of Fisheries and Aquaculture to develop and install a new exhibit at the marine station, highlighting the impact climate change is having on the oceans.
Participating in Promotional Events The goal of participating in promotional events was to extend the reach of the campaign while boosting engagement by capitalizing on opportunities to engage captive audiences in discussions about climate change and energy efficiency. These events included delivering presentations and promoting the campaign at trade shows, conventions and conferences. Throughout the duration of the campaign, 12 presentations were delivered during promotional events. Examples of events include the Newfoundland and Labrador Environmental Industry Association’s conference held in St. John’s in 2012, the Coastal Matters Speakers Series held in Corner Brook in 2012, and the Provincial Student Leadership Conference held in Gander in 2013. A full list of presentations is provided in Annex C. In addition to these presentations and the Energy Efficiency Pavilion partnership in 2014, the campaign also hosted a booth at the 2013 Home Show with the goal of providing information to home owners on improving their energy efficiency and reducing their carbon footprints.
An overview of the success of these activities is provided in the “Campaign Evaluation” section of this document.

Evaluation of the Turn Back the Tide Campaign 14
Campaign Evaluation
Evaluation of the Turn Back the Tide Campaign 15
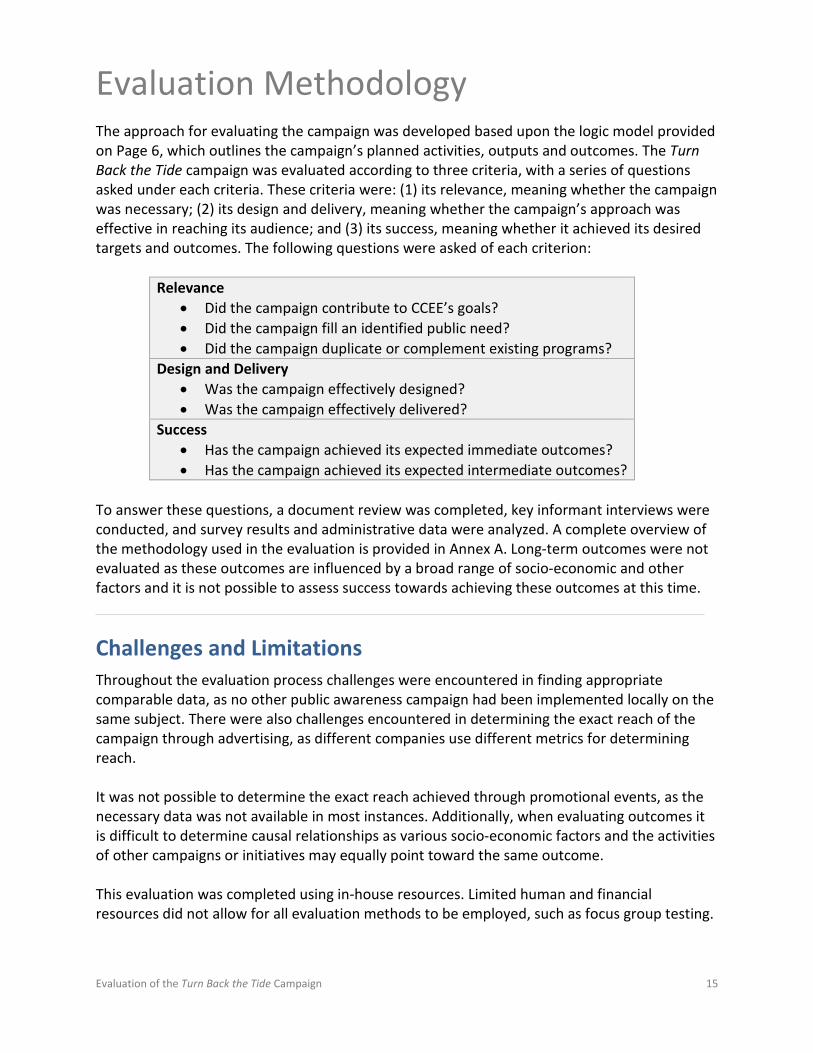
Evaluation Methodology The approach for evaluating the campaign was developed based upon the logic model provided on Page 6, which outlines the campaign’s planned activities, outputs and outcomes. The Turn Back the Tide campaign was evaluated according to three criteria, with a series of questions asked under each criteria. These criteria were: (1) its relevance, meaning whether the campaign was necessary; (2) its design and delivery, meaning whether the campaign’s approach was effective in reaching its audience; and (3) its success, meaning whether it achieved its desired targets and outcomes. The following questions were asked of each criterion:
Relevance • Did the campaign contribute to CCEE’s goals? • Did the campaign fill an identified public need? • Did the campaign duplicate or complement existing programs?
Design and Delivery • Was the campaign effectively designed? • Was the campaign effectively delivered?
Success • Has the campaign achieved its expected immediate outcomes? • Has the campaign achieved its expected intermediate outcomes?
To answer these questions, a document review was completed, key informant interviews were conducted, and survey results and administrative data were analyzed. A complete overview of the methodology used in the evaluation is provided in Annex A. Long-term outcomes were not evaluated as these outcomes are influenced by a broad range of socio-economic and other factors and it is not possible to assess success towards achieving these outcomes at this time.
Challenges and Limitations Throughout the evaluation process challenges were encountered in finding appropriate comparable data, as no other public awareness campaign had been implemented locally on the same subject. There were also challenges encountered in determining the exact reach of the campaign through advertising, as different companies use different metrics for determining reach. It was not possible to determine the exact reach achieved through promotional events, as the necessary data was not available in most instances. Additionally, when evaluating outcomes it is difficult to determine causal relationships as various socio-economic factors and the activities of other campaigns or initiatives may equally point toward the same outcome. This evaluation was completed using in-house resources. Limited human and financial resources did not allow for all evaluation methods to be employed, such as focus group testing.
Evaluation of the Turn Back the Tide Campaign 16
Relevance
Did the campaign contribute to CCEE’s goals? The evaluation showed the Turn Back the Tide campaign positively contributed to CCEE’s goals. In the 2011 climate change and energy efficiency action plans, CCEE committed to develop a public awareness campaign on climate change and energy efficiency. This campaign was to be developed to demonstrate provincial government leadership and promote economy-wide action on these issues. The launch of the Turn Back the Tide campaign was a fulfillment of this commitment. Other goals of these action plans were indirectly supported through the launch of the Turn Back the Tide campaign, as increasing awareness is an important step in improving the province’s resilience to the impacts of climate change, reducing GHG emissions and improving energy efficiency. Additionally, CCEE’s 2011-14 Business Plan outlined the goal to support actions to reduce GHG emissions and promote energy efficiency in Newfoundland and Labrador. The launch of a public awareness campaign was listed as an indicator under this goal. The launch of the Turn Back the Tide campaign allowed CCEE to report positively on this indicator.
Did the campaign fill an identified public need? The evaluation showed the Turn Back the Tide campaign positively filled an identified public need. A key message heard during public consultations held on climate change and energy efficiency in 2010 was the need for government to do more to increase public awareness on the issues of climate change and energy efficiency. During these consultations, participants felt that most members of the public had low awareness of the issues, including how climate change could impact the province and ways individuals could make a difference. In particular, most felt that citizens of the province had limited to no awareness of ways to adapt to climate change and reduce GHG emissions. Overall, one of the main themes of feedback received through the consultation process was the need for government to strengthen public awareness efforts on climate change and energy efficiency. The Turn Back the Tide campaign was developed specifically to fill this need.
Evaluating the relevance of the campaign required examining whether the campaign was necessary. This section therefore asks three key questions:
• Did the campaign contribute to CCEE’s goals? • Did the campaign fill an identified public need? • Did the campaign duplicate or complement existing programs?
The methodology used to answer these questions is outlined in Annex A.
Evaluation of the Turn Back the Tide Campaign 17
Additionally, the baseline survey conducted in 2012 further substantiated the need for increased understanding of climate change and energy efficiency in the province. The survey revealed that almost all respondents (96 per cent) believed that climate change was happening, but only 21 per cent felt very informed about the potential impacts of climate change on them as an individual. When asked who should take action to help reduce the impacts of climate change, respondents felt that it should be government (53 per cent) and individuals (61 per cent).
Did the campaign duplicate or complement existing initiatives? The evaluation showed the Turn Back the Tide campaign did not duplicate existing initiatives and sought to complement initiatives, where possible. The Turn Back the Tide campaign was the Government of Newfoundland and Labrador’s first public awareness campaign on climate change and energy efficiency. As such, it did not duplicate any existing efforts by the Provincial Government. As the Turn Back the Tide campaign was designed to provide information that was tailored specifically for Newfoundlanders and Labradorians, it did not duplicate initiatives by other governments or out-of-province entities. Additionally, while other organizations in the province had ongoing campaigns with messages that intersected with the Turn Back the Tide campaign, no other campaign brought together messages on climate change in a comprehensive and user-friendly way to explain what the problem is and how a wide variety of individual actions could help tackle climate change. For example, the Multi Materials Stewardship Board implements initiatives to raise awareness about waste diversion and the takeCHARGE program implements initiatives to raise awareness about energy efficiency, but neither of these programs connected the dots between these distinct issues and the broader suite of actions individuals could take on climate change. The Turn Back the Tide campaign proactively reached out to these organizations and sought opportunities to ensure approaches were complementary and messages were consistent and mutually reinforcing. For example, the Turn Back the Tide website provided an authoritative “one-stop shop” for tools and resources on climate change and energy efficiency, including providing links through to the other entities’ websites. Turn Back the Tide also collaborated with these entities on Facebook initiatives to increase traffic to each other’s websites during key events. In addition to messaging and online cooperation, the Turn Back the Tide campaign was able to partner with the takeCHARGE program and the Canadian Home Builders’ Association of Newfoundland and Labrador to promote energy efficiency during the 2014 Home Show.
Evaluation of the Turn Back the Tide Campaign 18
Design and Delivery
Was the campaign effectively designed? An effectively designed campaign is one that has a defined goal and target audience and that has a well-planned delivery and assessment of performance. CCEE had expertise in climate change and energy efficiency and conducted an environmental scan of the best practices of organizations in other provinces that have been successful in relaying similar messages to the public. This, combined with the marketing research of m5 Group to determine the creative concept, was used to design the campaign.
Creative and Digital Asset Development The defined target audience for the design of the look and feel of the campaign, based upon the research of m5 Group, was identified as the female head of household. This target audience was selected as “the decision makers in most homes are women and women are the ones we need to connect with” (m5 Creative Brief). This target population served as the focus in developing the campaign’s creative design. By tailoring the campaign’s design to target this segment of the population, the campaign would appeal to families within the province and extend its overall reach. All creative assets were to be designed to reach this target audience by relying heavily on local imagery and using local actors and vernacular whenever possible, such as in the campaign videos. This target audience was also used in designing the creative approach for the campaign’s digital assets. However, the deployment of the campaign was designed to achieve province-wide reach in order to increase awareness and understanding on these issues among as many Newfoundlanders and Labradorians as possible. As such, the campaign’s website contains dedicated information portals for homeowners, businesses and communities, including schools. The opportunities for action by each of these groups are distinct and effort was made to ensure each group had direct access to all of the relevant information.
Evaluating the design and delivery of the campaign required examining whether the campaign’s approach was effective in reaching its audience. As such, this section asks two key questions:
• Was the campaign effectively designed? • Was the campaign effectively delivered?
The methodology used to answer these questions is outlined in Annex A.
Evaluation of the Turn Back the Tide Campaign 19
Deployment Planning Thorough deployment planning at the outset of the campaign helped to achieve province-wide reach. The strategy developed by SPARK Marketing provided useful recommendations on how best to achieve this by suggesting a multi-pronged approach for delivery. Additionally, given a key goal of the campaign was to increase the province’s understanding of climate change and energy efficiency, a strategic decision was taken early in the campaign to drive traffic to the Turn Back the Tide website wherever possible. This includes promoting the website during advertising, via social media, and during partnership activities and promotional events. This was done to ensure individuals could access additional resources and information to increase their understanding of climate change and energy efficiency, including actions that can be taken.
Evaluation Planning The development of a performance measurement framework and the completion of evaluation planning at the outset of the campaign helped to ensure adequate collection of data. Targets were set for some aspects of the campaign as previously described. Baseline and follow-up surveys were conducted in 2012 and 2014, respectively, to help with the evaluation of this campaign. Collection and monitoring of data was conducted on an on-going basis with further data collection and interviews occurring at the end to support the evaluation.
Was the campaign effectively delivered? The delivery of a public awareness campaign is determined to be effective if it reached and engaged its intended audiences using the selected deployment methods and available financial resources.
Utilizing Financial Resources In financial years 2012-13 and 2013-14, the Turn Back the Tide campaign received funding to complete province-wide advertising, as outlined in the next section. The budget allocated for advertising each year was $100,000. The campaign was able to achieve its advertising goal each year by coming in under budget at $93,164 in year one and $93,679 in year two. The media buy for the campaign was completed using in-house expertise. This would have cost between $24,000 and $30,000 over two years to complete through a contractual arrangement. Completing this work in-house allowed the campaign to purchase additional advertising space while achieving overall cost savings for advertising. Cost savings were also achieved by completing other components of the campaign’s delivery in-house, including the hosting and maintenance of the campaign’s website, maintenance of the campaign’s Facebook Page, and the development of additional creative assets (e.g. fact sheets, posters). The campaign was able to use the remaining funding from advertising to support partnerships with community organizations and participation in promotional events. As outlined earlier,
Evaluation of the Turn Back the Tide Campaign 20
CCEE also developed resources to meet the objectives in its 2011-2014 Business Plan and, where possible, these resources were deployed under the Turn Back the Tide campaign to add value to campaign and raise the profile and uptake of the new resources. These synergies were possible because of the strong ties between the objectives of the Turn Back the Tide campaign and CCEE’s lines of business, one of which is to advance sustained action on climate change and energy efficiency, including by deepening public awareness on these issues. Additionally, by focusing on the establishment of effective and mutually beneficial partnerships with community organizations, the campaign was able to leverage additional resources. This includes leveraging:
• $16,000 from the Department of Fisheries and Aquaculture as part of the partnership with Bonne Bay Marine Station to install a climate change exhibit at the marine station;
• $4,500 from Grenfell Campus, Memorial University, as part of the partnership with Bonne Bay Marine Station to install a climate change exhibit at the marine station;
• $15,000 from the Department of Municipal and Intergovernmental Affairs, as part of the Municipal Government Carbon Footprint Challenge; and
• $300 from participating restaurants as part of the Green Restaurants partnership with the Restaurant Association of Newfoundland and Labrador.
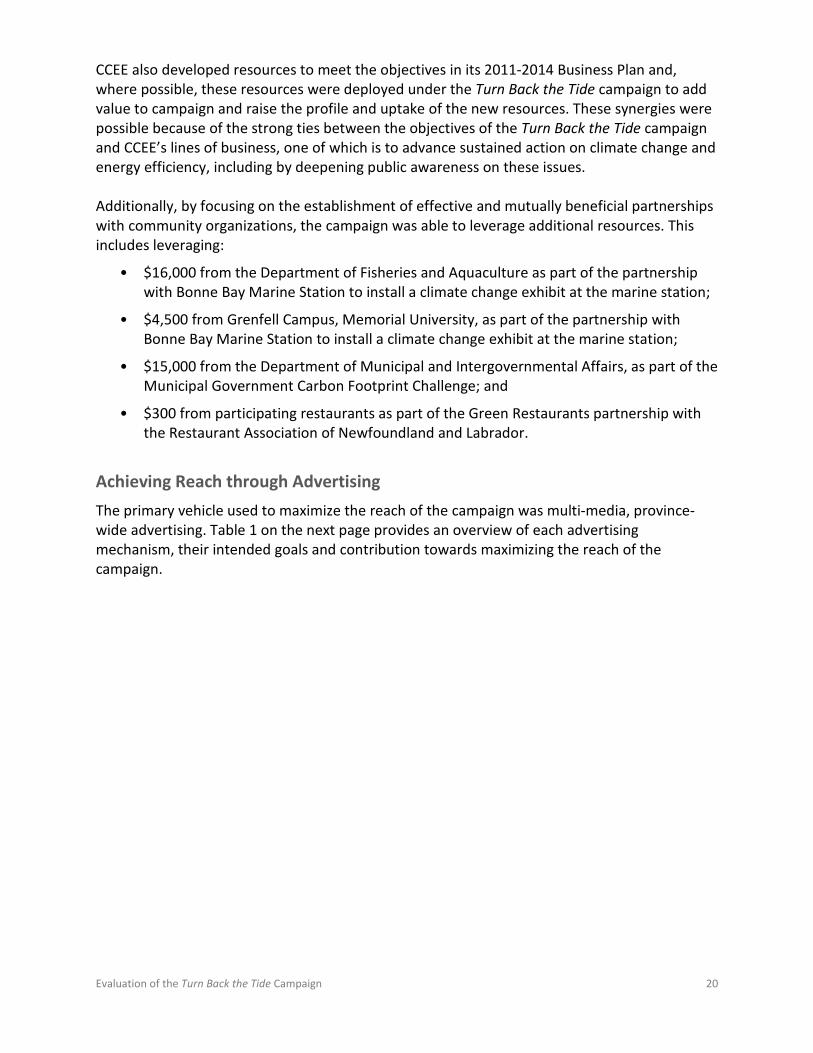
Achieving Reach through Advertising The primary vehicle used to maximize the reach of the campaign was multi-media, province-wide advertising. Table 1 on the next page provides an overview of each advertising mechanism, their intended goals and contribution towards maximizing the reach of the campaign.
Evaluation of the Turn Back the Tide Campaign 21
Table 1: Overview of Campaign Advertising
Type Vehicle Goal Result Total Cost
Campaign Familiarity
through Advertising1
Television advertising CBC, NTV
Maximize province-wide advertising
• 30-second commercials aired province-wide, including during prime spots.
• A total of 8,694,100 impressions2 were generated over two years.
$109,543 81%
Online advertising
Website for VOCM, CBC NL, NTV, The Telegram, The Western Star, Facebook
Maximize traffic to the Turn Back the Tide website
• A mix of online banner advertisements and pre-roll commercials were used over two years.
• This resulted in 18,262 visits to the campaign website, accounting for 32 per cent of total visits as of March 31, 2014.
$60,301 15%
Newspaper advertising
The Telegram, The Western Star, The Labradorian, The Aurora, The Northeast Avalon Times
Ensure geographic coverage
• Geographic coverage was achieved by advertising in a mix of province-wide and regional newspapers.
• This generated 245,108 total impressions3 over one year, including 30,000 on the west coast through The Western Star and 17,908 in Labrador through The Labradorian and The Aurora.
$16,998 8%
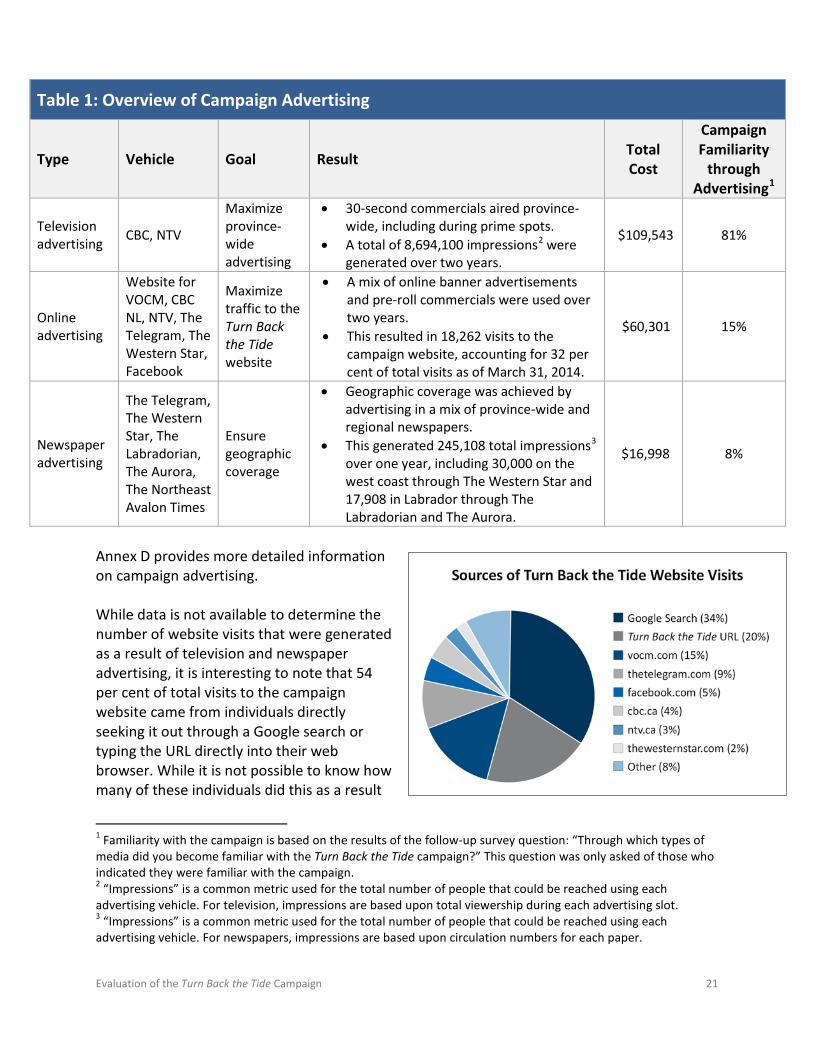
Annex D provides more detailed information on campaign advertising. While data is not available to determine the number of website visits that were generated as a result of television and newspaper advertising, it is interesting to note that 54 per cent of total visits to the campaign website came from individuals directly seeking it out through a Google search or typing the URL directly into their web browser. While it is not possible to know how many of these individuals did this as a result
1 Familiarity with the campaign is based on the results of the follow-up survey question: “Through which types of media did you become familiar with the Turn Back the Tide campaign?” This question was only asked of those who indicated they were familiar with the campaign. 2 “Impressions” is a common metric used for the total number of people that could be reached using each advertising vehicle. For television, impressions are based upon total viewership during each advertising slot. 3 “Impressions” is a common metric used for the total number of people that could be reached using each advertising vehicle. For newspapers, impressions are based upon circulation numbers for each paper.
Evaluation of the Turn Back the Tide Campaign 22
of viewing advertisements either on television or in newspapers, analytics show that during periods of advertising, website traffic increased more than threefold in comparison to previous weeks. As such, it is likely that this advertising had the added benefit of driving traffic to the campaign website. This advertising allowed the campaign to exceed its target for achieving 50,000 website visits, as a total of over 56,000 visits were achieved from September 2012 to March 2014. Annex E provides an overview of website analytics for the Turn Back the Tide website. The reach of the campaign was shown in the follow-up survey results completed in April 2014. Almost half of respondents said that they were aware of the campaign. Of these respondents, some of whom noted multiple responses, most were familiar with the campaign though television (81 per cent). A further 15 per cent were familiar with the campaign via online advertisements and 8 per cent via newspaper advertisements.
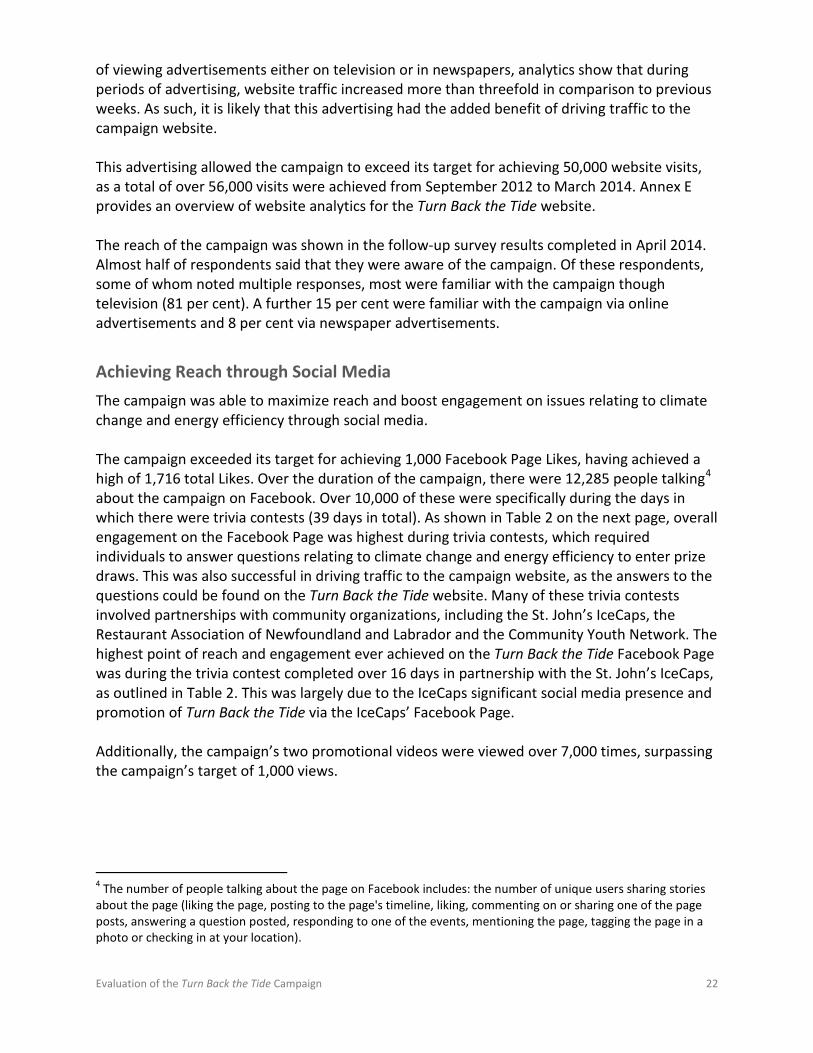
Achieving Reach through Social Media The campaign was able to maximize reach and boost engagement on issues relating to climate change and energy efficiency through social media. The campaign exceeded its target for achieving 1,000 Facebook Page Likes, having achieved a high of 1,716 total Likes. Over the duration of the campaign, there were 12,285 people talking4 about the campaign on Facebook. Over 10,000 of these were specifically during the days in which there were trivia contests (39 days in total). As shown in Table 2 on the next page, overall engagement on the Facebook Page was highest during trivia contests, which required individuals to answer questions relating to climate change and energy efficiency to enter prize draws. This was also successful in driving traffic to the campaign website, as the answers to the questions could be found on the Turn Back the Tide website. Many of these trivia contests involved partnerships with community organizations, including the St. John’s IceCaps, the Restaurant Association of Newfoundland and Labrador and the Community Youth Network. The highest point of reach and engagement ever achieved on the Turn Back the Tide Facebook Page was during the trivia contest completed over 16 days in partnership with the St. John’s IceCaps, as outlined in Table 2. This was largely due to the IceCaps significant social media presence and promotion of Turn Back the Tide via the IceCaps’ Facebook Page. Additionally, the campaign’s two promotional videos were viewed over 7,000 times, surpassing the campaign’s target of 1,000 views.
4 The number of people talking about the page on Facebook includes: the number of unique users sharing stories about the page (liking the page, posting to the page's timeline, liking, commenting on or sharing one of the page posts, answering a question posted, responding to one of the events, mentioning the page, tagging the page in a photo or checking in at your location).
Evaluation of the Turn Back the Tide Campaign 23
Table 2: Facebook Trivia Contests – Page Engagement and Website Traffic
Trivia Contest Time Frame Total people talking about the page on
Total website visits from Facebook
12 Days of Climate Change
Before Contest (6 days) 93 35 During Contest (6 days) 2117 151 After Contest (6 days) 151 26
St. John’s IceCaps Before Contest (16 days) 102 52 During Contest (16 days) 6413 1182 After Contest (16 days) 81 57
Green Restaurants Before Contest (6 days) 34 1 During Contest (6 days) 765 127 After Contest (6 days) 28 10
CYN Transportation Trivia Before Contest (5 days) 12 0 During Contest (5 days) 929 176 After Contest (5 days) 22 10
Annex F provides more detailed information on Facebook Page analytics.
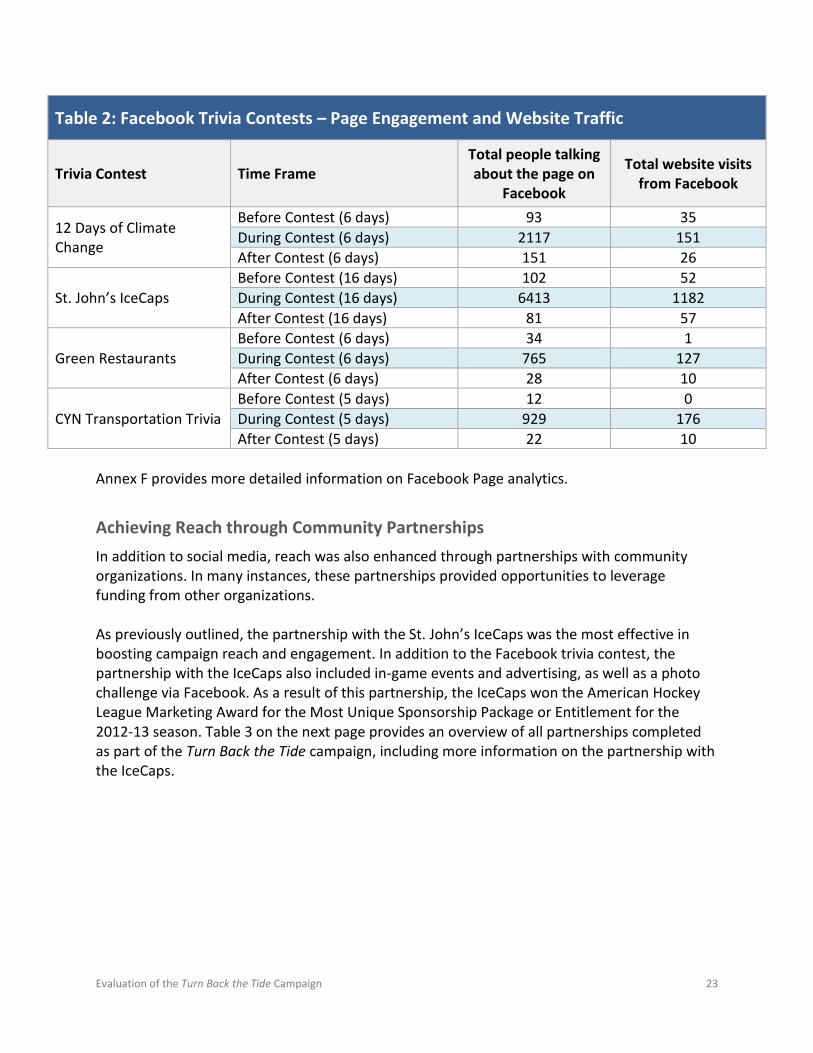
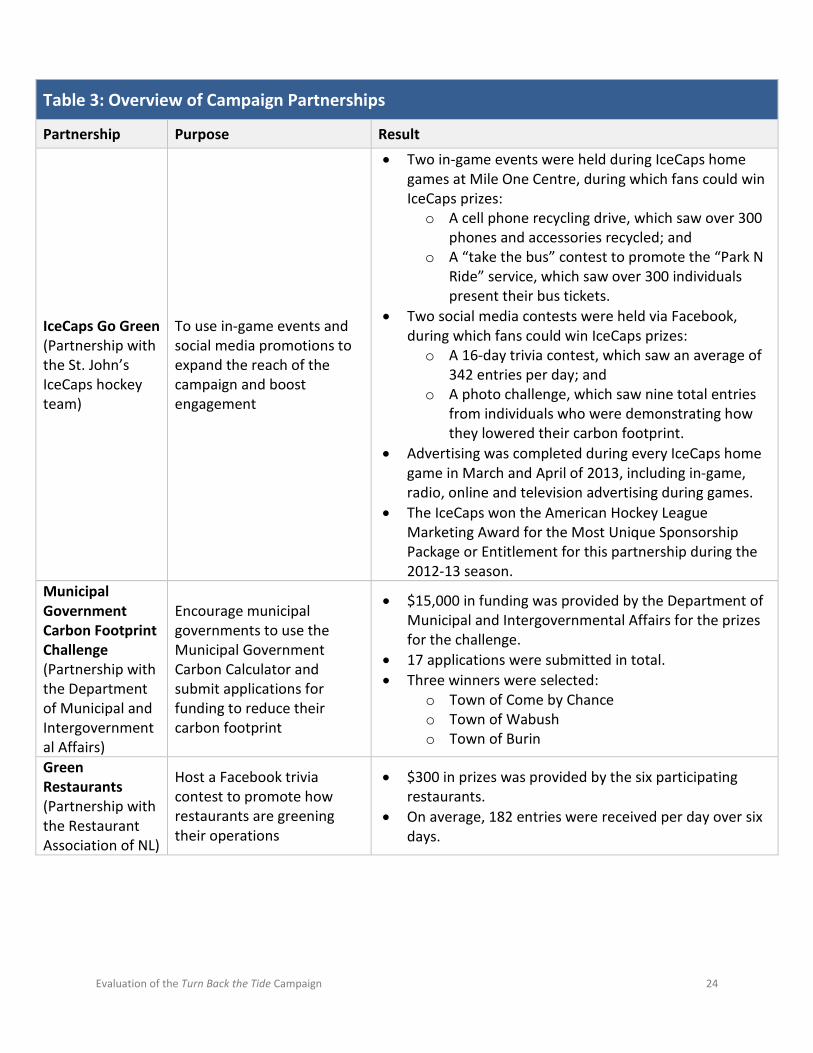
Achieving Reach through Community Partnerships In addition to social media, reach was also enhanced through partnerships with community organizations. In many instances, these partnerships provided opportunities to leverage funding from other organizations. As previously outlined, the partnership with the St. John’s IceCaps was the most effective in boosting campaign reach and engagement. In addition to the Facebook trivia contest, the partnership with the IceCaps also included in-game events and advertising, as well as a photo challenge via Facebook. As a result of this partnership, the IceCaps won the American Hockey League Marketing Award for the Most Unique Sponsorship Package or Entitlement for the 2012-13 season. Table 3 on the next page provides an overview of all partnerships completed as part of the Turn Back the Tide campaign, including more information on the partnership with the IceCaps.
Evaluation of the Turn Back the Tide Campaign 24
Table 3: Overview of Campaign Partnerships
Partnership Purpose Result
IceCaps Go Green (Partnership with the St. John’s IceCaps hockey team)
To use in-game events and social media promotions to expand the reach of the campaign and boost engagement
• Two in-game events were held during IceCaps home games at Mile One Centre, during which fans could win IceCaps prizes: o A cell phone recycling drive, which saw over 300
phones and accessories recycled; and o A “take the bus” contest to promote the “Park N
Ride” service, which saw over 300 individuals present their bus tickets.
• Two social media contests were held via Facebook, during which fans could win IceCaps prizes: o A 16-day trivia contest, which saw an average of
342 entries per day; and o A photo challenge, which saw nine total entries
from individuals who were demonstrating how they lowered their carbon footprint.
• Advertising was completed during every IceCaps home game in March and April of 2013, including in-game, radio, online and television advertising during games.
• The IceCaps won the American Hockey League Marketing Award for the Most Unique Sponsorship Package or Entitlement for this partnership during the 2012-13 season.
Municipal Government Carbon Footprint Challenge (Partnership with the Department of Municipal and Intergovernmental Affairs)
Encourage municipal governments to use the Municipal Government Carbon Calculator and submit applications for funding to reduce their carbon footprint
• $15,000 in funding was provided by the Department of Municipal and Intergovernmental Affairs for the prizes for the challenge.
• 17 applications were submitted in total. • Three winners were selected:
o Town of Come by Chance o Town of Wabush o Town of Burin
Green Restaurants (Partnership with the Restaurant Association of NL)
Host a Facebook trivia contest to promote how restaurants are greening their operations
• $300 in prizes was provided by the six participating restaurants.
• On average, 182 entries were received per day over six days.
Evaluation of the Turn Back the Tide Campaign 25
Table 3: Overview of Campaign Partnerships
Partnership Purpose Result
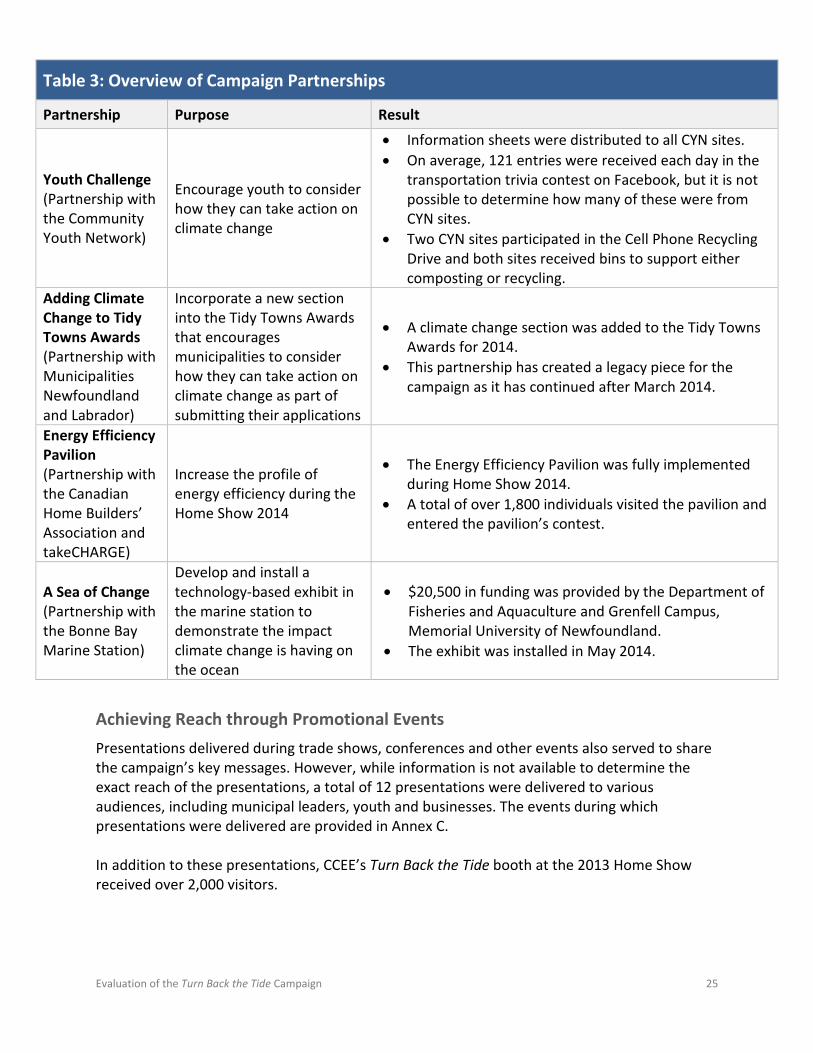
Youth Challenge (Partnership with the Community Youth Network)
Encourage youth to consider how they can take action on climate change
• Information sheets were distributed to all CYN sites. • On average, 121 entries were received each day in the
transportation trivia contest on Facebook, but it is not possible to determine how many of these were from CYN sites.
• Two CYN sites participated in the Cell Phone Recycling Drive and both sites received bins to support either composting or recycling.
Adding Climate Change to Tidy Towns Awards (Partnership with Municipalities Newfoundland and Labrador)
Incorporate a new section into the Tidy Towns Awards that encourages municipalities to consider how they can take action on climate change as part of submitting their applications
• A climate change section was added to the Tidy Towns Awards for 2014.
• This partnership has created a legacy piece for the campaign as it has continued after March 2014.
Energy Efficiency Pavilion (Partnership with the Canadian Home Builders’ Association and takeCHARGE)
Increase the profile of energy efficiency during the Home Show 2014
• The Energy Efficiency Pavilion was fully implemented during Home Show 2014.
• A total of over 1,800 individuals visited the pavilion and entered the pavilion’s contest.
A Sea of Change (Partnership with the Bonne Bay Marine Station)
Develop and install a technology-based exhibit in the marine station to demonstrate the impact climate change is having on the ocean
• $20,500 in funding was provided by the Department of Fisheries and Aquaculture and Grenfell Campus, Memorial University of Newfoundland.
• The exhibit was installed in May 2014.
Achieving Reach through Promotional Events Presentations delivered during trade shows, conferences and other events also served to share the campaign’s key messages. However, while information is not available to determine the exact reach of the presentations, a total of 12 presentations were delivered to various audiences, including municipal leaders, youth and businesses. The events during which presentations were delivered are provided in Annex C. In addition to these presentations, CCEE’s Turn Back the Tide booth at the 2013 Home Show received over 2,000 visitors.
Evaluation of the Turn Back the Tide Campaign 26
Success
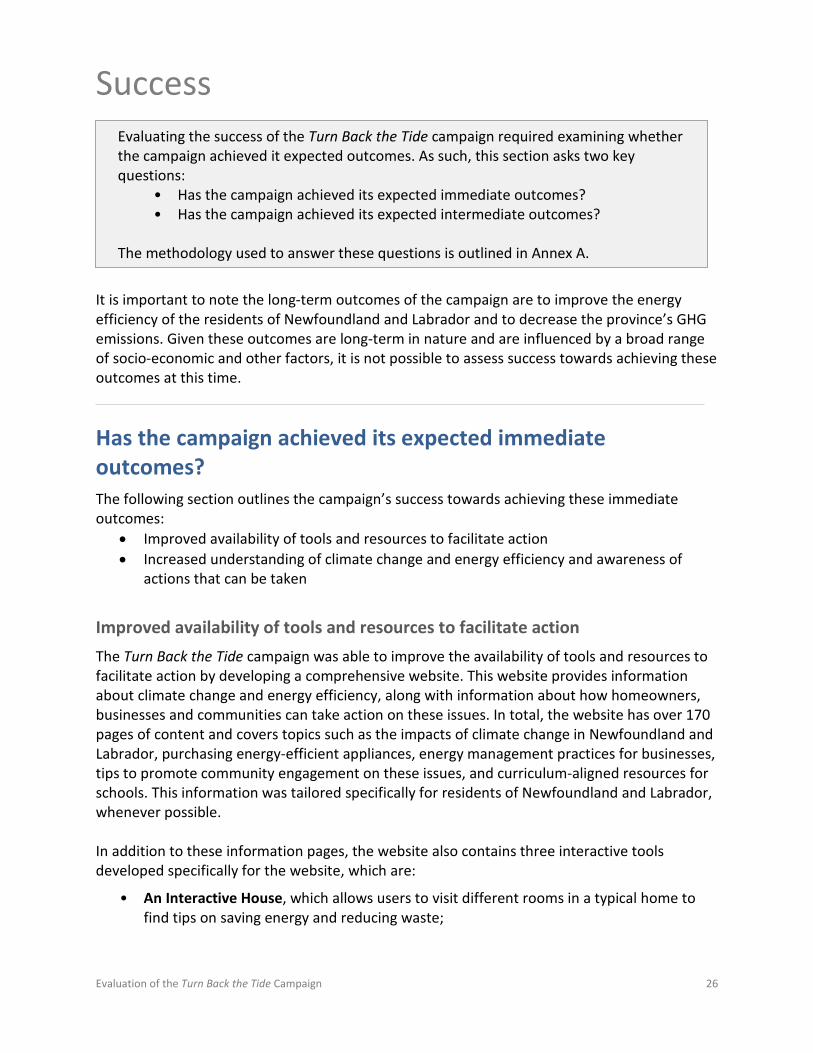
It is important to note the long-term outcomes of the campaign are to improve the energy efficiency of the residents of Newfoundland and Labrador and to decrease the province’s GHG emissions. Given these outcomes are long-term in nature and are influenced by a broad range of socio-economic and other factors, it is not possible to assess success towards achieving these outcomes at this time.
Has the campaign achieved its expected immediate outcomes? The following section outlines the campaign’s success towards achieving these immediate outcomes:
• Improved availability of tools and resources to facilitate action • Increased understanding of climate change and energy efficiency and awareness of
actions that can be taken
Improved availability of tools and resources to facilitate action The Turn Back the Tide campaign was able to improve the availability of tools and resources to facilitate action by developing a comprehensive website. This website provides information about climate change and energy efficiency, along with information about how homeowners, businesses and communities can take action on these issues. In total, the website has over 170 pages of content and covers topics such as the impacts of climate change in Newfoundland and Labrador, purchasing energy-efficient appliances, energy management practices for businesses, tips to promote community engagement on these issues, and curriculum-aligned resources for schools. This information was tailored specifically for residents of Newfoundland and Labrador, whenever possible. In addition to these information pages, the website also contains three interactive tools developed specifically for the website, which are:
• An Interactive House, which allows users to visit different rooms in a typical home to find tips on saving energy and reducing waste;
Evaluating the success of the Turn Back the Tide campaign required examining whether the campaign achieved it expected outcomes. As such, this section asks two key questions:
• Has the campaign achieved its expected immediate outcomes? • Has the campaign achieved its expected intermediate outcomes?
The methodology used to answer these questions is outlined in Annex A.
Evaluation of the Turn Back the Tide Campaign 27
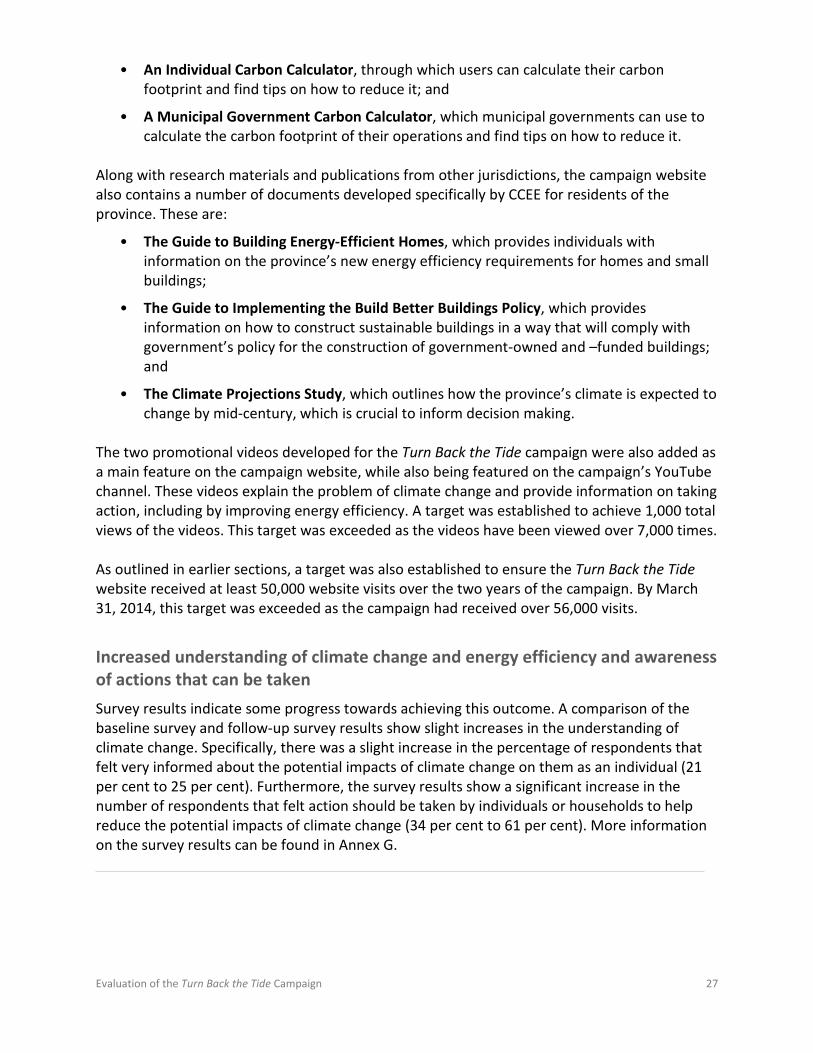
• An Individual Carbon Calculator, through which users can calculate their carbon footprint and find tips on how to reduce it; and
• A Municipal Government Carbon Calculator, which municipal governments can use to calculate the carbon footprint of their operations and find tips on how to reduce it.
Along with research materials and publications from other jurisdictions, the campaign website also contains a number of documents developed specifically by CCEE for residents of the province. These are:
• The Guide to Building Energy-Efficient Homes, which provides individuals with information on the province’s new energy efficiency requirements for homes and small buildings;
• The Guide to Implementing the Build Better Buildings Policy, which provides information on how to construct sustainable buildings in a way that will comply with government’s policy for the construction of government-owned and –funded buildings; and
• The Climate Projections Study, which outlines how the province’s climate is expected to change by mid-century, which is crucial to inform decision making.
The two promotional videos developed for the Turn Back the Tide campaign were also added as a main feature on the campaign website, while also being featured on the campaign’s YouTube channel. These videos explain the problem of climate change and provide information on taking action, including by improving energy efficiency. A target was established to achieve 1,000 total views of the videos. This target was exceeded as the videos have been viewed over 7,000 times. As outlined in earlier sections, a target was also established to ensure the Turn Back the Tide website received at least 50,000 website visits over the two years of the campaign. By March 31, 2014, this target was exceeded as the campaign had received over 56,000 visits.
Increased understanding of climate change and energy efficiency and awareness of actions that can be taken Survey results indicate some progress towards achieving this outcome. A comparison of the baseline survey and follow-up survey results show slight increases in the understanding of climate change. Specifically, there was a slight increase in the percentage of respondents that felt very informed about the potential impacts of climate change on them as an individual (21 per cent to 25 per cent). Furthermore, the survey results show a significant increase in the number of respondents that felt action should be taken by individuals or households to help reduce the potential impacts of climate change (34 per cent to 61 per cent). More information on the survey results can be found in Annex G.
Evaluation of the Turn Back the Tide Campaign 28
Has the campaign achieved its expected intermediate outcomes? The intermediate outcomes for the campaign are as follows:
• Established behavioural change towards increasing energy efficiency and reducing GHG emissions in the province
• Demonstrated government leadership on climate change and energy efficiency
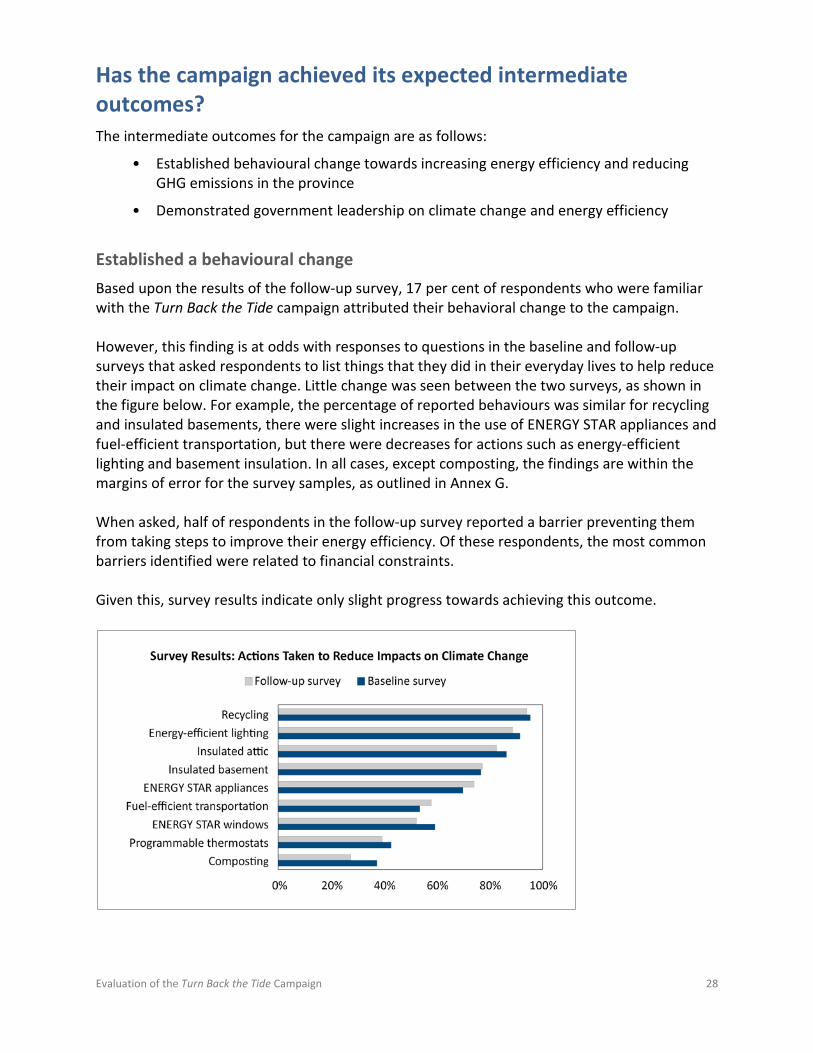
Established a behavioural change Based upon the results of the follow-up survey, 17 per cent of respondents who were familiar with the Turn Back the Tide campaign attributed their behavioral change to the campaign. However, this finding is at odds with responses to questions in the baseline and follow-up surveys that asked respondents to list things that they did in their everyday lives to help reduce their impact on climate change. Little change was seen between the two surveys, as shown in the figure below. For example, the percentage of reported behaviours was similar for recycling and insulated basements, there were slight increases in the use of ENERGY STAR appliances and fuel-efficient transportation, but there were decreases for actions such as energy-efficient lighting and basement insulation. In all cases, except composting, the findings are within the margins of error for the survey samples, as outlined in Annex G. When asked, half of respondents in the follow-up survey reported a barrier preventing them from taking steps to improve their energy efficiency. Of these respondents, the most common barriers identified were related to financial constraints. Given this, survey results indicate only slight progress towards achieving this outcome.
Evaluation of the Turn Back the Tide Campaign 29
Demonstrated government leadership CCEE’s work on this public awareness campaign has demonstrated government leadership that has been recognized through receiving awards. Specifically, in 2014 the Turn Back the Tide campaign won two Pinnacle Awards. The Pinnacle Awards showcase excellence in business communication and are awarded by the Newfoundland and Labrador Chapter of the International Association of Business Communicators. The awards received were:
• An Award of Merit under the category of Digital Communication Channels
• An Award of Excellence under the category of Government Communication Programs Additionally, the Turn Back the Tide campaign was featured in 25 news articles and releases, ranging from articles in The Telegram and Downhome Magazine, to news releases from the Newfoundland and Labrador Environmental Industry Association. This helped to demonstrate government’s commitment to action on climate change and energy efficiency.
Evaluation of the Turn Back the Tide Campaign 30
Conclusion
Evaluation of the Turn Back the Tide Campaign 31
Summary of Key Findings The following is a summary of the evaluation’s key findings: Relevance • The campaign helped achieve CCEE’s goals, specifically the commitment in the 2011 climate
change and energy efficiency action plans to launch a public awareness campaign. • The campaign filled an identified public need, as public consultations held on climate
change and energy efficiency in 2010 indicated the need for government to take a leadership role in increasing awareness and understanding of these issues.
• The campaign did not duplicate existing initiatives and sought to complement initiatives where possible, such as initiatives undertaken by the takeCHARGE program on energy efficiency and the Multi Materials Stewardship Board on waste diversion.
Design and Delivery • The design of the campaign was based upon thorough research during the development of
assets, as well as during deployment and evaluation planning. • The campaign effectively utilized financial resources, levered funding from other
departments and entities and benefited from synergies with other work that was being done by CCEE that could be promoted through the Turn Back the Tide campaign.
• The campaign achieved reach by completing province-wide advertising, maintaining a social media presence, establishing community partnerships and participating in promotional events.
• The campaign achieved all targets established for delivery by achieving over 56,000 website visits by March 31, 2014 (target: 50,000), over 1,700 Facebook Page Likes (target: 1,000) and over 7,000 video views (target: 1,000)
Success Immediate Outcomes • The campaign was able to improve the availability of tools and resources through the
launch of the Turn Back the Tide website, which contains over 170 total pages of content, three interactive tools that provide tips on taking action, and three publications developed by CCEE, as well as a number of publications by other organizations.
• Follow-up survey results indicate some progress towards increasing understanding of climate change and energy efficiency and awareness of actions that can be taken.
Intermediate Outcomes • Follow-up survey results indicate only slight progress towards establishing behavioural
change. • The Turn Back the Tide campaign demonstrated provincial government leadership by
receiving two Pinnacle Awards in 2014 from the Newfoundland and Labrador chapter of the International Association of Business Communicators.
Evaluation of the Turn Back the Tide Campaign 32
Update on Ongoing Campaign Activities While the budget for campaign advertising ended on March 31, 2014, several campaign activities have continued. This includes continued hosting and maintenance of the campaign website, which was made possible by deciding to host the website internally. As of March 24, 2015, this website had received 87,329 total visits. CCEE continues to add new content to this website, including “What’s New?” articles, which provide updates on new programs and initiatives, as well as current events. CCEE also continues to add new publications to this page. Since March 31, 2014, this has included added the “Buying Green” guide, which provides tips and advice on purchasing environmentally preferable products, as well as “Climate Change Curriculum Connections,” which is a curriculum-based resource for teachers of Environmental Science 3205. The campaign’s Facebook Page also continues to be maintained, serving as the primary vehicle through which CCEE is seeking to drive traffic to the campaign’s website. Partnerships with community organizations and participation in promotional events have also continued. The application developed as part of the partnership with the Bonne Bay Marine Station has seen over 103,000 downloads from the Apple Store as of March 12, 2015, far surpassing expectations. The integration of climate change into the Tidy Town Awards has also continued.

Evaluation of the Turn Back the Tide Campaign 33
Annexes
Evaluation of the Turn Back the Tide Campaign 34
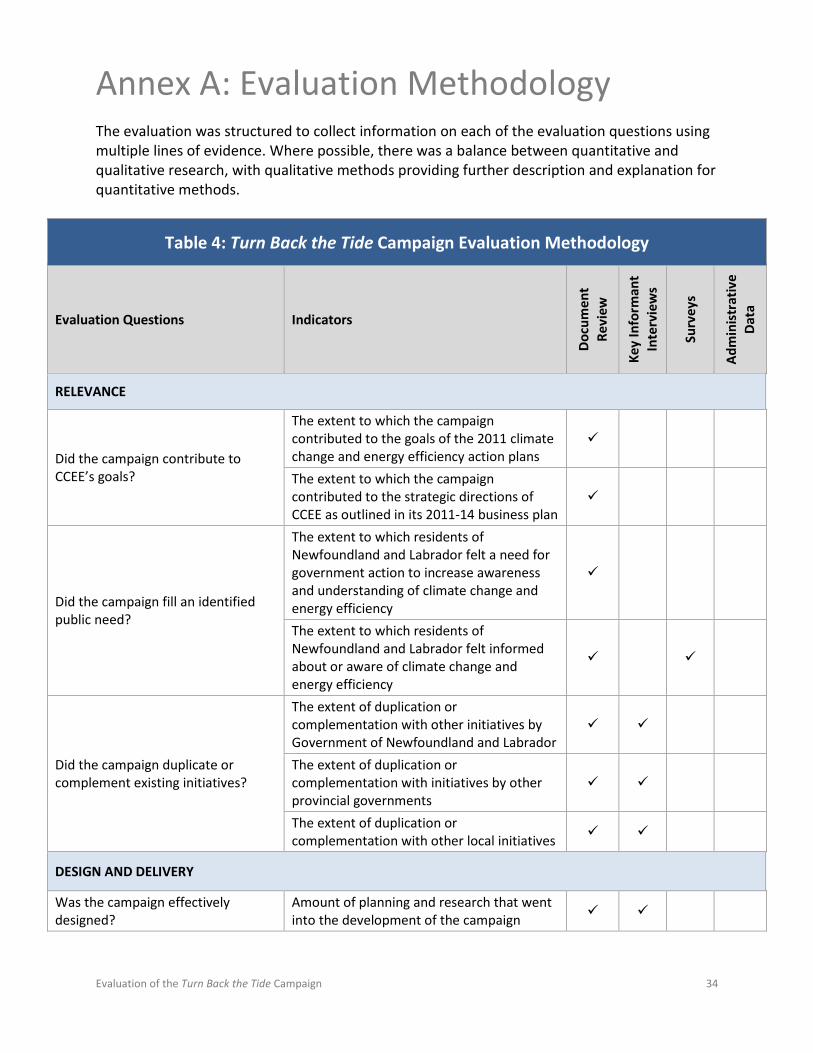
Annex A: Evaluation Methodology The evaluation was structured to collect information on each of the evaluation questions using multiple lines of evidence. Where possible, there was a balance between quantitative and qualitative research, with qualitative methods providing further description and explanation for quantitative methods.
Table 4: Turn Back the Tide Campaign Evaluation Methodology
Evaluation Questions Indicators
Docu
men
t Re
view
Key
Info
rman
t In
terv
iew
s
Surv
eys
Adm
inis
trat
ive
Data
RELEVANCE
Did the campaign contribute to CCEE’s goals?
The extent to which the campaign contributed to the goals of the 2011 climate change and energy efficiency action plans
The extent to which the campaign contributed to the strategic directions of CCEE as outlined in its 2011-14 business plan
Did the campaign fill an identified public need?
The extent to which residents of Newfoundland and Labrador felt a need for government action to increase awareness and understanding of climate change and energy efficiency
The extent to which residents of Newfoundland and Labrador felt informed about or aware of climate change and energy efficiency
Did the campaign duplicate or complement existing initiatives?
The extent of duplication or complementation with other initiatives by Government of Newfoundland and Labrador
The extent of duplication or complementation with initiatives by other provincial governments
The extent of duplication or complementation with other local initiatives
DESIGN AND DELIVERY
Was the campaign effectively designed?
Amount of planning and research that went into the development of the campaign
Evaluation of the Turn Back the Tide Campaign 35
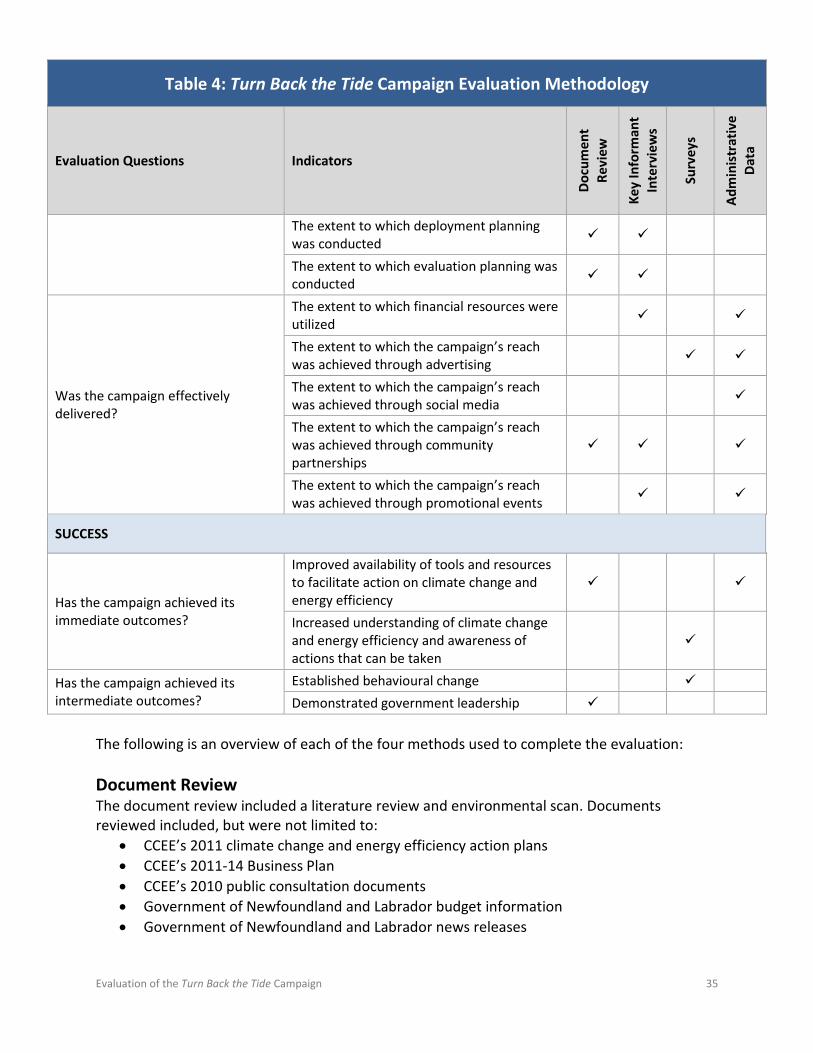
Table 4: Turn Back the Tide Campaign Evaluation Methodology
Evaluation Questions Indicators
Docu
men
t Re
view
Key
Info
rman
t In
terv
iew
s
Surv
eys
Adm
inis
trat
ive
Data
The extent to which deployment planning was conducted
The extent to which evaluation planning was conducted
Was the campaign effectively delivered?
The extent to which financial resources were utilized
The extent to which the campaign’s reach was achieved through advertising
The extent to which the campaign’s reach was achieved through social media
The extent to which the campaign’s reach was achieved through community partnerships
The extent to which the campaign’s reach was achieved through promotional events
SUCCESS
Has the campaign achieved its immediate outcomes?
Improved availability of tools and resources to facilitate action on climate change and energy efficiency
Increased understanding of climate change and energy efficiency and awareness of actions that can be taken
Has the campaign achieved its intermediate outcomes?
Established behavioural change Demonstrated government leadership
The following is an overview of each of the four methods used to complete the evaluation: Document Review The document review included a literature review and environmental scan. Documents reviewed included, but were not limited to:
• CCEE’s 2011 climate change and energy efficiency action plans • CCEE’s 2011-14 Business Plan • CCEE’s 2010 public consultation documents • Government of Newfoundland and Labrador budget information • Government of Newfoundland and Labrador news releases
Evaluation of the Turn Back the Tide Campaign 36
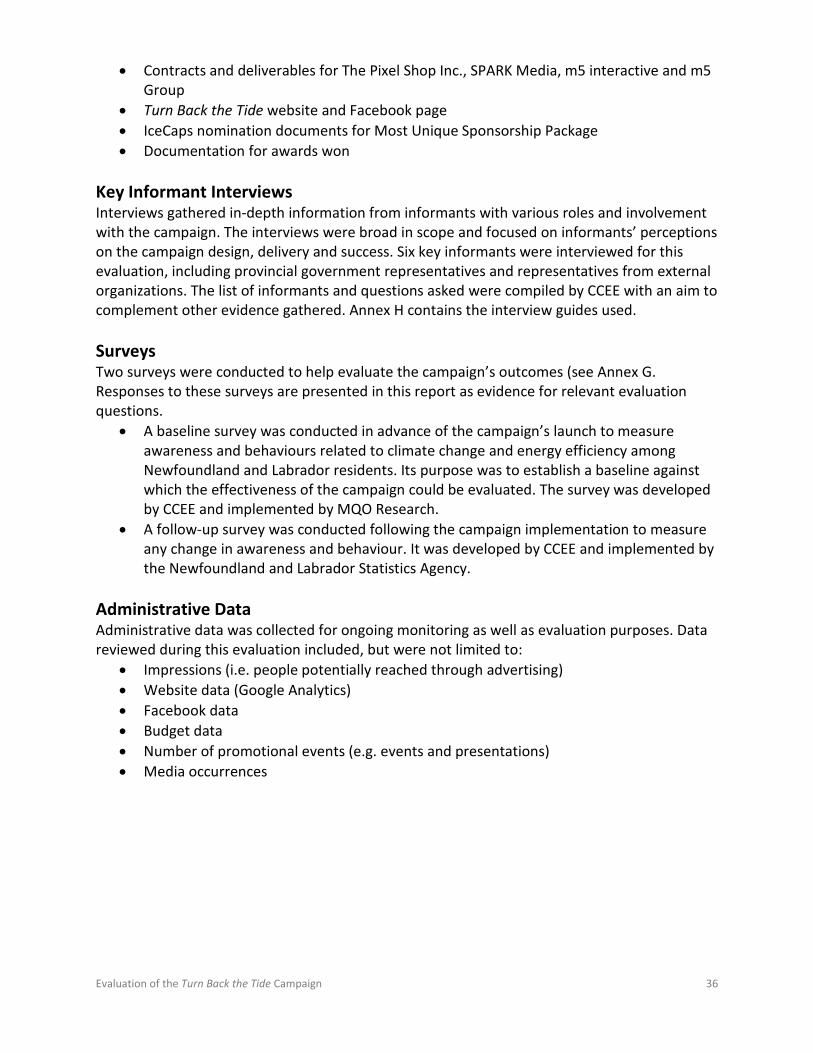
• Contracts and deliverables for The Pixel Shop Inc., SPARK Media, m5 interactive and m5 Group
• Turn Back the Tide website and Facebook page • IceCaps nomination documents for Most Unique Sponsorship Package • Documentation for awards won
Key Informant Interviews Interviews gathered in-depth information from informants with various roles and involvement with the campaign. The interviews were broad in scope and focused on informants’ perceptions on the campaign design, delivery and success. Six key informants were interviewed for this evaluation, including provincial government representatives and representatives from external organizations. The list of informants and questions asked were compiled by CCEE with an aim to complement other evidence gathered. Annex H contains the interview guides used. Surveys Two surveys were conducted to help evaluate the campaign’s outcomes (see Annex G. Responses to these surveys are presented in this report as evidence for relevant evaluation questions.
• A baseline survey was conducted in advance of the campaign’s launch to measure awareness and behaviours related to climate change and energy efficiency among Newfoundland and Labrador residents. Its purpose was to establish a baseline against which the effectiveness of the campaign could be evaluated. The survey was developed by CCEE and implemented by MQO Research.
• A follow-up survey was conducted following the campaign implementation to measure any change in awareness and behaviour. It was developed by CCEE and implemented by the Newfoundland and Labrador Statistics Agency.
Administrative Data Administrative data was collected for ongoing monitoring as well as evaluation purposes. Data reviewed during this evaluation included, but were not limited to:
• Impressions (i.e. people potentially reached through advertising) • Website data (Google Analytics) • Facebook data • Budget data • Number of promotional events (e.g. events and presentations) • Media occurrences
Evaluation of the Turn Back the Tide Campaign 37
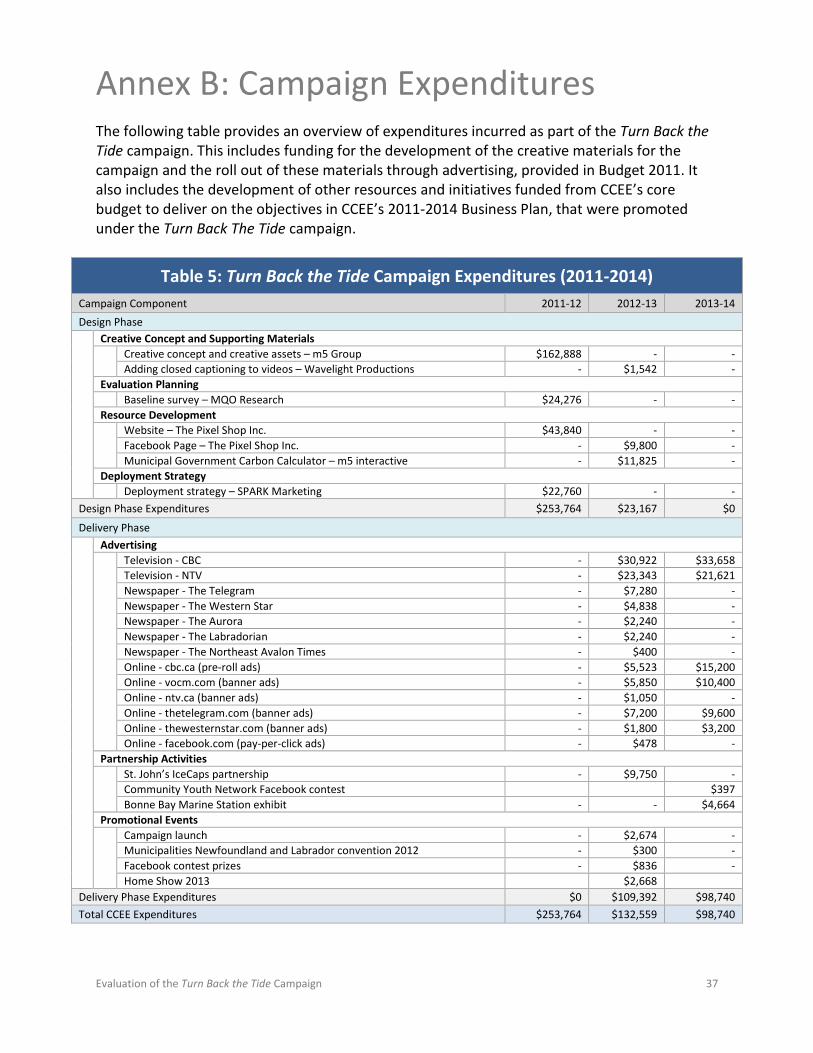
Annex B: Campaign Expenditures The following table provides an overview of expenditures incurred as part of the Turn Back the Tide campaign. This includes funding for the development of the creative materials for the campaign and the roll out of these materials through advertising, provided in Budget 2011. It also includes the development of other resources and initiatives funded from CCEE’s core budget to deliver on the objectives in CCEE’s 2011-2014 Business Plan, that were promoted under the Turn Back The Tide campaign.
Table 5: Turn Back the Tide Campaign Expenditures (2011-2014)
Campaign Component 2011-12 2012-13 2013-14 Design Phase
Creative Concept and Supporting Materials
Creative concept and creative assets – m5 Group $162,888 - - Adding closed captioning to videos – Wavelight Productions - $1,542 -
Evaluation Planning Baseline survey – MQO Research $24,276 - - Resource Development
Website – The Pixel Shop Inc. $43,840 - - Facebook Page – The Pixel Shop Inc. - $9,800 - Municipal Government Carbon Calculator – m5 interactive - $11,825 -
Deployment Strategy Deployment strategy – SPARK Marketing $22,760 - -
Design Phase Expenditures $253,764 $23,167 $0
Delivery Phase
Advertising
Television - CBC - $30,922 $33,658 Television - NTV - $23,343 $21,621 Newspaper - The Telegram - $7,280 - Newspaper - The Western Star - $4,838 - Newspaper - The Aurora - $2,240 - Newspaper - The Labradorian - $2,240 - Newspaper - The Northeast Avalon Times - $400 - Online - cbc.ca (pre-roll ads) - $5,523 $15,200 Online - vocm.com (banner ads) - $5,850 $10,400 Online - ntv.ca (banner ads) - $1,050 - Online - thetelegram.com (banner ads) - $7,200 $9,600 Online - thewesternstar.com (banner ads) - $1,800 $3,200 Online - facebook.com (pay-per-click ads) - $478 -
Partnership Activities
St. John’s IceCaps partnership - $9,750 - Community Youth Network Facebook contest $397 Bonne Bay Marine Station exhibit - - $4,664
Promotional Events
Campaign launch - $2,674 - Municipalities Newfoundland and Labrador convention 2012 - $300 - Facebook contest prizes - $836 - Home Show 2013 $2,668
Delivery Phase Expenditures $0 $109,392 $98,740 Total CCEE Expenditures $253,764 $132,559 $98,740
Evaluation of the Turn Back the Tide Campaign 38
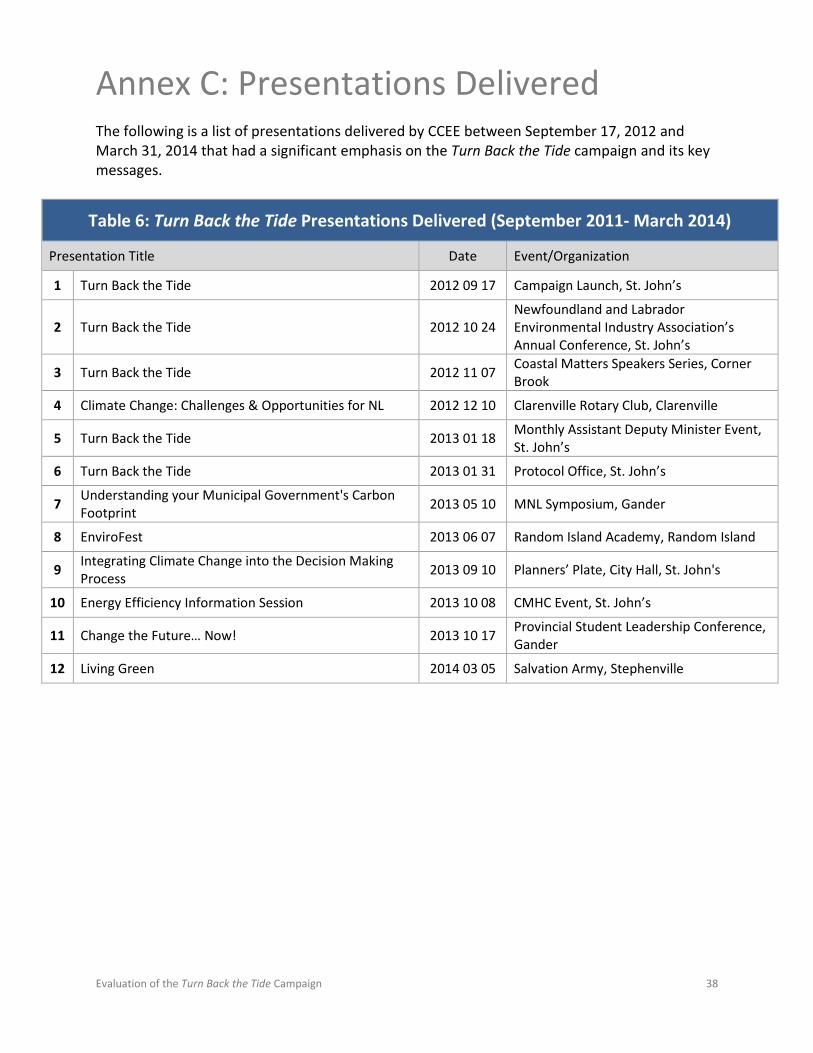
Annex C: Presentations Delivered The following is a list of presentations delivered by CCEE between September 17, 2012 and March 31, 2014 that had a significant emphasis on the Turn Back the Tide campaign and its key messages.
Table 6: Turn Back the Tide Presentations Delivered (September 2011- March 2014)
Presentation Title Date Event/Organization
1 Turn Back the Tide 2012 09 17 Campaign Launch, St. John’s
2 Turn Back the Tide 2012 10 24 Newfoundland and Labrador Environmental Industry Association’s Annual Conference, St. John’s
3 Turn Back the Tide 2012 11 07 Coastal Matters Speakers Series, Corner Brook
4 Climate Change: Challenges & Opportunities for NL 2012 12 10 Clarenville Rotary Club, Clarenville
5 Turn Back the Tide 2013 01 18 Monthly Assistant Deputy Minister Event, St. John’s
6 Turn Back the Tide 2013 01 31 Protocol Office, St. John’s
7 Understanding your Municipal Government's Carbon Footprint 2013 05 10 MNL Symposium, Gander
8 EnviroFest 2013 06 07 Random Island Academy, Random Island
9 Integrating Climate Change into the Decision Making Process 2013 09 10 Planners’ Plate, City Hall, St. John's
10 Energy Efficiency Information Session 2013 10 08 CMHC Event, St. John’s
11 Change the Future… Now! 2013 10 17 Provincial Student Leadership Conference, Gander
12 Living Green 2014 03 05 Salvation Army, Stephenville
Evaluation of the Turn Back the Tide Campaign 39
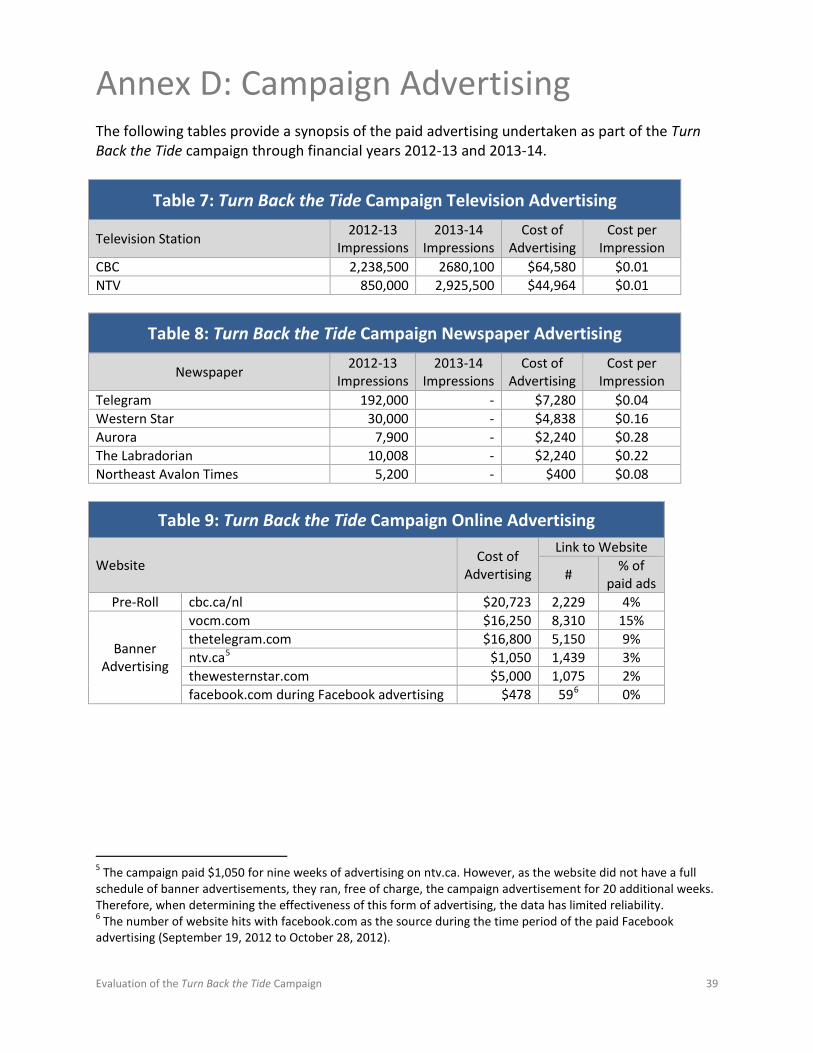
Annex D: Campaign Advertising The following tables provide a synopsis of the paid advertising undertaken as part of the Turn Back the Tide campaign through financial years 2012-13 and 2013-14.
Table 7: Turn Back the Tide Campaign Television Advertising
Television Station 2012-13 Impressions
2013-14 Impressions
Cost of Advertising
Cost per Impression
CBC 2,238,500 2680,100 $64,580 $0.01 NTV 850,000 2,925,500 $44,964 $0.01
Table 8: Turn Back the Tide Campaign Newspaper Advertising
Newspaper 2012-13 Impressions
2013-14 Impressions
Cost of Advertising
Cost per Impression
Telegram 192,000 - $7,280 $0.04 Western Star 30,000 - $4,838 $0.16 Aurora 7,900 - $2,240 $0.28 The Labradorian 10,008 - $2,240 $0.22 Northeast Avalon Times 5,200 - $400 $0.08
Table 9: Turn Back the Tide Campaign Online Advertising
Website Cost of Advertising
Link to Website
# % of paid ads
Pre-Roll cbc.ca/nl $20,723 2,229 4%
Banner Advertising
vocm.com $16,250 8,310 15% thetelegram.com $16,800 5,150 9% ntv.ca5 $1,050 1,439 3% thewesternstar.com $5,000 1,075 2% facebook.com during Facebook advertising $478 596 0%
5 The campaign paid $1,050 for nine weeks of advertising on ntv.ca. However, as the website did not have a full schedule of banner advertisements, they ran, free of charge, the campaign advertisement for 20 additional weeks. Therefore, when determining the effectiveness of this form of advertising, the data has limited reliability. 6 The number of website hits with facebook.com as the source during the time period of the paid Facebook advertising (September 19, 2012 to October 28, 2012).
Evaluation of the Turn Back the Tide Campaign 40
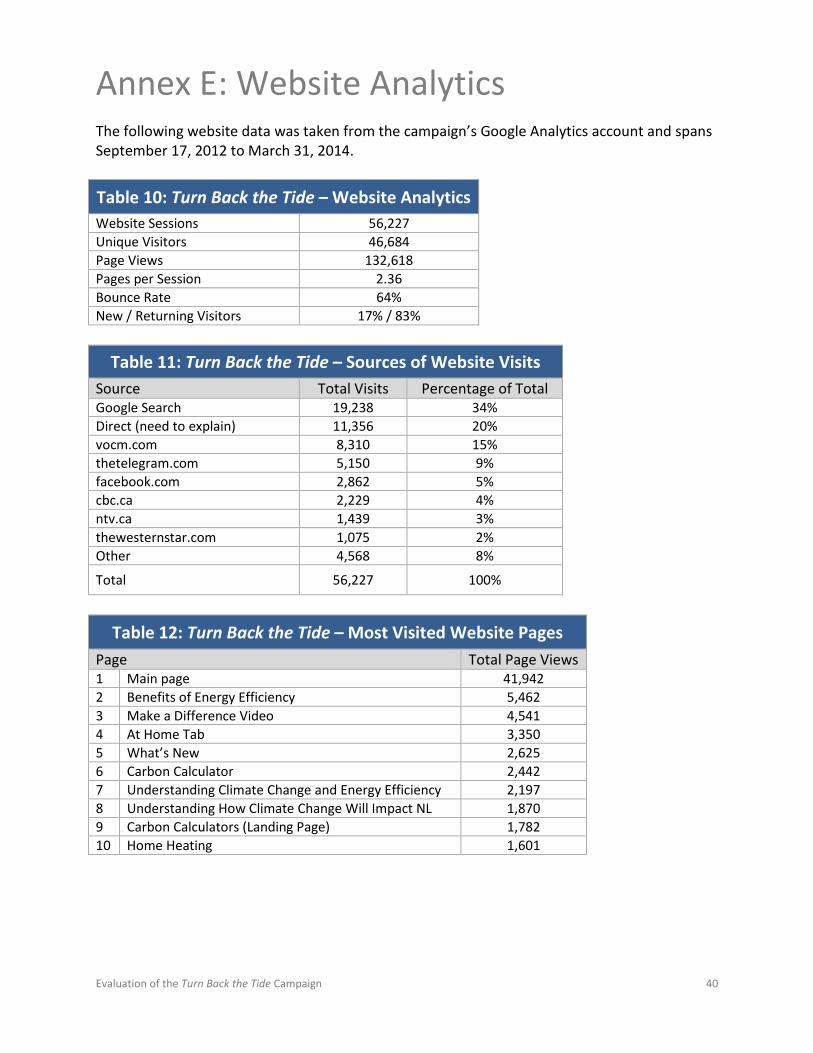
Annex E: Website Analytics The following website data was taken from the campaign’s Google Analytics account and spans September 17, 2012 to March 31, 2014.
Table 10: Turn Back the Tide – Website Analytics Website Sessions 56,227 Unique Visitors 46,684 Page Views 132,618 Pages per Session 2.36 Bounce Rate 64% New / Returning Visitors 17% / 83%
Table 11: Turn Back the Tide – Sources of Website Visits Source Total Visits Percentage of Total Google Search 19,238 34% Direct (need to explain) 11,356 20% vocm.com 8,310 15% thetelegram.com 5,150 9% facebook.com 2,862 5% cbc.ca 2,229 4% ntv.ca 1,439 3% thewesternstar.com 1,075 2% Other 4,568 8%
Total 56,227 100%
Table 12: Turn Back the Tide – Most Visited Website Pages Page Total Page Views 1 Main page 41,942 2 Benefits of Energy Efficiency 5,462 3 Make a Difference Video 4,541 4 At Home Tab 3,350 5 What’s New 2,625 6 Carbon Calculator 2,442 7 Understanding Climate Change and Energy Efficiency 2,197 8 Understanding How Climate Change Will Impact NL 1,870 9 Carbon Calculators (Landing Page) 1,782 10 Home Heating 1,601

Evaluation of the Turn Back the Tide Campaign 41
There were three distinct peaks of traffic following the launch of the campaign:
• First peak – January 21, 2013: This occurred during an advertising cycle on vocm.com. A quarter of visits came from vocm.com. A further 21% came from twitter.
• Second peak - June 13, 2013: On this date, 16% of links came from a government news release related to the release of climate change projections to the campaign website. A further 60% came from either Google or typing in the web address.
• Third peak – January 6, 2014: This occurred during an advertising cycle on vocm.com. Almost half of visits came from vocm.com.
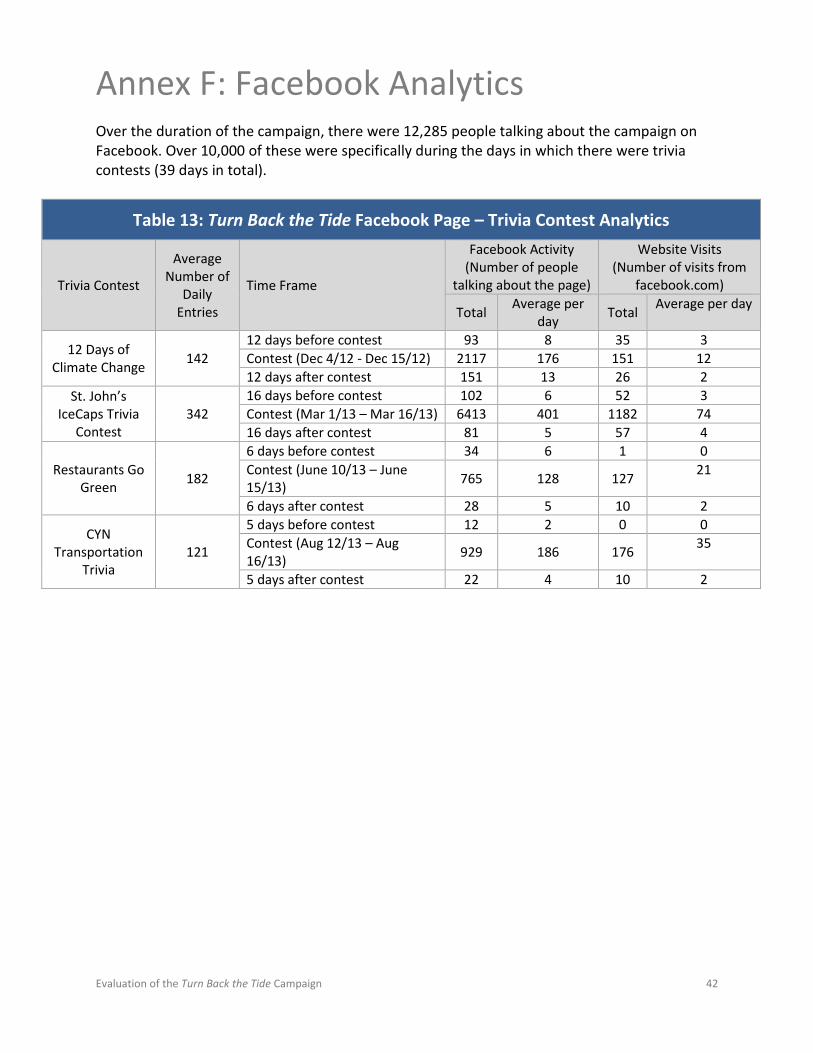
Evaluation of the Turn Back the Tide Campaign 42
Annex F: Facebook Analytics Over the duration of the campaign, there were 12,285 people talking about the campaign on Facebook. Over 10,000 of these were specifically during the days in which there were trivia contests (39 days in total).
Table 13: Turn Back the Tide Facebook Page – Trivia Contest Analytics
Trivia Contest
Average Number of
Daily Entries
Time Frame
Facebook Activity (Number of people
talking about the page)
Website Visits (Number of visits from
facebook.com)
Total Average per day Total Average per day
12 Days of Climate Change 142
12 days before contest 93 8 35 3 Contest (Dec 4/12 - Dec 15/12) 2117 176 151 12 12 days after contest 151 13 26 2
St. John’s IceCaps Trivia
Contest 342
16 days before contest 102 6 52 3 Contest (Mar 1/13 – Mar 16/13) 6413 401 1182 74 16 days after contest 81 5 57 4
Restaurants Go Green 182
6 days before contest 34 6 1 0 Contest (June 10/13 – June 15/13) 765 128 127 21
6 days after contest 28 5 10 2
CYN Transportation
Trivia 121
5 days before contest 12 2 0 0 Contest (Aug 12/13 – Aug 16/13) 929 186 176 35
5 days after contest 22 4 10 2
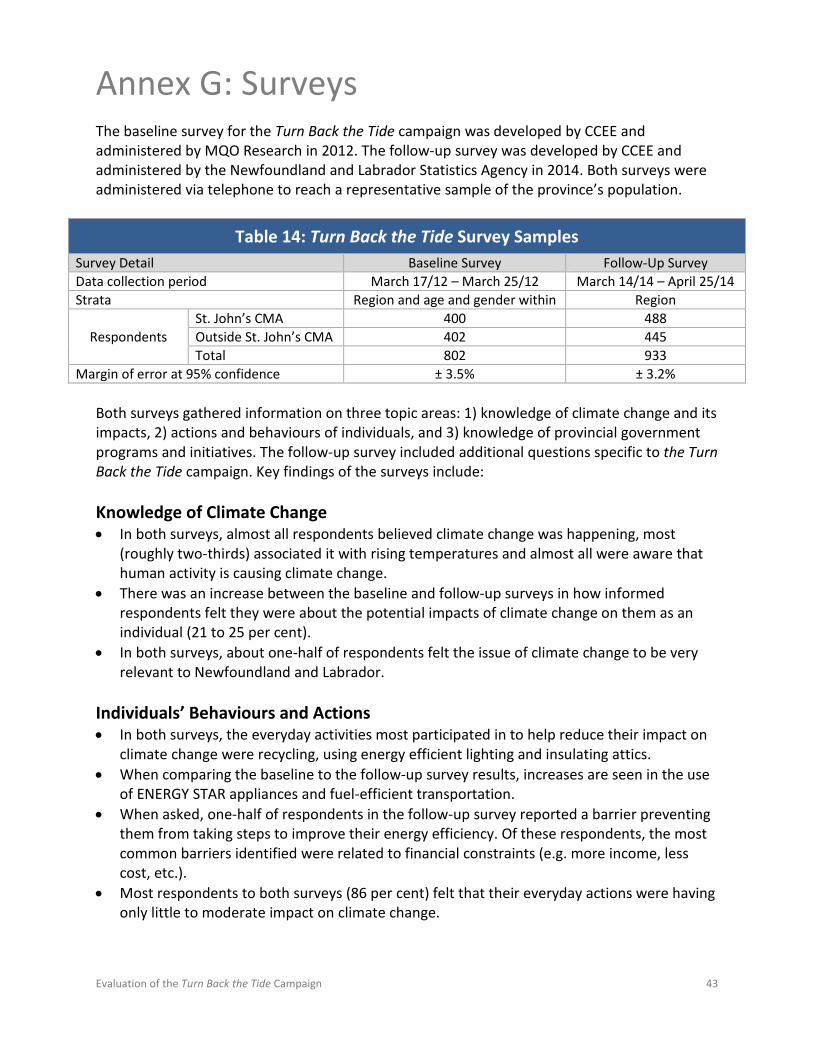
Evaluation of the Turn Back the Tide Campaign 43
Annex G: Surveys The baseline survey for the Turn Back the Tide campaign was developed by CCEE and administered by MQO Research in 2012. The follow-up survey was developed by CCEE and administered by the Newfoundland and Labrador Statistics Agency in 2014. Both surveys were administered via telephone to reach a representative sample of the province’s population.
Table 14: Turn Back the Tide Survey Samples Survey Detail Baseline Survey Follow-Up Survey Data collection period March 17/12 – March 25/12 March 14/14 – April 25/14 Strata Region and age and gender within Region
Respondents St. John’s CMA 400 488 Outside St. John’s CMA 402 445 Total 802 933
Margin of error at 95% confidence ± 3.5% ± 3.2% Both surveys gathered information on three topic areas: 1) knowledge of climate change and its impacts, 2) actions and behaviours of individuals, and 3) knowledge of provincial government programs and initiatives. The follow-up survey included additional questions specific to the Turn Back the Tide campaign. Key findings of the surveys include: Knowledge of Climate Change • In both surveys, almost all respondents believed climate change was happening, most
(roughly two-thirds) associated it with rising temperatures and almost all were aware that human activity is causing climate change.
• There was an increase between the baseline and follow-up surveys in how informed respondents felt they were about the potential impacts of climate change on them as an individual (21 to 25 per cent).
• In both surveys, about one-half of respondents felt the issue of climate change to be very relevant to Newfoundland and Labrador.
Individuals’ Behaviours and Actions • In both surveys, the everyday activities most participated in to help reduce their impact on
climate change were recycling, using energy efficient lighting and insulating attics. • When comparing the baseline to the follow-up survey results, increases are seen in the use
of ENERGY STAR appliances and fuel-efficient transportation. • When asked, one-half of respondents in the follow-up survey reported a barrier preventing
them from taking steps to improve their energy efficiency. Of these respondents, the most common barriers identified were related to financial constraints (e.g. more income, less cost, etc.).
• Most respondents to both surveys (86 per cent) felt that their everyday actions were having only little to moderate impact on climate change.
Evaluation of the Turn Back the Tide Campaign 44
Provincial Government Programs and Initiatives • There was limited knowledge of provincial government work to reduce climate change or
increase energy efficiency. In both surveys, about two-thirds of respondents were not aware of any provincial government departments or agencies that were working toward reducing climate change or increasing energy efficiency.
• There was increased awareness of provincial government programs or services targeted toward climate change or energy efficiency (27 to 35 per cent).
Turn Back the Tide (follow-up survey only) • Almost one-half of respondents were aware of the Turn Back the Tide campaign. Of those
that were aware, over 80 per cent became familiar through television. • Few respondents (4 per cent) had visited the campaign website. • About one-half of respondents indicated that they changed behaviours as a result of
information obtained on climate change and energy efficiency. • Of the respondents that were familiar with the campaign through television
advertisements, online advertiesements or newspaper advertisements, 17 per cent directly related their behavioural change to the Turn Back the Tide campaign.
Complete copies of both surveys and response data can be found online at: www.exec.gov.nl.ca/exec/ccee/publications/ccee-public-awareness-surveys.pdf
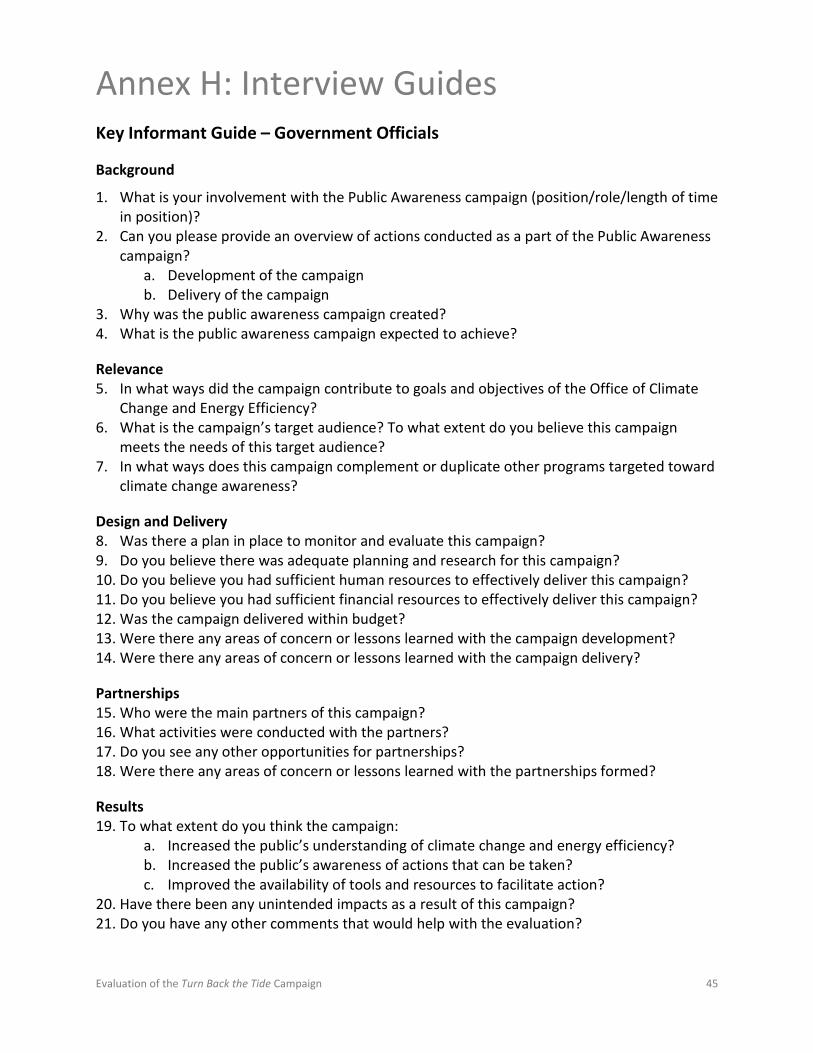
Evaluation of the Turn Back the Tide Campaign 45
Annex H: Interview Guides Key Informant Guide – Government Officials
Background
1. What is your involvement with the Public Awareness campaign (position/role/length of time in position)?
2. Can you please provide an overview of actions conducted as a part of the Public Awareness campaign?
a. Development of the campaign b. Delivery of the campaign
3. Why was the public awareness campaign created? 4. What is the public awareness campaign expected to achieve?
Relevance 5. In what ways did the campaign contribute to goals and objectives of the Office of Climate
Change and Energy Efficiency? 6. What is the campaign’s target audience? To what extent do you believe this campaign
meets the needs of this target audience? 7. In what ways does this campaign complement or duplicate other programs targeted toward
climate change awareness?
Design and Delivery 8. Was there a plan in place to monitor and evaluate this campaign? 9. Do you believe there was adequate planning and research for this campaign? 10. Do you believe you had sufficient human resources to effectively deliver this campaign? 11. Do you believe you had sufficient financial resources to effectively deliver this campaign? 12. Was the campaign delivered within budget? 13. Were there any areas of concern or lessons learned with the campaign development? 14. Were there any areas of concern or lessons learned with the campaign delivery?
Partnerships 15. Who were the main partners of this campaign? 16. What activities were conducted with the partners? 17. Do you see any other opportunities for partnerships? 18. Were there any areas of concern or lessons learned with the partnerships formed?
Results 19. To what extent do you think the campaign:
a. Increased the public’s understanding of climate change and energy efficiency? b. Increased the public’s awareness of actions that can be taken? c. Improved the availability of tools and resources to facilitate action?
20. Have there been any unintended impacts as a result of this campaign? 21. Do you have any other comments that would help with the evaluation?
Evaluation of the Turn Back the Tide Campaign 46
Key Informant Guide – Partnerships
Introduction The Government of Newfoundland and Labrador is in the process of evaluating the public awareness campaign, Turn Back the Tide, conducted by the Office of Climate Change and Energy Efficiency. The objective of this evaluation is to assess the relevance, design and delivery and success of the campaign. As you are probably aware, your organization had a partnership with Turn Back the Tide. Based on your organization’s partnership with the Turn Back the Tide campaign, you have been identified as an individual who may be able to assist in this evaluation. The information you provide is for evaluation purposes only and your participation is voluntary. Your acceptance or refusal to participate and your responses will not affect your relationship with the Government of Newfoundland and Labrador. There are seven questions and it is anticipated that this will take up to 20 minutes. Your input will contribute to the success of this evaluation process and we thank you for your participation. 1. What is your involvement with the Turn Back the Tide campaign (position/role/length of
time in position)? 2. What did you hope to get out of this partnership? 3. Can you please provide an overview of actions conducted as a part of the partnership with
the Turn Back the Tide campaign? 4. Do you feel this partnership was effective?
a. Do you feel this partnership was a good fit with your organization? b. Do you feel this partnership had good reach with your target audience? c. Do you feel the activities were well received?
5. Were there any challenges associated with this partnership? 6. Would you participate in another partnership with Turn Back the Tide?
a. Why? Why not? 7. Do you have any recommendations for future partnerships? 8. Do you have any other comments that would help to support the evaluation of this
partnership?
Key Informant Guide – Municipalities Newfoundland and Labrador
Introduction The Government of Newfoundland and Labrador is in the process of evaluating the public awareness campaign, Turn Back the Tide, conducted by the Office of Climate Change and Energy Efficiency. The objective of this evaluation is to assess the relevance, design and delivery and success of the campaign.

Evaluation of the Turn Back the Tide Campaign 47
As you are probably aware, your organization had a partnership with Turn Back the Tide. Based on your organization’s partnership with the Turn Back the Tide campaign, you have been identified as an individual who may be able to assist in this evaluation. The information you provide is for evaluation purposes only and your participation is voluntary. Your acceptance or refusal to participate and your responses will not affect your relationship with the Government of Newfoundland and Labrador. There are seven questions and it is anticipated that this will take up to 20 minutes. Your input will contribute to the success of this evaluation process and we thank you for your participation. 1. What is your involvement with the Turn Back the Tide campaign (position/role/length of
time in position)? 2. What did you hope to get out of this partnership? 3. Can you please provide an overview of actions conducted as a part of the partnership with
the Turn Back the Tide campaign? 4. Do you feel this partnership was effective?
a. Do you feel this partnership was a good fit with your organization? b. Do you feel the carbon calculator was well received? c. Did communities have any difficulty with the carbon calculator? d. How many people applied for the Tidy Town award in 2014? Out of these, how many
people completed the carbon calculator and submitted a PDF document of municipal footprint?
5. Were there any challenges associated with this partnership? 6. Would you participate in another partnership with Turn Back the Tide?
a. Why? Why not? 7. Do you have any recommendations for future partnerships? 8. Do you have any other comments that would help to support the evaluation of this
partnership?