Embed Size (px)
Citation preview

TURKISH FOUNDRY INDUSTRY
REPORT 2018
May 2019

TURKISH FOUNDRY INDUSTRY REPORT 2018
ii
Content
Content .....................................................................................................................................................ii
List of Figures ........................................................................................................................................... iii
A. Macroeconomic Developments ...................................................................................................... 1
B. The Situation in the Major Casting Customer Industries ................................................................ 6
C. Developments in the Foundry Industry ........................................................................................... 7
1. Industry Overview ....................................................................................................................... 7
2. Investments ................................................................................................................................. 9
D. The Situation in the Material Sectors .............................................................................................. 9
1. Iron Castings ................................................................................................................................ 9
2. Steel Castings ............................................................................................................................. 10
3. Non Ferrous Castings ................................................................................................................. 10
E. Cost Development ......................................................................................................................... 10
1. Energy ........................................................................................................................................ 11
2. Raw Materials ............................................................................................................................ 11
3. Wages ........................................................................................................................................ 12

TURKISH FOUNDRY INDUSTRY REPORT 2018
iii
List of Figures
FIGURE 1: GROSS DOMESTIC PRODUCT GROWTH AND PER CAPITA GROSS DOMESTIC PRODUCT ......................................... 1
FIGURE 2: LABOUR FORCE & POPULATION STATISTICS ................................................................................................. 2
FİGURE 3: DOMESTIC PRODUCER PRICE INDEX VS. CURRENCY EXCHANGE RATES ............................................................... 3
FİGURE 4: CONSUMER PRICE AND DOMESTIC PRODUCER PRICE INDICES YEAR-ON-YEAR CHANGES ...................................... 3
FİGURE 5: FOREIGN TRADE STATISTICS ...................................................................................................................... 4
FİGURE 6: CURRENT ACCOUNT BALANCE ................................................................................................................... 5
FİGURE 7: CALENDAR ADJUSTED INDUSTRIAL PRODUCTION INDEX .................................................................................. 5
FIGURE 8: TURKEY MANUFACTURING PURCHASING MANAGERS’ INDEX .......................................................................... 6
FİGURE 9: SHARE OF TURKEY IN GLOBAL CASTING PRODUCTION .................................................................................... 7
FİGURE 10: METAL CASTING PRODUCTION .................................................................................................................. 7
FİGURE 11: PRODUCTION VALUE OF METAL CASTINGS .................................................................................................. 8
FİGURE 12: IRON AND STEEL CASTINGS PRODUCTION .................................................................................................... 8
FİGURE 13: NON-FERROUS CASTINGS PRODUCTION...................................................................................................... 9
FIGURE 14: COST DEVELOPMENT INDICES ................................................................................................................. 10
FİGURE 15: ELECTRICITY AND NATURAL GAS PRICE DEVELOPMENT ................................................................................. 11
FİGURE 16: METALLIC INPUT MATERIALS PRICE DEVELOPMENT .................................................................................... 12
FIGURE 17: HOURLY LABOUR COST INDEX YEAR OVER YEAR CHANGE IN INDUSTRY ........................................................... 13


TURKISH FOUNDRY INDUSTRY REPORT 2018
1
A. Macroeconomic Developments
Following several years of strong growth, the Turkish economy achieved another strong GDP
increase by 7,4% in the first quarter and by 5,3% in the second quarter of 2018. While Turkey became
the second fastest growing economy among major developing economies in the first quarter, the
downward trend in unemployment continued; improvement in inflation remained limited due to the
fluctuations in food and energy prices; and steady depreciation of the exchange rate since mid-2017
was intensified during this period. Strong domestic demand, which was one of the major fuels for the
previous years’ strong growth, this time, became the major reason of the expansion in the current
account deficit, together with the commodity prices.
The macroeconomic developments and the political tensions with the US caused intense market
volatility in August 2018, which led to a further depreciation of Turkish Lira around 40% in a very
short period. Thereafter a recovery process commenced. Expansion in the current account deficit
stopped with a strong performance in tourism. Turkey’s economy posted a successive current
account surplus for the first time after many years. In the last quarter, inflation was slightly improved
thanks to the measures taken by the government, the decline in oil prices, relative normalization of
the exchange rates and the slowdown in domestic demand; which led to a narrower seasonally and
calendar adjusted GDP growth rate of 2,6% in 2018 (Figure 1).
Figure 1: GROSS DOMESTIC PRODUCT GROWTH AND PER CAPITA GROSS DOMESTIC PRODUCT
Source: TurkStat (Turkish Statistical Institute)
[1] The figures for 2018 are the sum of four quarters which are subject to be revised when the annual figures published.
[2] Based on the mid-year populations obtained from the annual results of Address Based Population Registration
System.
[3] Calculated by production approach in chain-linked volume percentage change [2009=100].
2009 2010 2011 2012 2013 2014 2015 2016 20172018
[1]
Per Capita GDP (USD) [2] 8.980 10.560 11.205 11.588 12.480 12.112 11.019 10.883 10.602 9.632
GDP YoY (%) [3] -4,7 8,5 11,1 4,8 8,5 5,2 6,1 3,2 7,4 2,6
-6,0
-3,0
0,0
3,0
6,0
9,0
12,0
-7.000
-3.500
0
3.500
7.000
10.500
14.000
GD
P Y
oY
Ch
ange
(%
)
Per
Cap
ita
GD
P (
USD
)
TURKISH FOUNDRY INDUSTRY REPORT 2018
2
GDP has increased by 19% in 2018 at current prices but due to the increasing value of the dollar
against lira by 38%, Per Capita GDP in USD contracted by 9% and fell below ten thousand level.
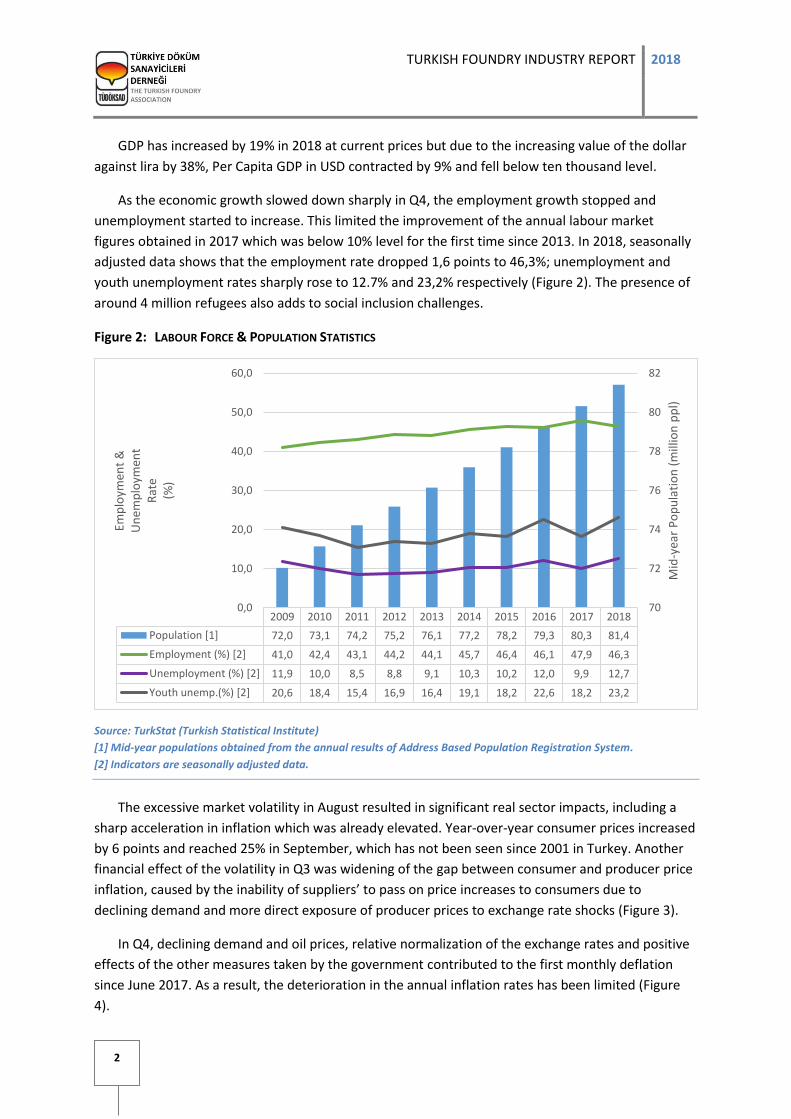
As the economic growth slowed down sharply in Q4, the employment growth stopped and
unemployment started to increase. This limited the improvement of the annual labour market
figures obtained in 2017 which was below 10% level for the first time since 2013. In 2018, seasonally
adjusted data shows that the employment rate dropped 1,6 points to 46,3%; unemployment and
youth unemployment rates sharply rose to 12.7% and 23,2% respectively (Figure 2). The presence of
around 4 million refugees also adds to social inclusion challenges.
Figure 2: LABOUR FORCE & POPULATION STATISTICS
Source: TurkStat (Turkish Statistical Institute)
[1] Mid-year populations obtained from the annual results of Address Based Population Registration System.
[2] Indicators are seasonally adjusted data.
The excessive market volatility in August resulted in significant real sector impacts, including a
sharp acceleration in inflation which was already elevated. Year-over-year consumer prices increased
by 6 points and reached 25% in September, which has not been seen since 2001 in Turkey. Another
financial effect of the volatility in Q3 was widening of the gap between consumer and producer price
inflation, caused by the inability of suppliers’ to pass on price increases to consumers due to
declining demand and more direct exposure of producer prices to exchange rate shocks (Figure 3).
In Q4, declining demand and oil prices, relative normalization of the exchange rates and positive
effects of the other measures taken by the government contributed to the first monthly deflation
since June 2017. As a result, the deterioration in the annual inflation rates has been limited (Figure
4).
2009 2010 2011 2012 2013 2014 2015 2016 2017 2018
Population [1] 72,0 73,1 74,2 75,2 76,1 77,2 78,2 79,3 80,3 81,4
Employment (%) [2] 41,0 42,4 43,1 44,2 44,1 45,7 46,4 46,1 47,9 46,3
Unemployment (%) [2] 11,9 10,0 8,5 8,8 9,1 10,3 10,2 12,0 9,9 12,7
Youth unemp.(%) [2] 20,6 18,4 15,4 16,9 16,4 19,1 18,2 22,6 18,2 23,2
70
72
74
76
78
80
82
0,0
10,0
20,0
30,0
40,0
50,0
60,0
Mid
-yea
r P
op
ula
tio
n (
mill
ion
pp
l)
Emp
loym
ent
&U
nem
plo
ymen
tR
ate
(%)

TURKISH FOUNDRY INDUSTRY REPORT 2018
3
Figure 3: DOMESTIC PRODUCER PRICE INDEX VS. CURRENCY EXCHANGE RATES
Source: TurkStat (Turkish Statistical Institute), CBRT (Central Bank of the Republic of Turkey)
[1] End of year indices
[2] End of year foreign exchange rates
Figure 4: CONSUMER PRICE AND DOMESTIC PRODUCER PRICE INDICES YEAR-ON-YEAR CHANGES
Source: TurkStat - Turkish Statistical Institute
[1] 2003=100, End of Period, Annual Percentage Change
2008 2009 2010 2011 2012 2013 2014 2015 2016 2017 2018
Dom. PPI [1] 154,80 163,98 178,54 202,33 207,29 221,74 235,84 249,31 274,09 316,48 422,94
TL/€ [2] 2,14 2,16 2,05 2,46 2,35 2,94 2,82 3,18 3,69 4,55 6,03
TL/$ [2] 1,51 1,51 1,55 1,91 1,78 2,13 2,32 2,91 3,53 3,81 5,26
1,00
2,00
3,00
4,00
5,00
6,00
7,00
0,00
50,00
100,00
150,00
200,00
250,00
300,00
350,00
400,00
450,00
Cu
rren
cy R
atio
Do
mes
tic
Pro
du
cer
Pri
ce In
dex
2009 2010 2011 2012 2013 2014 2015 2016 2017 2018
CPI YoY (%) [1] 6,5 6,4 10,5 6,2 7,4 8,2 8,8 8,5 11,9 20,3
Dom. PPI YoY (%) [1] 5,9 8,9 13,3 2,5 7,0 6,4 5,7 9,9 15,5 33,6
0,0
5,0
10,0
15,0
20,0
25,0
30,0
35,0
(%)

TURKISH FOUNDRY INDUSTRY REPORT 2018
4
Suppressed domestic demand, declined investment and weakened Turkish Lira has contributed
to a sharp deceleration in import demand, whilst exports have accelerated. As a result of export
growth outpacing that of imports, the annual export to import ratio increased from 67,1% to 75,3%
in 2018, which was the highest ratio in a decade (Figure 5).
Figure 5: FOREIGN TRADE STATISTICS
Source: TurkStat (Turkish Statistical Institute)
These developments, together with the good tourism revenues during the high-tourist season
(summer months) helped shift the current account deficit to surplus in the third and fourth quarters
of 2018, for the first time after many years. As a result, the current account deficit has narrowed
from 5,6% of GDP in 2017 to 3,5% in 2018 (Figure 6).
Non-tradable sectors have significantly contracted in 2018 Q4 due to higher costs and credit
rationing, which had already started in August with sharply rising commercial lending rates. The
sharp drop in credit growth also had an effect on containing current account imbalances going
forward (Figure 6). Because credit to the private sector has been one of the main drivers of Turkey’s
current account deficit in recent years.
Tradable sectors, on the other hand, grew significantly as exchange rate depreciation has
boosted external competitiveness together with the sustained external demand. Therefore, this
compensating effect aided the calendar adjusted industrial production index to remain positive for
2018 (Figure 7).
2009 2010 2011 2012 2013 2014 2015 2016 2017 2018
Import (CIF, USD bn) 140,9 185,5 240,8 236,5 251,7 242,2 207,2 198,6 233,8 223,0
Export (FOB, USD bn) 102,1 113,9 134,9 152,5 151,8 157,6 143,8 142,5 157,0 167,9
Export / Import (%) 72,5 61,4 56,0 64,5 60,3 65,1 69,4 71,8 67,1 75,3
30,0
40,0
50,0
60,0
70,0
80,0
50,0
100,0
150,0
200,0
250,0
300,0
Exp
ort
/ Im
po
rt (
%)
(USD
bn
)

TURKISH FOUNDRY INDUSTRY REPORT 2018
5
Figure 6: CURRENT ACCOUNT BALANCE
Source: CBRT (Central Bank of the Republic of Turkey
Figure 7: CALENDAR ADJUSTED INDUSTRIAL PRODUCTION INDEX
Source: TurkStat (Turkish Statistical Institute)
Contraction of the industrial production index in the second half of the year was also consistent
with the easing in the manufacturing purchasing managers’ index (PMI). However, it bottomed out in
September and sustained its level just below 45% (Figure 8). In manufacturing, the PMI shows a
much stronger outlook for new export orders compared to domestic orders.
Furthermore, the increase in the real sector confidence index continued since September and
reached 97,7% in December (Figure 8).
The weakening of economic activity in Turkey became more pronounced in the fourth quarter
along with global trends. It is considered that domestic demand may remain under pressure for a
while due to the delayed effects of the increases in interest rates and exchange rates in 2018.
2009 2010 2011 2012 2013 2014 2015 2016 2017 2018
Current account (USD bn) -11,4 -44,6 -74,4 -48,0 -63,6 -43,6 -32,1 -33,1 -47,3 -27,2
Current account balance (%) -1,8 -5,8 -8,9 -5,5 -6,7 -4,7 -3,7 -3,8 -5,6 -3,5
-9,0
-8,0
-7,0
-6,0
-5,0
-4,0
-3,0
-2,0
-1,0
-80,0
-70,0
-60,0
-50,0
-40,0
-30,0
-20,0
-10,0
0,0
Cu
rren
t A
cco
un
t /
GD
P (
%)
(Cu
rren
t A
cco
un
t (
USD
bn
)
-10,7
13,7 14,7
4,2
7,25,7 5,8
3,4
9,0
1,32009 2010 2011 2012 2013 2014 2015 2016 2017 2018
%

TURKISH FOUNDRY INDUSTRY REPORT 2018
6
Together with the volatility in the world economy and capital flows, the growth rate of Turkey is
anticipated to be around 2% in 2019.
Figure 8: TURKEY MANUFACTURING PURCHASING MANAGERS’ INDEX
Source: TurkStat (Turkish Statistical Institute; CBRT (Central Bank of the Republic of Turkey); ICI (Istanbul Chamber of
Industry) and IHS Markit
B. The Situation in the Major Casting Customer Industries
In 2018 total motor vehicle production decreased by 9% and domestic sales by 35%. The
decrease in passenger car production and market (10% and 33% respectively) were the main reasons
for the decline in the vehicle industry. Commercial vehicle production fell by 5%, whilst tractor
production by 30%.
The domestic machinery market is presumed to be declined by 20%. But a 15% increase in export
volume is expected to compensate, to some extent for the loss in domestic demand. The export
volume grew by nearly %30 in earth-moving machinery production where a 60% contraction was
observed in the domestic market. The agricultural machines industry is also estimated to shrink by
35%.
Falling demand for housing deeply impacted the construction sector. The annual drop in building
permit floor area reached 49%, and the total house sales fell by 2,4%. The annual production,
domestic sales and export volume of the cement industry all declined, by 10, 11 and 6%, respectively.
Steel production was stable as compared to the previous year.
The installed capacity in electricity production increased by 4% in 2018, where the driving force
was the investments in renewable energy resources.
Production in the white goods sector was stable in 2018; the growth was only by %0,4.
40,0
42,0
44,0
46,0
48,0
50,0
52,0
54,0
56,0
Jan Feb Mar Apr May Jun Jul Aug Sep Oct Nov Dec Jan Feb Mar Apr May Jun Jul Aug Sep Oct Nov Dec
2017 2018
80,0
85,0
90,0
95,0
100,0
105,0
110,0
115,0
120,0
Manufacturing PMI (Left Axis) Real Sector Confidence Index (Right Axis)
TURKISH FOUNDRY INDUSTRY REPORT 2018
7
C. Developments in the Foundry Industry
1. Industry Overview
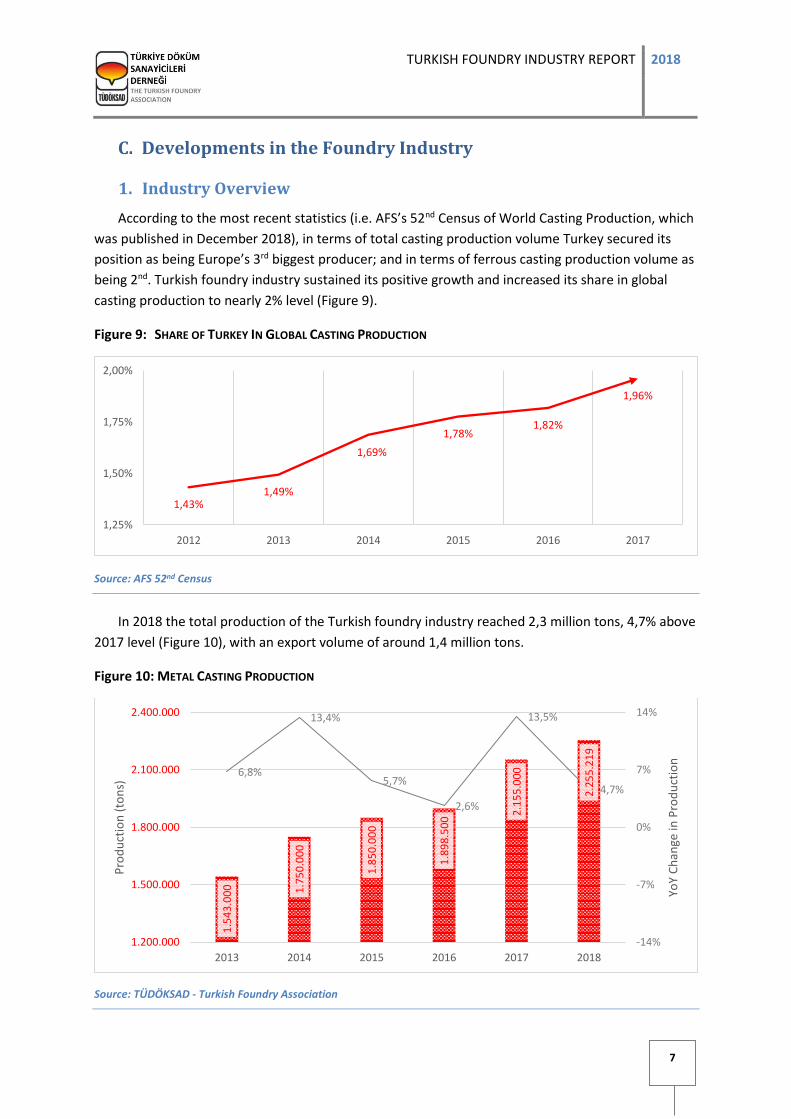
According to the most recent statistics (i.e. AFS’s 52nd Census of World Casting Production, which
was published in December 2018), in terms of total casting production volume Turkey secured its
position as being Europe’s 3rd biggest producer; and in terms of ferrous casting production volume as
being 2nd. Turkish foundry industry sustained its positive growth and increased its share in global
casting production to nearly 2% level (Figure 9).
Figure 9: SHARE OF TURKEY IN GLOBAL CASTING PRODUCTION
Source: AFS 52nd Census
In 2018 the total production of the Turkish foundry industry reached 2,3 million tons, 4,7% above
2017 level (Figure 10), with an export volume of around 1,4 million tons.
Figure 10: METAL CASTING PRODUCTION
Source: TÜDÖKSAD - Turkish Foundry Association
1,43%1,49%
1,69%
1,78%1,82%
1,96%
1,25%
1,50%
1,75%
2,00%
2012 2013 2014 2015 2016 2017
1.5
43
.00
0 1.7
50
.00
0
1.8
50
.00
0
1.8
98
.50
0
2.1
55
.00
0
2.2
55
.21
9
6,8%
13,4%
5,7%
2,6%
13,5%
4,7%
-14%
-7%
0%
7%
14%
1.200.000
1.500.000
1.800.000
2.100.000
2.400.000
2013 2014 2015 2016 2017 2018
YoY
Ch
ange
in P
rod
uct
ion
Pro
du
ctio
n (
ton
s)

TURKISH FOUNDRY INDUSTRY REPORT 2018
8
The deceleration is mainly due to the decrease in the production of grey iron castings.
However, the increase in the production value of castings against last year continued with a
slight loss of acceleration in growth and reached 5,2 billion Euros (Figure 11).
Figure 11: PRODUCTION VALUE OF METAL CASTINGS
Source: TÜDÖKSAD - Turkish Foundry Association
In 2018, the total production of iron and steel foundries remained constant as it was in 2016
(Figure 12). The weight of castings amounted to 1,7 million tons.
Figure 12: IRON AND STEEL CASTINGS PRODUCTION
Source: TÜDÖKSAD - Turkish Foundry Industry
3,2
7
3,7
0
3,7
2 3,9
6
4,4
7
5,1
5
22,6%
12,9%
0,5%
6,5%
13,0%15,2%
-24%
-12%
0%
12%
24%
2,00
3,00
4,00
5,00
6,00
2013 2014 2015 2016 2017 2018
YoY
Ch
ange
in P
rod
uct
ion
Val
ue
Pro
du
ctio
n V
alu
e (E
UR
bn
)
1.2
43
.00
0 1.4
00
.00
0
1.4
70
.00
0
1.4
71
.00
0
1.7
15
.00
0
1.7
08
.23
2
-1,3%
12,6%
5,0%
0,1%
16,6%
-0,4%
-18%
-9%
0%
9%
18%
1.000.000
1.200.000
1.400.000
1.600.000
1.800.000
2013 2014 2015 2016 2017 2018
YoY
Ch
ange
in P
rod
uct
ion
Pro
du
ctio
n (
ton
s)
TURKISH FOUNDRY INDUSTRY REPORT 2018
9
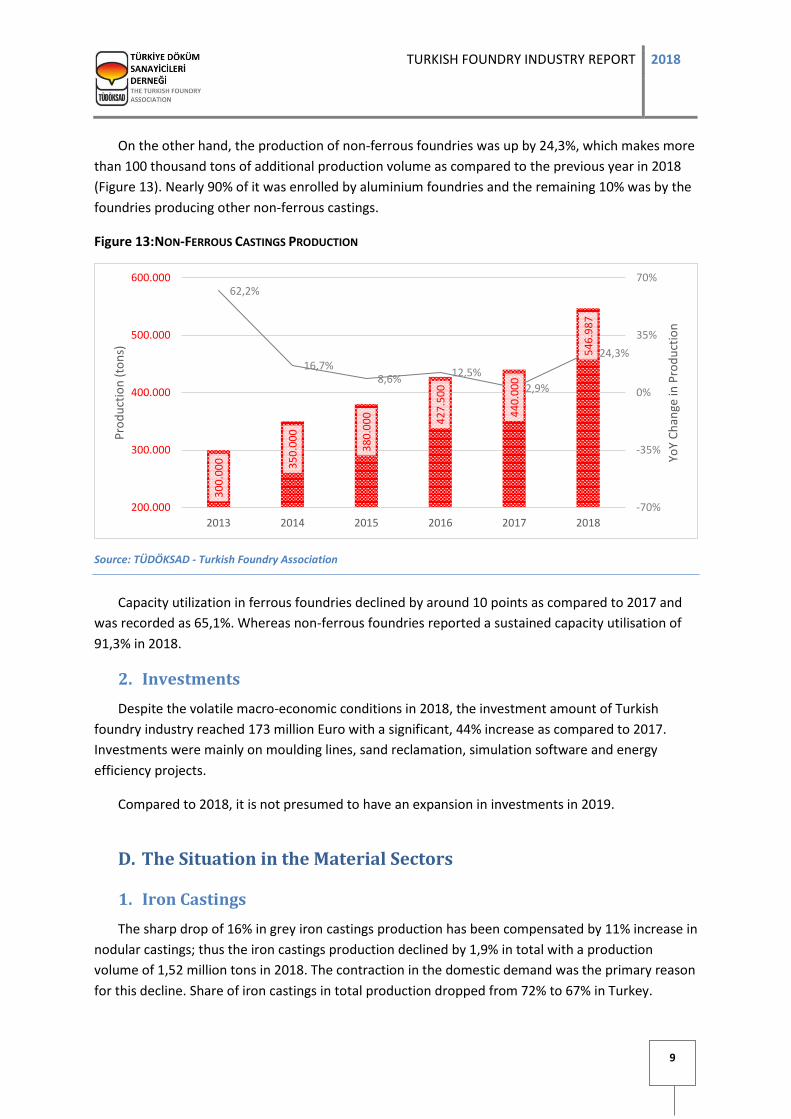
On the other hand, the production of non-ferrous foundries was up by 24,3%, which makes more
than 100 thousand tons of additional production volume as compared to the previous year in 2018
(Figure 13). Nearly 90% of it was enrolled by aluminium foundries and the remaining 10% was by the
foundries producing other non-ferrous castings.
Figure 13: NON-FERROUS CASTINGS PRODUCTION
Source: TÜDÖKSAD - Turkish Foundry Association
Capacity utilization in ferrous foundries declined by around 10 points as compared to 2017 and
was recorded as 65,1%. Whereas non-ferrous foundries reported a sustained capacity utilisation of
91,3% in 2018.
2. Investments
Despite the volatile macro-economic conditions in 2018, the investment amount of Turkish
foundry industry reached 173 million Euro with a significant, 44% increase as compared to 2017.
Investments were mainly on moulding lines, sand reclamation, simulation software and energy
efficiency projects.
Compared to 2018, it is not presumed to have an expansion in investments in 2019.
D. The Situation in the Material Sectors
1. Iron Castings
The sharp drop of 16% in grey iron castings production has been compensated by 11% increase in
nodular castings; thus the iron castings production declined by 1,9% in total with a production
volume of 1,52 million tons in 2018. The contraction in the domestic demand was the primary reason
for this decline. Share of iron castings in total production dropped from 72% to 67% in Turkey.
30
0.0
00 35
0.0
00
38
0.0
00
42
7.5
00
44
0.0
00
54
6.9
87
62,2%
16,7%8,6%
12,5%
2,9%
24,3%
-70%
-35%
0%
35%
70%
200.000
300.000
400.000
500.000
600.000
2013 2014 2015 2016 2017 2018
YoY
Ch
ange
in P
rod
uct
ion
Pro
du
ctio
n (
ton
s)

TURKISH FOUNDRY INDUSTRY REPORT 2018
10
Over the past years, iron foundries have been allocating their capacities on nodular castings.
Consequently, for the grey iron castings, capacity utilization was stable at 74% although the
production volume has declined sharply. Iron foundries in total reported a capacity utilization of 64%
in total.
2. Steel Castings
Except for 2017, steel castings production has been increasing with accelerating growth since
2013. In comparison with 2017, production volume reached 192.372 tons, registering an increase of
13,2%. Capacity utilization has also reached 70%.
3. Non-Ferrous Castings
The investments in capacity increase, especially in HPDC foundries in 2017 yielded a strong
growth in aluminium castings in 2018. Production volume increased by 25,3% as compared to the
previous year and peaked at 476.253 tons.
Other non-ferrous foundries produced 70.734 tons, up by 17,9% in comparison with 2017.
E. Cost Development
Manufacturing costs of foundries are mostly based on foreign exchange rates due to the import
of raw materials. 38% YoY increase in TL/USD and a 33% increase in the TL/EUR exchange rates
yielded a profound effect on cost development. On the other hand, the increase in domestic PPI in
the casting industry again surpassed the overall domestic PPI year-over-year change in 2018 (Figure
14).
Figure 14: COST DEVELOPMENT INDICES
Source: TurkStat (Turkish Statistical Institute; CBRT (Central Bank of the Republic of Turkey)
Calculations are based on the year-end indices and Exchange rates
2009 2010 2011 2012 2013 2014 2015 2016 2017 2018
Dom. PPI YoY (%) 5,9 8,9 13,3 2,5 7,0 6,4 5,7 9,9 15,5 33,6
Casting Ind. Dom. PPI YoY (%) 2,9 6,7 12,1 -1,0 9,5 4,8 3,5 9,4 32,1 36,9
TL/€ YoY Change (%) 0,9 -5,1 20,0 -4,4 24,9 -3,9 12,7 16,2 23,1 32,5
TL/$ YoY Change (%) -0,4 2,7 23,3 -6,5 19,7 8,6 25,4 21,5 7,9 38,1
-10,0
-5,0
0,0
5,0
10,0
15,0
20,0
25,0
30,0
35,0
40,0
(%)

TURKISH FOUNDRY INDUSTRY REPORT 2018
11
1. Energy
Both energy and gas prices in industrial consumption rose sharply in 2018. In comparison with
the previous year, the electricity market price was up on both TL and Euro basis, by 43,7% and 8,4%
respectively. The unit price of natural gas has increased by 40,5% in Turkish Liras and 6,0% in Euros
(Figure 15).
Figure 15: ELECTRICITY AND NATURAL GAS PRICE DEVELOPMENT
Source: Turkish Statistical Institute
[1] Average prices paid by industrial consumers for 1 kWh electricity / 1 m3 natural gas including all taxes.
The energy cost of foundries was reported to increase by 53% in TLs and by 9% in Euros.
2. Raw Materials
The acceleration in the prices of the raw materials maintained in 2018. The average increase in
prices reached around %130 in two years (Figure 16).
Foundries reported a 44% increase in TLs and a 3% increase in Euros in total raw materials costs.
0,80
0,90
1,00
1,10
1,20
1,30
0,20
0,24
0,28
0,32
0,36
0,40
2012 2013 2014 2015 2016 2017 2018
Nat
ura
l Gas
Un
it P
rice
[1]
(TL/
m3 )
Elec
tric
ity
Un
it P
rice
[1]
(TL/
kWh
)
Electricity Natural Gas

TURKISH FOUNDRY INDUSTRY REPORT 2018
12
Figure 16: RAW MATERIALS PRICE DEVELOPMENT
Source: TÜDÖKSAD - Turkish Foundry Association
3. Wages
The year-over-year change rate of the industrial production hourly labour cost index had
dropped below the 10% level in 2017. But it accelerated again and increased by 20,2% in 2018
(Figure 17).
The 2-year collective agreement concluded between the employer and employee unions in the
metal industry, effective as of Q3 2017 resulted in about a 30% increase in wages in 2018, including
the inflation bonuses.

TURKISH FOUNDRY INDUSTRY REPORT 2018
13
Figure 17: HOURLY LABOUR COST INDEX YEAR OVER YEAR CHANGE IN INDUSTRY
Source: Turkish Statistical Institute
Labour cost is the cost incurred by the employer in relation to employment as earnings and labour cost excluding
earnings. Hourly labour cost is calculated by dividing the labour cost by the number of hours worked. The annual average
of seasonally and calendar adjusted indices are used for calculation (2015=100).
6,07,8
10,0 11,0 11,7
16,4
20,9
9,8
20,2
2010 2011 2012 2013 2014 2015 2016 2017 2018
YoY
Ch
ange
(%
)