Embed Size (px)
Citation preview
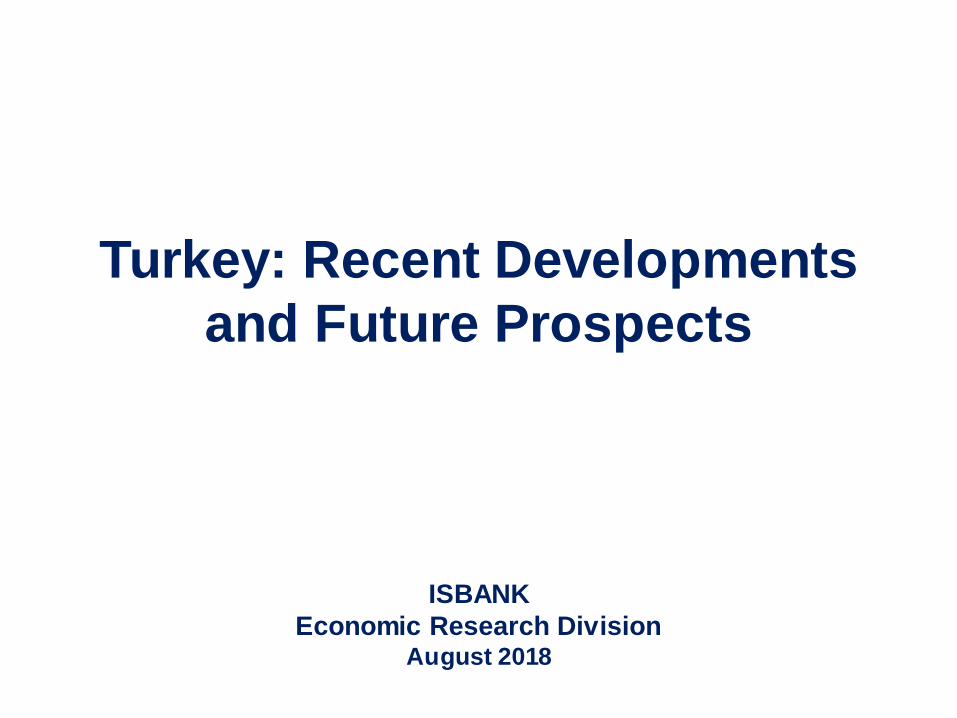
Turkey: Recent Developments
and Future Prospects
ISBANK
Economic Research Division August 2018

Macroeconomic Outlook
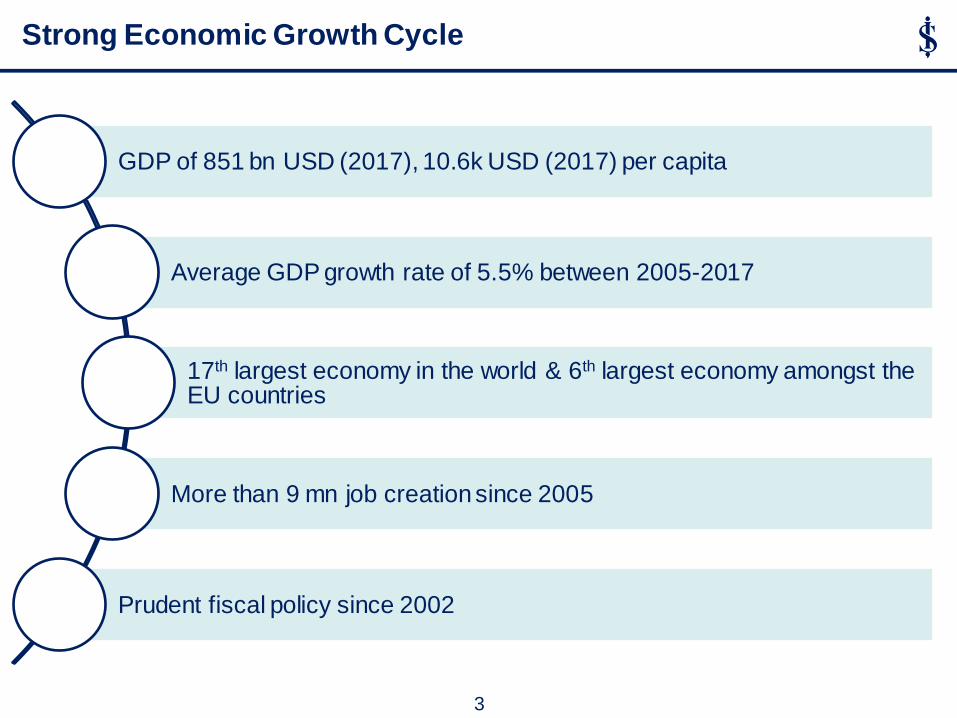
Strong Economic Growth Cycle
GDP of 851 bn USD (2017), 10.6k USD (2017) per capita
Average GDP growth rate of 5.5% between 2005-2017
17th largest economy in the world & 6th largest economy amongst the EU countries
More than 9 mn job creation since 2005
Prudent fiscal policy since 2002
3
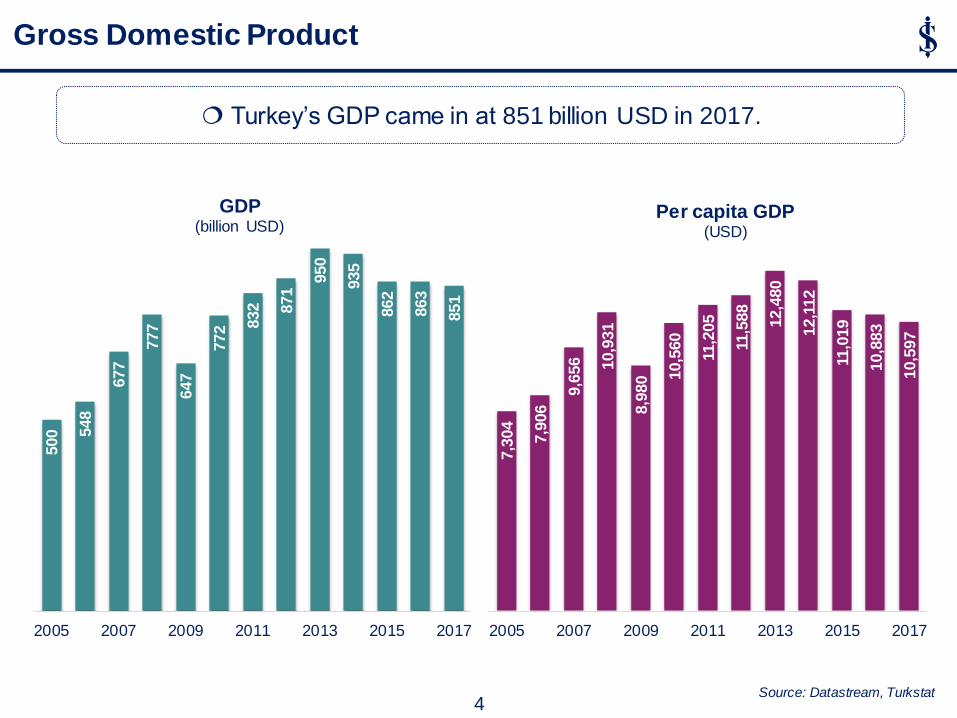
Gross Domestic Product
Source: Datastream, Turkstat
500 548
677
777
647
772 832
871 9
50
935
862
863
851
2005 2007 2009 2011 2013 2015 2017
GDP (billion USD)
7,3
04
7,9
06
9,6
56
10,9
31
8,9
80 10,5
60
11,2
05
11,5
88
12,4
80
12,1
12
11,0
19
10,8
83
10,5
97
2005 2007 2009 2011 2013 2015 2017
Per capita GDP (USD)
Turkey’s GDP came in at 851 billion USD in 2017.
4
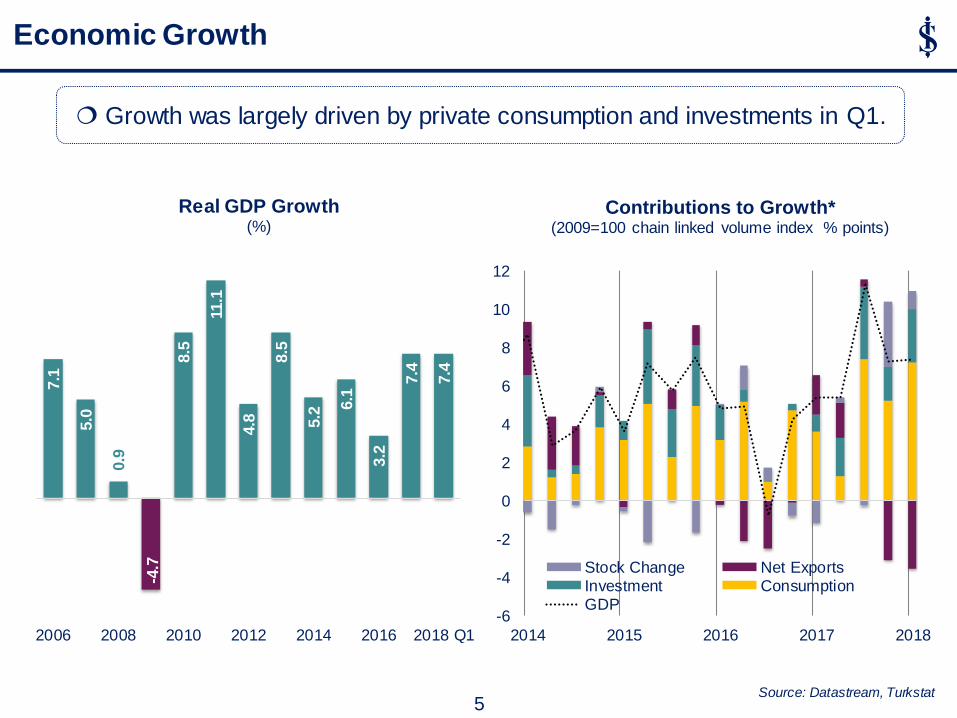
Growth was largely driven by private consumption and investments in Q1.
Source: Datastream, Turkstat
7.1
5.0
0.9
-4.7
8.5
11.1
4.8
8.5
5.2
6.1
3.2
7.4
7.4
2006 2008 2010 2012 2014 2016 2018 Q1
Real GDP Growth (%)
-6
-4
-2
0
2
4
6
8
10
12
2014 2015 2016 2017 2018
Contributions to Growth* (2009=100 chain linked volume index % points)
Stock Change Net ExportsInvestment ConsumptionGDP
Economic Growth
5
Leading Indicators
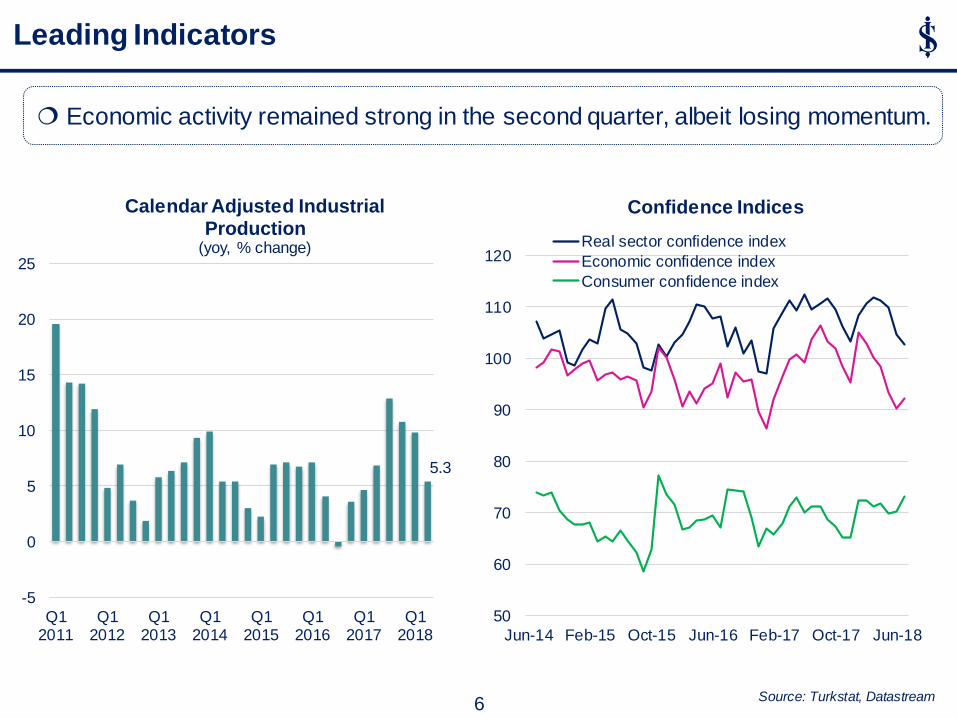
Economic activity remained strong in the second quarter, albeit losing momentum.
6
5.3
-5
0
5
10
15
20
25
Q12011
Q12012
Q12013
Q12014
Q12015
Q12016
Q12017
Q12018
Calendar Adjusted Industrial Production
(yoy, % change)
50
60
70
80
90
100
110
120
Jun-14 Feb-15 Oct-15 Jun-16 Feb-17 Oct-17 Jun-18
Confidence Indices
Real sector confidence index
Economic confidence index
Consumer confidence index
Source: Turkstat, Datastream
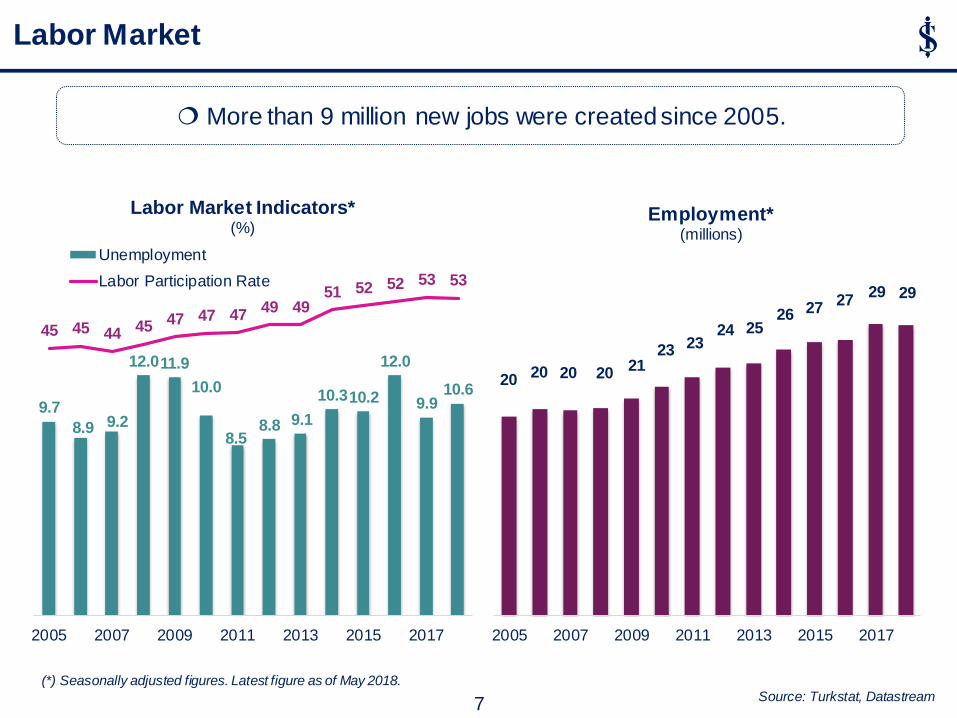
More than 9 million new jobs were created since 2005.
Labor Market
7
9.7
8.9 9.2
12.0 11.9
10.0
8.5 8.8 9.1
10.3 10.2
12.0
9.9 10.6
45 45 44 45 47 47 47 49 49
51 52 52 53 53
2005 2007 2009 2011 2013 2015 2017
Labor Market Indicators* (%)
Unemployment
Labor Participation Rate
20 20 20 20 21
23 23 24 25
26 27 27
29 29
2005 2007 2009 2011 2013 2015 2017
Employment* (millions)
(*) Seasonally adjusted figures. Latest figure as of May 2018. Source: Turkstat, Datastream
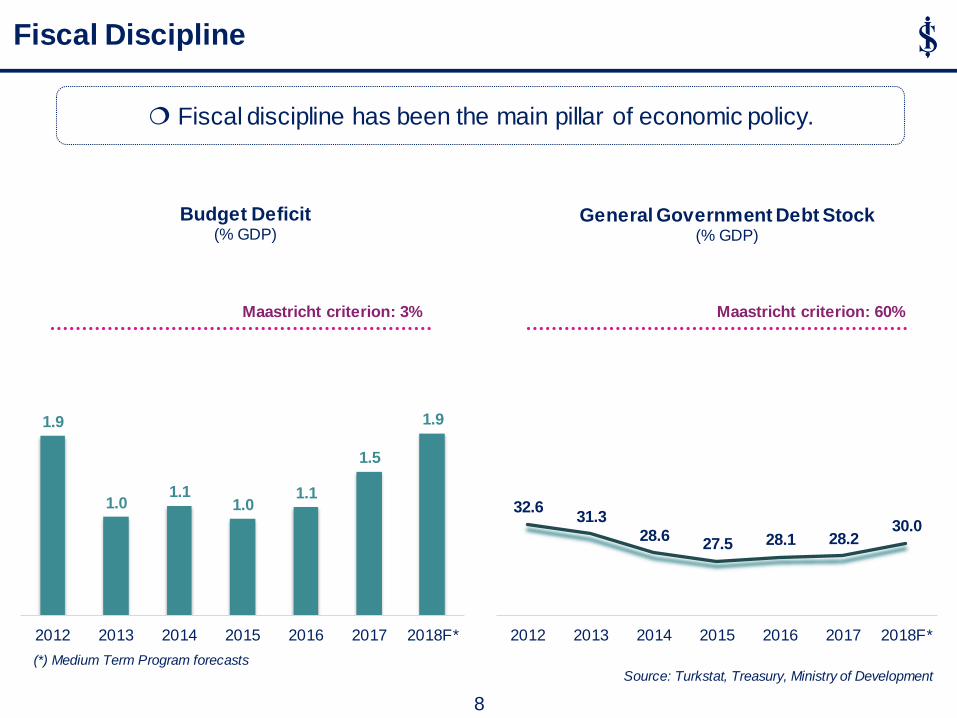
Fiscal discipline has been the main pillar of economic policy.
1.9
1.0 1.1
1.0 1.1
1.5
1.9
2012 2013 2014 2015 2016 2017 2018F*
Budget Deficit (% GDP)
Maastricht criterion: 3%
32.6 31.3
28.6 27.5 28.1 28.2
30.0
2012 2013 2014 2015 2016 2017 2018F*
General Government Debt Stock (% GDP)
Maastricht criterion: 60%
Fiscal Discipline
8
(*) Medium Term Program forecasts Source: Turkstat, Treasury, Ministry of Development
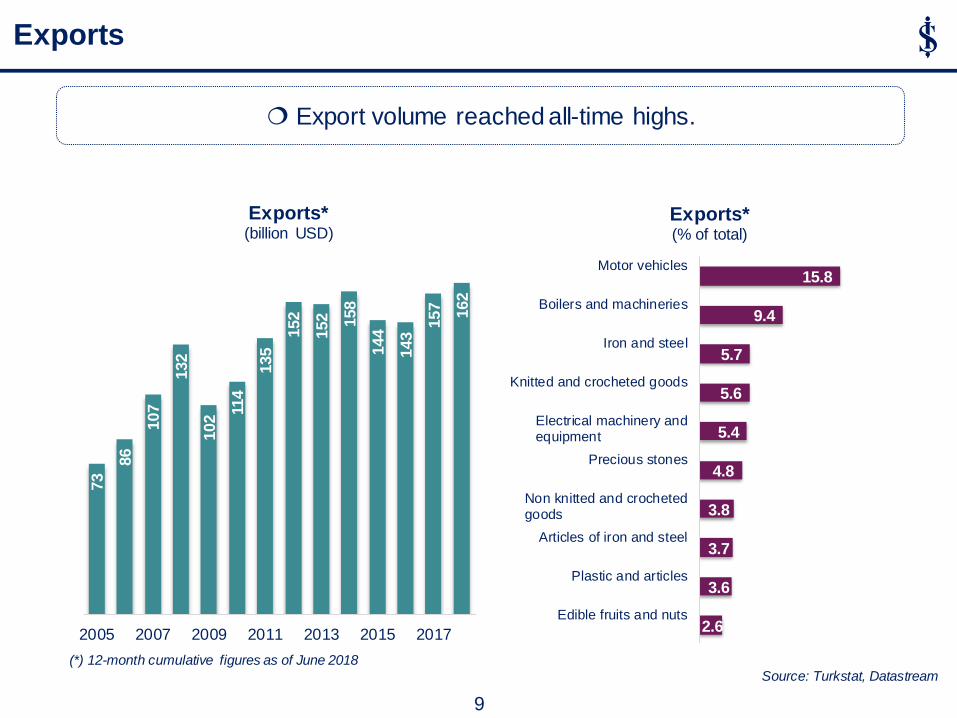
Export volume reached all-time highs.
2.6
3.6
3.7
3.8
4.8
5.4
5.6
5.7
9.4
15.8
Edible fruits and nuts
Plastic and articles
Articles of iron and steel
Non knitted and crochetedgoods
Precious stones
Electrical machinery andequipment
Knitted and crocheted goods
Iron and steel
Boilers and machineries
Motor vehicles
Exports* (% of total)
Exports
9
73
86
107
132
102 11
4
135
152
152
158
144
143 1
57
162
2005 2007 2009 2011 2013 2015 2017
Exports* (billion USD)
(*) 12-month cumulative figures as of June 2018 Source: Turkstat, Datastream
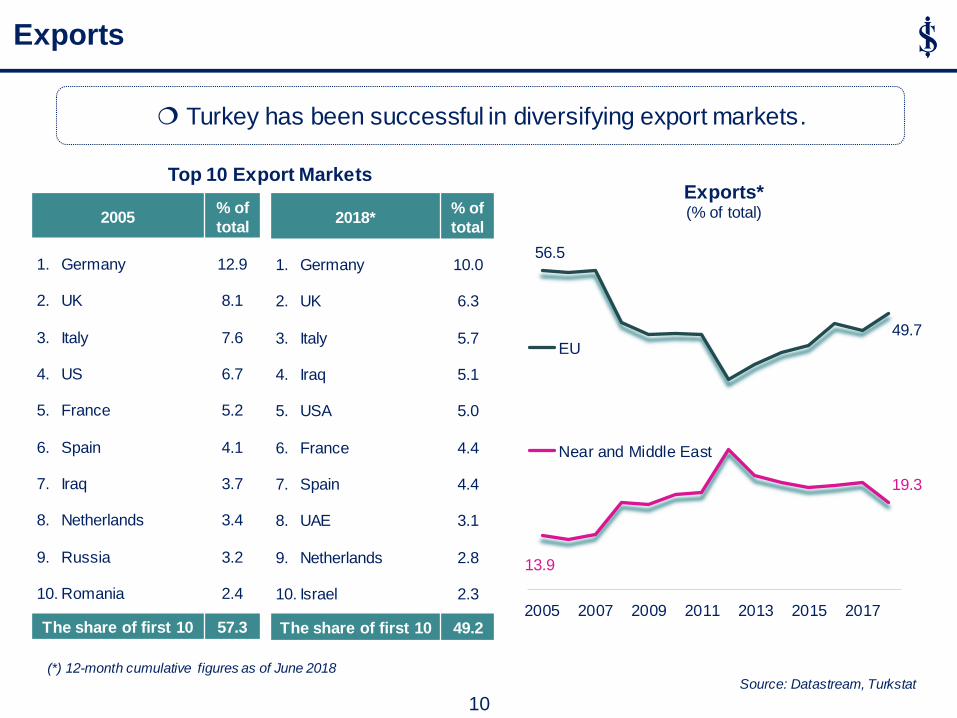
Turkey has been successful in diversifying export markets.
Top 10 Export Markets
2005 % of
total
1. Germany
2. UK
3. Italy
4. US
5. France
6. Spain
7. Iraq
8. Netherlands
9. Russia
10. Romania
12.9
8.1
7.6
6.7
5.2
4.1
3.7
3.4
3.2
2.4
The share of first 10 57.3
2018* % of
total
1. Germany
2. UK
3. Italy
4. Iraq
5. USA
6. France
7. Spain
8. UAE
9. Netherlands
10. Israel
10.0
6.3
5.7
5.1
5.0
4.4
4.4
3.1
2.8
2.3
The share of first 10 49.2
Exports
56.5
49.7
13.9
19.3
2005 2007 2009 2011 2013 2015 2017
Exports* (% of total)
EU
Near and Middle East
10
(*) 12-month cumulative figures as of June 2018 Source: Datastream, Turkstat
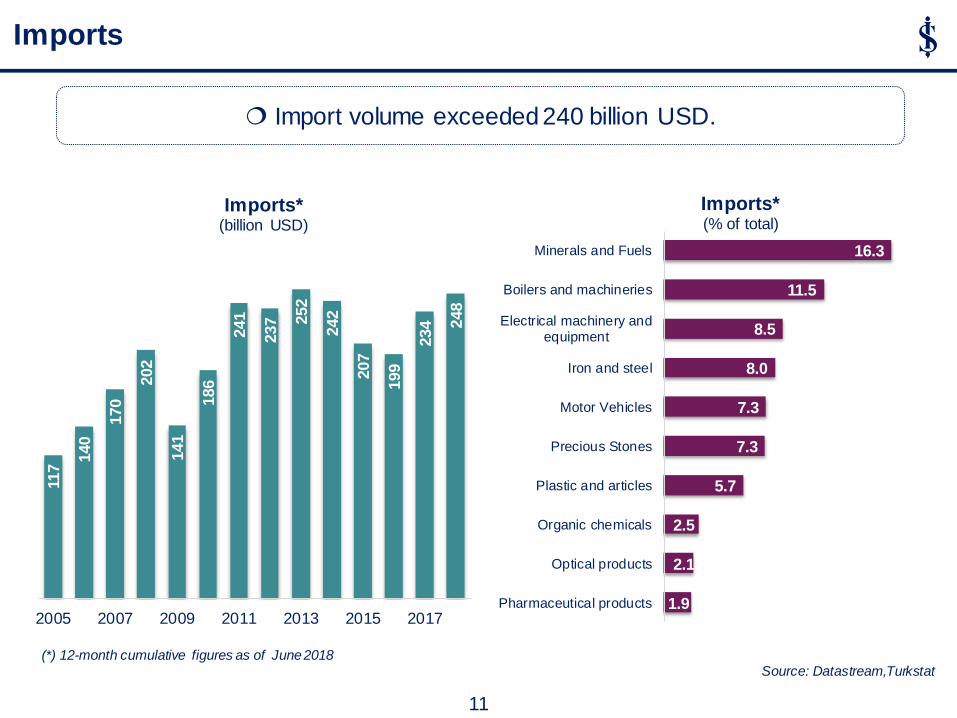
Import volume exceeded 240 billion USD.
1.9
2.1
2.5
5.7
7.3
7.3
8.0
8.5
11.5
16.3
Pharmaceutical products
Optical products
Organic chemicals
Plastic and articles
Precious Stones
Motor Vehicles
Iron and steel
Electrical machinery andequipment
Boilers and machineries
Minerals and Fuels
Imports* (% of total)
117 1
40
170
202
141
186
241
237 252
242
207
199
234
248
2005 2007 2009 2011 2013 2015 2017
Imports* (billion USD)
Imports
11
(*) 12-month cumulative figures as of June 2018 Source: Datastream,Turkstat
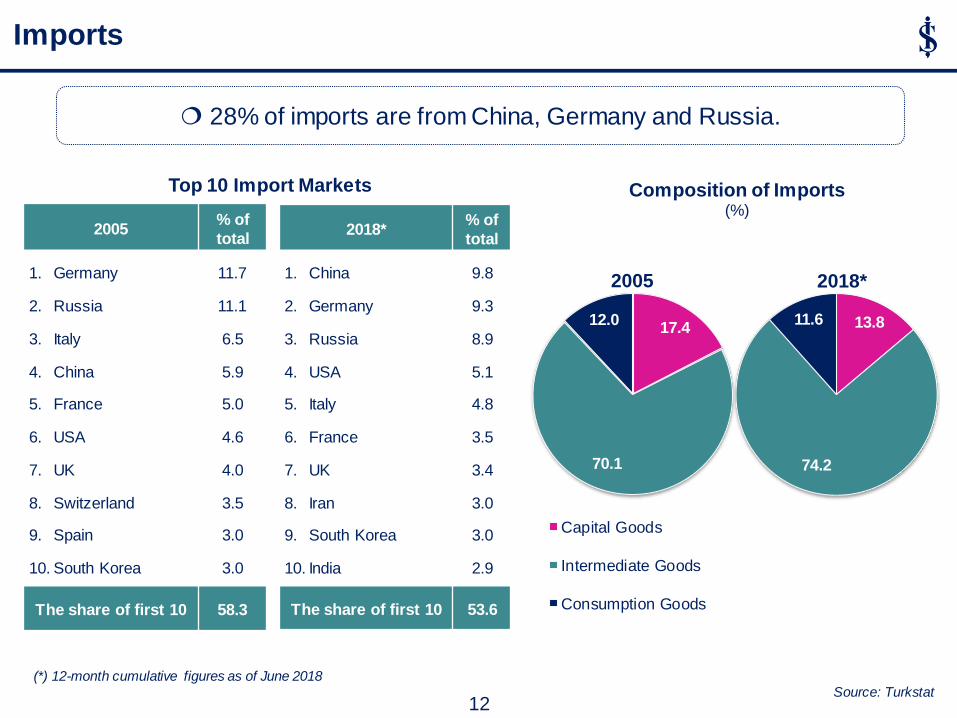
17.4
70.1
12.0
2005
Capital Goods
Intermediate Goods
Consumption Goods
28% of imports are from China, Germany and Russia.
Top 10 Import Markets
2005 % of
total
1. Germany
2. Russia
3. Italy
4. China
5. France
6. USA
7. UK
8. Switzerland
9. Spain
10. South Korea
11.7
11.1
6.5
5.9
5.0
4.6
4.0
3.5
3.0
3.0
The share of first 10 58.3
2018* % of
total
1. China
2. Germany
3. Russia
4. USA
5. Italy
6. France
7. UK
8. Iran
9. South Korea
10. India
9.8
9.3
8.9
5.1
4.8
3.5
3.4
3.0
3.0
2.9
The share of first 10 53.6
13.8
74.2
11.6
2018*
Imports
Composition of Imports (%)
12
(*) 12-month cumulative figures as of June 2018 Source: Turkstat
Tourism
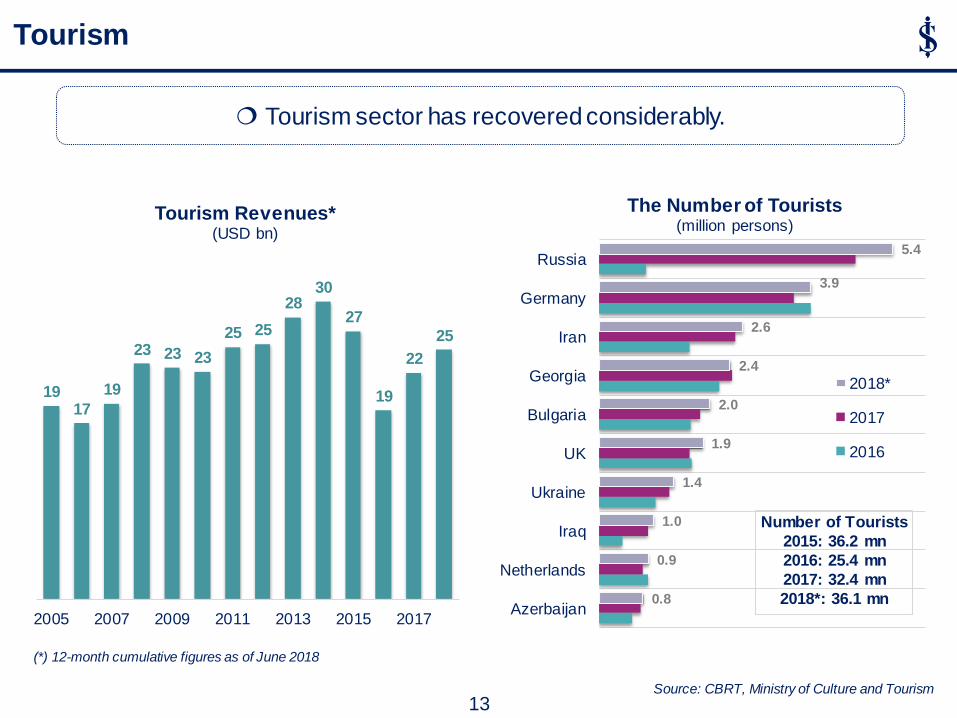
19 17
19
23 23 23
25 25
28 30
27
19
22
25
2005 2007 2009 2011 2013 2015 2017
Tourism Revenues* (USD bn)
Tourism sector has recovered considerably.
13
0.8
0.9
1.0
1.4
1.9
2.0
2.4
2.6
3.9
5.4
Azerbaijan
Netherlands
Iraq
Ukraine
UK
Bulgaria
Georgia
Iran
Germany
Russia
The Number of Tourists (million persons)
2018*
2017
2016
Number of Tourists
2015: 36.2 mn
2016: 25.4 mn
2017: 32.4 mn
2018*: 36.1 mn
(*) 12-month cumulative figures as of June 2018
Source: CBRT, Ministry of Culture and Tourism
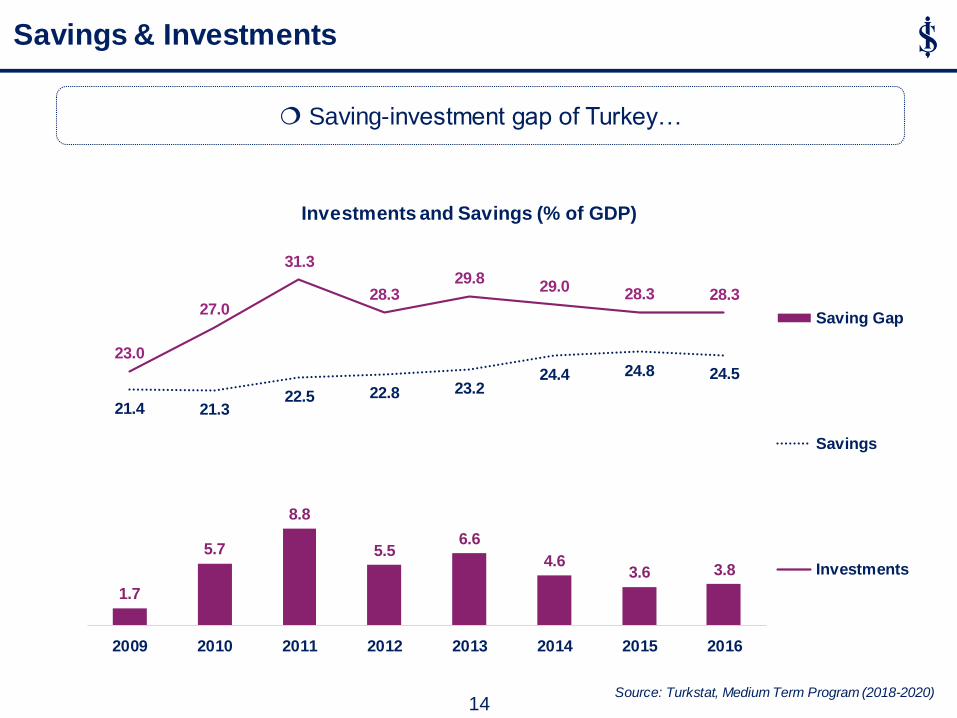
Saving-investment gap of Turkey…
Savings & Investments
Source: Turkstat, Medium Term Program (2018-2020)
1.7
5.7
8.8
5.5 6.6
4.6 3.6 3.8
21.4 21.3 22.5 22.8 23.2
24.4 24.8 24.5
23.0
27.0
31.3
28.3 29.8
29.0 28.3 28.3
2009 2010 2011 2012 2013 2014 2015 2016
Investments and Savings (% of GDP)
Saving Gap
Savings
Investments
14
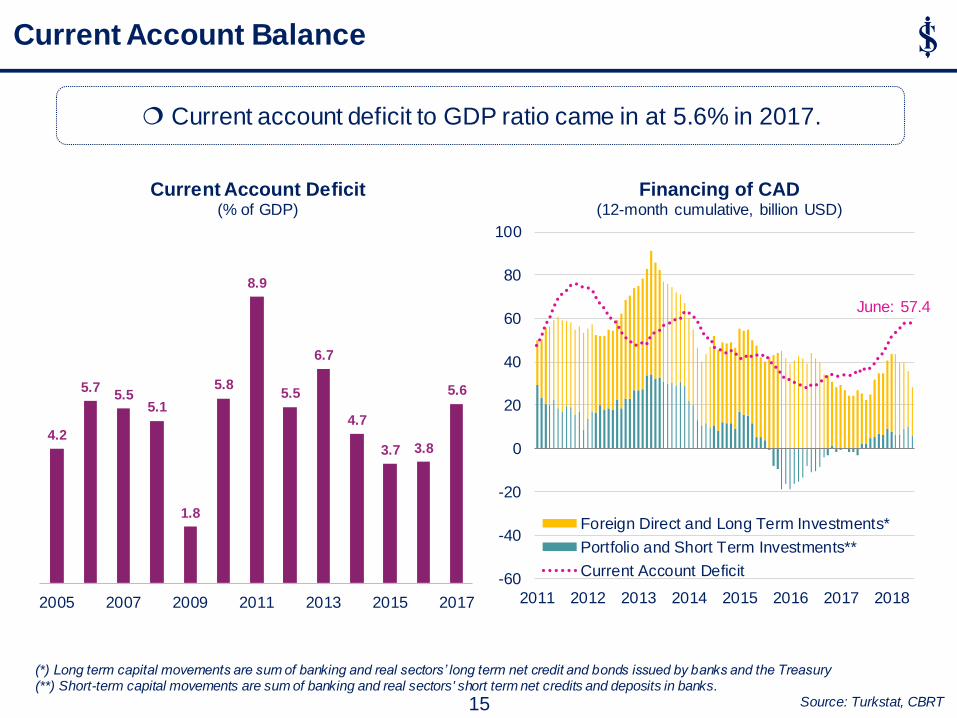
Current account deficit to GDP ratio came in at 5.6% in 2017.
4.2
5.7 5.5
5.1
1.8
5.8
8.9
5.5
6.7
4.7
3.7 3.8
5.6
2005 2007 2009 2011 2013 2015 2017
Current Account Deficit (% of GDP)
Current Account Balance
June: 57.4
-60
-40
-20
0
20
40
60
80
100
2011 2012 2013 2014 2015 2016 2017 2018
Financing of CAD (12-month cumulative, billion USD)
Foreign Direct and Long Term Investments*
Portfolio and Short Term Investments**
Current Account Deficit
(*) Long term capital movements are sum of banking and real sectors’ long term net credit and bonds issued by banks and the Treasury (**) Short-term capital movements are sum of banking and real sectors' short term net credits and deposits in banks.
Source: Turkstat, CBRT 15
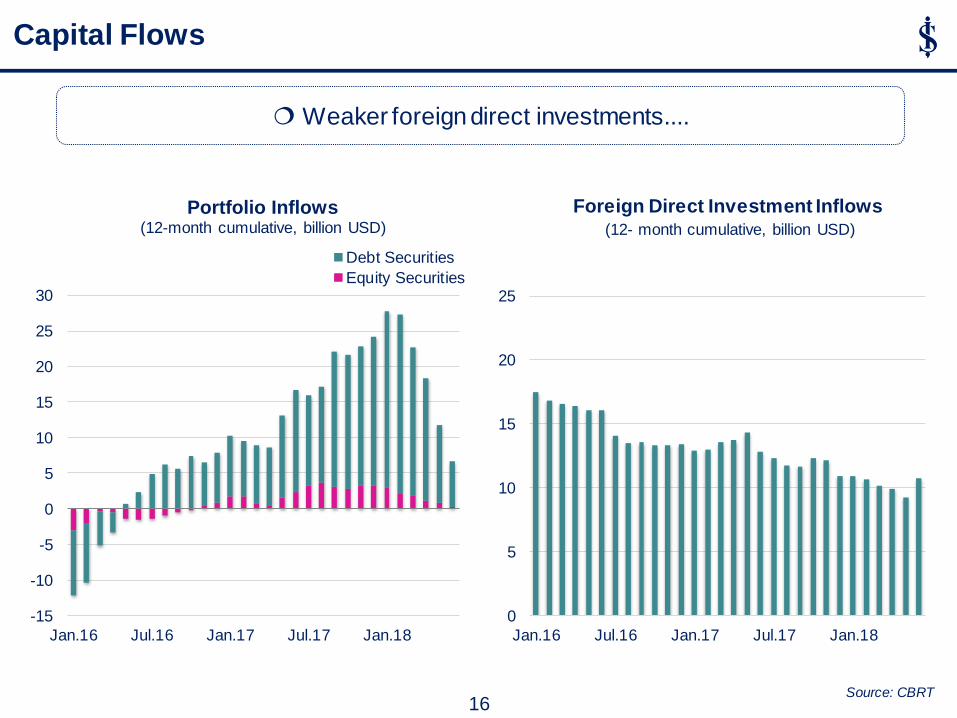
Weaker foreign direct investments....
Source: CBRT
Capital Flows
-15
-10
-5
0
5
10
15
20
25
30
Jan.16 Jul.16 Jan.17 Jul.17 Jan.18
Portfolio Inflows (12-month cumulative, billion USD)
Debt Securities
Equity Securities
0
5
10
15
20
25
Jan.16 Jul.16 Jan.17 Jul.17 Jan.18
Bin
ler
Foreign Direct Investment Inflows (12- month cumulative, billion USD)
16
6
8
10
12
14
16
18
20
22
Jan.17 May.17 Sep.17 Jan.18 May.18
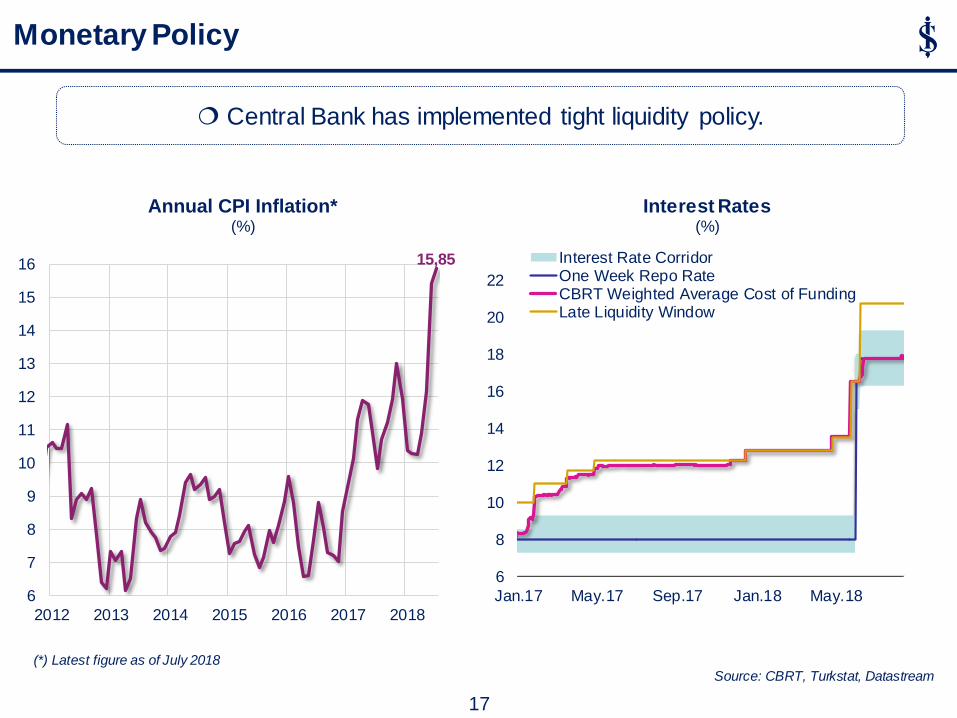
Interest Rates (%)
Interest Rate CorridorOne Week Repo RateCBRT Weighted Average Cost of FundingLate Liquidity Window
Monetary Policy
Central Bank has implemented tight liquidity policy.
15,85
6
7
8
9
10
11
12
13
14
15
16
2012 2013 2014 2015 2016 2017 2018
Annual CPI Inflation* (%)
17
(*) Latest figure as of July 2018 Source: CBRT, Turkstat, Datastream
80
100
120
140
160
180
200
Jan.17 May.17 Sep.17 Jan.18 May.18
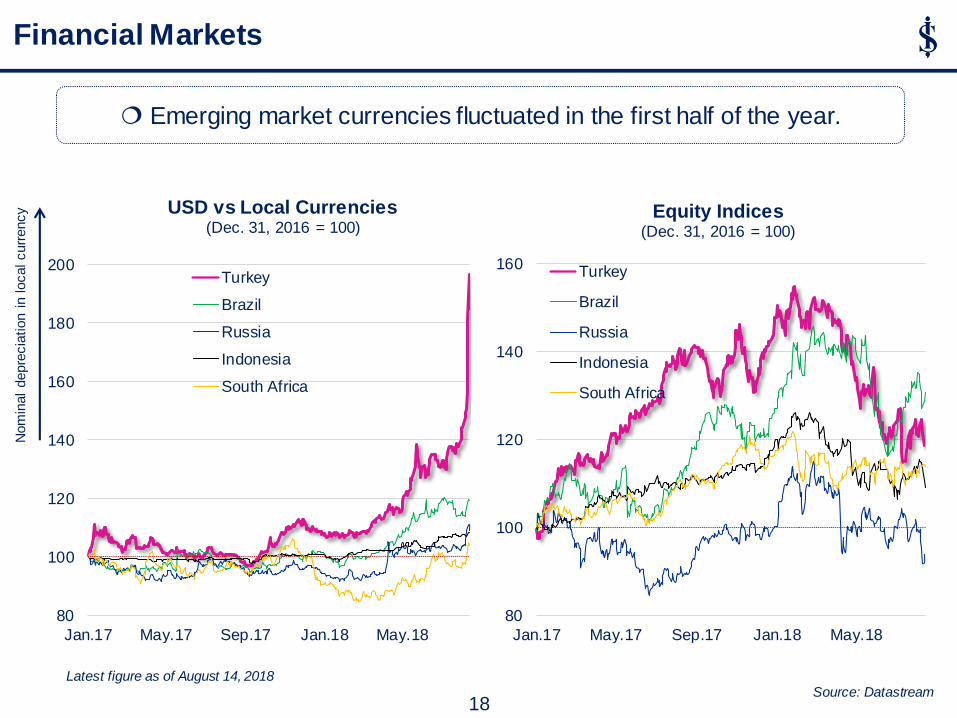
USD vs Local Currencies (Dec. 31, 2016 = 100)
Turkey
Brazil
Russia
Indonesia
South Africa
Latest figure as of August 14, 2018 Source: Datastream
Financial Markets N
om
inal
depre
cia
tion i
n local curr
ency
Emerging market currencies fluctuated in the first half of the year.
18
80
100
120
140
160
Jan.17 May.17 Sep.17 Jan.18 May.18
Equity Indices (Dec. 31, 2016 = 100)
Turkey
Brazil
Russia
Indonesia
South Africa
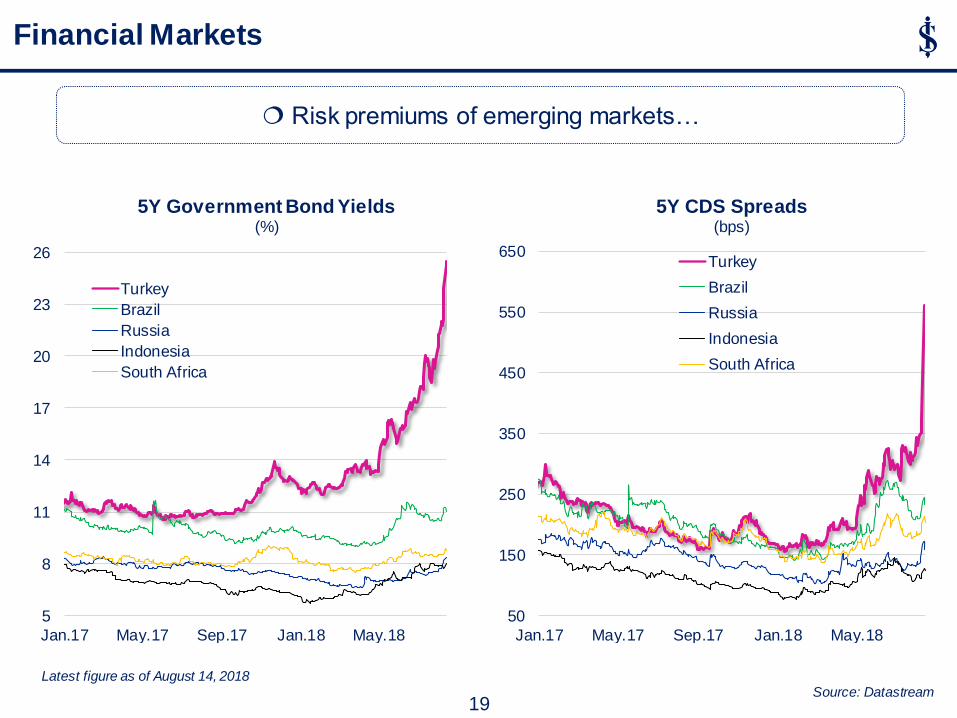
Financial Markets
Risk premiums of emerging markets…
Latest figure as of August 14, 2018 Source: Datastream
19
5
8
11
14
17
20
23
26
Jan.17 May.17 Sep.17 Jan.18 May.18
5Y Government Bond Yields (%)
Turkey
Brazil
Russia
Indonesia
South Africa
50
150
250
350
450
550
650
Jan.17 May.17 Sep.17 Jan.18 May.18
5Y CDS Spreads (bps)
Turkey
Brazil
Russia
Indonesia
South Africa

Banking Sector Dynamics
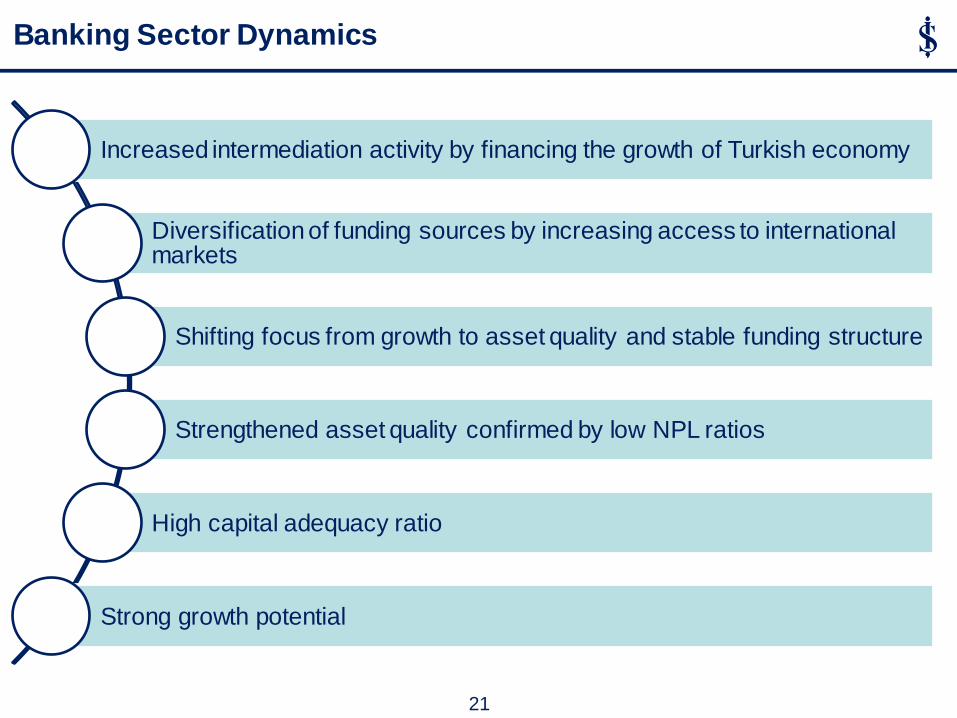
Banking Sector Dynamics
Increased intermediation activity by financing the growth of Turkish economy
Diversification of funding sources by increasing access to international markets
Shifting focus from growth to asset quality and stable funding structure
Strengthened asset quality confirmed by low NPL ratios
High capital adequacy ratio
Strong growth potential
21
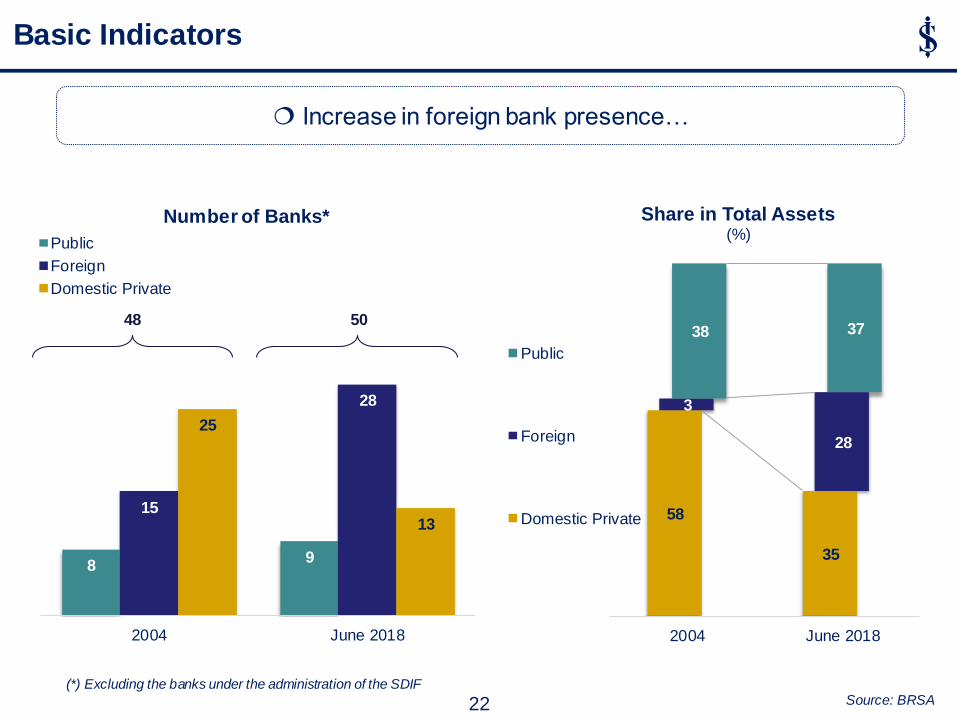
Increase in foreign bank presence…
(*) Excluding the banks under the administration of the SDIF Source: BRSA
Basic Indicators
22
8 9
15
28
25
13
2004 June 2018
Number of Banks*
Public
Foreign
Domestic Private
50 48
58
35
3
28
38 37
2004 June 2018
Share in Total Assets (%)
Public
Foreign
Domestic Private
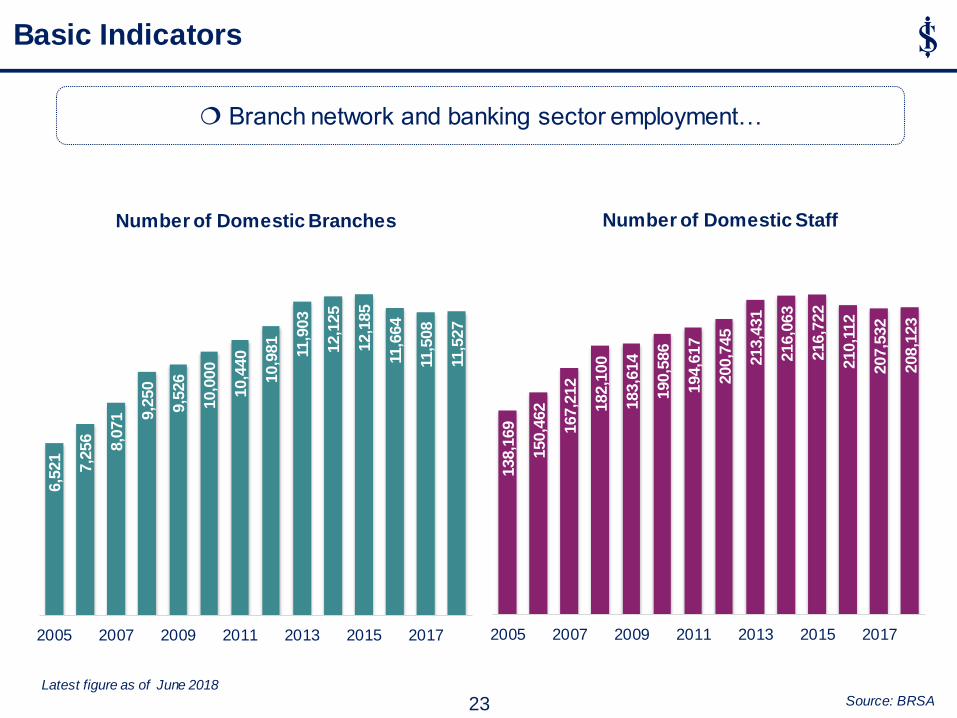
Branch network and banking sector employment…
Latest figure as of June 2018 Source: BRSA
Basic Indicators 6,5
21
7,2
56
8,0
71 9,2
50
9,5
26
10,0
00
10,4
40
10,9
81
11,9
03
12,1
25
12,1
85
11,6
64
11,5
08
11,5
27
2005 2007 2009 2011 2013 2015 2017
Number of Domestic Branches
23
138,1
69
150,4
62
167,2
12
182,1
00
183,6
14
190,5
86
194,6
17
200,7
45
213,4
31
216,0
63
216,7
22
210,1
12
207,5
32
208,1
23
2005 2007 2009 2011 2013 2015 2017
Number of Domestic Staff
23
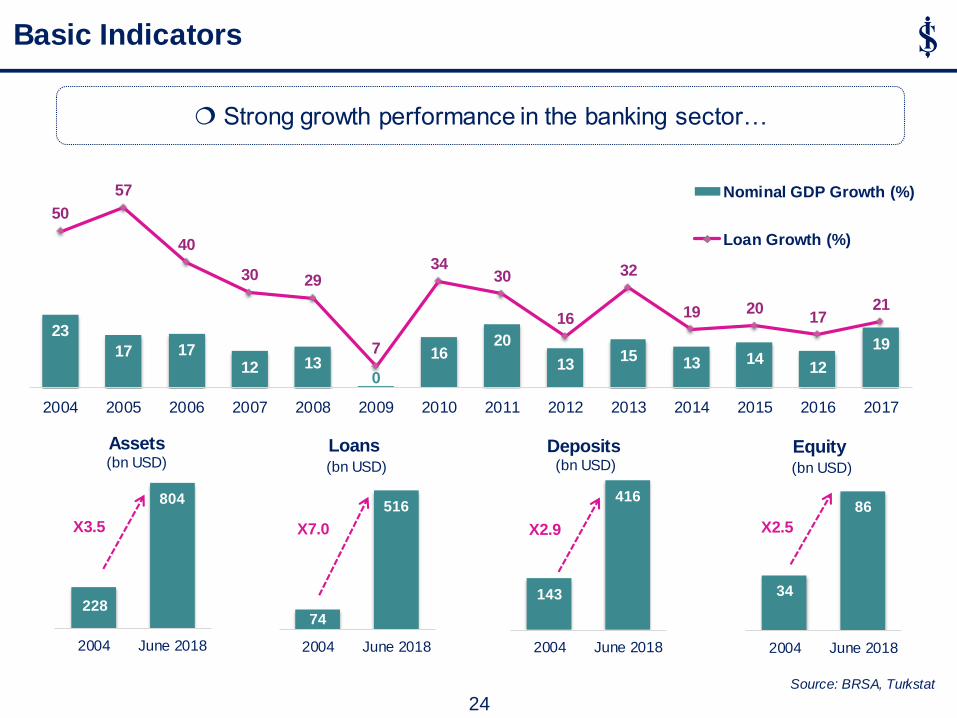
17 17 12 13
0
16 20
13 15 13 14
12
19
50
57
40
30 29
7
34 30
16
32
19 20 17
21
2004 2005 2006 2007 2008 2009 2010 2011 2012 2013 2014 2015 2016 2017
Nominal GDP Growth (%)
Loan Growth (%)
228
804
2004 June 2018
Assets (bn USD)
X3.5
Basic Indicators
143
416
2004 June 2018
Deposits (bn USD)
X2.9
74
516
2004 June 2018
Loans (bn USD)
X7.0
34
86
2004 June 2018
Equity (bn USD)
X2.5
Strong growth performance in the banking sector…
24 Source: BRSA, Turkstat
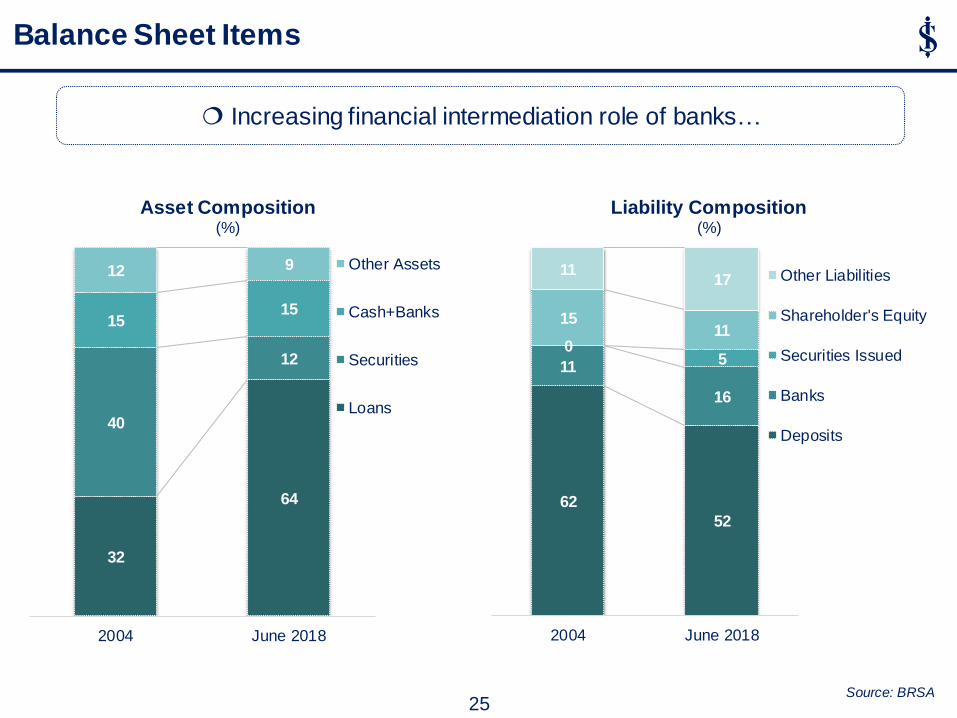
Increasing financial intermediation role of banks…
Source: BRSA
Balance Sheet Items
25
32
64
40
12
15 15
12 9
2004 June 2018
Asset Composition (%)
Other Assets
Cash+Banks
Securities
Loans
62
52
11
16
0 5
15 11
11 17
2004 June 2018
Liability Composition (%)
Other Liabilities
Shareholder's Equity
Securities Issued
Banks
Deposits
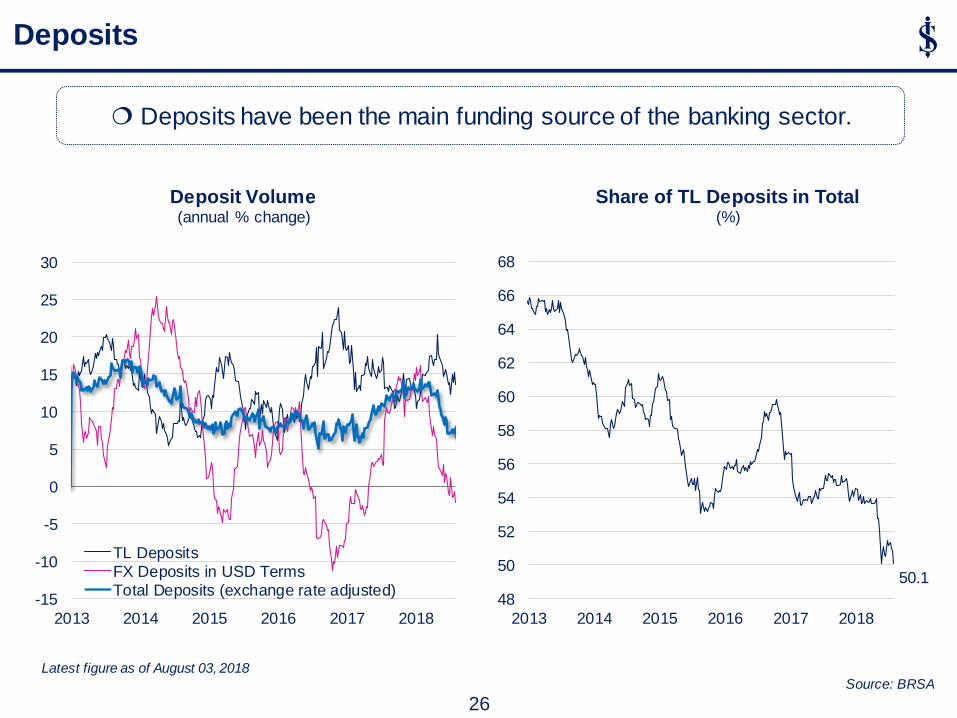
Deposits
Latest figure as of August 03, 2018 Source: BRSA
Deposits have been the main funding source of the banking sector.
26
-15
-10
-5
0
5
10
15
20
25
30
2013 2014 2015 2016 2017 2018
Deposit Volume (annual % change)
TL DepositsFX Deposits in USD TermsTotal Deposits (exchange rate adjusted)
50.1
48
50
52
54
56
58
60
62
64
66
68
2013 2014 2015 2016 2017 2018
Share of TL Deposits in Total (%)
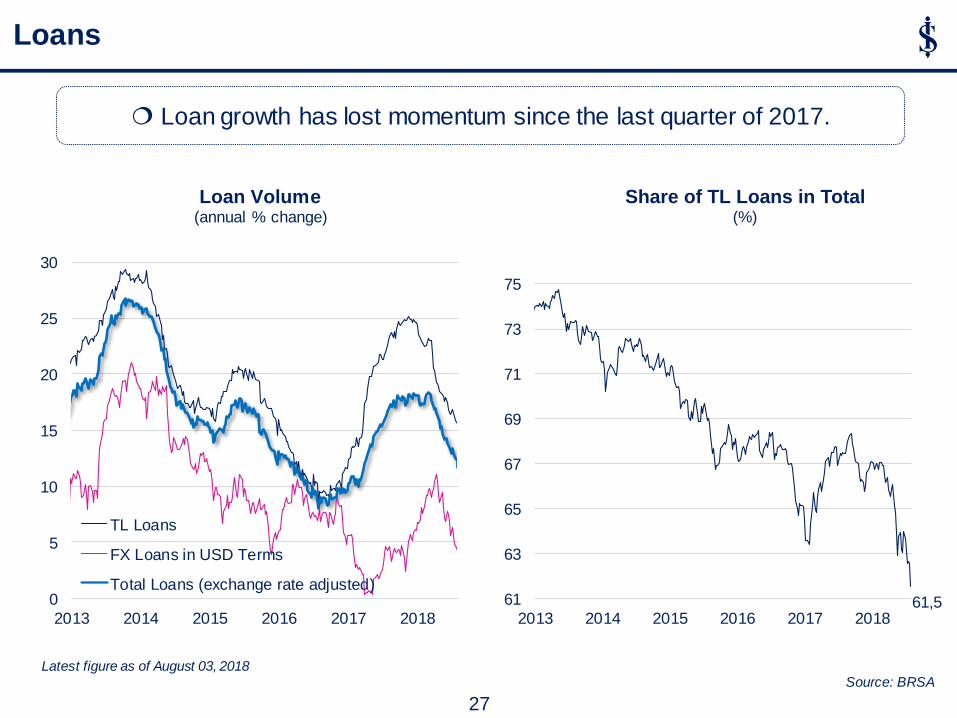
Loans
Loan growth has lost momentum since the last quarter of 2017.
27
61,5 61
63
65
67
69
71
73
75
2013 2014 2015 2016 2017 2018
Share of TL Loans in Total (%)
0
5
10
15
20
25
30
2013 2014 2015 2016 2017 2018
Loan Volume (annual % change)
TL Loans
FX Loans in USD Terms
Total Loans (exchange rate adjusted)
Latest figure as of August 03, 2018 Source: BRSA
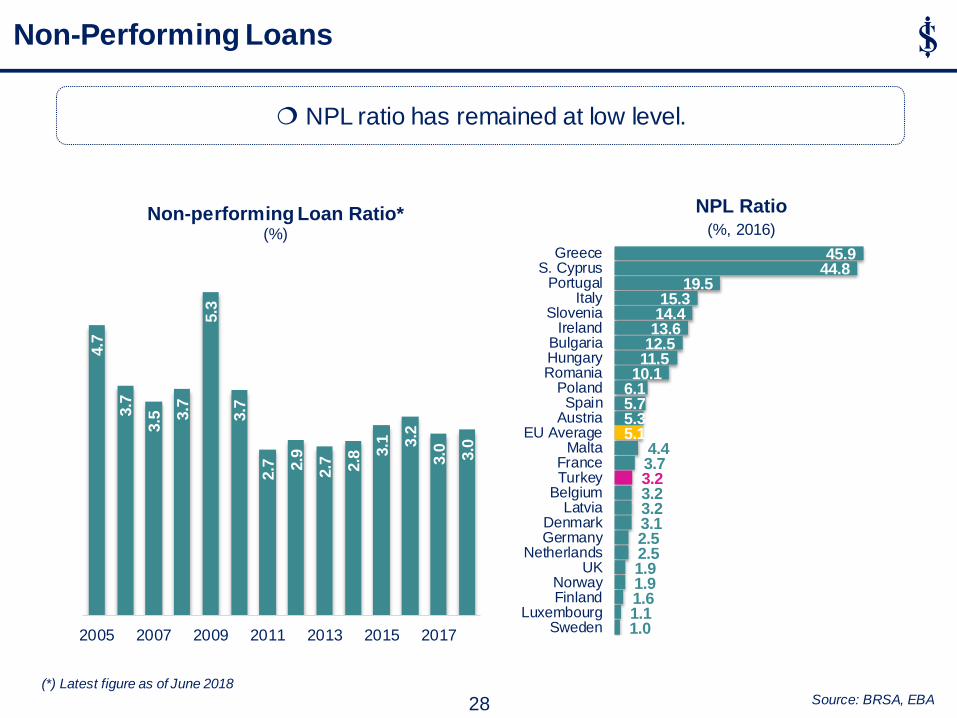
NPL ratio has remained at low level.
(*) Latest figure as of June 2018 Source: BRSA, EBA
Non-Performing Loans
1.0 1.1 1.6 1.9 1.9 2.5 2.5 3.1 3.2 3.2 3.2 3.7 4.4
5.1 5.3 5.7 6.1 10.1 11.5 12.5 13.6 14.4 15.3
19.5 44.8 45.9
SwedenLuxembourg
FinlandNorway
UKNetherlands
GermanyDenmark
LatviaBelgiumTurkeyFrance
MaltaEU Average
AustriaSpain
PolandRomaniaHungaryBulgaria
IrelandSlovenia
ItalyPortugal
S. CyprusGreece
NPL Ratio (%, 2016)
28
4.7
3.7
3.5
3.7
5.3
3.7
2.7
2.9
2.7
2.8
3.1
3.2
3.0
3.0
2005 2007 2009 2011 2013 2015 2017
Non-performing Loan Ratio* (%)
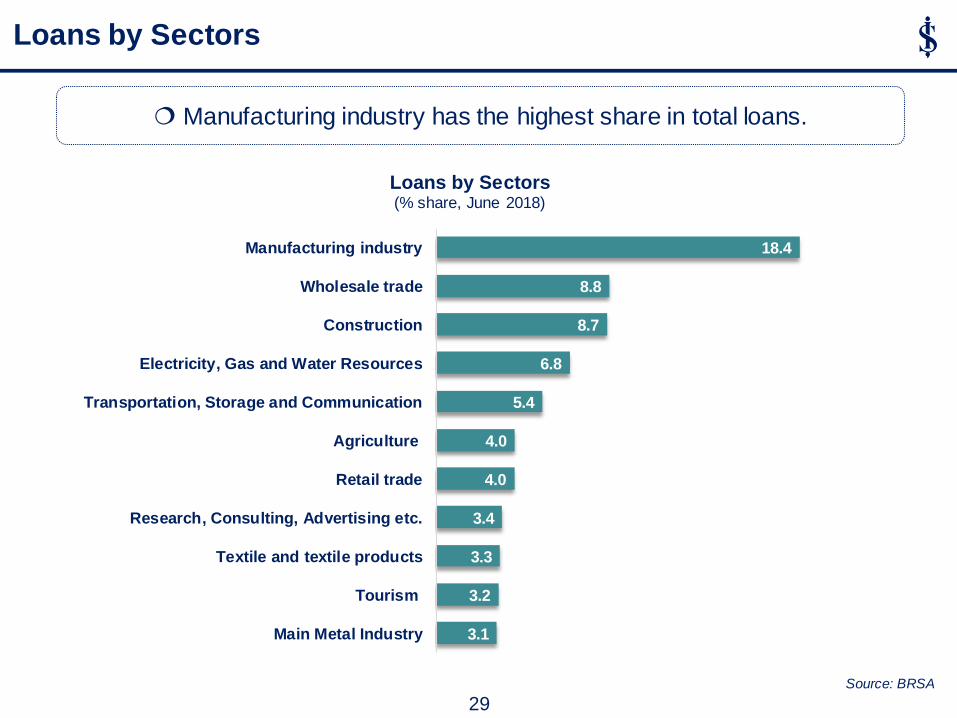
Manufacturing industry has the highest share in total loans.
Loans by Sectors
29
3.1
3.2
3.3
3.4
4.0
4.0
5.4
6.8
8.7
8.8
18.4
Main Metal Industry
Tourism
Textile and textile products
Research, Consulting, Advertising etc.
Retail trade
Agriculture
Transportation, Storage and Communication
Electricity, Gas and Water Resources
Construction
Wholesale trade
Manufacturing industry
Loans by Sectors (% share, June 2018)
Source: BRSA
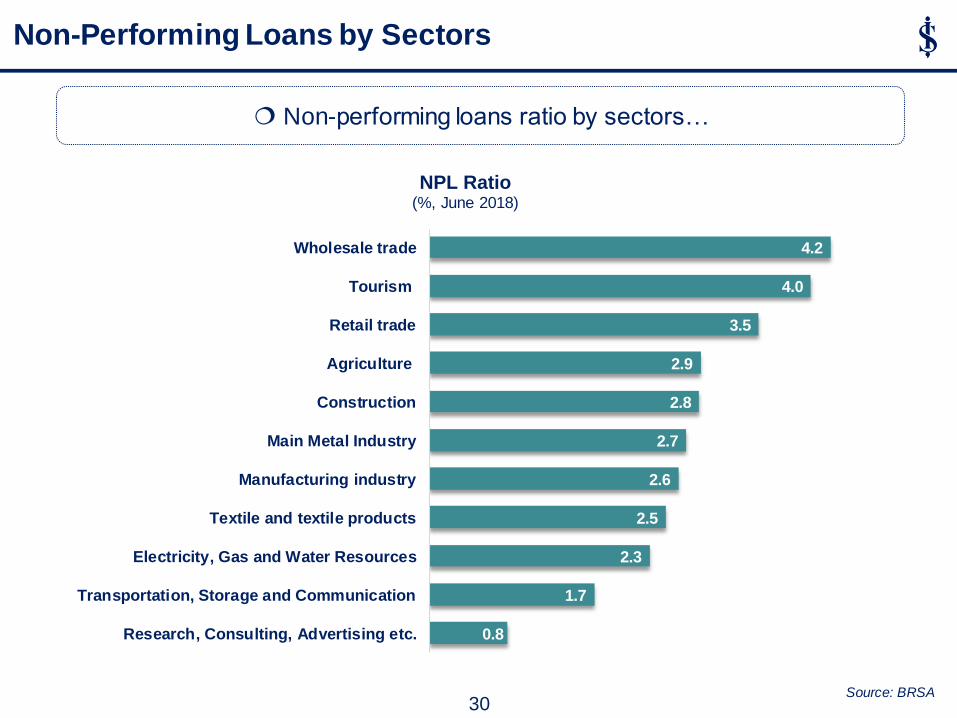
Non-performing loans ratio by sectors…
Source: BRSA
0.8
1.7
2.3
2.5
2.6
2.7
2.8
2.9
3.5
4.0
4.2
Research, Consulting, Advertising etc.
Transportation, Storage and Communication
Electricity, Gas and Water Resources
Textile and textile products
Manufacturing industry
Main Metal Industry
Construction
Agriculture
Retail trade
Tourism
Wholesale trade
NPL Ratio (%, June 2018)
Non-Performing Loans by Sectors
30
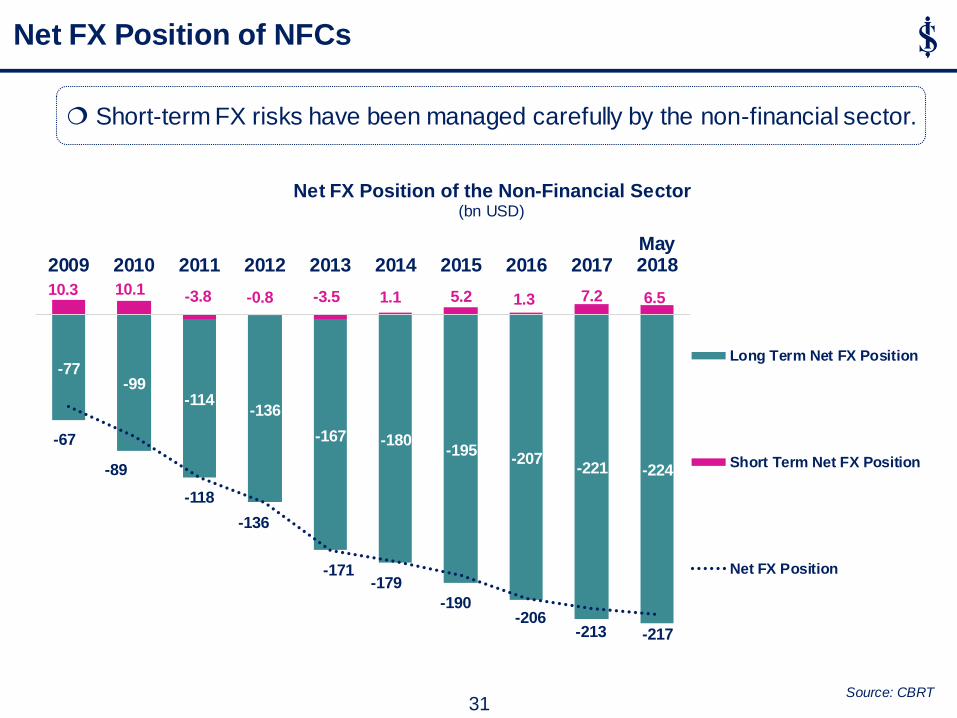
Short-term FX risks have been managed carefully by the non-financial sector.
Source: CBRT
Net FX Position of NFCs
10.3 10.1 -3.8 -0.8 -3.5 1.1 5.2 1.3 7.2 6.5
-77 -99
-114 -136
-167 -180 -195
-207 -221 -224
-67
-89
-118
-136
-171 -179
-190 -206
-213 -217
2009 2010 2011 2012 2013 2014 2015 2016 2017May2018
Net FX Position of the Non-Financial Sector (bn USD)
Long Term Net FX Position
Short Term Net FX Position
Net FX Position
31
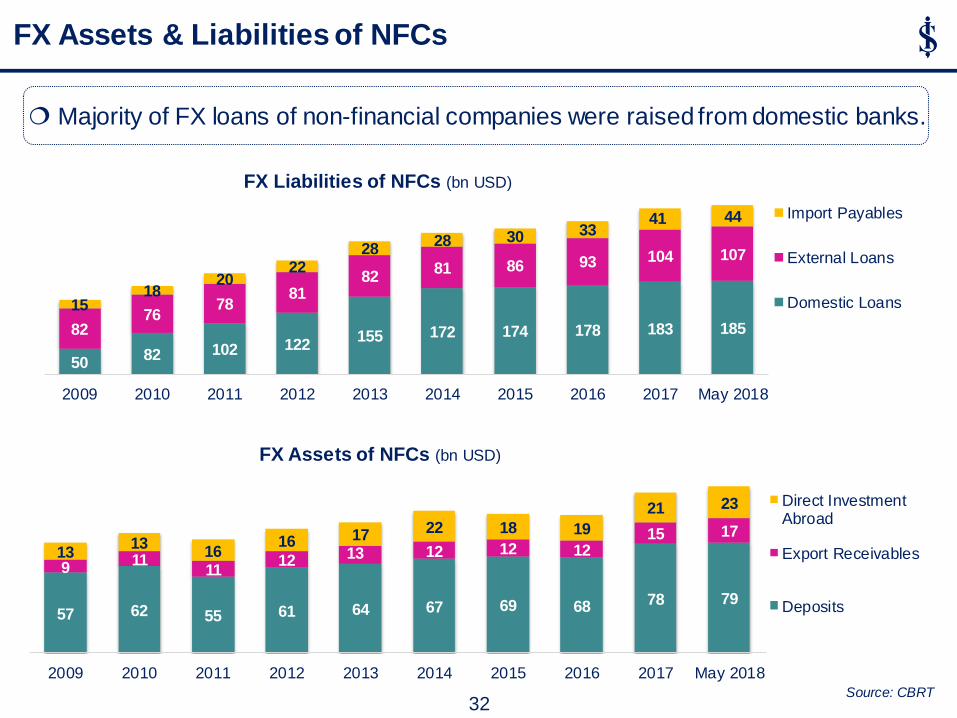
Majority of FX loans of non-financial companies were raised from domestic banks.
57 62 55 61 64 67 69 68 78 79
9 11
11 12 13 12 12 12
15 17
13 13
16 16 17 22 18 19
21 23
2009 2010 2011 2012 2013 2014 2015 2016 2017 May 2018
FX Assets of NFCs (bn USD)
Direct InvestmentAbroad
Export Receivables
Deposits
50 82 102 122
155 172 174 178 183 185 82 76
78 81
82 81 86 93 104 107
15 18
20 22
28 28 30 33
41 44
2009 2010 2011 2012 2013 2014 2015 2016 2017 May 2018
FX Liabilities of NFCs (bn USD)
Import Payables
External Loans
Domestic Loans
Source: CBRT
FX Assets & Liabilities of NFCs
32
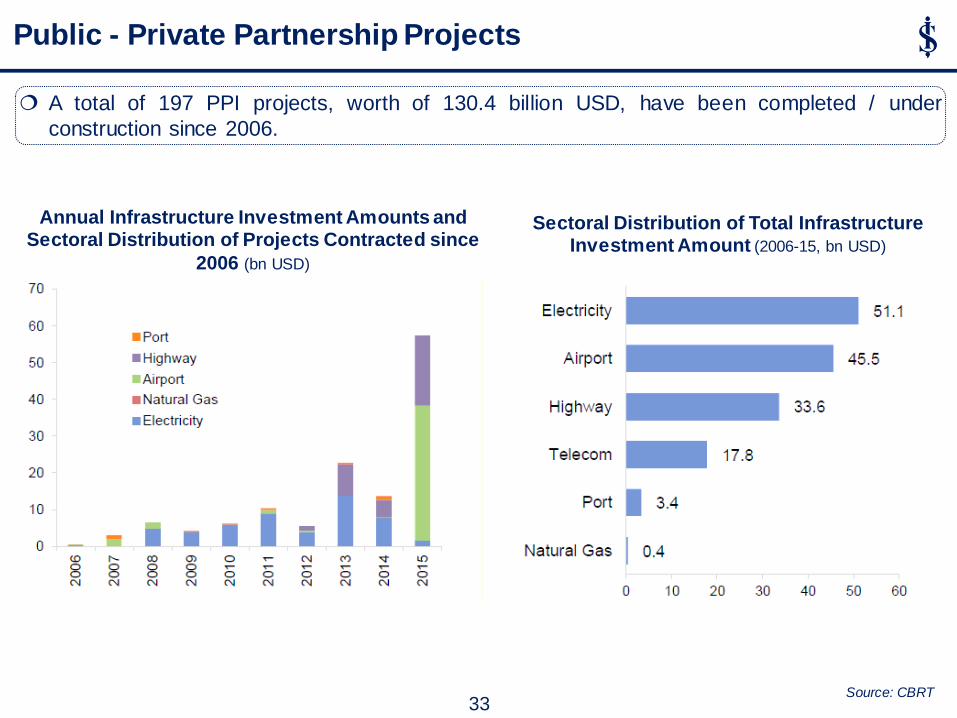
A total of 197 PPI projects, worth of 130.4 billion USD, have been completed / under
construction since 2006.
Source: CBRT
Annual Infrastructure Investment Amounts and Sectoral Distribution of Projects Contracted since
2006 (bn USD)
Public - Private Partnership Projects
Sectoral Distribution of Total Infrastructure Investment Amount (2006-15, bn USD)
33
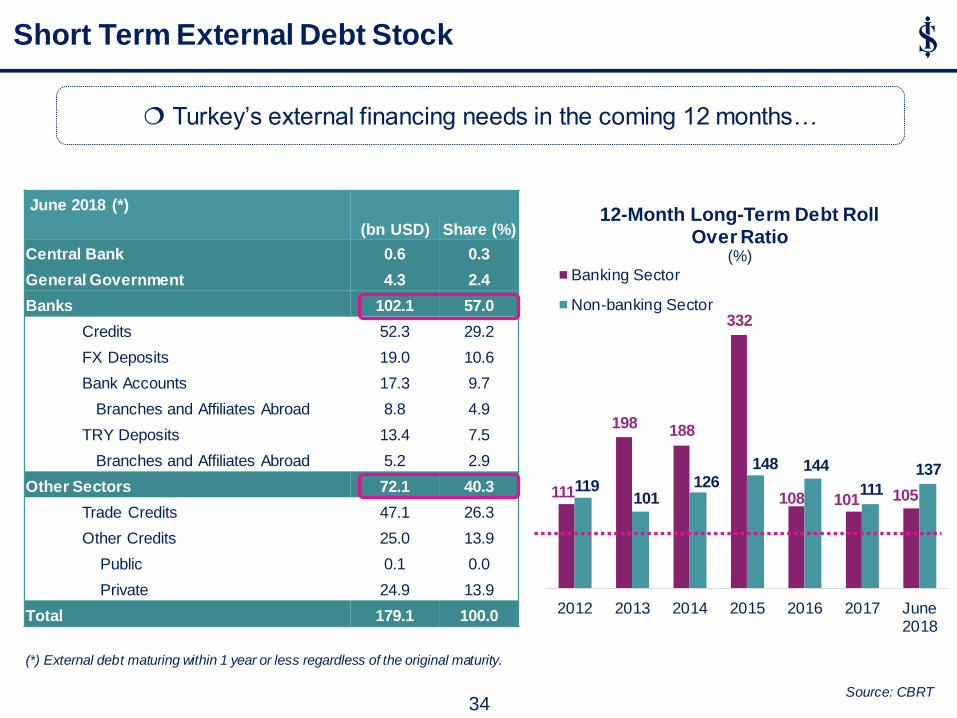
Turkey’s external financing needs in the coming 12 months…
June 2018 (*)
(bn USD) Share (%)
Central Bank 0.6 0.3
General Government 4.3 2.4
Banks 102.1 57.0
Credits 52.3 29.2
FX Deposits 19.0 10.6
Bank Accounts 17.3 9.7
Branches and Affiliates Abroad 8.8 4.9
TRY Deposits 13.4 7.5
Branches and Affiliates Abroad 5.2 2.9
Other Sectors 72.1 40.3
Trade Credits 47.1 26.3
Other Credits 25.0 13.9
Public 0.1 0.0
Private 24.9 13.9
Total 179.1 100.0
(*) External debt maturing within 1 year or less regardless of the original maturity.
Source: CBRT
Short Term External Debt Stock
111
198 188
332
108 101 105 119
101 126
148 144
111
137
2012 2013 2014 2015 2016 2017 June2018
12-Month Long-Term Debt Roll Over Ratio
(%)
Banking Sector
Non-banking Sector
34
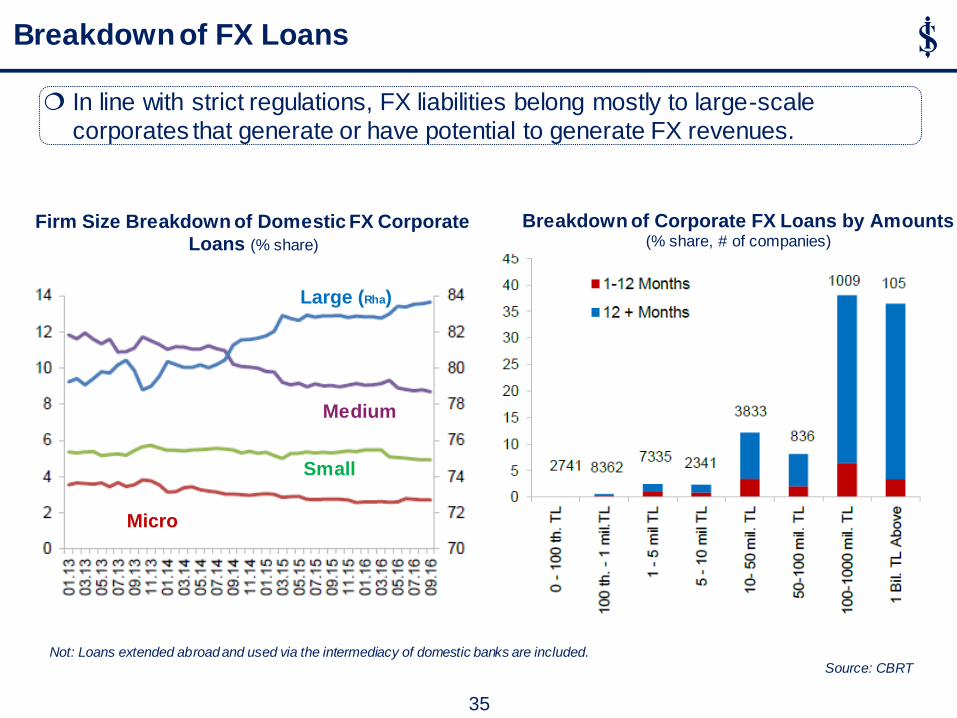
In line with strict regulations, FX liabilities belong mostly to large-scale
corporates that generate or have potential to generate FX revenues.
Not: Loans extended abroad and used via the intermediacy of domestic banks are included. Source: CBRT
Firm Size Breakdown of Domestic FX Corporate Loans (% share)
Breakdown of FX Loans
Micro
Medium
Small
Large (Rha)
Breakdown of Corporate FX Loans by Amounts (% share, # of companies)
35
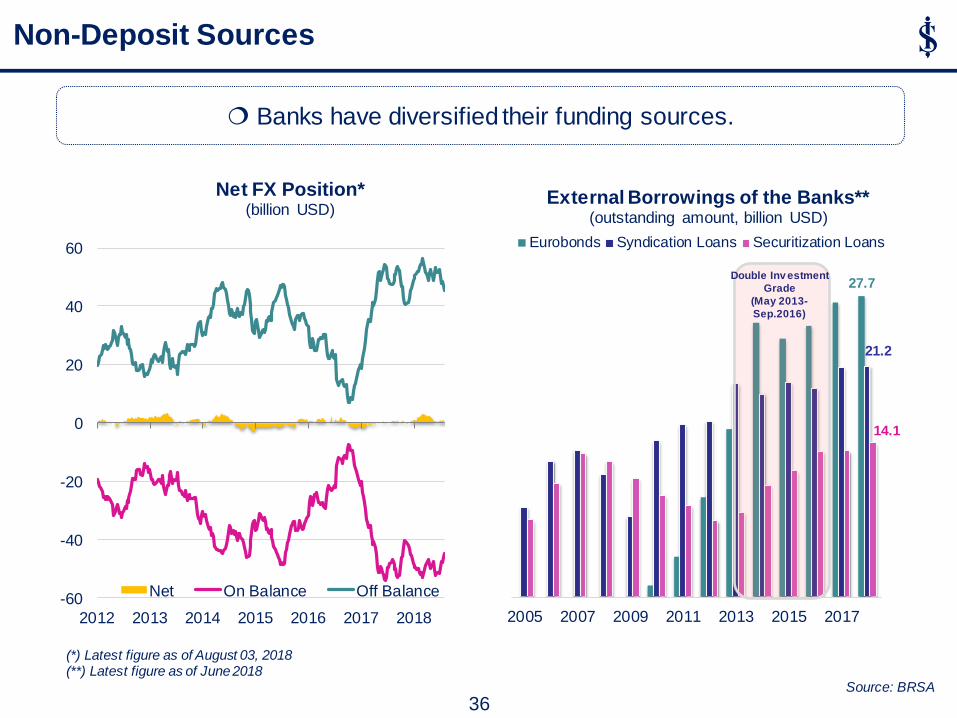
Non-Deposit Sources
(*) Latest figure as of August 03, 2018 (**) Latest figure as of June 2018
Source: BRSA
Banks have diversified their funding sources.
36
27.7
21.2
14.1
2005 2007 2009 2011 2013 2015 2017
External Borrowings of the Banks** (outstanding amount, billion USD)
Eurobonds Syndication Loans Securitization Loans
Double Inv estment
Grade
(May 2013-
Sep.2016)
-60
-40
-20
0
20
40
60
2012 2013 2014 2015 2016 2017 2018
Net FX Position* (billion USD)
Net On Balance Off Balance
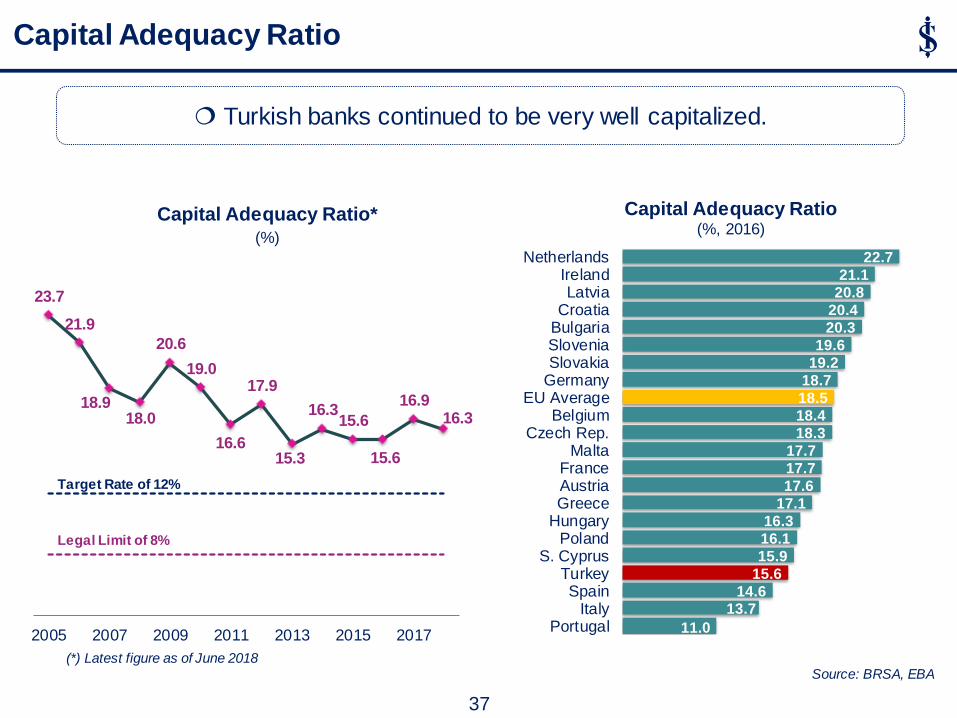
Turkish banks continued to be very well capitalized.
Capital Adequacy Ratio
11.0
13.7 14.6
15.6
15.9
16.1
16.3
17.1
17.6
17.7
17.7
18.3
18.4
18.5
18.7
19.2
19.6
20.3
20.4
20.8
21.1
22.7
PortugalItaly
SpainTurkey
S. CyprusPoland
HungaryGreeceAustriaFrance
MaltaCzech Rep.
BelgiumEU Average
GermanySlovakiaSloveniaBulgariaCroatiaLatvia
IrelandNetherlands
Capital Adequacy Ratio (%, 2016)
37
23.7
21.9
18.9 18.0
20.6
19.0
16.6
17.9
15.3
16.3 15.6
15.6
16.9 16.3
2005 2007 2009 2011 2013 2015 2017
Capital Adequacy Ratio* (%)
Legal Limit of 8%
Target Rate of 12%
(*) Latest figure as of June 2018 Source: BRSA, EBA
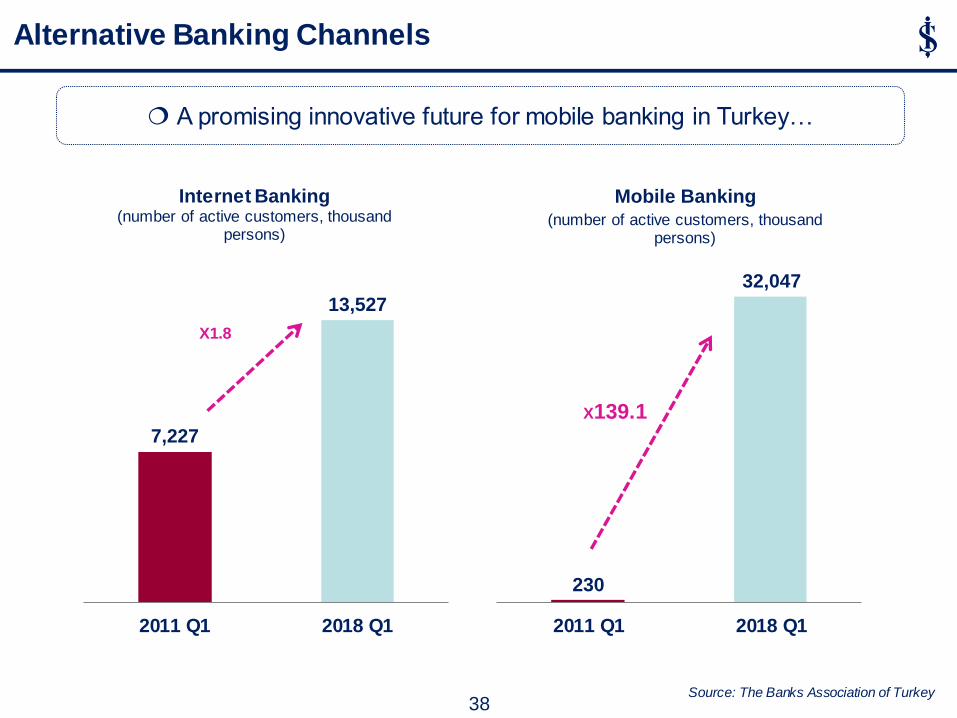
Alternative Banking Channels
Source: The Banks Association of Turkey
230
32,047
2011 Q1 2018 Q1
Mobile Banking (number of active customers, thousand
persons)
7,227
13,527
2011 Q1 2018 Q1
Internet Banking (number of active customers, thousand
persons)
X1.8
X139.1
38
A promising innovative future for mobile banking in Turkey…
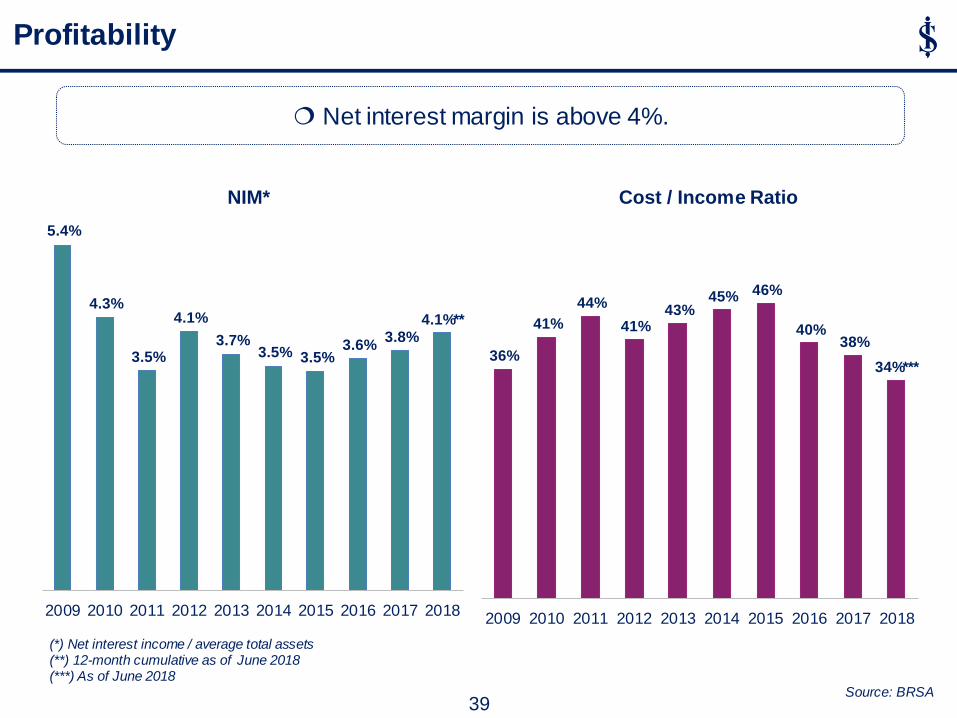
Profitability
Net interest margin is above 4%.
39
5.4%
4.3%
3.5%
4.1%
3.7% 3.5% 3.5%
3.6% 3.8%
4.1%**
2009 2010 2011 2012 2013 2014 2015 2016 2017 2018
NIM*
36%
41%
44%
41% 43%
45% 46%
40% 38%
34%***
2009 2010 2011 2012 2013 2014 2015 2016 2017 2018
Cost / Income Ratio
(*) Net interest income / average total assets (**) 12-month cumulative as of June 2018 (***) As of June 2018
Source: BRSA
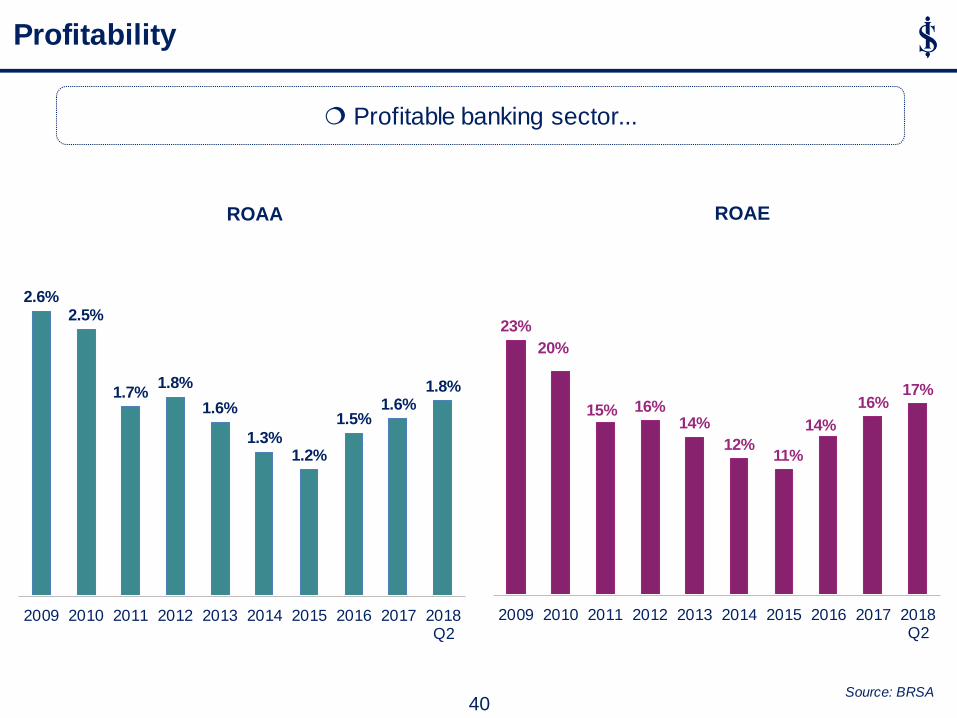
Profitable banking sector...
Profitability
2.6% 2.5%
1.7% 1.8%
1.6%
1.3% 1.2%
1.5% 1.6%
1.8%
2009 2010 2011 2012 2013 2014 2015 2016 2017 2018Q2
ROAA
23%
20%
15% 16% 14%
12% 11%
14%
16% 17%
2009 2010 2011 2012 2013 2014 2015 2016 2017 2018Q2
ROAE
40
Source: BRSA
Latest figure as of August 14, 2018 Source: Datastream
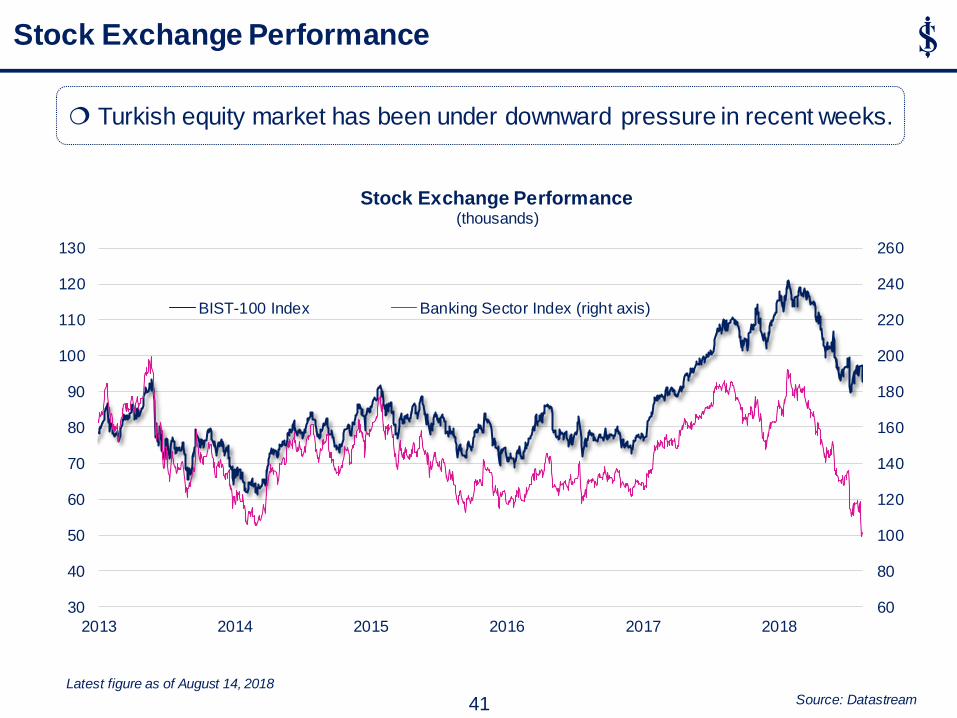
Stock Exchange Performance
41
60
80
100
120
140
160
180
200
220
240
260
30
40
50
60
70
80
90
100
110
120
130
2013 2014 2015 2016 2017 2018
Bin
ler
Stock Exchange Performance (thousands)
BIST-100 Index Banking Sector Index (right axis)
Turkish equity market has been under downward pressure in recent weeks.
Source: BRSA, Turkstat, ECB, Eurostat
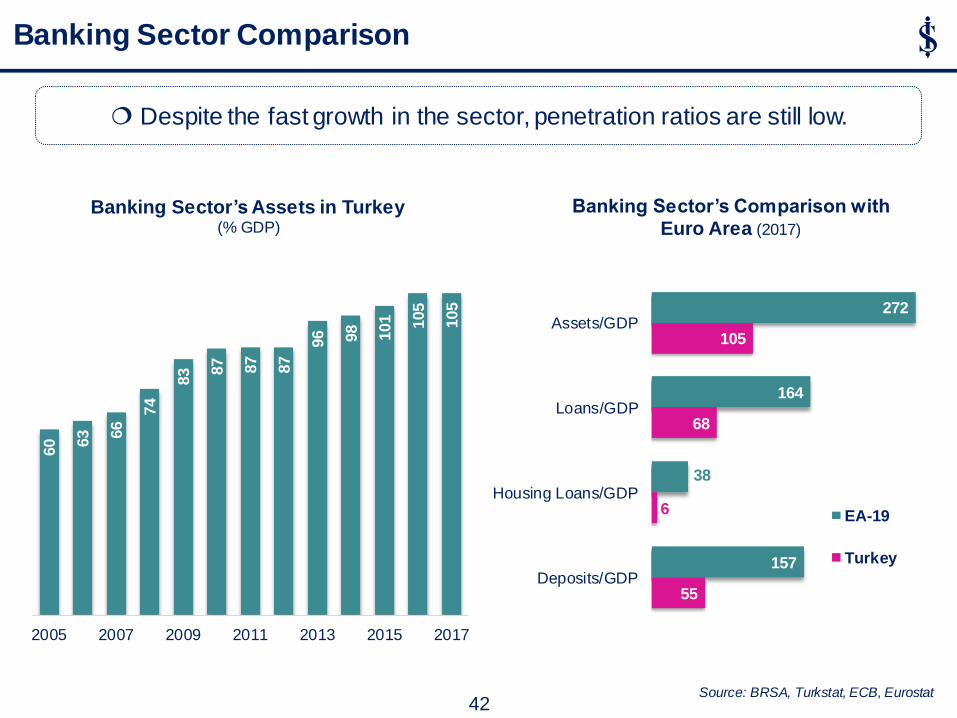
272
164
38
157
105
68
6
55
Assets/GDP
Loans/GDP
Housing Loans/GDP
Deposits/GDP
Banking Sector’s Comparison with Euro Area (2017)
(%, 2015)
EA-19
Turkey
Despite the fast growth in the sector, penetration ratios are still low.
60
63
66 7
4
83 87
87
87
96
98
101
105
105
2005 2007 2009 2011 2013 2015 2017
Banking Sector’s Assets in Turkey (% GDP)
Banking Sector Comparison
42
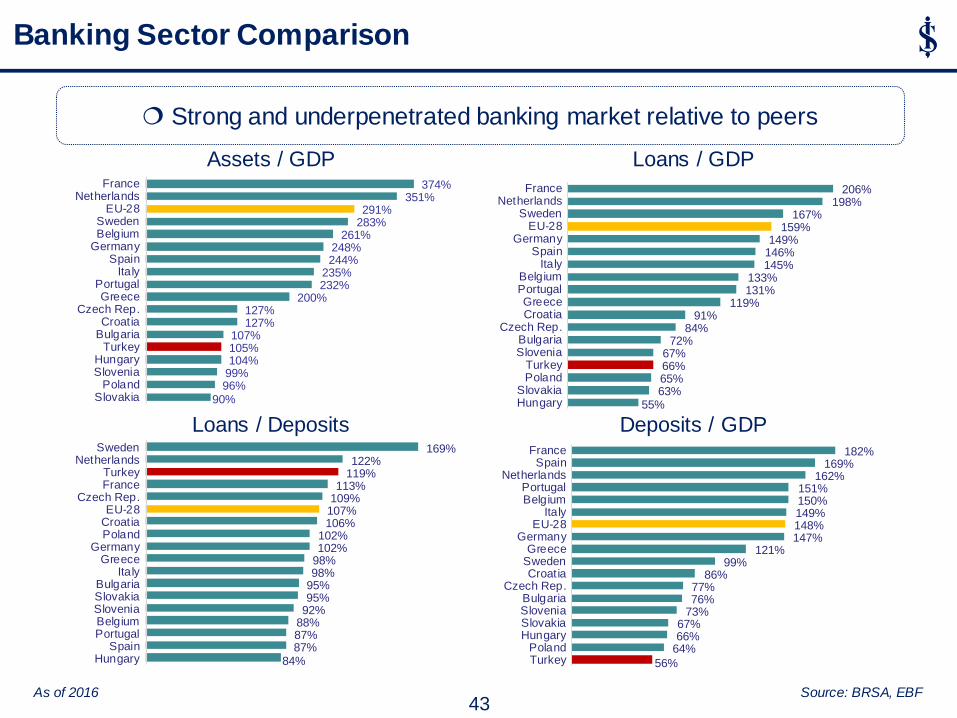
Banking Sector Comparison
Assets / GDP Loans / GDP
Deposits / GDP Loans / Deposits
90% 96% 99% 104% 105% 107%
127% 127%
200% 232% 235%
244% 248%
261% 283% 291%
351% 374%
SlovakiaPoland
SloveniaHungary
TurkeyBulgariaCroatia
Czech Rep.Greece
PortugalItaly
SpainGermanyBelgiumSweden
EU-28Netherlands
France
55% 63% 65% 66% 67%
72% 84%
91% 119%
131% 133%
145% 146% 149%
159% 167%
198% 206%
HungarySlovakia
PolandTurkey
SloveniaBulgaria
Czech Rep.CroatiaGreece
PortugalBelgium
ItalySpain
GermanyEU-28
SwedenNetherlands
France
56%
64% 66% 67%
73% 76% 77%
86% 99%
121% 147% 148% 149% 150% 151%
162% 169%
182%
TurkeyPoland
HungarySlovakiaSloveniaBulgaria
Czech Rep.Croatia
SwedenGreece
GermanyEU-28
ItalyBelgiumPortugal
NetherlandsSpain
France
84% 87% 87% 88% 92% 95% 95% 98% 98% 102% 102%
106% 107% 109% 113%
119% 122%
169%
HungarySpain
PortugalBelgiumSloveniaSlovakiaBulgaria
ItalyGreece
GermanyPolandCroatiaEU-28
Czech Rep.FranceTurkey
NetherlandsSweden
As of 2016 Source: BRSA, EBF
Strong and underpenetrated banking market relative to peers
43

Future Prospects
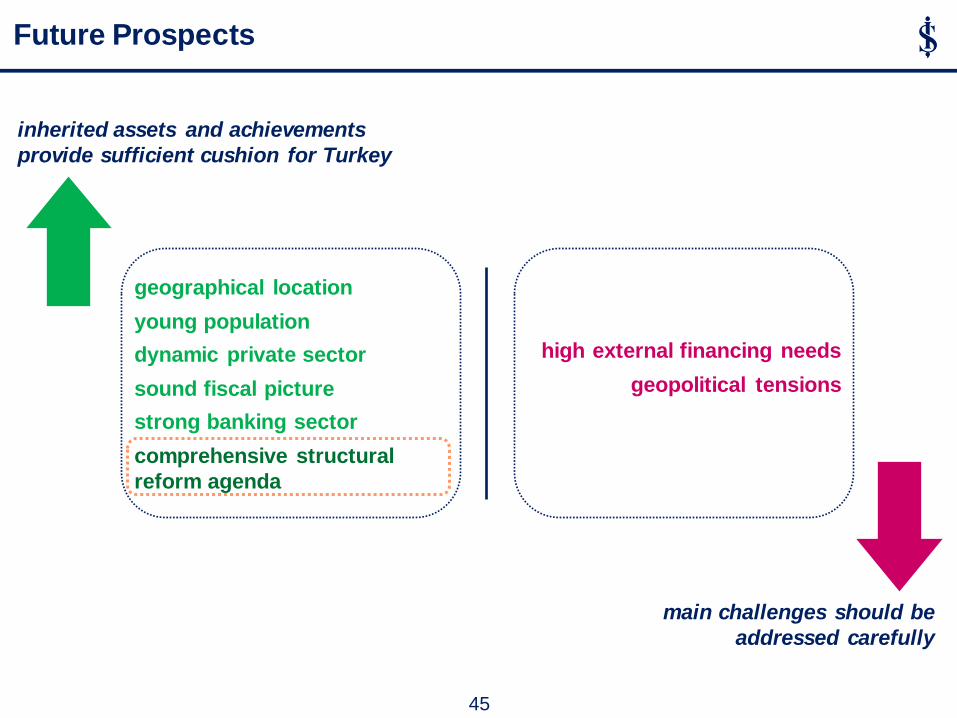
Future Prospects
inherited assets and achievements
provide sufficient cushion for Turkey
main challenges should be
addressed carefully
geographical location
young population
dynamic private sector
sound fiscal picture
strong banking sector
comprehensive structural
reform agenda
high external financing needs
geopolitical tensions
45
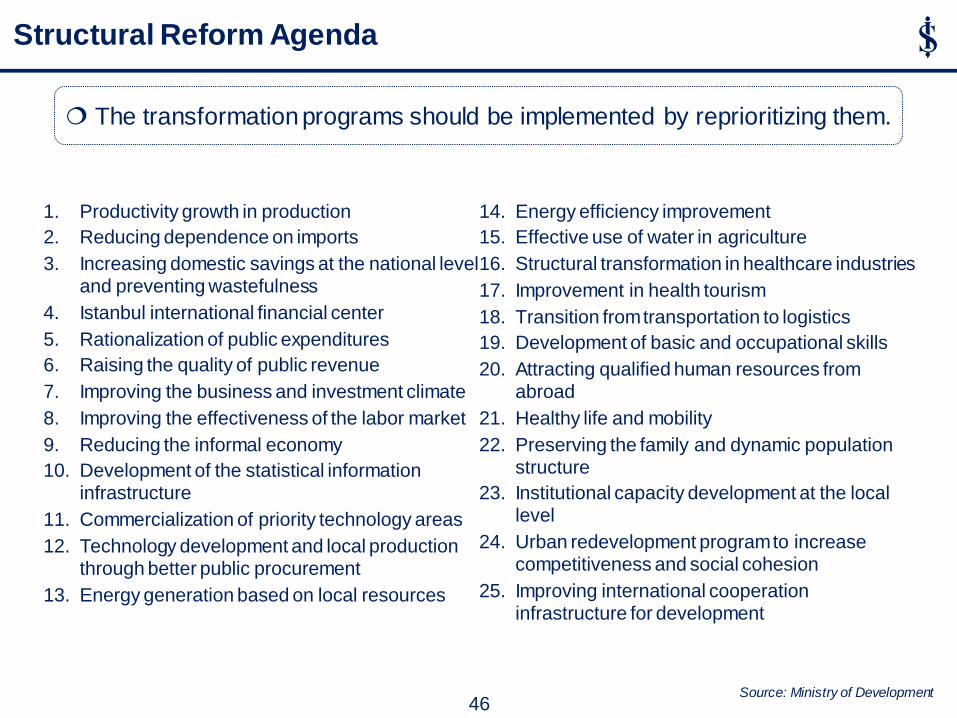
The transformation programs should be implemented by reprioritizing them.
Source: Ministry of Development
Structural Reform Agenda
1. Productivity growth in production
2. Reducing dependence on imports
3. Increasing domestic savings at the national level and preventing wastefulness
4. Istanbul international financial center
5. Rationalization of public expenditures
6. Raising the quality of public revenue
7. Improving the business and investment climate
8. Improving the effectiveness of the labor market
9. Reducing the informal economy
10. Development of the statistical information infrastructure
11. Commercialization of priority technology areas
12. Technology development and local production through better public procurement
13. Energy generation based on local resources
14. Energy efficiency improvement
15. Effective use of water in agriculture
16. Structural transformation in healthcare industries
17. Improvement in health tourism
18. Transition from transportation to logistics
19. Development of basic and occupational skills
20. Attracting qualified human resources from abroad
21. Healthy life and mobility
22. Preserving the family and dynamic population structure
23. Institutional capacity development at the local level
24. Urban redevelopment program to increase competitiveness and social cohesion
25. Improving international cooperation infrastructure for development
46
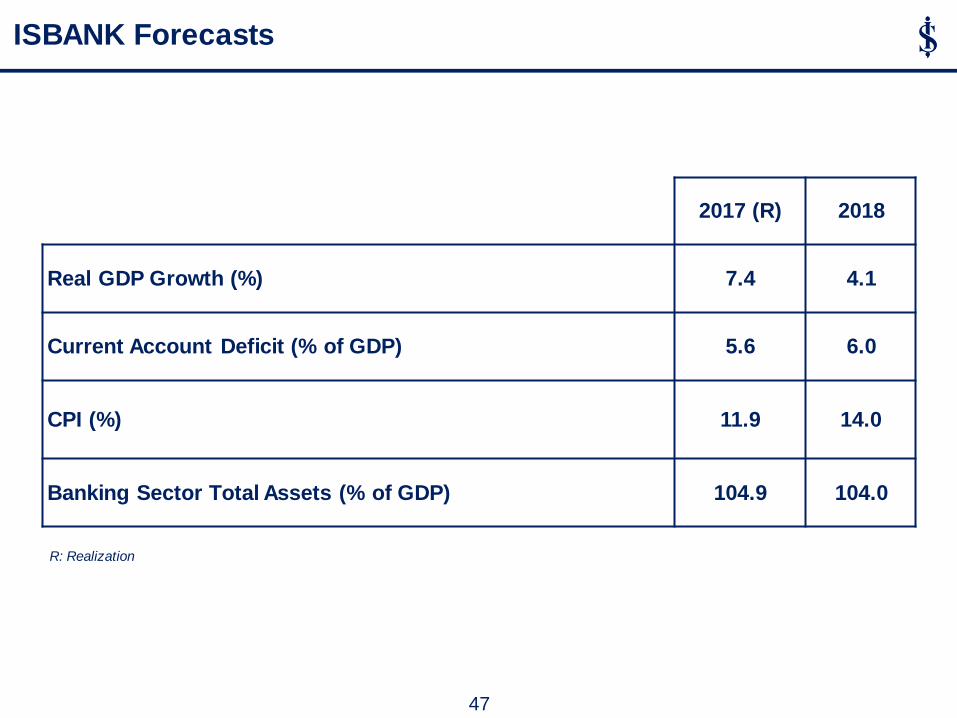
2017 (R) 2018
Real GDP Growth (%) 7.4 4.1
Current Account Deficit (% of GDP) 5.6 6.0
CPI (%) 11.9 14.0
Banking Sector Total Assets (% of GDP) 104.9 104.0
ISBANK Forecasts
R: Realization
47
LEGAL NOTICE
This report has been prepared by Türkiye İş Bankası A.Ş. economists and analysts by using the information from publicly available sources
believed to be reliable, solely for information purposes; and they are not intended to be construed as an offer or solicitation for the purchase
or sale of any financial instrument or the provision of an offer to provide investment services. The views, opinions and analyses expressed
do not represent the official standing of Türkiye İş Bankası A.Ş. and are personal views and opinions of the analysts and economists who
prepare the report. No representation or warranty, express or implied, is made as to the accuracy or completeness of the information
contained in this report. All information contained in this report is subject to change without notice, Türkiye İş Bankası A,Ş, accepts no
liability whatsoever for any direct or consequential loss arising from any use of this report or its contents.
This report is copyright-protected. Reproducing, publishing and/or distributing this report in whole or in part is therefore prohibited. All rights
reserved.
Our reports are available on our website https://research.isbank.com.tr