Embed Size (px)
Citation preview

COUNTRY PROFILE 2001
TurkeyThis Country Profile is a reference tool, which providesanalysis of historical political, infrastructural and economictrends. It is revised and updated annually. The EIU’squarterly Country Reports analyse current trends andprovide a two-year forecast
The full publishing schedule for Country Profiles is nowavailable on our website at http://www.eiu.com/schedule
The Economist Intelligence Unit15 Regent St, London SW1Y 4LRUnited Kingdom

The Economist Intelligence UnitThe Economist Intelligence Unit is a specialist publisher serving companies establishing and managingoperations across national borders. For over 50 years it has been a source of information on businessdevelopments, economic and political trends, government regulations and corporate practice worldwide.
The EIU delivers its information in four ways: through our digital portfolio, where our latest analysis isupdated daily; through printed subscription products ranging from newsletters to annual referenceworks; through research reports; and by organising seminars and presentations. The firm is a member ofThe Economist Group.
LondonThe Economist Intelligence Unit15 Regent StLondonSW1Y 4LRUnited KingdomTel: (44.20) 7830 1007Fax: (44.20) 7830 1023E-mail: [email protected]
New YorkThe Economist Intelligence UnitThe Economist Building111 West 57th StreetNew YorkNY 10019, USTel: (1.212) 554 0600Fax: (1.212) 586 0248E-mail: [email protected]
Hong KongThe Economist Intelligence Unit25/F, Dah Sing Financial Centre108 Gloucester RoadWanchaiHong KongTel: (852) 2585 3888Fax: (852) 2802 7638E-mail: [email protected]
Website: www.eiu.com
Electronic deliveryThis publication can be viewed by subscribing online at http://store.eiu.com
Reports are also available in various other electronic formats, such as CD-ROM, Lotus Notes, on-linedatabases and as direct feeds to corporate intranets. For further information, please contact your nearestEconomist Intelligence Unit office
London: Jan Frost Tel: (44.20) 7830 1183 Fax: (44.20) 7830 1023New York: Dante Cantu Tel: (1.212) 554 0643 Fax: (1.212) 586 1181Hong Kong: Amy Ha Tel: (852) 2802 7288/2585 3888 Fax: (852) 2802 7720/7638
Copyright© 2001 The Economist Intelligence Unit Limited. All rights reserved. Neither this publication norany part of it may be reproduced, stored in a retrieval system, or transmitted in any form or by anymeans, electronic, mechanical, photocopying, recording or otherwise, without the prior permissionof The Economist Intelligence Unit Limited.
All information in this report is verified to the best of the author’s and the publisher’s ability. However,the EIU does not accept responsibility for any loss arising from reliance on it.
ISSN 0269-6029
Symbols for tables“n/a” means not available; “–” means not applicable
Printed and distributed by Redhouse Press Ltd, Unit 151, Dartford Trade Park, Dartford, Kent DA1 1QB, UK


EIU Country Profile 2001 © The Economist Intelligence Unit Limited 2001
Comparative economic indicators, 2000

1
© The Economist Intelligence Unit Limited 2001 EIU Country Profile 2001
Contents
3 Basic data
4 Political background4 Historical background
10 Constitution and institutions15 International relations and defence
18 Resources and infrastructure18 Population20 Education21 Health21 Natural resources and the environment22 Transport and communications24 Energy
27 The economy27 Economic structure28 Economic policy33 Economic performance35 Regional trends
36 Economic sectors36 Agriculture38 Mining and semi-processing39 Manufacturing42 Construction43 Financial services47 Tourism
47 The external sector47 Trade in goods50 Invisibles and the current account51 Capital flows and foreign debt53 Foreign reserves and the exchange rate
55 Appendices55 Sources of information57 Reference tables57 Population57 Labour force57 Transport statistics58 National energy statistics59 Consolidated government finances59 Money supply and interest rates60 Gross domestic product60 Gross domestic product by expenditure61 Gross domestic product by expenditure61 Gross value added by sector62 Gross value added by sector62 Prices and earnings62 Agricultural production

2 Turkey
EIU Country Profile 2001 © The Economist Intelligence Unit Limited 2001
63 Livestock numbers63 Minerals production63 Manufacturing production64 Construction statistics64 The stockmarket64 Exports64 Imports65 Main trading partners65 Direction and composition of trade, 199866 Balance of payments, Central Bank of Turkey series67 Balance of payments, IMF series68 External debt68 Foreign reserves68 Exchange rates

Turkey 3
© The Economist Intelligence Unit Limited 2001 EIU Country Profile 2001
Turkey
Basic data
779,452 sq km, of which 35% arable, 4% permanent crops, 26% forestry
63.5m (State Planning Organisation estimate of annual average in 2000)
Population, city (city and province in brackets), in ‘000, 1997 (State Institute ofStatistics)
Istanbul 8,567 (9,199)Ankara (capital) 3,085 (3,693)Izmir 2,118 (3,115)Adana 1,185 (1,682)Bursa 1,160 (1,958)
Mediterranean on the south coast, continental inland
Hottest month, August, 15-31°C (average daily minimum and maximum);coldest month, January, –4-4°C; driest month, August, 10 mm average rainfall;wettest month, December, 48 mm average rainfall
Turkish
Metric system
Turkish lira. Annual average exchange rate in 2000: TL625,218:US$1; exchangerate on May 30th 2001: TL1,163,851:US$1
2 hours ahead of GMT; 3 hours in summer
Calendar year
January 1st, April 23rd, May 19th, three days for Ramadan and four days forKurban depending on the Muslim calendar, August 30th, October 28th (half-day), October 29th
Land area
Population
Main towns
Climate
Weather in Ankara(altitude 861 metres)
Language
Measures
Currency
Time
Fiscal year
Public holidays

4 Turkey
EIU Country Profile 2001 © The Economist Intelligence Unit Limited 2001
Political background
The current government, which emerged from the April 1999 general election,is headed by Bulent Ecevit and comprises Mr Ecevit’s centre-left DemocraticLeft Party (DSP), the ultra-nationalist Nationalist Action Party (MHP) led byDevlet Bahceli, and Mesut Yilmaz’s Motherland Party (Anap). It has lastedlonger than any of its predecessors since 1995, but domestic and internationalconfidence in its ability to address Turkey’s urgent political and economicproblems received a severe shock after the eruption of a serious financial crisisin February-March 2001.
Historical background
Modern Turkish politics have been shaped by two crucial historicalexperiences: the foundation by Mustafa Kemal (who assumed the surnameAtaturk in 1936) of a secular, unitary republic in the 1920s, and theestablishment of a multiparty democratic regime since 1945. This has beeninterrupted by three periods of military rule in 1960-61, 1971-73 and 1980-83.
The Republic of Turkey was established in 1923 on the ruins of the Ottomanempire, which reached its zenith in the 16th century before suffering a longperiod of decline. Its fate was finally sealed when it joined the German side inthe first world war (1914-18). After the war, the victorious Entente powersdetached the remaining Arab provinces and prepared an elaborate plan todivide Anatolia, the Turkish-inhabited heartland of the former empire. In 1919Greek forces occupied Izmir (Smyrna) and fanned out into western Anatolia.The occupation triggered off a nationalist resistance movement, led by Ataturk,which decisively defeated the Greeks in 1922. In November of that year thesultanate was officially abolished. Following the signature of the Treaty ofLausanne in July 1923, Turkey became a republic, with Ataturk as its presidentand Ankara its capital.
Until his death in 1938 Ataturk presided over a single-party state. He brokewith the country’s Islamic past and promoted a secular national identity. Anetatist programme of state-led industrialisation was also instituted. Hissuccessor as president, Ismet Inonu, managed to maintain Turkey’s neutralityduring the second world war (1939-45). In 1945 he ended the single-party era,allowing the Democrat Party (DP), led by Adnan Menderes, to come to powerin Turkey’s first genuinely free election in 1950. Meanwhile, direct territorialthreats from the Soviet Union had pushed Turkey into the Western camp inthe cold war, and it was admitted to NATO in 1952.
Against a backdrop of growing economic difficulties, the military ousted theDP government on May 27th 1960, ostensibly because of its increasingintolerance towards the opposition. The army held power until October 1961,when a general election was held following the trial and execution ofMenderes and two of his former cabinet members. A period of weak coalitiongovernments followed until 1965, when the Justice Party (AP), led by
The establishment ofthe republic
The 1960s and 1970s

Turkey 5
© The Economist Intelligence Unit Limited 2001 EIU Country Profile 2001
Suleyman Demirel and viewed as the successor to the DP, won the generalelection. Steady economic growth maintained the popularity of the AP, whichretained power in the 1969 election.
Nonetheless, increased left- and right-wing terrorism led to a second putsch bythe military in March 1971 and the installation of a technocratic governmentuntil 1973. In democratic elections in 1973 and 1977 none of the partiessucceeded in winning an overall majority. Thus, between 1974 and 1980Turkey was ruled by five feeble coalitions, headed alternately by the AP and thecentre-left Republican People’s Party (CHP), now headed by Bulent Ecevit. Bythe end of the 1970s the government and the economy seemed to be headingfor total collapse, with political violence claiming about 5,000 lives. A thirdmilitary takeover in September 1980 was greeted with general relief.
The leader of the 1980 coup, General Kenan Evren, established a five-manjunta which stayed in power until November 1983. During this period themilitary regime restored law and order through the draconian curtailment ofcivil rights. Economic reforms directed by the then deputy prime minister,Turgut Ozal, reduced inflation and the trade deficit, and economic growth wasrestored. In November 1982 a more restrictive constitution, intended toprovide stable government, was accepted in a national referendum, andGeneral Evren was elected president for the next seven years. Only three partieswere allowed to contest the September 1983 general election, in whichMr Ozal’s new Motherland Party (Anap) won a majority.
Under Ozal, who stayed in office as prime minister until 1989, parties excludedfrom the 1983 election emerged as important players. They included mostnotably the Social Democrat Party, led by Erdal Inonu, which merged with thePopulist Party in 1985 to become the Social Democrat Populist Party (SHP), andthe True Path Party (DYP), set up by Mr Demirel. Mr Ecevit, who had beenimprisoned for a time by the military after the 1980 coup, formed theDemocratic Left Party (DSP), while the Islamist tendency was represented bythe Welfare Party (Refah) led by Necmettin Erbakan. Following constitutionalamendments all these parties were allowed to compete in the 1987 election,but Ozal was returned to power with an increased majority.
When General Evren retired as president in November 1989, he was succeededby Ozal who, as president, won approval in the west for his support of Kuwaitfollowing the Iraqi invasion in August 1990, but failed to turn this to domesticpolitical advantage. His successor as prime minister, Yildirim Akbulut, wasreplaced by Mesut Yilmaz in June 1991. The latter opted for an early generalelection in October 1991, but Anap lost its majority. Mr Demirel thus returnedto office at the head of a coalition between the DYP and the SHP, withMr Inonu as deputy prime minister.
The Demirel government lasted until April 1993, when Ozal died suddenly.Mr Demirel was elected president the following month. His successor as partyleader and prime minister was Tansu Ciller. In March 1995 the SHP mergedwith the CHP under the latter’s name. On September 20th the CHP leader,Deniz Baykal, decided to withdraw the CHP from the coalition, following
The military regime,1980-83
Turgut Ozal’s leadership,1983-89
Mrs Ciller becomes primeminister in 1993
6 Turkey
EIU Country Profile 2001 © The Economist Intelligence Unit Limited 2001
Mrs Ciller’s refusal to meet his demands on the terms for the coalition. Sheresigned the same day, paving the way for a general election in December1995. Although serious financial and balance-of-payments crises in the firstquarter of 1994 marred Mrs Ciller’s record in office, one of her majorachievements was an agreement with the EU on the terms of a customs union,which came into force on January 1st 1996.
By this time the Kurdish issue had become Turkey’s major internal politicalproblem. About 15-20% of the population are Kurds, of whom about half livein their traditional homeland in the south-east, the other half havingmigrated to the industrial cities of western Turkey. The war in the south-eastern provinces against militants of the Kurdistan Workers’ Party (PKK)claimed around 30,000 lives between 1984 and 2000. By 1999 the army hadre-established control over most of the south-east. However, the counter-insurgency campaign led to serious human rights abuses by governmentforces, the compulsory evacuation of thousands of villages, severe disruptionof the region’s economy, and a cost to the government of an estimatedUS$6bn per year.
The results of the general election of December 24th 1995 confirmed the risingpopularity of Welfare (Refah), which received the largest share of the vote(21.4%). Welfare’s victory was made possible mainly by the even split of thecentre-right vote between the DYP and Anap, which together received 38.9%of the vote, and the rivalry between the two centre-left parties (DSP and CHP),which together won 25.3%. All other parties, notably the Nationalist ActionParty (MHP) and the pro-Kurdish People’s Democracy Party (Hadep), failed toovercome the 10% vote threshold to qualify for parliamentary seats.
After the election the two secular centre-right parties, Anap and DYP, formed acoalition at the end of February 1996, which lasted only until mid-June. Putinto place principally to keep Welfare from power, the coalition fell apart whenthe Anap leader, Mr Yilmaz, agreed to parliamentary investigations into allegedmalpractice by Mrs Ciller when she was prime minister. To avert corruptioninvestigations, Mrs Ciller then agreed to form a coalition with Welfare. TheWelfare-DYP coalition government, headed by Mr Erbakan, took office on June25th, bringing to power an Islamist-led government for the first time inTurkey’s history.
Mrs Ciller’s party controlled the most important ministerial portfolios, butMr Erbakan set the tone of the new administration. From the start the coalitionwas wracked by dissent between its two constituents, on both economic andforeign policy issues. It was further weakened by the revelation of damaginglinks between parts of the government and the police service with organisedcrime. Meanwhile, Mr Erbakan’s moves towards creeping Islamisation(especially in education) aroused the anger of the staunchly secularist generals,as well as much of an emerging civil society of intellectuals, businessorganisations, trades unions, and women’s groups. On June 18th 1997, in theface of repeated warnings from the military-dominated National SecurityCouncil as well as mounting public protests Mr Erbakan resigned, hoping toreconstruct the government under Mrs Ciller’s premiership. However,
The 1995 electionconfirms the rise of the
Welfare Party
An Islamist-led governmentlasts just 11 months

Turkey 7
© The Economist Intelligence Unit Limited 2001 EIU Country Profile 2001
backbench defections from the DYP to a short-lived Democratic Turkey Party(DTP) robbed the coalition of its majority. Accordingly, President Demirelpassed on the baton to Mr Yilmaz (Anap), who on June 30th 1997 formed aminority government, in coalition with DSP and the DTP, with outside supportfrom the CHP.
Mr Yilmaz’s third government—and Turkey’s fifth since the 1991 election—washampered by its minority status, which exaggerated the power of the CHP. Itcollapsed in November 1988, when Mr Yilmaz and the state minister for theeconomy, Gunes Taner, became embroiled in a corruption scandal related tothe privatisation of Turk Bank, and the CHP withdrew its support. In January1999 Mr Ecevit replaced Mr Yilmaz as the head of a minority DSP caretakergovernment, supported externally by Anap and DYP, with a mandate to takethe country to local and parliamentary elections on April 18th 1999.
The April 1999 legislative election produced an unlikely coalition government,led by Mr Ecevit and comprising his DSP, the ultra-nationalist MHP led byDevlet Bahceli, and Mr Yilmaz’s Anap. The election outcome was influenced toa considerable extent by the capture of the leader of the PKK, Abdullah Ocalan,on February 16th. The resultant upsurge in nationalist sentiment contributedto the growth in support for Mr Ecevit’s staunchly nationalist party, which wasenhanced by Mr Ecevit’s general reputation for honesty and by publicdisaffection with the mainstream centre-right parties, Anap and the DYP, andthe pro-Islamic Virtue Party. The strong nationalist sentiment also aided therise of the MHP. Accordingly, the DSP topped the poll. The MHP, which hadbeen excluded from parliament after the 1995 election because it did notsurmount the 10% vote threshold for representation, finished a close second.Anap, DYP and the Virtue Party (Fazilet, the successor to Welfare, banned inFebruary 1998), which were the other three parties to win representation inparliament, performed poorly, while the CHP was excluded because it failed toreach the 10% threshold.
Election results
Oct 1991 Dec 1995 Apr 1999 Seats % of votes Seats % of votes Seats % of votes
Democratic Left Party (DSP) 7 10.4 76 14.6 136 22.2
Nationalist Action Partya (MHP) 0 0.0 0 8.2 129 18.0
Virtue Partyb (Fazilet) 0 0 0 0 111 15.4
Welfare Partyb (Refah) 62 16.4 158 21.4 0 0
Motherland Party (Anap) 115 23.3 132 19.7 86 13.2
True Path Party (DYP) 178 26.2 135 19.2 85 12.0
Republican People’s Partyc (CHP) 88 20.1 49 10.7 0 8.7
People’s Democracy Party (Hadep) 0 0.0 0 4.2 0 4.8
Independents/others 0 3.6 0 2.1 3 5.7
Total 450 100.0 550 100.0 550 100.0
a In 1991 the Nationalist Action Party, then known as the Nationalist Endeavour Party (MCP), temporarily merged with the Islamist Welfare Party(Refah) in the general election. It then re-established itself as the MHP. b Formed in 1998 following the banning of Welfare. c In 1991 this was theSocial Democrat Populist Party (SHP), which merged with the Republican People’s Party under the latter’s title in February 1995.
Source: EIU.
Mr Yilmaz succeedsMr Erbakan asprime minister
The 1999 electionproduces a three-party
ruling coalition

8 Turkey
EIU Country Profile 2001 © The Economist Intelligence Unit Limited 2001
Important recent events
December 1995: The general election result is indecisive, but the pro-Islamist WelfareParty (Refah) receives 21.4% of the vote, becoming the largest party in parliament.
January 1996: The customs union with the EU comes into effect, but a clash withGreece over territorial rights in the Aegean sours Turkish-EU relations.
July 1996-June 1997: Welfare-True Path Party (DYP) form a government led by theWelfare leader, Necmettin Erbakan. Mr Erbakan resigns and his government collapsesfollowing a period of intense pressure from the military and public protests.
July 1997: A new three-party minority coalition government is formed, led by Anap’sMesut Yilmaz and including the Democratic Left Party (DSP) and the Democratic TurkeyParty (DTP). The external support of the Republican People’s Party (CHP) allows thegovernment to win a vote of confidence.
December 1997: At the European Council meeting in Luxembourg, the EU decidesnot to include Turkey as a candidate for EU membership in the next round ofenlargement.
November 1998: Mr Yilmaz resigns as prime minister following unproven allegationsof corruption.
January 1999: Bulent Ecevit, the leader of DSP, forms a one-party minority pre-electiongovernment with the external support of the Motherland Party (Anap) and the DYP.
April 1999: Boosted by the capture of Abdullah Ocalan. the leader of the KurdistanWorkers’ Party (PKK) in February, the DSP tops the poll with 22.2% of the vote in thegeneral election, followed unexpectedly by the Nationalist Action Party (MHP) with18%.
June 1999: The DSP, MHP and Anap form a government with a clear majority of 321out of 550 seats in parliament, and Mr Ecevit as prime minister.
August-November 1999: Two major earthquakes strike the areas around Izmit andBolu causing over 18,000 deaths, injuries to about 50,000 people and massivedestruction. The first provoked overseas sympathy and a dramatic improvement inrelations with Greece and the EU.
December 1999: The European Council meeting in Helsinki places Turkey on the list ofcandidates for eventual EU membership.
May 2000: Parliament elects Ahmet Necdet Sezer president after months of rulingcoalition wranglings which threatened to destabilise the government.
February-May 2001: A public quarrel between Mr Ecevit and President Sezer triggersa financial crash. The government appoints Kemal Dervis, a respected economist fromthe World Bank, to formulate a new programme of economic reforms. Although it isapproved by the government, the ruling coalition’s support is far from convincing. TheIMF and the World Bank pledge additional financial support.

Turkey 9
© The Economist Intelligence Unit Limited 2001 EIU Country Profile 2001
Following its installation, Mr Ecevit’s government chalked up some notableachievements, mainly in the economic and foreign policy fields—most notablyby reforming the social security system, thereby helping to pave the way forapproval by the IMF of a three-year stand-by credit in December 1999. Adisastrous earthquake on August 17th 1999, which badly damaged the city ofIzmit, one of Turkey’s main industrial centres, provoked harsh criticisms of thegovernment for its slow and complacent reaction, but also brought about adramatic improvement in the climate of relations with Greece and westernEurope, as these countries, among many others, responded swiftly andgenerously with emergency assistance.
This led up to a crucial turning-point in Turkey’s relations with the EU. At themeeting of the European Council in December 1999 the EU heads ofgovernment reversed the decision made in Luxembourg two years earlier, bydeclaring Turkey a candidate for EU accession. But besides laying downimportant conditions regarding Turkey’s relations with Greece and settlementof the Cyprus problem (see below), the EU also made it clear that accessionnegotiations could not begin until Turkey met the political conditionsstipulated by the Council in June 1993—the so-called Copenhagen criteria. InNovember 2000 the EU Commission issued an Accession PartnershipDocument for Turkey which added some detail to these conditions. But whilethe government’s response—contained in the National Programme for theAdoption of the Acquis published in March 2001—on paper met most of the EU’srequirements, it did so in rather vague terms and failed to give precisecommitments regarding the abolition of capital punishment, the reform of theNational Security Council (which gives the military a powerful role ingovernment) or the legalisation of Kurdish-language broadcasting oreducation.
In April 2000 Mr Ecevit suffered a serious setback when parliament, includingmembers of the ruling coalition, turned down his proposed amendments tothe constitution which would, among other things, have allowed theincumbent president, Mr Demirel, to be elected for a second five-year termwhen his existing term expired on May 15th. Subsequently, faced with thepossibility of an early general election, the coalition party leaders agreed to putforward as their candidate the chief justice of the Constitutional Court, AhmetNecdet Sezer, who was elected on the third ballot by a simple majority onMay 5th. Before long, however, it became clear that relations between the newpresident and the government would not be easy, as Mr Sezer refused to signgovernment decrees which would, among other things, have allowed it todismiss supposedly politically suspect civil servants, and pressed for thoroughinvestigations of corruption allegations, notably in the banking sector.
On February 19th, just three months after narrowly avoiding financial collapse,a row between Mr Ecevit and the president triggered a collapse of internationaland domestic confidence. This forced the government to abandon thecrawling-peg exchange-rate regime, which was followed by a sharp devaluationof the Turkish lira and the suspension of its disinflation strategy which hadenjoyed the backing of the IMF since the end of 1999. On March 2nd the
The government introducessome reforms
Turkey becomes an EUaccession candidate
Tensions between Mr Ecevitand Mr Sezer trigger a
financial crisis

10 Turkey
EIU Country Profile 2001 © The Economist Intelligence Unit Limited 2001
government appointed Kemal Dervis, a respected economist at the WorldBank, as the new economy minister. He drew up a programme of financial andeconomic reforms which obtained substantial financial support from the IMFon May 15th, despite the fact that the government coalition’s commitment tothe programme was far from convincing. In the wake of the crisis publicsupport for the government evaporated, but Mr Ecevit resisted calls for hisresignation and vowed to stay in government.
Constitution and institutions
Turkey is a unitary republic, in which power is exercised by a unicameralparliament (Meclis) and the prime minister. The prime minister is designatedby the president and is customarily the leader of the biggest party. The Mecliselects the president, who can serve only one seven-year term. He can delay, butnot veto, legislation. The president is supposed to be a neutral figurehead andis obliged to resign from a political party before assuming office. In practice, hecan have substantial influence behind the scenes, particularly in periods ofgovernmental crisis. The constitution can be altered only by a two-thirdsmajority in the Meclis, with a subsequent referendum if this is ordered by thepresident, or a three-fifths majority plus a compulsory referendum.
Parliament currently has 550 members with a parliamentary term of five years,although early elections can be held if the Meclis votes to this effect. Theelectoral system is based on multi-seat constituencies, with the exclusion ofparties failing to overcome a threshold of 10% of the national vote. The 10%threshold does not apply to independent candidates. The system favours thelarger parties over the smaller ones, particularly if there is a large difference inthe share of the vote won by the first- and second-placed parties. Elections arenormally fairly conducted, but groups considered to endanger the unitarynature of the state (in effect, Kurdish nationalist parties) have been banned.Despite continuing official efforts to shut it down, the pro-Kurdish People’sDemocracy Party (Hadep) contested the 1995 and 1999 elections but failed toovercome the 10% threshold on both occasions, although it captured themayoralties in a number of important cities in the south-east in 1999.
According to the constitution, parties should not exploit religion for politicalpurposes, although they often flout this prohibition. In February 1998,however, Welfare was closed down by the Constitutional Court for violatingthis principle, and its successor, Virtue, is threatened with the same fate. Inprinciple, Turkey accepts the European Convention on Human Rights andother international human rights instruments, but in practice the right to freespeech can be severely restricted. The regular torture of suspects by the police isanother serious abuse, although it has been curtailed somewhat in recent years.In November 2000 the EU specified a wide-ranging series of reforms of thehuman rights regime—particularly as it affects freedom of expression, theending of torture and of capital punishment, and the Kurdish question—whichTurkey was required to enact as a precondition for the start of accessionnegotiations. In principle, the government is committed to reforms, although
Parliament

Turkey 11
© The Economist Intelligence Unit Limited 2001 EIU Country Profile 2001
opposition from the MHP, the second largest party in the coalition, as well asparts of the military and police, will make these hard to apply (see above).
The administrative system is highly centralised. The country is divided into 73provinces, each under a governor appointed by the central administration, anddistricts within these. Since the 1980s elected municipalities have been givenmore powers and resources, but these are still fairly limited. A specialemergency regime, under a regional governor, is applied in four Kurdish-inhabited provinces in the south-east. This gives the police and army specialand much criticised powers, which must be renewed by parliament at four-month intervals.
The independence of the judiciary is respected in Turkey, and rulings by theConstitutional Court can overturn acts of parliament, with the exception oflegislation passed during the last period of military rule (1980-83). Followingseveral rulings by the European Court of Human Rights, the assembly voted inJune 1999, in the midst of the trial of the PKK leader Abdullah Ocalan, tocivilianise the quasi-military state security courts in which liberal, pro-Kurdishand Islamist dissidents are tried. Further reforms to increase the efficiency andeffectiveness of the judicial system are also being called for by the EU.
Among the important ministries, the foreign ministry has traditionally enjoyeda respected and non-partisan position, but the economic ministries and theministries of the interior and education have frequently been weakened bypartisan appointments and interference, with widespread corruption of parts ofthe civil service frequently reported. The defence ministry has little real controlover the armed forces. These are effectively controlled by the chief of thegeneral staff, who theoretically reports to the prime minister but in practiceenjoys wide autonomy.
Political forces
The main political parties and movements may be divided into five blocs.
• The centre right: the Motherland Party (Anap) under Mesut Yilmaz, and the TruePath Party (DYP) led by Tansu Ciller.
• The centre left: Bulent Ecevit’s Democratic Left Party (DSP) and the RepublicanPeople’s Party (CHP), led by Deniz Baykal.
• Islamic conservatives: Virtue (Fazilet), under Recai Kutan.
• The ultra-nationalist right (with Islamic sympathies): the Nationalist Action Party(MHP) led by Devlet Bahceli.
• Pro-Kurdish political groupings: People’s Democracy Party (Hadep), led byMurat Bozlak.
The administrative system
The judiciary
The ministries

12 Turkey
EIU Country Profile 2001 © The Economist Intelligence Unit Limited 2001
The centre right has traditionally attracted most support, but it is currentlyweakened by its division into two rival parties, Anap and the DYP. There islittle ideological difference between the two, which maintain their separateexistence mainly as a legacy of the personal rivalry between Suleyman Demireland Turgut Ozal. The latter’s death in 1993 should have removed this factor,but the current Anap leader, Mesut Yilmaz, and Tansu Ciller have been unableto co-operate. Despite poor performances by Anap and the DYP in the 1999elections and calls for their resignations, Mr Yilmaz and Mrs Ciller remained incharge of their respective parties.
Until the 1999 general election there were two main centre-left parties inparliament, the DSP and the CHP. The DSP, which is mainly a personal vehiclefor the charismatic Bulent Ecevit, became the largest party after the April 1999election. Mr Ecevit is a staunch nationalist who is probably best knowninternationally for ordering the invasion of the northern part of Cyprus in1974. He became caretaker prime minister in January 1999 and head of thecoalition government comprising the DSP, MHP and Anap formed in June ofthat year. Traditionally opposed to free-market reforms, the DSP has adopted afar more moderate stance on economic policy since 1997, but its publicsupport was badly eroded by the financial crash of February 2001. Meanwhile,the CHP failed to reach the 10% threshold for representation in parliament inthe April 1999 general election. Shortly afterwards the party leader, DenizBaykal, was forced to resign, to be succeeded by Altan Oymen. However,Mr Baykal succeeded in re-installing himself as leader in October 2000,provoking several resignations from the party’s senior ranks. Although the CHPis currently out of parliament, it may make a comeback as centre-left voterslose sympathy for the DSP.
After the February 1998 closure of Welfare and Necmettin Erbakan’s banningfrom politics for five years, the Islamists regrouped to form the Virtue Party(Fazilet). However, in the 1999 general election the party’s share of the votedropped to 15.4%, compared with Welfare’s 21.4% in 1995. At the partyconvention held in May 2000 a challenge Recai Mr Kutan’s leadership ofFazilet was mounted by the “modernist” faction within the party, led byAbdullah Gul and Tayyip Erdogan. Mr Kutan won the ballot by a fairly narrowmargin, but the modernists may renew their challenge in the near future,especially if the party is officially closed own by the Constitutional Court (as iscurrently threatened) and a successor party or parties are established. Althoughthe Islamists were a failure in national government, Virtue remains strong inmunicipal government in several cities, notably in Istanbul and Ankara, whereits relatively efficient and uncorrupted administration is appreciated.
The ultra-nationalist right is represented by the Nationalist Action Party(MHP), which under the leadership of Devlet Bahceli became the secondlargest party with 18% of the vote in the April 1999 general election. After alow-profile election campaign the MHP appears to have shifted towards thecentre in its successful bid to join the Ecevit government in May 1999,disavowing its previous rabidly anti-leftist stance. The MHP can be expected to
The centre right
The centre left
The Islamic conservatives
The ultra-nationalist right

Turkey 13
© The Economist Intelligence Unit Limited 2001 EIU Country Profile 2001
oppose reforms of human rights where these affect the Kurds, but hassupported the DSP and Anap on a wide-range of economic reforms.
Kurdish nationalism was previously represented in parliament by theDemocracy Party, originally a splinter group of the Social Democrat PopulistParty (SHP). This was closed down by court order in 1994 and was succeededby the People’s Democracy Party (Hadep). Hadep failed to overcome the 10%threshold in the 1995 and 1999 elections, but won an important role inmunicipal government in the south-east in 1999. Although the partydenounces the use of force, many of its grass-roots supporters are probablysympathetic to the illegal Kurdistan Workers’ Party (PKK). This is the mostmilitant of the Kurdish political groupings and waged a campaign of violenceand terrorism against the government between 1984 and 2000. It suffered amajor setback in February 1999, when its leader, Abdullah Ocalan, wascaptured in Nairobi, Kenya, by Turkish security agents. Recognising realities,the PKK has abandoned its previously Marxist discourse and claims that it hasended its armed campaign. However, its demand that it should now beaccepted as a legitimate negotiator for a peaceful settlement of the Kurdishproblem is unlikely to be accepted.
Among non-party actors, the army has played a crucial role in the recent past,staging three coups since 1960, the last time in 1980. It was instrumental inthe removal of the Welfare-led government in June 1997 and considers itselfthe guardian of the secular republic. The army wields power mainly throughthe half-military, half-civilian National Security Council (NSC), which issupposed to advise the government on security questions, but in practiceexercises considerable influence on a wider range of issues. The EU has calledfor a reduction of the NSC’s constitutional powers and an increase in thenumber of civilian members. Senior military commanders will probably resistthis, but since they officially support Turkey’s bid for eventual accession to theEU, they may be forced to make some concessions, at least on paper.
Main political figures
Bulent Ecevit: Leader of the Democratic Left Party (DSP) founded in 1983, hebecame prime minister for the fifth time in June 1999 at the head of a DSP-MHP-Anap coalition government. Respected for his honesty, Mr Ecevit is astaunch nationalist advocating a hard-line stance on issues such as Cyprus andthe Kurds, but his popularity has been badly dented by the financial crisiswhich erupted in February 2001. Moreover, he is now 76 years of age and inpoor health, so he may not be able to hold on to the party leadership andpremiership for much longer. If he is forced to leave the stage, then his partywill be seriously weakened, as it is very much his personal creation.
Devlet Bahceli: Leader of the Nationalist Action Party (MHP), he is deputyprime minister in the Ecevit government formed in June 1999. Mr Bahcelibecame leader of the MHP in 1997 following the death of the party’s fieryfounder, Alparslan Turkes, and gives the impression of an able but distinctlyuncharismatic figure. As far as national identity and the Kurdish question are
Kurdish politicalmovements
The army

14 Turkey
EIU Country Profile 2001 © The Economist Intelligence Unit Limited 2001
concerned, his party adopts an uncompromising line, maintaining that there is“no Kurdish problem”—merely one of PKK terrorism.
Kemal Dervis: A vice-president of the World Bank for the Middle East andNorth Africa, Mr Dervis was appointed minister of the economy with wide-ranging powers in early March 2001. His presence in the cabinet should help torestore the credibility of the government’s economic policy after the collapse ofthe IMF-backed programme and the resignation of top bureaucrats, includingthe Central Bank governor, who played a leading role in relations with the IMFand the World Bank. But there is a risk that he may become isolated, aselements within the ruling coalition are not happy that their parties have lostresponsibility for key areas of economic management.
Mesut Yilmaz: Chairman of the Motherland Party (Anap) and a former primeminister, Mr Yilmaz served for many years in the reform cabinets of the lateTurgut Ozal but has little of the charisma, acumen or reformist zeal of hismentor. He replaced Necmettin Erbakan as prime minister in July 1997 but wasforced to resign in November 1998 amid unproven allegations of corruption.Despite his party’s poor performance in the April 1999 election, Mr Yilmazremains leader of Anap, a junior partner in the Ecevit government formed inJune 1999, and a deputy prime minister. His rivalry with and personalanimosity towards Tansu Ciller, the leader of the True Path Party (DYP), is seenas the main obstacle to a merger of the parties of the centre right.
Tansu Ciller: A former prime minister, she has managed to survive as leaderof the True Path Party (DYP) despite her party’ s poor performance in the April1999 election. She is now widely perceived to have been a disastrous economicand political manager, and her bad judgment and poor choice of lieutenantshelped to precipitate the economic crisis of 1994. Frequent but so far unprovenallegations of corruption have further dented her political image.
Ahmet Necdet Sezer: Mr Sezer was unexpectedly elected president in May2000. At the time of his election he was the chief justice of the ConstitutionalCourt, making him the first president of Turkey to have been neither aprominent politician nor a former senior military commander. He is 60 yearsold, widely respected and known as a liberal. He has acquired an unexpectedlyimportant political role through his challenges to high-handed actions by thegovernment and its failure to follow up serious charges of corruption. His mainweakness is that he does not have any direct experience of party politics orpersonal influence within the parliament, unlike both Suleyman Demirel andTurgut Ozal. Opinion polls suggest that he has far more public support thanany of the present government leaders, which has greatly enhanced hisinfluence in the political sphere.
Necmettin Erbakan: As the most prominent leader of the Islamist right,Mr Erbakan’s fate seems to be to form parties which get closed down by themilitary or the courts. He was a junior partner in three coalition governmentsduring the 1970s, but his previous National Salvation Party was closed downby the then military regime in 1981. Mr Erbakan then formed the WelfareParty (Refah), which emerged as the biggest party in the 1995 election,propelling him into the premiership in June 1996. Faced with the possibility of

Turkey 15
© The Economist Intelligence Unit Limited 2001 EIU Country Profile 2001
military intervention and rising public protests, he resigned in June 1997.While in power, the party showed a weak grasp of international politics and aninability to run a modern economy. Following the February 1998 decision bythe Constitutional Court to ban him from politics for five years and closedown Welfare, Mr Erbakan has managed to retain an impressive amount ofcontrol over Welfare’s successor, Virtue (Fazilet).
The press and numerous private television and radio stations can have animportant effect on public opinion. However, increasing monopolisation hasdampened press independence, and two media groups now control around70% of circulation. Parts of the media have also been hit by financial frauds,notably affecting the Sabah newspaper group, which also owns ATV television:Sabah’s owner, Dinc Bilgin, was arrested in April 2001. Pressure groups are alsoof growing importance. The main business organisations are the TurkishIndustrialists’ and Businessmen’s Association (TUSIAD) and the Union ofChambers of Commerce (TTOBB). The industrial workforce is fairly heavilyunionised, particularly in the state sector. There are two main trade unionconfederations: the Turkish Trade Union Confederation (Turk-Is), whichofficially adopts a centrist, non-partisan position, and the Reformist TradeUnion Confederation (DISK), on the political left. Other promotional pressuregroups have acquired an enhanced political role; these include the Fethullahcisand other religious brotherhoods, and groups modelled on movements inwestern countries, such as those promoting secularist values, women’s rightsand environmental protection.
International relations and defence
Turkey’s relations with many of its neighbours have been radically changed bythe end of the cold war and the Gulf crisis of 1990-91. Long-running disputeswith Greece and the Greek Cypriots have not been resolved, although sincemid-1999 Greece and Turkey have been moving towards agreement onbilateral issues. Talks between the Greek and Turkish Cypriot leaders wererestarted in 1999-2000 but stalled at the beginning of 2001. Since thedissolution of the Soviet Union Turkey has developed political, economic andcultural links with the Turkic countries of Azerbaijan, Kazakhstan, Uzbekistan,the Kyrgyz Republic and Turkmenistan. However, Turkey’s main political,economic and military ties are still with western Europe and the US.
Relations with Bulgaria, Georgia and the other Black Sea countries are generallyexcellent, and Turkey has taken the lead in forming a Black Sea Economic Co-operation (BSEC) region, which includes all the above as well as Greece,Albania, Azerbaijan, Russia and Armenia. Strong economic, trade and energylinks with Russia have tended to counterbalance underlying historic tensionsover competition for influence in the former Soviet republics and rivalrybetween the two countries over projected export oil pipelines from the Caspianbasin. In the absence of a resolution to the Azeri-Armenian conflict overNagorny Karabakh after the May 1994 ceasefire, Turkey has not normalisedrelations with Armenia and the Turco-Armenian land border remains closed.
The media and pressuregroups
Relations with Russia andother Black Sea neighbours

16 Turkey
EIU Country Profile 2001 © The Economist Intelligence Unit Limited 2001
However, Turkey would probably seek to establish normal relations withArmenia if peace talks between the Armenian and Azeri presidents producedpositive results.
For many years relations with Syria were tense because of Syrian support forthe PKK and disputes over the Euphrates waters, following the construction ofthe Ataturk dam in Turkey. By expelling the PKK leader from Syria in October1998 the then Syrian president, Hafiz al-Assad, removed a major bone ofcontention between Ankara and Damascus. Although the Euphrates disputeremains unsettled, relations with Syria, mainly in the economic field, havemoved forward since the installation of Bashar al-Assad as president of Syria inJune 2000. The expanded relationship between Turkey and Israel hasexacerbated tensions with the Arab world, following the signature of a Turkish-Israeli military training and co-operation agreement, although this falls wellshort of a full military alliance between the two countries. However, Turkeybenefits from access to Israel’s advanced military technology and the supportof the pro-Israeli lobby in the US Congress. With the exception of a briefflirtation during the Islamist-led Erbakan government, Turkey tends to becautious in its relations with Iran, since it is suspicious of actual or potentialattempts by Iran to export Islamic radicalism.
Relations with Iraq are currently affected by partial UN sanctions against Iraq,but the Turkish government would like these to be lifted entirely and as soonas possible, since they have caused serious commercial loss to Turkey. Turkeystrongly opposes the formal establishment of an independent Kurdish state innorthern Iraq, but has established fairly close links with the two local Kurdishfactions, the Kurdistan Democratic Party (KDP) and the Patriotic Union ofKurdistan (PUK) in an effort to interdict PKK bases in the region.
The main point of tension in Turkey’s relations with its immediate neighboursis still the conflict with Greece over Cyprus and the Aegean. After years ofbitterness, relations between the two countries began to improve in 1999. Theatmosphere was significantly improved also by the generous Greek response tothe Turkish earthquake disaster, and Greece’s agreement to accept Turkey as acandidate for eventual EU membership at the European Council meeting inDecember of that year. The two governments have signed agreements on non-contentious issues, such as economic and cultural co-operation andenvironmental protection. Motivated by financial constraints in bothcountries, they have also begun to curb defence spending.
In the Aegean Sea, Turkey is opposed to the potential declaration by Greece ofa 12-mile limit for territorial waters, and disputes the Greek claim to offshoremineral rights over almost the whole of the Aegean. However, when acceptingEU candidacy in December 1999, Turkey also agreed to the possibility ofarbitration by the International Court at The Hague if bilateral discussions failto produce a positive result by 2004.
In parallel to the détente between the two mainland governments, the GreekCypriot president of the Republic of Cyprus, Glafcos Clerides, restarted“proximity talks” with Rauf Denktash, the leader of the breakaway Turkish
Syria, Israel, Iran and Iraq
Greece and Cyprus

Turkey 17
© The Economist Intelligence Unit Limited 2001 EIU Country Profile 2001
Republic of Northern Cyprus, under UN auspices in December 1999. However,the two sides’ positions had moved no closer when Mr Denktash decided towithdraw from the talks at the beginning of 2001. Although both seemedprepared to accept a federal constitution in principle, Mr Denktash and Turkeyhave been pressing for a settlement based on a confederation of two states,with weaker powers for the central government. Mr Denktash insists that thesovereign equality of his self-declared Turkish Republic of Northern Cyprusmust be recognised if the talks are to resume.
Turkey has been a committed member of NATO for 50 years. It initiallyopposed the EU’s plans to establish a new European security structure outsideNATO but with access to NATO capability and assets, fearing that under theproposed structure it would have no say in how NATO assets and capabilitieswould be used, particularly in cases of vital security interest or geographicproximity, unless or until it acquired EU membership. Relations with the UShave generally been good, since the US values Turkey’s role as a strategicpartner. The administration of George W Bush continues to supportTurkey’s strategic role in the middle east, the Balkans and Transcaucasia.
In the Balkans, Turkey has shunned unilateral action but joined UN and NATOpeacekeeping missions. In the war over Kosovo in March-June 1999 Turkeygave its full support to NATO operations, providing jet fighters based at NATObases in Italy and offering the use of air bases in Turkey. It has also given strongsupport to the Macedonian government against attacks by Albanian militants.
Turkey has had an association agreement with the EU since December 1st 1964and entered into a customs union with the EU on January 1st 1996. However,in December 1997 at the Luxembourg meeting of the European Council the EUexcluded Turkey from the list of candidates for enlargement, despite the factthat its application to become a full member dated from April 14th 1987. As aresult, the Turkish government froze its relations with the EU until 1999. Therelationship then improved, following the installation of the Ecevitgovernment in Turkey and that of the Social Democrat-Green coalition underGerhard Schröder in Germany in 1998. This paved the way for Turkey’sinclusion as a candidate for EU membership at the Helsinki meeting of theEuropean Council in December 1999. But the EU has made clear that Turkeyhas a great deal to do in the areas of democratisation and human rights andprotection of minorities before accession negotiations can even begin (seeHistorical background).
The military is trying to move towards domestic production to avoid the threatof an arms embargo, such as that imposed by the US after the invasion ofCyprus which lasted until 1978. In 1998 Turkey announced a ten-year,US$31bn defence modernisation programme which was expected to includemain battle tanks, attack helicopters and assault rifles. A portion of the heavyweapons, such as the helicopters and tanks, will be produced or assembled inthe country under licence. Turkey already assembles its own advancedweapons, notably the F-16 aircraft, under an agreement with GeneralDynamics of the US. However, the financial crisis of February-March 2001 is
Western Europe and the US
Armed forces

18 Turkey
EIU Country Profile 2001 © The Economist Intelligence Unit Limited 2001
expected to lead to delays or cancellations in the planned purchases ofhelicopters, tanks and some warships.
Armed forces, 2000
Active 609,700 Army 495,000 Navy 54,600 Air force 60,100
Reserves 378,700
Paramilitary (gendarmerie/national guard) 218,200
Total armed forces 1,206,600
Forces in Cyprus 36,000
Source: International Institute for Strategic Studies, The Military Balance, 2000/01.
Resources and infrastructure
Population
The State Planning Organisation (DPT) estimates that the average populationin 2000 was 65.3bn, the third largest in Europe after Russia and Germany. Thepopulation growth rate is estimated to have fallen to below 1.5% a year—highby European standards but low by the norms of the Middle East. Thedeceleration in the birth rate since the 1950s is related to an improvement inthe educational level of women, migration to urban areas and the wider use ofmodern birth-control practices. The DPT estimates the birth rate for 1998 at2.1% and the fertility rate at 2.35%. The declining birth rate has been partlyoffset by a declining mortality rate (about 0.65%). As of 2000, infant mortalityis estimated to have dropped to about 3.5%, while life expectancy is put at67 years for men and 71.6 for women. A census was held in 2000, but theresults have not yet been finalised.
Population, sex and age distribution, 1998 estimates(‘000)
Age group Total Males Females
0-19 26,149 13,359 12,790
20-39 21,290 10,859 10,426
40-64 12,780 6,362 6,416
65+ 3,232 1,474 1,759
Total 63,451 32,055 31,396
Source: UN, Demographic Yearbook.
Turkey’s population is still young, with 67.6% below the age of 35 in 1998,according to UN figures. This compares with 49% in France (based on 1993data) and 48% in Portugal (based on 1997 data). According to researchpublished by the Businessmen’s Association, TUSIAD, the number ofhouseholds—currently around 15m—is likely to reach 18.5m in 2010. There
Population growth hasbegun to slow
Cities are expandingthrough migration from
rural areas

Turkey 19
© The Economist Intelligence Unit Limited 2001 EIU Country Profile 2001
has been a high level of migration from rural areas to major cities andincreasingly other regional centres. In the largest cities, the inhabitants of theshanty towns account for half or more of the population. (However, some ofthe shanty town areas are rapidly being transformed into regular multi-storeyhousing areas benefiting from all urban services.) The 1997 census estimatesthat the urban population (comprising provincial and district centres)accounted for 65% of the total, compared with 59% in 1990 and 27% in 1960.The 1990s was the first decade in which the rural population of the republicdeclined in absolute terms.
One-quarter of the population is concentrated in the Marmara region in thenorth-west, including Istanbul. According to the census results, this is also thearea of most rapid population growth (28% between 1990 and 1997). Anotherquarter lives along or close to the western and southern coasts. The Black Searegion accounts for about one-eighth of the population, but it is the onlyregion where the population is declining. Inland areas east of the capital,Ankara, are sparsely populated. However, the south-east accounts for about10% of the total population, and population growth is strong.
There are large discrepancies in income distribution between regions, betweenurban and rural parts of the same region, and within the individual urbanareas. According to a survey by AC Nielsen Zet, carried out in 2000, some 9mTurks, or approximately 15% of the population, may be classified as “A” or “B”group consumers with a monthly expenditure of more than US$2,750. Ofthese, more than 2.8m fall into the “A” group with a spend of more thanUS$5,200 per month. The bulk of the population, almost 42m, fall into the“C” and “D” classes, which include semi-skilled and unskilled manual workers.An estimated 11m are classified in the poorest “E” group, with a monthlyspend of just US$266 per month.
The size of the workforce varies according to seasonal trends, particularly inagriculture. In 2000 the workforce averaged 22m. Unemployment averaged6.6%. Work for wages and salaries accounts for about half of all employment,with about a quarter of these jobs provided by the public sector. 30% of theworking population are employers or self-employed—a broad definition whichincludes, for example, street-hawkers, shopkeepers, taxi drivers andindependent professionals, farmers and owner-managers in industry andservices. The remaining 20% are unpaid family workers on farms and in otherfamily-sized enterprises. (See Reference table 2 for historical employment data.)By sector, services account for about 40% of employment, agriculture for about35% and industry including construction for 25%. Women make up just underhalf of the population but only about one-quarter of the workforce.Approximately 60% of working women are employed in agriculture.
Over 99% of the population is at least nominally Muslim. The Greek,Armenian and Jewish communities have steadily declined. Among theMuslims, the unorthodox Alevi minority is estimated at anywhere betweenone-tenth and one-quarter of the total. Massacres of Alevis have occurred, mostrecently in Kahramanmaras in 1978 and in Sivas in 1993. Kurds form themajority of the population in the south-east and parts of the east, where
The service sector hasbecome the largest
employer
The population is almostentirely Muslim

20 Turkey
EIU Country Profile 2001 © The Economist Intelligence Unit Limited 2001
Kurdish is commonly spoken and many villagers still cannot speak Turkish.People of wholly or partly Kurdish origin also make up a substantial minorityof the population of many major cities, where they are often indistinguishablefrom other people. Kurds also live in neighbouring regions of Iran, Iraq andSyria. Arabic-speakers, who live mainly along the southern frontier with Syria,account for 1.5-2% of the total population. There are believed to be severalhundred thousand illegal immigrants living in Istanbul and other Turkishcities, mainly from Romania and other poor former communist countries.
Education
The minimum period of schooling was raised from five to eight years in 1997,and there is a single curriculum for the 6-14 age group. All those successfullycompleting their primary education are entitled to go on to attend three yearsat secondary school. Most secondary schools have broad curriculums aimed atpreparing students for university. But there is also a range of specialist schools,including the religious Imam Hatip secondary schools which can only takepupils from the age of 14, rather than 11. This has reversed the rapidexpansion of the Imam Hatip schools, which are seen by the authorities astraining ground for religious radicals.
Entry to university for secondary-school graduates is by national examination.The Open University has had some success in catering for the large number ofsecondary-school graduates unable to obtain full-time university places. Thissituation has also encouraged the establishment of a large number of privateuniversities in the last couple of years. All levels of education, from the stilllimited pre-school level upwards, are available in both public and privatesectors. Public-sector education dominates and is in principle free with theexception of partial university fees. A World Bank study (Turkey: EconomicReforms, Living Standards and Social Welfare Study 2000) put consolidated budgetspending on education at 3.1% in 1998, well below the 4.8% average formiddle- and lower-middle-income countries, and comparable to the 3.3%average for low-income countries. Many of the most prestigious universitiesand secondary schools, public and private, use a foreign language, usuallyEnglish, as the medium of education.
Today’s young people are much better educated than the older population,most of whom completed five years of primary education at best. Literacy isover 80%, compared with 30% in 1950, and the gap between the genders hasbeen closing. In 1998/99 the enrolment rate was estimated by the StatePlanning Organisation at 92.8% for primary education, 57.7% for secondaryand 25.7% for tertiary education (including the Open University). There aresome 14m students in primary, secondary and tertiary education, and abouthalf a million teachers. The quality of education is uneven. It suffers from anemphasis on rote-learning and centralised multiple-choice examinations,outdated curriculums, a lack of practical facilities, a failure to encourageinitiative and free debate, poorly trained and poorly rewarded teachers, andlarge class sizes. In rural areas schools can be severely under-equipped, and insome cases they barely function.
Eight-year educationis compulsory
The public sector has thedominant role
The quality ofeducation varies

Turkey 21
© The Economist Intelligence Unit Limited 2001 EIU Country Profile 2001
Health
Healthcare standards in Turkey are well below those of the developedcountries. Public expenditure on healthcare is under 3% of GDP, comparedwith 5-8% for developed countries. Total expenditure on healthcare isestimated at 3.5–4% of GDP. There is about one doctor for every 875 people,and one hospital bed for every 400. Apart from the overall shortage ofresources, the fact that about 35% of the population still lives in small andoften isolated rural settlements increases the difficulties of adequate provision.There is far more health provision in the western than in the eastern provincesof the country.
Access to health services is mainly via three social security organisations, whichalso provide pensions. 80-90% of the population have now been included inthe system, but resources are stretched. There are plans to separate health andpension provision as part of ongoing social security reform.
Just as the inadequacies of the state education system have encouraged themiddle classes to turn to private-sector education providers, so the bureaucracyand overcrowding associated with the public health system have encouragedthe growth of private health services. Private specialists are commonlyconsulted, particularly in the big cities, and many new private clinics andhospitals have opened in recent years. The development of private healthinsurance, however, has had teething problems.
Natural resources and the environment
At 779,452 sq km, the land area is about the same as that of France and the UKtogether. Approximately 275,000 sq km (35%) is agricultural land and much ofthe rest can be used as grazing. However, there is also a substantial area ofexposed highland, particularly in central and eastern Anatolia, much of whichis extremely cold in winter. Water resources are less plentiful than in westernEurope but much less scarce than in most of the Middle East. The Black Searegion is warm and wet. Other parts of the country enjoy considerablesunshine, with varying degrees of precipitation. This climatic variety allows awide range of crops to be grown.
Mineral resources include much lignite and some hard coal, iron ore, metalsand salts. Turkish boron minerals and chromium are significant forinternational trade. Only relatively small oil and natural gas reserves have beenfound and exploited, but several rivers have been or are being dammed forhydroelectricity generation as well as irrigation. Wind power also has potential.Long coastlines offer opportunities for shipping, fishing and, above all,tourism, which also benefits from warm summers, fine coastal scenery andhistorical remains (see Economic sectors).
The earthquake disasters of August and November 1999 served as a reminderthat large areas of Turkey are at risk from active fault lines. Both the 1999earthquakes occurred towards the western end of the country-wide NorthAnatolian fault. A major earthquake or series of quakes, centred further west
Health provision isunder-resourced
Land and climate favouragriculture and tourism
Earthquakes are frequent

22 Turkey
EIU Country Profile 2001 © The Economist Intelligence Unit Limited 2001
under the Sea of Marmara, is considered likely within the next 10-15 years,potentially causing more damage in Istanbul. The south-west and south-eastare also particularly prone to earthquakes.
Transport and communications
Long distances, mountainous terrain and lack of resources have hindered road-building projects. The length of the state and provincial road network isaround 60,000 km and has increased little since the early 1990s. However, roadsurfaces have been improved, and some roads have been widened. The Ankara-Istanbul toll road (motorway) has almost been completed. This forms part ofthe E-5 link between Europe and the Middle East. The total vehicle stock(excluding motorcycles) rose from around 1.2m in 1980 to 2.4m in 1990 and6.2m in 2000. Traffic deaths and urban congestion are both major problems.Projects awaiting financing include a road crossing of the Gulf of Izmit, cuttingjourney times between Istanbul and the Aegean region, and morecontroversially a bridge across the Dardanelles. (See Reference table 3 forhistorical transport data.)
Most railway lines are single-track and circuitous, and rail travel is slow. All areowned by the loss-making state railways (TCDD). Only a few suburban linesare commercially successful, while services to the east have been run at a loss.All in all, the railways account for only 5% of land transport. Attempts are inhand to streamline the TCDD and to build branch lines to industrial zones.There are already rail links to some ports and state enterprises producing basicgoods. There have long been plans for an Istanbul-Ankara high-speed train or,more realistically, an upgrading of the existing line to cut the journey time.Rail is making a comeback as a form of urban transport. Several municipalitieshave built “metro” systems, and the Marmaray project, a line running east-west through Istanbul including a tunnel under the Bosporus, is due to be putout to tender in 2001.
Air transport, both domestic and international, is dominated by the state-controlled Turkish Airlines (THY). Its young fleet of some 75 aircraft carriesabout 10.5m passengers a year to over 100 Turkish and internationaldestinations. A majority stake in THY is slated for privatisation in 2001. Thenew international terminal at Istanbul’s main Ataturk Airport was completedin early 2000. The main tourist airport at Antalya has also been expanded.These projects were carried out on a build-operate-transfer basis. Most airportsare owned and run by the state.
Sea transport is important for domestic and international trade and travel, asthree of Turkey’s main industrial conurbations (Istanbul-Izmit, Izmir andAdana) are located on the coast. The establishment of private ports and thetrend towards private management of state-owned ports have gone some waytowards mitigating overcrowding and inefficiency in recent years. There areseveral ports concentrated in and around Istanbul. Mersin and Izmir are themain ports on the Mediterranean and Aegean coasts respectively. Many
Roads are the main meansof land transport
The railways havebeen neglected
Istanbul has a newair terminal
The ports are improving

Turkey 23
© The Economist Intelligence Unit Limited 2001 EIU Country Profile 2001
commuters in Istanbul use the mainly state-owned steamers and ferries. Thetonnage of the Turkish merchant marine has been stable at just over 10m dwtsince 1996. However, the share of Turkish-flag vessels in the transport ofexports and imports has slipped to under 30%. Shipping is dominated by theprivate sector.
The telecommunications network improved and expanded rapidly in the1980s and early 1990s. Digitalisation is almost complete, but pressure on theinfrastructure has continued to rise, augmented by the introduction of mobilephone and Internet services. The state-controlled Turk Telekom has about18.5m fixed-line subscribers and owns the national infrastructure. TurkTelekom also has significant satellite, Internet and cable TV assets and has beengranted a mobile operator licence. Attempts to part-privatise Turk Telekomfailed in 2000 and early 2001. However, new legislation passed in mid-May2001 envisages the sale of 99% of the company (the state will retain a 1%“golden share”), but the stake to be sold to a strategic foreign investor cannotexceed 45% of total capital. The ceiling on foreign ownership, the state’sgolden share and waning demand for telecoms shares worldwide will make itdifficult to privatise Turk Telekom in 2001. The company’s monopoly on fixed-line services is due to end in 2003, but this date may be brought forward tospeed up the liberalisation of the sector.
A framework law for the future free market in telecommunications was passedby parliament in January 2000, and a semi-autonomous watchdog, theTelecommunications Agency, has been set up. So far, the main private-sectorinvolvement in telecommunications services in Turkey has been in mobiletelephony. The established operators, Turkcell (Cukurova group-Sonera) andTelsim (Uzan group), were joined in early 2001 by Is-Tim (Aria), jointly ownedby Turkiye Is Bankasi and Telecom Italia. Is-Tim bid an unexpectedly high priceof US$2.35bn for its licence in an April 2000 auction. Turk Telekom’s service(Aycell) is also expected to start up in 2001. There are about 15m mobilesubscribers. Third-generation licences have yet to be issued.
The Post Office (PTT) continues to dominate traditional mail and parcelservices. There are a large number of Internet service providers operating inconjunction with Turk Telekom. Most of the leading Internet service providersand portals are associated with established banking and/or media groups,notably Cukurova (Superonline), Dogan (E-kolay) and Dogus (Ixir). There werean estimated 1.5m-2m Internet subscribers at the end of 2000.
There are a plethora of newspapers, television and radio channels. The bestknown are owned by large media groups which aim at a wide audience. Thesmaller ones tend to have a clear local and/or cultural-ideological bias. Theleading newspapers are Hurriyet (Dogan) and Sabah (Bilgin group), selling about500,000 each, but there are numerous alternatives. Top TV channels includeKanal D and CNN Turk (Dogan), ATV (Bilgin), Star (Uzan), Show TV(Cukurova), NTV and CNBCE (Dogus) and TGRT (Ihlas). The state-owned TRT,which held a monopoly of broadcasting until the 1980s, continues to runseveral TV and radio channels. Broadcasting is supervised by an independent
The sale of Turk Telekomis still awaited
Mobile telephone servicesare booming
The Internet iscoming of age
Newspapers and TV are stillthe key media

24 Turkey
EIU Country Profile 2001 © The Economist Intelligence Unit Limited 2001
agency, RTUK, which is best known for ordering television channels to closedown for a day or more as punishment for showing offensive programmes.RTUK was due to settle chaotic frequency allocations in the first half of 2001.There are a handful of pay-TV services, including the new digital channels,Digiturk and Star-Digital, set up by the Cukurova and Uzan groups.
Energy
With very limited domestic production, Turkey is a major importer of oil and,increasingly, of natural gas. Both oil and gas are used by industry and forresidential heating, alongside coal, which is mainly produced locally. Ligniteaccounts for the vast majority of coal production. Reserves are put at 8.3bntonnes but may well be much higher. The state-owned TKI is the mainproducer. Hard coal is mainly found on the declining Zonguldak field on theBlack Sea coast. Reserves are put at 1.3bn, but production—controlled by thestate-owned TTK—has fallen to 2-2.5m tonnes/year. Hard coal is also imported.
The Baku-Ceyhan oil pipeline project
Turkey has ambitious plans for a 1,730-km pipeline to take 1m barrels a day of oil fromAzerbaijan to the Ceyhan export terminal on Turkey’s Mediterranean coast. A series ofagreements were signed in September and October 2000 involving the Azerbaijani,Georgian and Turkish governments and AIOC, the BP-led consortium set up to produceAzerbaijani oil. The hope is to begin construction work in 2002 and complete it in 2004,at a cost of at least US$2.4bn. But uncertainty prevails regarding throughputcommitments and financing. The discovery of gas, rather than oil, in Azerbaijan’s ShahDeniz field has also complicated the issue. On the one hand, it has raised the possibilityof an oil pipeline being built in parallel with the construction of an Azerbaijan-Turkey gaspipeline. But on the other hand it may mean that the Baku-Ceyhan project is short ofthe critical volume of oil needed to convince the oil companies of its feasibility.
Much hangs on whether producers in Kazakhstan can be persuaded to export some oftheir crude via this route with the help of a connecting pipeline. Ironically, oil from theTengiz field in Kazakhstan is now being exported to world markets via the Russian BlackSea port of Novorossisk using a separate line completed in March 2000. This givesRussia control of Caspian oil export routes and poses human and environmental risksresulting from the large number of oil tankers sailing through the Bosporus, both ofwhich supporters of the Baku-Ceyhan pipeline claim they want to avoid. Also, backed bythe US the Baku-Ceyhan pipeline would add to Turkey’s strategic importance andgenerate employment and transit fees. Basic engineering work is under way on the1,037-km stretch of the route crossing Turkish territory, and detailed engineering work isto start in mid-2001.
Since natural gas was first imported from Russia in the 1990s, Turkey hasturned rapidly to gas as a clean fuel for residential use and power generation.The Ministry of Energy and Natural Resources expects demand to rise fromabout 15bn cu metres in 2000 to 55bn cu metres in 2010. The current pipelinefrom Russia via Ukraine and Bulgaria is being upgraded, and a second pipelinefor Russian gas, known as the Blue Stream project, is to be built under the Black
Aside from coal, Turkeydepends on imports
Gas supplies hinge onpipeline projects

Turkey 25
© The Economist Intelligence Unit Limited 2001 EIU Country Profile 2001
Sea, with the first deliveries due in early 2002. Meanwhile, the necessarypipelines are largely in place for Iran to start supplying Turkey with gas in July2001. An inter-governmental agreement signed with Azerbaijan in March 2001envisages the construction of a pipeline to bring Azerbaijani gas to Turkey viaGeorgia, with a start-up date of 2004. US-backed plans for a sub-Caspian linereaching Turkey from Turkmenistan via Kazakhstan, Azerbaijan and Georgiaare currently stalled.
There are also projects to pipe gas from Iraq and Egypt and to increase lignite-receiving capacity. At the same time, Turkey is co-operating with Greece on theEU-sponsored INOGATE project, whereby the two countries may become atransit country for the transport of natural gas (and possibly oil) from theCaspian region to Europe. Domestically, gas is transported by the state company,BOTAS, which has a monopoly on imports. Households and small businesses insome cities are supplied by municipally owned companies. Legislation toliberalise the gas market in line with EU norms is on the agenda for 2001.
Energy balance, 2000(m tonnes oil equivalent)
Oil Gas Coal Electricitya Other Total
Primary supplyProduction 3.0 0.6 18.5 7.6 7.0 36.7Imports 29.5 11.9 5.5 0.8 0.8 47.7Exports –1.0 0.0 0.0 –0.1 0.0 –1.1Stock change 0.0 0.0 0.0 0.0 0.0 0.0Total 31.5 12.5 24.0 8.3 7.0 83.3
Processing & transformationInput to refining –22.0 0.0 0.0 0.0 0.0 –22.0Input to transformation –2.4 –6.9 –11.8 –8.3 -–0.1 –29.5Refining/transformation output 22.0 0.4 0.0 11.2 0.0 33.6Energy industry fuel/loss –2.1 –0.1 –0.4 –2.8 0.0 –5.4
Final consumptionTransport fuels 11.8 0.0 0.0 0.0 0.0 11.8Industrial fuels 4.4 2.1 9.6 4.3 0.0 20.4Residential etc 6.3 3.1 2.2 4.1 6.9 22.6Non-energy uses 4.5 0.7 0.0 0.0 0.0 5.2Total 27.0 5.7 11.8 8.4 6.9 60.0
a Primary electricity output and imports/exports of electricity are expressed as input equivalents, on an assumed generating efficiency of 38.5%.
Source: Energy Data Associates.
Electricity production has more than doubled in the last decade, reachingabout 125bn kwh in 2000. At the end of 1999 total installed electricity-generating capacity was 26bn kwh, of which thermal plants accounted for59.3%. These plants are mainly fuelled by lignite, although gas and oil are alsoused. The remainder of Turkey’s electricity comes from hydroelectric plants,principally the Ataturk and Karakaya dams on the Euphrates. However, waterlevels have run low in 1999-2000, and hydroelectric plants cannot be run atfull capacity. Small amounts of electricity have been imported in recent yearsfrom Bulgaria, Iran and Georgia. Decades-old plans for a nuclear plant atAkkuyu on the Mediterranean coast have been shelved. (See Reference table 4for historical energy data.)
Electricity supply isstruggling to keep up with
demand

26 Turkey
EIU Country Profile 2001 © The Economist Intelligence Unit Limited 2001
Electricity Market Act
The Electricity Market Act, approved by Parliament in February 2001, introduces radicalchanges in the way electricity is produced, traded and distributed to bring Turkey’slegislation into line with that already existing in the EU. The private sector will be free toproduce electricity and sell it to trading companies, large users and distributors undercontracts freely negotiated by the parties. The state will privatise its generation anddistribution assets and make the transmission network available to all comers.
With a few exceptions—mainly projects already under way—the Act puts an end toschemes such as build-operate-transfer projects that rely on state guarantees for thepurchase or supply of power, the supply of fuel, and/or the repayment of loans. Underthe new system private companies will have to take full market risks as in any otherindustry. While this ensures competition and reduces the scope for sleaze, it may alsomake investment—whether through privatisation or greenfield plants—unattractive,particularly in the early years, when newcomers will have to compete mainly against thestate and privileged producers.
The state generation and transmission company, TEAS, is being divided into threecompanies: TEUAS, to manage the generation capacity that remains in state hands;TEIAS, to handle transmission, and TETTAS, to buy electricity wholesale from producersand sell it wholesale to distributors, until such time as this function is taken over entirelyby a free market.
Households and small commercial users currently purchase their electricity either fromthe national distribution company, TEDAS, or in four regions from private regionaldistribution monopolies. In future, all regions will have private distributors. In principle,these will own the local distribution networks and will have to buy their electricity fromthe market. In some cases, however, regional distribution concessions already awardedon the basis of “transfer of operating rights” may be honoured.
Many aspects of the plan are controversial, and its success will depend to a large extenton the performance of the new watchdog, the Electricity Agency, which is to be set upto publish regulations, issue licences and supervise the market. In the long term,competition and market regulation are expected to improve electricity provision andreduce prices, while reducing loss and wastage of electricity and non-payment of bills. Atwo-year transition period is envisaged.
State investment in electricity generation and transmission has slowed inrecent years because of budgetary constraints. Licences have therefore beengranted to private producers—companies and industrial estates producing theirown electricity and able under certain circumstances to sell any surplus. Inaddition, official policy has been to involve the private sector through build-operate-transfer (BOT) or build-operate (BO) contracts. This has been done inan non-transparent way and without proper legislation, resulting in delays anddisputes. The most important projects currently in progress under theseschemes are the five BO thermal power plants being built with foreign capitalat Gebze, Adapazari, Ankara, Gebze, Iskenderun and Izmir. These projects, witha total capacity of 5,700 mw, will begin to come on-stream in 2002 (gassupplies permitting). Until then, blackouts may continue to occur, even in

Turkey 27
© The Economist Intelligence Unit Limited 2001 EIU Country Profile 2001
major cities, at peak times in winter. The Electricity Market Act approved byParliament in February 2001 aims to introduce an open electricity market tohelp to improve the efficiency of electricity provision and reduce the burden ofsubsidisation on state finances.
The economy
Economic structure
Main economic indicators, 2000
Real GDP growth (%) 7.1
Consumer price inflation (%; av) 54.9
Consumer price inflation (%; year-end) 39.0
Current-account balance (% of GDP) –4.8
Foreign debt (US$ bn) 114.3
Exchange rate (av; TL:US$) 625,218
Population (m) 65.3a
a State Planning Organisation; mid-year estimate.
Source: EIU.
After the crises of the 1970s Turkey abandoned import substitution and optedfor an open economy, in line with international trends. The liberalisation ofthe domestic economy has been less rapid, and despite some privatisation theeconomy remains mixed, with infrastructure, utilities, many basic industries,some food-processing industries and almost half the banking sectorstill owned by the state. However, under pressure from the IMF and the WorldBank privatisation and liberalisation seem to be imminent in many ofthese areas.
On a sectoral basis, agriculture contributed 14.6% of GDP in 2000, accountingfor over a quarter of male employment and nearly 60% of female employment.The share of agriculture in GDP declined steadily in the 1960s, 1970s and1980s but has been fairly stable in recent years, with variations dependingmainly on prices, weather conditions and the performance of other sectors.Industry (excluding construction) has declined from almost 30% of GDP at theend of the 1980s to about 22-23% in 1998-2000. Mining accounted for only1.1% of GDP in 1998-2000, down from 2% a decade earlier. Industry isdominated by the manufacturing industry, and the private manufacture ofconsumer goods—led by textiles, motor vehicles and consumer electronics—has been the most dynamic sector of the economy. The energy sector supplied3% of GDP in 2000, up from 2% ten years before. Construction contributed5-6% of GDP in 1996-2000, down from 6-8% of GDP in the late 1980s andearly 1990s. The contribution of services has risen steadily, reaching almost57% in 2000. In the service sector, trade (including hotels and catering)accounted for about 20% of GDP, while transport, which has slightly increasedin importance over the years, accounted for 14.1%.
Manufacturing and servicesare the key sectors
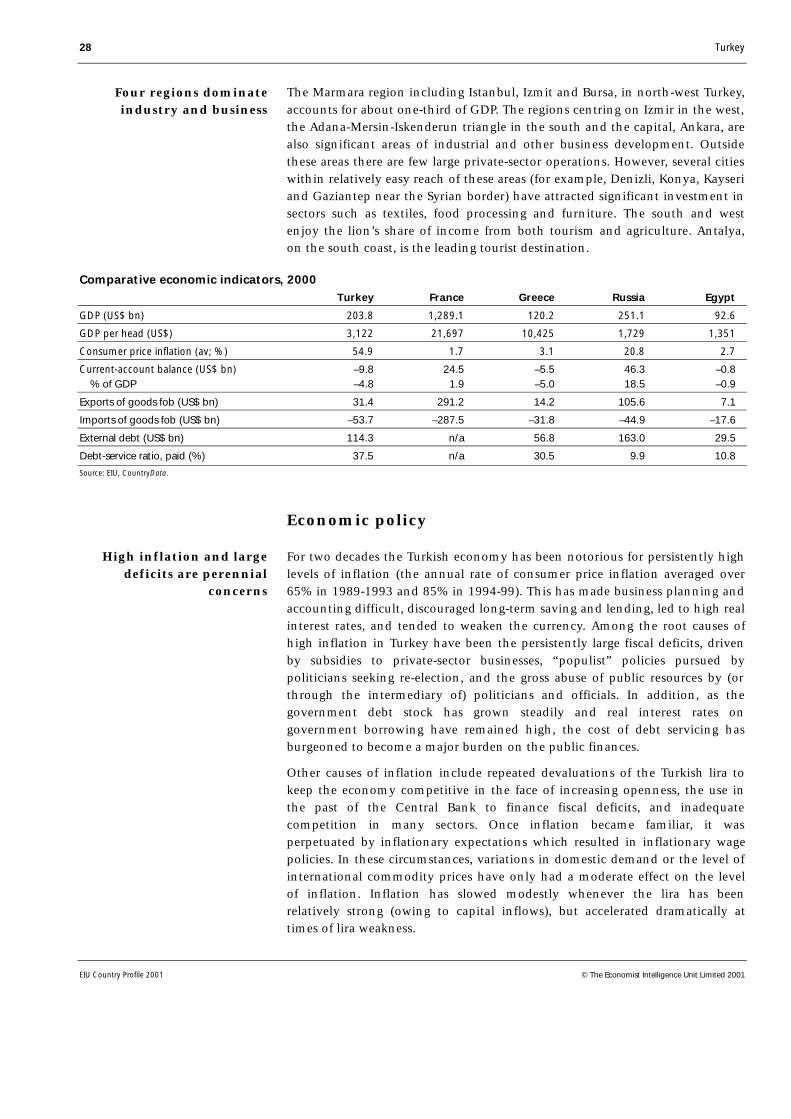
28 Turkey
EIU Country Profile 2001 © The Economist Intelligence Unit Limited 2001
The Marmara region including Istanbul, Izmit and Bursa, in north-west Turkey,accounts for about one-third of GDP. The regions centring on Izmir in the west,the Adana-Mersin-Iskenderun triangle in the south and the capital, Ankara, arealso significant areas of industrial and other business development. Outsidethese areas there are few large private-sector operations. However, several citieswithin relatively easy reach of these areas (for example, Denizli, Konya, Kayseriand Gaziantep near the Syrian border) have attracted significant investment insectors such as textiles, food processing and furniture. The south and westenjoy the lion’s share of income from both tourism and agriculture. Antalya,on the south coast, is the leading tourist destination.
Comparative economic indicators, 2000Turkey France Greece Russia Egypt
GDP (US$ bn) 203.8 1,289.1 120.2 251.1 92.6
GDP per head (US$) 3,122 21,697 10,425 1,729 1,351
Consumer price inflation (av; %) 54.9 1.7 3.1 20.8 2.7
Current-account balance (US$ bn) –9.8 24.5 –5.5 46.3 –0.8 % of GDP –4.8 1.9 –5.0 18.5 –0.9
Exports of goods fob (US$ bn) 31.4 291.2 14.2 105.6 7.1
Imports of goods fob (US$ bn) –53.7 –287.5 –31.8 –44.9 –17.6
External debt (US$ bn) 114.3 n/a 56.8 163.0 29.5
Debt-service ratio, paid (%) 37.5 n/a 30.5 9.9 10.8
Source: EIU, CountryData.
Economic policy
For two decades the Turkish economy has been notorious for persistently highlevels of inflation (the annual rate of consumer price inflation averaged over65% in 1989-1993 and 85% in 1994-99). This has made business planning andaccounting difficult, discouraged long-term saving and lending, led to high realinterest rates, and tended to weaken the currency. Among the root causes ofhigh inflation in Turkey have been the persistently large fiscal deficits, drivenby subsidies to private-sector businesses, “populist” policies pursued bypoliticians seeking re-election, and the gross abuse of public resources by (orthrough the intermediary of) politicians and officials. In addition, as thegovernment debt stock has grown steadily and real interest rates ongovernment borrowing have remained high, the cost of debt servicing hasburgeoned to become a major burden on the public finances.
Other causes of inflation include repeated devaluations of the Turkish lira tokeep the economy competitive in the face of increasing openness, the use inthe past of the Central Bank to finance fiscal deficits, and inadequatecompetition in many sectors. Once inflation became familiar, it wasperpetuated by inflationary expectations which resulted in inflationary wagepolicies. In these circumstances, variations in domestic demand or the level ofinternational commodity prices have only had a moderate effect on the levelof inflation. Inflation has slowed modestly whenever the lira has beenrelatively strong (owing to capital inflows), but accelerated dramatically attimes of lira weakness.
Four regions dominateindustry and business
High inflation and largedeficits are perennial
concerns

Turkey 29
© The Economist Intelligence Unit Limited 2001 EIU Country Profile 2001
Summary of government finances(TL trn unless otherwise indicated)
1999 2000
Consolidated budgetRevenue 18,933 33,756 Non-interest spending –17,364 –26,163
Primary balance 1,569 7,594
Interest payments –10,721 –20,440
Budget balance –9,152 –12,846 % of GDP –11.0 –10.1
Consolidated public-sector deficit (% of GNP) 23.3 12.5a
a State Planning Office year-end estimate.
Sources: Under-secretariat of the Treasury; Ministry of Finance; IMF, Turkey: Selected Issues, February 2000.
Relations with the IMF, the EU and the World Bank have resulted in a growingawareness of the case for “structural reforms” designed to reduce governmentspending in the long-term, harness the benefits of competition and attractforeign capital. Privatisation of state-owned industries has enjoyed the supportof many politicians since the 1980s. More recently, issues such as the regulationof markets, the opening up of infrastructure and utilities to free competition,the overhaul of the social security and agricultural support systems, and budgettransparency have moved up the economic policy agenda. However, politicalsupport for comprehensive reform is still far from convincing, which raisesserious doubts about the chances of success of the latest programme includedin the letter of intent approved by the IMF in May 2001.
Key reforms 1998-2001
Petroleum: An automatic pricing mechanism for petroleum products tookeffect in mid-1998, linking domestic, pre-tax prices to Mediterraneanbenchmarks. The new arrangement removes the possibility of low prices beingset in the state sector for political reasons. This paved the way for the privati-sation of state refiner, TUPRAS, which controls four of Turkey’s five refineries,and of the state-owned petroleum products distribution chain, POAS. In April2000 the government sold 31.5% of TUPRAS on the stockmarket, raisingUS$1.25bn, although the state retains a majority stake. Also in 2000, a 51% stakein POAS was sold to a consortium of Is Bank and Dogus Holding for US$1.26bn.The state intervened in petroleum prices again as international oil prices soaredin 1999-2000, but only by adjusting the rates of taxes and fund levies.
Pensions: In August 1999 parliament amended social security laws, establishinga minimum retirement age of 58 for women and 60 for men. The new systemreduces the cost to the state of subsidising the three social security institutions,which had threatened to spiral out of control. Subsequent decree-laws foresee areorganisation of the social security system, separating pensions from health andsocial assistance. A law regulating and providing incentives for private top-uppension schemes took effect in April 2001.
Banks: Despite its importance to Turkey’s economic stabilisation plans,reform of the troubled banking sector has been slow was and usually onlyintroduced in response to a crisis. In June 1999 the Banks Act was amended so
Structural reforms havemoved up the agenda
30 Turkey
EIU Country Profile 2001 © The Economist Intelligence Unit Limited 2001
as to tighten banking regulation, set up a new watchdog and facilitate thetakeover and management of weak banks. Further amendments were made inline with IMF recommendations in December, when the government alsotemporarily assumed the watchdog’s powers in order to take over five privatebanks. The watchdog, known as the Bank Regulation and Supervisory Agency(BRSA), was finally appointed in March 2000 and became operative inSeptember 2000. In November 2000 parliament approved legislation providingfor state bank autonomy, restructuring and eventual privatisation. Furtherlegislation was introduced after the February crisis to accelerate therestructuring of the state banks and the sale or liquidation of private-sectorbanks taken over by the Savings Deposit Insurance Fund (SDIF) and the BRSA(see also Economic sectors, Financial services).
Telecommunications: Progress towards liberalisation and privatisation inthis sector has been slow. A new Telecommunications Act adopted in January2000 led to the formation later in the year of a watchdog, the Tele-communications Agency, to oversee the planned free market in telecomsservices. The legislation also transformed Turk Telekom into a public companyand confirmed its land-line voice-only monopoly until the end of 2003. Thiswas seen as paving the way for the privatisation of a minority stake in TurkTelekom to a strategic international partner. However, successive tenders in1999 and 2000 failed to find a buyer, mainly because of the government’sreluctance to hand over management rights. In mid-May 2001 new legislationwas approved, allowing the state to sell 99% of Turk Telekom; up to 45% canbe sold to an international strategic partner and the state will retain a 1%golden share. The government has granted four mobile phone licences: thefirst two went to two private-sector companies, Turkcell and Telsim, in 1998;the third was awarded to a consortium of Is Bank and Telecom Italiaconsortium in 2000 for an unexpected US$2.5bn; the fourth was awarded toTurk Telekom.
Electricity: In February 2001 parliament approved the Electricity Market Law,in the lead-up to a free market in electricity. It provides for the privatisation ofall the state’s distribution assets and most of its generating assets. Thetransmission system is to be run by the state on a neutral basis. Except for alimited number of schemes, including those already under way, the bill puts anend to transfer-of-operating-rights and build-operate-transfer schemes. Theseschemes were designed to involve private-sector capital in electricitygeneration and distribution without full privatisation or a free market. Anelectricity watchdog is to be set up with the power to issue licences. In parallelwith the new system, the state power company, TEAS, is being broken up intogeneration, trading and transmission arms.
In practice, economic policy has generally been geared not so much todefeating inflation as to managing the growing debt. This has frequently beenachieved with the aid of foreign borrowing and foreign capital inflows to thedomestic financial markets. Monetary policy has generally been accommo-dating, except under the crawling-peg exchange rate regime that was in placebetween January 2000 and February 2001. At times of limited availability ofinternational finance—reflecting either international developments or a lack of
Reform programmes haveso far never been fully
implemented

Turkey 31
© The Economist Intelligence Unit Limited 2001 EIU Country Profile 2001
confidence in Turkish policy-making—financing the government debt hasbeen more difficult and more costly. In those cases, circumstances and theconditions attached to IMF support have obliged governments to cutinvestments and other spending, to raise taxes and to try to privatise stateenterprises. However, none of the government’s reform programmes have sofar been fully implemented.
The IMF stand-by agreement concluded after the 1994 financial crisis wasabandoned just one year later in 1995. This was followed by another period ofrelatively expansionary policies, as governments came and went (see Politicalbackground). In 1998 the government started to pursue more stringent policiesand entered into a fresh dialogue with the IMF. The impact of the August 1998Russian rouble crisis on the government’s borrowing costs, the formation of apotentially more long-lived coalition after the April 1999 election, and theshock caused by the August 1999 earthquake led to a renewed effort atachieving macroeconomic stability and reform. Despite the inevitable difficultyin obtaining public support for painful measures, a general consensus hademerged by the end of 1999 among bureaucrats and leading politicians alikeabout the need for responsible fiscal policies and structural reforms. Largerbusiness interests, which in the past used to benefit from fiscally inducedconsumer demand, had also become more concerned about stability, lowerinterest rates and national competitiveness.
In December 1999 a three-year programme supported by a US$4bn IMF stand-by loan replaced an IMF staff-monitored programme put in place in 1998.Although Turkey made substantial progress towards achieving the targets setdown in the programme, this was interrupted by two bouts of severe financialturmoil, first in November-December 2000 and then in February 2001. The firstcrisis, caused by difficulties in the banking sector and concern over theburgeoning current-account deficit, was averted by a promise of US$7.5bnfrom the IMF. The February 2001 crisis, triggered on the face of it by politicalinstability (see Political background), was more severe, forcing the governmentto abandon the crawling-peg exchange-rate regime and float the lira. In Maythe IMF pledged an additional US$8bn and the World Bank US$2bn-2.5bn (ontop of the US$5bn it approved in December 2000), making the rescue packagethe largest in the history of the IMF.
The IMF programmes
December 1999 to February 2001
The US$4bn IMF stand-by agreement formally concluded in December 1999was ambitious. Its central declared aim was to cut inflation from almost 70% atthe end of 1999 to 25% by the end of 2000 and to single digits by the end of2002. A crawling-peg exchange-rate regime and new tight fiscal policy targetswere established. A series of tax increases were introduced, and the governmentsought to raise public-sector wages and agricultural support prices in line withthe low inflation targets. In addition, a dramatic acceleration of structuralchange was envisaged, notably in banking, social security (already initiated inmid-1999), agriculture and energy. A target of US$7.6bn for privatisationrevenue was established for 2000, and another of US$10bn for 2001.

32 Turkey
EIU Country Profile 2001 © The Economist Intelligence Unit Limited 2001
In December 2000, in response to market turmoil, the IMF provided Turkeywith a US$7.5bn supplementary reserve facility. However, the turmoil resumedin February 2001, and this time the currency peg was abandoned and theoriginal programme suspended. This resulted in a 50% devaluation of the lirain two months and a resurgence of inflation. The immediate causes includedthe following.
(i) Although inflation slowed sharply (end-December consumer price inflationwas 39% in 2000), it was above target and considerably higher than thecurrency depreciation rate, leading to perceptions that the currency wasovervalued.
(ii) The crawling-peg exchange-rate policy prompted large capital inflows tothe equity, debt and money markets. This reduced real interest ratesdramatically, encouraging Turks to spend rather than save. The ensuingconsumer boom helped produce a large current-account deficit.
(iii) Although the fiscal targets adopted under the IMF programme weregenerally achieved, concern built up in the second half of 2000 that thegovernment was falling behind schedule in the areas of structural reform andprivatisation. Notably, there had been delays in banking sector reform, and nostrategic foreign partner was found for Turk Telekom.
Once capital began to flow out from the lira in response to the above factors,the upward impact on interest rates was exacerbated by the weakness of thebanking system. Numerous banks were caught depending on short-termmoney-market financing to meet their obligations. (See Economic sectors formore on the banking system.)
May 2001 to end-2002
In March-May the new economy minister, Kemal Dervis, drew up a newprogramme that would win back the confidence of the international financialcommunity, but which would also be politically acceptable in Turkey.Substantial international aid has been pledged. On May 15th the IMFannounced that it would provide US$8bn, in addition to the US$6bn stillavailable under the old programme. Assuming the government carries out thereforms proposed in the letter of intent to the IMF, almost US$13bn will bedisbursed in 2001 (US$3.8bn immediately) to help cover large debt rollovers inMay-August. The World Bank pledged an additional US$2bn-2.5bn, but by theend of May this had not yet been approved by the Board.
The main features of the new programme are bank restructuring, fiscalrestraint, further privatisation, measures to curb the rise of inflation, wagemoderation and a gradual move towards inflation targeting. The authorities setthemselves ambitious targets of 5.5% of GNP in 2001 and 6.5% in 2002 for theconsolidated public sector primary surplus (net of interest payments). Thesefigures exclude all costs related to recapitalisation of the banks under the SDIFand state bank restructuring, which are to be counted directly in the debt stock.

Turkey 33
© The Economist Intelligence Unit Limited 2001 EIU Country Profile 2001
All measures introduced in 1999 and 2000 to increase tax revenue, controlspending and eliminate subsidies remain in force, and new measuresannounced in the wake of the crisis include increases in the petroleumconsumption tax, rises in the rates of value-added tax rates (VAT) and socialsecurity contributions, and a planned 8% real reduction in spending, some ofwhich will come from substantial cuts in military expenditure.
Economic performance
Annual real GDP growth averaged 3.7% between 1991 and 2000. (GNP, whichis usually referred to for government macroeconomic targets, includes netfactor income from abroad.) The average rate of economic expansion in Turkeyin the last ten years compares favourably with an average annual rate ofgrowth of little over 2% in the OECD. However, it is unspectacular by thestandards of some middle- or lower-income countries, especially in Asia. It isalso disappointing by historical standards: growth averaged some 6% in the1960s and 4-5% in the 1970s and 1980s. Growth, which has always beenvolatile, became even more so in the 1990s, reflecting the dramaticcontractions of the economy in 1994 and 1999.
After two years of strong growth in 1992-93 the Turkish economy was hit by acurrency crisis in early 1994. The lira was devalued and depreciated by over60% over the course of the year, while GDP contracted by 5%. In 1995-97growth rebounded to average 7.2% a year. Economic activity in this period wasdriven largely by domestic demand. There were sharp increases in expenditureboth on private consumption and on gross fixed investment. In contrast, thecontribution of the foreign balance to growth was negative during most of the1990s with the exception of 1994 and 1998, when domestic demandcontracted sharply or was very weak (see Reference tables 7-11 for GDP data).
Gross domestic product(% change; constant 1987 prices)
Annual average2000 1996-2000
Private consumption 6.4 4.0
Public consumption 7.1 6.8
Gross fixed capital formation 16.5 5.0
Exports of goods & services 19.3 13.0
Imports of goods & services 25.4 13.6
GDP 7.1 4.1
Source: State Institute of Statistics.
In 1998-2000 economic growth became even more volatile: in 1998 real GDPgrowth slowed sharply from 7.6% in 1997 to 3.2%, as the Russian financialcrisis reduced demand for Turkish exports, including tourism and contracting,and prompted capital flight. This compounded the negative impact of the1997 Asian crisis, the effects of which were still being felt in the worldeconomy, and some tightening of fiscal policy by the government. Private
Growth has been modestand very volatile
The 1994 crisis wasfollowed by a strong
recovery
Volatility increased in1998-2000

34 Turkey
EIU Country Profile 2001 © The Economist Intelligence Unit Limited 2001
consumption expenditure stagnated and private-sector fixed investmentcontracted, as high interest rates discouraged investment and consumerspending and encouraged saving. By the second quarter of 1999 there weresome initial signs of economic recovery, as international market conditionsimproved. However, a devastating earthquake struck the Izmit area east ofIstanbul in August, killing almost 17,000 and seriously disrupting economicactivity in the industrial heartland of Turkey. Hence GDP contracted by 4.7%in 1999 as a whole, with private consumption 2.6% lower than in the previousyear and private investment down by 17.8%. Output in the construction sectordeclined by 12.5%. 1999 was also a poor year for agriculture and for tourism(see Economic sectors).
In 2000 economic growth rebounded. This had been anticipated, as re-construction after the earthquake, helped by substantial foreign aid, wasexpected to be a major engine of growth. However, the sharp fall in interestrates that greeted the IMF stand-by agreement signed in December 1999 fuelleda consumer boom which contributed to an increase of 7.2% in real GDP in2000. Private consumption rose by 6.4%, as spending on durable goods suchcars and household appliances soared by 27.5%, reflecting delayedconsumption as a result of the earthquake and a rapid expansion of consumercredit. Investment also bounced back, rising by 16.5% (15.4% in the privatesector). Driven by the surge in domestic demand growth, net imports of goodsand services rose sharply, reducing overall growth by almost 3% andcontributing to a dramatic widening of the current-account deficit.
Turkey experienced significant bouts of inflation during the second world war,in the late 1950s and for most of the 1970s. After reaching three figures in1980, when the currency was devalued, inflation dipped below 30% in 1982but then began to rise again. Between 1988 and 1999 the annual average rateof consumer price inflation ranged between 60% and 90%. The one exceptionwas 1994, when it exceeded 105%, driven again by a sharp devaluation.Inflation slowed slightly in 1998 and early 1999, thanks to low oil prices andpublic-sector pay restraint as well as weakening domestic demand. Even so, theannual average rate in 1999 was still 65.1%, with a year-end rate of 68.8%.
Starting in March 2000, the new exchange-rate policy began to reduceimported inflation and inflationary expectations (see Economic policy). At theend of 2000 consumer price inflation stood at 39%, with an annual averagerate of 54.9%. However, inflation began to surge again following theabandonment of the currency peg in February 2001 and stood at 48.3% inApril, driven by a depreciation of the Turkish currency by about 50% in twomonths. (See Reference table 12 for historical data on inflation.)
Prices(% change; av)
Annual average2000 1996-2000
Wholesale prices 51.6 66.9
Consumer prices 54.9 74.1
Source: State Institute of Statistics.
Turkey has a long historyof high inflation

Turkey 35
© The Economist Intelligence Unit Limited 2001 EIU Country Profile 2001
Evidence concerning the development of real wages is mixed. In themanufacturing sector, hourly wages have risen in real terms in recent years,notably in 1997 and 1999, after a sharp fall in 1994. Since 1997 the increasehas been higher in the public than in the private sector, reflecting high payawards. The 1999 pay deal kept the wages of unionised workers in the publicsector rising in real terms throughout 2000, while real wages started to declinein the private sector. Non-unionised civil service pay rises, on the other hand,have failed to keep pace with inflation. In 2000 civil service pay was kept inline with the government’s inflation target. Additional increments weretriggered as inflation surpassed the government’s targets, but the fall in realterms was not made up in arrears. The minimum wage, which has often beenraised in line with actual inflation, was increased less generously for 2000 and2001. In the first half of 2001 the net minimum monthly wage was TL102.4m(US$90). There is little information regarding wages in Turkey’s large informalsector. Pensions were linked to inflation under the 1999 social security reform.
Together with high returns on rent and financial earnings, inflation is widelyheld to be exacerbating inequalities of wealth and income. Income distributionis already considered to be poor because of inter-regional and rural-urbandifferences, inadequate education, the lack of effective redistributivemechanisms and other factors. In 1998 income per head was US$7,601 inKocaeli (Izmit) in the industrialised north-west, but only US$827 in Agri in theremote east. According to a recent World Bank report, Turkey—EconomicReforms, Living Standards and Social Welfare Study, the Gini coefficient based on1994 data is 0.45 for income and 0.41 for consumption. This suggests thatinequality in Turkey is considerably higher than in other west Europeancountries, and similar to Russia, Ecuador or Tunisia. A further survey is to becarried out in 2001.
Regional trends
The highly centralised system of administration leaves little room for regionalinitiatives. Public services and infrastructure are generally provided by centralgovernment, either directly or via the provincial governorates, which areheaded by appointed governors. However, in major cities municipalities canplay a significant economic role, given their responsibilities in areas such aslocal transport, water and gas supply, waste disposal and the construction ofstreets and parks. (An outline of the regional distribution of industry andincome is contained in Economic structure.)
Like the provinces, the municipalities receive most of their funds from a shareof central government tax revenue, distributed on the basis of population size.In addition, they charge for services and have been known to run commercialenterprises such as supermarkets. Local property taxes and household leviesaccount for only about 5% of total revenue. Many municipalities are in arrearsto the social security institutions. Several have undertaken large infrastructureprojects requiring debt financing. Normally, this has involved the Treasuryproviding a guarantee to the financiers, and the Treasury typically ending uppaying the debt.
Wage rises have exceededinflation in some sectors
The economic influence ofmunicipalities has grown
Income distribution is poor

36 Turkey
EIU Country Profile 2001 © The Economist Intelligence Unit Limited 2001
Legislation to devolve certain responsibilities (such as the upkeep of schoolbuildings) to the municipalities is on the agenda, but it seems unlikely to resultin a major reallocation of powers or resources.
Special incentives are available for private-sector investment in poorer parts ofthe country, but these have generally had little impact. The south-east attractsspecial attention, as the war between government forces and the Kurdishnationalist Kurdistan Workers’ Party (PKK) has severely disrupted the region’seconomy and the rural areas have been depopulated. However, the decline inarmed activity is encouraging private investment in some towns.
The South-east Anatolian Project (GAP) was started before the violence began,and its centre of activity is slightly west of the main trouble spots. It is basedaround a series of dams being built on the Euphrates and Tigris rivers and ismaking slow progress (except in electricity generation). Nevertheless, largeareas of dry land are now being irrigated and are starting to attract investmentin agriculture and related industries. However, the economic viability of theseactivities remains unproved.
Economic sectors
Agriculture
Turkey grows a wide range of crops, headed by wheat, and meets most of itsown needs for agricultural produce. There are significant exports of dried fruitsand, to a lesser extent, tobacco from the Aegean region, and of hazelnuts—ofwhich Turkey is the world’s largest supplier—from the Black Sea coast.Attempts are also made to export surpluses of grain and sugar. Surpluses ofTurkish-style tea (another Black Sea speciality) and tobacco (also grown in thesouth, the south-east and the Black Sea region) have at times had to bedestroyed. Imports are increasingly needed to top up local production of cropssuch as cotton, oilseeds and rice, while some fresh fruit and tobacco are alsoimported for reasons of quality, taste or price. In 2000 Turkey registered its firstdeficit in trade in agriculture and forestry products, with exports dipping tojust under US$2bn and accounting for a record low of 7.2% of total exports.Agricultural imports of US$2.1bn accounted for 3.9% of total imports. (SeeReference tables 13-14 for historical data on agriculture.)
A major driver of growth up to and including the 1950s, the agricultural sectorhas since grown by an average of only about 1.5% a year. Annual growth variesaccording to meteorological factors and prices. The sector is generallycharacterised by a low level of efficiency, which stems from the large numberof small farms, problems of transport and storage, relatively little mechani-sation, and above all the large population dependent on agricultural income.Intensive agriculture is practised along the south coast and in the Aegeanregion, but this accounts for only a small fraction of total production. Majorirrigation projects currently under way in the Euphrates valley are expected toboost production in this region.
Economic developmentin the south-east remains
a priority
A wide range of crops aregrown and some exported

Turkey 37
© The Economist Intelligence Unit Limited 2001 EIU Country Profile 2001
Agriculture has for many years enjoyed substantial financial support from thestate. Irrigation water and fertiliser have been subsidised, while farmers havebeen able to obtain concessionary loans from the state agricultural bank, ZiraatBankasi. In addition, much agricultural produce has been bought up at“support prices” determined each year in a way that has often reflectedpolitical expediency rather than commercial considerations or long-term policygoals. Some of these purchases have been made by state enterprises involved inprocessing the crop in question. Thus TEKEL, the state cigarettes and alcoholicdrinks manufacturer, buys most of the tobacco crop. Caykur, the state teapackaging and retailing firm, buys almost all of the tea crop; and Turkish SugarRefineries (TSF), the state enterprise which owns almost all of Turkey’s sugarrefineries, buys the bulk of the sugarbeet crop. The Soil Products Office (TMO)purchases a minority of wheat and other grains, which it stores or mills to flour.Other support purchases have been made by co-operatives or unions of co-operatives partly financed and run by the state. Such co-operatives includeFiskobirlik for hazelnuts and Taris for cotton, olives and other products grownin the Aegean region.
Support to agriculture has cost the government about 2.5% of GNP annually,without taking into account the under-taxation of the sector or the cost tothe economy of maintaining high tariff barriers for most agricultural goods.The cost has not been fully reflected in the state budget, as it has been sharedby Ziraat Bankasi and the state enterprises under the heading “duty losses”.Apart from cost, the price support system has also been blamed for favouringwealthier farmers, creating mismatches of supply and demand, althoughattempts have been made in recent years to limit overproduction of tobacco,sugar and tea and to introduce new crops.
Driven by fiscal constraints and IMF and World Bank pressure, agriculture hasentered into a period of substantial change. Cheap Ziraat Bank credits andfertiliser subsidies were virtually eliminated under the IMF programme ofDecember 1999. Under legislation adopted in June 2000, co-operatives are to berestructured over a period of four years and given financial and managerialindependence, after which they will be left to fend for themselves. The year-on-year increases in support prices were kept well below the rate of inflation in2000. TEKEL and TSF are slated for piecemeal privatisation, and legislationcame before parliament in early 2001 envisaging new market mechanisms fortobacco and sugarbeet (production of both will remain subject to quotas). Itremains to be seen whether these policies will be pursued consistently and whatimpact they will have on agricultural activity and the agricultural trade deficit.
The IMF and World Bank are aiming to replace support prices completely witha system of direct income support for farmers. Pilot projects were undertakenin 2000, and the system is to be extended in 2001. The World Bank is toprovide financial assistance for this project, which will also involve carryingout a much needed agricultural census.
The production of milk is estimated at 10m tonnes per year and theconsumption of meat is put at 800,000 tonnes/year. Dairy farmers sell theiroutput through informal, local channels or to dairy plants, including some
The sector has been heavilysubsidised
Significant changes areunder way
Livestock farming declinedin the 1980s and 1990s

38 Turkey
EIU Country Profile 2001 © The Economist Intelligence Unit Limited 2001
large ones with national distribution channels. Large-scale enterprises have alsobegun to play a role in the disparate and often informal meat and meatproducts sector. Almost all of the assets of state enterprises involved in meatand milk processing and fodder production have been sold to the private sectoror closed down since 1986.
The population of cattle, sheep and goats was almost halved in the 1980s andearly 1990s. Reasons given include premature attempts at liberalisation, highcosts, smuggling, and the impact of the war in the south-east on internal tradeand access to grazing. The quality of livestock is poor and various diseases arecommon. Smuggling of livestock and meat from neighbouring Middle Easterncountries continues, although it has reportedly been curtailed to some extentsince 1999. Meat and live animal imports were banned in the wake of thebovine spongiform encephalopathy (BSE) scare in 1996. The EU is pressingstrongly for the right to sell meat to Turkey again, but the foot-and-mouthoutbreak in 2001 will not help its cause. Breeding stock may be imported undercertain conditions.
Mining and semi-processing
Turkey has a rather wide range of mineral deposits, but mining output hasdeclined and accounted for just 1.1% of gross value added in 2000. The valueof exports of raw minerals was about US$400m per year in 1996-2000. Thenon-energy minerals sector is dominated by a state company, Eti Holding,which produces boron and chromium mainly for world markets, aluminiummainly for the domestic industry, and some copper and silver. (See Referencetable 15 for historical data on mineral production.) The company’s assets are tobe privatised with the exception of the Seydisehir aluminium works in Konya,the sole operation of its kind, and the boron ore mines in Eskisehir, Kutahyaand Balikesir. Turkey accounts for over 60% of world reserves of boron, whichis primarily used to harden steel, and sells about 700,000 tonnes of ore andconcentrate annually, earning US$220m.
The promising Beypazari soda ash facilities are being developed in conjunctionwith the private sector. The Black Sea Copper Works at Samsun, partlydependent on imported ore, is a separate state enterprise and also slated forprivatisation. Cinkur, a zinc processor based in Kayseri, was privatised in 1996but ran into financial difficulties in 1999 despite significant exports to Iran.Production was halted, and repeated attempts to find a new owner have failed.
Gold reserves are put at 300 tonnes and have started to attract interest.Eurogold has not abandoned its plans for a gold mine on the Aegean coast,despite a long court battle involving local inhabitants and environmentalists(Turkey is a substantial importer of gold, spending a record US$1.9bn in 2000).
Marble is quarried in a number of Aegean and central provinces. Exports ofprocessed and unprocessed marble soared to US$189m in 2000. Stone, aggre-gates, clay and others are quarried in sufficient quantities to feed a large cementsector and significant ceramics, glass and other building materials industries.
Mining output has declinedas a percentage of GDP

Turkey 39
© The Economist Intelligence Unit Limited 2001 EIU Country Profile 2001
Iron and steel is a sizeable industry, with exports of US$1.5bn-2bn and importsof US$2.5bn-3bn. Imports include iron ore, scrap iron and steel for the manyprivate-sector electric arc furnaces, flat steels—of which the only producer,Eregli Iron and Steel (Erdemir), can meet only 60% of demand—and specialisedsteels. Exports are mainly long products. In 1997-99 the internationalcompetitiveness of the domestic industry was badly affected by devaluations inAsia and the countries of the former Soviet Union. Hot steel production was13.6m tonnes in 2000. Erdemir, situated on the Zonguldak coalfield, is 52%owned by the state and a major privatisation target. Nearby Kardemir, whichwas privatised and sold for a symbolic TL1 to workers and local interests in1995, has since been floated on the stockmarket. The state has anotherintegrated steel mill, Isdemir, at the east Mediterranean port of Iskenderun.Following a number of unsuccessful privatisation tenders, Isdemir is to betaken over and modernised by Erdemir.
Other basic industries in which the state plays the leading role are oil refiningand petrochemicals. TUPRAS (petroleum) and Petkim (chemicals) are therespective state enterprises. In both cases, the two main plants are at theseaports of Aliaga (Izmir) and Yarimca near Izmit. TUPRAS, which was partiallyprivatised through a share offering in the first half of 2000, has four refineriesin all and processes 20m-25m tonnes of crude oil per year. About 2m tonnes ofthe crude comes from local production in Adiyaman and Batman in the south-east, and the remainder is imported. The damage done to the Yarimca refineryby the 1999 earthquake has been repaired. New continuous catalytic reformer(CCR) and isomerisation units are to be completed at Aliaga and Yarimca in2001. TUPRAS accounts for over 85% of domestic refinery output. The Aktasprivate-sector refinery provides the remainder. Turkey also meets 5-10% of itsdemand for refined products through imports. Distribution of refineryproducts is carried out by the private sector, including international oilcompanies. The largest single distributor, Petrol Ofisi (POAS), was partiallyprivatised through the sale of a 51% stake to a consortium of Turkiye Is Bankasiand the Dogan Group in 2000.
Petkim, also earmarked for privatisation, produces polyethylene, polyvinylchloride (PVC), benzene, carbon black and other petrochemicals. It has a totalcapacity of about 1.35m tonnes/year and meets about 40% of the demand ofdomestic industry for petrochemicals. The remainder is supplied almostentirely from imports. A new low-density polyethylene (LDPE) unit will comeon-stream as part of extension work at Aliaga in 2001-02.
Manufacturing
Manufacturing output growth has been a major driver of economic growthsince the 1960s. Manufacturing also accounts for over 90% of merchandiseexports and about 17% of employment. A wide variety of industrial materials,including chemicals, plastics and building materials, are produced in-country,although not always in sufficient quantity or variety to meet local needs.However, production of other intermediary goods such as machinery orelectronic components is limited. Most consumer products are also
Turkey has a substantialsteel industry
Oil refining andpetrochemicals are still in
state hands
Consumer industries supplylocal and export demand

40 Turkey
EIU Country Profile 2001 © The Economist Intelligence Unit Limited 2001
domestically manufactured, although there are a number of exceptions,particularly in goods requiring relatively high technology. The majority ofexports are made up of consumer goods. Aside from primary processing andone or two other sectors such as tobacco and paper products, ownership restsalmost entirely with the private sector. Tens of thousands of small firms rubshoulders with a dozen large conglomerates.
In 1988 the contribution of manufacturing to GDP reached 23%. In the 1990s,however, the growth of manufacturing slowed, and in 2000 it contributed only19.1% of GDP (all figures are based on a broad definition of manufacturingthat includes oil refining and basic processing of minerals and agriculturalproducts). Growth was interrupted in 1998-99, as the Asian and Russian criseshit international competitiveness, raised the cost of domestic credit anddampened domestic demand by increasing the returns on financial earnings.The earthquakes of late 1999 briefly interrupted output and depressed localsales further. Domestic demand bounced back in 2000, albeit partly to thebenefit of importers. For export industries financial problems eased, but thestrength of the lira, particularly against the weak euro, affected marginsadversely. The crises of November 2000-February 2001 and the devaluation ofthe lira were expected to assist exports, but domestic demand is likely to slumpin 2001, as small and medium-sized firms are once again faced with financingproblems. (See Reference table 16 for historical data on manufacturing output.)
State support
Various forms of state support have been used to favour the growth of manufacturingindustry. State support for agriculture and direct state investment in energy,infrastructure and basic industries have provided necessary inputs and facilities, althoughelectricity shortages have created difficulties for energy-intensive sectors such as textilesand clothing. In the 1930s the state also invested directly in consumer industries, suchas clothing. In the post-war period the state supported the efforts of nascent privatecapital through specific tariff protection, capital injections and a range of incentives,including tax breaks and the duty-free importation of investment goods. Industrialistsmade use of foreign technology and formed joint ventures with foreign capital. Somebecame virtual monopolies in the domestic market. These “import substitution” policiesreached their peak in the 1960s and 1970s. In the 1980s and 1990s trade barriers camedown, but investment incentives remained widely available. The state turned a blind eyeto tax evasion and informal employment, increased its own payroll and financed itsdeficits with the help of capital inflows. A new generation of small industrial enterprisesgrew up, particularly in relatively low-technology areas such as food-processing andtextiles/clothing. These smaller enterprises were also the main beneficiaries of policies tosupport exports.
Specific incentives have at times been made available to specific sectors, often resultingin excess capacity, but also contributing to critical mass and accumulation of expertise.The excessive number of steel furnaces and car plants are a case in point. In the early1990s, in the run-up to the customs union with the EU and the abolition of EU textilesquotas, specific incentives were made available for the textile industry.

Turkey 41
© The Economist Intelligence Unit Limited 2001 EIU Country Profile 2001
Textiles and clothing alone account for almost 40% of exports and employsome 1.5m people, mostly in small businesses. The original spinning andweaving industry, based on local cotton, is still internationally significant, butit has been overtaken by the clothing industry. The latter now accounts forsome 70% of the sector’s exports, which are typically made to order for westernfashion houses. Germany and other west European countries are by far thelargest market. Home textiles and carpets are also manufactured. However,output growth has lagged other sectors in recent years. Firms face the challengeof moving up the value-added ladder to cope with intense internationalcompetition, but are at the same time faced with financial constraints.
The traditional textiles industry is centred on Istanbul, Bursa and the cotton-growing Izmir and Adana regions. In recent years investments, especially infinished products, have also spread to Denizli and other more remote centreswhere labour is cheaper. The industry is made up of a large number of tiny,small and medium-sized firms displaying various degrees of specialisation andachieving various levels of quality. Foreign investment in the sector is rare, anda large number of the firms form part of the hidden economy.
Turkey has six car manufacturers (the Opel plant near Izmir is now out ofproduction) and a total of 16 road vehicle manufacturers, as well as severaltractor plants. All have foreign partners which supply technology and parts.The two oldest and largest car plants are the OYAK-Renault and Tofas (Koc-Fiat)plants, both in Bursa. A major new Otosan (Koc-Ford) plant at Izmit is to start toproduce commercial vehicles, mainly for export, in 2001.
Domestic vehicle production began in 1963 and reached about 150,000 unitsin 1975-6. Output then fell back, surpassing its previous level only in the late1980s. Between 1990 and 1993 vehicle output virtually doubled to reach453,000 vehicles, including 348,000 cars. This record was not broken until2000, when 468,381 vehicles were produced (but only 297,000 cars). Apartfrom periods of high interest rates and delayed consumption in times ofeconomic crisis, domestic output—particularly of cars—has suffered fromimport competition since customs barriers were lowered under the customsunion with the EU, in force since 1996. In 2000 imported cars—overwhelmingly from western Europe—accounted for 57% of all car sales,assisted by the weak euro and the relatively strong lira.
Local plants have turned to exports with some success since 1999. Renault andTofas, in particular, have been able to manufacture to order for theinternational distribution networks of their foreign partners. Annual carexports now total around 70,000. Previously, Turkey’s automotive exports hadbeen mainly limited to Mercedes buses and to the products of the growingparts industry. In 2000 exports of road vehicles and parts totalled US$1.6bn,but US$5.4bn was spent on imports. Automotive sales and production wereexpected to contract sharply in 2001, in line with the plummeting lira andrising credit rates.
Textiles leads the way butfaces problems
The automotive industry isfighting imports

42 Turkey
EIU Country Profile 2001 © The Economist Intelligence Unit Limited 2001
The manufacture of household durables and consumer electronics isdominated by a small number of large firms. The largest, Arcelik, which spansboth sectors, is also Turkey’s largest private-sector industrial company. It is amember of the Koc Group and the classic product of the “import substitution”era (see box on state support). It also uses the Beko trade mark. Its domesticrivals include Profilo Telra in electronics, the German-controlled BSH-Profilo inwhite goods and Vestel in both. Vestel’s television and monitor plant at Manisais one of the largest in the world with a capacity of 7m units per year.
Despite growing competition from imports, more than 80% of domestic demandcontinues to be met by local assembly plants. In 2000 local manufacturers sold1.2m refrigerators and 1.1m washing machines in the domestic market. Thesector also generates substantial export revenue, providing considerableinsulation from volatility in domestic demand. Television exports, mainly toEurope, surged from under 2m until 1995 to 7.2m in 2000, benefiting fromcheap labour and better customs access than East Asian competitors. About40% of refrigerator production and 50% of oven production was also exportedin 2000. Although still partly dependent on imported technology and parts,Turkish firms in these sectors are investing in research and development andadopting digital technology and other innovations.
Manufacturing production(1997=100; % change year on year in average of quarterly industrial production index)
2000 1996-2000
Food & beverages 3.7 4.3
Textiles 10.0 3.1
Clothes 6.5 2.8
Refinery products –11.4 –2.4
Chemicals 9.0 7.1
Non-metallic goods 7.6 5.3
Metals 3.6 5.0
Non-electrical machinery & equipment 6.7 5.9
Motor vehicles 47.7 12.6
Total manufacturing 6.4 4.4
Sources: State Institute of Statistics; Central Bank of Turkey.
Construction
Construction accounted for 5.3% of gross value added in 2000, down from5.5% in 1999 and 7.4% as recently as 1993. The sector has been the motor for anumber of other industries, including iron and steel, the wholly privatisedcement sector, glass, ceramics and paint. However, growth in the second half ofthe 1990s has been slow. Public investment spending was squeezed, and thegovernment mass housing administration (TOKI) faced a shortage of funds tolend to housing co-operatives. High inflation has hindered the development ofa mortgage market. In 1998 and 1999 high interest rates deterred privateinvestment and limited the use of credit for home purchases. In 1999 thesector was badly affected by the earthquakes, as much construction work was
Household durables andconsumer electronics are
prospering
The construction industry’scontribution to GDP has
declined

Turkey 43
© The Economist Intelligence Unit Limited 2001 EIU Country Profile 2001
delayed so that safety checks could be carried out. This was followed by furtherdelays as a result of new legislation requiring independent inspections beforebuilding and occupancy permits are issued. Earthquake reconstruction workprovided some compensation in 2000. (See Reference table 17 for historicalconstruction data.)
There are innumerable small construction companies providing much informalemployment, but there are also dozens of larger firms capable of undertakingcontracts abroad. Firms such as Alarko, Ceylan, Dogus, Enka, Gama, Guris,Nurol, STFA and Tekfen have outstanding contracts worth several billiondollars in Russia, other Commonwealth of Independent States (CIS) countries,the Middle East and the Balkans. Annual earnings reached US$2bn in someyears. Some of Turkey’s best known conglomerates started out as buildingcontractors before moving into other areas such as manufacturing, hotels,tourism, energy, media, telecommunications and financial services.
Financial services
Financial institutions accounted for 4% of gross value added in 2000, downfrom 5.5% in 1999 and a peak of 6.3% in 1998. The total assets of the bankingsystem are only about 60% of GNP, although some off-balance sheet items,such as repurchase agreements (repos), are significant. But while the sector issmall compared to the size and level of development of the economy, Turkey isalso considered to have too many banks, many of which are small andinefficient and have survived primarily thanks to high yields on governmentsecurities. Inflation and high real interest rates have hindered the growth offinancial savings and credit and made long-term credits such as housingmortgages virtually unthinkable. Investment by many private businesses is self-financed through profits, and some of the major conglomerates are cash-rich.Both credits and deposits are typically very short-term—around threemonths—although they are usually renewed.
Holdings of government securities have in recent years come to account for15% of banks’ assets, and a similar volume of government securities is sold onby the banks to customers by way of repos, which in Turkey have become acommon alternative to deposits. As a result, government securities account foralmost as high a share of total assets as bank credit, which is about 33%. In theshort term, the share of government securities in banks’ business is set toincrease owing to the issue of government debt to replace state banks’ claimson the government and to assist troubled banks. The banks’ balance sheetliabilities stem mainly (65-70%) from deposits. Domestic savings deposits aredivided almost equally between lira-denominated and foreign-currency-denominated accounts. Turkish banks also make use of international loans andof short-term lending from international banks, much of which was used inthe past to finance investment in government securities.
Interest margins (the differential between lending and deposit rates) havegenerally been high, reflecting mainly the government’s substantial borrowingneeds. However, banking profitability was damaged in 2000 by the sharp fall in
The banking sector is smallby international standards
Government securities havebeen a major source of
banks’ earnings

44 Turkey
EIU Country Profile 2001 © The Economist Intelligence Unit Limited 2001
interest rates on government securities that accompanied the signing of the IMFstand-by accord at end-1999. In response, banks sought to increase their loanportfolios, including consumer credit. The crises of November 2000 andFebruary 2001 put an end to the period of low real interest rates. However, theyhave raised the prospect of significant losses resulting from the banks’ shortforeign-exchange positions, which were thought to be over US$20bn. Theyare also expected to lead to an increase in bad loans, which already accountfor over 10% of banking system credit volume.
At the end of 2000 there were 80 banks operating in Turkey. These included ahandful of specialist institutions and a dozen tiny private investment banks.They also included the local operations of 18 foreign banks, headed byCitibank, although these accounted for only about 3% of banking sector assets.There were four state banks and 41 private commercial banks, including thosetaken over by the Savings Deposit Insurance Fund (SDIF—see box).
Akbank, Isbank, Garanti Bank and Yapi Kredi Bank are considered the big fourprivate banks. Akbank belongs to the Sabanci Group, Garanti Bank to the DogusGroup, and Yapi Kredi Bank to the Cukurova Group. These are arguably thecountry’s biggest business groups apart from the Koc Group, which came tobanking belatedly but now has a significant presence with Kocbank. Theseleading private banks and a handful of others are considered solid. They enjoyready access to deposits and international loans and are able to choose theircustomers.
The government sold its remaining stake in Isbank, which was set up with stateassistance in the early days of the Republic, on the stock exchange in 1998, butthe Republican People’s Party (CHP) still has a significant minority stake. Thebank has substantial holdings in industry—for example, in the glassmanufacturer, Sise Cam. In 2000 it won the privatisation tender for a majoritystake in the petroleum products distributor, POAS, in a 50-50 partnership withthe Dogan group. It also partners Telecom Italia Mobile in the Is-Timconsortium running Turkey’s third mobile telephone operator, Aria. Otherbanks also have participations in other firms, but it is more typical for the bankto be one arm—albeit often the largest arm—of a diverse conglomerate.
The four state banks—Ziraat Bank, Halkbank, Emlakbank and Vakifbank—control about one-third of total banking assets and nearly 40% of deposits.Two smaller state banks, Sumerbank and Etibank, were privatised in 1997-98(although neither prospered in private ownership). The state banks havesuffered from corruption to varying degrees, and at times they have been usedto finance government deficits. Ziraat Bank and Halk Bank are traditionallyresponsible for state-supported lending to agriculture and small businessesrespectively, and the scandal-ridden EmlakBank has traditionally financedhousing. The banks have not been fully recompensed by the government forthe duties they have carried out in these areas.
These weaknesses of the state banks have left them illiquid and reliant onmoney market funding to carry out their day-to-day activities. When foreigncapital fled the money markets for the second time in three months in
Four state banks accountfor about 40% of total
deposits
The strongest private banksare linked to leading
conglomerates

Turkey 45
© The Economist Intelligence Unit Limited 2001 EIU Country Profile 2001
February 2001 the state banks, particularly Ziraat Bank and Halkbank, weredenied funding by the Central Bank, and their demand for money helped topush interest rates into four figures, sparking the abandonment of thecrawling-peg currency policy.
Banking sector reform, 1999-2001
Since mid-1999 much has been done under pressure from the World Bank and the IMFto improve Turkey’s banking sector, albeit only after considerable debate and delay. Apowerful new watchdog—the Bank Regulation and Supervision Agency (BRSA) —hasbeen set up to issue licences, draft regulations and run the Savings Deposit InsuranceFund (SDIF).
New limits and rules have been introduced for in-group exposure, loan lossprovisioning, foreign-exchange exposure, internal risk management systems and marketrisk-related capital adequacy limits. Tax changes were introduced to facilitate bankmergers and legislation was passed at the end of 2000 to restructure and eventuallyprivatise Ziraat Bank, Halkbank and Emlakbank. A separate law provides for theprivatisation of Vakifbank.
However, the 100% deposit insurance scheme (for up to TRL50bn) remains in place,despite complaints that it prevents sound banks from using their competitive advantageand encourages weaker banks to lure savers with irresponsibly high interest rates. Afterthe crisis of November 2000 the state guarantee was extended to include virtually allbank creditors to stem the decline in confidence in the banking system. None of thesereforms prevented the financial crises of November 2000 and February 2001, in whichthe banking sector played a prominent role.
Accordingly, further measures were introduced or are planned. A start was made onresolving the liquidity problems of the state banks and the banks under the SDIF byissuing them with Treasury bonds which they will be able to cash with the Central Bank.Changes to the Banks Act were approved to make it easier to reclaim assets from formerbank owners, if necessary through specialised courts, and to control the marketing ofoffshore products.
The SDIF is also expected to be empowered to intervene at weak banks withoutnecessarily taking them over completely. The asset management unit of the SDIF is to beactivated, and a regulation is to be issued on bank mergers. Overdue legislation on thetax deductibility of special loan loss provisioning is also imminent. The bankingwatchdog, the BRSA, is expected to insist more strongly on the minimum 8% capitaladequacy ratio. However, it is still unclear how and when the limit on short foreign-currency positions (20% of capital) will be enforced.
For the state banks, Ziraat Bank, Halkbank and Emlakbank, a single executive boardhas been elected with plans to restructure the banks and prepare them forprivatisation. The law on the privatisation of Vakifbank is to be revised to allow thegovernment to determine the method of sale. State banks are to be given no moreresponsibilities unless the necessary funding has been provided for in the state budget.State banks’ capital is to be increased, excess branches are to be closed and the payrollis to be reduced.
46 Turkey
EIU Country Profile 2001 © The Economist Intelligence Unit Limited 2001
Turkey’s banking sector has a large number of small private banks owned byup-and-coming entrepreneurs, some of which have been a major source ofinstability in the sector. In the past licences were issued quite freely,particularly—it is claimed—to those with political connections. Even thoughthese banks have attempted to keep up in terms of technology, they have failedto achieve economies of scale. Lack of capital has also been a commonproblem. Some are believed to have been set up primarily to meet the cashneeds of their owners. There is a long history of the government (or statebanks) having to take over the obligations of troubled small and medium-sizedprivate banks in order to pacify deposit-holders and maintain confidence inthe system.
Since the 1994 crisis, bank deposits have been guaranteed by the government,and banks which have run into difficulties have been taken from their ownersand managed by the state without being closed down. This trend accelerated in1999-2001, so that at the time of the February 2001 crisis 13 banks were underthe management of the SDIF. In February 2001 Egebank, Sumerbank,Yurttbank, Yasarbank and Bank Kapital, which had been taken over in1999-2000, were merged under the Sumerbank name, and the new entity isundergoing restructuring. The SDIF hopes to sell at least some of the banks tonew owners; the remainder are expected to be liquidated. The possibility thatmore banks might have to be taken over by the SDIF cannot be ruled out.
The large government securities market aside, fixed-income markets areunderdeveloped, with little private debt. However, the Istanbul Stock Exchange(ISE), which opened in December 1985, has made considerable, if erratic,progress. The lack of local institutional investors—apart from investment fundsset up by the banks—is a major reason for its volatility. Private pension fundsare to be established under legislation which came into effect in April 2001.
In 2000 the daily volume of trading averaged US$740m, and the number oflisted companies rose to 315, from 290 earlier in the year. A US$1bn shareoffering in TUPRAS, the state oil refiner, was carried out in April 2000, and themobile telephone operator, Turkcell, went public in a US$1.7bn offering in July2000. Several Turkish companies have raised capital through internationalequity offerings, but Turkcell was the first to be quoted on the New York Stockexchange as well as the ISE. Other leading companies include the large privatebanks, conglomerates and state-controlled concerns part-opened to the public.However, the majority of large companies are still not open to the public. Inaddition, most Turkish firms retain their family structure, typically makingonly about one-quarter of the equity publicly tradable.
The ISE National-100 index, which rose by 85% in dollar terms in 1997, fell by50% in 1998 mainly as a result of the spread of the emerging markets financialcrisis to Russia, scaring off non-residents who had come to hold the majority ofthe free float. In 1999 the index went up by 242% in dollar terms, with most ofthe increase taking place in the final quarter of the year in anticipation oflower interest rates and the IMF stand-by accord. But in 2000 share prices fellby 51%, driven mainly by a crash in the last two months of the year, asfinancial turmoil set in. Year-end market capitalisation was just under US$70bn.
Many of the smaller bankshave run into trouble
The stock exchange isnotoriously volatile

Turkey 47
© The Economist Intelligence Unit Limited 2001 EIU Country Profile 2001
In early 2001 the share price index continued to plummet, particularly in theimmediate aftermath of the February crisis. After recovering on the back ofpledges of fresh IMF and World Bank aid in early May, the index started to fallagain over concerns about the government’s ability to meet large debtredemptions. (See Reference table 18 for historical data on the stockmarket.)
Tourism
The international tourism industry expanded quickly along the western andsouthern coasts in the 1980s, boosting consumer demand and creatingemployment. By 1992 the number of foreign visitors had risen to 7.1m. After ahiatus caused partly by the Gulf crisis strong growth resumed, and in 1997 and1998 the number of visitors exceeded 9m. In 1999 numbers fell to 7.5m aspotential visitors were deterred by violent protests in Europe and bomb attacksin Turkish cities following the capture of the Kurdish leader, Abdullah Ocalan,in February of that year. In 2000 the number of visitors exceeded 10m for thefirst time. According to the balance-of-payments figures, gross tourism revenuefor the year reached US$7.6bn (about 3.7% of GDP). This is about a quarter ofthe revenue obtained from merchandise exports. By way of comparison, Spainreceived over 48.2m tourists in 2000, generating revenue of about US$30.5bnor 5.5% of GDP. The sector is expecting further growth in 2001 and 2002,particularly after the devaluation of the lira in early 2001.
Most visitors are cheap package holidaymakers, primarily from Germany,followed by the UK and other EU countries. Istanbul, the coastal regions andCappadocia also attract visitors from a wide range of countries for cultural andhistorical reasons. In recent years there have been large numbers of Russianand other east European visitors to Istanbul and other cities on shoppingexpeditions. Istanbul has had some success in attracting internationalconferences, and various activity holidays are available. Over 95% of hotels arelocally owned, typically by small businesses, although conglomerates and hotelchains are playing an increasing role through new investments.
The external sector
Trade in goods
In the 1980s incentives were provided to boost exports, quantitativerestrictions on imports were lifted and customs duties were progressivelyreduced. By the 1990s export subsidies which contravened the General Agree-ment on Tariffs and Trade had been abolished, while the process of importliberalisation continued. In 1996 Turkey entered into a customs union with theEuropean Union. The main effect of this was to give EU manufactured goodscustoms-free access to the Turkish market, while allowing manufactured goodsfrom third countries access at the same low tariff rates applicable in the EU.
Foreign trade has beenprogressively liberalised
The package holidaybusiness is an added source
of hard currency

48 Turkey
EIU Country Profile 2001 © The Economist Intelligence Unit Limited 2001
Under the customs union, Turkey was allowed to go on protecting certain“sensitive sectors”, including the automotive industry, against third-partygoods, but this exemption expired at the end of 2000. In 1999 Turkey adoptedEU-style customs legislation, and the customs administration is undergoingmodernisation. Meanwhile, free-trade agreements have been concluded withthe EU’s main partners in central Europe, and a similar process is under waywith those countries in North Africa, the eastern Mediterranean and MiddleEast that are covered by the EU-Med agreements. There has been talk of a free-trade agreement with the US, possibly ending US textile quotas. Despite theexistence of an agreement with the EU on trade in agriculture, there are stillrestrictions on imports of agricultural goods.
Foreign trade, 2000a
(US$ m)
Exports fob Imports cif Balance
Agriculture, hunting & forestry 1,956.5 –2,097.8 –141.3
Fishery 24.1 –1.7 22.4
Mining & quarrying 397.0 –7,098.8 –6,701.8
Manufacturing 24,909.6 –44,533.4 –19,623.8
Total incl others 27,485.0 –54,150.0 –26,664.0
a Excluding “suitcase” trade.
Source: State Institute of Statistics.
Until the 1970s, unprocessed agricultural goods made up the bulk of exports,while manufactures accounted for only a small fraction. Today agricultureaccounts for only about 10% of exports, and processed foods for another 5%.Clothing and other finished textiles products accounted for 27% of exports in2000, and fibres, yarn and cloth (cotton and artificial) for another 10%.Clothes are typically manufactured to order for western stores. A wide range ofother manufactured goods are also exported, notably electrical goods(especially televisions), steel and motor vehicles and parts.
About 65% of imports are made up of intermediate goods. These mainlycomprise inputs for Turkish industry and business—materials such as steel andplastics (and even traditionally home-grown cotton and tobacco), and semi-finished goods such as electronic components. Imports of oil and gas are alsoregarded as intermediate goods. Mineral oils and fuels accounted for 13.2% ofimports in 1999 and for 17.6% in 2000. Investment goods, chiefly industrialmachinery, but also everything from transport vehicles to hospital equipment,account for about 20% of total imports. As trade barriers have come down,Turkish manufactured goods have also faced increased competition fromimports in their domestic market, most obviously in the case of motor vehicles.The share of consumer goods in total imports remained well under 10% until1996, but then edged up to 13.4% in 2000.
The EU accounts for about 50% of both imports and exports. The strong USgrowth and the strong dollar of recent years have lifted the US share inTurkey’s exports to over 10%, while the share of US goods in Turkey’s imports
Exports are mainlyfinished goods
Intermediate goodsdominate imports
The EU is Turkey’s maintrading partner

Turkey 49
© The Economist Intelligence Unit Limited 2001 EIU Country Profile 2001
has fallen to 7%. Russia—Turkey’s key natural gas supplier—also supplied 7%of Turkey’s imports in 2000. Exports to Russia accounted for almost 8% of totalexports in 1997, but slumped dramatically after the 1998 rouble crisis.
The figures cited above are based on formal trade returns and therefore excludeinformal “suitcase trade” with Russia and other former communist countries ofgoods ostensibly carried on the person of individual travellers. Earnings fromsuitcase trade was officially estimated at US$8.8bn—one-quarter of all exportsin 1996, the first year an estimate was included in the merchandise tradefigures in the balance of payments. Since then it has contracted sharply,standing at US$2.9bn in 2000, although this is well up on the previous year.
The Middle East has lost much of its significance as an export market since the1980s, especially given the decline of Iraq, once Turkey’s second largest tradingpartner. Imports from the Middle East consist mainly of crude oil. Informalimports of Iraqi petroleum products in contravention of the sanctions regimeaccounted for an estimated 20% of the domestic retail market in 1999. Manyother products are also imported informally from or via neighbouring MiddleEast countries and the former Soviet Union. (See Reference tables 21-22 forfurther data on main trading partners.)
Main trading partners, 2000
Exportsa fob % of total Importsa cif % of total
EU 52.5 EU 48.9 of which: of which: Germany 18.8 Germany 13.2 UK 7.4 Italy 8.0 Italy 6.4 France 6.5 France 6.0 UK 5.0
US 11.2 Russia 7.2
Middle East 7.8 US 7.2
Africa 4.9 Middle East 5.7
CIS 5.9 Japan 2.9
a Excluding “suitcase” trade.
Source: State Institute of Statistics.
In 2000 exports of goods (excluding suitcase trade) amounted to 13.5% of GDPand imports to 26.6%. There has always been a trade deficit, and broadlyspeaking it has grown with the volume of trade. However, there have beensharp variations in the deficit from year to year. The trade deficit (excludingsuitcase trade) reached a record US$26.7bn in 2000, compared to onlyUS$14.1bn the year before. Variations in the value of imports largely accountfor the volatility in the trade deficit. Imports rise sharply in years of highdomestic demand growth (1990, 1993, 1995-7) and fall back in years whendemand contracts (1994, 1999). In 2000 high domestic demand combinedwith high oil prices and a strong lira to produce an import bill of US$54.2bn(cif), compared to US$40.7bn in 1999 and US$48.6bn in 1997. (See Referencetable 20 for historical data on imports.)
The trade deficit has risenbroadly in line with trade
volume

50 Turkey
EIU Country Profile 2001 © The Economist Intelligence Unit Limited 2001
In 1993-97 the value of exports rose by 71% (or 109% including suitcase trade).During this period exports were assisted by the 1994 devaluation and thestrength of the global economy. In 1997-2000, however, exports rose in valueby only 4.7% (and including the suitcase trade declined by 4.4%). The Asia andRussian crises of 1997 and 1998 led to high financing costs, weak demand, lowprices in international markets and slow growth in Turkey’s main market,western Europe. Subsequently, disruption from the 1999 earthquakes and theimpact of a weak euro on export prices helped to depress exports. In 2000exports (excluding suitcase trade) were US$27.5bn. (See Reference table 19 forhistorical data on exports.)
Invisibles and the current account
Turkey regularly achieves a substantial surplus on the invisibles balance (netearnings from services, income—interest, profits and dividends—and currenttransfers). This invisibles surplus, which partly offsets the perennial deficit onthe merchandise trade balance, is mainly a result of earnings from tourism andworkers’ remittances. Occasionally the invisibles surplus exceeds themerchandise trade deficit entirely, producing a current-account surplus. Thishappened most recently in 1998.
In 2000 the invisibles surplus reached US$12.6bn. Tourism receipts were arecord US$7.6bn (US$5.9bn net of the tourist spending of Turks in othercountries), and US$4.6bn entered the country as workers’ remittances.However, in spite of this strong invisibles balance, the huge trade deficit meantthat there was still a current-account deficit of US$9.8bn. This was theequivalent of 4.8% of GDP, higher even than the previous record deficit of3.5% of GDP recorded in 1993.
Earnings from tourism first became significant in the 1980s. They have risen byabout 150% in the last decade, despite occasional setbacks caused by weakinternational demand or politics (see Economic sectors). Workers’ remittancescome mainly from Turkish workers in Germany and other European countries,but those employed in the construction industry in the Middle East, easternEurope and the former Soviet Union also make remittances. While there areconsiderable variations from year to year, remittances were about US$1bn ayear in the 1970s, US$2bn a year in the 1980s and US$3bn a year in the early1990s. They then soared to a peak of US$5.4bn in 1998, perhaps becauseTurkish workers abroad were attracted by high interest rates in Turkey.
Among other invisible items, interest payments have been growing inimportance, and in 2000 Turkey made net interest payments of US$3.5bn. Netincome from “other goods and services” can also be substantial—in 1998 itamounted to over US$7bn. Besides transport, freight and profits from cross-border investments, this item encompasses the earnings of Turkish contractingcompanies abroad. However, this does not fully explain either the amountsinvolved or the recent wide variations from one year to the next, and as in thecase of workers’ remittances, there may be a speculative element to this item.Earnings from transit trade and pipeline royalties have not been significant
Export performance hasbeen weak since 1997
Turkey has a substantialinvisibles surplus
Tourism and workers’remittances are major
sources of foreign exchange
Interest paymentsare rising

Turkey 51
© The Economist Intelligence Unit Limited 2001 EIU Country Profile 2001
since the Gulf crisis cut off normal relations with Iraq. (See Reference tables 23and 24 for historical data on the balance of payments.)
Current account, 2000US$ m % changea
Exports fob 31,375 7.0 of which: ”suitcase” trade 2,944 30.6
Imports fob –53,712 35.1
Merchandise trade balance –22,337 113.9
Services & income inflows 22,320 19.1 of which: travel 7,636 46.8 interest income 2,836 20.7
Services & income outflows –14,975 0.9 of which: interest income –6,299 15.6
Current transfers balance 5,011 4.1
Invisibles balance 12,570 38.4
Current-account balance incl “suitcase” trade –9,767 618.2
a 1999/2000.
Source: Central Bank of Turkey.
Capital flows and foreign debt
Capital flows have been positive in most years, more than making up for thecurrent-account deficit and allowing Turkey to build up a cushion of foreign-exchange reserves. Since the declaration of full capital-account convertibility in1989, the level of capital inflows has varied greatly from year to year,depending on international liquidity conditions and domestic and inter-national confidence in the conduct of economic policy. In 1994 there were netcapital outflows of US$4.2bn. There were also capital outflows in 1991 and1998. By contrast, net capital inflows were as high as US$9bn in 1993,US$7.1bn in 1997 and US$9.4bn in 2000.
Net government bond issuance on international capital markets has been onesource of capital inflows. The Treasury has taken every opportunity to raisefunds in this way in recent years. Although redemptions overtook issuance in1998—the year of the rouble crisis—net issuance bounded back to US$3.1bn in1999 and US$6.1bn in 2000. Banks and companies have also rapidly increasedtheir foreign borrowing in recent years. In 1996-99 net inflows of long-termloans to the non-bank, non-central government sector averaged someUS$3.5bn a year. In 2000 they amounted to US$10bn, according to balance-of-payments data. Banks and companies have also made significant use of short-term credit. In particular, banks obtained net short-term credit of US$2.4bnand US$3.8bn in 1992 and 1993, only to pay back US$6.6bn in the crisis yearof 1994. Net use of short-term credit by banks then resumed, expanding toUS$2.1bn in 1999 and US$4.7bn in 2000.
Capital inflows have beenvolatile but generally
positive
Borrowing has accountedfor most capital inflows

52 Turkey
EIU Country Profile 2001 © The Economist Intelligence Unit Limited 2001
At under US$1bn a year, foreign direct investment (FDI) into Turkey has beendisappointing. Reasons given for this include political uncertainty; inflationand the associated accounting problems; competition from central and easternEurope; and a range of other negative factors from inadequate infrastructure toabuse of intellectual property rights, bureaucratic irritants and the unpre-dictability of the legal and judicial system. More generally, Turkey offersneither a virgin domestic market nor the extremely cheap and flexible labourforce that would make it a manufacturing outpost.
Hopes for much larger FDI inflows are tied to faster progress on privatisationand the opening up of energy, telecommunications and other infrastructuresectors to foreign investment. The first signs of this have come with the start ofconstruction work on five major power plants being built by private consortiaincluding international firms, and with the purchase of a mobile telecomslicence by Turkish-Italian joint venture Is-Tim. However, Turkish directinvestment in other countries has also risen sharply in the past three years.
Continuous foreign borrowing by the public and private sectors has led to asteady increase in Turkey’s external debt. It rose sharply in 1978-1991 anddoubled in 1984-87 from US$20bn to US$40bn, reaching about 45% of GDP.The pace of increase then slowed and actually fell as a percentage of GDP. In1992 this trend was inverted and Turkey’s external debt began to rise againfairly steadily, with the exception of 1994. According to the Treasury, Turkey’sforeign debt stock was US$79.6bn, or about 43% of GDP at the end of 1996. Bythe end of 2000 it had reached US$114.3bn, or about 56% of GDP. The rise inthe debt stock since 1996 is almost entirely attributable to an increase inprivate-sector debt. As a proportion of GDP, public-sector foreign debt wasalmost unchanged at about 30% during this period. (See Reference table 25 forhistorical data on external debt.)
Turkey’s medium and long-term foreign debt at the end of 2000 wasUS$85.4bn and short-term debt was US$28.9bn. Short-term debt is held almostentirely (94%) by the private sector, particularly banks. The private-sectormedium- and long-term debt is put at US$24.9bn. About one-quarter is owedby banks and other financial institutions, and the remainder by non-financialinstitutions. The public-sector medium- and long-term debt amounted toUS$60.6bn in 2000. It consisted mainly of a fairly even mixture of bond issuesand credits from governments and multilateral organisations and includedUS$9.7bn in deposits held with the Central Bank by Turks living in Europe (theDresdner Bank scheme).
Private-sector debt, in particular, is not always recorded accurately. It is alsoworth noting that the existing debt stock rises in US dollar terms when thedollar is weak against the euro and the yen and falls when the dollar is strong.This is caused by changes in the exchange rates at which the portion of thedebt denominated in other currencies is converted into dollars. About 55% ofthe debt is denominated in dollars, close to 30% in euros and euro-relatedcurrencies, and some 9% in yen.
FDI inflows are limited
Total external debtexceeded 55% of GDP
in 2000
Over half of the totalexternal debt is
public-sector debt
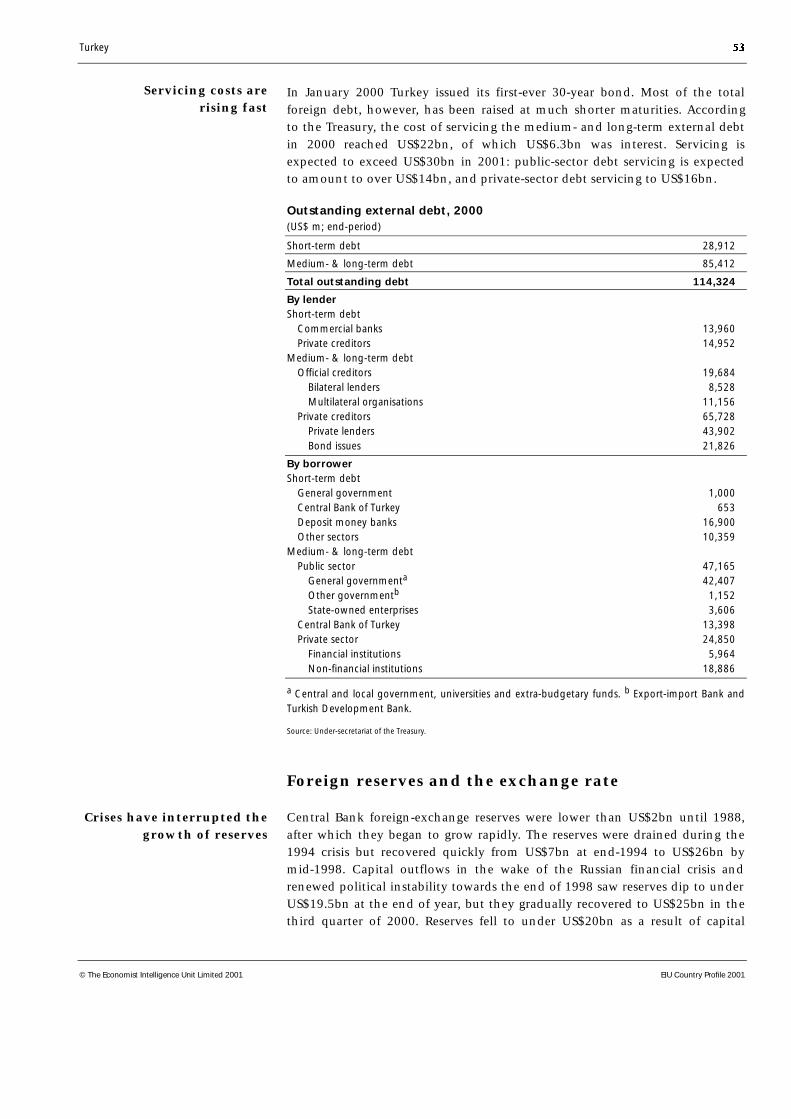
Turkey 53
© The Economist Intelligence Unit Limited 2001 EIU Country Profile 2001
In January 2000 Turkey issued its first-ever 30-year bond. Most of the totalforeign debt, however, has been raised at much shorter maturities. Accordingto the Treasury, the cost of servicing the medium- and long-term external debtin 2000 reached US$22bn, of which US$6.3bn was interest. Servicing isexpected to exceed US$30bn in 2001: public-sector debt servicing is expectedto amount to over US$14bn, and private-sector debt servicing to US$16bn.
Outstanding external debt, 2000(US$ m; end-period)
Short-term debt 28,912
Medium- & long-term debt 85,412
Total outstanding debt 114,324
By lenderShort-term debt Commercial banks 13,960 Private creditors 14,952Medium- & long-term debt Official creditors 19,684 Bilateral lenders 8,528 Multilateral organisations 11,156 Private creditors 65,728 Private lenders 43,902 Bond issues 21,826
By borrowerShort-term debt General government 1,000 Central Bank of Turkey 653 Deposit money banks 16,900 Other sectors 10,359Medium- & long-term debt Public sector 47,165 General governmenta 42,407 Other governmentb 1,152 State-owned enterprises 3,606 Central Bank of Turkey 13,398 Private sector 24,850 Financial institutions 5,964 Non-financial institutions 18,886
a Central and local government, universities and extra-budgetary funds. b Export-import Bank andTurkish Development Bank.
Source: Under-secretariat of the Treasury.
Foreign reserves and the exchange rate
Central Bank foreign-exchange reserves were lower than US$2bn until 1988,after which they began to grow rapidly. The reserves were drained during the1994 crisis but recovered quickly from US$7bn at end-1994 to US$26bn bymid-1998. Capital outflows in the wake of the Russian financial crisis andrenewed political instability towards the end of 1998 saw reserves dip to underUS$19.5bn at the end of year, but they gradually recovered to US$25bn in thethird quarter of 2000. Reserves fell to under US$20bn as a result of capital
Servicing costs arerising fast
Crises have interrupted thegrowth of reserves
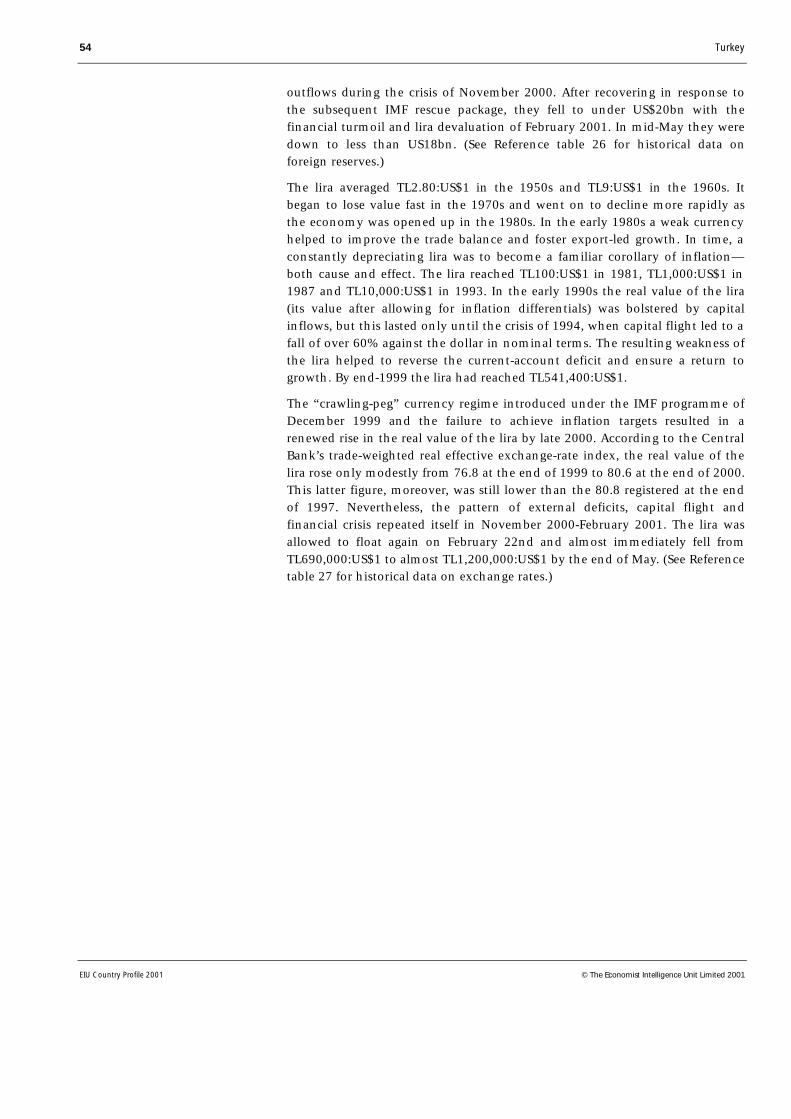
54 Turkey
EIU Country Profile 2001 © The Economist Intelligence Unit Limited 2001
outflows during the crisis of November 2000. After recovering in response tothe subsequent IMF rescue package, they fell to under US$20bn with thefinancial turmoil and lira devaluation of February 2001. In mid-May they weredown to less than US18bn. (See Reference table 26 for historical data onforeign reserves.)
The lira averaged TL2.80:US$1 in the 1950s and TL9:US$1 in the 1960s. Itbegan to lose value fast in the 1970s and went on to decline more rapidly asthe economy was opened up in the 1980s. In the early 1980s a weak currencyhelped to improve the trade balance and foster export-led growth. In time, aconstantly depreciating lira was to become a familiar corollary of inflation—both cause and effect. The lira reached TL100:US$1 in 1981, TL1,000:US$1 in1987 and TL10,000:US$1 in 1993. In the early 1990s the real value of the lira(its value after allowing for inflation differentials) was bolstered by capitalinflows, but this lasted only until the crisis of 1994, when capital flight led to afall of over 60% against the dollar in nominal terms. The resulting weakness ofthe lira helped to reverse the current-account deficit and ensure a return togrowth. By end-1999 the lira had reached TL541,400:US$1.
The “crawling-peg” currency regime introduced under the IMF programme ofDecember 1999 and the failure to achieve inflation targets resulted in arenewed rise in the real value of the lira by late 2000. According to the CentralBank’s trade-weighted real effective exchange-rate index, the real value of thelira rose only modestly from 76.8 at the end of 1999 to 80.6 at the end of 2000.This latter figure, moreover, was still lower than the 80.8 registered at the endof 1997. Nevertheless, the pattern of external deficits, capital flight andfinancial crisis repeated itself in November 2000-February 2001. The lira wasallowed to float again on February 22nd and almost immediately fell fromTL690,000:US$1 to almost TL1,200,000:US$1 by the end of May. (See Referencetable 27 for historical data on exchange rates.)

Turkey 55
© The Economist Intelligence Unit Limited 2001 EIU Country Profile 2001
Appendices
Sources of information
Census of population (until 1990 held every five years; from 1990 to be heldevery ten years, although a census was held in November 1997). Full resultsnormally published two or three years afterwards in DIE, Population byAdministrative Division and Social and Economic Characteristics of Population
State Institute of Statistics (DIE), Monthly Bulletin of Statistics
State Planning Organisation (DPT), Main Economic Indicators (monthly; fullerdata on national income etc than the DIE’s Bulletin of Statistics)
Briefing, an English-language weekly news magazine published in Ankara, alsoprints current economic statistics, mainly from the DIE, with analysis ofcurrent political and economic developments
The IMF and OECD are the main international providers of statisticalinformation on the Turkish economy
Energy Data Associates, Bishops Walk House, 19-23 High Street, Pinner,Middlesex HA5 5PJ
IMF, International Financial Statistics (monthly)
OECD, Economic survey (annual)
Ministry of Foreign Affairs, www.mfa.gov.org
The Treasury, www. treasury.gov.tr
Ministry of Finance, General Directorate of Public Accounts,www.muhasebat.gov.tr
DIE, www.die.gov.tr
Central Bank, www.tcmb.gov.tr
DPT, www.dpt.gov.tr
Istanbul Stock Exchange (ISE), www.ise.org
Turkish Daily News, www.turkishdailynews.com (English language dailynewspaper on Turkey
The Turkish Economic and Social Studies Foundation (leading Turkishthinktank), www.tesev.org.tr
There is a rich collection of books on Turkey’s history and contemporarypolitics and society, but academic literature on the economy is disappointinglypatchy, given its importance. The following is just a selection.
National statistical sources
Select bibliography
International sources
Websites

56 Turkey
EIU Country Profile 2001 © The Economist Intelligence Unit Limited 2001
Tosun Aricanli and Dani Rodrik (eds), The Political Economy of Turkey: Debt,Adjustment and Sustainability, Macmillan, Basingstoke, 1990. Technical, but thelast chapter has a good summary of economic reforms in the early 1980s.
Cigdem Balim (ed), Turkey, revised edition, Clio Press, Oxford, WorldBibliographical Series Vol. 27, 1999. An excellent overall bibliography.
Mehmet Ali Birand, Shirts of Steel: an Anatomy of the Turkish Armed Forces,I B Tauris, London, 1991. A fascinating and original study by one of Turkey’smost distinguished journalists.
Clement H Dodd, The Crisis of Turkish Democracy, Eothen, Hemingford Grey,2nd edn, 1990. A valuable, short study.
Clement H Dodd, The Cyprus Imbroglio, Eothen, Hemingford Grey, 1998. Adetailed up-to-date study of the problem since 1974.
William Hale, The Political and Economic Development of Modern Turkey, CroomHelm, London, 1981. Mainly on the economy for the period 1923-80.
William Hale, Turkish Foreign Policy, 1774-2000, Frank Cass, London, 2000.Historical survey which concentrates on the period since the second world war.
Metin Heper and Ahmet Evin (eds), Politics in the Third Turkish Republic,Westview, Boulder (Colorado), 1994. Includes useful papers on the economy.
A Kazancigil and E Ozbudun (eds), Ataturk: Founder of a Modern State, Hurst,London, 1981. More than a biography.
Heinz Kramer, A Changing Turkey: The Challenge to Europe and the United States,Brookings Institution Press, Washington DC, 2000. Concentrates on Turkey’sforeign relations since the end of the cold war.
Bernard Lewis, The Emergence of Modern Turkey, Oxford University Press,London, 1961. A classic; reprinted several times.
Andrew Mango, Ataturk, John Murray, London 1999. An excellent biography ofthe founding father of modern Turkey.
Ziya Onis and James Riedel, Economic Crises and Long-Term Growth in Turkey,World Bank, Washington, 1993. Valuable and topical.
David Shankland, Islam and Society in Turkey, Eothen, Hemingford Grey, 1998.An original and up-to-date survey of Islamist movements.
Paul Stirling (ed), Culture and Economy: Changes in Turkish Villages, EothenHemingford Grey, 1993. Valuable scholarly papers on an understudied subject.
Richard Tapper (ed), Islam in Modern Turkey: Religion, Politics and Literature in aSecular State, I B Tauris, London, 1991. Wide-ranging papers on a crucial topic.
Sweder van Wijnerbergen, Ritu Anand, Ajay Chhiber and Roberto Rocha,External Debt, Fiscal Policy and Sustainable Growth in Turkey, Johns Hopkins forWorld Bank, Baltimore, 1992. A valuable specialist study.
Eric J Zurcher, Turkey, a Modern History, I B Tauris, London, 1993. The bestup-to-date overall history, with a valuable annotated bibliography.

Turkey 57
© The Economist Intelligence Unit Limited 2001 EIU Country Profile 2001
Reference tables
These reference tables provide the most up-to-date statistics available at the time ofpublication.
Reference table 1
Population(m unless otherwise indicated)
1995 1996 1997 1998 1999
Total (mid-year estimates) 60.61 61.53 62.47 63.45 64.39 % change, year on year 1.5 1.5 1.5 1.6 1.5
Source: IMF, International Financial Statistics (IFS).
Reference table 2
Labour force(‘000 unless otherwise indicated)
1996 1997 1998 1999 2000a
Civilian labour force 22,077 21,796 22,929 22,925 22,029 Employed 20,707 20,247 21,393 21,236 20,578 Unemployed 1,370 1,549 1,536 1,689 1,451
Unemployment rate (%) 6.2 7.1 6.7 7.4 6.6 of which: urban 9.7 9.9 10.3 10.4 8.9 rural 2.9 4.1 2.9 4.1 3.7
Underemployed 1,456 1,468 1,345 2,331 1,541
Unemployment & underemployment (%) 12.8 13.8 12.6 17.5 13.6
a Break in series. Figures for 1996-1999 are October data based on population over 12; figures for2000 are annual averages based on population over 15.
Source: State Institute of Statistics, Household Labour Force Survey.
Reference table 3
Transport statistics
1995 1996 1997 1998 1999a
RailwaysPassenger traffic (m passenger-km) 5,797 5,229 5,840 6,160 6,140 Goods traffic (m tonne-km) 8,516 8,914 9,614 8,377 8,108
SeaPassenger traffic (m passenger-km) 672 651 710 745 780 Goods traffic (m tonne-km) 34,965 512,938 526,400 538,600 558,800
RoadTotal length (km) 59,999 60,225 60,841 60,885 60,911 Passenger cars (no.) 3,058,511 3,274,156 3,570,105 3,807,305 4,040,768 Passengers carried (m person-km) 155,202 167,871 180,967 186,159 189,882 Goods carried (m tonne-km) 112,515 135,781 139,789 152,210 155,254
AirPassengers (‘000) 8,599 9,281 10,266 10,504 10,410 Aeroplanes (no.) 64 65 66 71 75
a Provisional.
Source: Central Bank of Turkey, Annual Report, 1999.

58 Turkey
EIU Country Profile 2001 © The Economist Intelligence Unit Limited 2001
Reference table 4
National energy statistics(m tonnes of petroleum equivalent)
1995 1996 1997 1998 1999a
Consumption 63.3 69.4 73.2 74.2 80.3 Commercial 56.2 62.3 66.2 67.1 73.6 Petroleum 29.3 30.9 30.5 30.3 32.9 Lignite 10.6 11.2 12.3 12.6 13.0 Hard coalb 6.7 9.1 10.3 10.3 11.3 Hydroelectricityc 3.1 3.5 3.4 3.6 2.8 Net imported electricity 0.0 0.0 0.2 0.3 0.3 Natural gas 6.3 7.4 9.2 9.7 12.9 Renewable 0.2 0.2 0.3 0.3 0.4 Non-commercial 7.1 7.1 7.0 7.1 6.7 Wood 5.5 5.5 5.5 5.5 5.3 Wastes 1.6 1.6 1.5 1.6 1.4
Supply 63.3 69.4 73.2 74.2 80.3
Domestic products 26.3 27.0 27.7 28.9 28.5 Petroleum 3.7 3.7 3.6 3.4 3.2 Lignite 10.7 10.9 11.9 12.8 13.0 Hard coalb 1.3 1.4 1.3 1.2 1.7 Hydroelectricityc 3.1 3.5 3.4 3.6 2.8 Wood 5.5 5.5 5.5 5.5 5.3 Wastes 1.6 1.6 1.5 1.6 1.4 Natural gas 0.2 0.2 0.2 0.5 0.7 Renewable 0.2 0.2 0.3 0.3 0.4
Imports 39.8 44.3 47.5 48.6 51.9 Petroleum 28.4 29.5 29.4 30.3 29.8 Hard coal 5.2 7.5 8.9 8.7 9.6 Electricity 0.0 0.0 0.2 0.3 0.3 Natural gas 6.2 7.3 9.0 9.3 12.2
Exports 1.9 1.9 1.6 2.4 0.0 Petroleum 1.9 1.9 1.6 2.4 0.0 Electricity 0.0 0.0 0.0 0.0 0.0
Marine bunkers –0.5 –0.5 –0.6 –0.6 0.0
Change in stocks –0.2 0.4 0.5 –0.1 0.0
Statistical error –0.2 0.1 –0.3 –0.2 –0.1
a Provisional. b Including secondary coal, coke and petrocoke. c Including geothermal, solar.
Sources: Central Bank of Turkey, Annual Report, 1999; Ministry of Energy and Natural Resources.

Turkey 59
© The Economist Intelligence Unit Limited 2001 EIU Country Profile 2001
Reference table 5
Consolidated government finances(TL trn unless otherwise indicated)
1996 1997 1998 1999 2000
Revenue 2,728.0 5,815.1 11,811.1 18,933.1 33,756.4 Tax 2,244.1 4,745.5 9,228.6 14,802.3 26,514.1 Non-tax 483.9 1,069.6 2,582.5 4,130.8 7,242.3
Expenditure 3,961.3 8,050.3 15,614.4 28,084.7 46,602.6 Personnel 974.1 2,073.1 3,871.0 6,911.9 9.982.1 Other current 312.1 715.2 1,316.8 2,260.8 3,611.3 Capital 255.4 640.1 999.3 1,544.4 2,472.3 Interest 1,497.4 2,277.9 6,176.6 10,720.8 20,439.9 Other transfers 922.3 2,343.9 3,250.7 6,646.6 10,097.0
Balance –1,233.4 –2,235.2 –3,803.4 –9,151.6 –12,846.2 % of GDP –8.6 –7.8 –7.1 –11.0 –10.1
Balance excl interest 264.1 42.8 2,373.2 1,569.2 7,593.7 % of GDP 1.8 0.1 4.4 1.9 6.0
Consolidated public sector deficit % of GDP 13.1 13.1 15.6 23.3 12.5a
a State Planning Office estimate; year-end.
Sources: Ministry of Finance General Directorate of Public Accounts; Central Bank of Turkey; IMF, Turkey: Selected Issues, February 2000; OECD, Economic Survey: Turkey, February 2001.
Reference table 6
Money supply and interest rates(TL bn unless otherwise indicated; end-period)
1996 1997 1998 1999 2000
Money (M1) incl others 882.3 1,491.7 2,433.0 4,307.1 n/a % change, year on year 130 69 63 77 n/a
Quasi-money 4,580 9,298 18,040 36,297 n/a
Money (M2) 5,462 10,790 20,473 40,604 n/a % change, year on year 117.3 97.5 89.7 98.3 n/a
Interest rates (%; period averages) Deposit rate (av) 80.7 79.5 80.1 78.4 47.2 Interbank money market rate (av) 76.2 70.3 74.6 73.5 56.7
Sources: IMF, IFS; Central Bank of Turkey.

60 Turkey
EIU Country Profile 2001 © The Economist Intelligence Unit Limited 2001
Reference table 7
Gross domestic product(market prices)
1996 1997 1998 1999 2000
Total (US$ m)At current prices 176 189 205 198 204
Total (TL bn)At current prices 14,320,117 28,720,649 53,522,970 82,925,538 127,424,444 At constant (1987) prices 104,903 112,892 116,541 111,083 118,950 % change, year on year 7.3 7.6 3.2 –4.7 7.1
Per head (TL)At current prices 2,858 3,025 3,235 3,075 3,122a
At constant (1987) prices 1,705 1,806 1,837 1,725 1822a
% change, year on year 5.7 5.9 1.7 –6.1 5.2a
a Derived from EIU estimate for population.
Source: State Institute of Statistics.
Reference table 8
Gross domestic product by expenditure(TL bn; current prices; % of total in brackets)
1996 1997 1998 1999 2000
Private consumption 9,937,697 19,619,096 36,122,555 55,927,761 88,977,627 (69.3) (68.3) (67.5) (67.4) (69.8)
Government consumption 1,709,247 3,535,104 6,632,766 11,747,738 17,495,884 (11.9) (12.3) (12.4) (14.2) (13.7)
Gross fixed investment 3,706,404 7,618,372 12,839,212 16,930,592 27,688,469 (25.8) (26.5) (24.0) (20.4) (21.7)
Stockbuilding –79,656 –377,455 –211,639 1,148,533 2,427,531 (–1.3) (–1.3) (–0.4) (1.4) (1.9)
Exports of goods & services 3,182,305 7,088,355 12,713,300 17,972,068 29,775,104 (22.2) (24.7) (23.8) (21.7) (23.4)
Imports of goods & services 4,110,584 8,762,823 14,573,224 20,801,155 38,940,171 (28.7) (30.5) (27.2) (25.1) (30.6)
GDP 14,345,413 28,720,649 53,522,970 82,925,537 127,424,444
Source: State Institute of Statistics.

Turkey 61
© The Economist Intelligence Unit Limited 2001 EIU Country Profile 2001
Reference table 9
Gross domestic product by expenditure(TL bn at constant 1987 prices; % change year on year in brackets)
1996 1997 1998 1999 2000
Private consumption 71,614 77,620 78,113 76,077 80,935 (8.5) (8.4) (0.6) (–2.6) (6.4)
Government consumption 8,047 8,379 9,036 9,623 10,304 (8.6) (4.1) (7.8) (6.5) (7.1)
Gross fixed investment 30,598 35,137 33,768 28,473 33,166(14.1) (14.8) (–3.9) (–15.7) (16.5)
Stockbuilding –501 –1,420 –446 1,896 2,793 (–2.3)a (–0.9)a (0.9)a (2.0)a (0.8)a
Exports of goods & services 26,521 31,593 35,383 32,890 39,233 (22.0) (19.1) (12.0) (–7.0) (19.3)
Imports of goods & services 31,376 38,417 39,313 37,876 47,481 (20.5) (22.4) (2.3) (–3.7) (25.4)
GDP 104,903 112,892 116,541 111,083 118,950 (7.4) (7.6) (3.2) (–4.7) (7.1)
a Change as a percentage of GDP in the previous year.
Source: State Institute of Statistics.
Reference table 10
Gross value added by sector(TL trn at current producer prices; % of total in brackets)
1996 1997 1998 1999 2000
Agriculture 2,490 4,170 9,113 11,851 18,111 (16.6) (14.3) (17.0) (14.9) (14.6)
Industry excl construction 3,717 7,293 11,970 17,974 28,926 (24.7) (24.9) (22.3) (22.6) (23.3)
Construction 858 1,743 3,125 4,362 6,561 (5.7) (6.0) (5.8) (5.5) (5.3)
Services 7,959 16,029 29,520 45,198 70,675 (53.0) (54.8) (54.9) (56.9) (56.9)
Gross value added 15,023 29,236 53,728 79,385 124,273 (100.0) (100.0) (100.0) (100.0) (100.0)
Source: State Institute of Statistics.

62 Turkey
EIU Country Profile 2001 © The Economist Intelligence Unit Limited 2001
Reference table 11
Gross value added by sector(TL bn at 1987 producer prices; % change year on year in brackets)
1996 1997 1998 1999 2000
Agriculture 15,284 14,927 16,176 15,369 16,005 (4.4) (–2.3) (8.4) (–5.0) (4.1)
Industry (excl construction) 29,743 32,835 33,494 31,814 33,602 (7.1) (10.4) (2.0) (–5.0) (5.6)
Construction 6,200 6,511 6,560 5,739 6,071 (5.8) (5.0) (0.7) (–12.5) (5.8)
Services 50,953 54,984 56,694 54,981 58,759 (6.5) (7.9) (3.1) (–3.0) (6.9)
Gross value added 102,181 109,258 112,924 107,903 114,437(6.3) (6.9) (3.4) (–4.4) (6.1)
Source: State Institute of Statistics.
Reference table 12
Prices and earnings(% change, year on year)
1996 1997 1998 1999 2000
Consumer prices (av) 80.4 85.7 84.6 65.1 54.9
Consumer prices (year-end) 79.8 99.1 69.7 68.8 39.0
Wholesale prices (av) 75.9 81.8 71.8 53.2 51.6
Wholesale prices (year-end) 84.9 91.0 54.3 62.9 32.7
Hourly wages of production workers in manufacturing (av) 91.6 84.1 83.1 55.7 n/a
Source: State Institute of Statistics.
Reference table 13
Agricultural production(‘000 tonnes unless otherwise indicated)
1995 1996 1997 1998 1999
CerealsWheat 18,000 18,500 18,650 21,000 18,000Barley 7,500 8,000 8,200 9,000 7,700Maize 1,900 2,000 2,080 2,320 2,297
Industrial cropsSugarbeet 11,171 14,383 18,553 22,283 16,854Cotton 856 804 810 876 886Tobacco 204 232 286 251 251
Oil seedsCotton seed 1,368 1,285 1,295 1,400 1,415Sunflower 900 780 900 860 950
Tuber cropsPotatoes 4,750 4,950 5,100 5,250 6,000Dry onions 2,850 1,900 2,100 2,270 2,500
Fruit-bearing vegetablesWater melons & melons 5,400 5,800 5,550 5,815 5,725Tomatoes 7,250 7,800 6,600 8,290 8,956
continued

Turkey 63
© The Economist Intelligence Unit Limited 2001 EIU Country Profile 2001
1995 1996 1997 1998 1999
Fruit & nutsGrapes & figs 3,850 3,990 3,943 3,855 3,675Citrus fruits 1,782 1,820 1,433 1,944 2,263Hazelnuts 455 446 410 580 530Apples 2,100 2,200 2,550 2,450 2,500Olives 515 1,800 510 1,650 600
Tea 523 600 752 979 1,09
Value added in agriculture (at 1987 prices; TL bn) 14,640 15,284 14,927 16,176 15,426
Sources: State Planning Organisation, Main Economic Indicators ; State Institute of Statistics.
Reference table 14
Livestock numbers(‘000 head)
1995 1996 1997 1998 1999
Cattle 11,789 11,886 11,185 11,031 11,054
Goats 8,397 8,242 7,761 7,523 7,284
Sheep 33,791 33,072 30,238 29,435 30,256
Sources: Central Bank of Turkey, Annual Report, 1998; Ministry of Agriculture; State Institute of Statistics.
Reference table 15
Minerals production(‘000 tonnes unless otherwise indicated)
1996 1997 1998 1999 2000a
Lignite 57,930 52,047 65,084 64,897 59,661
Hard coal 2,691 2,411 3,335 2,738 3,330
Iron ore 6,404 6,750 n/a n/a n/a
Chrome ore 1,386 1,450 1,428 1,015 531
Crude oil 3,500 3,457 3,224 2,939 2,748
a Provisional.
Source: State Institute of Statistics.
Reference table 16
Manufacturing production(1997=100; % change, year on year)
1996 1997 1998 1999 2000
Total manufacturing 7.5 12.1 0.1 –4.2 6.5 of which: food & beverages 9.4 8.0 0.8 –0.4 3.7 textiles 10.3 8.7 –6.4 –7.1 10.0 clothes 4.4 1.1 6.7 –4.4 6.6 refinery products –2.9 4.4 2.1 –4.0 –11.4 chemicals 10.2 14.5 0.3 1.5 9.0 non-metallic goods 5.1 12.6 6.8 –5.9 7.7 metals 7.7 9.6 0.5 –1.8 3.7 non-electrical machinery & equipment 13.7 22.5 –2.6 –11.1 6.7 motor vehicles 14.4 24.8 –3.7 –18.6 47.8
Sources: State Institute of Statistics; Central Bank of Turkey.

64 Turkey
EIU Country Profile 2001 © The Economist Intelligence Unit Limited 2001
Reference table 17
Construction statistics1996 1997 1998 1999 2000
Construction permitsArea (‘000 sq metres) 78,478 88,389 78,569 62,762 58,605Value (TL bn) 1,237,925 2,574,237 4,197,013 4,970,995 6,780,395
Occupancy permitsArea (‘000 sq metres) 41,765 45,167 42,167 36,500 41,413Value (TL bn) 659,075 1,378,974 2,254,934 3,081,051 4,754,865
Source: State Institute of Statistics.
Reference table 18
The stockmarket
1996 1997 1998 1999 2000
Traded value (annual; US$ m) 37,737 58,104 70,396 84,034 181,934
Traded value (daily average; US$ m) 153 231 284 356 740
No. of stocks traded (annual; m) 390,924 919,784 2,242,531 5,823,858 11,075,685
No. of stocks traded (daily average; m) 1,583 3,650 9,042 24,677 45,023
No. of contracts (annual; ‘000) 12,446 17,639 21,571 25,785 32,427
No. of contracts (daily average; ‘000) 50 70 87 109 132
National 100 index (1986=100, dollar-based, year-end) 534 982 484 1,654 681
Source: Istanbul Stock Exchange.
Reference table 19
Exportsa
(US$ m; fob)
1996 1997 1998 1999 2000
Agriculture, hunting, forestry & fisheries 2,481 2,712 2,717 2,432 1,990
Mining & quarrying 369 404 364 385 400
Manufacturing 20,358 23,132 23,873 23,755 25,059
Total incl others 23,224 26,261 26,974 26,587 27,485
a Excluding “suitcase” trade.
Source: State Institute of Statistics.
Reference table 20
Importsa
(US$ m; cif)
1996 1997 1998 1999 2000
Agriculture, hunting, forestry & fisheries 2,172 2,421 2,130 1,655 2,125
Mining & quarrying 5,090 5,138 3,766 4,254 7,101
Manufacturing 36,339 40,908 39,914 34,688 44,673
Total incl others 43,627 48,559 45,921 40,687 54,150
a Excluding “suitcase” trade.
Sources: State Planning Organisation, Main Economic Indicators; State Institute of Statistics.
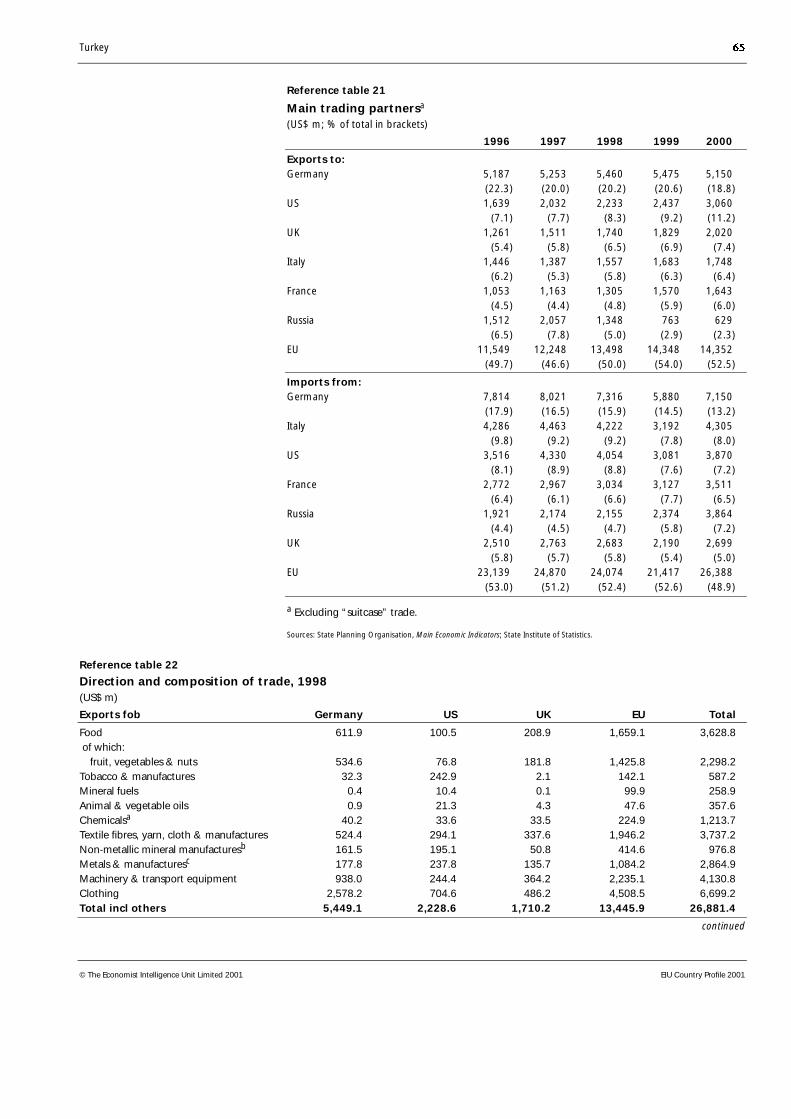
Turkey 65
© The Economist Intelligence Unit Limited 2001 EIU Country Profile 2001
Reference table 21
Main trading partnersa
(US$ m; % of total in brackets)
1996 1997 1998 1999 2000
Exports to:Germany 5,187 5,253 5,460 5,475 5,150
(22.3) (20.0) (20.2) (20.6) (18.8)US 1,639 2,032 2,233 2,437 3,060
(7.1) (7.7) (8.3) (9.2) (11.2)UK 1,261 1,511 1,740 1,829 2,020
(5.4) (5.8) (6.5) (6.9) (7.4)Italy 1,446 1,387 1,557 1,683 1,748
(6.2) (5.3) (5.8) (6.3) (6.4)France 1,053 1,163 1,305 1,570 1,643
(4.5) (4.4) (4.8) (5.9) (6.0)Russia 1,512 2,057 1,348 763 629
(6.5) (7.8) (5.0) (2.9) (2.3)EU 11,549 12,248 13,498 14,348 14,352
(49.7) (46.6) (50.0) (54.0) (52.5)
Imports from:Germany 7,814 8,021 7,316 5,880 7,150
(17.9) (16.5) (15.9) (14.5) (13.2)Italy 4,286 4,463 4,222 3,192 4,305
(9.8) (9.2) (9.2) (7.8) (8.0)US 3,516 4,330 4,054 3,081 3,870
(8.1) (8.9) (8.8) (7.6) (7.2)France 2,772 2,967 3,034 3,127 3,511
(6.4) (6.1) (6.6) (7.7) (6.5)Russia 1,921 2,174 2,155 2,374 3,864
(4.4) (4.5) (4.7) (5.8) (7.2)UK 2,510 2,763 2,683 2,190 2,699
(5.8) (5.7) (5.8) (5.4) (5.0)EU 23,139 24,870 24,074 21,417 26,388
(53.0) (51.2) (52.4) (52.6) (48.9)
a Excluding “suitcase” trade.
Sources: State Planning Organisation, Main Economic Indicators; State Institute of Statistics.
Reference table 22
Direction and composition of trade, 1998(US$ m)
Exports fob Germany US UK EU Total
Food 611.9 100.5 208.9 1,659.1 3,628.8 of which: fruit, vegetables & nuts 534.6 76.8 181.8 1,425.8 2,298.2Tobacco & manufactures 32.3 242.9 2.1 142.1 587.2Mineral fuels 0.4 10.4 0.1 99.9 258.9Animal & vegetable oils 0.9 21.3 4.3 47.6 357.6Chemicalsa 40.2 33.6 33.5 224.9 1,213.7Textile fibres, yarn, cloth & manufactures 524.4 294.1 337.6 1,946.2 3,737.2Non-metallic mineral manufacturesb 161.5 195.1 50.8 414.6 976.8Metals & manufacturesc 177.8 237.8 135.7 1,084.2 2,864.9Machinery & transport equipment 938.0 244.4 364.2 2,235.1 4,130.8Clothing 2,578.2 704.6 486.2 4,508.5 6,699.2Total incl others 5,449.1 2,228.6 1,710.2 13,445.9 26,881.4
continued

66 Turkey
EIU Country Profile 2001 © The Economist Intelligence Unit Limited 2001
Imports cif Germany Italy US EU Total
Food 74.5 32.1 193.0 308.1 1,154.1 of which: cereals & preparations 37.1 18.1 120.8 90.3 503.8Mineral fuels 17.5 57.6 145.2 335.4 3,624.5Animal & vegetable oils 16.6 18.5 115.4 127.7 536.8Chemicalsa 1,259.0 607.2 573.3 4,435.8 6,888.8Paper & manufactures 146.3 52.0 29.4 519.2 719.2Textile fibres, yarn, cloth & manufactures 379.9 313.2 336.7 1,313.2 3,330.1Metals & manufacturesc 576.8 300.7 157.2 2,077.7 4,767.0 of which: iron & steel & manufacturesc 375.5 246.4 109.3 1,479.8 3,431.8 non-ferrous metals & manufacturesc 130.5 50.1 25.8 366.5 1,002.8Machinery incl electric 2,891.3 1,815.6 1,085.0 8,998.0 13,322.8Road vehicles & tractors 1,130.7 279.1 81.5 2,692.7 3,724.9Aircraft 39.5 6.5 617.3 171.8 796.0Other transport equipment 14.1 5.1 9.2 71.4 270.6Total incl others 7,310.8 4,234.8 4,043.5 24,076.8 45,908.2
a Including manufactures of plastics. b Including precious metals & jewellery. c Including scrap.
Source: UN, External Trade Statistics; series D.
Reference table 23
Balance of payments, Central Bank of Turkey series(US$ m)
1996 1997 1998 1999 2000
Merchandise exports fob 32,446 32,647 31,220 29,325 31,375 of which: suitcase trade 8,842 5,849 3,689 2,255 2,944
Merchandise imports fob –43,028 –48,005 –45,440 –39,768 –53,712
Trade balance –10,582 –15,358 –14,220 –10,443 –22,337
Other goods, services & income (credit) 14,628 21,273 25,802 18,748 22,320 Travel 5,650 7,002 7,177 5,203 7,636 Interest 1,577 1,900 2,481 2,350 2,836 Other 7,401 12,371 16,144 11,195 11,848
Other goods, services & income (debit) –10,930 –13,419 –15,325 –14,840 –14,975 Travel –1,265 –1,716 –1,754 –1,471 –1,711 Interest –4,200 –4,588 –4,823 –5,450 –6,299 Other –5,465 –7,115 –8,748 –7,919 –6,965
Private unrequited transfers (credit) 3,892 4,552 5,568 4,813 5,011 of which: workers’ remittances 3,542 4,197 5,356 4,529 4,560
Private unrequited transfers (debit) 0 0 0 0 0
Official unrequited transfers (credit) 555 314 159 362 214 Workers’ remittances 48 32 41 47 43 Other 507 282 118 315 171
Current-account balance –2,437 –2,638 1,984 –1,360 –9,767
Capital (excl reserves) 5,555 7,053 –755 4,670 9,445 Direct investment (net) 612 554 573 138 112 Portfolio investment (net) 570 1,634 –6,711 3,429 1,022 Other long-term capital (net) 1,636 4,788 3,985 344 4,276 Short-term capital (net) 2,737 77 1,398 759 4,035
continued
Turkey 67
© The Economist Intelligence Unit Limited 2001 EIU Country Profile 2001
1996 1997 1998 1999 2000
Net errors & omissions 1,427 –1,071 –782 1,896 –2,675
Overall balance 4,545 3,344 447 5,206 –2,997
Total change in reserves –4,545 –3,344 –447 –5,206 2,997 IMF 0 –28 –231 520 3,351 Reserve position in the Fund 0 0 0 –112 0 Official reserves –4,545 –3,316 –216 –5,614 –354
Source: Central Bank of Turkey.
Reference table 24
Balance of payments, IMF series(US$ m)
1995 1996 1997 1998 1999
Goods: exports fob 21,975 32,446 32,647 31,220 29,326
Goods: imports fob –35,187 –43,028 –48,005 –45,328 –39,773
Trade balance –13,212 –10,582 –15,358 –14,108 –10,447
Services: credit 14,606 13,051 19,373 23,321 16,398
Services: debit –5,024 –6,426 –8,831 –9,859 –8,953
Income: credit 1,489 1,577 1,900 2,481 2,350
Income: debit –4,693 –4,504 –4,588 –5,466 –5,887
Current transfers: credit 4,512 4,466 4,909 5,860 5,294
Current transfers: debit –16 –19 –43 –133 –119
Current-account balance –2,338 –2,437 –2,638 2,096 –1,364
Direct investment in Turkey 885 722 805 940 783
Direct investment abroad –113 –110 –251 –367 –645
Inward portfolio investment 76 372 369 –4,888 965
Outward portfolio investment –466 –1,380 –710 –1,622 –759
Other investment assets –383 331 –1,750 –1,464 –2,571
Other investment liabilities 4,017 7,250 8,178 8,050 3,675
Financial balance 4,016 7,185 6,641 649 1,448
Capital account nie balance 0 0 0 0 0
Net errors & omissions 2,355 –1,782 –2,594 –1,991 1,897
Overall balance 4,660 4,544 3,343 441 5,204
Financing (– indicates inflow)Movement of reserves –5,246 –3,983 –2,234 –572 –3,737Use of IMF credit & loans 341 0 0 0 797
Source: IMF, IFS.

68 Turkey
EIU Country Profile 2001 © The Economist Intelligence Unit Limited 2001
Reference table 25
External debt(US$ m unless otherwise indicated; debt stocks as at year-end)
1996 1997 1998 1999 2000
Public medium- & long-term 51,598 50,217 52,564 53,764 60,563
Private medium- & long-term 10,628 16,533 23,116 25,789 24,850
Total medium- & long-term debt 62,226 66,750 75,680 79,553 85,412 Official creditors 18,682 17,214 17,858 16,970 19,684 Bilateral 9,807 9,140 9,855 9,186 8,528 Multilateral 8,875 8,073 8,003 7,784 11,156 Private creditors 43,554 49,536 57,821 62,583 65,728
Short-term debt 17,345 18,047 21,217 23,472 28,912
Total external debt 79,571 84,797 96,897 103,025 114,324
Principal repayments 7,218 7,830 11,690 12,866 15,538
Interest payments 4,200 4,588 4,823 5,450 6,299
Total debt service 11,418 12,418 16,513 18,316 21,837
Ratios (%)Total external debt/GNP 43.2 43.9 47.3 55.3 56.6Debt-service ratioa 22.4 21.2 26.4 34.6 37.5
a Debt service as a percentage of earnings from exports of goods and services.
Sources: Under-secretariat of the Treasury.
Reference table 26
Foreign reserves(US$ m unless otherwise indicated; end-period)
1996 1997 1998 1999 2000
Total international reserves excl gold 16,436 18,658 19,489 23,340 19,952
Golda 1,372 1,384 1,125 1,011 1,099
Total reserves incl gold 17,808 20,042 20,614 24,351 20,961
Gold (m fine troy oz)b 3.7 3.7 3.7 3.7 3.7
a Valued at 75% of the fourth-quarter London price. b National valuation.
Source: IMF, IFS.
Reference table 27
Exchange rates(TL per unit of currency unless otherwise indicated; annual averages)
1996 1997 1998 1999 2000
US$ 81,405 151,865 260,724 418,783 625,218
DM 54,097 87,547 148,164 228,434 295,318
Ecu/€ 103,222 172,230 292,011 446,164 577,592
¥ (100) 74,836 125,519 199,174 367,652 580,195
Source: IMF, IFS.
Editors: Robert O’Daly (editor); Merli Baroudi (consulting editor)Editorial closing date: June 1st 2001
All queries: Tel: (44.20) 7830 1007 E-mail: [email protected]