Embed Size (px)
Citation preview
Turf, Trees, and Canopy Cover
ESPM 4041W Problem Solving for Environmental Change
University of Minnesota -
College of Food, Agricultural and
Natural Resource Sciences
Report 1/9
Prepared by:
Thomsen Jordheim - Leader
Claudia Althoen - Liaison
Gabrielle Groath
Ethan Jung
Sadie Loose
December 6, 2018
Table of Contents List of Figures……………………………………………………………………………………1 List of Tables………………………………………………………………….……………..…..1
Acknowledgements……………………………………………………………………………..2
Executive Summary…………………………………………………………...........................3
Introduction……………………………………………………………………………………....5
Mission/Vision Statements……………………………………………………………………..8
Study Area……………………………………………………………………………………….9
Parks……………………………………………………………………………………..9
Boulevards…………………………………………………………………………...…10
Goals and Objectives………………………………………………………………………….11
Methods………………………………………………………………………………………...12
Communities and Parks Selected for Field Data…………………………………..12
Field Methods…………………………………………………………….…………….13
Randomized Selection of Inventoried Trees………………………….………….....14
Assessing Level of Damage to Trees……………………………………………….15
Findings………………………………………………………………………………………...16
Park Trees Damage Rates…………………………………………………………...16
Damage Ranking Survey……………………………………………………………..18
Relevance………………………………………………………………………………………19
Recommendations…………………………………………………………………………….20
Public Awareness……………………………………………………………………...20
Physical Preventative Measures……………………………………………………..21
Conclusion……………………………………………………………………………………...22
References and Sources……………………………………………………………………...23
Glossary………………………………………………………………………………………...25
Appendices……………………………………………………………………………………..26
A. Table of neighborhoods and communities in Minneapolis.…………………….26
B. Generated Avenza© maps of Folwell, Deming Heights, and Phelps Park.….28
C. Examples of Tree Damage Severity Rankings.…………………………………31
D. Data Ownership Statement.……………………………………………………….34
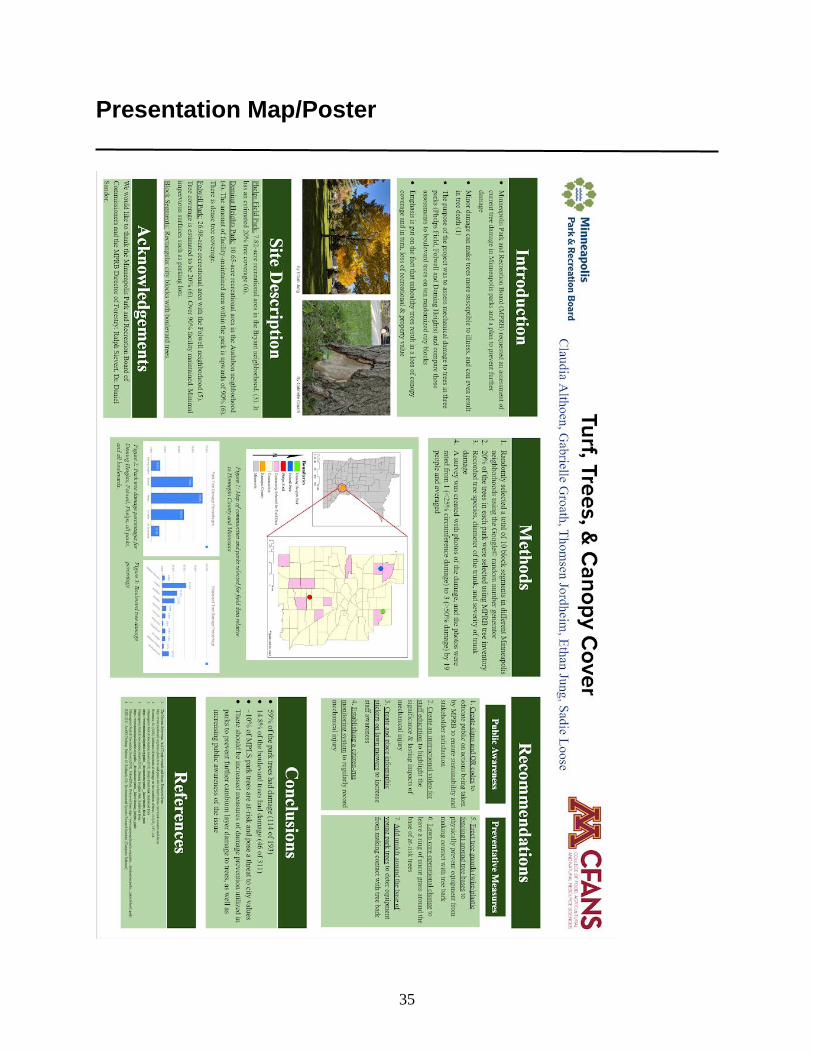
Presentation Map/Poster……………………………………………………………………...35
1
List of Figures
Figure 1. Map of Minneapolis parks studied for the collective projects of ESPM
4041W…………………………………………………………………………………....6
Figure 2. Aerial satellite photos of block segments A-J with description of cross-
streets……………………………………………………………………………………11
Figure 3. Map of Communities and Parks Selected for Field Data Relative to Hennepin County
and Minnesota…………………………………………………………………………..13
Figure 4. Park tree damage percentages for Deming Heights, Folwell, Phelps park, and all
boulevards………………………………………………………………………………16
Figure 5. Trees Below 8” and Damaged………………………………………………………...17
Figure 6. Boulevard Tree Damage Percentage………………………………………………….18
Figure 7. All Trees Damage Rankings…………………………………………………………..19
List of Tables
Table 1. Park name, the total amount of trees within each park, and the number of sampled trees
for data collection, 2018. ……………………………………………………………….14
Table 2. Cambium layer damage severity scale in percentages, 2018…………………………..15
2
Acknowledgments
We would like to thank the Minneapolis Park and Recreation Board of Commissioners and the
MPRB Director of Forestry: Ralph Sievert, Dr. Daniel Sandor.
3
Executive Summary
The Minneapolis Park and Recreation Board (MPRB) Department of Forestry—responsible for
the management and care of all parks in the City of Minneapolis—determined a need to assess the
damage to trees in Minneapolis parks caused by contact with lawn care vehicles.
The assessment consisted of documenting mechanical damage to trees on the boulevards of ten
Minneapolis city blocks that were chosen at random, and twenty percent of the trees in three
Minneapolis parks (Folwell Park, Deming Heights Park, and Phelps Park). In addition to wanting
an assessment of current levels of mechanical damage to trees in Minneapolis parks, MPRB
Department of Forestry has been looking for potential solutions to prevent further damage to park
trees.
Environmental Sciences, Policy and Management (ESPM) students from the University of
Minnesota-Twin Cities taking the capstone course “Problem Solving for Environmental Change”
(ESPM 4041W) partnered with the MPRB Department of Forestry to assess tree damage in
Minneapolis parks caused by lawn care equipment. They were also asked to develop potential
solutions to prevent further tree damage and to test whether future tree damage assessments can
be taken on by non-expert citizen volunteers.
The damage assessment was designed to compare the tree damage on city block boulevards to the
tree damage in city parks. This comparison was intended to show the difference between amounts
of tree damage in areas that are managed by private citizens and areas maintained by park
employees. The selection of boulevards and trees within parks were chosen using a random number
generator. Each tree that was sampled for the assessment was identified by species and had its
circumference and DBH (Diameter at Breast Height) measured. If there was visible damage to
trees, the team member recording tree data also took a picture of the damage.
All of the tree damage pictures were compiled in a survey made with Google Forums©. The survey
was divided into sections. The first section included basic questions such as name, email, and
4
identifying whether the surveyor had knowledge in dendrology and whether they understood the
instructions of how to rank the damage. The other sections were split between park and boulevard
trees.
Compiling the survey results showed that there was a significant number of trees that could be
considered at-risk. The amount of cambium damage has lasting and detrimental effects on the
tree’s health and could determine its ability to grow and mature properly. These at-risk trees could,
if at an immature growth stage, have their growth stunted, and this, in turn, could prevent these
trees from maintaining a sprawling canopy, resulting in shade coverage loss in parks.
Unfortunately, tree death is also a possibility with at-risk trees. Without action, these trees could
be lost, incurring cleanup costs, loss of recreational value, loss of property value, and possibly be
considered an ‘eyesore’ in a park. These consequences reflect poorly on the care provided by its
stewards, MPRB Department of Forestry. However, with action, canopy coverage can be saved
and even expanded while increasing recreational, property value, and the reputation and
confidence in MPRB Department of Forestry.
Recommendations (brief)
Install signs with QR codes that explain MPRB Department of Forestry action and promote
citizen science participation
Consider the practice of leaving a ring of uncut grass at the base of high-risk trees
Install plastic/metal guards to prevent mechanical injury physically
Mulch the base of high-risk trees to deter mechanical injury
Update the current version of the instructional video for lawn care service providers
Design and install infographic/statement stickers as on-site reminders of proper practice
that can also be placed on turf care equipment
Establish a citizen-based monitoring program to assess mechanical injury regularly
5
Introduction
For the last six years, the city of Minneapolis has been ranked as the top park district in the
United States (Zamora, 2018). Minneapolis is the largest city in Minnesota—a state located just
west of the Great Lakes (Figure 1)—with a population of 422,331 people (Census, 2017). This
report was made for the Minneapolis Park and Recreation Board [MPRB] Department of
Forestry, MPRB commissioners, staff members, individuals involved in the parks (i.e.,
groundskeepers, community center directors, silviculturists, and environmentalists), and
stakeholders (i.e., park patrons & community members). A unique and relevant aspect of the
Minneapolis Park and Recreation Board is that it has a tax base and a working budget of over
$60.5 million for 2018 fiscal year (Budget, MPRB website).
6
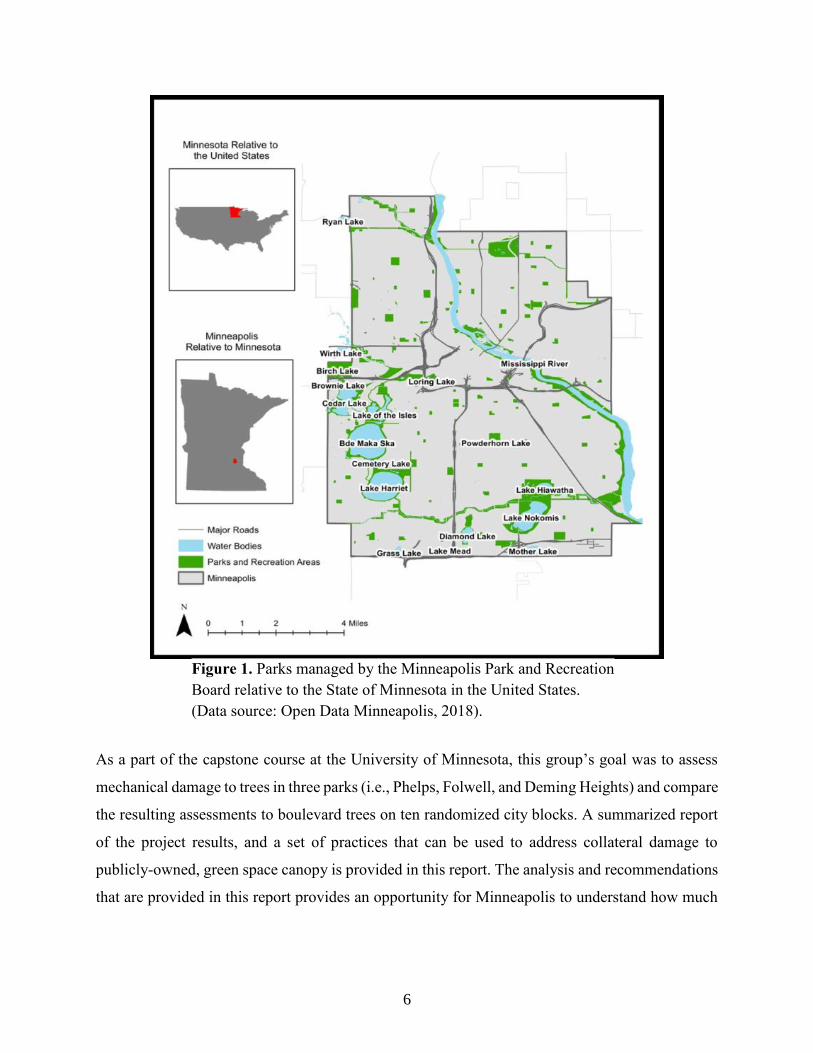
Figure 1. Parks managed by the Minneapolis Park and Recreation
Board relative to the State of Minnesota in the United States.
(Data source: Open Data Minneapolis, 2018).
As a part of the capstone course at the University of Minnesota, this group’s goal was to assess
mechanical damage to trees in three parks (i.e., Phelps, Folwell, and Deming Heights) and compare
the resulting assessments to boulevard trees on ten randomized city blocks. A summarized report
of the project results, and a set of practices that can be used to address collateral damage to
publicly-owned, green space canopy is provided in this report. The analysis and recommendations
that are provided in this report provides an opportunity for Minneapolis to understand how much
7
seemingly insignificant mechanical injuries to young trees affect their lifespan and in turn, the total
canopy coverage for its parks and streets.
Canopy coverage is essential for the creation of shade and contributes to both the aesthetics of the
park and the enjoyment of park patrons and other stake-holders. Green space in Minneapolis is
invaluable for communal and private gatherings, and individual usage. The high use and value of
green space is why it is essential to assess tree damage caused by lawn mowers and weed trimmers
in the parks and boulevards of Minneapolis and to develop a plan to prevent further damage. As
expected, most urban trees incur some damage to their bark layer during their lifespan. Such
damage can happen due to biking and other sports, animals nesting in trees, disease, and natural
events like wind damage from storms. While trees can tolerate some injuries, other damage can
impact the trees’ lifespan and growth (The Morton Arboretum, n.d.).
Minor damages can make trees more susceptible to illness, while injuries that extend around the
entire trunk can result in tree death (The Morton Arboretum, n.d.). A vital layer in trees is the
cambium layer, the thin layer of living tree tissues just inside the bark (Kosmala, 2008). The
cambium layer is responsible for tissue production that transports water and nutrients up and down
the tree (Kosmala, 2008). Consequences of significant damage to the cambium layer include a
reduction in canopy coverage due to premature tree deaths, ergo, a loss of the natural shade in a
park.
8
Mission/Vision Statements
MPRB
In 2020, the Minneapolis Park System is a premier destination that welcomes and captivates
residents and visitors. The Park System and its beauty are part of daily life and shape the character
of Minneapolis. Natural, cultural, artistic, historical, and recreational resources cultivate
outstanding experiences, health, enjoyment, fun, and learning for all people. The Park System is
sustainable, well-maintained and safe, and meets the needs of individuals, families, and
communities. The focus on preserving land continues, with a strong emphasis on connecting
people to the land and each other. Aware of its value to their lives, residents are proud stewards
and supporters of an extraordinary park and recreation system (Mission, Vision & Values, MPRB
website).
Class
These reports seek to work collaboratively with fellow students, the Minneapolis Park and
Recreation Board Department of Forestry, and community members to create innovative and
effective policies, tools, and experiences based on scientific research that can be available to
current and future generations. Solutions will be equitable and sustainable, aligning with
Minneapolis Park and Recreation Board values while fostering a welcoming environment for all.
Group
In 2020, the MPRB Department of Forestry is well informed and has a clear understanding of the
severity and importance of tree health and are fully aware of the consequences caused by
mechanical injury either by MPRB Department of Forestry service staff or citizens. Canopy
coverage is on a positive trend, and park patrons are enjoying the additional shade for the
increasingly warm summers.
9
Study Area
This report covers two areas of focus: Minneapolis parks and Minneapolis boulevards and the trees
they contain. Each park is managed by the facility management group of MPRB Department of
Forestry. The boulevards are managed by either private residents or the facility management group,
depending on the size and location of the boulevard. Generally, they are maintained by the nearest
resident.
Parks
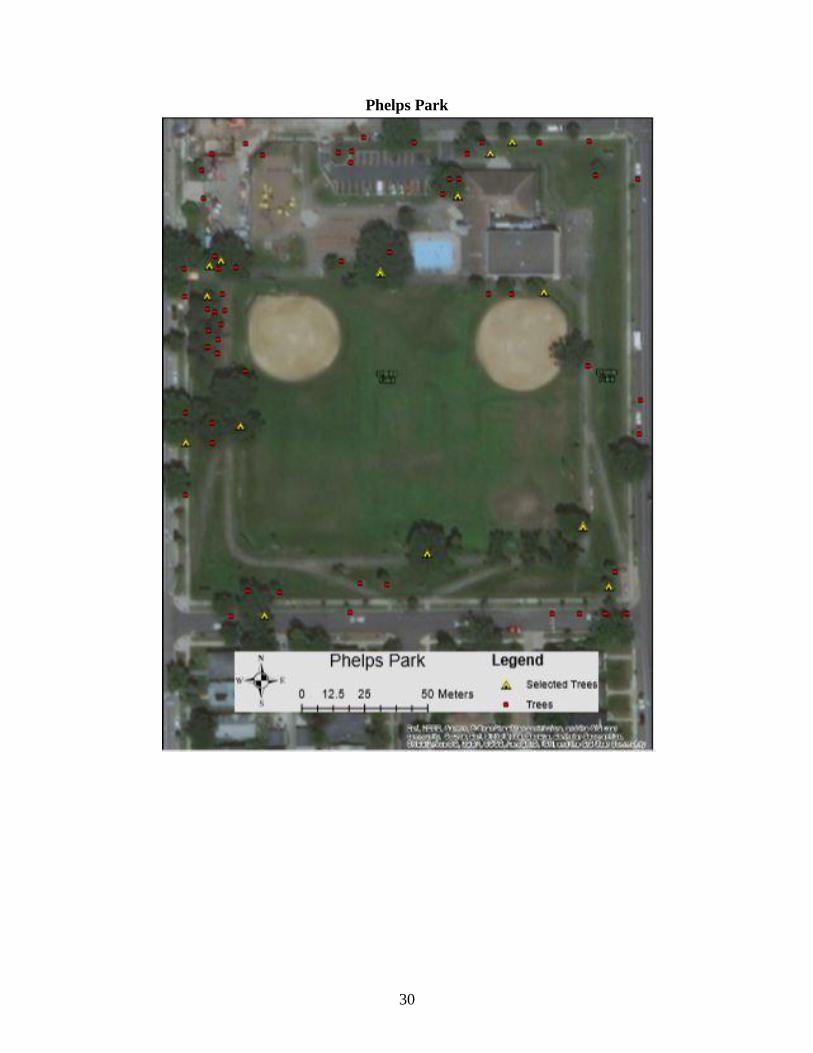
Phelps Field Park
Phelps Field Park is a 7.82-acre recreation area located in the Bryant neighborhood of Minneapolis
in commissioners district 5 (Phelps Field Park, MRPB website). It has an estimated 20% tree
coverage because it is mostly dominated by multi-use sports fields and diamonds and these areas
are maintained by facility management. (ArcMap through © ArcGIS 2018 ESRI)
701 E 39th St.
Minneapolis, MN 55407
Deming Heights
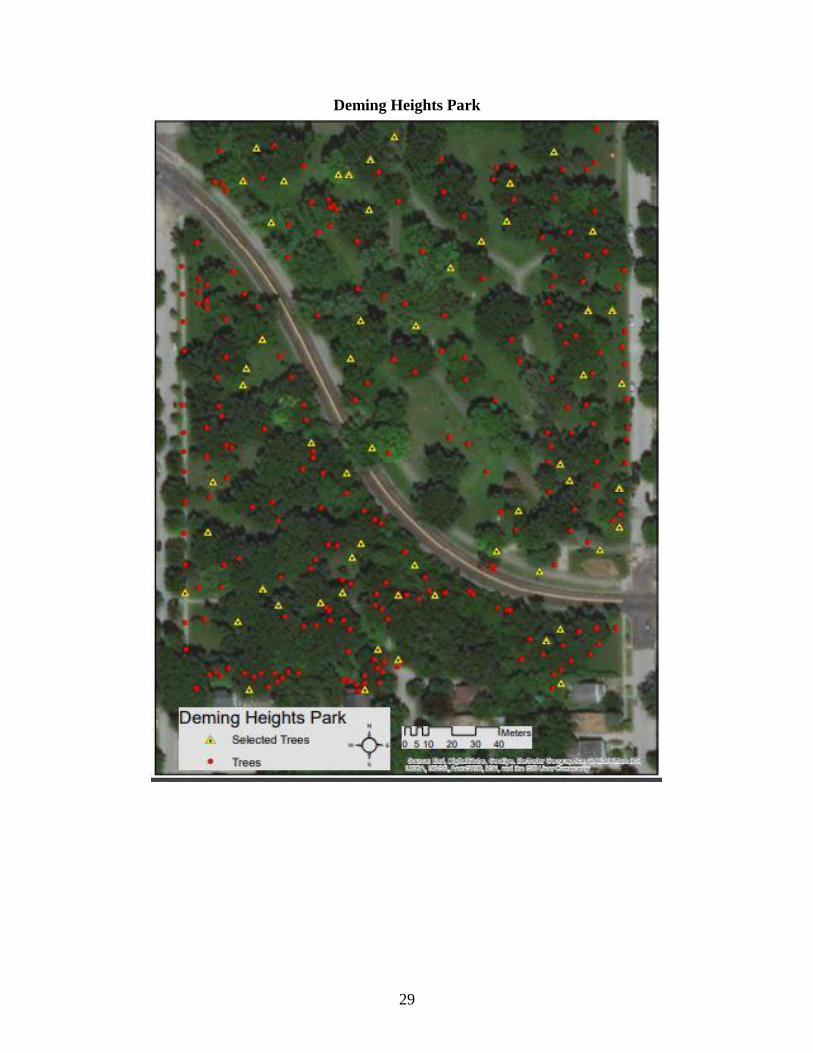
Deming Heights Park is a 10.65-acre recreational area within the Audubon neighborhood (Deming
Heights Park, MRPB website). The amount of maintained area within the park is upwards of 90%
(ArcMap through © ArcGIS 2018 ESRI). There is dense tree coverage, making the likelihood of
mechanical damage to trees higher than a park with more dispersed trees, such as Phelps Park.
1115 St. Anthony Parkway
Minneapolis, MN 55418
10
Folwell
Folwell Park is a 26.98-acre recreation area with the Folwell neighborhood (Folwell Park, MRPB
website). Tree coverage is widespread in the park, and is estimated to be approximately 20%
(ArcMap through © ArcGIS 2018 ESRI). Folwell Park is estimated to be over 90% managed with
only a small percentage of impervious surfaces such as parking lots that would not require facility
maintenance.
1615 N Dowling Ave.
Minneapolis, MN 55412
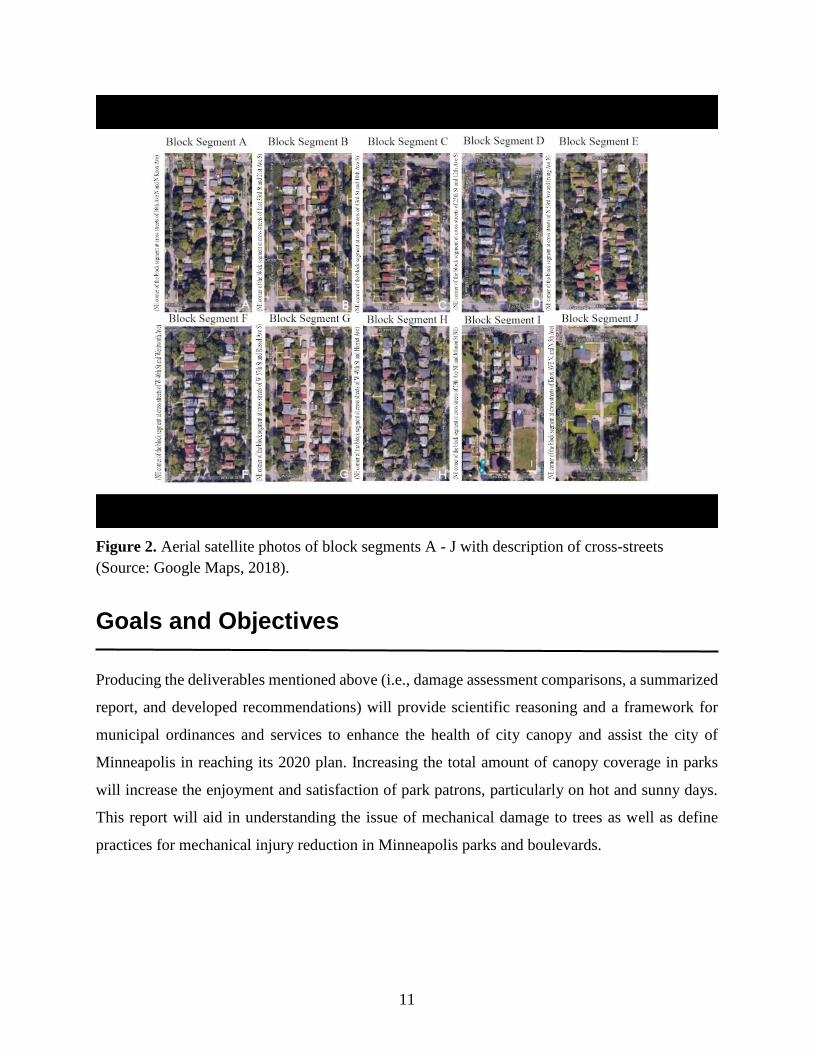
Block Segments
Block segments are rectangular city blocks that include boulevard trees (public trees located
between the curb and sidewalk in front of houses). Ten separate and randomized rectangular city
block segments were chosen for Minneapolis and are listed here in satellite view (© Google Maps)
and are listed as segments A through J (Figure 2).
11
Figure 2. Aerial satellite photos of block segments A - J with description of cross-streets
(Source: Google Maps, 2018).
Goals and Objectives
Producing the deliverables mentioned above (i.e., damage assessment comparisons, a summarized
report, and developed recommendations) will provide scientific reasoning and a framework for
municipal ordinances and services to enhance the health of city canopy and assist the city of
Minneapolis in reaching its 2020 plan. Increasing the total amount of canopy coverage in parks
will increase the enjoyment and satisfaction of park patrons, particularly on hot and sunny days.
This report will aid in understanding the issue of mechanical damage to trees as well as define
practices for mechanical injury reduction in Minneapolis parks and boulevards.
12
Methods
Communities and Parks Selected for Field Data A table of eleven randomly selected block segments of Minneapolis neighborhoods and
communities was made (Appendix A). Each neighborhood was designated a number one through
eleven, and the communities within them were also assigned a number (Appendix A).
© Google’s number generator was used to choose the neighborhood and community.
When choosing the neighborhoods, the maximum number was set to eleven to give an equal chance
for each one. When selecting the community after the neighborhood was determined, the
maximum number was adjusted (weighted) to how many communities were in that neighborhood
(Figure 3). For example, when the neighborhood Camden was selected, the maximum number was
set to eight. The minimum number was always set to one. Ten numbers were generated to pick the
neighborhoods, and a total of ten numbers were generated to select the communities.
13
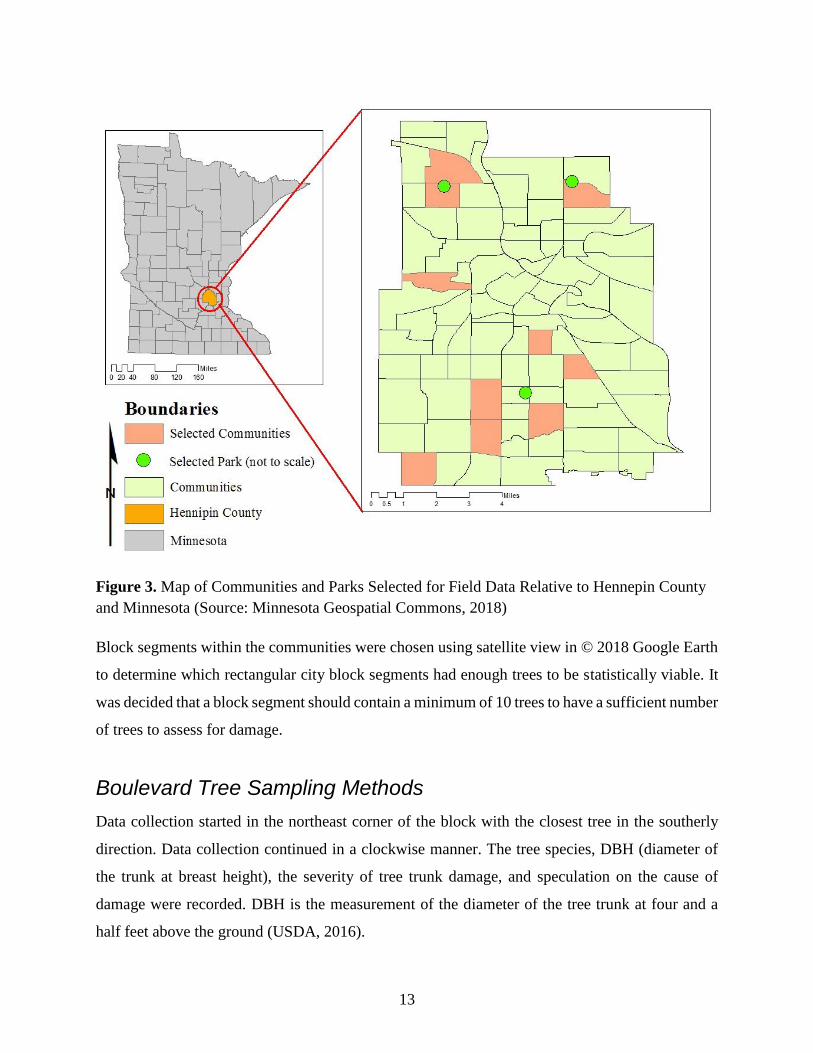
Figure 3. Map of Communities and Parks Selected for Field Data Relative to Hennepin County
and Minnesota (Source: Minnesota Geospatial Commons, 2018)
Block segments within the communities were chosen using satellite view in © 2018 Google Earth
to determine which rectangular city block segments had enough trees to be statistically viable. It
was decided that a block segment should contain a minimum of 10 trees to have a sufficient number
of trees to assess for damage.
Boulevard Tree Sampling Methods
Data collection started in the northeast corner of the block with the closest tree in the southerly
direction. Data collection continued in a clockwise manner. The tree species, DBH (diameter of
the trunk at breast height), the severity of tree trunk damage, and speculation on the cause of
damage were recorded. DBH is the measurement of the diameter of the tree trunk at four and a
half feet above the ground (USDA, 2016).
14
Randomized Selection and Sampling of Inventoried Park Trees
To randomize which trees were used for data collected within each park, a tree directory was
obtained from the Minneapolis Park and Recreation Board. Using the ArcMap through © ArcGIS
2018 ESRI, trees within Phelps, Deming Heights, and Folwell parks were separated from the
directory data and assigned random numbers. Trees noted as ‘removed’ in the comprehensive data
were not included in the subset of data for analysis. Twenty-percent of the trees in each park were
measured as a sample of the general tree population to keep the amount of data to a manageable
yet statistically robust sample size. Each tree selected was assigned a number, and © Google’s
random number generator was used to randomly select the sampled trees.
The maximum amount of random numbers used in the generator differed for each park due to the
varying amount of trees within them. The minimum was always set to zero since the numbering
scheme began with zero within the trees attribute table. Repeated numbers during the random
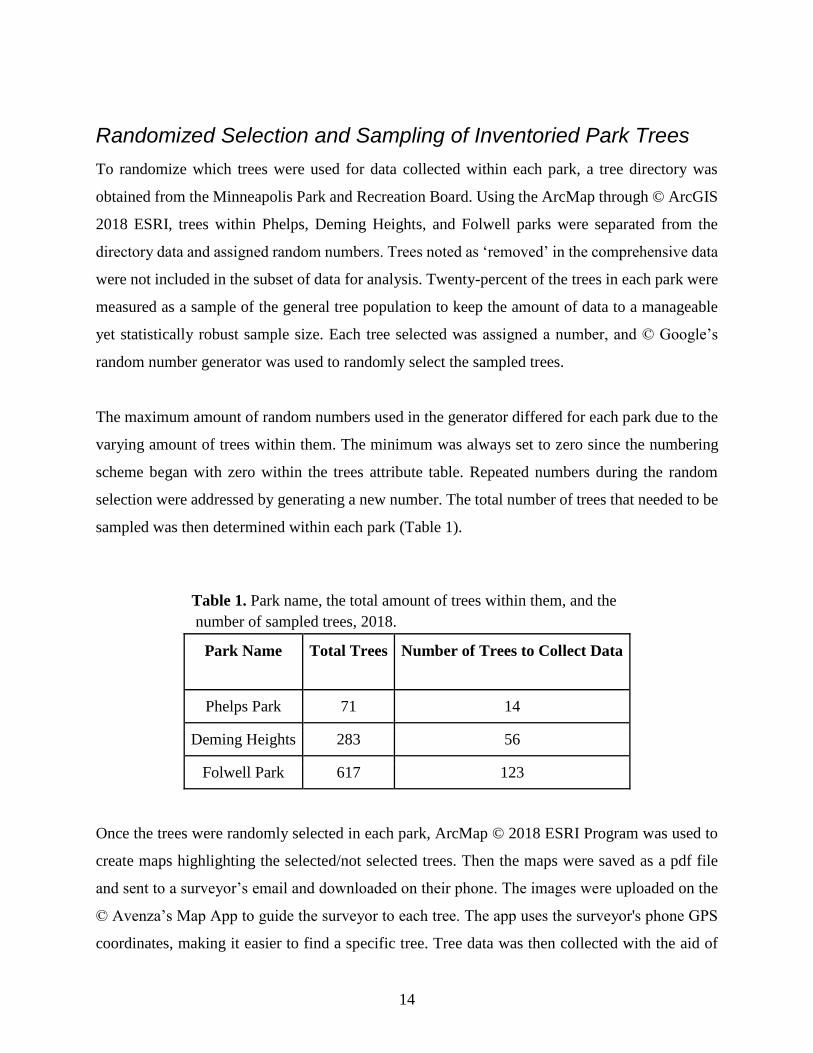
selection were addressed by generating a new number. The total number of trees that needed to be
sampled was then determined within each park (Table 1).
Table 1. Park name, the total amount of trees within them, and the
number of sampled trees, 2018.
Park Name Total Trees Number of Trees to Collect Data
Phelps Park 71 14
Deming Heights 283 56
Folwell Park 617 123
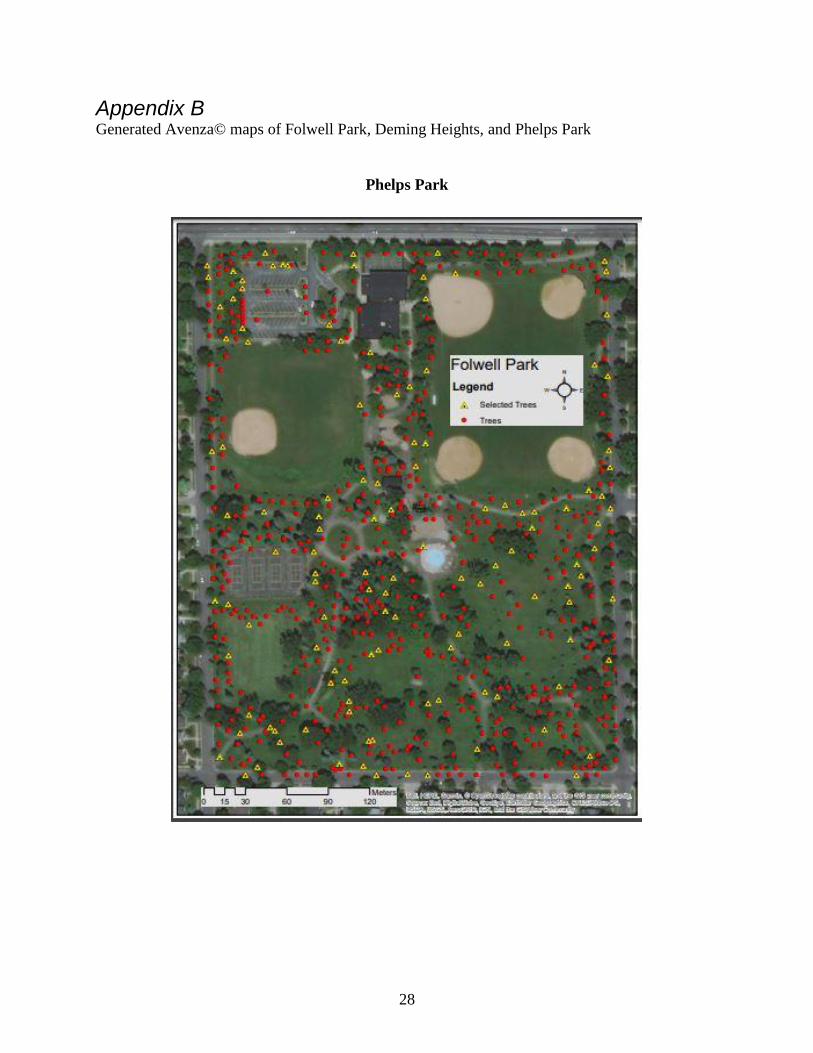
Once the trees were randomly selected in each park, ArcMap © 2018 ESRI Program was used to
create maps highlighting the selected/not selected trees. Then the maps were saved as a pdf file
and sent to a surveyor’s email and downloaded on their phone. The images were uploaded on the
© Avenza’s Map App to guide the surveyor to each tree. The app uses the surveyor's phone GPS
coordinates, making it easier to find a specific tree. Tree data was then collected with the aid of
15
the created maps which indicated trees by red dots and the trees to be sampled by yellow triangles
(Appendix B). However, if a tree had been removed since the city’s tree directory had last been
updated, the tree closest to the spot in which there was supposed to be a tree was used for data
collection. As with the boulevard block segment methods, the tree species, DBH, the severity of
tree trunk damage, and the possible cause of the damage were collected at each park and analyzed.
Once all data was collected from both the parks and block segments, different statistical analyses
were conducted.
Assessing Level of Damage to Trees
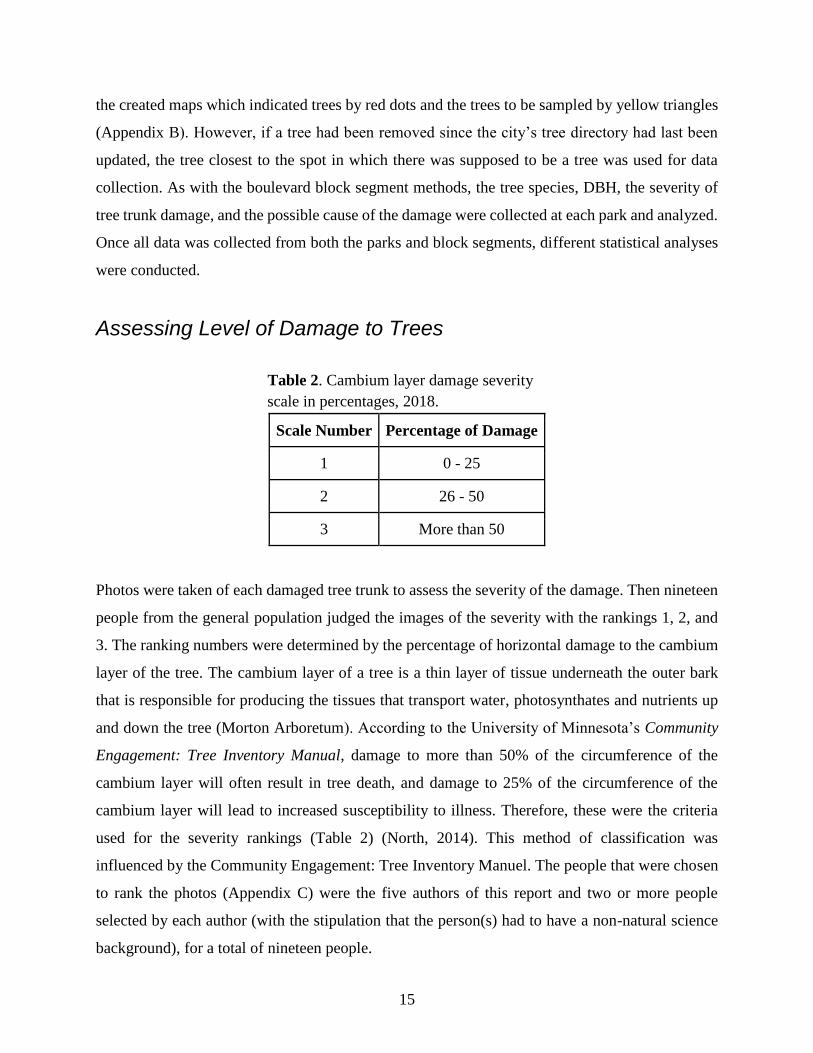
Table 2. Cambium layer damage severity
scale in percentages, 2018.
Scale Number Percentage of Damage
1 0 - 25
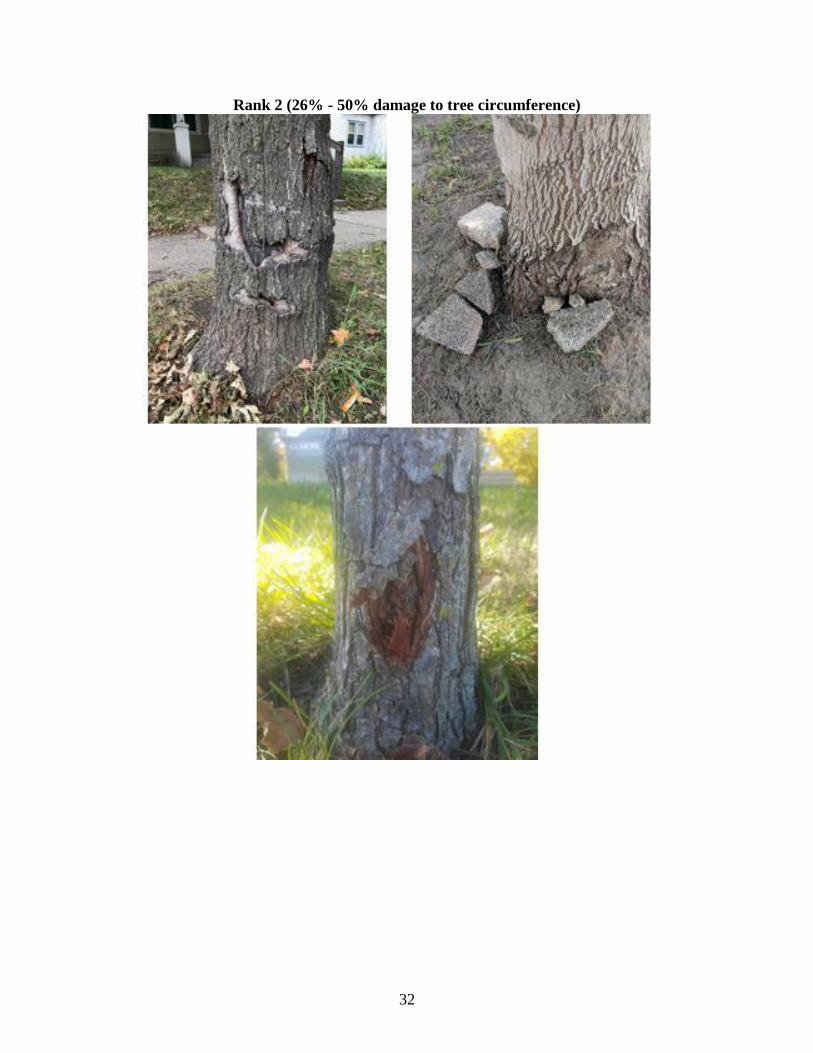
2 26 - 50
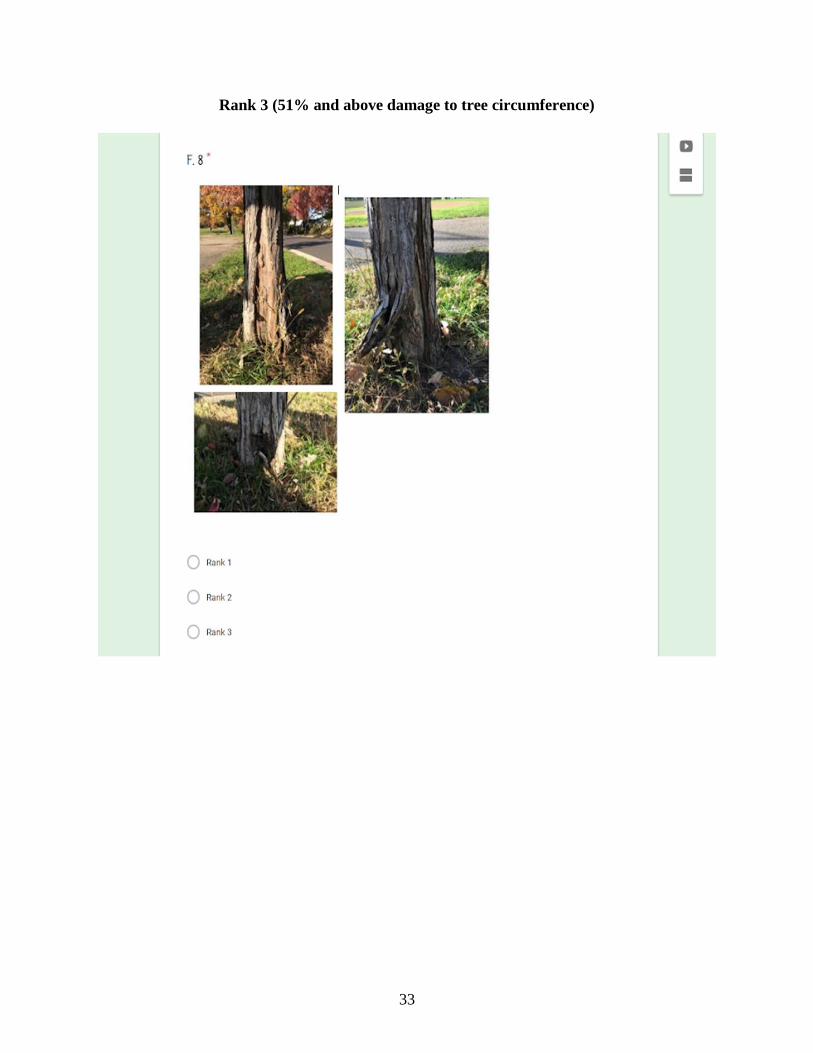
3 More than 50
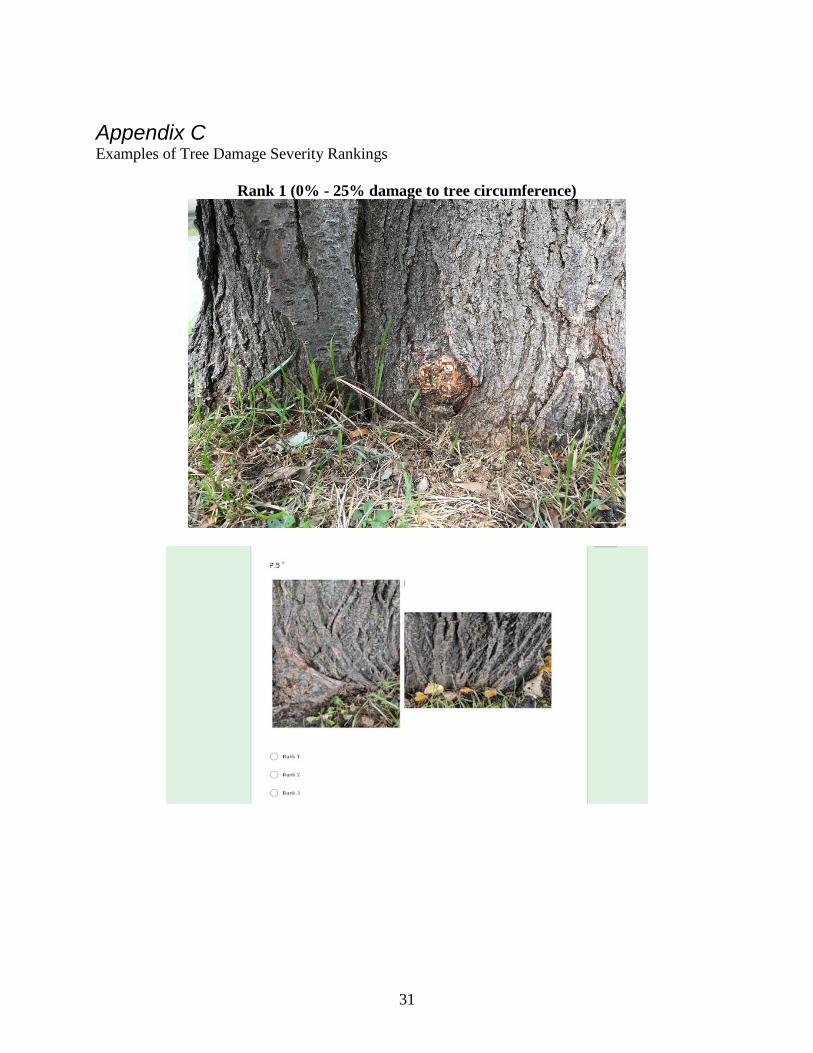
Photos were taken of each damaged tree trunk to assess the severity of the damage. Then nineteen
people from the general population judged the images of the severity with the rankings 1, 2, and
3. The ranking numbers were determined by the percentage of horizontal damage to the cambium
layer of the tree. The cambium layer of a tree is a thin layer of tissue underneath the outer bark
that is responsible for producing the tissues that transport water, photosynthates and nutrients up
and down the tree (Morton Arboretum). According to the University of Minnesota’s Community
Engagement: Tree Inventory Manual, damage to more than 50% of the circumference of the
cambium layer will often result in tree death, and damage to 25% of the circumference of the
cambium layer will lead to increased susceptibility to illness. Therefore, these were the criteria
used for the severity rankings (Table 2) (North, 2014). This method of classification was
influenced by the Community Engagement: Tree Inventory Manuel. The people that were chosen
to rank the photos (Appendix C) were the five authors of this report and two or more people
selected by each author (with the stipulation that the person(s) had to have a non-natural science
background), for a total of nineteen people.
16
Findings
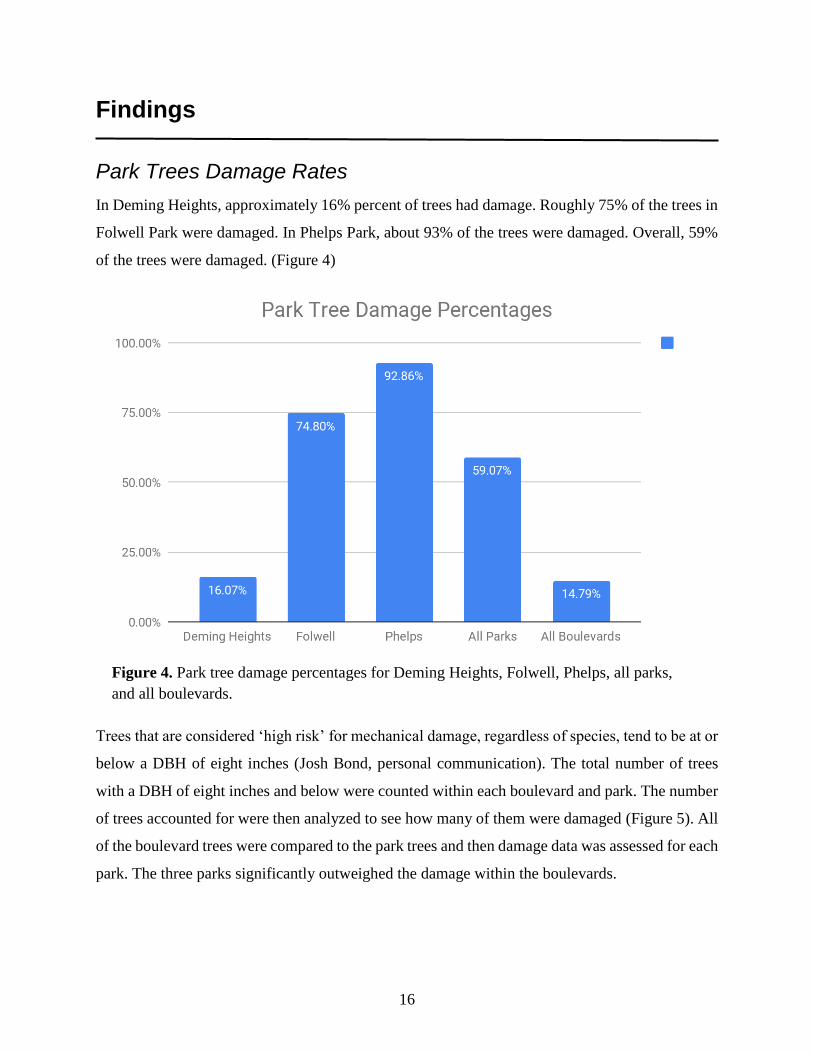
Park Trees Damage Rates
In Deming Heights, approximately 16% percent of trees had damage. Roughly 75% of the trees in
Folwell Park were damaged. In Phelps Park, about 93% of the trees were damaged. Overall, 59%
of the trees were damaged. (Figure 4)
Figure 4. Park tree damage percentages for Deming Heights, Folwell, Phelps, all parks,
and all boulevards.
Trees that are considered ‘high risk’ for mechanical damage, regardless of species, tend to be at or
below a DBH of eight inches (Josh Bond, personal communication). The total number of trees
with a DBH of eight inches and below were counted within each boulevard and park. The number
of trees accounted for were then analyzed to see how many of them were damaged (Figure 5). All
of the boulevard trees were compared to the park trees and then damage data was assessed for each
park. The three parks significantly outweighed the damage within the boulevards.
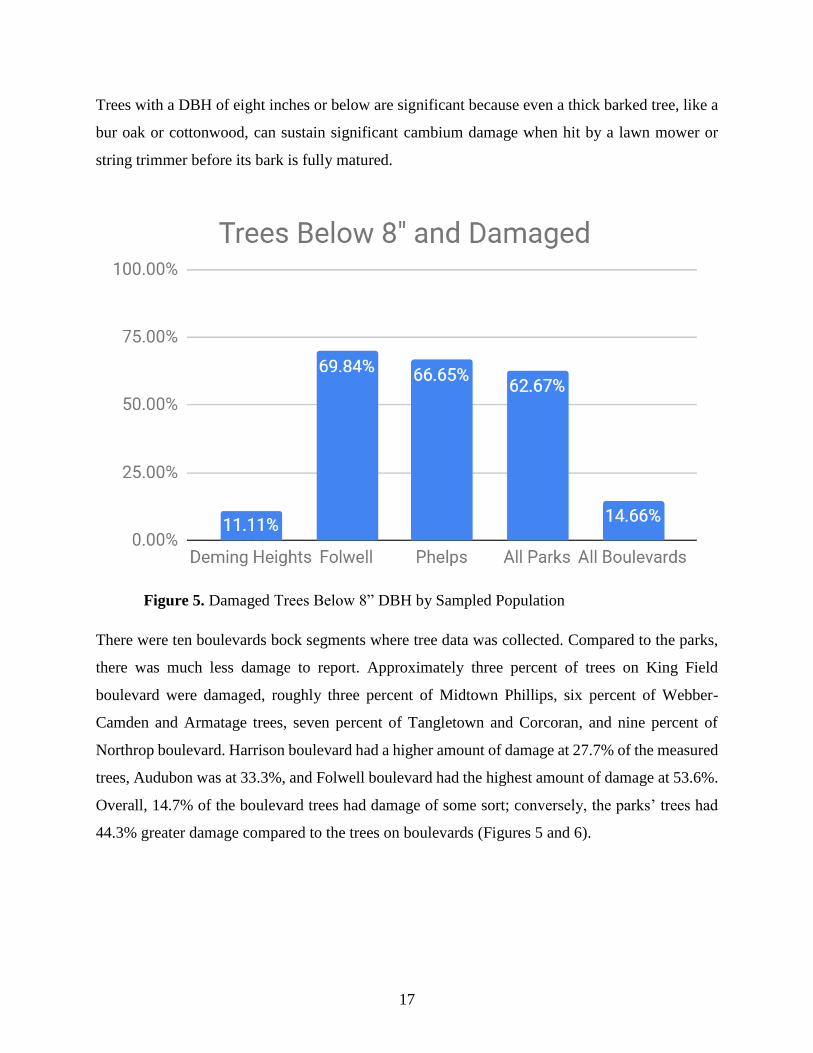
17
Trees with a DBH of eight inches or below are significant because even a thick barked tree, like a
bur oak or cottonwood, can sustain significant cambium damage when hit by a lawn mower or
string trimmer before its bark is fully matured.
Figure 5. Damaged Trees Below 8” DBH by Sampled Population
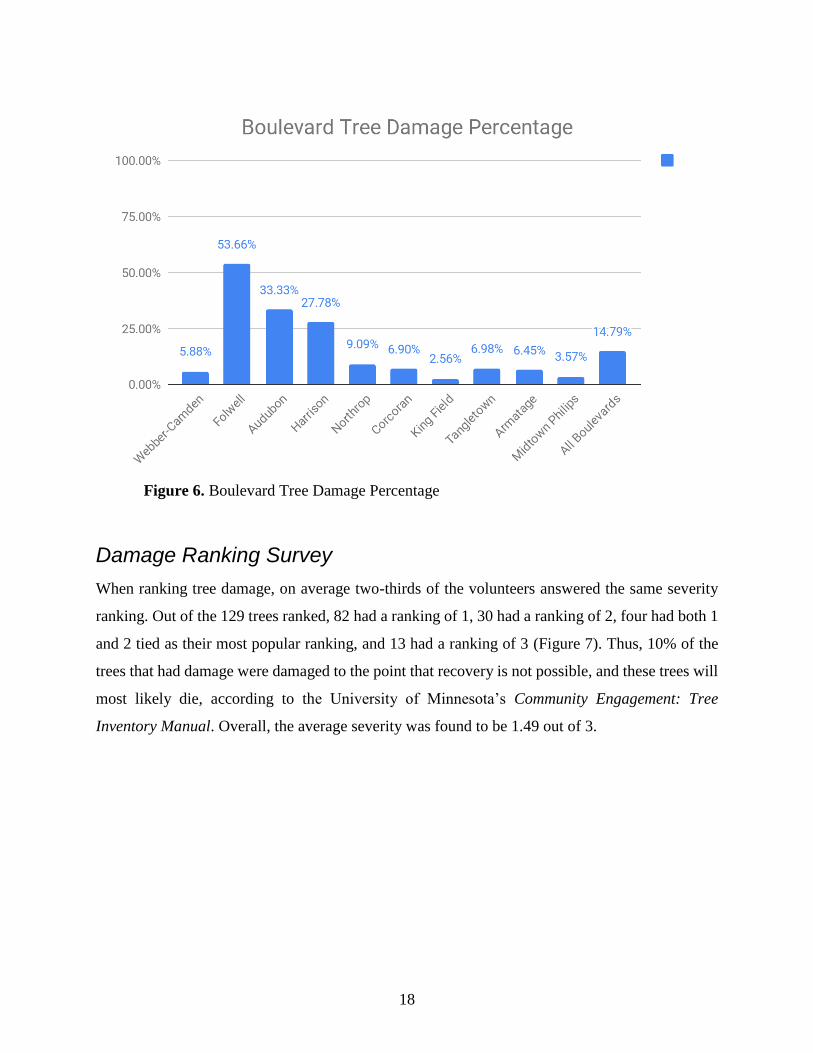
There were ten boulevards bock segments where tree data was collected. Compared to the parks,
there was much less damage to report. Approximately three percent of trees on King Field
boulevard were damaged, roughly three percent of Midtown Phillips, six percent of Webber-
Camden and Armatage trees, seven percent of Tangletown and Corcoran, and nine percent of
Northrop boulevard. Harrison boulevard had a higher amount of damage at 27.7% of the measured
trees, Audubon was at 33.3%, and Folwell boulevard had the highest amount of damage at 53.6%.
Overall, 14.7% of the boulevard trees had damage of some sort; conversely, the parks’ trees had
44.3% greater damage compared to the trees on boulevards (Figures 5 and 6).
18
Figure 6. Boulevard Tree Damage Percentage
Damage Ranking Survey
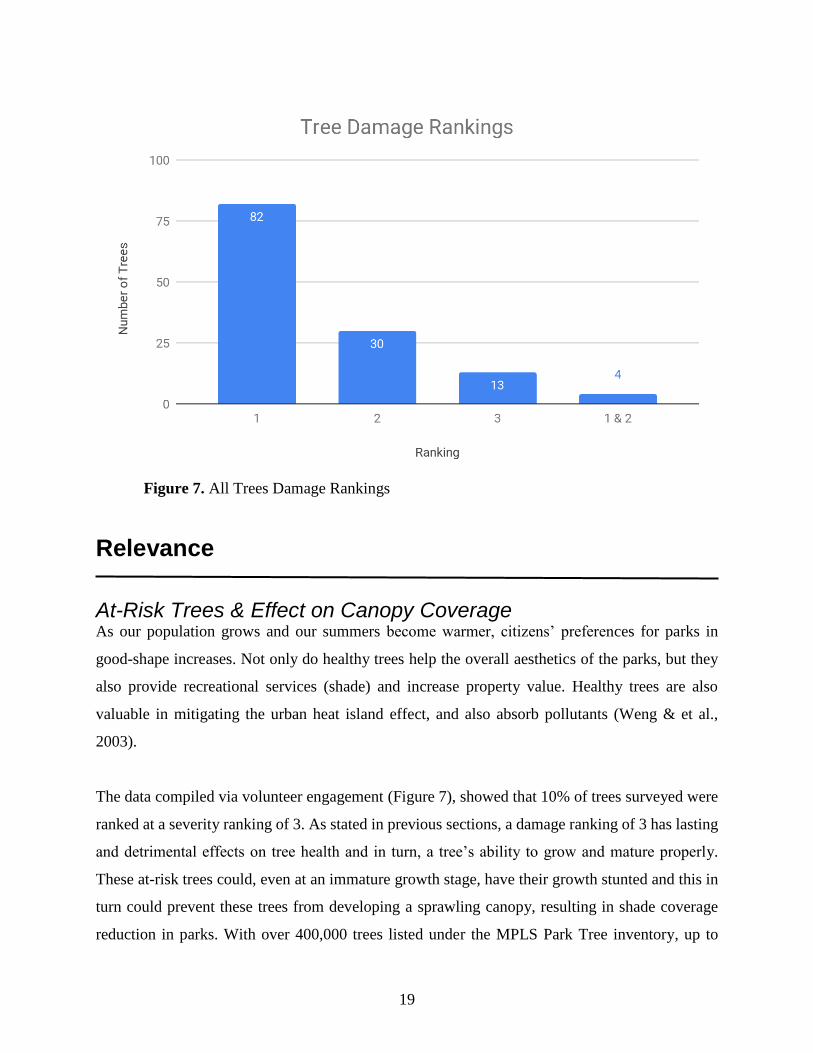
When ranking tree damage, on average two-thirds of the volunteers answered the same severity
ranking. Out of the 129 trees ranked, 82 had a ranking of 1, 30 had a ranking of 2, four had both 1
and 2 tied as their most popular ranking, and 13 had a ranking of 3 (Figure 7). Thus, 10% of the
trees that had damage were damaged to the point that recovery is not possible, and these trees will
most likely die, according to the University of Minnesota’s Community Engagement: Tree
Inventory Manual. Overall, the average severity was found to be 1.49 out of 3.
19
Figure 7. All Trees Damage Rankings
Relevance
At-Risk Trees & Effect on Canopy Coverage As our population grows and our summers become warmer, citizens’ preferences for parks in
good-shape increases. Not only do healthy trees help the overall aesthetics of the parks, but they
also provide recreational services (shade) and increase property value. Healthy trees are also
valuable in mitigating the urban heat island effect, and also absorb pollutants (Weng & et al.,
2003).
The data compiled via volunteer engagement (Figure 7), showed that 10% of trees surveyed were
ranked at a severity ranking of 3. As stated in previous sections, a damage ranking of 3 has lasting
and detrimental effects on tree health and in turn, a tree’s ability to grow and mature properly.
These at-risk trees could, even at an immature growth stage, have their growth stunted and this in
turn could prevent these trees from developing a sprawling canopy, resulting in shade coverage
reduction in parks. With over 400,000 trees listed under the MPLS Park Tree inventory, up to
20
40,000 trees (10%) could be considered at-risk. Without action, these 40,000 trees could be lost,
and consequently result in increased cleanup costs and the loss of recreational and property value.
The noticeable reduction in trees would likely be considered an ‘eyesore’ in the park, reflecting
poorly on the care provided by its stewards, MPRB Department of Forestry. However, with action,
canopy coverage can be saved and even expanded while increasing recreational, property value,
and the reputation and confidence in MPRB Department of Forestry.
Recommendations
Public Awareness
Recommendation 1: Create signs and QR codes
Raising public awareness of the issue—tree trunk damage—is essential in establishing or
maintaining correct lawn care habits. Placing signs in parks that show the effects of tree trunk
damage from lawn mower damage would simultaneously illustrate that MPRB Department of
Forestry is actively addressing the problem and would inform concerned park patrons of the issue.
Recommendation 2: Create an instructional video for teaching purposes
An effective way to educate those involved with mowing in the parks is by the creation of a video.
It could be an animated video that talks about the best mowing practices to protect trees, current
problems and miscommunication, and why it is important to follow the proposed practices. The
creation of a video may be more memorable than merely giving a lecture about lawn care practices.
Recommendation 3: Create and place infographic stickers on lawn mowers
Small stickers would be placed on city lawn mowers with graphics that remind lawn mower
operators to leave a ring of uncut grass around the tree to avoid causing damage. The sticker would
be placed on an area of the lawn mower that would be easily visible by the lawn mower operator
during operation, thus serving as a constant reminder to avoid being in close proximity to the tree,
and to leave a ring of grass around each tree. Infographic stickers will help prevent lawn mower
operators from forgetting what was learned in a training session or video.
21
Recommendation 4: Establishing a citizen-based monitoring system to regularly record
mechanical injury
Recruiting citizens as volunteers for tree ranking could be a viable way to continue tree damage
assessments beyond the results found in this project. There was approximately 66% agreement in
severity ranking with little preparatory training, which means that there was a high degree of
consistency. It would be feasible for a citizen science program to monitor tree damage and to
potentially create a community-based management (CBM) program or project, a process where
concerned citizens can monitor and track issues of common environmental concerns (Leach et al.,
1999).
Citizens in communities practicing CBM have been shown to inspire people within communities
to be more engaged and help bridge the gap between scientists and nonscientists by sharing the
information that is needed (Conrad & Hilchey, 2011). Tree data collected by citizens who are
participating in CBM communities could help the MPRB Department of Forestry to better and
more frequently assess trees within the city’s parks. However, further studies are recommended
that would compare these results with the results of multiple experts who would take the tree
damage survey in this study. This comparison of non-dendrology trained citizens and experts
results in the same survey could establish the accuracy and usefulness of trained vs. untrained
citizens for analyzing tree damage data in the future and identify the level of necessary training for
said volunteers.
Physical Preventative Measures
Recommendation 5: Lawn mower operators leave a ring of uncut grass around trees
Lawn mower operators would leave a 1.5-foot ring of uncut grass around each tree. Establishing a
ring would allow lawn mower operators to avoid cutting grass in the immediate vicinity of the
trees, thus preventing trunk damage.
Recommendation 6: Metal fences around saplings
Since saplings are in a more fragile state than mature trees, placing metal or protective
fences/guards around park saplings will prevent possible damage from lawn mowers by removing
the ability for mowers and weed whips to work near vulnerable trees.
22
Recommendation 7: Add mulch around the base of park trees
Installing a 3-foot radius and ~1-2 inches of wood mulch – reapplied annually - surrounding each
tree with a DBH of eight inches or less would help to reduce the necessity for mowers to get within
damaging distance of the vulnerable trees (Josh Bond, personal communication).
Conclusions
Mechanical damage caused by lawn care vehicles and string trimmers is a threat to any tree located
within a park or a community boulevard and could determine future tree canopy cover. The MPRB
Department of Forestry deemed it important to assess damages that trees have sustained in selected
Minneapolis parks to determine how prevalent and severe the damage is and to compare park tree
with trees randomly chosen from within Minneapolis boulevards. The MPRB Department of
Forestry partnered with Environmental Science and Policy Management students who are
currently enrolled in their capstone course “Problem Solving for Environmental Change” (ESPM
4041W) to help assess tree damage in both selected parks and randomly selected boulevards. They
were also asked to develop possible solutions that could be implemented to prevent further tree
damage and to test whether future tree damage assessments could be taken on by non-expert citizen
volunteers.
The findings concluded that, in total, there was more damage to trees within the parks compared
to the boulevards. Non-expert citizen volunteers that took the survey had an overall agreement on
levels of damage (66%) when rating the cambium damage for each tree. This uniformity is much
higher than random chance which would be a three-way split between the answers. This may
indicate that citizens could determine on their own how much cambium damage trees have taken
from mechanical damage based on the proposed damage levels —either in their yards or nearby
boulevards or parks — and assist in creating better management practices that ensure sustainable
tree canopy cover. However, as mentioned in recommendation #4, further study is recommended
that compares these results with the results of multiple experts who would take the tree damage
survey in this study. Comparing the cambium tree damage survey results of citizens with minimal

23
dendrology background and experts of the field could establish the accuracy and usefulness of
Minneapolis citizens analyzing tree damage data in the future.
References and Sources
ArcMap. 2018, March 28. Retrieved from https://en.wikipedia.org/wiki/ArcMap
Black’s Law Dictionary. 2013.What is municipal ordinance? Definition of municipal
ordinance. Retrieved from https://thelawdictionary.org/municipal-ordinance/
Bond, J. 2018, November 16. Personal communication.
City block. 2018, October 12. Retrieved from
https://en.wikipedia.org/wiki/City_block#Definitions_and_typologies
Conrad, C. C., & Hilchey, G. K. 2011. A Review of Citizen Science and Community-Based
Environmental Monitoring: Issues and Opportunities. Environmental Monitoring
Assessment, 176, pp. 273-291. DOI 10.1007/s10661-010-1582-5
Definition is used for a human body but the terminology applies to trees and their cambium
layers in the context of this report.
ESRI 2011. ArcGIS Desktop: Release 10. Redlands, CA: Environmental Systems Research
Institute. [Computer Software]
Hudson, Horace B. (Horace Bushnell) 1918. "Hudson's dictionary of Minneapolis and vicinity;
a handbook for strangers and residents". Minneapolis, The Hudson publishing company.
Jennings, S., N.D. Brown and D, Sheil. 1999. Assessing forest canopies and understory
illumination: Canopy closure, canopy cover and other measures. Forestry: An
International Journal of Forest Research,72(1), 59-74. doi:10.1093/forestry/72.1.59
Kosmala, M. 2008. Influence of mechanical damage on the condition of trees, 144(29), 137–
144.
Leach, M., Mearns, R., & Scoones, I. 1999. Environmental Entitlements: Dynamics and
Institutions in Community-Based Natural Resource Management. World Development,
Vol. 27 (Issue No. 2), pp 225-247.
Mechanical trauma. (n.d.). Retrieved from https://www.britannica.com/science/mechanical-
trauma
24
Merriam-Webster Definition of Cambium. (n.d.). Retrieved from https://www.merriam-
webster.com/dictionary/cambium
Minneapolis Park & Recreation Board. 2018) Park Care & Improvements. Retrieved from
https://www.minneapolisparks.org/park_care__improvements/trees/park_trees/
Minneapolis. 2018, October ). Welcome to Minneapolis 2040 - The City's Draft Comprehensive
Plan. Retrieved from https://minneapolis2040.com/
Minneapolis Park & Recreation Board. 2018. 2018 Annual Budget. Retrieved from
https://www.minneapolisparks.org/about_us/budget__financial/
Minneapolis Park & Recreation Board 2018. Deming Heights Park. Retrieved from
https://www.minneapolisparks.org/parks__destinations/parks__lakes/deming_heights_par
k/
Minneapolis Park & Recreation Board 2018. Folwell Park. Retrieved from
https://www.minneapolisparks.org/parks__destinations/parks__lakes/folwell_park/
Minneapolis Park & Recreation Board 2018. Mission, Vision, & Values. Retrieved from
https://www.minneapolisparks.org/about_us/mission_vision__values/
Minneapolis Park & Recreation Board 2018. Phelps Field Park. Retrieved from
https://www.minneapolisparks.org/parks__destinations/parks__lakes/phelps_field_park/
The Morton Arboretum. (n.d.) Trunk wounds and decay. Retrieved from
http://www.mortonarb.org/trees-plants/tree-and-plant-advice/horticulture-care/trunk-
wounds-and-decay
North, Eric. 2014. Community Engagement: Tree Inventory Manual. Department of Forest
Resources, University of Minnesota.
Open Data Minneapolis. 2018. http://opendata.minneapolismn.gov/
United States Environmental Protection Agency 2017 Retrieved from
https://www3.epa.gov/region1/eco/uep/openspace.html
United States Census Bureau 2017. Minneapolis city, Minnesota July 1st, 2017 Census.
Retrieved from https://www.census.gov/quickfacts/fact/table/minneapoliscityminnesota
/PST045217
Weng, Q., Lu, D. & Schubring J. 2003. Estimation of land surface temperature-vegetation
abundance relationship for urban heat island studies. Remote Sensing of Environment,
Volume 89 (Issue 4), pp. 467-483.
25
Glossary
ArcMap/ArcGIS - ArcMap is the main component of Esri's ArcGIS suite of geospatial processing
programs, and is used primarily to view, edit, create, and analyze geospatial data.ArcMap
allows the user to explore data within a data set, symbolize features accordingly, and create
maps. (ArcMap, 2018)
Block Segments - A city block, urban block or block that is a central element of urban planning
and urban design. A city block is the smallest area that is surrounded by streets. City blocks
are the space for buildings within the street pattern of a city and form the basic unit of a
city's urban fabric. (City Block, 2018) A typical city block is 660 by 330 feet (200 m × 100
m) (w × h), meaning that 16 east-west blocks or 8 north-south blocks measure one mile.
(Hudson, 1918)
Boulevard - A broad and usually important street that often has trees, grass, or flowers planted
down its center or along its sides. (Merriam-Webster). In Minnesota, boulevards are
described as the publicly-owned areas between city street curbs and city sidewalks.
Cambium - A thin formative layer between the xylem and phloem of most vascular plants that
gives rise to new cells and is responsible for secondary growth. (Merriam-Webster, 2018)
Canopy Coverage - Forest canopy cover, also known as canopy coverage or crown cover, is
defined as the proportion of the forest covered by the vertical projection of the tree crowns
(Jennings et al. 1999).
DBH - Diameter of the trunk at breast height. Specifically, it is the measurement of the diameter
of the tree trunk at four and a half feet above the ground (USDA, 2016).
Green Space - Land that is partly or entirely covered with grass, trees, shrubs, or other vegetation).
Green space includes parks, community gardens, cemeteries, schoolyards, playgrounds,
public plazas, vacant lots, and general public seating areas.
Mechanical Injury - Mechanical trauma is defined as an injury to any portion of the body from a
blow, crush, cut, or penetrating wound. (Britannica)
Minneapolis 2040 Plan - The city’s draft of a comprehensive plan and goals for the next two
decades. (Welcome to Minneapolis 2040, 2018)
Municipal Ordinances - The name given to a rule, law or regulation that is enacted in a town or
city. (Black’s Law Dictionary)
26
Appendices
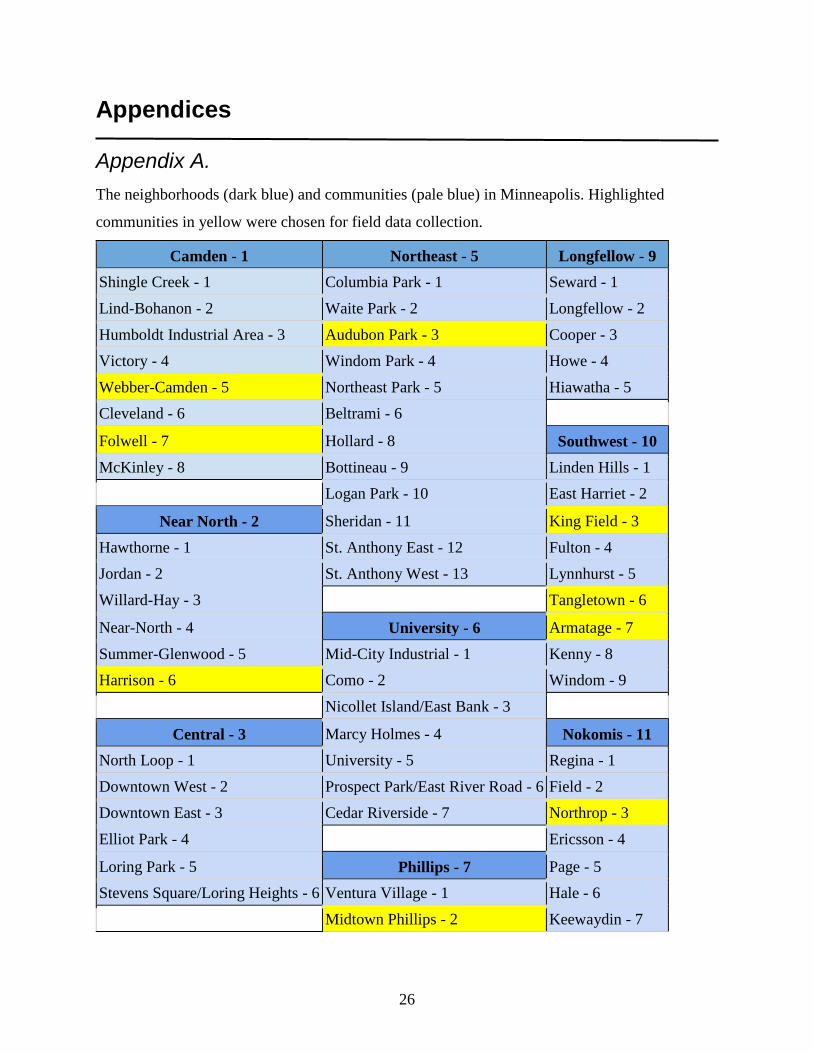
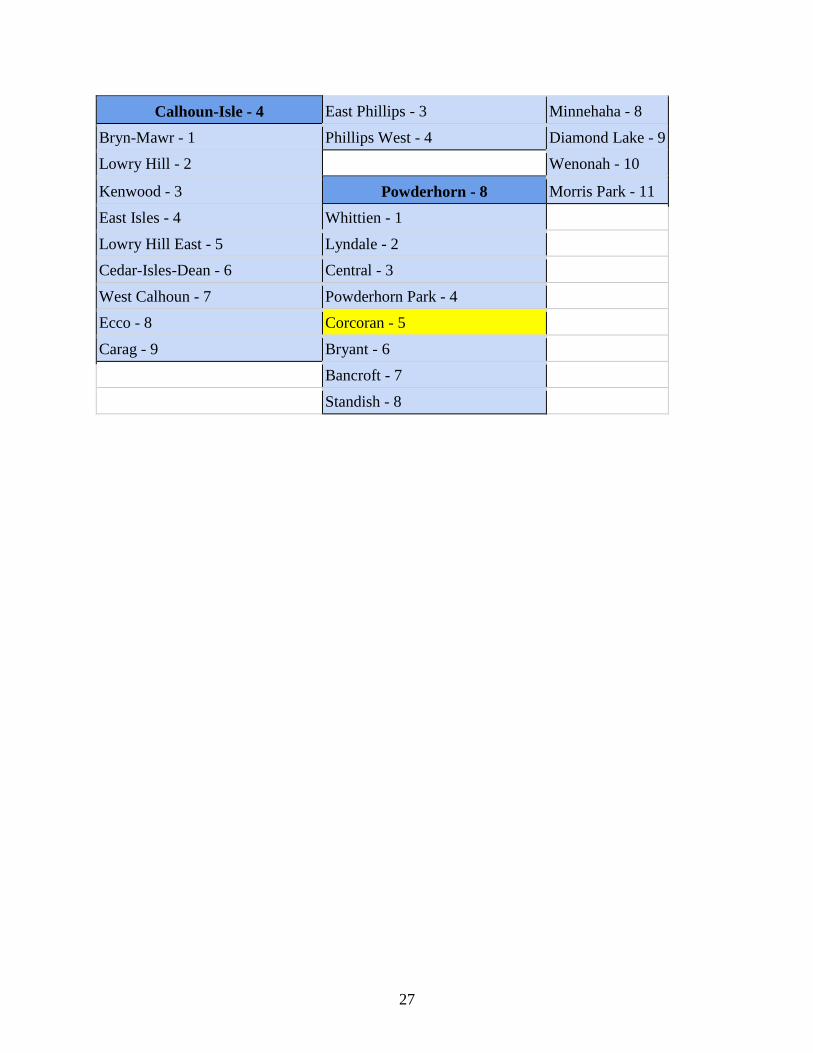
Appendix A.
The neighborhoods (dark blue) and communities (pale blue) in Minneapolis. Highlighted
communities in yellow were chosen for field data collection.
Camden - 1 Northeast - 5 Longfellow - 9
Shingle Creek - 1 Columbia Park - 1 Seward - 1
Lind-Bohanon - 2 Waite Park - 2 Longfellow - 2
Humboldt Industrial Area - 3 Audubon Park - 3 Cooper - 3
Victory - 4 Windom Park - 4 Howe - 4
Webber-Camden - 5 Northeast Park - 5 Hiawatha - 5
Cleveland - 6 Beltrami - 6
Folwell - 7 Hollard - 8 Southwest - 10
McKinley - 8 Bottineau - 9 Linden Hills - 1
Logan Park - 10 East Harriet - 2
Near North - 2 Sheridan - 11 King Field - 3
Hawthorne - 1 St. Anthony East - 12 Fulton - 4
Jordan - 2 St. Anthony West - 13 Lynnhurst - 5
Willard-Hay - 3 Tangletown - 6
Near-North - 4 University - 6 Armatage - 7
Summer-Glenwood - 5 Mid-City Industrial - 1 Kenny - 8
Harrison - 6 Como - 2 Windom - 9
Nicollet Island/East Bank - 3
Central - 3 Marcy Holmes - 4 Nokomis - 11
North Loop - 1 University - 5 Regina - 1
Downtown West - 2 Prospect Park/East River Road - 6 Field - 2
Downtown East - 3 Cedar Riverside - 7 Northrop - 3
Elliot Park - 4 Ericsson - 4
Loring Park - 5 Phillips - 7 Page - 5
Stevens Square/Loring Heights - 6 Ventura Village - 1 Hale - 6
Midtown Phillips - 2 Keewaydin - 7
27
Calhoun-Isle - 4 East Phillips - 3 Minnehaha - 8
Bryn-Mawr - 1 Phillips West - 4 Diamond Lake - 9
Lowry Hill - 2 Wenonah - 10
Kenwood - 3 Powderhorn - 8 Morris Park - 11
East Isles - 4 Whittien - 1
Lowry Hill East - 5 Lyndale - 2
Cedar-Isles-Dean - 6 Central - 3
West Calhoun - 7 Powderhorn Park - 4
Ecco - 8 Corcoran - 5
Carag - 9 Bryant - 6
Bancroft - 7
Standish - 8
28
Appendix B Generated Avenza© maps of Folwell Park, Deming Heights, and Phelps Park
Phelps Park
29
Deming Heights Park
30
Phelps Park
31
Appendix C Examples of Tree Damage Severity Rankings
Rank 1 (0% - 25% damage to tree circumference)
32
Rank 2 (26% - 50% damage to tree circumference)
33
Rank 3 (51% and above damage to tree circumference)
34
Appendix D Data Ownership Statement
All data contained in the Microsoft Excel Spreadsheet for this project is the sole property
of the University of Minnesota and the Minneapolis Park and Recreation Board, City of
Minneapolis, MN. As such, it is illegal to delete, add or modify the data in any way.
December 11, 2018.
35
Presentation Map/Poster