Embed Size (px)
Citation preview

' ' ° , ' i , "
:';V?~,
R. & M. No. 3678
M I N I S T R Y OF D E F E N C E ( A V I A T I O N SUP P L Y)
A E R O N A U T I C A L R E SEARCH C O U N C I L
REPORTS A N D M E M O R A N D A
Turbulent Boundary Layers on a Large Flat Plate a t M = 4
by R. C. HASTTNGS and W. G. SAWYER
Aerodynamics Dept.. RAE, Bedford
LONDON: H E R M A J E S T Y S STATIONERY OFFICE
1971
PRICE £2"10 N~-T
Turbulent Boundary Layers a t M - - 4
By R. C. HASTINGS and W. G. SAWYER
Aerodynamics Dept., RAE, Bedford
on a Large Flat Plate
i I .
Reports and Memoranda No. 3 6 7 8 * ~': ~ , ''~ , ,
_March, 1 9 7 0 .........
1 . - , ]
Summary. Transition positions, local skin-friction coefficients and boundary layer profiles measured in adiabatic
flow on a flat plate are given. The data are for turbulent flow and cover a range of momentum-thickness Reynolds numbers of approximately 2500 to 25000. At high Reynolds number, skin-friction coefficients are well predicted by the relations of Spalding and Chi or Winter and Gaudet. Below a Reynolds number of roughly 10000 the results, though less reliable, seem to lie above these predictions; the higher values are corroborated by data from other sources.
The inner parts of the velocity profiles follow a common law, well predicted by the correlation of Winter and Gaudet, and at high Reynolds numbers the velocity-defect profile of the outer layer agrees with a number of previous predictions. The outer parts of the profiles exhibit a wake component which decreases with decreasing Reynolds number and eventually vanishes. In respect of this behaviour, the compressible flow corresponds to an incompressible flow at a much lower Reynolds number.
*Replaces RAE Tech. Report No. 70040--A.R.C. 32 427.

LIST OF CONTENTS
Section.
1. Introduction
2. Theories for Predicting Skin Friction
2.1. General background
2.2. Particular methods
3.1.
3.2.
3.3.
2.2.1.
2.2.2.
2.2.3.
2.2.4.
2.2.5.
2.2.6.
Intermediate-temperature methods
Transformation methods
Van Driest's mixing length method
The method of Spalding and Chi
The method of Winter and Gaudet
General calculation procedures
.
2.3. Comparison of methods
Description of Experiment
Wind tunnel and model mounting
Model
Instrumentation
3.3.1.
3.3.2.
3.3.3.
3.3.4.
Pitot traverse gear
Floating-element skin-friction meter
Surface static and pitot pressures
Transition indicator
3.4. Test procedure
4. Results
4.1. Accuracy
4.2. Transition positions
4.3. Skin-friction measurements
4.4. Velocity profiles
5. Conclusions
Acknowledgements
Symbols
References
Tables--I to 4
Illustrations--Figs. 1 to 16
Detachable Abstract Cards
1. Introduction.
The behaviour of turbulent boundary layers in compressible flow is a topic of considerable practical importance, and one for which there is no exact theory. Consequently, experimental data are continually needed to enable semi-empirical theories to be formulated and tested. This Report gives a set of measure- ments made for these purposes. The measurements were made in the boundary layer of a large, flat plate, to which heat transfer was small, immersed in an airstream at a Mach number of 4. The main results consist of velocity profiles and skin-friction measurements. Positions of natural transition from laminar to turbulent flow are also given.
In order to provide a framework within which to discuss the measurements, some boundary-layer theories are briefly described. The skin-friction laws of these theories are compared with the measurements in terms of relations between skin-friction coefficient and Reynolds number based on momentum thick- ness. Because there were clear indications that the flow along the centre-line of the plate was slightly convergent, no comparisons are made in terms of skin friction as a function of length Reynolds number.
To provide a further comparison with theory, the forms of the measured velocity profiles in the wall region and the outer, 'velocity-defect' region are examined.
2. Theories for Predicting Skin Friction.
2.1. General Background.
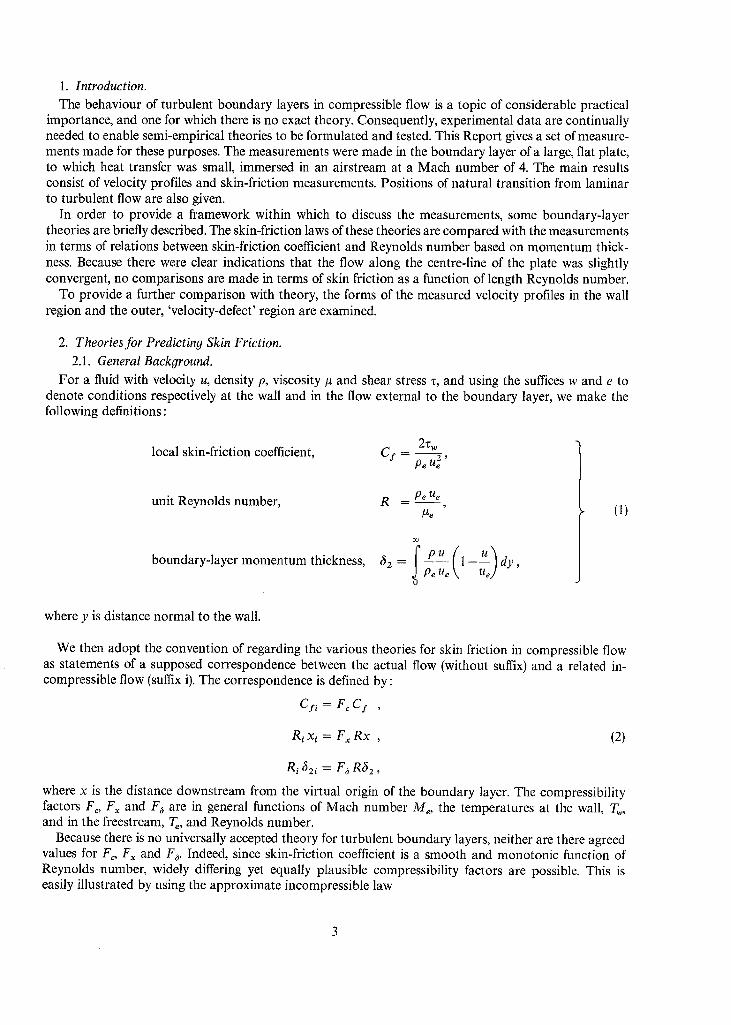
For a fluid with velocity u, density p, viscosity # and shear stress z, and using the suffices w and e to denote conditions respectively at the wall and in the flow external to the boundary layer, we make the following definitions:
local skin-friction coefficient,
unit Reynolds number,
boundary-layer momentum thickness,
2"~ w Cs- 2 '
Pe Ue
R _ Pe Ue
#e
a 2 = P~e 1-- dy , 0
(1)
where y is distance normal to the wall.
We then adopt the convention of regarding the various theories for skin friction in compressible flow as statements of a supposed correspondence between the actual flow (without suffix) and a related in- compressible flow (suffix i). The correspondence is defined by:
C f i .~. F c C f ,
R i X i = F . R x , (2)
Ri (~2i = Fa R~2,
where x is the distance downstream from the virtual origin of the boundary layer. The compressibility factors F o Fx and Fa are in general functions of Mach number Me, the temperatures at the wall, Tw, and in the freestream, T~, and Reynolds number.
Because there is no universally accepted theory for turbulent boundary layers, neither are there agreed values for Fo Fx and F~. Indeed, since skin4riction coefficient is a smooth and monotonic function of Reynolds number, widely differing yet equally plausible compressibility factors are possible. This is easily illustrated by using the approximate incompressible law
K L C~,i - - - ± = 1 (3 )
(Ri xi)" (R i 62i)n- 1
where K = constant
1
and L = [ - n K " - - ~ " - ' k2(n- 1)]
The relation between K and L is a consequence of the momentum equation
Cfi _ d (Ri ~2i) (4) 2 d (R i xi) "
If F,~ F~ and F6 are constants for a particular flow, it follows from (4) and the corresponding equation for compressible flow
C I _ d (R62)
2 d (Rx) ' (5)
that
F~F~ = F~, (6)
whatever the functional form of the skin-friction law. Consequently the compressible law corresponding to (3) is
K L CI = ± i = 1 i • (7)
Fc (Fx)" (Rx)" F¢ (F6)"- 1 (R62)"- a
Thus any combination
! (8) Fc(Fx)" = N = constant ,
or alternatively
1 1 F,. (Fa)"- 1 = N n- 1' (9)
will yield the same compressible skin-friction law, i.e. however arbitrary the choice of F x or F6, the same law will result i fF c is then chosen to fit a given set of experimental data. Since in most methods the scaling factors are derived empirically, or at least the factors proposed are justified by comparison with experi- ment, it is difficult to make a critical assessment of the various theories simply by further comparisons with experimental values of skin friction.
Application of most methods to adiabatic flow leads to F c > 1 ; Fx, F6 < 1 ; that is to say, a compres- sible flow corresponds to an incompressible flow at lower Reynolds number. It seems intuitively reason- able that this should be so, since it is generally accepted that viscosity plays an important part only in the region close to the wall. With increasing Mach number the static temperature at the wall increases relative to that outside the boundary layer, the kinematic viscosity (which varies across the layer roughly as the square of temperature) increases also, and there is therefore a relative reduction in the local unit Reynolds number close to the wall.
2.2. Particular Methods. 2.2.1. Intermediate-temperature methods. It is supposed that, if fluid density and viscosity are
evaluated at some temperature T' intermediate between the temperature of the wall T w and that of the external stream Te, then a single relation for skin friction may be used in both compressible and incom- pressible flow. If, for incompressible flow, this relation is written:
2%i Fp~ uei xi] P~i u~2i = Csi = ¢1 L~A' (10)
then, for compressible flow, it becomes
2% Fp' ue x 1 p' u--~ = q ' = qh L - - f - _ l
(11)
Since T' occurs part way across the boundary layer and static pressure is constant,
p' T' = Pe Te (12)
for a perfect gas. The compressibility factors of equation (2) are thus
TI Fc = ~ ,
F x -
f iT '
and hence, from (6),
jU e
g 6 ~ - - ,U p"
(13)
Well known formulae for intermediate temperature are :
T~ 1+0"5 - 1 +0"22 T, 1 ; (14)
i.e.
T~ 1+0.5 Tw 1 +0.22 r M ~ ,
where
T~ 1 + r ( ~ _ 1 / M e 2 . r~
(15)
Alternatively
- - = ' - 1 +0"035ME. T~ 1 +0"45 \T~ (16)
Equation (14~ was given by Eckert ~ and equation (161 by Sommer and Short 2. In equation (151 r is the recover), factor, taken here to be 0'89: }' is the ratio of specific heats for the gas, laken here to be 1.4 for air: and M,. is the Mach number of the external stream. I-or adiabatic flow (71,. = 7)) lhe respective intermediate temperatures are:
r e
Eckert; -~ = 1 +0"128 m 2 (17)
r t
S o m m e r a n d S h o r t ; ~ = l+0 .115M~. (18)
2.2.2. Transformation methods. There have been several attempts to derive transformations relating the differential equations of mean motion in turbulent compressible and incompressible flows. The goal of such transformations is to enable treatments which are well established for incompressible flow to be carried over to deal with compressible flows. It is well known that for laminar flow a complete formal transformation exists between compressible and incompressible flows at constant pressure, provided that the gas is of Prandtl number unity and has viscosity proportional to temperature. Under the transforma- tion the velocity ratio u/u,, is invariant and the ordinate )~ satisfies the condition dy: ~ p dy. Consequently the momentum thickness transforms immediately to incompressible form :
oo
6z = 1 - dy J Pe Ue \ 0
0
Y
1 f p dy and 2 is a scaling factor. w h e r e ~ = ~ Pe 0
Transformations proposed for turbulent flow have usually been linked to intermediate temperature methods" for example, Spence a presented evidence showing the utility of the transformed ordinate
Y
y = f - ~ dy, where p' was evaluated at Eckert's intermediate temperature of equations (14)and (17). 0
Since then, Coles 4 has discussed transformation theory in considerable detail in a paper whose main purpose is to expound a new transformation involving scaling factors which are Reynolds-number dependent. To be compatible with each other at the wall, corresponding stations in related flows have to satisfy the relation
Cy R62 = #w Pw Cfi R62i, Pe Pe
which Coles terms the 'Law of Corresponding Stations'. Momentum-thickness Reynolds numbers are related by'
R62 = us Ri 62i, bl e
where/~s is the viscosity at a sub-layer temperature T~. This sub-layer temperature, derived empirically, is given by:
+ Te (19)
where c = (~ f f -C~) ~ .
At practical Reynolds number c is of order unity; it does however vary quite rapidly at low Reynolds number. Consequently (19), though resembling (14) and (16), often yields rather different results. Com- pressibility factors for Coles' method are :
T~ ~ F c - T~ #,v
and (20)
F~ = #--~ /zs
2.2.3. Van Driest's mixing-length method. Van Driest 5, extending the mixing-length arguments first put forward by Prandti 6, derived a skin-friction relation which for compressible flow is written:
1 [ s i n - t a+s in -1 fll V Rx C: 1 (C:)~[_ ~ - ~ = l'694+4"1321Ogto[_(~w/T-~,j (21)
where .~2=_T~ M~; B = 1+ M - 1 ;
2.42 - B B (B 2 + 4.~2) ~- ; fl (B2 + 442) ½ ,
and the viscosity law is taken to be/~ ~ T °'. In incompressible flow, equation (21) reduces to :
(C:i)---- ~ = 1.694+ 4.132 log~o [Ri xi C r J . (22)
Using the definitions (2) and equation (6) we find from (21) and (22) that the scaling factors are:
Tw~ 2 Fc = Te (sin- i a + sin- 1 fl)2,
Fx (sin-ta+sin-~fl)Z(T~) t+~' = 42 ~ (23)
and
2.2.4. The method of Spalding and Chi. These authors, in a review v of the then existing theories for skin friction, concluded from extensive comparisons with experiment that mixing-length theories were the most successful. They went on from this to develop an empirical theory of their own, taking
/ t k / . t \
as a starting point F~to be defined in equation (23)but with r ( ~ - ) M 2 substituted for ( ~ ) M 2 \ /
in van Driest's expressions for A, B, ~ and ft. Recovery factor was taken as 0.89 and F a was chosen empiri- cally, from a least-squares fit to the available data, as :
(24)
For adiabatic flow the method gives similar results to intermediate temperature theory. In flows with appreciable heat transfer, however, the variation of skin friction with heat transfer is, according to Spalding and Chi, considerably less than that predicted by earlier theories.
The empirical development of the method can be criticised on the grounds that it was based on experi- mental data of very uneven quality, and that too much reliance was placed on the viscosity law # ~ T ° ' 7 6 .
This approximation is not very accurate for wind-tunnel conditions. Nevertheless, subsequent work has tended to confirm the value of the Spalding and Chi method as an engineering tool.
2.2.5. The method off Winter and Gaudet. Winter and Gaudet s, in an extension of previous work 9, have recently presented a correlation based on the observation that the shape of the velocity profile does not vary perceptibly when Mach number is varied with Reynolds number (based on some character- istic overall scale of the boundary layer) held constant. They have found that skin friction in adiabatic flow can usefully be expressed as a function of Reynolds number based on a kinematic integral* analogous to momentum thickness:
FcC s = ~z[R62(")]
where
o
(25)
It follows immediately that
F a -
6z
and for this Winter and Gaudet x derived the empirical relation
F a = 1 + 0.056 M 2 . (26a)
At the same time it was found that a suitable empirical form for Fc was
F~ = (1 + ~ - ~ M2/½ (26b)
*Winter and Gaudet 8 denote these integrals by the superscript i, but, to avoid confusion with the present notation of equation (2), the superscript u is used in this Report.
and so, from (6),
1 +0 .056 Fx - (1 +0.2 M~) ~" (26c)
It is interesting to note that the correlation of Winter and Gaudet differs from all others in having F ~ > 1.
2.2.6. General calculation procedures. Recently a number of authors have proposed that boundary- layer development in flows with pressure gradients may be calculated using finite difference methods to solve a set of partial differential equations which includes, explicitly or implicitly, a modelling of the turbulence structure. In applying such methods to compressible flow, the authors commonly assume that their model of the turbulence structure is not influenced by compressibility. It is then possible to use the method, as Bradshaw and Ferriss 1° have done, to compute constant-pressure flows at various Mach numbers. From such computations we could, of course, determine the relation between Cy and Re] 2. Bradshaw and Ferriss illustrate their method by presenting example velocity profiles at Mach numbers of 0, 1, 2.2, 3 and 4. For these illustrative examples, computed skin-friction coefficients are within 2.5 per cent of the predictions of Spalding and Chi.
2.3. Comparison of Methods. A selection of skin-friction relations for adiabatic flow at M = 4 is shown in Fig. 1. Although some
of the difference between these relations arises because they are based on different skin-friction relations for incompressible flow, the major source of discrepancy is the choice of the factors F~, Fx and Fv Com- pressibility factors for all the methods discussed earlier, except the last for which none are given, are compared in Table 1. True viscosity for this table was obtained from Sutherland's law, written
kt = 3'045 x 10 -s T3/2
T + 110.4 slug/ft sec at T°K.
In the temperature range appropriate to wind-tunnel flow the exponent e) in a power viscosity law is rather higher at free-stream temperature than at wall temperature. The effect of different viscosity assump- tions on the relation proposed by van Driest is included in Table 1.
The table includes two extra quantities. The first is the product F c F~ which, for o2 unity, would be unity in an intermediate temperature method, and which for transformations is equal to /~e Pe/P~ P~ according to Coles' 'Law of Corresponding Stations'. The last column gives f:,. (F~) "~ with n taken as 5:
according to the arguments of Section 2.1, this quantity should not vary much between methods.
3. Description of Experiment. 3.1. VC~nd Tunnel and Model Mounting.
The tests were performed in the 3ft by 4ft supersonic tunnel at R.A.E. Bedford. This is a continuous tunnel fitted, at the time of the tests, with a wooden nozzle producing a Mach number of approximately four. Models to be tested in the tunnel are mounted so as to protrude forward from a model-support section which is wheeled up on a railway to the downstream end of the nozzle. The flat plate on which the present measurements were made was mounted, working face downwards, from the underside of support arms screwed to the sides of a model-support section.
3.2. Model. Since the model, illustrated in Fig. 2, had to enter the nozzle as described above, its span was limited
to 35 inches to provide a half inch clearance from the nozzle walls on each side. It consisted of a mild- steel plate, with a centre-line chord of 65 inches, having its working (lower) surface ground smooth to within 25#inches. The leading edge was chamfered on the upper side at 10 degrees included angle to a

nose of thickness 0.01 inch. Downstream of the chamfer the upper surface of the plate was ground, over the central third of its span, to be flat and parallel with the working surface so as to provide an instrumen- tation platform. The main instrumentation stations were twenty two holes, 1-625 inches in diameter, arranged along the centre line of the plate in alternate staggered rows of three and two. This arrangement provides four identical groups of five holes followed by a final downstream pair. The holes could be filled with instrumented plugs whose faces were flush with the plate surface to within 0.0005 inch.
3.3. Instrumentation.
The main instruments--traversing probes, skin-friction meter and surface pi tot- tubes--are described in separate sub-sections. Pressures and temperatures were measured and recorded in the following ways.
Surface pitot pressures and associated static pressures were measured by a Statham PA 208 TC-350 transducer having a range of 0-10 inches Hg absolute. It was used in conjunction with a Scanivalve 48D stepping switch, operated with alternate ports connected to vacuum to ensure that all measured pressures were approached from below.
Traverse probe pressures were measured by a C.E.C. 4-312 differential transducer of range _ l0 inch H~r One side of this transducer was connected to a reference tank whose pressure, which was controllable, was monitored by a Midwood 0,60 inch Hg, servo-balanced, capsule and weighbeam manometer.
Copper-constantan thermocouples with beads of about 0.01 inch diameter were used to recast, re all temperatures. Their reference junctions were enclosed in a chamber immersed in a water bath in which the temperature was controlled and measured to an accuracy of +_0-1°C.
Thermocouple and pressure-transducer voltages were fed to Speedomax G recorders which, like the Midwood manometer, were fitted with shaft encoders supplying digital information to punched cards.
3.3.1. Pitot traverse gear. Two identical, electrically driven traverse mechanisms were used. The associated pitot probes had round tips both with outside diameters of 0.014 inch but with different internal diameters. One, which was used at stations 2.5 inches to the port side of the centre line and at distances of 42, 32 and 22 inches from the leading edge, had an internal diameter of0.011 inch. The other, used at stations 2.5 inches to starboard of the centre line and 46, 36, 26 and 16 inches from the leading edge, had an internal diameter of 0.005 inch.
A traverse mechanism and an enlarged view of a probe head are illustrated in Fig. 3. As shown, each pitot-tube contained a thermocouple bead. The temperature of this bead was recorded while air was being sucked through the probe at a rate sufficient to choke its entry. Pressure measurements were made during separate runs.
A twelve-step transmitter gave pitot stem movement with a resolution of 0.0001 inch from a datum determined by electrical contact between the tip of the probe and the surface of the instrumented plug.
3.3.2. Floating-element skin-fi'iction meter. The skin-friction meter is illustrated in Fig. 4. The element was circular and had a diameter of 0-312 inch. The thickness of its edge was kept to a minimum (0.0l inch) to ensure that the chordwise force arising from any streamwise pressure gradients would be small. Static-pressure tappings were not provided in the housing around the element to sense any pressure forces on it, because there was not sufficient space available. The average gap around the element was 0.005 inch. The element was supported by encastr6 leaf springs and allowed to move under load. Its movement was measured by a Schaevitz linear variable differential transformer energised by 3 volts at 5 kHz. Vibration of the element was heavily damped by vanes moving in dashpots of 100 centistoke silicone oil. To calibrate the meter, weights were placed in a scale pan, hanging on a thread which passed over a pulley mounted on jewel bearings, to apply a tangential force to the element.
3.3.3. Surface static and pitot pressures. As shown in Fig. 5, two configurations of pressure-tapped plug were used. Static pressures were measured using a plug with two tappings abreast of each other and one inch apart. Surface pitot pressures were measured on a plug with three tappings, two of which were covered by pieces of razor ~,lade. Each piece of razor blade, 0-25 inch square and originally 0.01
10
inch thick, had 0-004 inch ground from one face to reduce its thickness and produce a profile resembling that of a Stanton tube. It was cemented onto the plug, either directly or on top of one or two packing pieces of thin card, with its leading edge 0.001 inch aft of the upstream edge of the pressure tapping; the result was a family of pitots of varying heights and of approximate, but not strict, geometric similarity. Two plugs were used in the experiments, each carrying two pitots (the heights are given in Fig. 5). One plug, with pitots of height 0-0060 and 0.0127 inch, was fitted 1"25 inches to port of the centre line at stations 48.5, 38-5, 28.5 and 18.5 inches from the leading edge. The other was fitted on the centre line at distances of 54-5, 44.5, 34.5 and 24.5 inches from the leading edge and also, to provide a check between plugs, at 28.5 inches from the leading edge in the hole offset 1.25 inches to port.
3.3.4. Transition indicator. Transition regions were made visible by sublimation of azobenzene coatings from the surface of the plate. The coatings were sprayed on to the plate as a solution of one volume of the dry indicator in ten volumes of acetone. Quantities used, including wastage, were about 50 cc per square foot of plate surface. The distance between the spray gun and plate surface had to be controlled ; when the gun was too close the plate received a very thin coating, initially a very wet 'wash', while if the gun was too far away the coating was thick and coarse-grained. It was necessary to run the tunnel for more than an hour (at a stagnation temperature of 40°C) to allow the transition pattern to develop fully. Later work on other models has shown that acenaphthene, which sublimes more rapidly, can be used successfully in this tunnel.
3.4. Test Procedure. Tests were performed at a total temperature of 40°C and at total pressures of 25, 50, 100 and 200 inch
Hg absolute. Resulting unit Reynolds numbers ranged from about 9.4 × 10⁴ to 7.4 × 10⁵ per inch. At each total pressure the skin friction was measured by the floating element, surface pitot and static pres- sures were recorded, and boundary-layer traverses were made. Since the readings of the skin-friction meter were not steady, about twenty readings were recorded during every pitot traverse. At each station and total pressure two traverses were made, one for pitot pressure and the other for temperature, and skin friction was thus obtained as the average of forty readings.
The instrumentation group is shown in Fig. 6. Its layout was chosen after preliminary tests to examine the possibility of interference between the various instruments in the group. The group was initially at its rearmost position on the plate and was subsequently moved forward.
Azobenzene sublimation patterns were obtained during separate runs.
4. Results. The main results of the experiment are given in Tables 2 to 4, and the skin friction measurements and
some features of the velocity profiles are illustrated in Figs. 10 to 16. Wall temperatures and freestream Mach numbers at the stations of the pitot traverses are shown in Fig. 7. The Mach numbers were deter- mined from the ratio of freestream pitot pressure to tunnel total pressure. Transition positions are shown in Figs. 8 and 9.
4.1. Accuracy. Traverse pitot pressures were measured to within _+ 0.02 inch Hg and probe positions to within + 0.0005
inch, but there will probably be a pitot displacement error on all readings. A special form of this error is noticeable close to the plate in the thickest boundary layers, for which the apparent velocity has a minimum away from the wall. It resembles errors noted 11 in traverses of laminar boundary layers in compressible flow. It seems likely that outside the immediate vicinity of the wall an outward displace- ment effect of approximately 0-15 pitot outside diameter should be expected. This is the value found 1 z in low-speed flow, and there is some evidence la that compressibility does not affect displacement errors. Measurements at 25 inch and 50 inch Hg total pressure are probably subject to some viscous error on pitot readings. According to MacMillan 14, this error depends on a pitot Reynolds number based on the internal diameter of the probe; it becomes negligible only when the probe Reynolds number exceeds 200.
11
Velocities in the inner parts of the profiles at 25 inch Hy total pressure, where probe Reynolds numbers less than 20 occurred, might therefore be overestimated by several per cent. At 50 inch Hy total pressure the error should not exceed one per cent.
The recovery factors of the probes when used for measuring total temperature, determined from their readings outside the boundary layer, were rather low (0.9 approximately). The accuracy with which these factors applied within the boundary layer is not known, but the possibility of errors of several degrees C cannot be entirely discounted.
The static calibration of the skin-friction meter was repeatable to within _ 1 per cent of the maxinaum measurable force: i.e. approximately 0.5 gm. This latter corresponds to a Cy of slightly less than 0.002 at a total pressure of 200 inch H q. This is only one factor in the overall accuracy of the meter. The meter was normally adjusted so that the element was recessed less than 0.0005 inch within its housing. Auxiliary tests showed that this procedure, which was adopted for convenience, was likely to reduce the force carried by the element by 3 per cent compared to the force it would bear if truly flush with the main surface. The area of the element and its surrounding gap was 6 per cent greater than the area of the element alone. Coles ~ has argued that the meter will record half the drag force on the gap, and has suggested that the effective sheal" stress on the gap will be of order twice that on the nearby smooth surface. Hence the combined error due to the gap and recessing the element may be an overestimation of shear stress by up to 3 per cent. Further sources of error in the instrument were zero shift and unsteadiness of reading which both occurred while the tunnel was running. These were examined, after the main measurements had been made, during some experiments by D. G. Mabey which formed part of a continuing investigation of techniques for skin-friction measurement. The zero shift was caused by bending of the plate and its supports under aerodynamic load and thermal stress. This bending tilted the meter and thus subjected the element to a gravitational force. For stations towards the rear of the plate the correction which has been applied to the meter reading is -8 -5 per cent (with an estimated uncertainty of _ 3-4 per cent) for the two highest total pressures. At other stations and total pressures the correction is larger and less certain. The unsteadiness of meter reading, much of which was due to an oscillating component in the tunnel flow at 6 Hz which coincided with the natural frequency of the element suspension, had an rms magnitude of about 5 per cent of the time-mean reading. Since the final values taken for skin friction were each the results of two tunnel runs, and were thus the average of some forty readings or more, meter unsteadiness is not expected to contribute significantly to the overall uncertainty of the measure- ments. The results presented in the tables have been corrected for zero shift, but no correction has been made for the combined effects of element recessing and gap force.
The overall accuracy of skin-friction coefficients derived from surface pitot measurements depends on the accuracy of the calibration function employed and on the accuracy of measurement of pitot height and pitot pressure. At best, that is for the largest pitot at 200 inch H9 total pressure, the accuracy in the present experiments was about 4-5 per cent. The calibration function used was the one presented by Hopkins and Keener in Fig. 18 of Ref. 15. lit was extended to lower values of its constituent variables by relating results, from the present tests, of pitots having differing heights. This was possible because the pitot of h = 0.0127 inch was always tested at stations between two at which the pitot of h = 0.0223 inch was used. Consequently, if the reading of the larger pitot fell on the adopted calibration, the skin friction at the position of the smaller pitot could be deduced by interpolation and the reading of the smaller pitot then used to extend the calibration. Readings from the two small pitots were rejected, primarily because the readings of these pitots appeared to be unduly influenced by the presence of their larger neighbours.
4.2. Transition Positions.
Transition regions as indicated by azobenzene sublimation are shown in Fig. 8. Parts (a) and (b) of this figure show how, at a total pressure of 25 inch Hg, the surface pattern changes with time. Parts (e) and (I) show the same effect at a total pressure of 200 inch Hg. Although the later photographs illustrate the transition region more clearly, the actual position of transition can in each case be estimated quite well from the earlier photograph; i.e. the position of transition deduced from the photographs is not
12
critically dependent on the time allowed for the pattern to form. The variation of transition Reynolds number with total pressure is given in Fig. 9. The loci of maximum
and minimum surface pitot pressures are also shown. The surface pitots indicate a broader transition region than does the sublimation technique.
4.3. Skin-friction Measurements. Skin friction measurements are listed in Table 2. It is found, by comparing skin-friction coefficients
with rate of growth of momentum thickness, that there is an imbalance in the momentum equation indicative of flow convergence along the plate centre line. Further evidence of convergence is provided by the sublimation patterns, Figs. 8a, b and c, which show traces downstream from deliberate leaks through two pressure tappings. This convergence is very slight, and probably will not give rise to any perceptible spanwise variation of such parameters as boundary-layer thickness and profile shape para- meter. Nevertheless, its contribution to the momentum equation is sufficiently large (in places, of order 25 per cent) to rule out the use of length of streamwise run as a meaningful scale for the boundary layer. For this reason, in presenting the skin friction measurements, Reynolds number based on momentum thickness is taken to be the only parameter with which they can profitably be correlated.
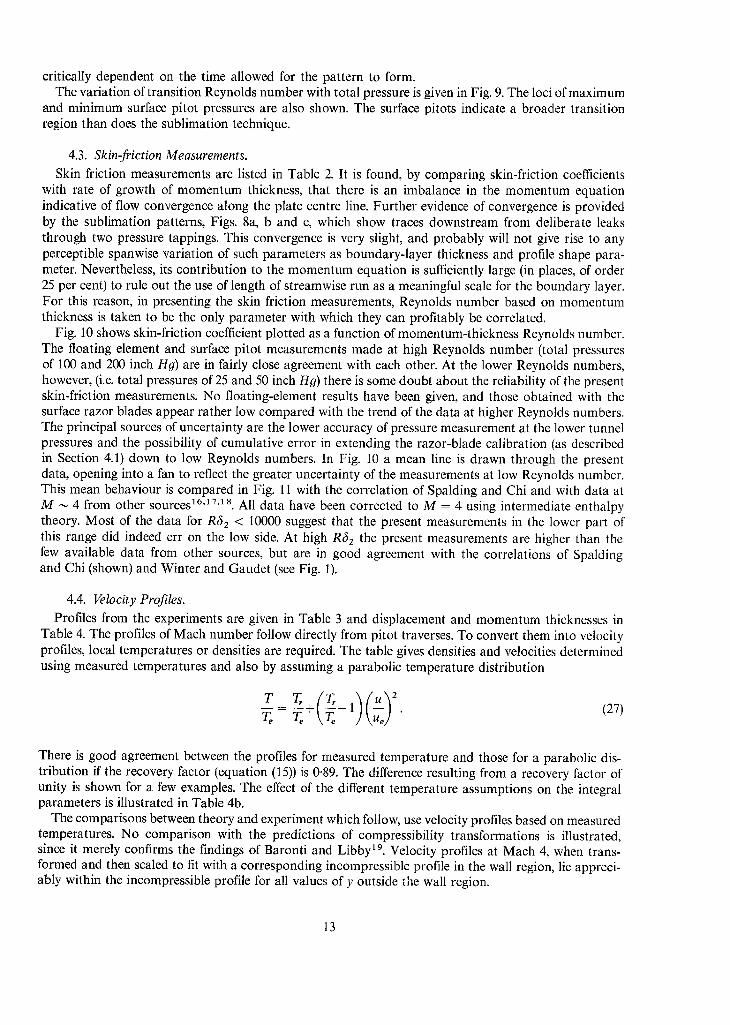
Fig. 10 shows skin-friction coefficient plotted as a function of momentum-thickness Reynolds number. The floating element and surface pitot measurements made at high Reynolds number (total pressures of 100 and 200 inch Hg) are in fairly close agreement with each other. At the lower Reynolds numbers, however, (i.e. total pressures of 25 and 50 inch Hg) there is some doubt about the reliability of the present skin-friction measurements. No floating-element results have been given, and those obtained with the surface razor blades appear rather low compared with the trend of the data at higher Reynolds numbers. The principal sources of uncertainty are the lower accuracy of pressure measurement at the lower tunnel pressures and the possibility of cumulative error in extending the razor-blade calibration (as described in Section 4.1) down to low Reynolds numbers. In Fig. 10 a mean line is drawn through the present data, opening into a fan to reflect the greater uncertainty of the measurements at low Reynolds number. This mean behaviour is compared in Fig. 11 with the correlation of Spalding and Chi and with data at M ,-~ 4 from other sources 16"17'18. All data have been corrected to M = 4 using intermediate enthalpy theory. Most of the data for R62 < 10000 suggest that the present measurements in the lower part of this range did indeed err on the low side. At high R62 the present measurements are higher than the few available data from other sources, but are in good agreement with the correlations of Spalding and Chi (shown) and Winter and Gaudet (see Fig. 1).
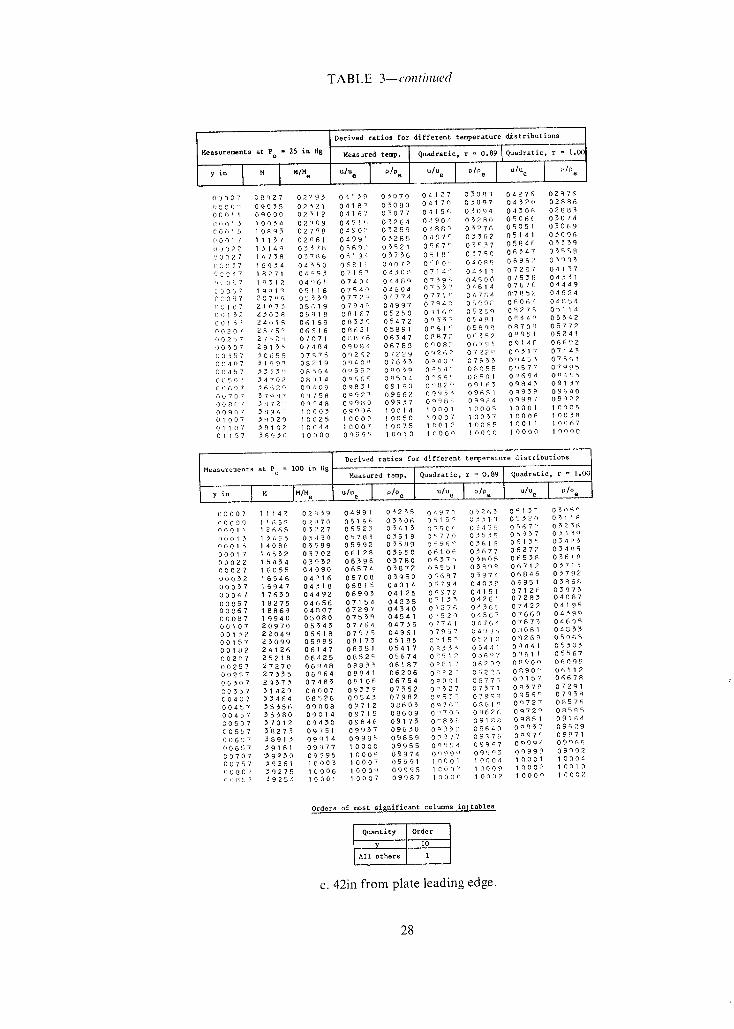
4.4. Velocity Profiles. Profiles from the experiments are given in Table 3 and displacement and momentum thicknesses in
Table 4. The profiles of Mach number follow directly from pitot traverses. To convert them into velocity profiles, local temperatures or densities are required. The table gives densities and velocities determined using measured temperatures and also by assuming a parabolic temperature distribution
T~- T~ ~ - 1 ~ . (27)
There is good agreement between the profiles for measured temperature and those for a parabolic dis- tribution if the recovery factor (equation (15)) is 0.89. The difference resulting from a recovery factor of unity is shown for a few examples. The effect of the different temperature assumptions on the integral parameters is illustrated in Table 4b.
The comparisons between theory and experiment which follow, use velocity profiles based on measured temperatures. No comparison with the predictions of compressibility transformations is illustrated, since it merely confirms the findings of Baronti and Libby tg. Velocity profiles at Mach 4, when trans- formed and then scaled to fit with a corresponding incompressible profile in the wall region, lie appreci- ably within the incompressible profile for all values of y outside the wall region.
13
Comparison with other theories is made, first, in terms of the velocity defect (Ue-U) /U,w--where u~ = (~,,/pw)~--expressed as a function of y/6. Fig. 12 shows theoretical velocity-defect profiles at M = 4 drawn from three sources; the correlation of Winter and Gaudet s, the correlation of Maise and McDonald 2°, and the sample velocity profile calculated by Bradshaw and Ferriss 1° (M = 4, R ~ 2 = 149 000). The correlation of Maise and McDonald comes from an extension of the mixing-length arguments used by van Driest to derive the skin-friction relation of Section 2.2.3. It results in a unique velocity-defect law written in terms of a generalised velocity u* (= x ~ o arc sin [u/,,2/2ho] in flow with constant stagnation enthalpy he throughout the boundary layer). Fig. 12 shows the spread of the cor- relation in natural coordinates for the range Rt'SJ2 = 5000 (upper line) to RcS 2 = 150 000 (lower line). To make the vertical scales compatible for the three theories, the friction velocity u.,. appearing in the ordinate of Fig. 12 is in each case based on the theoretical wall shear stress and on a wall density cor- responding to adiabatic flow with recovery factor unity. As the figure shows, the differences between the three theories are small.
In Fig. 13 one of these relations, that of Winter and Gaudet, is compared with some of the present experimental results. In this Figure u~w is based on the actual density at an adiabatic wall, ~ is taken as y at u/u,, = 0.99, and for clarity only a few points from each profile are plotted. The spread of the experi- mental profiles is appreciably greater than that between the three theories of Fig. 12 and reveals a system- atic variation of defect with Reynolds number. At the higher Reynolds numbers the agreement with the theoretical line is very satisfactory, velocities being predicted to better than 2 per cent over virtually the whole of the boundary layer. The trend of the data away from this line as Reynolds number decreases is shown consistently by all the measured profiles and illustrates a phenomenon shown previously by Coles 4 to occur in incompressible flows.
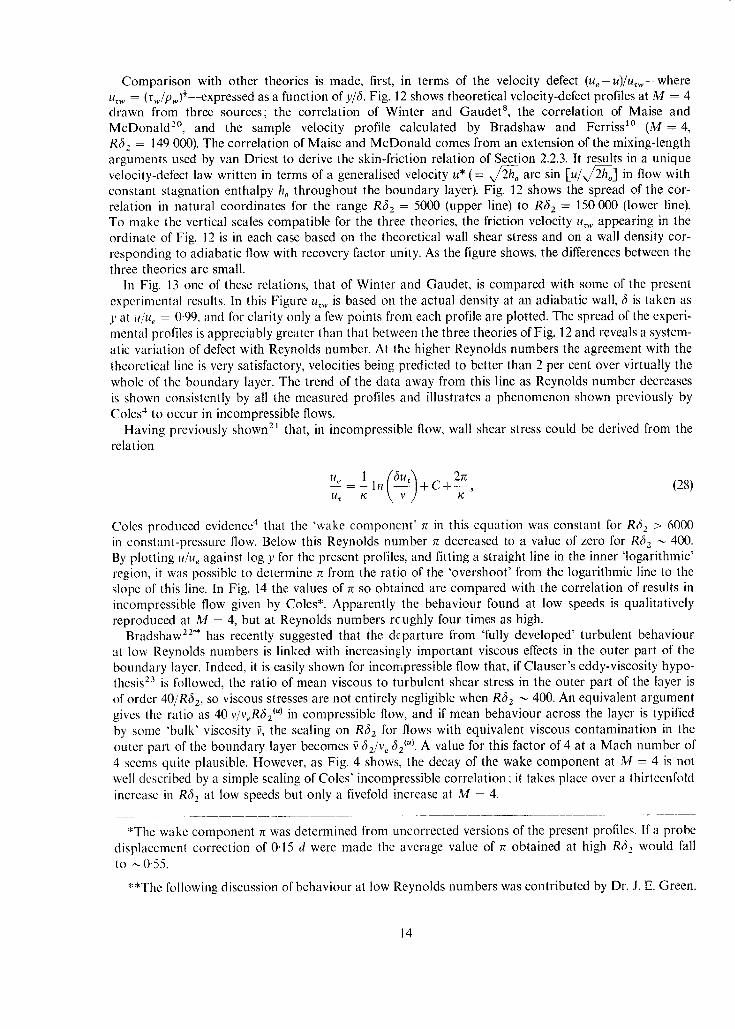
Having previously shown 21 that, in incompressible flow, wall shear stress could be derived from the relation
Coles produced evidence 4 that the 'wake component ' n in this equation was constant for R(~ 2 > 6000 in constant-pressure flow. Below this Reynolds number n decreased to a value of zero for R62 ~ 400. By plotting u/us against log y for the present profiles, and fitting a straight line in the inner 'logarithmic' region, it was possible to determine n from the ratio of the 'overshoot' from the logarithmic line to the slope of this line. In Fig. 14 the values of n so obtained are compared with the correlation of results in incompressible flow given by Coles*. Apparently the behaviour found at low speeds is qualitatively reproduced at M = 4, but at Reynolds numbers rcughly four times as high.
Bradshaw 22.* has recently suggested that the departure from 'fully developed' turbulent behaviour at low Reynolds numbers is linked with increasingly important viscous effects in the outer part of the boundary layer. Indeed, it is easily shown for incompressible flow that, if Clauser's eddy-viscosity hypo- thesis 23 is followed, the ratio of mean viscous to turbulent shear stress in the outer part of the layer is of order 40/R(52, so viscous stresses are not entirely negligible when R(5 z ,,~ 400. An equivalent argument gives the ratio as 40 v / v e R 6 f ') in compressible flow, and if mean behaviour across the layer is typified by some 'bulk' viscosity ~, the scaling on R62 for flows with equivalent viscous contamination in the outer part of the boundary layer becomes ~ (52/v e 62 ~"). A value for this factor of 4 at a Mach number of 4 seems quite plausible. However, as Fig. 4 shows, the decay of the wake component at M = 4 is not well described by a simple scaling of Coles' incompressible correlation : it takes place over a thirteenfold increase in R~32 at low speeds but only a fivefold increase at M = 4.
*The wake component ~ was determined from uncorrected versions of the present profiles. If a probe displacement correction of 0.15 d were made the average value of 7r obtained at high R,52 would fall to 40"55.
**The following discussion of behaviour at low Reynolds numbers was contributed by Dr. J. E. Green.
14
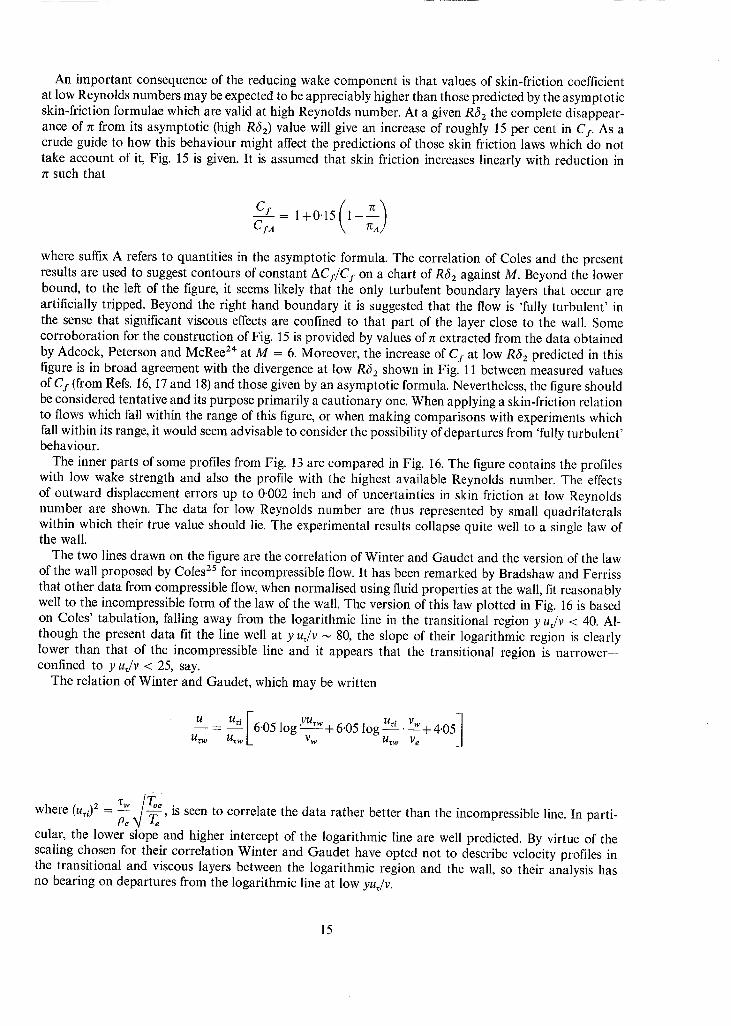
An important consequence of the reducing wake component is that values of skin-friction coefficient at low Reynolds numbers may be expected to be appreciably higher than those predicted by the asymptotic skin-friction formulae which are valid at high Reynolds number. At a given R62 the complete disappear- ance of n from its asymptotic (high R6z) value will give an increase of roughly 15 per cent in C~. As a crude guide to how this behaviour might affect the predictions of those skin friction laws which do not take account of it, Fig. 15 is given. It is assumed that skin friction increases linearly with reduction in n such that
Cfa
where suffix A refers to quantities in the asymptotic formula. The correlation of Coles and the present results are used to suggest contours of constant ACI/C I on a chart of Re52 against M. Beyond the lower bound, to the left of the figure, it seems likely that the only turbulent boundary layers that occur are artificially tripped. Beyond the right hand boundary it is suggested that the flow is 'fully turbulent' in the sense that significant viscous effects are confined to that part of the layer close to the wall. Some corroboration for the construction of Fig. 15 is provided by values of n extracted from the data obtained by Adcock, Peterson and McRee 24 at M = 6. Moreover, the increase of C I at low R62 predicted in this figure is in broad agreement with the divergence at low R62 shown in Fig. 11 between measured values of C c (from Refs. 16, 17 and 18) and those given by an asymptotic formula. Nevertheless, the figure should be considered tentative and its purpose primarily a cautionary one. When applying a skin-friction relation to flows which fall within the range of this figure, or when making comparisons with experiments which fall within its range, it would seem advisable to consider the possibility of departures from 'fully turbulent' behaviour.
The inner parts of some profiles from Fig. 13 are compared in Fig. 16. The figure contains the profiles with low wake strength and also the profile with the highest available Reynolds number. The effects of outward displacement errors up to 0.002 inch and of uncertainties in skin friction at low Reynolds number are shown. The data for low Reynolds number are thus represented by small quadrilaterals within which their true value should lie. The experimental results collapse quite well to a single law of the wall.
The two lines drawn on the figure are the correlation of Winter and Gaudet and the version of the law of the wall proposed by Coles 25 for incompressible flow. It has been remarked by Bradshaw and Ferriss that other data from compressible flow, when normalised using fluid properties at the wall, fit reasonably well to the incompressible form of the law of the wall. The version of this law plotted in Fig. 16 is based on Coles' tabulation, falling away from the logarithmic line in the transitional region y u Jr < 40. Al- though the present data fit the line well at y uJv ~ 80, the slope of their logarithmic region is clearly lower than that of the incompressible line and it appears that the transitional region is narrower-- confined to y u Jr < 25, say.
The relation of Winter and Gaudet, which may be written
- - ~ flUTw U~i Vw u u~i ['6.05 log + 6"05 l o g - - • - - + 4-05] r t~ U~w [_ v w rt~w Ve _]
w h e r e t . . ) 2 = /Toe Pe ~/T~ ' is seen to correlate the data rather better than the incompressible line. In parti-
cular, the lower slope and higher intercept of the logarithmic line are well predicted. By virtue of the scaling chosen for their correlation Winter and Gaudet have opted not to describe velocity profiles in the transitional and viscous layers between the logarithmic region and the wall, so their analysis has no bearing on departures from the logarithmic line at low yuJv.
15
5. Conclusions. Skin-friction measurements at high Reynolds number are close to the predictions of Spalding and
Chi and of Winter and Gaudet. At low Reynolds number the skin-friction coefficients are less certain. Other skin-friction measurements and the collapse of the present velocity-profile measurements support the higher of two tentative trend lines faired through the skin-friction measurements at low Reynolds number. The higher trend diverges from the predictions of the ~asymptotic' skin-friction formulae which are the most successful at high Reynolds numbers.
Velocity profiles near the wall, when normalised with respect to fluid properties at the wall, show a logarithmic line which has a lower slope and higher intercept than in incompressible flow. This behaviour is well predicted by the correlation of Winter and Gaudet. Velocity-defect profiles at high Reynolds number are in reasonably good agreement with a number of proposed correlations. As Reynolds number decreases the velocity defect is observed to decrease as a result of the progressive decay of the wake component ~z of the velocity profile. This decay, which might be associated with the increasing importance of viscous effects in the turbulent outer layer, is thought to be the reason why asymptotic skin-friction formulae appear to underestimate skin-friction at low Reynolds numbers. At M = 4 the decay sets in at values of momentum-thickness Reynolds number roughly four times as high as in incompressible flow.
6. Acknowledyements.
The original measurements, obtained in the winter of 1963/64, seemed difficult to reconcile with the boundary layer correlations which Winter and Gaudet were beginning to develop at that time, and which ultimately took the form outlined in Section 2.2.5. The resolution of this difficulty stems largely from D. G. Mabey's improved assessment of the accuracy of the skin friction meter measurements (Section 4.1) and J. E. Green's argument on low Reynolds number effects (Section 4.4).
These important contributions are most gratefully acknowledged.
16

m _
A B
C
C
C~.
F~, Fx, F ~
h
ho
K, L, n
N
M
r
R
T
7"o
U
U*
U ~
X
Y
62
2
#
V
P
LIST OF SYMBOLS
Parameters in van Driest's mixing-length theory (equation (21))
Coles' friction parameter (equation (19))
Additive constant in logarithmic inner law (equation (28))
Local skin-friction coefficient (equations(I))
Compressibility factors (equations (2))
Height of surface pitot
Stagnation enthalpy
Constants in simple incompressible law (equation (3))
Approximate invariant between different theories (equation (8))
Mach number
Recovery factor (equation (15))
Unit Reynolds number (equations (1))
Static temperature
Stagnation temperature
Velocity
Generalised velocity (= x/~o arc sin [-u/x/~o] ) in mixing-length theory for adiabatic flow
Friction velocity (= x / ~
Distance along the wall measured from the virtual origin of the turbulent layer
Distance away from the wall
Parameters in van Driest's mixing-length theory (equation (21))
Ratio of specific heats
Boundary layer thickness
Displacement thickness
Momentum thickness
Inverse of slope of logarithmic velocity profile (equation (28))
Scaling factor or ordinate in compressibility transformation
Absolute viscosity
Kinematic viscosity (= #/p)
Wake component of velocity profile (equation (28))
Density
Shear stress
17

LIST OF SYMBOLS--continued
6O
Subscripts e
r
w
s
i
Superscripts U
General functional form of skin-friction law
Exponent in viscosity/temperature relation (# ~ T '~)
Denotes conditions in the external stream
Denotes 'recovery' conditions, at an adiabatic wall
Denotes conditions at the wall
Denotes Coles' 'substructure' reference condition
Denotes the equivalent conditions in incompressible flow
Denotes 'kinematic' integral parameters
Denotes either
(a) quantities in a transformed plane or
(b) 'bulk' quantities representing some average for the whole boundary layer
Denotes properties evaluated at an intermediate temperature
18
No. Author(s)
1 E .R .G . Eckert . .
2 S.C. Sommer and Barbara J. Short
3 D.A. Spence . . . .
4 D.E. Coles . . . . . .
5 E.R. van Driest . . . .
6 L. Prandtl . . . . . .
7 D.B. Spalding and S. W. Chi
8 K .G . Winter and L. Gaude t . .
9 K .G . Winter, K .G . Smith and L. Gaudet . . . . . .
10 P. Bradshaw and D. H. Ferriss . .
11 R.J . Monaghan . . . .
12 F.A. MacMillan . . . .
13 G.B. Marson and G. M. Lilley
14 F.A. MacMillan . . . .
15 E.J. Hopkins and E. R. Keener
LIST OF REFERENCES
71tie, etc.
•. Survey on heat transfer at high speeds. WADC TR 54-70 (1954) (P 49878).
Free-flight measurements of turbulent-boundary-layer skin fric- . . tion in the presence of severe aerodynamic heating at Mach
numbers from 2.8 to 7.0. NACA TN 3391 (A.R.C. 17614) (1950).
.. Distributions of velocity, enthalpy and shear stress in the com- pressible turbulent boundary layer on a flat plate.
J. Fluid Mech., 8, 368-387 (1960) A.R.C. 21642 also R.A.E. Report Aero 2631 (1959).
The turbulent boundary layer in a compressible fluid. Project Rand Rep. R--403-PR (A.R.C. 24497) (1962).
The turbulent boundary layer with variable Prandtl number. 50 years of boundary layer research. (Ed. H. G6rtler and W. Tollmien) Braunschweig, F. Vieweg, 257-271 (1955).
Zur turbulenten Stromung in R6hren und 1/ings Platten. Ergebn. Aerodyn. Versuchsanst. G6ttingen, 4, 18-29 (1932).
The drag of a compressible turbulent boundary layer on a smooth flat plate with and without heat transfer.
J. Fluid• Mech. 18, 1,117-143 (1964).
Turbulent boundary layer studies at high Reynolds numbers at Mach numbers between 0.2 and 2.8.
R.A.E./TR 70251 (1970).
Measurements of turbulent skin friction at high Reynolds numbers at Mach numbers of 0.2 and 2.2.
AGARDograph 97, 1, 97-123 (1965).
Calculation of boundary-layer development using the turbulent . . energy equation II: compressible flow on adiabatic walls.
Published in J. of Fluid Mechanics Fol. 46, 1, pp. 83-110. (1971) A.R.C. 28541 (1966).
The use of pitot tubes in the measurement of laminar boundary layers in supersonic flow.
A.R.C.R. & M. 3056 (1955).
Experiments on pitot tubes in shear flow. A.R.C.R. & M. 3028 (1956).
The displacement effect of pitot tubes in narrow wakes. Coll. of Aero. Rep. 107 (1956).
Viscous effects of pitot tubes at low speeds. J. Roy. Aero. Soc., 58, 570-572 (1954).
Study of surface pitots for measuring turbulent skin friction at supersonic Mach numbers--adiabatic wall. NASA TN D-3478 (A.R.C. 29008) (1966).
19
LIST OF REFERENCES continued
16 C.J. Stalmach . . . .
17 D.E. Coles . . . . . .
18 F. W. Matting, D. R. Chapman, J. R. Nyholm and A. G. Thomas . . . .
19 P.O. Baronti and P. A. Libby
20 ,G. Maise and H. McDonald ..
21 D.E. Coles . . . . . .
22 P. Bradshaw . . . . . .
23 F .H. Clauser . . . . . .
24 J.B. Adcock, J. B. Peterson, Jr. and D. I. McRee . . . .
25 D.E. Coles . . . . . .
Experimental investigation of the surface impact probe method of measurin~z local skin friction at supersonic speeds.
Univ. of Texas Rep. DRL-410, CF-2675 (1958).
Measurements in the boundary layer on a smooth flat plate in supersonic flow III.
Caltech. JPL Rep. 20-71 (A.R.C. 17109) (1953).
Turbulent skin friction at high Mach numbers and Reynolds numbers in air and helium.
NASA TR R-82 (1961).
Velocity profiles in turbulent compressible boundary layers. AIAA J. 4, 193-201 (1966).
Mixing length and kinematic eddy viscosity in a compressible boundary layer.
AIAA J. 6, 73-80 (1968).
The law of the wake in the turbulent boundary layer. J. Fluid Mech. 1,191-226 (1956).
Special topics in turbulent flows. Contribution to VKI Lecture series. 10: "Turbulent boundary
layers." Von K arman Institute, Belgium, January 27-31, 1969.
The turbulent boundary layer. Advances in Applied Mechanics IV 1-51 New York, Academic Press Inc. (1956).
Experimental investigation of a turbulent boundary layer at M = 6, high Reynolds numbers, and zero heat transfer.
NASA TN D-2907 (1965).
The law of the wall in turbulent shear flow. 50 years of boundary layer research. (Ed. H. G6rtler and W. Tollmien) Braunschweig, F. Vieweg, 153-163 (1955).
20
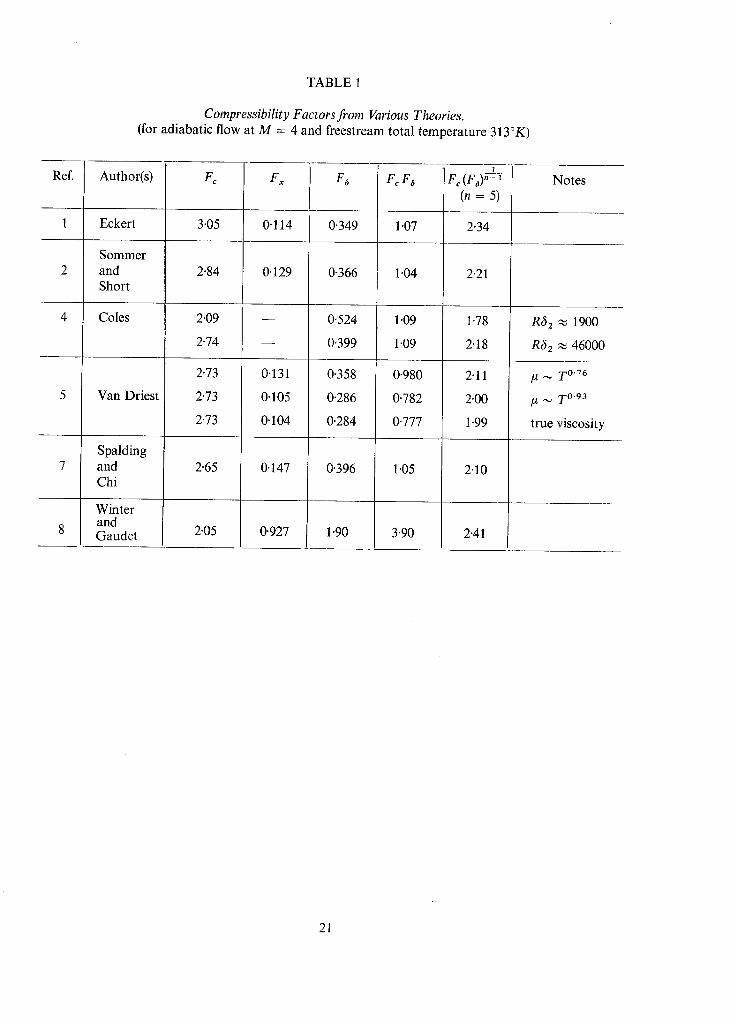
TABLE 1
Compressibility Factors from Various Theories. (for adiabatic flow at M = 4 and freestream total temperature 313°K)
Ref.
2
4
Author(s)
Eckert
Sommer and Short
Coles
Van Driest
Spalding and Chi
Winter and Gaudet
G
3"05
2"84
2"09
2"74
2"73
2"73
2"73
2"65
2"05
Fx
0.114
0.129
0"131
0-105
0"104
0.147
0.927
F~
L
0.349
0-366
0.524
0"399
0"358
0.286
0"284
0"396
1 "90
I F c F6
1 "07
1 "04
1 "09
1"09
0.980
0.782
0.777
1 "05
3"90
]F c (Fa). =11 (n = 5)
2"34
2"21
1 "78
2"18
2"11
2"00
1 "99
2"10
2.41
Notes
R62 ~ 1900
R62 ~ 46000
~ T0"76
] . / ~ T 0'93
true viscosity
21
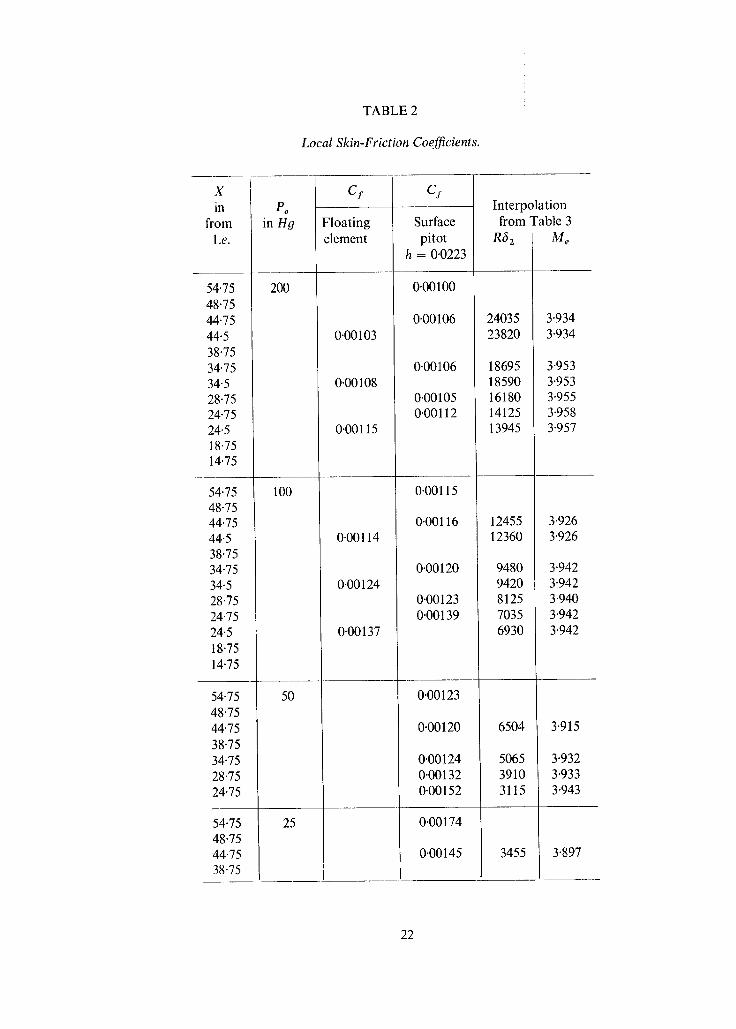
TABLE 2
Local Skin-Friction Coefficients.
X in
from l.e.
54.75 48.75 44.75 44-5 38.75 34.75 34.5 28.75 24-75 24.5 18.75 14.75
54.75 48.75 44.75 44-5 38.75 34.75 34-5 28.75 24.75 24.5 18.75 14.75
54.75 48.75 44.75 38-75 34.75 28.75 24.75
54.75 48.75 44.75 38.75
e o
in Hg
200
100
50
25
CI
Floating element
0-00103
0.00108
0.00115
0.00114
0.00124
0.00137
Surface pitot
h = 0.0223
0'00100
0"00106
0'00106
0"00105 0"00112
0"00115
0"00116
0"00120
0"00123 0"00139
0"00123
0"00120
0"00124 0"00132 0"00152
0"00174
0'00145
Interpolation ~om Table 3
R62 Me
24035 3"934 23820 3"934
18695 3"953 18590 3'953 16180 3'955 14125 3'958 13945 3"957
12455 3"926 12360 3"926
9480 3'942 9420 3"942 8125 3"940 7035 3"942 6930 3'942
6504 3"915
5065 3"932 3910 3"933 3115 3"943
3455 3"897
22

23
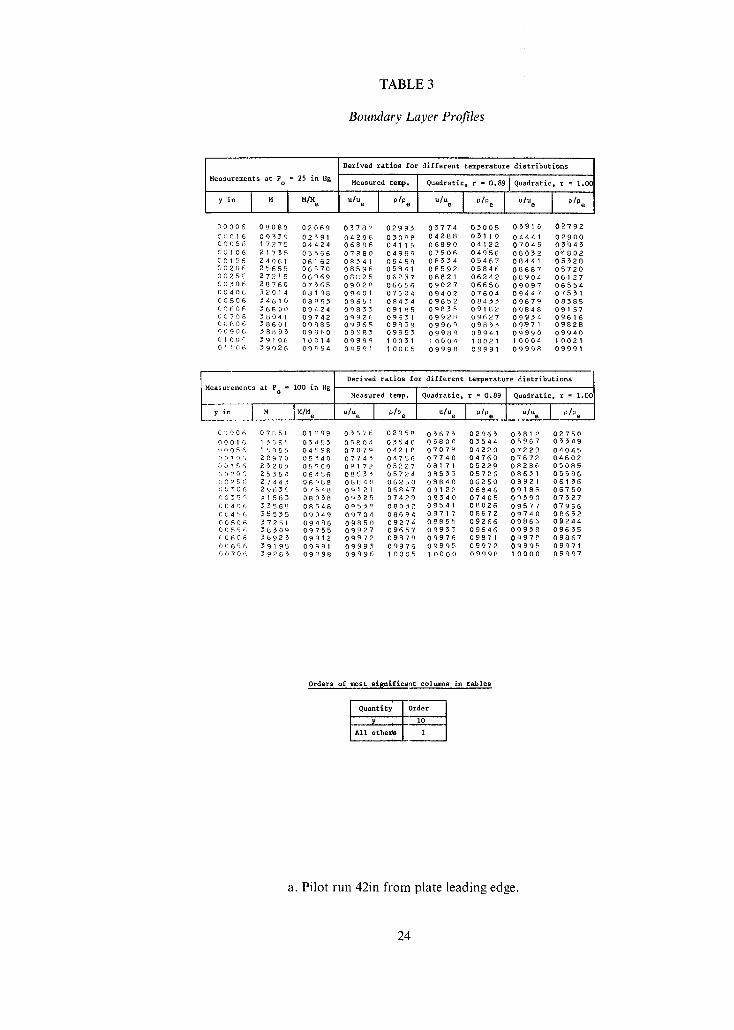
TABLE3
BoundaryLayerProfiles
Derived ratios for different temperature distributions
Measurements at Po 25 in 8g I Measured temp. Quadratic, r = 0.89 I Quadratic, r = I.OE
y i n ] M M/M e u/% j o/P e U/Ue I °/Oe I U/Ue j ° /o e
I
00006 08080 02069 0~782 02995 03774 05005 05916 02792 0 ¢ 0 1 6 0 9 5 3 8 0 2 5 9 1 04296-` 0 5 0 9 8 0 4 2 8 8 0 3 1 1 0 0 4 4 4 1 0 2 9 0 0 0 0 0 5 6 1 7 2 7 5 0 4 4 2 4 0 6 8 9 6 0 4 1 1 6 0 6 8 9 0 0 4 1 2 2 0 7 0 4 5 0 i ~ 9 4 3 0 0 1 0 6 2 1 7 5 5 0 5 5 6 6 0 7 8 8 0 0 4 9 8 9 0 7 9 0 6 0 4 9 5 6 0 8 0 5 2 0~ ,802 0 0 1 5 6 2 4 0 6 1 0 6 1 6 2 0 R 3 4 1 0 5 4 5 8 0 8 5 5 4 0 5 4 6 7 0 8 4 4 1 0 5 5 2 8 00206 25655 06570 0859~ 05841 08592 05846 08687 05720 0 0 2 5 6 2 7 2 1 5 060 ,69 0 8 8 2 5 0 6 2 5 7 0 8 8 2 1 0 6 2 4 2 0 8 9 0 4 0 6 1 2 7 00506 28760 07565 0902n 06656 09027 06656 09097 06554 0 0 4 0 6 5 2 0 1 4 0 8 1 9 8 0 9 4 0 1 0 7 6 0 4 0 9 4 0 2 0 7 6 0 4 0 9 4 4 7 0 7 5 5 1 0 0 5 0 6 5 4 6 1 0 0 8 8 6 3 0 9 6 5 1 0 8 4 5 4 0 9 6 5 2 0 8 4 3 5 0 9 6 7 9 0 8 5 8 5 0 ~ 6 0 8 5 6 8 0 0 0 9 4 2 4 0 9 8 5 5 0 9 1 8 5 0 9 8 5 5 0 9 1 8 2 0 9 8 4 6 0 9 1 5 7 0 0 7 0 6 3 8 0 4 1 0 9 7 4 2 0 9 9 2 6 0 9 6 5 1 0 9 9 2 8 0 9 6 2 7 0 9 9 5 4 0 9 6 1 6 0 0 8 0 6 5 8 6 0 1 0 9 8 8 5 0 9 9 6 5 0 9 8 5 9 0 9 9 6 ~ 0 9 8 5 5 09:971 0 9 8 2 8 0 0 9 0 6 5 8 8 9 5 0 9 9 6 0 0 9 9 8 5 0 9 9 5 5 0 9 9 8 9 0 9 9 4 1 0 9 9 9 0 0 9 9 4 0 0 1 0 0 ~" 5 9 1 0 6 1 0 0 1 4 0 9 9 9 9 1 0 0 3 1 1 0 0 0 4 1 0 0 2 1 1 0 0 0 4 1 0 0 2 1 0 1 1 0 6 5 9 0 2 6 0 9 9 9 4 0 9 9 9 1 1 0 0 0 5 0 9 9 9 8 0 9 9 9 1 0 9 9 9 8 0 9 9 9 1
Derived ratios for different temperature distributions
Measured temp. Quadratic, r ~ 0.89 Quadratic, r = 1.00
y,o i M l.IMe oIoo I 010o oIoo I°'% oIue I 010e C2906 07851 01999 05676 02958 05675 02965 05812 02750 00016 15561 05455 0580 ~ 05540 05800 05544 05967 05549 00086 18055 04598 0707 ~ 04218 07078 04220 07229 04045 r'O I 0'% 20970 05~40 07745 04756 07740 04760 07872 04602 <:0156 23205 05909 0R172 05227 08171 05229 08286 05085 GOPOG 25554 06456 09535 05724 08555 05726 08651 05596 0025~ 27443 06988 0~840 06250 08840 06250 08921 06136 !;0506 29659 07548 09121 06847 09122 06846 09186 06750 r) 055q 31565 08058 0q525 07429 09540 07405 09598 07527 00406 5556~ 08548 0055£ 08052 09541 08026 09977 07966 00456 55555 09049 09704 08694 09717 08672 09740 08652 00506 57251 09486 09850 09274 09855 09266 09866 09244 0 0 5 5 5 5 8 5 0 9 0 9 7 5 5 0 9 9 2 7 0 9 6 5 7 0 9 9 5 5 0 9 6 4 6 0 9 9 5 8 0 9 6 3 5 ( : 0 6 0 6 5 ,~925 0 9 9 1 2 0 9 9 7 2 0 9 8 7 9 0 9 9 7 6 0 9 8 7 1 0 9 9 7 8 0 9 8 6 7 00656 59195 09981 09995 09976 09995 09972 09998 09971 0070< 59265 09998 09996 I0008 10000 09998 10008 09997
Orders of most s i~n l f l c a~ t columns in t ab l e s
Quantity Order
Y I 10 All others I i
a. Pilot run 42in from plate leading edge.
24
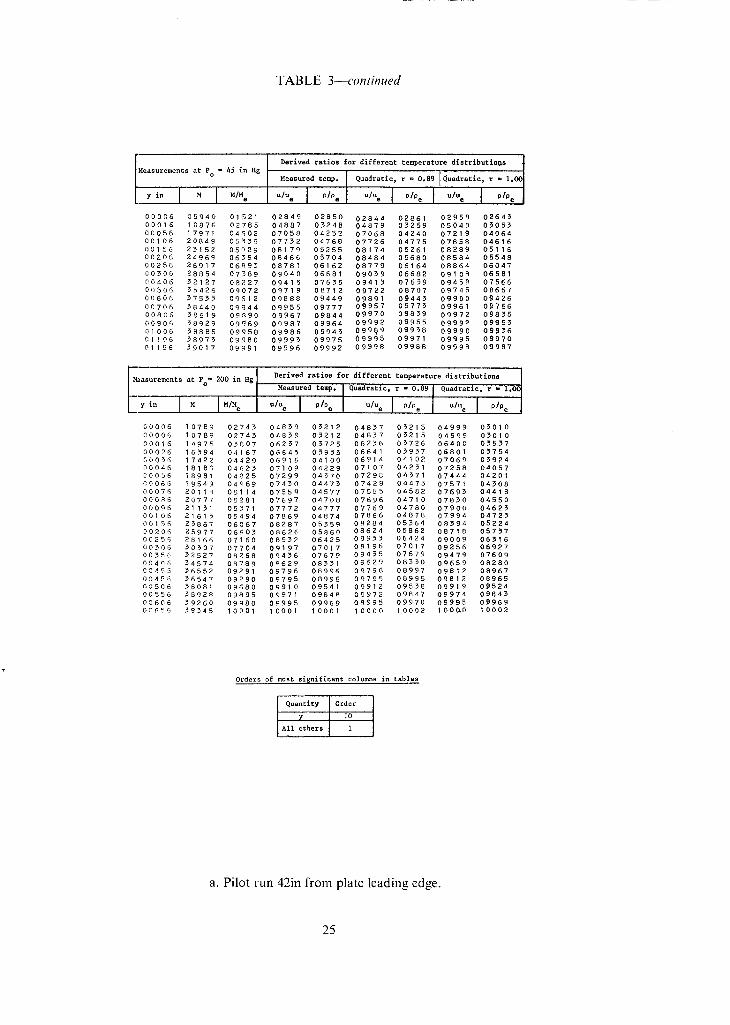
TABLE 3--continued
Derived ratios ior different temperature distributions Measurements at P ffi 45 in Hg t
o M ...... d temp. Quadrati .... 0.89 [ Quadratl .... I.~
~,o I M I M~Mo °'°° I "°° °'°e I "°e I u,o I °"°J 0 0 0 0 6 0 5 9 4 0 0 1 5 2 1 0 8 8 4 9 0 2 8 5 0 0 2 8 4 4 0 2 8 6 1 0 2 9 5 8 0 2 6 4 3 00016 10876 02785 04887 0)248 04879 05259 05040 0)053 00056 17971 04~02 07058 04258 07068 04240 07219 04064 00106 20849 05559 07752 04768 07786 04775 07858 04616 00156 25152 05929 08179 05255 08174 05261 08289 05116 00206 24969 06594 08468 05704 08484 05680 08584 05548 00856 26917 0689) 08781 06162 08779 06164 08864 06047 00506 28854 07589 09040 06681 090)9 06688 09108 06581 t0406 52127 08227 09415 07655 09415 076)9 09458 07566 0 0 5 0 6 5 5 4 2 6 0 9 0 7 2 0 9 7 1 9 0 8 7 1 2 0 9 7 2 2 0 8 7 0 7 0 9 7 4 5 0 8 6 6 7 00606 )7555 09612 09889 09449 09891 0944) 09900 09426 00706 ~8440 09844 09955 09777 09957 09775 09961 09766 00806 58819 09~90 09967 09844 09970 098)9 09972 098)5 00906 38929 09~69 09987 09964 09992 09955 09992 0995) 01006 58885 09958 09986 0994~ 09989 099)8 09990 09936 0 1 1 0 6 5897) 09980 09995 09975 09995 09971 09995 09970 01156 39017 09991 09996 09992 09998 09988 09998 09987
asurements at 200 in Derived ratios for different temperature distributions
Po ffi Hg Measured temp. I Quadratic, r ffi 0.89 I Quadratic. r - 1.00
L ,io I M I M'Mo °'% I "% I °'°o I°'% I 'Ue I °'°e 0 0 0 0 6 1 0 7 8 9 0 2 7 4 ) 0 4 8 3 9 0 5 2 1 2 0 4 8 ) 7 0 5 2 1 5 0 4 9 9 9 0 5 0 1 0 0 0 0 0 6 1 0 7 8 9 0 2 7 4 ) 0 4 8 5 9 0 3 2 1 2 0 4 8 5 7 0 5 2 1 5 0 4 9 9 9 0 5 0 1 0 00016 14975 05807 06237 05725 06256 03726 06400 05537 00026 16594 04167 06645 05935 06641 03937 0&801 0)754 6 0 0 5 6 1 7 4 2 2 0 4 4 2 9 0 6 9 1 6 0 4 1 0 0 0 6 9 1 4 0 4 1 0 2 0 7 0 6 9 0 3 9 2 4 00046 18188 0462) 07109 04229 07107 04231 07258 04057 0 0 0 5 6 1 8 9 8 1 0 4 8 2 5 0 7 2 9 9 0 4 5 7 0 0 7 2 9 8 0 4 5 7 1 0 7 4 4 4 0 4 2 0 1 0 0 0 6 6 1 9 5 4 9 0 4 9 6 9 0 7 4 5 0 0 4 4 7 3 0 7 4 2 8 0 4 4 7 5 0 7 5 7 1 0 4 ) 0 8 00076 20118 05114 07559 04577 07555 04582 07693 04418 000~5 2 0 7 7 7 0 5 2 8 1 0 7 6 9 7 0 4 7 0 8 0 7 6 9 6 0 4 7 1 0 0 7 8 ) 0 0 4 5 5 0 00096 21151 05571 07772 04777 07769 04780 07900 04625 00105 21615 05494 07869 04874 07866 04878 07994 04723 00156 23867 06067 08887 05559 08284 05364 08594 05224 00206 25977 06~05 08626 05880 08624 05868 08718 05737 0025~ 28166 07160 08952 06425 08955 06424 09009 06316 8 0 ) 0 6 5 0 5 0 7 0 7 7 0 4 0 9 1 9 7 0 7 0 1 7 0 9 1 9 6 0 7 0 1 7 0 9 2 5 6 0 6 9 2 7 00358 )~527 08268 094)6 07679 094)5 07679 09479 07609 00405 54574 08789 09629 08551 09629 08550 09659 08880 00~ 36552 09291 09796 08996 09796 08997 09812 08967 00456 )6847 09290 09795 08996 09795 08995 09812 08965 00506 58081 09880 09910 09541 09912 09558 09919 09524 00556 ~ 0 9 2 ~ 09895 09971 09848 09972 09847 09974 0984) 00606 59260 09980 09995 09969 09995 09970 09995 09969 0~656 ~9545 10001 10001 10O01 I0000 10002 I0000 10002
Orders of most s[~nlflcant columns in tables
Quantity Order
y I0
All others I
a. Pilot run 42in from plate leading edge.
25
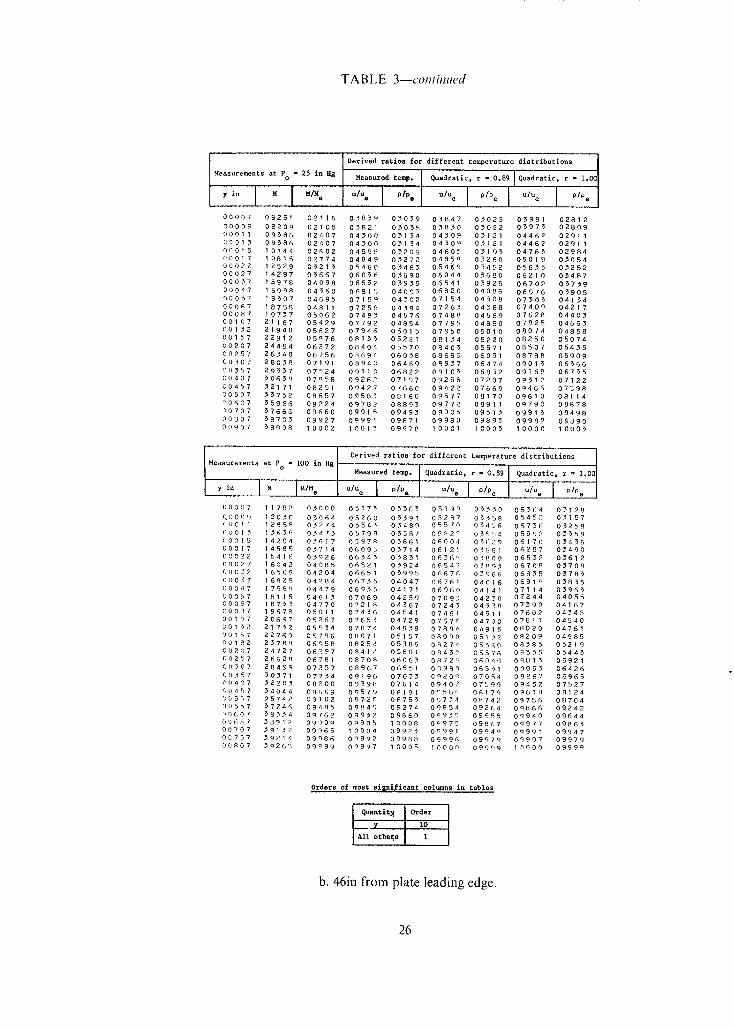
TABLE 3--contimu~d
! Derived ratios for different temperature distributions I
Measurements at Po " 25 in H E Measured tel~. I Quadratic. r = 0.89 Quadratic. r = 1,00 II
,oI"I -I 0'%1 °'% -% o o o'%1 0 0 0 0 7 0 8 2 5 1 0 2 ~ 1 6 0 3 8 5 9 0 3 0 3 9 0 5 8 4 7 0 5 0 2 5 0 5 9 9 1 0 2 8 1 2 00009 08209 02105 05821 03055 03850 05022 05975 02809 00011 09386 02407 04300 03154 04309 05121 04462 02911 C t 0 1 5 0 9 5 8 6 0 2 4 0 7 0 4 3 0 0 0 3 1 5 4 0 4 5 0 0 0 3 1 2 1 0 4 4 6 2 0 2 9 1 1 0 0 0 1 5 1 0 1 4 4 0 2 0 0 2 0 4 5 9 5 0 5 2 0 5 0 4 6 0 5 0 5 1 9 5 0 4 7 6 5 0 2 9 8 4 00017 10815 02774 04849 05272 0485~ 05260 05019 05054 00022 12529 03215 05460 05465 05469 03452 05635 05252 00027 14297 05667 06036 05690 06044 0 5 6 8 0 06210 05487 00037 15978 04098 06552 05955 06541 05925 06702 057)9 00047 16998 04360 06815 04093 06820 04086 06976 05905 00057 18507 04695 07159 04302 07154 04508 07503 04154 00067 18758 04811 0725~ 04594 07865 04588 07409 04217 00087 I 9757 05062 07483 04576 07488 04569 07628 04405 00107 21167 05429 07792 0 4 8 5 4 07795 04850 07925 04695 00152 81940 05627 07946 05015 07950 05010 08074 04858 00157 82912 05~76 0R155 05221 08154 05220 08250 05074 00207 24454 06272 08404 05570 08403 05571 08507 05455 00257 26340 06756 08694 06058 08699 06031 08788 05909 00507 28058 07191 08940 06469 08937 06474 09013 06566 (~0557 29537 07524 09110 06822 09105 06852 09168 06755 00407 50659 07858 09262 07197 09256 07207 09512 07122 00457 52171 08251 09427 07660 09422 07669 09466 07898 00507 )3752 08657 09585 08160 09577 08170 09610 08114 00607 35966 09224 09782 08893 09772 0891 I 09790 08878 ~0707 37666 09660 09915 09495 09905 09515 09915 09498 0 0 8 0 7 ) 8 7 0 3 0 9 9 2 7 0 9 9 9 1 0 9 8 7 1 0 9 9 8 0 0 9 8 9 5 0 9 9 8 2 0 9 8 9 0 0 0 9 0 7 5 8 9 9 8 1 0 0 0 2 1 0 0 1 5 0 9 9 7 8 1 0 0 0 1 l O 0 0 D 1 0 0 0 0 1 0 0 0 5
Derived ratios for different temperature distributions Measurements at Po " I00 in H 8 ...........
J Measured temp. Quadratic. r - 0.89 I Quadratic. r = 1.00
y i n I M I M/Me U/Ue I P/Pe U/Ue I 0/% I u/u I ~/Pe 00007 11782 03000 05173 05565 0519 ° 03330 05564 03128 0.0009 12030 03064 05260 05591 05287 03358 05452 05157 00011 12858 03274 05548 05489 0557(~ 03456 05756 05258 00015 15658 05473 05799 05587 0~52 r 05854 05992 05359 00015 14204 05617 0597R 05661 06004 03629 06170 03456 00017 14585 03714 06095 05714 06121 03681 06287 03490 C00-92 15416 05926 06545 05851 0636 ° 03800 06552 03612 00027 16042 04085 06521 03924 06547 05895 06706 03709 00052 16509 0 4 2 0 4 06651 05995 0667(I 05966 06855 05785 00057 16825 04284 06755 04047 06761 04016 0691 q 05855 00047 17589 04479 06935 04171 06960 04141 07114 05965 00057 18115 04613 07069 04259 07093 04250 07244 04055 80067 18753 04770 07218 04367 07245 04538 07590 04167 00087 19678 05011 07456 0454] 07461 04511 07602 04545 00107 80667 05265 07655 04729 07676 04700 07811 04540 C0152 21752 05~54 07874 04959 07894 04915 08020 04751 00187 22760 05796 08071 05157 00090 05152 0820 q 04985 0 0 1 8 2 2378;~ 06058 00254 05586 0027~ 05360 08385 05219 00207 24727 06~97 08414 05601 08432 05576 08535 05443 00257 26628 06781 0870e 06065 0872 ~ 06040 08815 05921 00507 28499 07257 08967 06551 00980 0655i 09055 06426 00557 30571 07754 09196 07073 0920 e 07084 09267 06965 00407 )2203 08?00 0959~ 07614 09407 07599 09452 07527 00457 34044 08669 09579 0~191 0058~ 0R179 OQ61R 08]24 {&507 ~5742 09102 0972~ 08755 00754 0e742 00756 08704 00557 )7246 09485 09849 09274 09854 09264 00866 09242 00607 )8534 09762 09932 09660 00955 09655 09940 09644 00657 58912 09009 00905 10000 09975 09867 09977 09863 00707 39152 09965 1 0 0 0 4 09923 0~991 0 9 9 4 c~ 09991 09947 00757 39214 09986 0~992 09988 09996 09979 09897 09979 00807 5~26~ 09999 09997 10005 10000 09999 I~000 09999
Order s of most s i g n i f i c a n t columns i n t a b l e s
q u a n t l t ~ Order
__ ~ J i0
A l l others 1
b. 46in from plate leading edge.
26
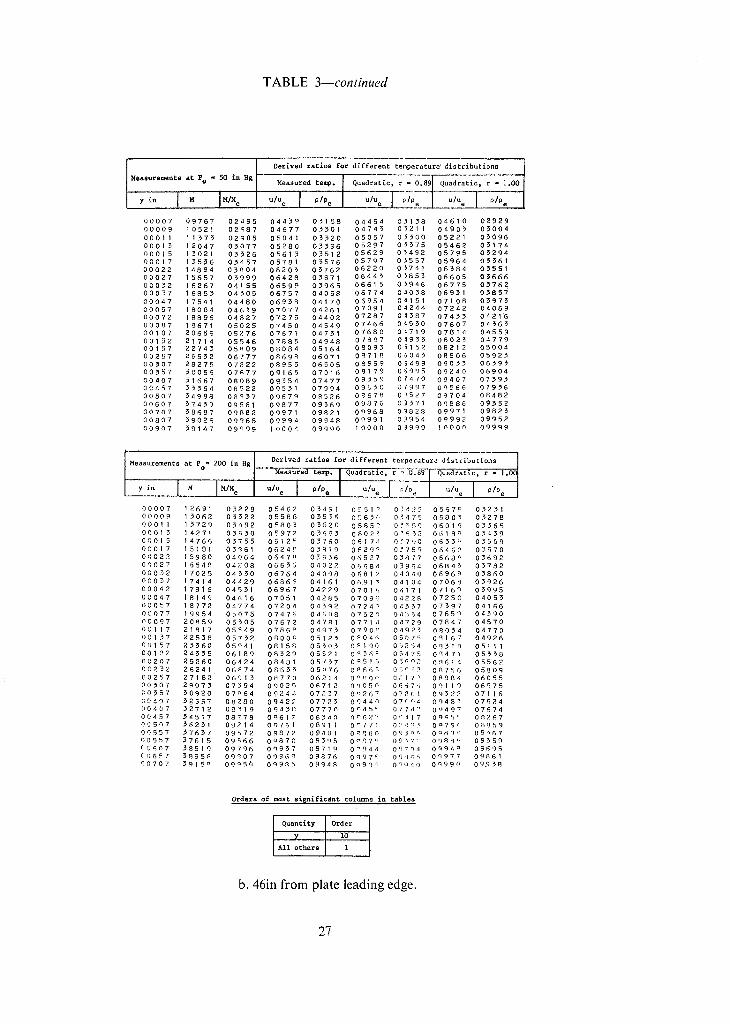
TABLE 3--continued
Derived ratios for different tenperature distributions
Measurements at PO " 50 i~% Mg Measured te~z~. Quadratic, r = 0.89[ Quadratic. r = 1.00
I . i M"o °'°o I ° ' ° o °'°e I ' e e u'oe I°'°o 0 0 0 0 7 0 9 7 6 7 0 2 4 9 5 0 4 4 ) 9 0 5 1 5 8 0 4 4 5 4 0 5 1 5 8 0 4 6 1 0 0 2 9 2 9 0 0 0 0 9 0 5 2 1 0 2 6 8 7 0 4 6 7 7 0 5 5 0 1 0 4 7 4 5 0 ~ 2 1 I 0 4 9 0 3 0 ) 0 0 4 0 0 0 1 1 1 5 7 5 0 2 9 0 5 0 5 0 4 1 0 3 5 2 0 0 5 0 5 7 0 ~ 5 0 0 0 5 2 2 1 0 5 0 9 6 0 0 0 1 5 2 0 4 7 0 5 0 7 7 0 5 2 8 0 0 5 5 9 6 0 5 2 9 7 0 ~ 5 7 5 0 5 4 6 2 0 5 1 7 4 0 0 0 1 5 5 0 2 1 0 5 5 2 6 0 5 6 1 5 0 5 5 1 2 0 5 6 2 9 0 5 4 9 2 0 5 7 9 5 0 5 2 9 4 00017 5556 0)457 05781 05576 05797 05557 05964 05361 0 0 0 2 2 4 8 9 4 0 5 8 0 4 0 6 2 0 3 0 5 7 6 2 0 6 2 2 0 0 ~ 7 4 1 0 6 5 8 4 0 5 5 5 1 0 0 0 2 7 5 6 5 7 0 ) 9 9 9 0 6 4 2 8 0 5 8 7 1 0 6 4 4 3 0 ~ 8 5 5 0 6 6 0 5 0 ~ , 6 6 6 00052 6267 04155 06599 05965 06615 0~946 06775 05762 00057 6855 04505 06757 04058 06774 04058 06951 05857 00047 7541 04480 06958 04170 06954 0 " 1 1 5 1 07108 0~97~ 00057 8084 04619 07077 04261 07091 04244 07242 04069 00072 8896 04827 07275 04402 07287 0~587 07455 04216 00087 9671 05025 07450 04549 07466 04550 07607 0456~ 00107 20656 05276 07671 04751 07680 05719 07814 04559 00152 21714 05546 07888 04948 07897 0~959 08025 04779 0 0 1 5 7 2 2 7 4 5 0 5 8 0 9 0 8 0 8 4 0 5 1 6 4 0 8 0 9 5 0 5 1 5 2 0 8 2 1 2 0 5 0 0 4 0 0 2 5 7 2 6 5 5 2 0 6 7 7 7 0 8 6 9 R 0 6 0 7 1 0 8 7 1 8 0 , 3 0 4 5 0 8 8 0 6 0 5 9 2 5 0 0 5 0 7 2 8 2 7 5 0 7 2 2 2 0 8 9 5 5 0 6 5 0 5 0 8 9 5 9 0 5 4 9 9 0 9 0 ~ 5 0 6 5 9 5 00557 50056 07677 09165 07016 09179 05995 09240 06904 00407 51667 08089 09554 07477 09559 0?470 09407 07595 00497 3~564 08522 09551 07994 09550 0/997 09866 07956 0 0 5 0 7 J 4 9 8 8 0 8 q 5 7 0 9 6 7 9 0 8 5 2 6 0 9 6 7 8 0 ~ 5 2 7 0 9 7 0 4 0 8 4 8 2 0 0 6 0 7 5 7 4 5 0 0 9 5 6 1 0 9 8 7 7 0 9 5 6 9 0 9 8 7 6 0 9 5 7 1 0 9 8 8 6 0 9 5 5 2 0 0 7 0 7 5 8 6 8 7 0 9 8 5 2 0 9 9 7 1 0 9 8 2 1 0 9 9 6 8 0 9 8 2 8 0 9 9 7 1 0 9 8 2 5 0 0 8 0 7 5 9 0 2 6 0 9 ~ 6 8 0 9 9 9 4 0 9 9 4 8 0 c ' 9 9 1 0 3 9 5 4 0 9 9 9 2 0 9 9 5 2 0 0 9 0 7 3 9 1 4 7 0 9 0 9 9 1 0 0 0 4 0 9 9 9 0 1 0 0 0 0 0 9 9 9 9 1 0 0 0 0 0 9 9 9 9
Derived r a t i o s for d i f f e r e n t te,Iperatura distclbut[ons ]
y io I . I M'Mo 1 °'°" I °'°o I °'°o.J 00007 00009 00011 00015 00015 00017 00022 00027 0 0 0 5 2 00037 00042 00047 00057 00077
2 6 9 1 0 5 2 2 8 0 5 4 6 2 0 5 4 9 1 0 1 5 1 7 0 1 4 2 9 0 5 6 7 9 0 5 2 3 1 5 0 6 2 0 5 5 2 2 0 5 5 8 6 0 5 5 5 8 0 5 6 5 0 0 ~ 4 7 5 0 5 8 0 3 0 5 2 7 8 5729 05492 05805 05620 0585~ 0~959 0 6 0 1 9 05565 4271 05~50 0597~ 05695 0602~ 0~652 0618 ~ 05459 4766 05755 06125 05760 0617,! 097)0 0655 <~ 05509 5191 05q61 0624P 05819 0829 ¢ 0f759 06462 05670 5980 04064 0647~! 0Z036 06527 05977 0668 ° 03692 6548 04208 0665[{ 04022 06684 05964 06843 03782 7025 04350 06764 04098 0681 ° 04040 06969 03860 7 4 1 4 0 4 4 2 9 0 6 8 6 6 0 4 1 6 1 0 A 9 1 ~ 0 4 1 0 4 0 7 0 6 8 0 5 9 2 6 7 8 1 6 0 4 5 5 1 0 6 9 6 7 0 4 2 2 9 0 7 0 f 6 0 4 1 7 1 0 7 1 6 9 0 5 9 9 5 8 1 4 9 0 4 6 1 6 0 7 0 5 1 0 4 2 8 5 0 7 0 9 q 0 4 2 2 8 0 7 2 5 ~ 0 4 0 5 5 8 7 7 2 0 4 7 7 4 0 7 2 0 4 0 4 5 9 2 0 7 2 4 n 0 4 5 5 7 0 7 5 9 7 0 4 1 6 6 9954 05075 07476 046(98 07520 04554 0765 q 04590
~0097 20859 05505 07672 04781 0771,1 04789 07847 04570 00117 21817 05549 0788P 04975 0790 ~ 04925 08034 04770 00157 22558 05752 0800 ~ 05125 0~04< 05070 09167 04926 0n157 25360 05941 Oe15Z 055(13 09196 082~4 09510 05111 001[~8 24555 06189 0e529 05521 0056 = 05475 09471 05558 00207 25260 06424 08481 05757 08515 05~2 09614 05562 00232 26241 06~74 08655 05~76 0~660 05r~? 08759 05909 0 0 2 5 7 2 7 1 8 2 0 6 0 1 5 0 ~ 7 7 0 0 6 2 1 4 0 ° ~ 0 ¢~ 0 / 1 7 , 7 0 8 9 8 4 0 6 0 5 5 0 0 5 0 7 2 9 0 7 5 0 7 5 9 4 0 9 0 2 ~ 0 6 7 1 2 0 0 0 5 0 0 6 6 7 6 0 9 1 1 9 0 6 5 7 5 0 0 5 5 7 5 0 9 2 0 0 7 0 6 4 0 9 2 4 4 0 7 2 3 7 0 0 2 6 7 0 7 2 0 1 0 9 5 2 2 0 7 1 1 6 0 8 4 0 7 5 ~ 5 5 7 0 8 2 8 0 0 9 4 2 2 0 7 7 2 5 0 9 4 4 e 0 7 ~ " , 4 0 9 4 8 5 0 7 6 2 4 [ ; 0 4 0 7 3 2 7 1 2 0 8 5 1 9 0 9 4 5 £ 0 7 7 7 0 0 ~ 4 5 c~ 0 7 7 4 ~ 0 0 4 9 7 0 7 6 7 4 00457 54517 08778 0961Y 08540 0°62 ~ 0~'517 0~5 ~ 08267 00597 56251 09214 09761 08911 0~771 0!~;! q~ 0o79 r: 08~59 00557 )7657 09£72 09872 09401 0~80 0950 m o q s q '~ 09567 00557 57615 09966 09870 09595 0097 m 09~7 < 098~q 09559 ~ 0 6 0 7 5 8 5 1 9 0 9 7 9 6 0 q 9 5 7 0 9 7 1 9 0 ~ 9 4 4 0 9 7 n 4 0 9 9 4 Q 0 9 6 9 5 00657 58956 09007 09960 09876 0997£ 09:{<q 00977 09861 0 0 7 0 7 5 9 1 5 m 0 9 ~ 5 9 0 9 9 £ 5 0 9 9 4 8 0 ~ 9 ~ '7 O q q , l O 0 0 9 9 0 0 9 9 3 8
Orders of most significant columns in tables
Q u a n t i t y Order
y lO
All others 1
b. 46in from plate leading edge.
27
TABI.E 3---continued
I Derived ratios for different temperature d/stributions
Measurements at Po " 25 in H8 Measured temp. Quadratic, r = 0.89 I Quadratic, r = 1.00
yin I M i M/M e U/Ue [ O/P e u/u e P/Oe [ ulu e PlPe
i
00807 08927 02;!93 04139 03070 0~127 0308£ 04276 02876 0000 I 09035 02581 04182 03080 04170 03097 04520 02888 00011 09000 0 2 ~ 1 2 04167 0}077 0415< 03094 0430 ~ 02883 enO13 10914 02*09 0491F~ 0}264 0490~ 03280 05066 03074 t0015 10883 02798 0490 ? 05259 0 aROq 05276 05051 03069 ~0017 11117 02061 04991 05285 0 '197° 03502 05141 03098 0902~ 15|40 03578 05691' 03521 0667c 05537 05846 03539 '?0027 14738 0}786 0619~; 037}6 0618~ 03750 06}47 03558 r'0R~7 15854 04350 06810: 04872 0:£0 " 040~15 06962 05')03 CS947 18271 04,095 07157 04500 0714" 04511 07297 04117 (~t:O67 I0312 04061 07404 04409 0759 ~ 0450~ 07538 04331 C0067 1981 q 09116 07540 04~04 0753~ 0461 07670 04449 CC087 2070f~ 05539 0772 ~ 04774 0771c 04704 0"7852 04624 !'0197 Z1873 05619 07940 04997 07948 0500P 0 ~06~ 041~54 00152 23038 05818 08167 05250 00169 052L~q 0827£ 05114 00157 24015 06169 08539 05472 0 ~33~ 054!81 0~44n 05342 001207 ~575 q 06~6 08621 05891 09,61 r" 05898 0870c! 05772 00257 2 7 : ' 2 n 07071 0~876 06547 0~872 06552 0 0 9 5 1 0 6 2 4 1 0 0 5 0 7 2 9 1 5 =' 0 7 , 1 8 4 0 8 0 8 4 0 6 7 8 8 0 ° 0 8 ? 0 6 7 9 5 0 9 1 4 P 0 6 6 9 2 ¢0567 30695 07875 09262 07229 00267 07229 0~517 07143 00407 11990 08219 0040 ~ 07653 0 0 4 0 ~ 07633 0q45 " 07961 00457 3333 ~) 08564 0°557 08039 0o54 ? 08085 O ~577 07995 0 0 5 0 7 3 4 7 0 > 0 8 1 1 4 0 0 6 6 < 0 £ 5 8 4 0 ~ 6 6 ! 0~S£01 0 0 6 9 4 0 0 4 5 5 00697 56620 09~09 09831 09160 0 '182/' 09165 09843 09137 00707 170H7 09758 00927 09662 0993~ 09851 08938 09640 0 0 8 ( 7 5 8 7 2 " 0 9 0 4 8 0 < ) 9 8 0 0 9 9 5 7 0 ~ 0 6 ' 0 9 9 2 4 0 9 9 8 7 0 9 9 2 2 0 0 9 0 7 3 8 9 4 1 0 0 0 3 0 9 9 9 6 1 0 0 1 4 1 0 0 0 1 1 0 0 0 8 1 0 0 0 1 1 0 0 0 5 0 1 0 0 7 ~ q 0 2 9 1 0 0 2 5 1 0 0 0 0 1 0 0 5 0 1 0 0 0 7 1 0 0 3 7 1 0 0 0 r~ 1 0 0 3 8 0 1 1 0 7 3 9 1 0 2 1 0 0 4 4 1 0 0 0 7 1 0 0 7 , 5 1 0 0 1 2 1 0 0 ~ 5 1 0 0 1 1 1 0 0 5 7 01157 58930 10800 0999 ~ I0010 10000 10030 10000 I0000
~y 1 Derived ratios for d[ff ..... temp ....... d{stributions ] Measurements = lOO in ~ . . . . . . . . . . . Ol
at Po M ...... d temp. I Quadratl 0.89 ~ Quadrati .... 1,.0,,
0 0 0 0 7 1 1 1 4 ~ 0 2 0 3 9 0 4 9 9 1 0 3 2 5 5 0 4 9 7 0 032F~3 0 ~ 1 5 ~ 0 5 0 5 0 0 0 0 0 9 11~S58 0 2 ~ 7 0 0 5 1 6 6 0 3 3 0 6 0 8 1 5 5 0 5 5 1 - 0 0 5 3 2 1 ~ 0 5 1 1 A 00011 12665 03227 05526 03413 0%50 :~ 0}435 0~672 05216 00015 I~465 05430 05785 03519 0q770 03955 05937 03~9 610015 14088 05589 05992 03589 0096 05615 06135 034?5 00017 14532 05702 06128 05650 06106 05~77 06272 03485 ~ 0 0 2 2 1 5 4 3 4 0 3 9 3 2 0 6 3 9 6 0 5 7 8 0 0 5 3 7 5 0 5 8 0 5 0 6 5 3 9 0 3 6 1 8 0 0 0 2 7 1 6 0 5 5 0 4 0 9 0 0 6 5 7 4 0 3 8 7 2 0 6 5 5 1 0 1 £ 9 ~ 0 8 7 1 2 0 3 7 1 3 0 0 0 3 2 1 6 5 4 6 0 4 2 1 6 0 6 7 0 8 0 3 9 5 0 0 6 6 8 7 0 3 9 7 ~ 0 6 8 4 6 0 3 7 9 2 00037 16947 04318 06815 04014 0 ~794 04058 06951 0}850 00047 17630 04492 06995 04126 06972 04151 07126 03973 00057 18275 04656 07154 04235 07135 04261 07289 04087 00067 18869 04807 07297 04340 07276 0436~ 07422 04195 00087 19940 05080 07539 04541 07520 04563 07660 04399 0 0 1 0 7 2 0 9 7 0 0 5 3 4 3 0 7 7 6 4 0 4 7 3 5 0 ~ 7 4 1 0 4 7 6 : ~ 0 7 8 7 3 0 4 6 0 5 0 0 1 3 2 2 2 0 4 9 0 5 6 1 8 0 7 9 7 5 0 4 9 6 1 0 7 9 5 7 0 4 9 3 5 0 8 0 8 1 0 4 8 5 3 0 0 1 5 7 2 ~ 0 9 9 0 5 8 8 5 0 8 1 7 3 0 5 1 8 5 0 8 1 5 " 0 5 2 1 0 0 8 2 6 8 0 5 0 6 8 0 0 1 8 2 2 4 1 2 6 0 6 1 4 7 0 8 3 5 1 0 5 4 1 7 0 0 1 3 ~ 0 5 4 4 1 0 8 4 4 1 0 ! 3 1 0 3 0 0 2 0 7 2 5 2 1 8 0 6 4 2 5 0 8 5 2 0 0 5 6 7 4 0 0 5 1 8 0 5 6 9 7 0 R 6 1 1 0 5 5 6 7 0 0 2 5 7 2 7 2 7 0 0 6 0 4 8 08833 0 6 1 8 7 0 ~ 1 "' 06230 0 8 9 0 0 0 6 0 9 6 0 0 2 5 7 2 7 5 3 5 0 6 0 6 4 0 8 8 4 1 0 6 2 0 6 0 ~ ° 2 , " 0 ~ 2 2 5 0 0 9 0 r ~ 0 6 1 1 2 00307 29573 07483 09106 06754 09091 0677~ 09157 0667R 00357 31429 08007 093~9 07552 09527 07171 0~37~q 07291 0 0 4 0 7 1 3 4 6 4 0 8 5 2 6 0 9 5 4 3 0 7 9 8 2 0 0 5 ~ u 0 7 9 8 9 0 0 5 6 0 0 7 9 5 8 0 0 4 5 7 3 5 5 5 6 0 9 0 0 8 0 9 7 1 2 0 8 6 0 5 o q 7 r , ~ 02 ,61 £ 0 ° 7 2 7 0 8 5 7 8 00457 35380 09014 09715 08609 0070 ~ 0862,~ 0972~ 08585 0 0 5 0 7 3 7 0 1 8 0 9 4 5 0 0 9 8 4 6 0 9 1 7 3 0 r 8 5 [ ' 0 9 1 8 8 0 9 8 5 1 091F~4 C0567 5"8273 09751 09937 08630 0~95: 09640 0 n957 09629 0 0 6 0 7 ~ 8 9 1 3 0 9 9 1 4 0 9 9 8 5 0 9 8 5 9 0 ~ 9 7 "," 0 9 q 7 5 0 9 9 7 ~ 0 9 8 7 1 00657 ~9161 09~177 10000 09955 0<!9!) 4 099~q7 0 ~994 090(~6 00707 "~9230 09095 I0009 09974 0099 ° 090,95 09999 09892 0 0 7 5 " 1 ~ 9 2 6 1 1 0 0 0 3 1 0 0 0 7 0 9 9 9 1 1 9 0 0 1 1 0 8 0 4 1 0 0 0 1 1 0 0 0 z~ 0 0 8 0 7 5 9 2 7 5 1 0 0 0 6 1 0 0 0 9 0 9 9 9 5 1 0 0 0 [ ' 1 0 0 0 9 1 0 0 0 2 1 0 0 1 0 0 0 B ! , 7 -5925 ,4 1 0 0 0 1 1 0 0 0 7 0 9 9 8 7 1 8 0 0 n 1 0 0 0 2 1 0 0 0 9 1 0 0 0 2
Orders of most si~niflcant columns in I tables
Quantity Order
y IO
All others I
c. 42in from plate leading edge.
28
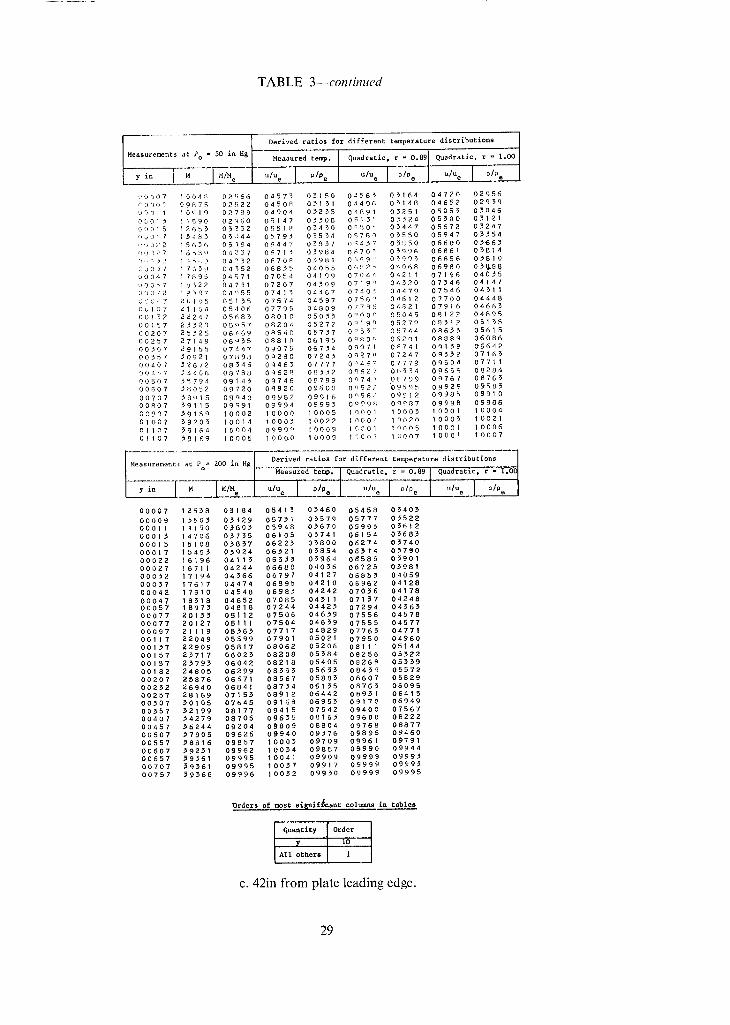
TABLE 3--contmued
~ i . . . . . . . . • Derived ratios for different temperature distributions
nts at Po" 50 in Hg~_-~e-aaured te~ quadrati .... 0.89 quadrati .... 1.00
I o'o. ":<-I o'oo O,Oo I o ' o o ....
i~0907 1004 ~ 02';66 04575 05150 04565 05164 04720 02956 C3009 09875 02522 04500 03151 0 4 4 9 ~ 05148 04652 02959 i J 0 ~ l l 1 O q l q 0 2 7 8 9 0 4 9 0 4 0 3 2 5 5 04R91 0 5 2 5 1 0 5 0 5 5 0 5 0 4 6 06015 11590 02q60 05147 05308 0515 ~ 03524 05500 0 5 1 2 1 00015 12653 03252 0551~ ~ 03450 0~50 ~ 03447 05672 03247 D U ( l l 7 i ~ 4 8 5 0 5 4 4 4 0 5 7 9 5 0 5 5 5 4 0 5 7 8 q 0 5 5 5 0 0 5 9 4 7 0 5 3 5 4 003?2 15058 05q94 06447 03537 0~437 03~50 06600 05"665 00~27 1665~ 04237 06715 05954 O&70 ~ 05q96 06861 03814 [,,rS! I&4.93 04~32 0670P 03981 03~9~' 05903 06856 05810 C,J057 17039 04552 06855 04055 08~2~ 04088 06980 03~8@ 0 0 0 4 7 1 7 8 9 5 04571 0 7 0 5 4 0 4 1 9 9 0 7 0 4 4 0 4 2 1 1 0 7 1 9 6 0 4 0 3 5 UOOb7 I~522 04731 07207 04309 0719 m 04320 07546 04147 OOO,'Z 19597 04q55 07415 04467 0740~ 04479 07546 04311 <:'T(;;'7 21, I,35 05155 07574 04597 0756?= 04612 07700 04448 CUI07 21164 05405 07795 04809 07796 04~21 07916 04665 00152 2~247 05~85 08010 05055 0 nO0~ 05045 08122 04895 00157 25529 05q57 08204 05272 0 n19~ 05279 08512 05155 00207 25325 06469 0R540 05757 0 =53": 05744 08655 05615 00257 27149 06055 08810 06195 o n e o c 06201 0888 q 06086 00507 29155 07447 09075 06754 0 q071 0~741 0q138 ~6642 00557 50921 07~398 0~280 07243 0 m27n 07247 0955? 07165 00407 5~672 08545 09463 0777"7 0046 ~ 07779 09504 077II 9 0 4 6 7 3 4 4 0 8 0 8 7 8 8 0 q 6 2 8 0 8 5 3 2 0 ° 6 2 7 0 ~ 5 5 4 0 9 6 5 8 0 8 2 8 4 0 0 5 0 7 5 5 7 9 4 0 9 1 4 5 0 9 7 4 6 0 8 7 9 9 0 ~ 7 4 7 0 # 7 9 9 0 9 7 6 7 0 8 7 6 3 00607 3~052 09720 09920 0 9 6 0 0 0n922 09595 09929 09583 00707 339t5 09940 09982 09916 0 ~98~; 09912 09985 09910 00807 39115 09Q91 09994 09995 00993i 09087 09998 09986 0 t 9 0 7 5 9 1 5 q 1 0 0 0 2 1 0 0 0 0 1 0 0 0 5 10001 1 0 0 0 5 10001 1 0 0 0 4 0 1 0 0 7 39205 1 0 0 1 4 1 0 0 0 3 1 0 0 2 2 I O 0 0 z 1 0 0 2 0 1 0 0 0 5 10021 0 1 1 0 7 3 9 1 6 4 1 0 ~ 0 4 0 9 9 9 r~ 1 0 0 0 9 I~ ;001 1 0 ~ 0 5 10001 1 0 0 0 6 0 1 1 0 7 5 9 1 6 9 10005 1 0 0 ~ 0 1 0 0 0 9 1~001 1{ )007 1 0 0 0 ! 1 0 0 0 7
' - 'i Derived ratios for different temperature distributions ]
................ I - . . . . ' 4 I o,ool - % / o , u e I0,0o = u,oo I -% / - - I . . . . . . . . . . . . . . . . . . . . . . .
0 0 0 0 7 1 2 5 3 8 0 5 1 8 4 0 5 4 1 3 0 3 4 6 0 0 5 4 5 8 0 5 4 0 5 0 0 0 0 9 1 5 5 0 3 0 5 4 2 9 0 5 7 5 1 0 5 5 7 9 0 5 7 7 7 0 3 5 2 2 00011 1 ~ 1 9 0 0 3 6 0 3 0 5 9 4 8 0 5 6 7 0 0 5 9 9 5 0 3 6 1 2 0 0 0 1 3 1 4 7 0 6 0 3 7 3 5 0 6 1 0 5 03741 0 6 1 5 4 0 3 6 8 5 0 0 0 1 5 1 5 1 0 8 0 5 8 3 7 0 6 2 2 5 0 5 8 0 0 0 6 2 7 4 0 3 7 4 0 0 0 0 1 7 1 5 4 5 5 0 5 9 2 4 0 6 5 2 1 0 5 8 5 4 0 6 5 7 4 0 3 7 9 0 0 0 0 2 2 1 6 1 9 6 0 4 1 1 5 0 5 5 3 3 0 5 9 5 4 0 8 5 8 5 0 3 9 0 1 0 0 0 2 7 16711 0 4 2 4 4 0 6 6 8 0 0 4 0 5 6 0 6 7 2 5 0 3 9 8 1 0 0 0 5 2 1 7 1 9 4 0 4 5 6 6 0 6 7 9 7 0 4 1 2 7 0 6 8 5 3 0 4 0 5 9 0 0 0 3 7 I "7617 0 4 4 7 4 0 6 8 9 5 0 4 2 1 0 0 6 9 6 2 0 4 1 2 8 0 0 0 4 2 1 7 9 1 0 0 4 5 4 8 0 5 9 8 5 0 4 2 4 2 0 7 0 5 6 0 4 1 7 8 0 0 0 4 7 1 8 5 1 8 0 4 6 5 2 0 7 0 8 5 0 4 5 1 1 0 7 1 5 7 0 4 2 4 8 0 0 0 5 7 1 B 9 7 5 0 4 8 1 8 0 7 2 4 4 0 4 4 2 5 0 7 2 9 4 0 4 3 6 5 0 0 0 7 7 2 0 1 3 3 0 5 1 1 2 0 7 5 0 6 0 4 6 3 9 0 7 5 5 6 0 4 5 7 8 0 0 0 7 7 2 0 1 2 7 05111 0 7 5 0 4 0 4 6 3 9 0 7 5 5 5 0 4 5 7 7 0 0 0 9 7 2 1 1 1 9 0 5 5 6 5 0 7 7 1 7 0 4 8 2 9 0 7 7 6 5 0 4 7 7 1 0 0 1 1 7 2 2 0 4 9 0 5 5 9 9 0 7 9 0 1 05021 0 7 9 5 0 0 4 9 6 0 0 0 1 5 7 2 2 9 0 9 0 5 8 1 7 0 8 0 6 2 0 5 2 0 6 0 8 1 1 1 0 5 1 4 4 0 0 1 5 7 2 3 7 1 7 0 6 0 2 5 0 8 2 0 8 0 5 5 8 4 0 8 2 5 6 0 5 3 2 2 0 0 1 5 7 2 5 7 9 5 0 6 0 4 2 0 8 2 1 8 0 5 4 0 5 0 6 2 5 9 0 5 5 3 9 0 0 1 8 2 2 4 8 0 5 0 6 2 9 9 0 8 3 9 5 0 5 6 3 3 0 8 4 5 9 0 5 5 7 2 00207 25876 06571 08567 05885 08607 05829 00252 26940 06841 08754 06155 08763 06095 0 0 2 5 7 2 8 1 6 9 0 7 1 5 3 0 8 9 1 2 0 6 4 4 2 0 8 9 5 1 0 6 4 1 5 00507 50105 07645 09168 06953 09170 06949 00387 32199 08177 09415 07542 09400 07567 0 0 4 0 7 5 4 2 7 9 0 8 7 0 5 0 9 6 3 5 0 8 1 6 5 0 9 6 0 0 0 8 2 2 2 0 0 4 5 7 3 6 2 4 4 0 9 2 0 4 0 9 8 0 9 0 8 8 0 4 0 9 7 6 8 0 8 8 7 7 0 0 5 0 7 5 7 9 0 5 0 9 6 2 5 0 9 9 4 0 0 9 5 7 6 0 9 8 9 6 0 9 4 6 0 0 0 5 5 7 5 8 8 1 6 0 9 8 5 7 1 0 0 0 5 0 9 7 0 9 0 9 9 6 1 09791 0 0 6 0 7 39231 0 9 9 6 2 1 0 0 5 4 0 9 8 5 7 0 9 9 9 0 0 9 9 4 4 0 0 6 5 7 59361 0 9 9 9 5 10041 0 9 9 0 9 0 9 9 9 9 0 9 9 9 5 00707 39561 09995 10037 09917 09999 09995 00757 59566 09996 10052 09930 09999 09995
Orders of most s i ~ n i f ~ a n t columns in tables
q u a n t i t y O r d e r
I 0
A l l o t h e r s 1
c. 42in from plate leading edge.
29
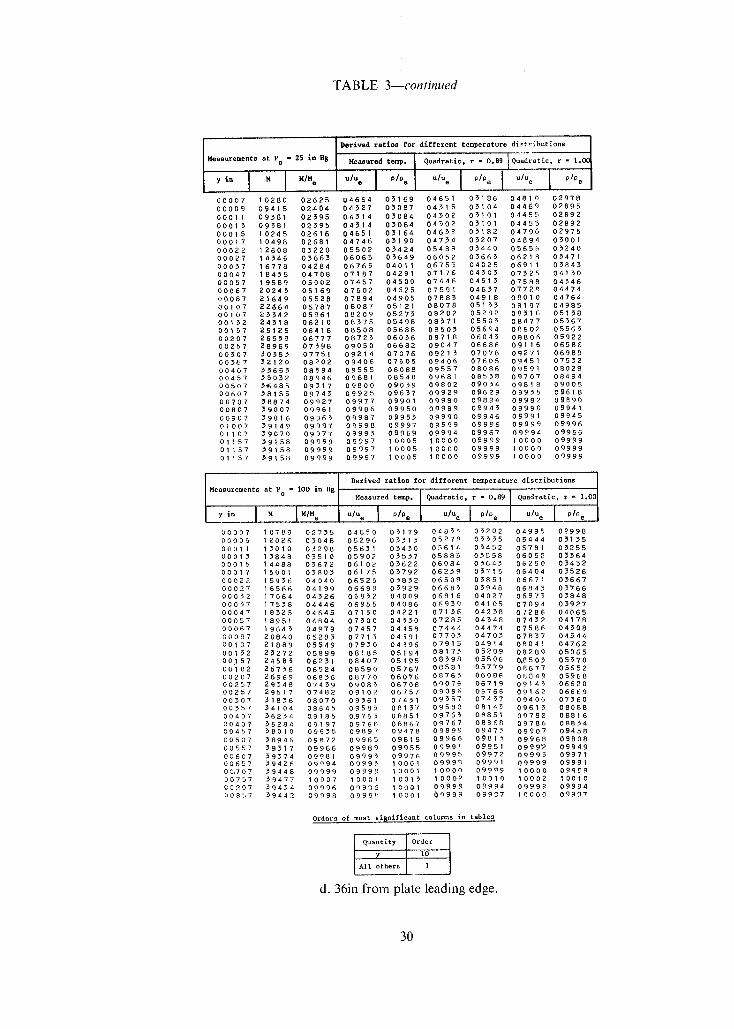
TABLE 3--continued
Derived ratios for different tenperature di~tributions
M e a s u r e m e n t s a t Po " 25 i n H 8 Measu red t emp. q u a d r a t i c , r = 0 . 8 9 I Q u a d r a t i c , r ffi 1 . 0 0 i
0 0 0 0 7 1 0 2 8 0 0 2 6 2 5 0 4 6 6 4 0 5 1 6 9 0 4 6 5 1 0 5 1 8 6 0 4 8 1 0 0 2 9 7 8 0 0 0 0 9 0 9 4 1 5 0 2 4 0 4 0 4 5 2 7 0 5 0 8 7 0 4 5 1 5 0 5 1 0 4 0 4 4 6 9 0 2 8 9 5 0 0 0 1 1 0 9 5 8 1 0 2 5 9 5 0 4 5 1 4 0 5 0 8 4 0 4 5 0 2 0 5 1 0 1 0 4 4 5 5 0 2 8 9 2 0 0 0 1 5 0 9 5 8 1 0 2 5 9 5 0 4 5 1 4 0 5 0 8 4 0 4 5 0 2 0 5 1 0 1 0 4 4 5 5 0 2 8 9 2 0 0 0 1 5 1 0 2 4 5 0 2 6 1 6 0 4 6 5 1 0 5 1 6 4 0 4 6 5 E 0 5 1 8 2 0 4 7 9 6 0 2 9 7 5 0 0 0 1 7 1 0 4 9 8 0 2 6 8 1 0 4 7 4 6 0 5 1 9 0 0 4 7 5 4 0 5 2 0 7 0 4 8 9 4 0 5 0 0 1 0 0 0 2 2 1 2 6 0 8 0 5 2 2 0 0 5 5 0 2 0 5 4 2 4 0 5 4 8 9 0 5 4 4 0 0 5 6 5 6 0 5 2 4 0 00027 14546 05665 06065 05649 06052 05665 06218 05471 00057 16778 04284 06765 04011 0.6755 04025 06911 05845 00047 18455 04708 07187 04291 07176 04505 07525 04150 00057 19589 05002 07457 04500 07446 04515 07588 04546 0 0 0 6 7 2 0 2 4 5 0 5 1 6 9 0 7 6 0 2 0 4 6 2 5 0 7 5 9 1 0 4 6 5 7 0 7 7 2 8 0 4 4 7 4 0 0 0 8 7 2 1 6 4 9 0 5 5 2 8 0 7 8 9 4 0 4 9 0 5 0 7 8 8 5 0 4 9 1 8 0 8 0 1 0 0 4 7 6 4 00107 22664 05787 08087 05121 08078 05155 08197 04985 00107 25542 05961 08209 05275 08202 05282 08516 05158 00152 24518 06210 08575 05498 08571 05505 08477 05567 00157 25125 06416 08508 05688 08505 05694 08602 05565 00207 26559 06777 08725 06056 08718 06045 08806 05922 00257 28969 07598 09050 06682 09047 06686 08116 06586 0050"7 5 0 5 5 5 0 7 7 5 1 0 9 2 1 4 0 7 0 7 6 0 9 2 1 5 0 7 0 7 8 0 9 2 7 1 0 6 9 8 9 00567 52120 08202 09406 07605 09406 07605 09451 07552 00407 55655 08594 09555 08088 09557 08086 09591 08028 00457 ~5052 08946 09681 08540 09681 08558 09707 08494 0 0 5 0 7 ~ 6 4 8 5 0 9 5 1 7 0 9 8 0 0 0 9 0 5 9 0 9 8 0 2 0 9 0 5 4 0 9 8 1 8 0 9 0 0 5 00607 58155 09745 09925 09657 09929 09629 09955 09618 00707 58874 09927 09977 09901 09980 09894 09982 09890 00807 59007 09961 09986 09950 09989 09945 09990 09941 00907 59016 09965 09987 09955 09990 09946 09991 09945 01007 39149 09997 09998 09997 09999 09996 09999 09996 01107 39070 09977 09995 09969 09994 09967 09994 09966 0 1 1 5 7 5 9 1 5 8 0 9 9 9 9 0 9 9 9 7 1 0 0 0 5 1 0 0 0 0 0 9 9 9 9 1 0 0 0 0 0 9 9 9 9 0 1 1 5 7 39158 09999 09997 10005 1 0 0 0 0 09999 10000 09999 01157 39158 09999 09997 10005 10000 09999 10000 09999
Derived ratios for different temperature distributions Measurements at P = 100 in D 8
,,° I " l"'Mo °'°o i "°e I °'°o I°'% I u,oo I °'% 0 0 0 0 7 1 0 7 8 9 0 2 7 5 5 0 4 8 5 0 0 5 1 7 9 0485"~ 0 5 2 0 2 0 4 9 9 5 0 2 9 9 8 00009 12026 05048 05296 05515 0527P 05555 05444 05155 00011 13010 05298 05651 05450 05614 05452 05781 05255 00015 15848 05510 05902 05557 05885 05558 06052 05564 00015 14488 05672 06102 05622 06084 05645 06250 05452 00017 15001 05805 06175 05792 06259 05715 06404 05526 00022 15956 04040 06525 05852 06509 05851 06671 05667 00027 16566 04199 06'699 05929 06685 05948 06843 05766 00052 17064 04526 06852 04009 06816 04027 06975 05848 00057 17558 04446 06955 04086 06959 04105 07094 05927 00047 18525 04645 07150 04221 07156 04258 0J286 04065 0 0 0 5 7 1 8 9 5 1 0 4 8 0 4 0 7 5 0 0 0 4 3 3 0 0 7 2 8 5 0 4 5 4 8 0 7 4 5 2 0 4 1 7 8 0 0 0 6 7 1 9 6 4 5 0 4 9 7 9 0 7 4 5 7 0 4 4 5 8 0 7 4 4 4 0 4 4 7 4 0 7 5 8 6 0 4 5 0 8 00087 20840 05885 07715 04391 07705 04705 07857 04544 00107 21889 05549 07950 04396 07915 04914 08041 04762 00132 2.5272 05899 08185 05194 88175 05209 08289 05065 00.157 24585 06251 08407 05495 08598 05506 0,8505 05570 00182 25756 06524 08590 05767 08581 05779 08677 05652 00207 26969 06856 08770 06076 08765 06086 08849 05968 00257 29548 07459 09085 06708 09076 06719 09145 06620 00257 29517 07482 09102 06757 09096 06766 09162 06669 00507 ~1856 08070 09561 07451 09557 07457 09406 07560 00557 54104 08645 09585 08157 09580 08145 09615 08088 00407 36254 09185 0.9765 08851 09765 08851 09782 08816 00407 36284 09197 09768 08867 09767 08868 09786 08824 00457 38010 09655 09897 09478 09899 09475 09907 09458 00507 58946 09872 09965 09815 09966 09815 09968 09808 00557 59517 09966 09989 09955 09991 09951 09997 09949 00607 59574 09981 09995 09976 09995 09972 09995 09971 00657 39426 09994 09995 10001 09999, 09991 09999 09991 00,707 59448 09999 09999 10001 10000 09999 10000 09999 0 0 7 5 7 5 9 4 7 7 1 0 0 0 7 1 0 0 0 1 1 0 0 1 5 1 0 0 0 2 1 0 0 1 0 1 0 0 0 2 1 0 0 1 0 0~07 39454 09996 09996 10001 09999 09994 09999 09994 0 0 8 5 7 5 9 4 4 2 0 9 9 9 8 0 9 9 9 F', 1 0 0 0 1 6 9 9 9 9 0 9 9 0 7 1 0 0 0 0 0 9 9 9 7
Orders of most significant columns in table~
Quantity Orde r
y I 0
All otherB 1
d. 36in from plate leading edge.
30
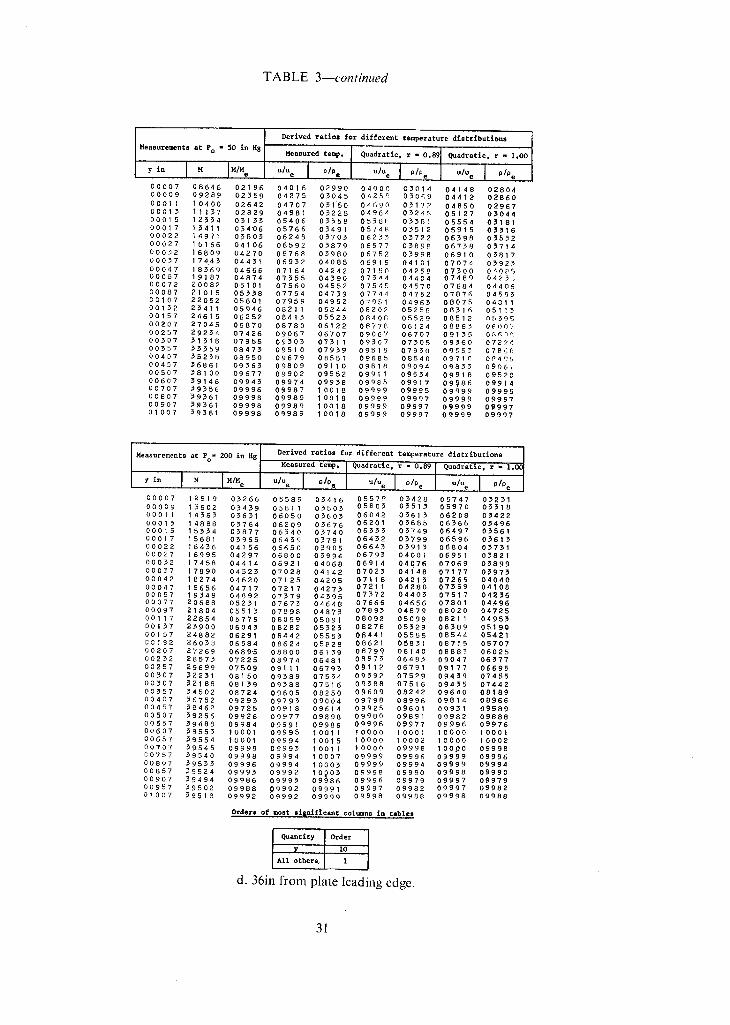
TABLE 3--continued
Derived ratios fo r different temperature distributions
Measurements at Po = 50 in Hg Measured temp. Quadratic, r - 0.89 Quadratic, r - I.O0
,io I M I M,Mo °,uo I °'°o u,uo I°'% °'% I °;% 00007 08646 02196 04016 02990 04000 05014 04148 02804 00009 09289 02559 04278 05045 04259 050c, 9 04412 02860 00011 10400 02642 04707 05150 04690 031VP 04850 02967 00015 11157 02889 04981 05225 0496 A 0324~ 06127 05044 00015 12554 05155 05406 05558 0538£' 05581 05554 0 5 1 8 1 00017 15411 054"06 05766 05491 0574~ 05512 05915 05316 00022 14971 03805 06248 05705 06257, 05722 06598 05852 00027 16166 04106 06592 05879 06577 05895 06758 05714 000.~ 2 16809 04270 06768 05980 06752 05998 06910 05817 0 0 0 5 7 1 7 4 4 5 0 4 4 5 1 0 6 9 5 2 0 4 0 8 5 0 6 9 1 9 0 4 1 0 1 0 7 0 7 4 0 3 9 2 3 00047 18569 0 4 6 6 6 07164 04242 0719(% 04258 07500 04005 0 0 0 5 7 1 9 1 8 7 0 4 8 7 4 0 7 5 5 5 0 4 5 9 0 0 7 5 ~ 4 0 4 4 0 4 0 7 4 8 9 0 4 2 5 5 00072 20082 05101 07560 04552 07545 04570 07684 04406 00087 21015 05558 07754 04759 0774~ 04752 07876 04595 00107 22052 05601 07959 04952 07951 04965 08075 04811 00152 25411 05946 082|I 05244 08202 05256 08316 05113 00157 24615 06252 08413 05523 08402~ 05529 08512 85395 00207 27045 06870 08780 05122 0[R778 06124 08865 0600"~ 00257 29254 07426 09067 06707 09067 06707 09135 0 ,", c~ ", ~ 00507 51518 07955 09305 07311 09507 07505 09360 0722~ 00557 55359 08475 09510 07959 09515 07950 0955~ 0786f: 00407 55238 08950 09679 08551 09685 08540 0971{" 0P406 00457 56861 09565 09809 09110 0981~, 09094 09853 0906, 00507 ~8100 09677 09902 09552 09911 09554 09918 09520 00607 59146 09945 09974 09938 099~5 09917 09?86 09914 00707 ~9556 09996 09987 10018 09999 09995 09999 09998 00807 ~9561 09998 09989 10018 09999 09997 09999 09997 00907 59561 09998 09989 10018 09999 09997 09999 09997 01007 59361 09998 09989 10018 09999 09997 09999 09997
Measurements at Po" 200 in Hg Derived ratios for different temperature distributions
Measured tew. I Quadratic, r - 0.89 I Quadratic, r = I.~
y ln 1 M ]M/M e UlUe I .I.. I UlUe I 01% [ u/us I P/P~ 00007 12919 05266 05589 03416 05579 05428 05747 05231 00009 15602 05439 05811 05505 85805 05513 05970 05518 00011 14565 05651 06050 05603 06042 05615 06208 05422 00013 14888 05764 06209 05676 06201 05685 06366 03496 00015 15554 05877 06540 05740 08355 05749 06497 03561 00017 15681 05965 06459 05791 06452 05799 06596 05615 00022 16436 04156 06650 05905 06643 03913 06804 05751 00027 16995 04297 06800 05994 06795 04001 06951 05821 00052 17458 04414 06921 04068 06914 04076 07069 03899 00057 17890 04525 07028 04142 07025 04148 07177 05975 0 0 0 4 2 1 8 2 7 4 0 4 6 2 0 0 7 1 2 5 0 4 2 0 5 0 7 1 1 8 0 4 2 1 5 0 7 2 6 9 0 4 0 4 0 00047 18656 04717 07217 04275 07211 04280 07559 04108 00057 19548 04892 07579 04595 07572 04405 07517 04256 00077 20688 05251 07675 04648 07666 04656 07801 04496 00097 21804 05515 07898 04875 07893 04879 88020 04725 00117 22854 05779 08099 05091 08092 05099 08211 0495~ 00157 25900 06045 08282 05~25 08278 05529 08589 05190 00157 24882 06291 08442 05555 08441 05558 08544 05421 00182 26058 06584 08624 05~28 08621 05851 08715 05707 00207 27269 0689~ 08800 06159 08799 06140 08885 06025 00252 28575 07225 08974 06481 08973 06483 09047 06~77 00257 29699 07509 09111 06795 09112 06791 09177 06695 00507 52251 08150 09589 07554 09392 07529 09459 07455 00507 52188 08159 09588 07516 09588 07516 09455 07442 00557 54802 08724 09605 08250 09609 08242 09640 08189 00407 56752 09295 09793 09004 09798 08998 09814 08966 00457 ~8462 09725 09918 09614 09925 09601 09951 09589 00507 59256 09926 09977 09898 09980 09891 09982 09888 00857 59488 09984 09991 09986 09996 09977 09996 09976 00607 59555 10001 09995 10011 ~0000 10001 10000 10001 00657 59554 10001 09994 10015 10000 10002 10000 10002 00707 38545 09999 09995 10011 10000 09998 100po 09998 00757 ~9540 09998 09994 10007 09999 09996 09999 09996 00807 55553 09996 09994 10005 09999 09994 09999 09994 00857 ~9524 09993 09992 10905 88998 09990 09998 09990 00907 39494 09986 09993 09986 09996 09979 09997 09979 00957 58502 09988 0 9 9 9 2 09991 09997 09982 09997 09982 01007 39518 09992 09992 09999 09998 09988 09998 09988
Orders of W i t s l l n l f ~ c s n t e o l ~ n s in t ~ l e s
Quantity Order
y IO
A l l o t h e r ~ 1
d. 36in from plate leading edge.
31
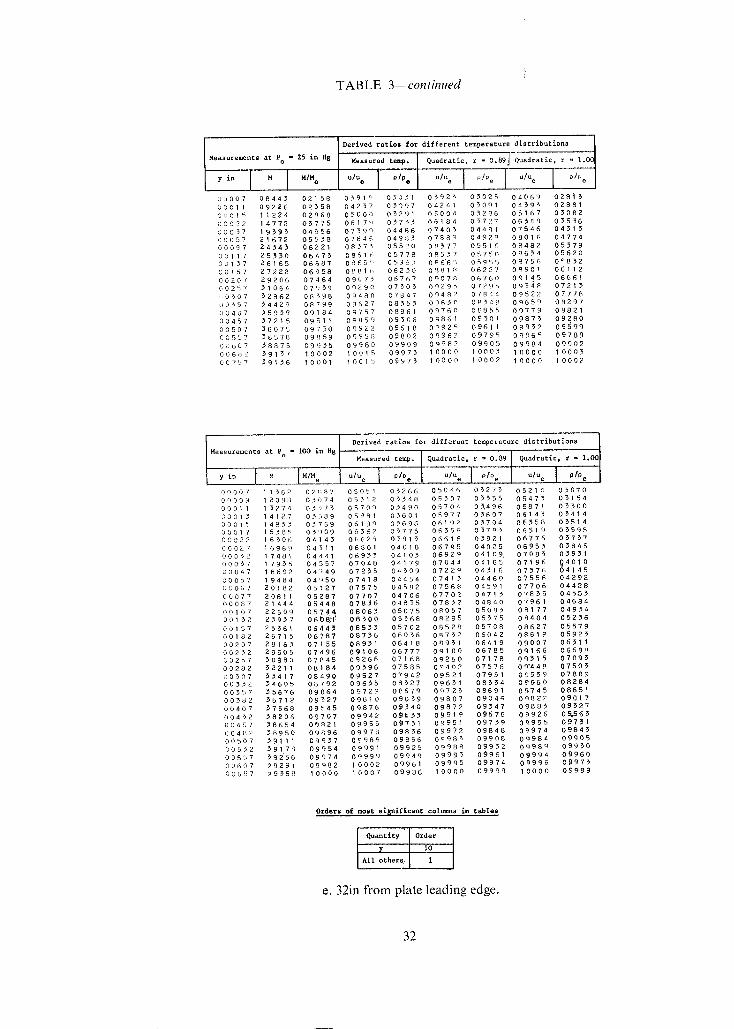
TABLE 3--contmued
I Derived ratios fo i different temperaturedtstrlbutlons / M ........ eS at e ° - 25 in .g M ...... d temp. Quadrati .... 0.89] Quadrati .... 1.O(I
yi . M I M/M ~ ~1~ I" ~'% .% o/% ~/~e ~ '%/ O U O 0 7 0 8 4 4 3 0 2 1 5 8 0 3 9 1 ~' 03031 0 5 9 2 ~ 0 3 0 2 5 0 4 0 6 9 0 2 8 | 3 00011 09226 02558 04237 03097 042aI 03091 0459a 02881 00015 11224 02868 05000 05291 05004 03286 05167 05082 CC922 14772 03775 0517 ~! 03733 06184 03727 06349 03536 00037 19395 04956 0739 <I 04486 07405 04481 07546 04313 00057 21672 05538 07~46 04985 07880 04928 08016 04774 00097 24345 06221 0837~ 05520 08577 05516 08482 05579 00117 25550 06473 08516 05778 08537 05750 08654 05620 00137 26165 06687 0865 ~' 05963 08669 05955 09756 05832 00157 27228 06958 0881(, 06230 0~818 06227 08901 06112 00207 29206 07464 0907~ 06767 O~07a 06760 09195 06661 00257 31064 07939 09290 07303 0~29 ~ 0 7 2 q 5 09548 07215 I0307 32862 08398 09480 07847 0948P 07844 09522 07778 00357 5 4 4 2 9 08799 09627 08553 09630 08548 09659 08297 00407 55939 09184 09757 08861 09760 08855 09779 08821 00457 57215 09511 09859 09506 09861 09301 09875 09280 00507 38075 09730 09922 09618 0 ~925 09611 09952 09~99 00557 38578 09859 09958 09802 09962 09795 09965 09789 00607 56875 09!355 09980 09909 09982 09905 09984 09902 00602 39137 10002 10015 09973 I0000 10003 10000 10005 00757 39136 10001 10015 09973 1 0 0 0 0 10002 10000 I0007
Derived ratios for different temperature distributions
Measurements at P = IO0 in H E ] I Measured temp. Quadratic, r = 0.89 Quadratic, r - 1.09
y in ] M [M/M e U/Ue I PIPe [ u/ue [ ¢'/Oe ] UlUe I OlP ..... 00007 11362 02~87 05051 03266 05045 03275 05210, 05070 0 0 0 0 9 1 2 0 9 8 0 3 0 7 4 0 5 3 1 2 0 3 3 4 8 0 5 3 0 7 0 5 5 9 5 05475 0 5 1 5 4 000~ I 13274 03 i75 05700 03490 05704 03,496 06871 03500 00013 14127 03589 05991 03601 05977 05607 06145 05414 0 0 0 1 5 1 4 8 3 3 0 3 7 6 9 0 6 1 9 q 0 3 6 9 6 0 8 1 9 2 0 3 7 0 4 0 6 3 5 8 0 3 5 1 4 00017 15385 03909 06362 05775 06356 03785 06519 05596 00022 16506 04143 06625 03913 06616 05921 06776 05737 00027 16969 04311 06801 04018 06795 04025 06953 03845 00052 17481 04441 06933 04103 06929 04109, 07083 03931 0 0 0 3 7 1 7 9 3 5 0 4 5 5 7 0 7 0 4 8 0 4 1 7 9 0 7 0 4 4 0 4 1 8 5 0 7 1 9 6 9 4 0 1 0 00047 18692 04749 07235 04309 07229 04316 07576 04145 00057 19484 04950 07418 04454 07413 04460 07556 04292 000(;7 20182 05127 07575 04582 07568 04591 07706 04428 00077 20811 05287 07707 04706 07702- 04715 07855 045,55 00087 21444 05448 07836 04855 07832 04840 07961 04684 00107 22609 05744 08065 05075 08057 05083 08177 04934 00132 23937 06 ~) S31 ! 08500 05568 08295 05575 08404 05256 00157 25361 06445 08553 05702 08528 05708 08627 05579 00182 26715 06787 08756 06036 08752 06042 08819 05925 00207 28165 07155 08931 06418 08951 06419 09007 06511 00232 29505 07496 09106 06777 09100 06785 09166 06688 00257 30880 07845 09266 07168 09260 07178 09515 07095 00282 32211 08184 09596 07585 00402 07576 0~'d48 07505 00507 53417 08490 09527 07942 09521 07951 09559 07889 00332 34605 08792 09635 08527 0o651 08354 09660 08284 00557 35676 09064 09729 08679 09723 38691 09745 08651 00382 36712 09527 09810 09039 09807 09048 0~822 09017 00407 -57568 09545 09876 09340 09872 09547 09883 09527 00452 38206 09707 09942 09553 09919 09576 09925 09.565 00457 38654 09821 09955 09731 09951 09739 09955 09751 0 0 4 8 2 58950 09;396 09978 09856 099-f2 09848 00974 09845 00507 59111 09957 09989 09896 0m98 ~ 09908 09984 09905 00552 391.78 09954 09991 09925 0n988 09932 0998 q 09950 00557 59256 09974 09999 09949 09993 09961 09994 09960 00607 59291 09982 10002 09961 09995 09974 09996 09975 00657 39358 10000 10007 09986 10000 09999 10000 09999
Orders o f most s i ~ n i f L c a n t columns in t a b l e s
Quantity Order
y 10
Ali others: I
e. 32in from plate leading edge.
32
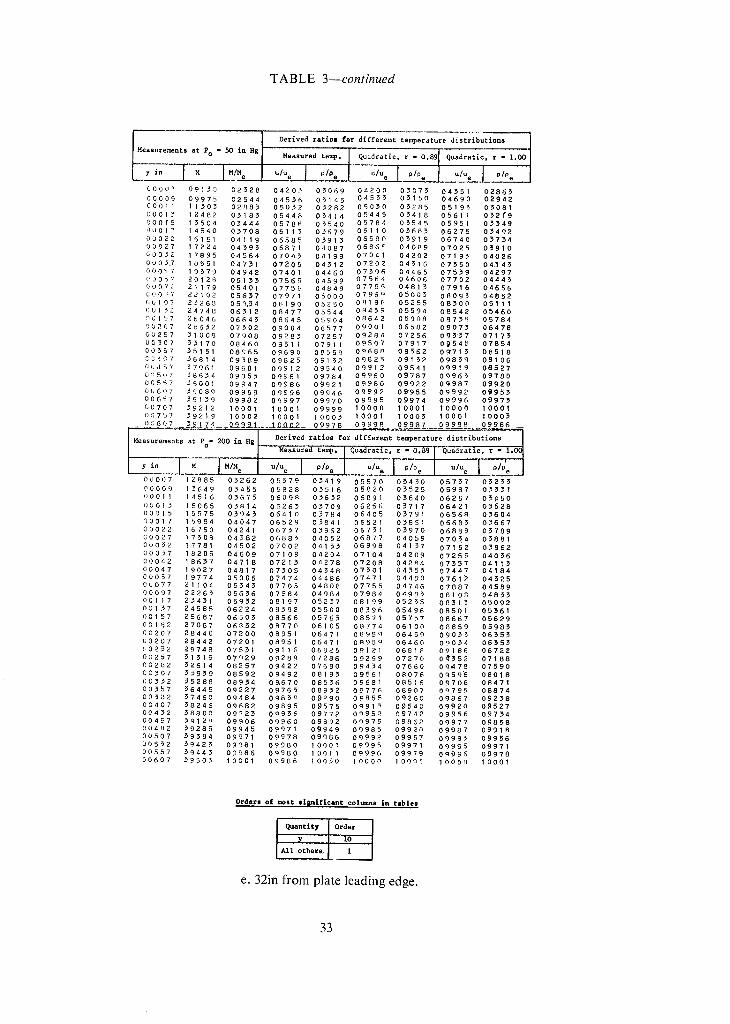
TABLE 3--continued
i Derve r'o'o'i'tteopertuestlbuton ..... M . . . . . . . . t ' a t PO = 50 J.U H 8 '" M . . . . . . d t e ~ . QuadL"a'i;e', r - 0.89 Quadra t i . . . . 1.00
; " ° I " .... I . ; .o I °'°e I °-'°o °'°o I °'°e °'°° I °'°o C0007 09130 02528 04205 05069 04200 0 ) 0 7 ) 04551 02865 00009 09975 02544 04536 05145 045 )5 05150 04690 02942 CO011 11505 0288) 05032 05282 050 )0 05285 05195 05081 o 0 0 1 5 1 2 4 8 2 0 5 1 8 5 0 5 4 4 8 0 5 4 1 4 0 5 4 4 5 0 5 4 1 8 0 5 6 1 1 0 5 2 f 9 O 0 0 F 5 1 5 5 0 4 0 5 4 4 4 0 5 7 8 8 0 5 5 4 0 0 5 7 8 4 0 5 5 4 5 0 5 9 5 1 0 3 5 4 9 0 0 0 } 7 1 4 5 4 0 0 5 7 0 8 0 6 1 1 5 0 5 6 7 9 0 6 1 1 0 0 ) 6 8 ) 0 6 2 7 5 0 3 4 9 2 00022 16151 04119 06585 05915 Q 6580 03919 06740 0)754 00027 17224 04595 06871 04087 0686c 04089 07025 03910 Q0052 17895 04564 07045 04199 07041 04202 07195 040~6 0005.7 18551 04731 07205 04512 07202 04516 07)50 04,343 000~7 19579 04942 07401 04460 07396 04465 075)9 04297 00057 20128 05155 07569 04599 07564 04606 07702 0444) (,Q072 21179 05401 07758 04849 07788 04815 07916 04656 c00;~7 22102 056)7 07971 05000 °796c~ 05005 0809) 04852 (i0107 25268 05%54 08190 05250 08186 05255 08500 05111 (,'0152 24748 06512 08477 05544 084)9 05594 08542 05460 00157 26046 0664) 08645 05904 0~642 05908 08155 05784 0U207 28652 07502 09004 0657"7 09001 06582 0907~ 06478 00257 31008 07900 09285 07257 09284 07256 09)57 07175 00507 55170 08460 09511 07911 09507 07917 09545 07854 00357 55151 08~65 09690 08659 0968P 08562 09715 08518 C~ ~,07 ~6614 09589 09825 09152 09828 09152 098)9 09106 (;i ,157 37961 09681 09912 09540 09912 09541 09919 08527 0:1507 ~8554 09855 09961 09784 09960 09787 0996) 09780 00557 ~9001 09947 09986 09921 09986 09922 09987 09920 0(J607 ~9089 09969 09996 09946 09992 09'955 09992 0995) 00657 59159 09982 09997 09970 09995 09974 09996 0997) G0707 5 9 2 1 2 10001 10001 09999 10000 10001 10000 10001 06757 59219 10002 10001 10005 10001 10005 10001 10005
,-- (!0807 _3~!74__0_~.98_i.__,i0~__ Q_99]~ 099_98 .09987_____0999_9_8_._..0_9_986___
[M . . . . . . . . . ts a~ P = 200 i n H g l I • Derived ratios for d[f£erent temperature distributions
r o ~ M ...... d temp. [ quadraCi .... 0.89 I Quadrati .... 1.0~
] .Y ~-n I M M/M I u/u P/0 u/u p/p u/u P/P / I - - _ _ ~ ! e / e I e I . . . . . e I e I e I _ e l
0 0 0 8 7 1 2 9 8 5 0 5 2 6 2 0 5 5 7 9 0 5 4 1 9 0 5 5 7 0 0 5 4 5 0 0 5 7 ) 7 0 5 2 5 5 00009 15649 05455 05828 05516 05820 05525 05987 05351 00011 14516 05675 0609R 0)632 06091 05640 06257 05.450 00015 15065 05814 0626) 05709 06256 05717 06421 05528 00015 15575 05945 06410 03784 06405 05791 06568 0)604 00017 15984 04047 06529 05841 06521 05851 0668) 0)667 00022 16150 04241 06757 05962 06751 05970 06889 0)789 C0027 17508 04582 06885 04052 06877 04059 070~4 05881 0 0 0 5 2 1 7 7 8 1 0 4 5 0 2 0 7 0 0 2 0 4 1 5 5 0 6 9 9 8 0 4 1 5 7 0 7 1 5 2 0 5 9 6 2 0 0 0 5 7 1 8 2 0 5 0 4 6 0 9 0 7 1 0 9 0 4 2 0 4 0 7 1 0 4 0 4 2 0 9 0 7 2 5 5 0 4 0 ) 6 0 0 0 4 2 ! 8 6 5 7 0 4 7 1 8 0 7 2 1 5 0 4 2 7 8 0 7 2 0 8 0 4 2 8 4 0 7 5 5 7 0 4 1 1 5 00047 19027 04817 07)05 04548 07501 04555 07447 04184 00057 19774 05006 07474 04486 07471 04490 0761~ 04)25 00077 21104 0554) 07705 04808 07755 04746 07887 04589 00097 22263 056)6 07984 04984 07984 04983 08108 048)) 00117 23451 059)2 08197 05237 08199 05255 08)15 05092 00157 24585 06224 08)92 05500 08)96 05496 08501 05561 00157 25687 06505 08566 05765 08571 05757 08667 05629 001}~2 27067 06852 08770 06105 08774 06100 08859 0598) 0 0 2 0 7 2 8 4 4 0 0 7 2 0 0 0 8 9 5 1 0 6 4 7 1 0 8 9 5 9 0 6 4 5 9 0 9 0 ) 5 0 6 ) 5 ) 00207 28442 07201 08951 06471 0895 q 06460 09054 06)55 (0252 29748 07551 09116 06825 091~I 06818 09186 06722 00257 51519 07929 09289 07286 09299 07270 0~)52 07188 00282 52614 08257 09422 07680 09454 07660 09478 07590 00)07 55959 08592 09492 08195 09561 08076 0959'6 08018 00)52 ~5288 08934 0~670 085)6 09681 08516 09706 08471 00557 56445 09227 09763 08952 09776 08907 09795 08874 00382 )7460 09484 09859 09290 09855 09260 09867 09258 00407 58246 09682 09895 09575 09915 09540 09920 09527 00452 58800 09925 09956 09772 0~95~ 09742 09956 09754 00457 39128 09906 09960 09892 0n975 09862 09977 09858 00482 59288 09945 09971 09949 09985 09920 09987 09918 00507 39584 09971 09978 09986 09992 09957 0999) 09956 00552 59425 09981 09980 10001 09995 09971 09995 09971 00557 5944) 09986 09980 10011 09996 09979 09996 09978 00607 ~9505 10001 09986 10050 10000 10001 1000h 10001
Orders o f most s t a n l f l c a n t columns [n tab les
Quantity Order y 10
All othere~ I
e. 32in from plate leading edge.
33
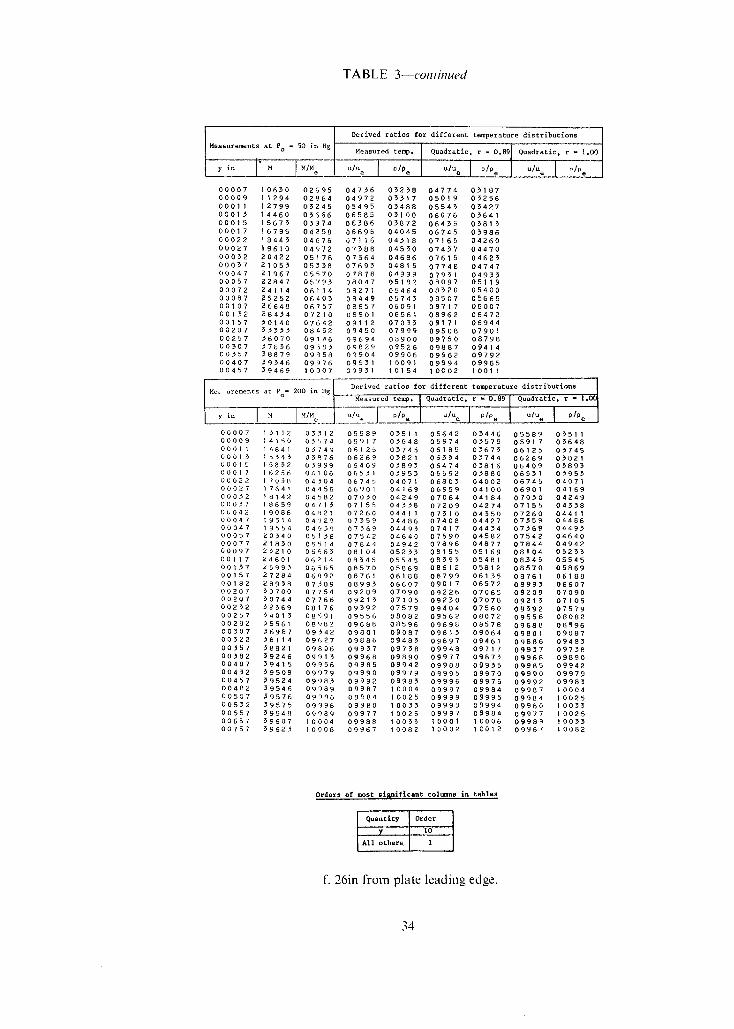
TABLE 3--cominued
Derived r a t i o s f o r different temperature distributions
Measurements at Po = 50 in 8g Measured temp. I Quadratic, r = 0.89 Quadratic, r = 1.00
yin l'M IM/Me U/Ue I P/Pe I u/ue I P/Oe U/Ue } p/pe
0 0 0 0 7 1 0 6 5 0 0 2 6 9 5 0 4 7 5 6 0 5 2 5 8 0 4 7 7 4 0 5 1 8 7 0 0 0 0 9 1 1 2 9 4 0 2 8 6 4 0 4 9 7 2 0 3 3 1 7 0 5 0 1 9 0 5 2 5 6 0 0 0 1 1 1 2 7 9 9 0 3 2 4 5 0 5 4 9 5 0 5 4 8 8 0 5 5 4 5 0 5 4 2 7 0 0 0 1 5 1 4 4 6 0 0 5 6 6 6 0 6 5 8 5 0 5 1 0 0 0 6 0 7 6 0 5 6 4 1 0 0 0 1 5 1 5 6 7 5 0 5 9 7 4 0 6 5 8 6 0 3 8 7 2 0 6 4 ) 5 0 5 8 1 3 0 0 0 1 7 1 6 7 9 5 0 4 2 5 8 0 6 6 9 6 0 4 0 4 5 0 6 7 4 5 0 5 9 8 6 0 0 0 2 2 1 8 4 4 5 0 4 6 7 6 0 7 1 1 6 0 4 3 1 8 0 7 1 6 5 0 4 2 6 0 0 0 0 2 7 1 9 6 1 0 0 4 9 7 2 0 7 ) 8 8 0 4 5 5 0 0 7 4 ) 7 0 4 4 7 0 0 0 0 5 2 2 0 4 2 2 0 5 1 7 8 0 7 5 6 4 0 4 6 8 6 0 7 6 1 5 0 4 6 2 5 0 0 0 5 7 2 1 0 5 5 0 5 3 5 8 0 7 6 9 5 0 4 8 1 5 0 7 7 4 6 0 4 7 4 7 0 0 0 4 7 2 1 9 6 7 0 5 5 7 0 0 7 8 7 8 0 4 9 9 9 0 7 9 5 1 0 4 9 5 5 0 0 0 5 7 2 2 8 4 7 0 5 7 9 5 0 8 0 4 7 0 5 1 8 2 0 8 0 9 7 0 5 1 1 9 0 0 0 7 2 2 4 1 1 4 0 6 1 1 4 0 8 2 7 1 0 5 4 6 4 0 8 5 2 0 0 5 4 0 0 00087 25252 06405 08449 05745 08507 05665 00107 26648 06757 08657 06091 08717 06007 0 0 1 5 2 2 8 4 5 4 0 7 2 1 0 0 5 9 0 1 0 6 5 6 1 0 8 9 6 2 0 6 4 7 2 0 0 1 5 7 3 0 1 4 0 0 7 6 4 2 0 9 1 1 2 0 7 0 5 5 0 9 1 7 1 0 6 9 4 4 0 0 2 0 7 ) 5 5 5 3 0 8 4 5 2 0 9 4 5 0 0 7 9 9 9 0 9 5 0 8 0 7 9 0 1 0 0 2 5 7 3 6 0 7 0 0 9 1 A 6 0 9 6 9 4 0 8 9 0 0 0 9 7 5 0 0 8 7 9 8 0 0 5 0 7 -'~ 7 6 5 6 0 9 5 9 ~ 0 9 8 2 9 0 9 5 2 6 0 9 8 8 7 0 9 4 1 4 0 0 5 5 7 5 8 8 7 9 0 9 8 5 8 0 9 9 0 4 0 9 9 0 6 0 9 9 6 2 0 9 7 9 2 0 0 4 0 7 5 9 ) 4 6 0 9 9 7 6 0~1931 1 0 0 9 1 0 9 9 9 4 0 9 9 6 5 0 0 4 5 7 ~ 9 4 6 9 1 0 0 0 7 0 9 9 5 1 1 0 1 5 4 1 0 0 0 2 1 0 0 1 1
• Derived ratios for different temperature distributions 200 in Hg
........... Po = "M ...... d temp. I quadrati .... 0.89 I Quadrati .... 1.
,o I,,Mo I . . . . . . . . . . +el °'°o I u'% l o'oe l °'°e I 0'%1 0 0 0 0 7 0 0 0 0 9 0 0 0 1 1 0 0 0 1 5 0 0 0 1 5 0 0 0 1 7 0 0 0 2 2 0 0 0 2 7 00052 0 0 0 3 7 0 0 0 4 2 0 0 0 4 7 0 0 0 4 7 00057 00077 00097 0 0 1 1 7 0 0 1 3 7 0 0 1 5 7 0 0 1 8 2 0 0 2 0 7 0 0 2 0 7 0 0 2 5 2 0 0 2 5 7 0 0 2 8 2 0 0 5 0 7 0 0 5 2 2 0 0 5 5 7 0 0 5 8 2 0 0 4 0 7 00452 0 0 4 5 7 0 0 4 8 2 00507 0 0 5 5 2 00557 00657 00757
3 1 1 2 0 3 5 1 2 0 5 5 8 9 0 5 5 1 1 0 5 6 4 2 0 5 4 4 6 0 5 5 8 9 0 5 5 1 1 4 1 5 0 0 5 5 7 4 0 5 9 1 7 0 5 6 4 8 0 5 9 7 4 0 5 5 7 9 0 5 9 1 7 0 5 6 4 8 4 8 4 1 0 3 7 4 9 0 8 1 2 5 0 5 7 4 5 0 6 1 8 6 0 5 6 7 5 0 6 1 2 5 0 ) 7 4 5 5545 05876 06269 05821 06354 05744 0 6 2 6 9 05821 5852 05999 06409 05895 06474 03816 06409 05895 6256 04106 06531 05953 06592 05880 06551 05955 7 0 3 8 0 4 3 0 4 0 6 7 4 5 0 4 0 7 1 0 6 8 0 5 0 4 0 0 2 0 6 7 4 5 0 4 0 7 1 7 6 4 1 0 4 4 5 6 0 6 9 0 1 0 4 1 6 9 0 6 9 5 9 0 4 1 0 0 0 6 9 0 1 0 4 1 6 9 8 1 4 2 0 4 5 8 2 0 7 0 ) 0 0 4 2 4 9 0 7 0 8 4 0 4 1 8 4 0 7 0 5 0 0 4 2 4 9 8 6 5 9 0 4 7 1 5 0 7 1 5 5 0 4 5 5 8 0 7 2 0 9 0 4 2 7 4 0 7 1 5 5 0 4 5 5 8 9 0 8 8 0 4 ~ 2 1 0 7 2 6 0 0 4 4 1 1 0 7 5 1 0 0 4 5 5 0 0 7 2 6 0 0 4 4 1 1 9514 04929 07559 04486 07408 04427 07559 04486 9554 04939 07569 04495 07417 04454 07569 04495
20)40 05~58 07542 04640 07590 04582 07542 04640 2 1 8 5 0 0 5 5 1 4 0 7 8 4 4 0 4 9 4 2 0 7 8 9 6 0 4 8 7 7 0 7 8 4 4 0 4 9 4 2 2 3 2 1 0 0 5 8 6 5 0 8 1 0 4 0 5 2 5 5 0 8 1 5 5 0 5 1 6 9 0 8 1 0 4 0 5 2 5 3 2 4 6 0 1 0 6 P l 4 0 8 5 4 5 0 5 5 4 5 0 8 5 9 3 0 5 4 8 1 0 8 3 4 5 0 5 5 4 5 2 5 9 9 5 0 6 5 6 5 0 8 5 7 0 0 5 8 6 9 0 8 6 1 2 0 5 8 1 2 0 8 5 7 0 0 5 8 6 9 2 7 2 8 4 0 6 8 9 2 0 8 7 6 1 0 6 1 8 8 0 8 7 9 9 0 6 1 5 5 0 8 7 6 1 0 6 1 8 8 28958 07509 08993 06607 09017 06572 08995 06607 30700 07754 09209 07090 09226 07065 09209 07090 30744 07766 09215 07105 09230 07078 09215 07105 52569 08176 09592 07579 09404 07560 09)92 07579 3 4 0 1 5 0 8 5 9 1 0 9 5 5 6 0 8 0 8 2 0 9 5 6 2 0 8 0 7 2 0 9 5 5 6 0 8 0 8 2 ~5561 08982 09688 08596 09698 08578 09688 08596 56987 09542 09801 09087 09815 09064 09801 09087 38114 09627 09886 09485 09897 09461 09886 09485 38821 09806 09957 09738 09948 09717 09957 09758 59246 09915 09966 09890 09977 09875 09968 09890 3 9 4 1 5 09956 09985 09942 09980 09955 09985 09942 39508 09979 09990 09979 09995 09970 09990 09979 ~ 9 5 2 4 0 9 9 8 5 0 9 9 9 2 0 9 9 8 5 0 9 9 9 6 0 9 9 7 5 0 9 9 9 2 0 9 9 8 5 39546 09989 09987 10004 09997 09984 09987 10004 39576 09396 09984 10025 09999 09995 09984 10025 )9575 09396 09980 10053 09999 09994 09980 10055 39548 09989 09977 10025 09997 09984 09977 I0825 59607 10004 09988 10055 10001 10006 09988 10055 5 9 6 2 5 1 0 0 0 8 0 9 9 6 7 1 0 0 8 2 1 0 0 0 2 1 0 0 1 2 0 9 9 6 7 1 0 0 8 2
Orders o f most s ~ ; n l f [ c a n t columns in t a b l e s
q u a n t i t y Order
y I0
A l l others: 1
f. 26in from plate leading edge.
34
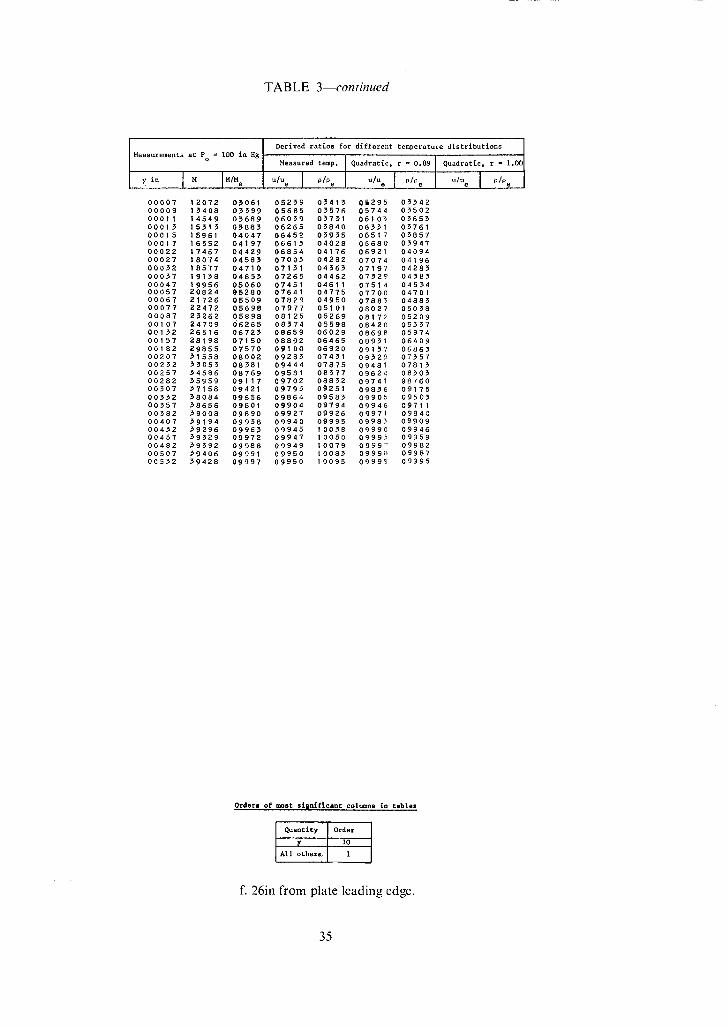
TABLE 3--continued
Derived ratios for different temperature distributions
M tsat o=1ooi Hg ......... 1 I Measured temp. Quadratic, r = 0.89 Quadratic, r = 1.00
,io I IM .e u,oo I °'°o u,% l°'°e I °'°e 00007 12072 0~,061 05239 03413 01295 0 )342 00009 I3408 05 )99 05685 0 )576 0574,4 0 )502 00011 14549 05689 06039 03731 06103 0)65) 00013 18313 0)883 06265 03840 06531 03761 00015 15961 04047 06452 0)935 06517 05857 00017 16552 04197 06613 04028 0668(> 03947 00022 17467 04429 06854 04176 06921 04094 0 0 0 2 7 1 8 0 7 4 0 4 5 8 ~ ' 0 7 0 0 3 0 4 2 8 2 0 7 0 7 4 0 4 1 9 6 0 0 0 3 2 1 8 5 7 7 0 4 7 1 0 0 7 1 3 1 0 4 3 6 3 0 7 1 9 7 0 4 2 8 3 0 0 0 ) 7 1 9 1 3 8 0 4 8 5 3 0 7 2 6 5 0 4 4 6 2 0 7 3 2 9 0 4 3 8 3 0 0 0 4 7 1 9 9 5 6 0 5 0 6 0 0 7 4 5 1 0 4 6 1 I 0 7 5 1 4 0 4 5 3 4 0 0 0 5 7 2 0 8 2 4 @ 5 2 8 0 0 7 6 4 1 0 4 7 7 5 0 7 7 0 0 0 4 7 0 1 0 0 0 6 7 2 1 7 2 6 0 5 5 0 9 0 7 8 2 9 0 4 9 5 0 0 7 8 8 3 0 4 8 8 3 0 0 0 7 7 2 2 4 7 2 0 5 6 9 8 0 7 9 7 7 0 5 1 0 1 0 8 0 2 7 0 5 0 3 8 0 0 0 8 7 2 3 2 6 2 (35898 0 8 1 2 5 0 5 2 6 9 0 8 1 7 2 0 5 2 0 9 0 0 1 0 7 2 4 7 0 9 0 6 2 6 5 0 8 ) 7 4 0 5 5 9 8 0 8 4 2 0 0 5 5 5 7 0 0 1 3 2 2 6 5 1 6 0 6 7 2 ~ ' 0 8 6 5 9 0 6 0 2 9 0 8 6 9 8 0 5 9 7 4 0 0 1 5 7 2 8 1 9 8 0 7 1 5 0 0 8 8 9 2 0 6 4 6 5 0 8 9 3 l 0 6 4 0 9 00182 29855 07570 09100 06920 09137 06863 00207 31558 08002 09285 07431 09529 07357 00832 )3053 08381 09444 07875 09481 07813 00257 34586 08769 09581 08)77 09624 08303 00282 35959 09117 09702 08832 09741 08760 00)07 37158 09421 09795 09251 09836 09175 00)32 38084 09656 09864 09583 09905 09503 00357 38656 09801 09904 09794 09946 09711 00382 39008 09890 09927 09926 09971 09840 00407 39194 09938 09940 09995 09983 09909 00432 39286 09963 09945 I 00)8 09990 09946 00457 39)29 09972 09947 10050 0999~ 09959 00482 39392 09988 09949 10079 09997 09982 00507 39406 09991 09950 10083 09998 09987 00532 )9428 09997 09950 10095 09999 09995
O rd e r s of most s [ ~ n i f | c a n t columns i n t a b l e s
Q u a n t i t y Order
y 10
All o t h e r s , I
f. 26in from plate leading edge.
35
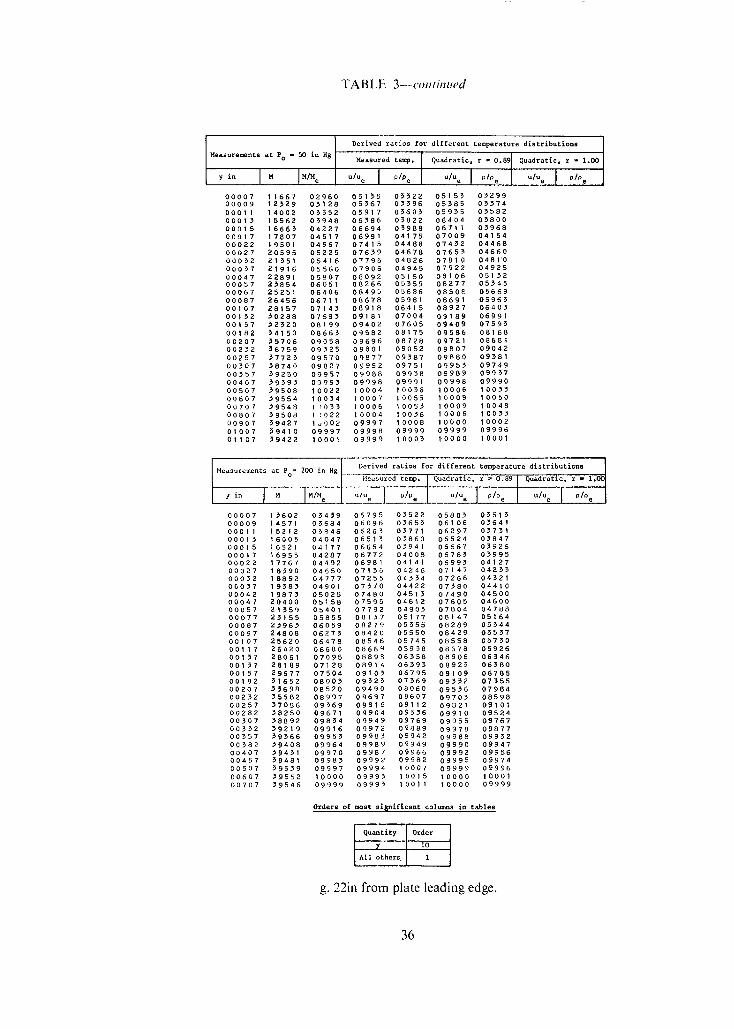
TABLE 3-- continued
Measurements at Po " 50 in 8g
y in
0 0 0 0 7 0 0 0 0 9 0 0 0 1 1 0 0 0 1 5 0 0 0 1 5 0 0 0 1 7 0 0 0 2 2 0 0 0 2 7 0 0 0 5 2 00057 0 0 0 4 7 0 0 0 5 7 0 0 0 6 7 00087 0 0 1 0 7 0 0 1 3 2 0 0 1 5 7 0 0 1 8 2 0 0 2 0 7 00252 0 0 2 5 7 0 0 3 0 7 00357 00407 00507 00607 00707 00807 00907 0 1 0 0 7 0 1 1 0 7
I M JM~ e 1 6 6 7 0 2 9 6 0 2 3 2 9 0 3 1 2 8 4 0 0 2 0 5 5 5 2 5562 0 5 9 4 8 6 6 6 5 0 4 2 2 7 7 8 0 7 0 4 5 1 7 9 5 8 1 0 4 9 6 7
2 0 5 9 5 0 5 2 2 5 2 1 5 5 1 0 5 4 1 6 2 1 9 1 6 O556O 2 2 8 9 1 0 5 8 0 7 2 5 8 5 4 0 6 0 5 1 2 5 2 5 1 0 6 4 0 6 2 6 4 5 6 0 6 7 1 1 2 8 1 5 7 0 7 1 4 5 ~0288 0 7 6 8 5 ~ 2 3 2 0 0 8 1 9 9 ) 4 1 5 0 08663 35706 09058 ]6759 09325 ~7725 09578 ~8740 09827 3 9 2 5 0 09957 39593 09993 39508 1 0 0 2 2 3 9 5 5 4 1 0 0 5 4 5 9 5 4 8 1 ~ 0 3 5 ~9508 1 ~ 0 2 2 39427 I~002 ~ 9 4 1 0 09997 5 9 4 2 2 1 0 0 0 1
Derived ratios for different temperature distributions
Measured temp. Quadratic, r = 0.89 Quadratic, r - 1.00
u/ue I °/Pe u/ue I°/% U/Ue [ P/Pe
0 5 1 3 5 0 5 5 2 2 0 5 1 8 3 0 3 2 9 9 05567 05596 05385 05574 05917 05605 05935 05582 06586 05822 06404 05800 06694 03988 0671 t 05968 0 6 9 9 1 0 4 1 7 5 0 7 0 0 9 0 4 1 5 4 0 7 4 1 5 0 4 4 8 8 0 7 4 3 2 0 4 4 6 8 07639 04678 07653 04660 07796 04826 07810 0481'0 07906 04945 07922 04925 08092 05150 08106 05152 08266 05559 08277 05345 08495 05686 08505 05669 08678 05981 08691 05963 08918 06415 0 8 9 2 7 06405 09181 0 7 0 0 4 09189 06991 0 9 4 0 2 07605 09409 07595 09582 08175 09586 08168 0 9 6 9 6 0 8 7 2 8 0 9 7 2 1 0 8 6 8 1 0 9 8 0 1 09052 09807 0 9 0 4 2 0 9 8 7 7 0 9 3 8 7 0 9 8 8 0 0 9 3 8 1 09952 09751 09955 09749 09988 09958 09989 09937 09998 09991 09998 09990 1 0 0 0 4 10056 10006 10035 10007 10055 10009 10050 10006 10055 10009 10048 10004 10056 10006 10055 09997 I0008 1 0 0 0 0 1 0 0 0 2 0 9 9 9 8 0 9 9 9 9 0 9 9 9 9 0 9 9 9 6 0 9 9 9 9 1 0 0 0 3 1 0 0 0 0 1 0 0 0 1
I I Derived ratios for different temperature distributions Measurements at 200 in H E . . . . . . . . . . . . . . . . . I
P°= [ M ...... d temp. I Quadrati .... 0.09 I Quadrati .... 1.00
,io I M I M'Me °'°' I °'°e I"% I °'"° I °'0" 0 0 0 0 7 3 6 0 2 0 0 0 0 9 4 5 7 1 00011 5 2 1 2 00013 6 0 0 5 0 0 0 1 5 6 5 2 1 00017 6955 00022 7767 00027 8590 00032 8892 00037 9385 0 0 0 4 2 9875 0 0 0 4 7 2 0 4 0 0 00057 2 1 5 5 9 0 0 0 7 7 2 3 1 5 5 00087 23965 00097 24808 0 0 1 0 7 2 5 6 2 0 0 0 1 1 7 2 6 4 2 0 0 0 1 5 7 2 8 0 6 1 0 0 1 3 7 2 8 1 8 9 0 0 1 5 7 2 9 6 7 7 0 0 1 8 2 5 1 6 5 2 0 0 2 0 7 3 5 6 9 8 0 0 2 5 2 3 5 5 8 2 0 0 2 5 7 3 7 0 5 6 0 0 2 8 2 3 8 2 5 0 00307 38892 0 0 3 3 2 3 9 2 1 9 00357 39366 00582 39408 00407 39451 0 0 4 5 7 3 9 4 8 1 00507 59539 00607 39552 00707 59546
03439 05795 03522 05805 03515 05684 06096 03655 06106 05641 05846 06263 03771 06297 03751 04047 06513 03860 06524 03847 04177 06654 05941 06667 03926 04287 06772 04008 06785 05995 0 4 4 9 2 0 6 9 8 1 0 4 1 4 1 0 6 9 9 5 0 4 1 2 7 0 4 6 5 0 07156 0 4 2 4 6 0 7 1 4 7 0 4 2 5 5 0 4 7 7 7 0 7 2 5 5 0 4 3 3 4 0 7 2 6 6 04321 0 4 9 0 1 0 7 5 7 0 0 4 4 2 2 07380 0 4 4 1 0 05025 07480 04513 07490 04500 05158 07595 04612 07605 04600 05401 07792 04805 07804 04788 05855 081~7 05177 08147 05164 06059 08279 05555 08289 05344 06275 0 8 4 2 0 05550 08429 0 5 5 3 7 06478 08546 05745 08558 05730 06680 0866 q 05938 08678 05926 07095 08898 06358 08906 06546 07128 08914 06593 08923 06580 07504 09103 06795 09109 06785 08003 09323 07569 09332 07555 08520 09490 08060 09536 07984 08997 09697 08607 09703 08598 0 9 5 6 9 0 9 8 1 6 0 9 1 1 2 0 9 8 2 1 0 9 1 0 1 0 9 6 7 1 0 9 9 0 4 0 9 5 5 6 0 9 9 1 0 0 9 5 2 4 09854 09949 09769 09955 09767 09916 09972 09889 09978 09877 09953 09983 09942 09988 09932 09964 09989 09949 09990 09947 09970 09987 09966 09992 09956 09985 09992 09982 09995 09974 09997 09994 10007 09999 09996 1 0 0 0 0 0 9 9 9 3 1 0 0 1 5 1 0 0 0 0 1 0 0 0 1 0 9 9 9 9 0 9 9 9 5 10011 1 0 0 0 0 0 9 9 9 9
Order8 oE most si~niflcant cofumns in tables
Quantity Order
All ochers~ 1
g. 22in from plate leading edge.
36
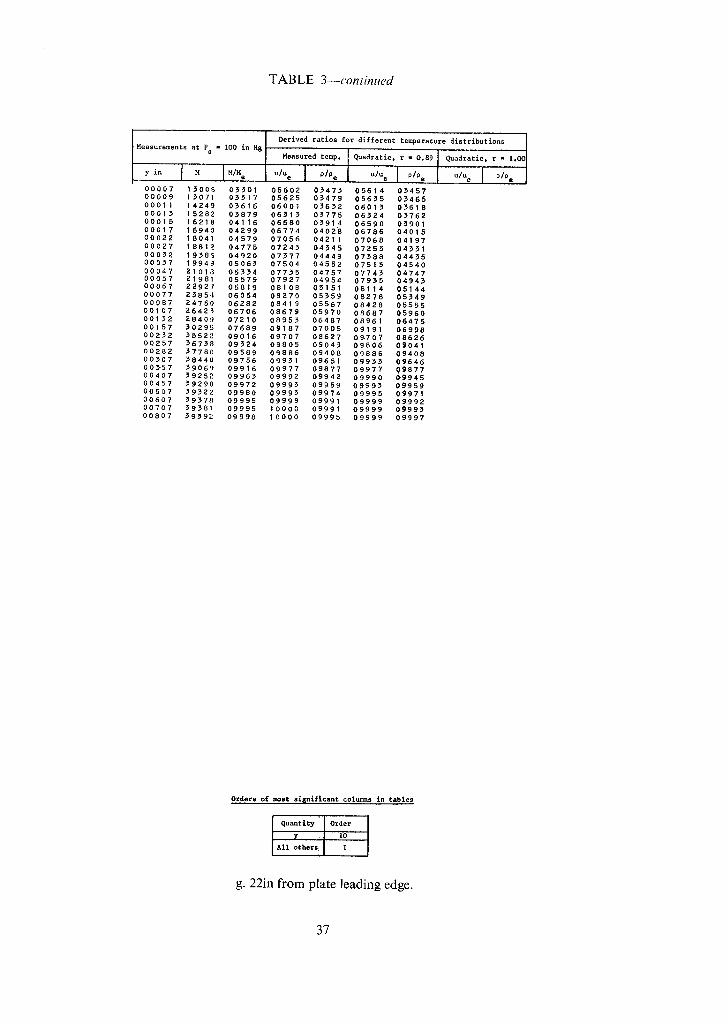
TABLE 3--conHnued
Measurements at Po
y in I M
= lO0 in Hg I Derived ratios ~or different temperature distributions I
Heasured temp. Quadratic, r - 0,89 Quadratic, r - 1.00 l
l""e I °'°o l°"e u'°s I°'% °'% l'°e J 0 0 0 0 7 1 5 0 0 6 0 0 0 0 9 1 3 0 7 1 0 0 0 1 1 1 4 2 4 9 0 0 0 1 5 1 5 2 8 2 0 0 0 1 5 1 6 2 1 8 0 0 0 1 7 1 6 9 4 0 0 0 0 2 2 1 8 0 4 1 0 0 0 2 7 1 8 8 1 2 0 0 0 5 2 1 9 5 8 6 0 0 0 3 7 1 9 9 4 9 0 0 0 4 7 2 1 0 1 8 0 0 0 5 7 2 1 9 8 1 0 0 0 6 7 2 2 9 2 7 0 0 0 7 7 2 5 8 5 4 0 0 0 8 7 2 4 7 5 0 0 0 1 O 7 2 6 4 2 3 0 0 1 5 2 2 8 4 0 9 0 0 1 5 7 5 0 2 9 5 0 0 2 5 2 3 5 5 2 2 0 0 2 5 7 5 6 7 5 8 0 0 2 8 2 3 7 7 8 0 0 0 5 0 7 3 8 4 4 0 0 0 9 5 7 5 9 0 6 9 0 0 4 0 7 5 9 2 5 2 0 0 4 5 7 5 9 2 9 0 0 0 5 0 7 3 9 5 2 2 0 0 6 0 7 3 9 3 7 8 0 0 7 0 7 3 9 3 8 1 0 0 8 0 7 5 9 3 9 2
0 5 5 0 1 0 5 6 0 2 0 5 4 7 5 0 5 6 1 4 0 5 4 5 7 0 3 5 1 7 0 5 6 2 5 0 5 4 7 9 0 5 6 5 5 0 3 4 6 5 0 3 6 1 6 0 6 0 0 1 0 5 6 3 2 0 6 0 1 5 0 3 6 1 8 0 3 8 7 9 0 6 5 1 3 0 ~ 7 7 5 0 6 3 2 4 0 3 7 6 2 0 4 1 1 6 0 6 5 8 0 0 5 9 1 4 0 6 5 9 0 0 5 9 0 1 0 4 2 9 9 0 6 7 7 4 0 4 0 2 8 0 6 7 8 6 0 4 0 1 5 0 4 5 7 9 0 7 0 5 6 0 4 2 1 1 0 7 0 6 8 0 4 1 9 7 0 4 7 7 5 0 7 2 4 5 0 4 5 4 5 0 7 2 5 5 0 4 5 5 1 0 4 9 2 0 0 7 3 7 7 0 4 4 4 9 0 7 5 8 8 0 4 4 3 5 0 5 0 6 5 0 7 5 0 4 0 4 5 5 2 0 7 5 1 5 0 4 5 4 0 0 5 5 3 4 0 7 7 5 5 0 4 7 5 7 0 7 7 4 3 0 4 7 4 7 0 5 5 7 9 0 7 9 2 7 0 4 9 5 4 0 7 9 5 5 0 4 9 4 3 0 5 8 1 9 0 8 1 0 6 0 5 1 5 1 0 8 1 1 4 0 5 1 4 4 0 6 0 5 4 0 8 2 7 0 0 5 5 5 9 0 8 2 7 8 0 5 5 4 9 0 6 2 8 2 0 8 4 1 9 0 5 5 6 7 0 8 4 2 8 0 5 5 5 5 0 6 7 0 6 0 8 6 7 9 0 5 9 7 0 0 8 6 8 7 0 5 9 6 0 0 7 2 1 0 0 8 9 5 5 0 6 4 8 7 0 8 9 6 1 0 6 4 7 5 0 7 6 8 9 0 9 1 8 7 0 7 0 0 5 0 9 1 9 1 0 6 9 9 8 0 9 0 1 6 0 9 7 0 7 0 8 6 2 7 0 F 7 0 7 0 8 6 2 6 0 9 5 2 4 0 9 8 0 5 0 9 0 4 5 0 9 8 0 6 0 9 0 4 1 0 9 5 8 9 0 9 8 8 6 0 9 4 0 8 0 9 8 8 6 0 9 4 0 8 0 9 7 5 6 0 9 9 3 1 0 9 6 5 1 0 9 9 3 5 0 9 6 4 6 0 9 9 1 6 0 9 9 7 7 0 9 8 7 7 0 9 9 7 7 0 9 8 7 7 0 9 9 6 5 0 9 9 9 2 0 9 9 4 2 0 9 9 9 0 0 9 9 4 5 0 9 9 7 2 0 9 9 9 5 0 9 9 5 9 0 9 9 9 3 0 9 9 5 9 0 9 9 8 0 0 9 9 9 5 0 9 9 7 4 0 9 9 9 5 0 9 9 7 1 0 9 9 9 5 0 9 9 9 9 0 9 9 9 1 0 9 9 9 9 0 9 9 9 2 0 9 9 9 5 1 0 0 0 0 0 9 9 9 1 0 9 9 9 9 0 9 9 9 5 0 9 9 9 8 I 0 0 0 0 0 9 9 9 5 0 9 9 9 9 0 9 9 9 7
O rd e r s of most s i s n l f i c a n t colunms i n t a b l e s
q u a n t i t y Order
y 10
A l l o t h e r s j I
g. 22in from plate leading edge.
37
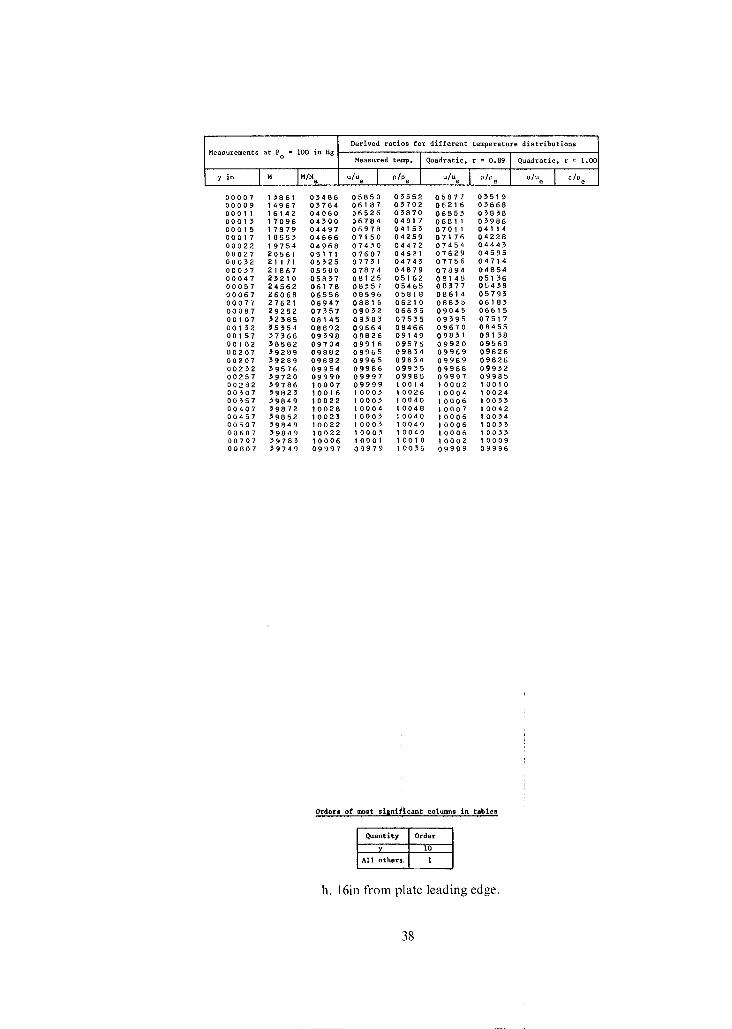
! Measurements at Po = I00 in 88
yln I M ]M/M e
0 0 0 0 7 ' 8 6 1 0 , 4 8 6 0 0 0 0 9 4 9 6 7 0 5 7 6 4 0 0 0 1 1 6 1 4 2 0 4 0 6 0 0 0 0 1 5 7 0 9 6 0 4 5 0 0 0 0 0 1 5 7 8 7 9 0 4 4 9 7 0 0 0 1 7 8 5 5 5 0 4 6 6 6 0 0 0 2 2 9 7 5 4 0 4 9 6 8 0 0 0 2 7 2 0 5 6 1 0 5 1 7 1 0 0 0 , 2 2 1 1 7 1 0 5 3 2 5 0 0 0 3 7 2 1 8 6 7 0 5 5 0 0 0 0 0 4 7 2 5 2 1 0 0 5 8 5 7 0 0 0 5 7 2 4 5 6 2 0 6 1 7 8 0 0 0 6 7 2 6 0 6 8 0 6 5 5 6 0 0 0 7 7 2 7 6 2 1 06947 00087 29252 07357 0 0 1 0 7 ~ ' 2 5 8 5 0 8 1 4 5 0 0 1 , 2 5 5 5 5 4 0 8 8 9 2 0 0 1 5 7 , 7 5 6 6 0 9 5 9 8 0 0 1 8 2 , 8 5 8 2 0 9 7 0 4 0 0 2 0 7 - '$9289 0 9 8 8 2 0 0 2 0 7 :,',59289 0 9 8 8 2 0 0 2 ) 2 , 9 5 7 6 0 9 9 5 4 0 0 2 5 7 ' 9 7 2 0 0 9 9 9 0 0 0 2 8 2 59786 1 0 0 0 7 0 0 5 0 7 )9825 1 0 0 1 6 0 0 5 5 7 , 9 8 4 9 1 0 0 2 2 0 0 4 0 7 ) 9 8 7 2 1 0 0 2 8 0 0 4 5 7 5 9 8 5 2 1 0 0 2 5 0 0 5 0 7 3 9 8 4 9 1 0 0 2 2 0 0 6 0 7 ~ ' 9 8 4 9 1 0 0 2 2 00707 '978, 10006 00807 59749 09997
Derived ratios for different temperature distributions I
Measured temp. Quadratic, r = 0.89 [ Quadratic, r = 1.00
U/Ue I O/tOe U/Ue I °/% I U/Ue I O/Pe
0 5 8 5 0 0 ) 5 5 2 0 5 8 7 7 0 5 5 1 9 06187 0 5 7 0 2 06216 05668 {)6526 0)870 06555 05838 5 6 7 8 4 0 4 0 1 7 0 6 8 1 1 0 .5986 06978 0 4 1 5 5 0 7 0 1 1 0 4 1 1 4 0 7 1 5 0 0 4 2 5 9 0 7 1 7 6 0 4 2 2 8 0 7 4 5 0 0 4 4 7 2 0 7 4 5 4 0 4 4 4 3 0 7 6 0 7 0 4 6 2 1 0 7 6 2 9 0 4 5 9 5 0 7 7 5 1 0 4 7 4 ) 0 7 7 5 6 0 4 7 1 4 0 7 8 7 4 0 4 8 7 9 0 7 8 9 4 0 4 8 5 4 0 8 1 2 5 0 5 1 6 2 0 8 1 4 5 0 5 1 5 6 0 8 5 5 7 0 5 4 6 5 0 8 5 7 7 0 5 4 5 8 08596 05818 0 8 6 1 4 0579) 08816 0 6 2 1 0 08855 06185 0 9 0 . 5 2 06655 09045 06615 09583 07555 09595 07517 09664 08466 09670 08455 09826 09149 09851 09138 09916 09576 09920 09569 09965 09834 09969 09826 09965 0 9 8 3 4 09969 09826 09986 09935 09988 09952 09997 09985 09997 09985 09999 1 0 0 1 4 1 0 0 0 2 1 0 0 1 0 1 0 0 0 5 1 0 0 2 6 1 0 0 0 4 1 0 0 2 4 1 0 0 0 5 1 0 0 4 0 1 0 0 0 6 1 0 0 3 3 1 0 0 0 4 1 0 0 4 8 1 0 0 0 7 1 0 0 4 2 1 0 0 0 3 1 0 0 4 0 1 0 0 0 6 1 0 0 5 4 1 0 0 0 3 1 0 0 4 0 1 0 0 0 6 10055 I0005 1 0 0 4 0 1 0 0 0 6 100'5 1 0 0 0 1 1 0 0 1 0 1 0 0 0 2 1 0 0 0 9 0 9 9 7 9 I 0 0 5 6 0 9 9 9 9 0 9 9 9 6
Orders of most si~nlf|cant columns in tables,
Quantity ] Order i
~ 10
Ali other0~ 1
h. 16in from plate leading edge.
38

Measurements at Po = 200 in Hg Derived ratios for dlffezent temperature distributions
Measuzed ¢emp, Quadratic, r = 0.89 Quadratic, r - 1.
y l n I M IM/He u/u e I p/p e U / U e Z P/De U/Ue I O/De
0 0 0 0 7 1 4 1 8 4 0 5 5 7 1 0 5 9 4 3 0 3 6 1 1 0 5 9 8 0 0 3 5 6 6 0 0 0 0 9 1 5 0 1 7 0 5 7 8 1 0 6 1 9 6 0 3 7 2 4 0 6 2 3 2 0 3 6 8 0 0 0 0 1 1 15831 0 3 9 8 6 0 6 4 3 1 0 3 8 4 1 0 6 4 6 8 0 3 7 9 7 0 0 0 1 5 1 6 4 5 3 0 4 1 4 2 0 6 6 0 3 0 3 9 3 6 0 6 6 4 1 0 3 8 9 1 0 0 0 1 5 1 7 0 3 4 0 4 2 8 9 0 6 7 6 0 0 4 0 2 4 0 6 7 9 6 0 3 9 8 2 0 0 0 1 7 1 7 5 4 9 0 4 4 1 8 0 6 8 9 4 0 4 1 0 8 0 6 9 3 0 0 4 0 6 5 0 0 0 2 2 1 8 4 7 6 0 4 6 5 2 0 7 1 2 5 0 4 2 6 2 0 7 1 5 9 0 4 2 2 1 0 0 0 2 7 1 9 1 4 9 0 4 8 2 1 0 7 2 8 5 0 4 3 7 9 0 7 3 1 8 0 4 3 4 0 0 0 0 3 2 1 9 7 3 4 0 4 9 6 8 0 7 4 1 9 0 4 4 8 5 0 7 4 5 1 0 4 4 4 6 0 0 0 3 7 2 0 2 7 4 0 5 1 0 4 0 7 5 3 7 0 4 5 8 6 0 7 5 7 0 0 4 5 4 7 0 0 0 4 2 2 0 8 6 3 0 5 2 5 2 0 7 6 8 4 0 4 6 7 3 0 7 6 9 4 0 4 6 6 0 0 0 0 4 7 2 1 4 4 0 0 5 3 9 8 0 7 7 8 3 0 4 8 1 0 0 7 8 1 2 0 4 7 7 4 0 0 0 5 7 2 2 6 1 8 0 5 6 9 4 0 8 0 1 2 0 5 0 5 1 0 8 0 3 9 0 5 0 1 7 0 0 0 7 2 2 4 8 6 9 0 6 2 6 1 0 8 4 0 4 0 5 5 5 0 0 8 4 3 0 0 5 5 1 7 0 0 0 8 7 2 5 9 7 5 0 6 5 4 0 0 8 3 8 8 0 6 0 7 8 0 8 6 0 2 0 5 7 8 0 0 0 0 9 7 2 7 1 1 0 0 6 8 2 5 0 8 7 4 7 0 6 0 8 9 0 8 7 6 7 0 6 0 6 1 0 0 1 0 7 2 8 2 7 4 0 7 1 1 8 0 8 9 0 6 0 6 3 8 9 0 8 9 2 4 0 6 3 6 2 0 0 1 1 7 2 9 3 7 2 0 7 3 9 5 0 9 0 4 5 0 6 6 8 4 0 9 0 6 2 0 6 6 5 8 0 0 1 5 7 3 1 3 9 1 0 7 9 0 3 0 9 2 8 1 0 7 2 5 1 0 9 2 9 3 0 7 2 3 2 0 0 1 5 7 5 1 4 0 7 0 7 9 0 7 0 9 2 8 0 0 7 2 6 0 0 9 2 9 5 0 7 2 3 6 0 0 1 5 7 3 3 3 9 7 0 8 4 0 8 0 9 4 8 4 0 7 8 5 9 0 9 4 9 7 0 7 8 3 9 0 0 1 8 2 3 5 8 3 5 0 9 0 2 2 0 9 7 0 6 0 8 6 4 1 0 9 7 1 3 0 8 6 2 8 0 0 2 0 7 ~ 7 8 1 3 0 9 5 2 0 0 9 8 6 3 0 9 5 1 6 0 9 8 6 7 0 9 3 0 9 0 0 2 3 2 ~ 8 9 6 5 0 9 8 1 0 0 9 9 4 7 0 9 7 2 5 0 9 9 4 9 0 9 7 2 2 0 0 2 5 7 ~ 9 3 6 5 0 9 9 1 1 0 9 9 7 6 0 9 8 6 9 0 9 9 7 6 0 9 8 6 9 0 0 2 8 2 ~ 9 5 4 5 0 9 9 5 6 0 9 9 8 9 0 9 9 5 4 0 9 9 8 8 0 9 9 3 5 0 0 3 0 7 3 9 5 8 8 0 9 9 6 7 0 9 9 9 2 0 9 9 5 0 0 9 9 9 1 0 9 9 5 1 0 0 3 3 2 3 9 6 3 7 0 9 9 7 9 0 9 9 9 6 0 9 9 6 7 0 9 9 9 5 0 9 9 6 9 0 0 3 5 7 3 9 6 7 7 0 9 9 8 9 0 9 9 9 8 0 9 9 8 3 0 9 9 9 7 0 9 9 8 4 0 0 3 8 2 3 9 6 6 9 0 9 9 8 7 0 9 9 9 8 0 9 9 7 9 0 9 9 9 7 0 9 9 8 1 0 0 4 0 7 3 9 6 4 4 0 9 9 8 1 0 9 9 9 1 0 9 9 7 9 0 9 9 9 5 0 9 9 7 2 0 0 4 5 7 3 9 6 9 2 0 9 9 9 3 0 9 9 9 9 0 9 9 8 8 0 9 9 9 8 0 9 9 8 9 0 0 5 0 7 3 9 7 2 5 10001 1 0 0 0 1 1 0 0 0 0 1 0 0 0 0 1 0 0 0 2 0 0 6 0 7 3 9 7 0 3 0 9 9 9 6 0 9 9 9 6 ZOO00 0 9 9 9 9 0 9 9 9 4 0 0 7 0 7 ~ 9 7 0 9 0 9 9 9 7 0 9 9 9 7 1 0 0 0 0 0 9 9 9 9 0 9 9 9 6
Orders of most si~n,lf~c.n~ c o l o n s in t&bles
Quantity Order
10
All o ther¢ I
h. 16in from plate leading edge.
39
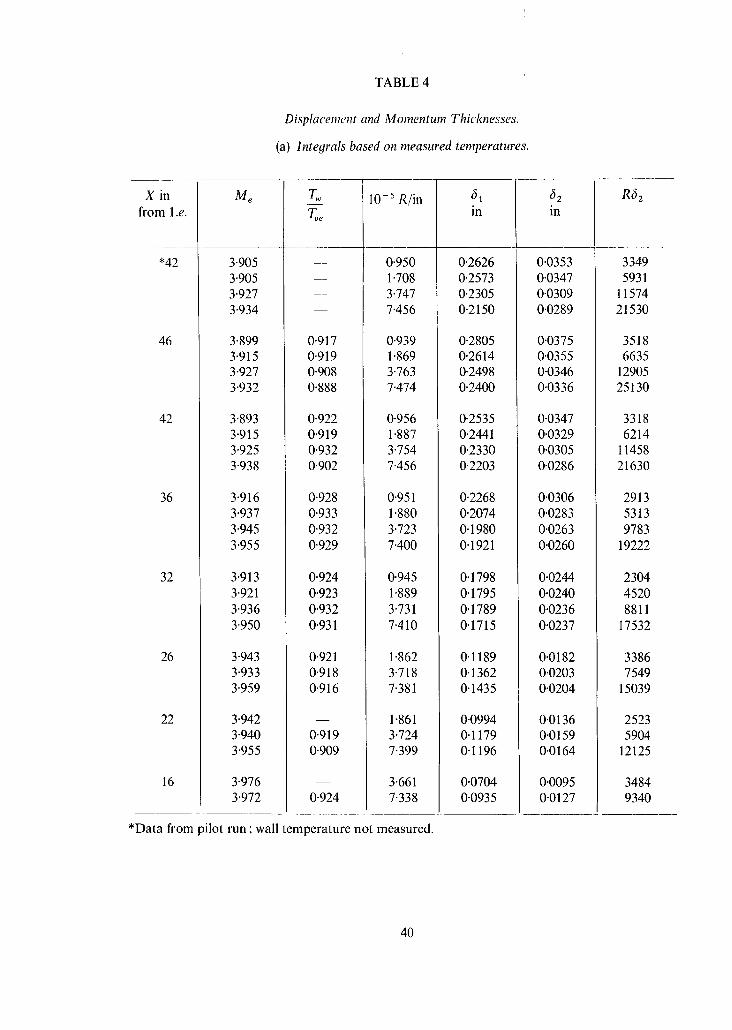
TABLE 4
Displacement and Momentum Thicknesses.
(a) Integrals based on measured temperatures.
X in from I.e.
*42
46
42
36
32
26
22
16
Me
3'905 3'905 3'927 3.934
3"899 3-915 3"927 3"932
3"893 3"915 3"925 3"938
3"916 3"937 3"945 3"955
3"913 3"921 3'936 3"950
3"943 3"933 3'959
3"942 3"940 3"955
3-976 3"972
w
Toe
m
m
0.917 0.919 0.908 0.888
0.922 0.919 0.932 0.902
0.928 0.933 0.932 0-929
0.924 0"923 0.932 0.931
0.921 0.918 0.916
m
0.919 0.909
0-924
1 O- 5 R/in
0.950 1.708 3.747 7.456
0.939 1.869 3.763 7.474
81 in
0.2626 0.2573 0.2305 0.2150
0.2805 0.2614 0-2498 0.2400
82 in
0.0353 0.0347 0.0309 0.0289
0.0375 0.0355 0-0346 0.0336
0.956 1.887 3.754 7.456
0"951 1.880 3.723 7.400
0"945 1"889 3'731 7'410
1"862 3-718 7.381
1-861 3"724 7"399
3'661 7'338
0-2535 0.0347 0"2441 0"0329 0'2330 0"0305 0'2203 0"0286
0'2268 0.0306 0'2074 0'0283 0"1980 0"0263 0"1921 0"0260
0-1798 0.0244 0"1795 0"0240 0"1789 0'0236 0"1715 0"0237
0'1189 0"0182 0'1362 0'0203 0.1435 0"0204
0.0994 0'0136 0"1179 0"0159 0"1196 0.0164
0.0704 0.0095 0-0935 0.0127
R62
3349 5931
11574 21530
3518 6635
12905 25130
3318 6214
11458 21630
2913 5313 9783
19222
2304 4520 8811
17532
3386 7549
15039
2523 5904
12125
3484 9340
*Data from pilot run ; wall temperature not measured.
40
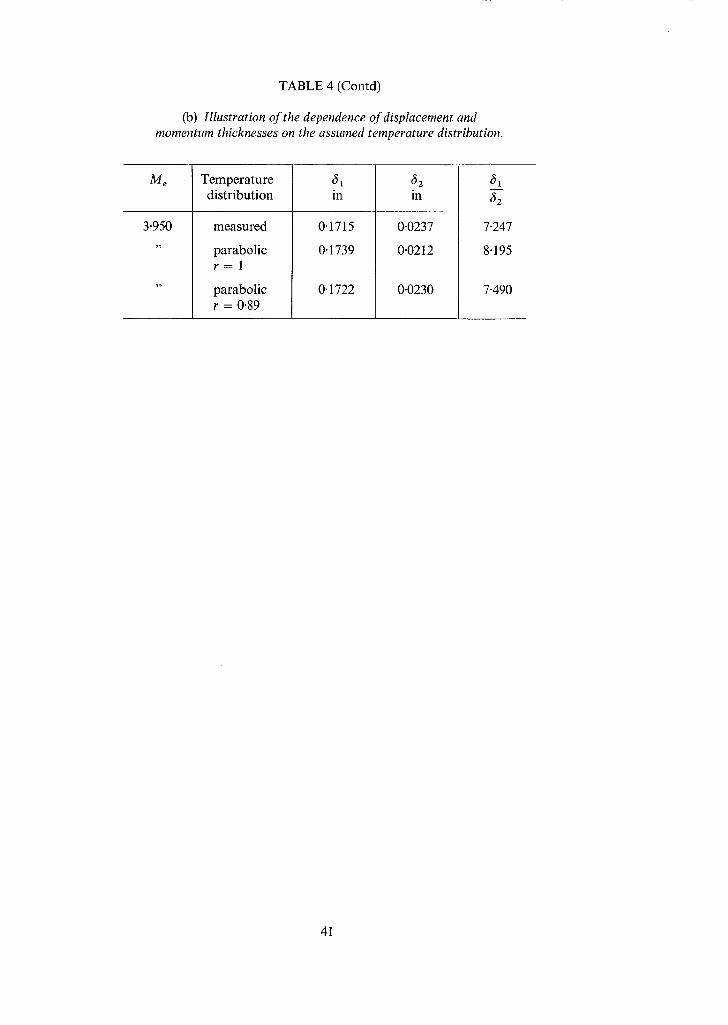
TABLE 4 (Contd)
(b) Illustration of the dependence of displacement and momentum thicknesses on the assumed temperature distribution.
Me
3.950
Temperature distribution
measured
parabolic r = l
parabolic r = 0.89
in
0.1715
0.1739
0.1722
~2 in
0-0237
0"0212
0"0230
~2
7"247
8"195
7-490
41
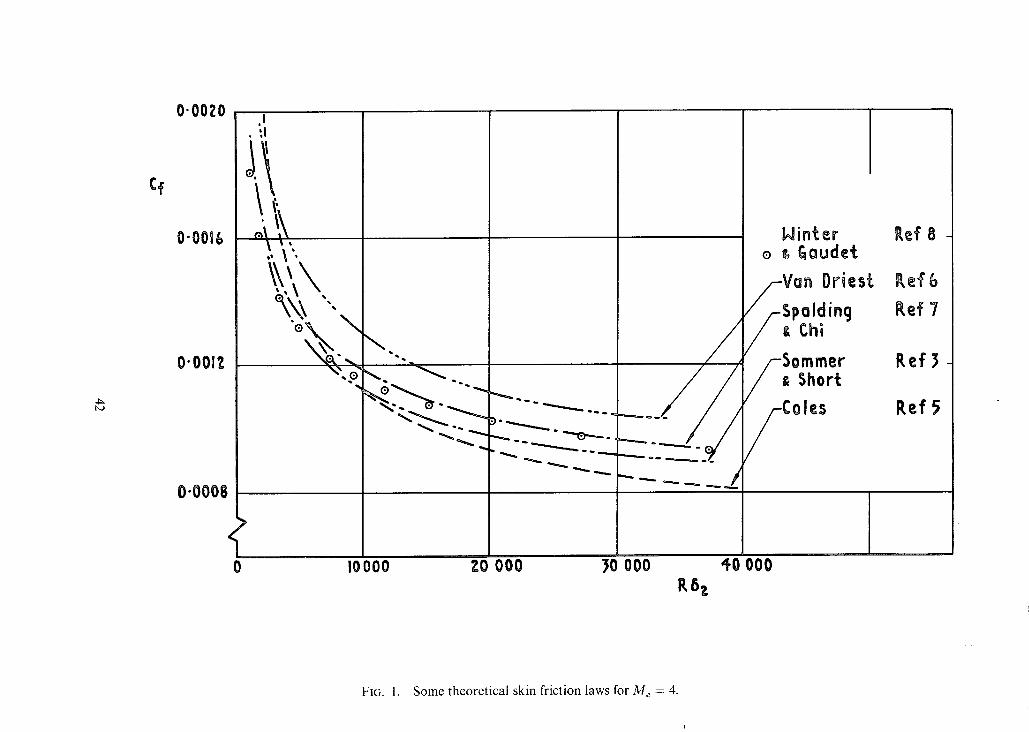
¢f
O.OOZO
0.0016
O'O01Z
O.O00g ?
0
.! • 11
!,1
I0000 ZO )00 3o 000 R6~
Nin~er Ref 8 e t ~aude~
/ - V a n Driest. P, ef 6 /
Ref3
P, e f 5
40 000
FIG. 1. Some theoretical skin friction laws for M e = 4 .
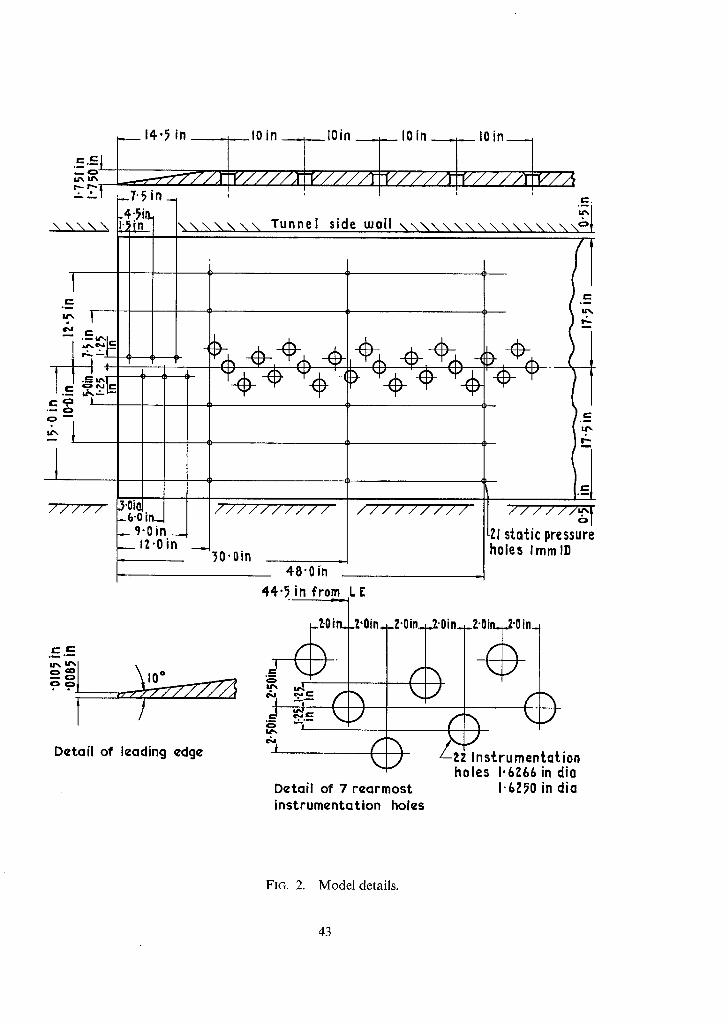
.---.-=l
\ X \ \ \
I# 'P in -~ lOin ~, lOin :: lOin .,J loin
~/X"Y////X'Y///,/]-"P'////'I-'Y////~-P'/A l
in ,
% % % \ % % Tunnel side w0[I \ \ \ \ \ \ \ \ \ \ \ \ \ \ \ \ o
T _ _
e-
• ~ 0
0
l
~ ~,~
C
I t %
B
1._ =
(-
/ / / / /
¢ - . r - ° ~ , ~
.~.oio] _6-Oin_ 9-Oin ~ lZ'Oin
l /
48" 0 in
44"7 in from
__•////////// ~O'Oin
/ / / / / / / / /
LE
.?.'Oin.
J
_Z.O~Oin.
Z] stat ic pressure holes ImmlO
)
Q
; ( g
Det.ail of leading edge ( Detail of 7 rearmost ins t rumenta t ion holes
( ) Ins t rumenta t ion
holes 1.6Z66 in dio I-6ZPO in clio
FIG. 2. Model details.
43
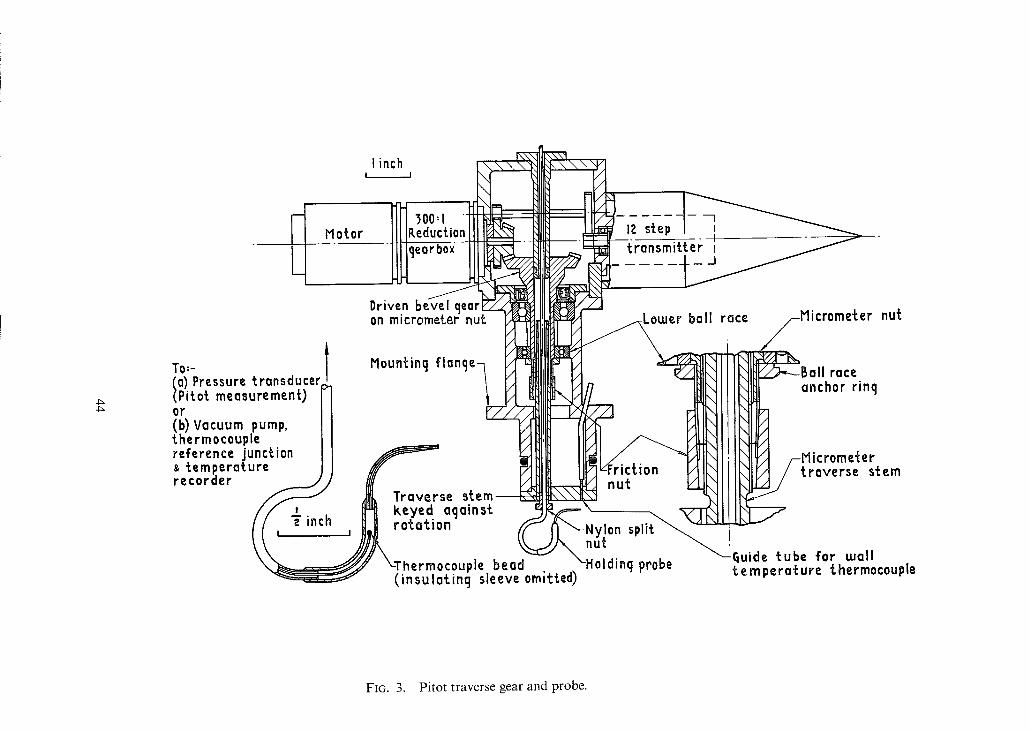
4~
linch I I
Motor t00,1 ,eclucti~ iearbox
Driven bevel on micrometf
,o.- I (o) Pressure transducer~ V] (Pitot measurement) [ ] or I I (b) Vacuum pump. I I thermocouple I I reference junction I I
temperature ) J / ' /" recorder _----. / / E( I:
: : J ~l~ Traverse stem~-E / f _~. , ~ Keyed aqainst.
~hermocouple bead . (insulat.inq sleeve omit~.ed)
12 step t ~ _
-Lo~er ball race ter nut
Ball race anchor rinq
nut
-Micrometer traverse stem
,•on spit
• tube for ,,,all ,Idinq p r o b e temperature thermocouple
FIG. 3. Pitot traverse gear and probe.
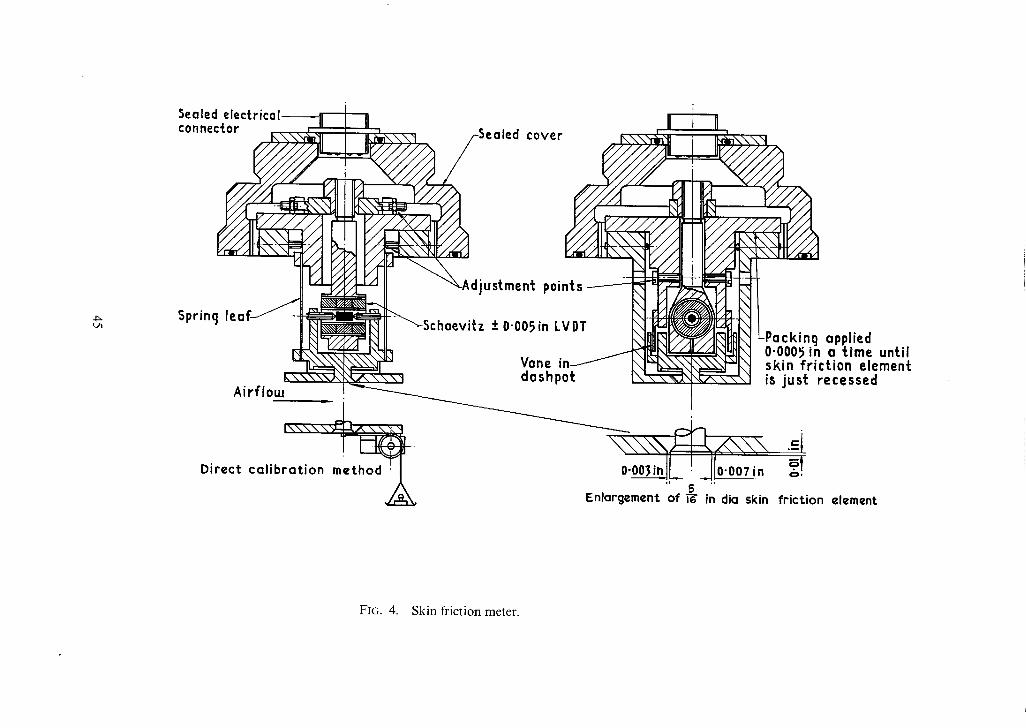
Sealed connec
C o v e r
4~ Sprincj
Direct cal ibrat ion m ' t h o d ~
05 in L~
Vane il doshpG
applied a t ime until
:t ion element -ecessed
\ \ \ \ \ , ~ ,~, ,~\ .~i o.oo,,~ L Jr;.;o;,o ~
5 Enlargement of ~ in dia skin friction element
FIG. 4. Skin friction meter.
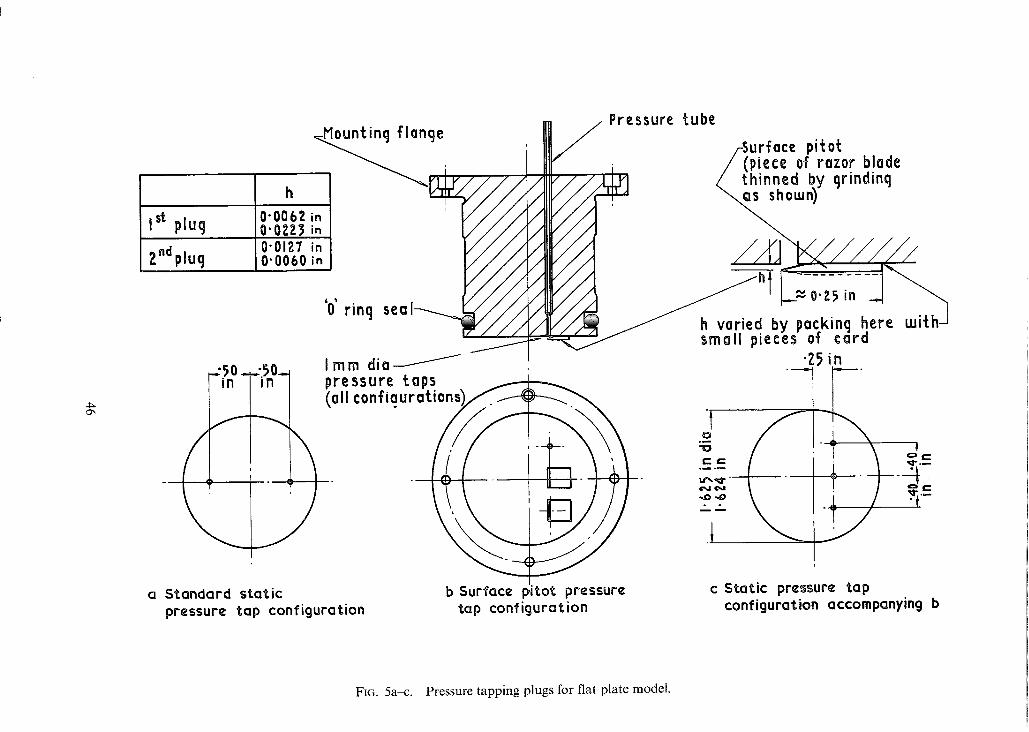
4~ C~
I st pluq
zndplucJ
~ lancje
0"0062
0"006O
'0 rinq sea l ~
_i~nO ° ~SnO_ Imm d i a ~ J • pressure taps
( 2 ) " Standard static b Surface itot pressure pressure tap configuration tap configuration
/]/•//t,•lPre ssure ~.ube
/-Surface pi~ot / ( p i e c e of razor blade ~/ thinned by qrindinq
IU/A /xJ
~ , / ' ~ ~ hv~ 'ed by pac, kinq here with ~ - ~ ~ small pieces aT tara
• ?.5 in
" 1
c Static pressure tap configuration accompanying b
FIG. 5am. Pressure tapping plugs for flat plate model.
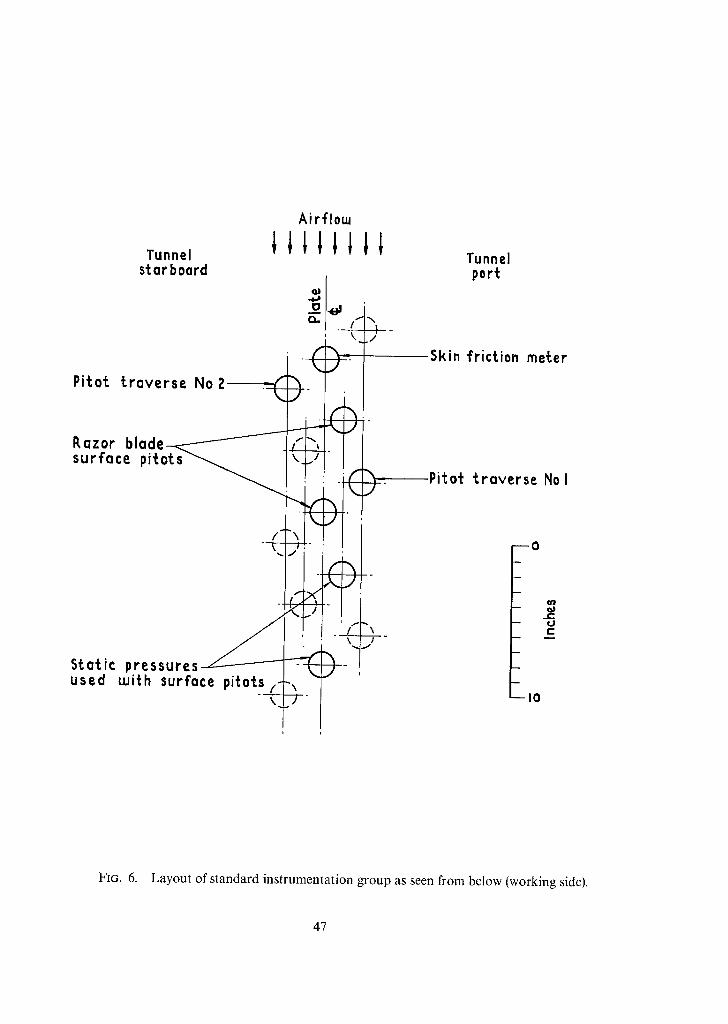
Pitot
Tunnel starboard
~.raverse No
AirfloLu
o n /.-- ~,}
~ I •
Tunnel port
Skin friction me~.er
Razor blade surface pitt
Pitot traverse No l
Static used
p r e s s u r e s ~ Luith surface pi~ots (__~-
\
\ - T J
- - 0
- - U ¢ -
b l O
FIG. 6. Layout of standard instrumentation group as seen from below (working side).
47
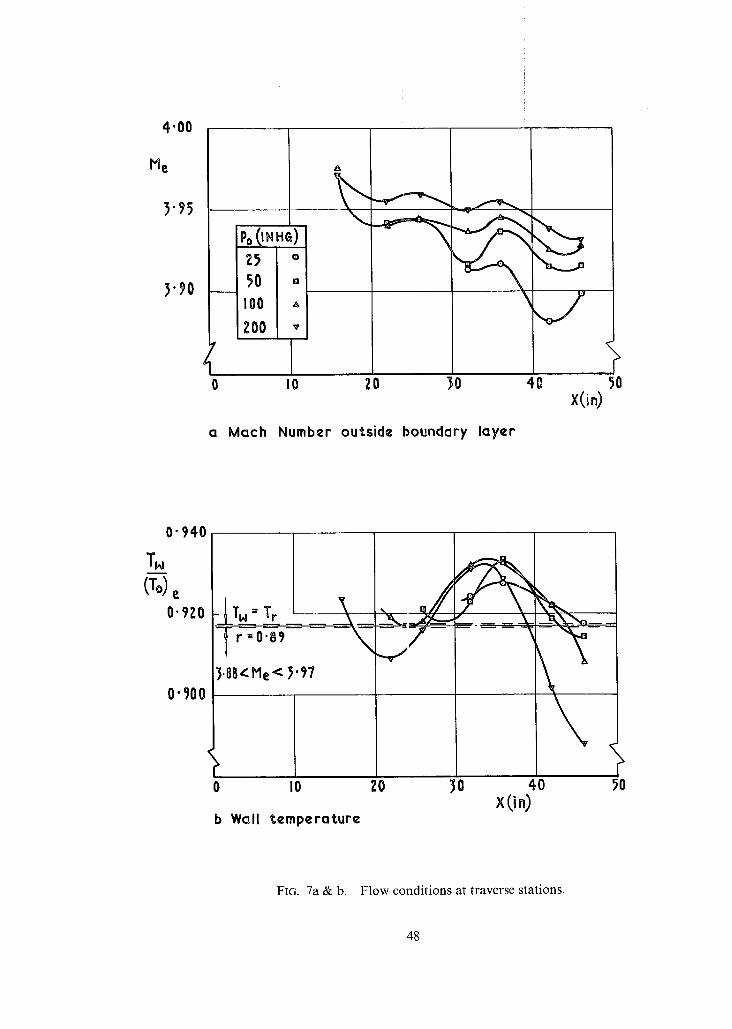
4.00
He
3'~P
3"~0
Po0"HG) Z5 o
50 .
I00 A
ZOO "
' I 1 0 IO
A
20 }0 40 50
a Mach Number outside boundary layer
0"940
TN i i
~e O'gZO
0"~00
='=r =o'8~= = /
3.88<Me< 3"97
%.
0 I0
b Wall temperature
ZO 3O 40 PO xO.)
FIG. 7a & b. Flow conditions at traverse stations.
48
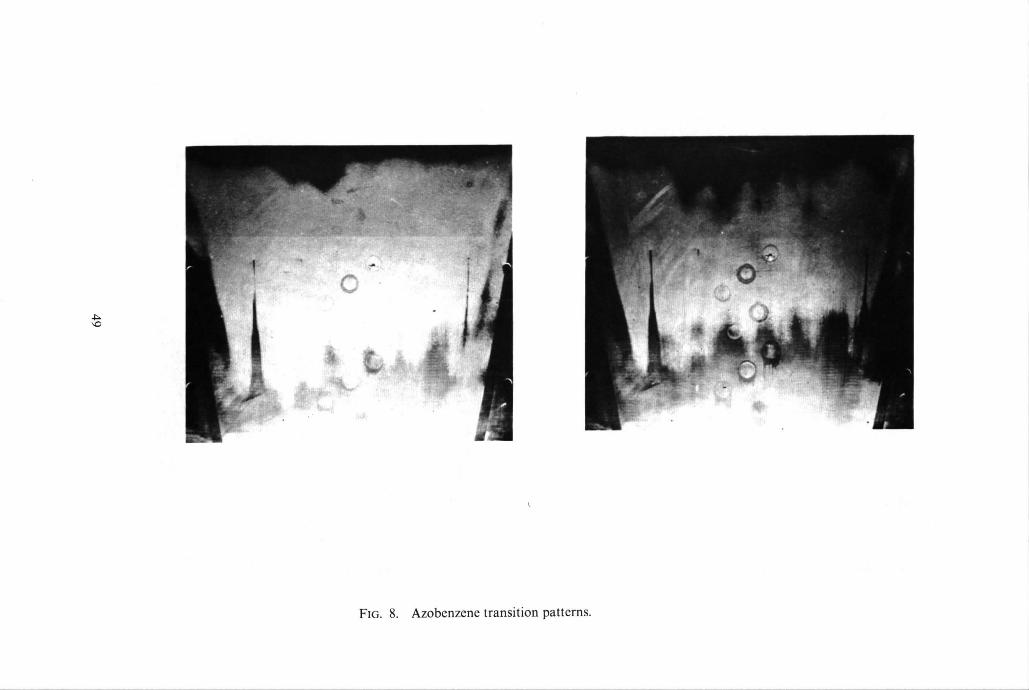
4 ~
.Jr
FIG. 8. Azobenzene transition patterns.
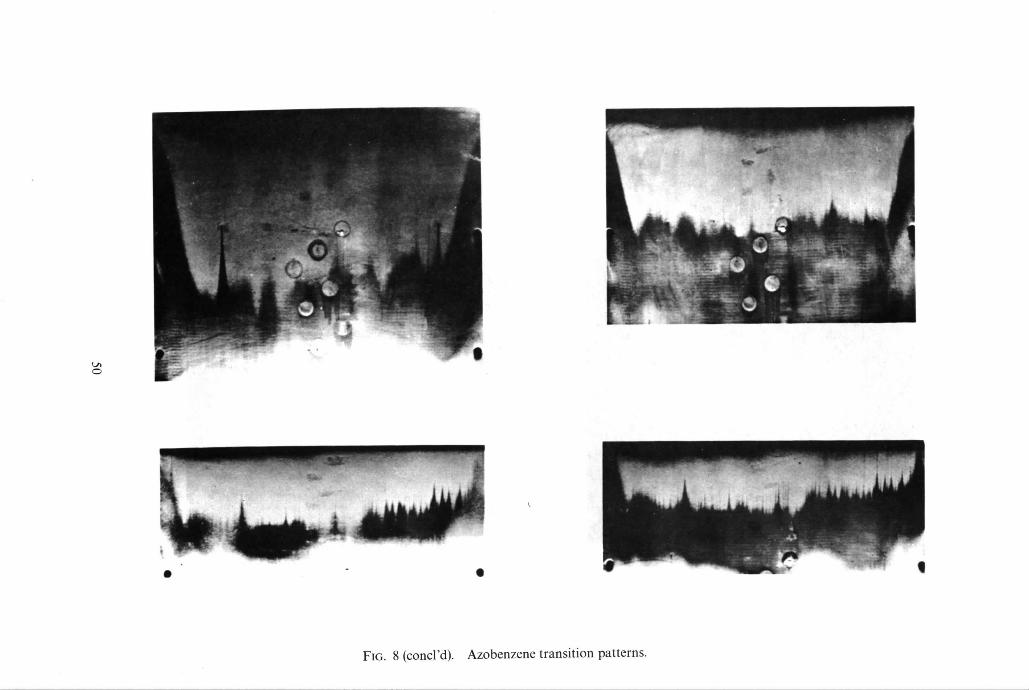
L~ O
FIG. 8 (concl'd). Azobenzene transition patterns.
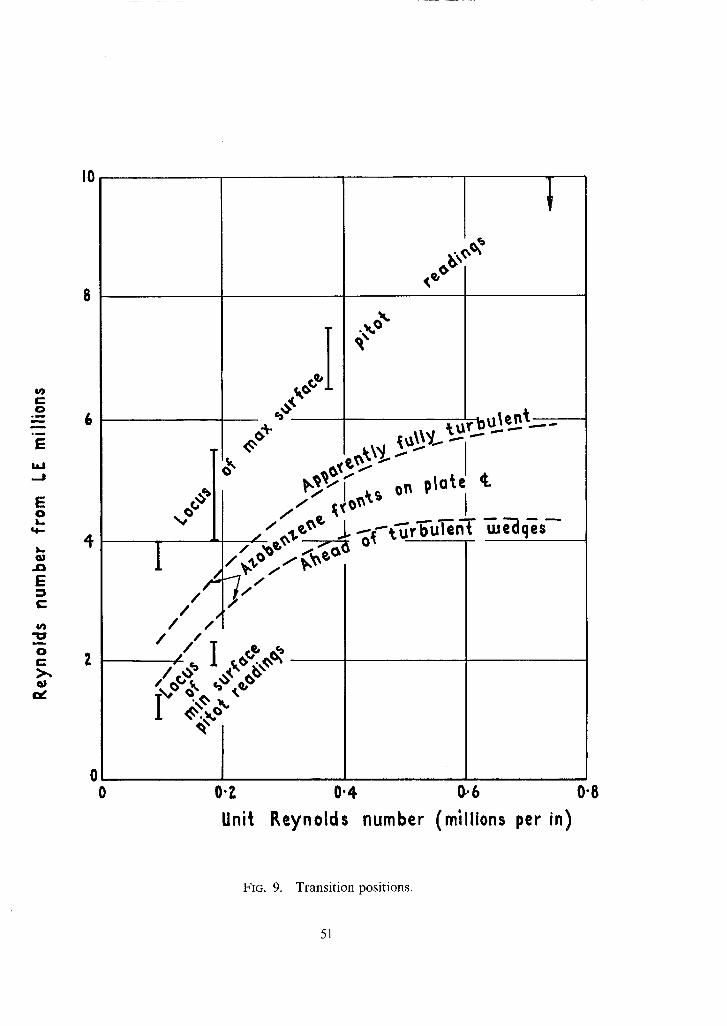
Itl C (i
i:
W
E 0 i..
i,,,. Qi
i:
Itl
i
0
Qi
I0
8
4
I
,f . . /
,. ~ _ ~ ~
.o<' / ~ . ,~ °~'~'' - _ I
I i-~D~-'~ '°~ °" /7-" I i
I i / / I [ ,~, ,,~
~W
o 0"Z 0'4 O,6 0"8
Unit Reynolds number (millions per in)
FIG. 9. Transition positions.
51
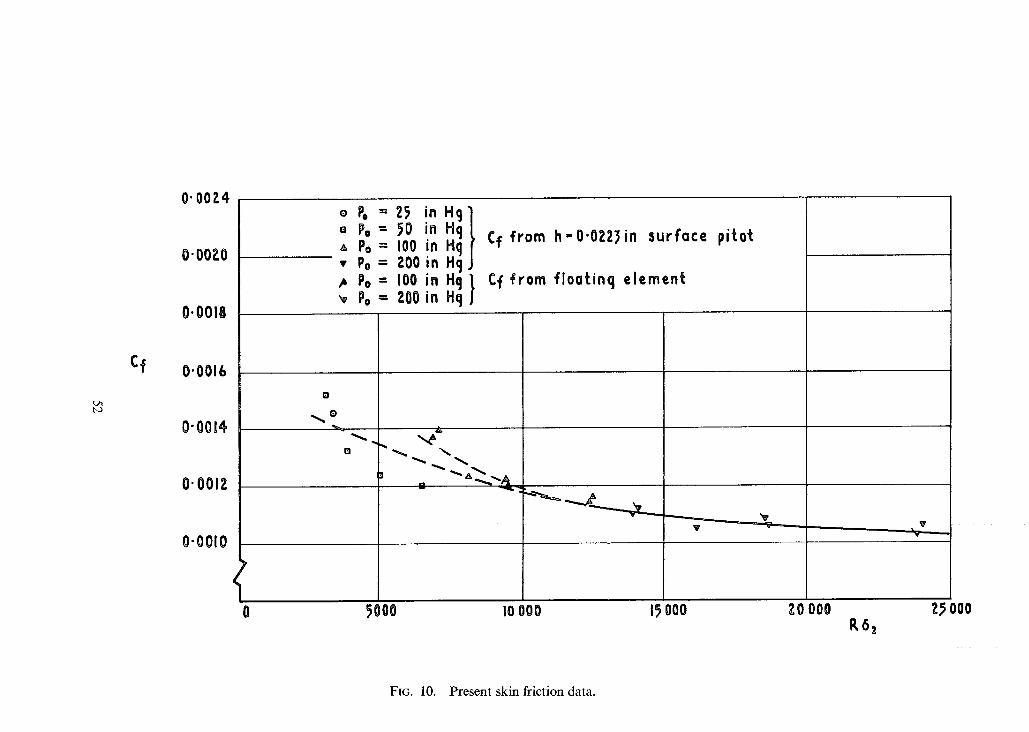
Cf
0"00?.4
O'OOZO
o.oola
0"0016
0"0014
0.0012
0-0010
1 0
O
O
o 13, = 25 in H c l ,', P° = 50 in Hi A P .= 100 in Hi Cf f rom h-0"0223in surface pi tot v p . = 200 in Hc ,~ Po = 100 in Hcj I, Cf f rom floa~inq element ~, Po ZO0 in Hq J
I0 000
V
ZO 000 ~000
,.. ",.6
15 mo
'F , -= . - . , , . . V
2~ooo P,G~
FIG. 10. Present skin friction data.
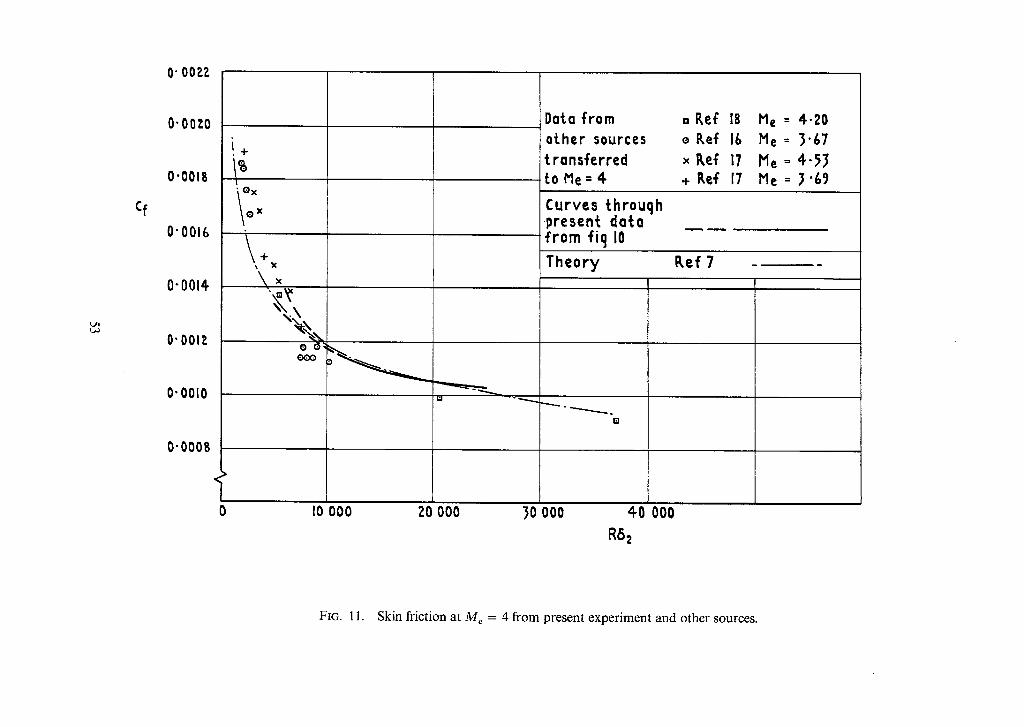
O" 00 ~.?.
Cf
O'OOlO
0"0018
0"0016
0"0014.
O" O01P.
0"0010
0"0008
i -t-
" O x
<
i
0 I0 000 ZO 000 30 000
Daf~a from other sources transTerred to Me = 4
Curves throuqh present data f rom fi 9 I0
. Kef e P, ef x i~ef + I~eT
Theory E e l 7
41
R6z
El
000
18 Me = 4-20
ib Me = 3"/,7
17 Me = 4 - ~ 3
17 Me = ~'&9
FIG. 11. Skin friction at M e -- 4 from present experiment and other sources.
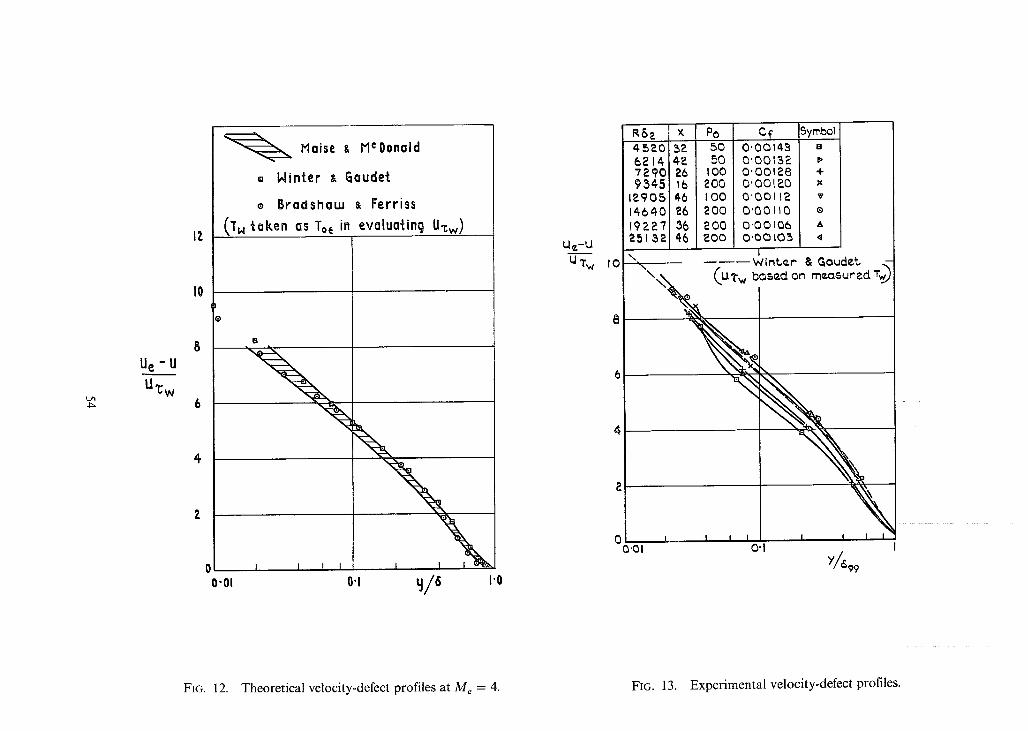
L~ 4~
U e -U
U~ w
!0
~ Maise & MCOonald
a Winter ~ Gaudet
e BradshauJ ~ Ferriss (T w taken as Toe in evaluating U~w)
"01 I I I I I
o.t ~ /6 i.o
U¢-U
U,r~ to
RS~ I x Po Cf 5yr~bo} 45~0 ~ 50 0"001¢3 e 8214 4P. 50 0"0015~ ~' 7290 26 tO0 o' 0012.8 + 9545 I0 200 O'OOi~_O x
1~905 40 I 0 0 0 '00112 v 14640 ~6 20O O'OOllO o 19Z27! 36 200 O'OOIO6 a ~ 5 ~ 46 ~00 O'OOl05 ,~
2
Q , O,Ol
\ I ------Winter & Goud~t - \x~ (u% bosaaon m~a~rad'rw)
\ ! I I
O'1 I I I I
Y,/699
FIG. 12. Theoretical velocity-defect profiles at Me = 4. FIG. 13. Experimental velocity-defect profiles.
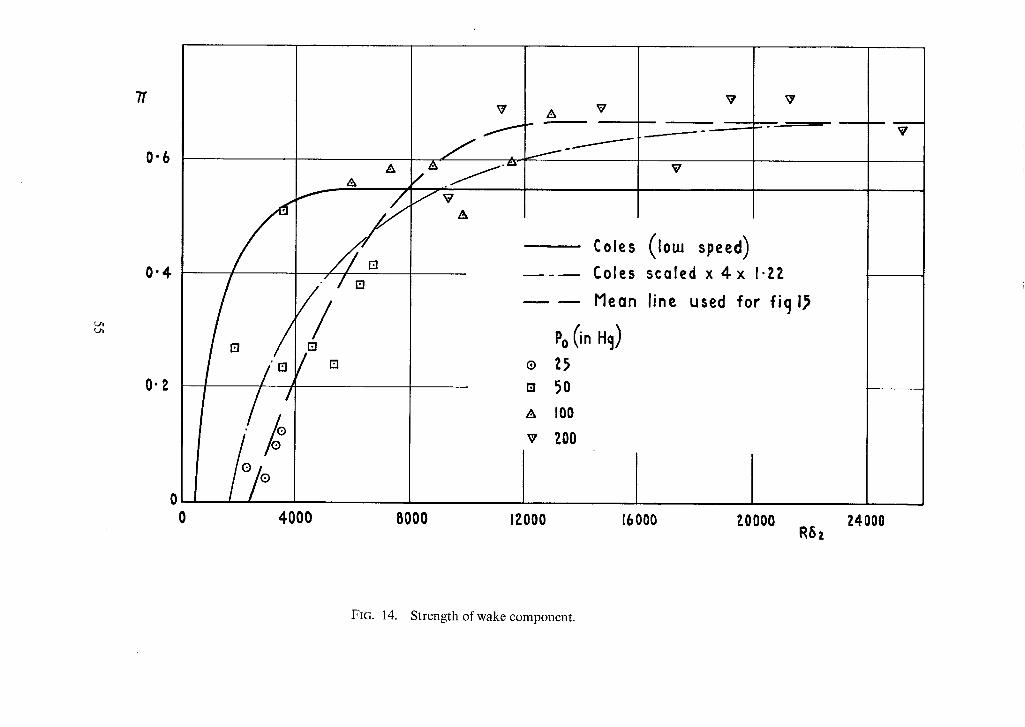
t ~ t ~
0"6
0"4
0"2
0 0
A A
f / .
[]
/ o
f
/ A ~ .A-"
A
A
/
®
El
A
V
V V
V
I I Coles (tow speed) Coles scaled x ¢ x I.ZZ
Mean line used for fi 9 I,~
Po (in H9) t5 50
100 ZOO
4000 8000 IZO00 16000 ZOO00 R6z
V
?4000
FIG. 14. Strength of wake component.
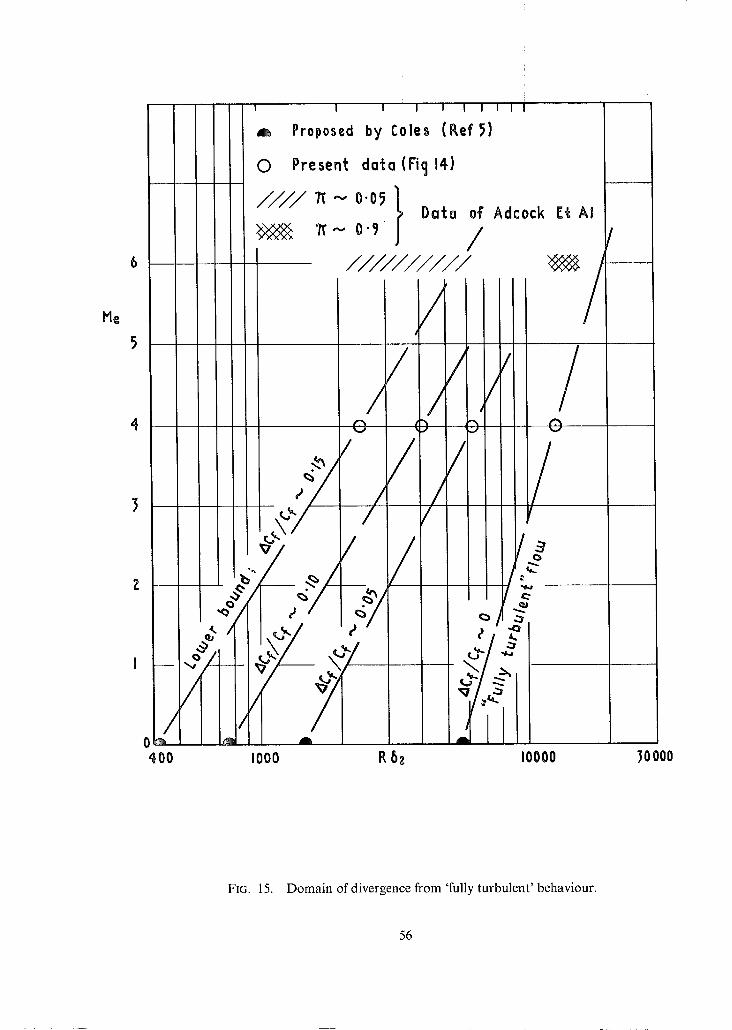
A Proposed by Cole~ (KefS)
© Present data (Fiq 14-)
/ / / / T~ .~ 0"05 I Data o~ Adcock Et AI ~- o.~ J /
I //////////
He
/
O
Qa
0 ~ 4OO 1000 R b2 10000 ~0000
FIG. 15. Domain of divergence from 'fully turbulent' behaviour.
56
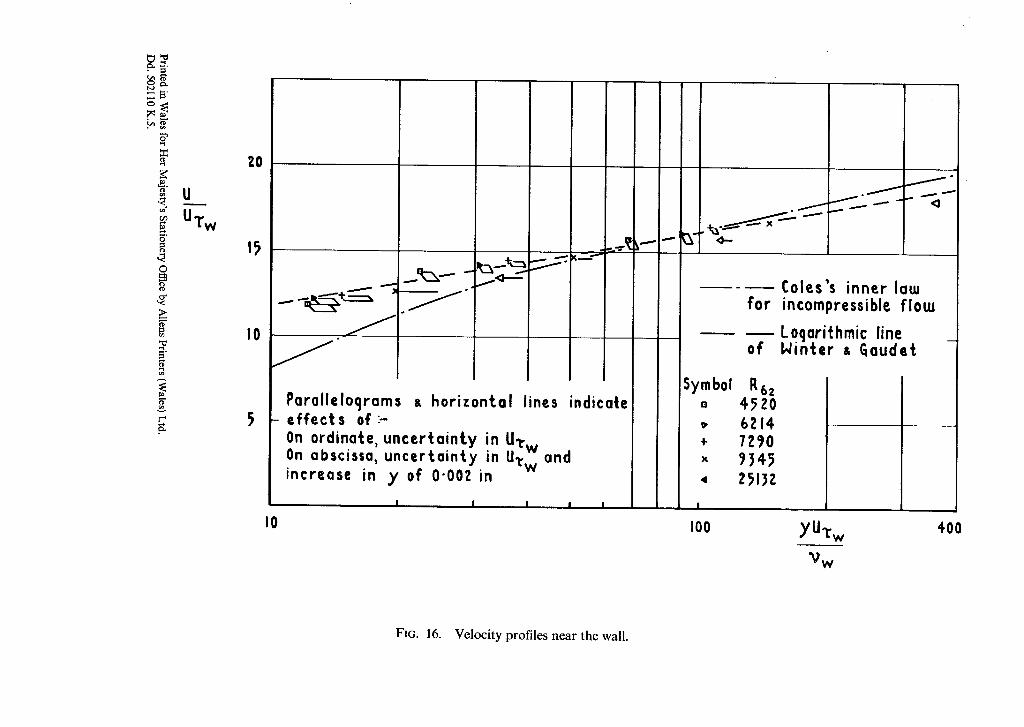
,-t
o
O
o "
>
U
UT w
20
15
I0
I0
& I I I
horizontal lines indicate Paralleloqrams - effects of:-
On ordinate, uncertainty in Uz w On abscissa, uncertainty in U~w and increase in y of O'OOZ in
I I I I I
/
Symbol Q
4-
X
4
I
IO0
Coles's inner law for incompressible flotu
Loqari~hmic line of Winter ~ ~audet
R62 4520 6 2 i 4 7290 ~345 2513z
yU.r w
"9 w
400
FIG. 16. Velocity profiles near the wall.

R. & M. No, 3678
((5 Crown copvriL, ht 1971
Published by Ih~R MAJESIY'S SIA'IIONERY ()[:t;ICI
To be purchased from 49 High Holborn, London WCIV 6HB 13a Castle Street, Edinburgh EH2 3AR
109 St Mary Street. Cardif fCFI 1JW Brazennose Street. Manchester M60 8AS
50 Fairfax Street, Bristol BS1 3DE 258 Broad Street, Birmingham BI 2HE 80 Chichester Street, Belfast BTI 4JY
or through booksellers
R. & Mo No, 3678
S B N 1 1 4 7 0 4 1 8 X