Embed Size (px)
Citation preview

199
PAPER 13
Turbo Pulp Lifter (TPLTM) - An Efficient Discharger to Improve SAG Mill Performance
Sanjeeva Latchireddi
Chief Process Engineer Outokumpu Technology Inc. Centennial Co 80112, USA
Phone +1 303 792 3110 x224 Fax +1 303 799 6892
Email: [email protected]
Key Words: SAG, Grate, Pulp lifter, pebbles, flow-back, carry-over
January 23 to 25, 2007 Ottawa, Ontario, Canada
39th Annual Meeting of the Canadian Mineral Processors

Proceedings of the 39th Annual Canadian Mineral Processors Conference – 2007
200
ABSTRACT Deteriorating ore grade and high demand of metals has tremendously influenced the unit capacity of SAG mills. Pebble circuits have been added to the existing SAG circuits to increase their unit capacity. To make the pebble circuits justifiable, the grate openings are increased almost to 4.5 inches to draw large quantity of pebbles. The inherent transportation problems associated with SAG mills in closed circuit with pebble fraction are more complicated than the single stage SAG mill operation, because the coarse pebbles behave significantly different to that of slurry in pulp lifters. In addition, operation of mills at higher speed, to take advantage of precise design of high release angled shell lifters significantly reduces the discharge efficiency of the conventional pulp dischargers. The presence of a sizable quantity of pebbles in the pulp lifter limits the space available and reduces the flow gradient through the grate thus increases the load inside the mill and hence the mill power-draw. This paper analyses all the problems associated in discharge of slurry and pebbles in SAG mills with pebble circuits. The Outokumpu patented Turbo Pulp Lifter (TPLTM) aims at eliminating the inherent material transport problems to ensure good grinding conditions. Recent installation of TPLTM in a 26-ft SAG mill has proven these claims by reducing the specific power consumption while increasing the mill capacity. INTRODUCTION The conventional wisdom is to look at the semi-autogenous grinding (SAG) mill as just another grinding mill in which ball charge, mill filling, and mill speed are varied to attain maximum throughput. Liner design for the SAG was also approached more from a wear perspective rather than a metallurgical and hydraulic-flow perspective. The extensive research work carried out by Latchireddi and Morrell (1997,2003a and 2003b) has demonstrated to think of the SAG as more of a pump in which the grates and pulp discharger end (“impeller”) were designed to efficiently discharge the product sized particles smaller than the grate size with minimal recirculation out of the mill. The rock load in the mill is essentially depends on ore characteristics and the discharge rate of broken particles. The discharge rate of the product material depends on how efficiently the discharge pump (grate and pulp lifters) is operating. Similar to the impeller design affecting the pump capacity, the pulp lifter design affects the discharge capacity (or mill throughput) of the SAG/AG grinding mills. The general arrangement of AG/SAG mills discharge system is shown in Figure 1.
BREAKAGE DISCHARGEBREAKAGEBREAKAGE DISCHARGEDISCHARGE
Figure 1: Schematic of a typical sag mill operation.
Proceedings of the 39th Annual Canadian Mineral Processors Conference – 2007
201
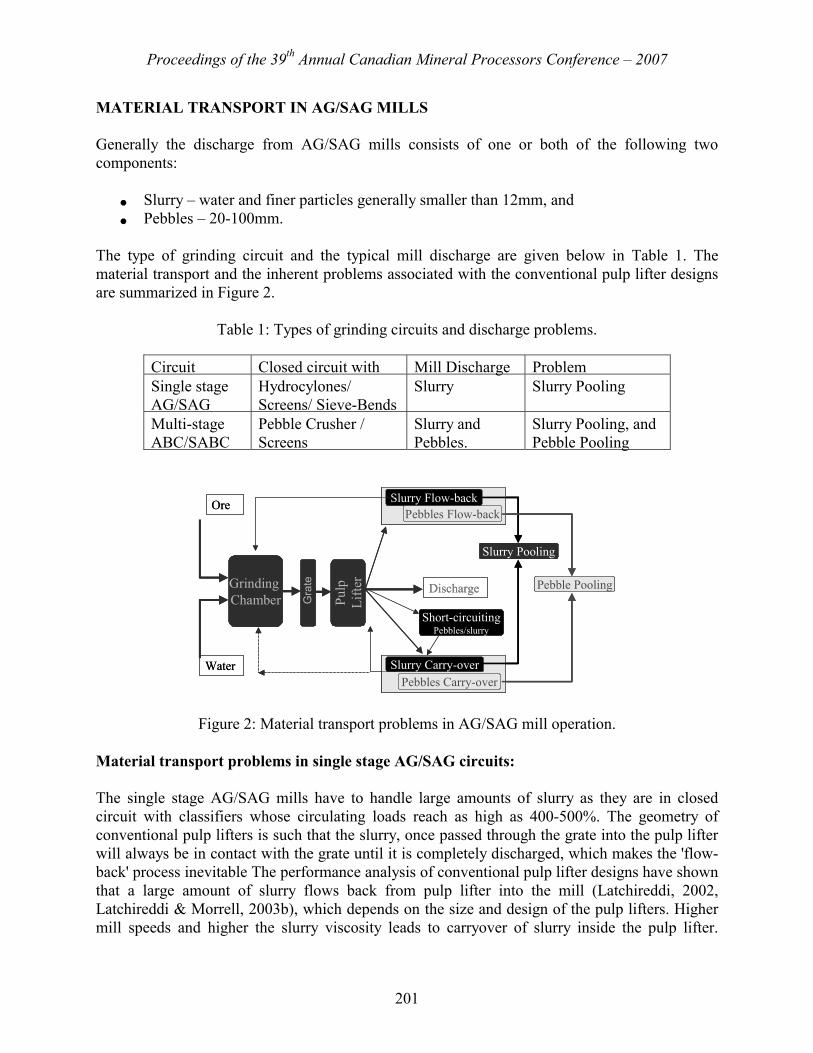
MATERIAL TRANSPORT IN AG/SAG MILLS Generally the discharge from AG/SAG mills consists of one or both of the following two components:
• Slurry – water and finer particles generally smaller than 12mm, and • Pebbles – 20-100mm.
The type of grinding circuit and the typical mill discharge are given below in Table 1. The material transport and the inherent problems associated with the conventional pulp lifter designs are summarized in Figure 2.
Table 1: Types of grinding circuits and discharge problems.
Circuit Closed circuit with Mill Discharge Problem Single stage AG/SAG
Hydrocylones/ Screens/ Sieve-Bends
Slurry Slurry Pooling
Multi-stage ABC/SABC
Pebble Crusher / Screens
Slurry and Pebbles.
Slurry Pooling, and Pebble Pooling
Grinding Chamber Pu
lpLi
fter
Water
Ore
Discharge
Slurry Flow-back
Short-circuitingPebbles/slurry
Slurry Carry-over
Slurry Pooling
Pebbles Flow-back
Pebbles Carry-over
Pebble Pooling
Gra
teGrinding Chamber Pu
lpLi
fter
Water
Ore
Discharge
Slurry Flow-back
Short-circuitingPebbles/slurry
Slurry Carry-over
Slurry Pooling
Pebbles Flow-back
Pebbles Carry-over
Pebble Pooling
Gra
te
Figure 2: Material transport problems in AG/SAG mill operation. Material transport problems in single stage AG/SAG circuits: The single stage AG/SAG mills have to handle large amounts of slurry as they are in closed circuit with classifiers whose circulating loads reach as high as 400-500%. The geometry of conventional pulp lifters is such that the slurry, once passed through the grate into the pulp lifter will always be in contact with the grate until it is completely discharged, which makes the 'flow-back' process inevitable The performance analysis of conventional pulp lifter designs have shown that a large amount of slurry flows back from pulp lifter into the mill (Latchireddi, 2002, Latchireddi & Morrell, 2003b), which depends on the size and design of the pulp lifters. Higher mill speeds and higher the slurry viscosity leads to carryover of slurry inside the pulp lifter.
Proceedings of the 39th Annual Canadian Mineral Processors Conference – 2007
202
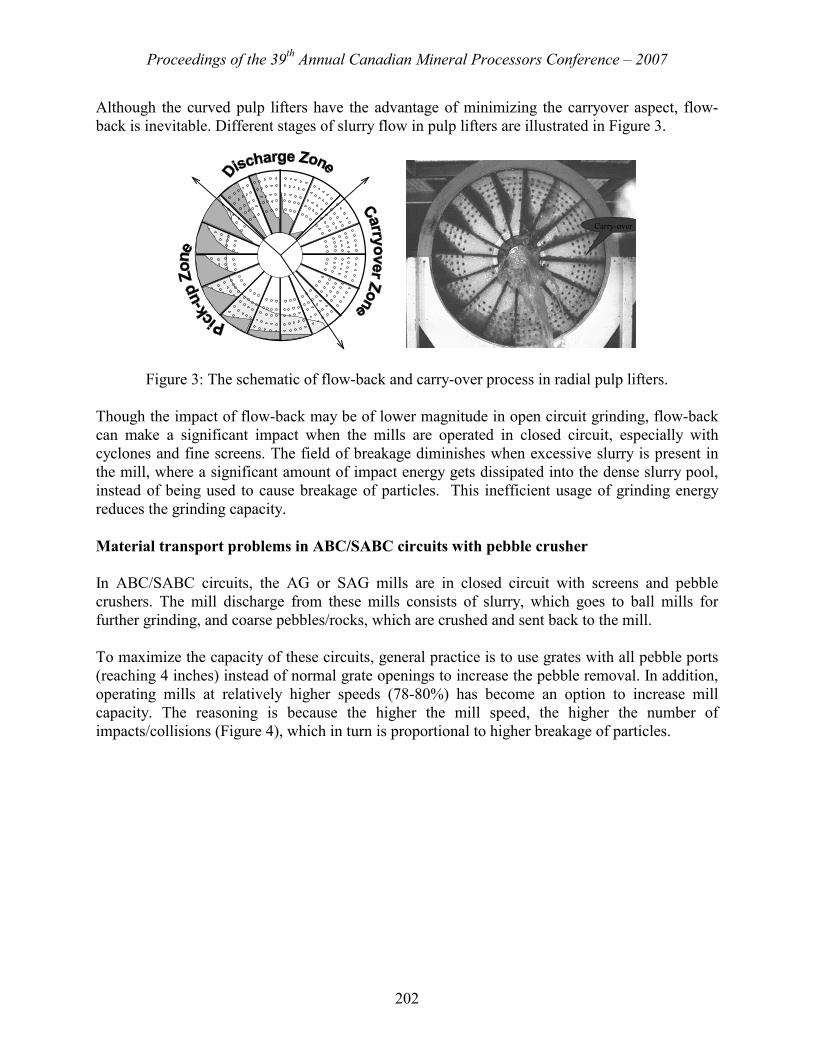
Although the curved pulp lifters have the advantage of minimizing the carryover aspect, flow-back is inevitable. Different stages of slurry flow in pulp lifters are illustrated in Figure 3.
Carry-overCarry-over
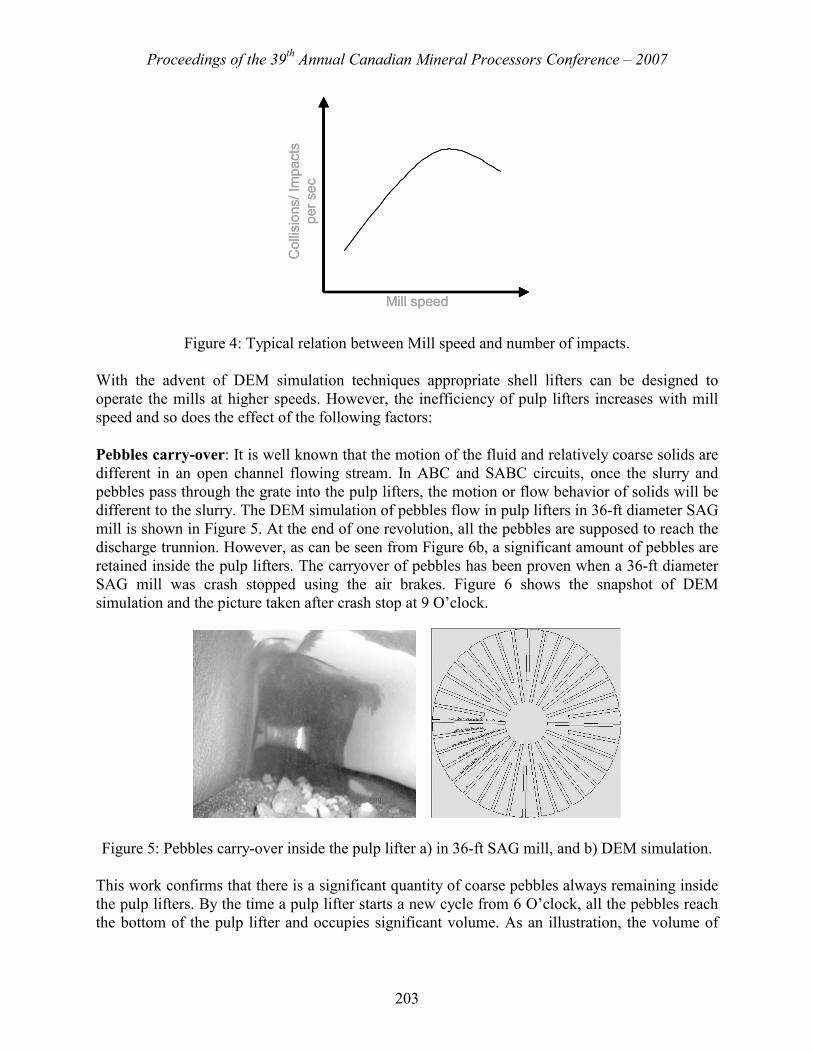
Figure 3: The schematic of flow-back and carry-over process in radial pulp lifters. Though the impact of flow-back may be of lower magnitude in open circuit grinding, flow-back can make a significant impact when the mills are operated in closed circuit, especially with cyclones and fine screens. The field of breakage diminishes when excessive slurry is present in the mill, where a significant amount of impact energy gets dissipated into the dense slurry pool, instead of being used to cause breakage of particles. This inefficient usage of grinding energy reduces the grinding capacity. Material transport problems in ABC/SABC circuits with pebble crusher In ABC/SABC circuits, the AG or SAG mills are in closed circuit with screens and pebble crushers. The mill discharge from these mills consists of slurry, which goes to ball mills for further grinding, and coarse pebbles/rocks, which are crushed and sent back to the mill. To maximize the capacity of these circuits, general practice is to use grates with all pebble ports (reaching 4 inches) instead of normal grate openings to increase the pebble removal. In addition, operating mills at relatively higher speeds (78-80%) has become an option to increase mill capacity. The reasoning is because the higher the mill speed, the higher the number of impacts/collisions (Figure 4), which in turn is proportional to higher breakage of particles.
Proceedings of the 39th Annual Canadian Mineral Processors Conference – 2007
203
Mill speedC
ollis
ions
/ Im
pact
s pe
r sec
Mill speedC
ollis
ions
/ Im
pact
s pe
r sec
Figure 4: Typical relation between Mill speed and number of impacts. With the advent of DEM simulation techniques appropriate shell lifters can be designed to operate the mills at higher speeds. However, the inefficiency of pulp lifters increases with mill speed and so does the effect of the following factors: Pebbles carry-over: It is well known that the motion of the fluid and relatively coarse solids are different in an open channel flowing stream. In ABC and SABC circuits, once the slurry and pebbles pass through the grate into the pulp lifters, the motion or flow behavior of solids will be different to the slurry. The DEM simulation of pebbles flow in pulp lifters in 36-ft diameter SAG mill is shown in Figure 5. At the end of one revolution, all the pebbles are supposed to reach the discharge trunnion. However, as can be seen from Figure 6b, a significant amount of pebbles are retained inside the pulp lifters. The carryover of pebbles has been proven when a 36-ft diameter SAG mill was crash stopped using the air brakes. Figure 6 shows the snapshot of DEM simulation and the picture taken after crash stop at 9 O’clock.
Figure 5: Pebbles carry-over inside the pulp lifter a) in 36-ft SAG mill, and b) DEM simulation. This work confirms that there is a significant quantity of coarse pebbles always remaining inside the pulp lifters. By the time a pulp lifter starts a new cycle from 6 O’clock, all the pebbles reach the bottom of the pulp lifter and occupies significant volume. As an illustration, the volume of

Proceedings of the 39th Annual Canadian Mineral Processors Conference – 2007
204
the pebbles retained was calculated in the test case and shown in Figure 6. The presence of these pebbles could block the outer rows of grate slots and reduces the flow gradient across the grate. To attain the flow gradient required, the load inside the mill raises to higher level as shown in Figure 6, drawing more power than necessary. This also leads to higher rock to ball ratio resulting in insufficient grinding energy in balls to break the rocks, thus leading to higher rock loads.
Pebble Pooling in PL
Increased Mill Load
Slurry
Pebbles
0.042 m3
Slurry
Pebbles
0.042 m3
Pebble Pooling in PL
Increased Mill Load
Pebble Pooling in PL
Increased Mill Load
Slurry
Pebbles
0.042 m3
Slurry
Pebbles
0.042 m3
Figure 6: The effect of pebbles carry-over. Pebbles Flow-back: Similar to the slurry flow-back, the pebbles flowing back into the mill increases with increasing pebble port or grate slot size. As the pebbles flow down, they slide across the grate slots where they get equal chance to go back into the mill. Similar to slurry pool formation, pebbles flow-back would increase the quantity of critical size material in the mill. The amount of pebbles passing through the grate increases with angle of grate. A DEM simulation of this scenario for a 36-ft diameter SAG mill is shown in Figure 7.
GrateGrate
Figure 7: DEM simulation of pebbles flow-back through grate slots.

Proceedings of the 39th Annual Canadian Mineral Processors Conference – 2007
205
It is imperative from the above facts that efficient removal of both slurry and coarse pebbles (critical size) is an important issue to ensure the efficient operation of ABC/SABC circuits. The effects of slurry pooling and pebble pooling are summarized in Figure 8.
Increased rock:ball ratio
Increased charge loading
Inefficient grinding
Reduced flow gradientSlurry Pooling, andPebble pooling
Increased rock:ball ratio
Increased charge loading
Inefficient grinding
Reduced flow gradientSlurry Pooling, andPebble pooling
Figure 8: Effect of slurry pooling and pebble pooling. Elimination of the above mentioned material transport problems will allow the mill to respond truly in terms of power draw for the changes in mill load which depends on feed ore characteristics. TURBO PULP LIFTER (TPLTM) Outokumpu’s patented new design – TPLTM (patent pending), is a culmination of the above facts. From the point of retrofitting, TPLTM appears exactly like the conventional radial pulp lifter. Elimination of material problems using TPLTM will bring the following process benefits:
• Allows mill to operate at maximum capacity. • Ensures good grinding conditions with lower grinding energy per ton. • Efficient operation even at higher mill speeds. • Operator friendly smooth mill operation. • Significantly improves wear life.
TPLTM can be precisely designed to handle the maximum capacity. TPLTM can be easily retro-fitted to the existing mills as demonstrated in Cortez Gold Mines. Performance of 26ft SAG mill with TPLTM The world’s first installation of TPL™ was done in a 26ft diameter by 12.5ft EGL SAG mill at Cortez Gold Mines – a Barrick/Kennecott plant in Nevada, USA. The SAG mill is 26’ diameter x
Proceedings of the 39th Annual Canadian Mineral Processors Conference – 2007
206
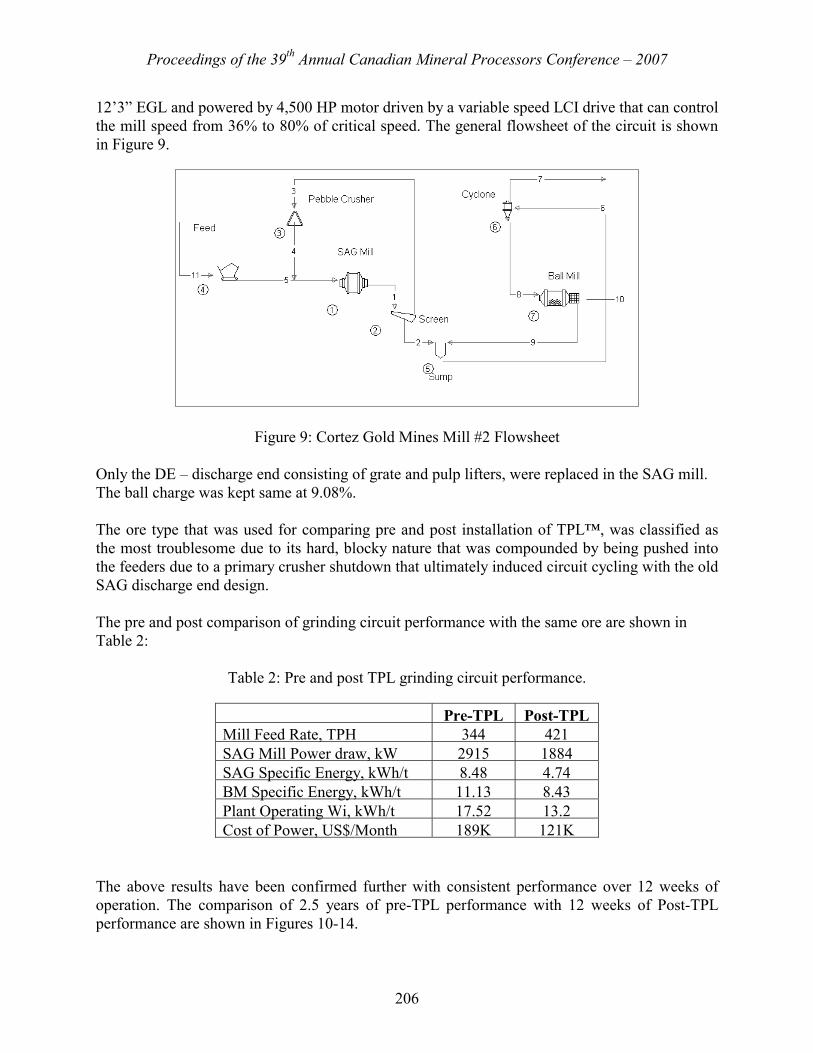
12’3” EGL and powered by 4,500 HP motor driven by a variable speed LCI drive that can control the mill speed from 36% to 80% of critical speed. The general flowsheet of the circuit is shown in Figure 9.
Figure 9: Cortez Gold Mines Mill #2 Flowsheet
Only the DE – discharge end consisting of grate and pulp lifters, were replaced in the SAG mill. The ball charge was kept same at 9.08%. The ore type that was used for comparing pre and post installation of TPL™, was classified as the most troublesome due to its hard, blocky nature that was compounded by being pushed into the feeders due to a primary crusher shutdown that ultimately induced circuit cycling with the old SAG discharge end design. The pre and post comparison of grinding circuit performance with the same ore are shown in Table 2:
Table 2: Pre and post TPL grinding circuit performance.
Pre-TPL Post-TPL Mill Feed Rate, TPH 344 421 SAG Mill Power draw, kW 2915 1884 SAG Specific Energy, kWh/t 8.48 4.74 BM Specific Energy, kWh/t 11.13 8.43 Plant Operating Wi, kWh/t 17.52 13.2 Cost of Power, US$/Month 189K 121K
The above results have been confirmed further with consistent performance over 12 weeks of operation. The comparison of 2.5 years of pre-TPL performance with 12 weeks of Post-TPL performance are shown in Figures 10-14.

Proceedings of the 39th Annual Canadian Mineral Processors Conference – 2007
207
Daily comments received from the operators were typical of, “we could never run steady and with confidence like this before with the old design for fear of the SAG mill getting quickly out of control” (Steiger, J., et al 2007).
SAG Power
0
500
1000
1500
2000
2500
3000
3500
J 04F 04
M 04A 04M 04 J 04J 0
4A 04S 04O 04N 04D 04 J 0
5F 05M 05
A 05M 05J 05J 0
5A 05S 05O 05N 05D 05 J 0
6F 06M 06A 06
M 06J 06
Pre_TPL
Post_T
PL W 1
W 2
W 3
W 4
W 5
W 6
W 7
W 8
W 9W
10W
11W
12
Months / Weeks of operation
SAG
Pow
er, k
Wh 2580
2080Jan 2004 - June 2006
Post_TPL Operation (12 weeks)
Figure 10: SAG mill power draw operating trend.
SAG S.E.
0
2
4
6
8
10
12
J 04F 04M 04A 04M 04 J 0
4J 0
4A 04S 04O 04N 04D 04 J 0
5F 05M 05A 05M 05 J 0
5J 0
5A 05S 05O 05N 05D 05 J 0
6F 06M 06A 06M 06 J 0
6
Pre_TPL
Post_T
PL W 1
W 2
W 3
W 4
W 5
W 6
W 7
W 8
W 9
W 10W 11W 12
Month / Week of operation
SAG
SE,
kW
h/t
6.3
4.2
Jan 2004 - June 2006
Post_TPL Operation (12 weeks)
Figure 11: SAG mill specific energy (kWh/t) trend.
Proceedings of the 39th Annual Canadian Mineral Processors Conference – 2007
208
SAG S.E.
0
2
4
6
8
10
12
J 04F 04M 04A 04M 04 J 0
4J 0
4A 04S 04O 04N 04D 04 J 0
5F 05M 05A 05M 05 J 0
5J 0
5A 05S 05O 05N 05D 05 J 0
6F 06M 06A 06M 06
J 06
Pre_TPL
Post_T
PL W 1
W 2
W 3
W 4
W 5
W 6
W 7
W 8
W 9
W 10
W 11
W 12
Month / Week of operation
SAG
SE,
kW
h/t
6.3
4.2
Jan 2004 - June 2006
Post_TPL Operation (12 weeks)
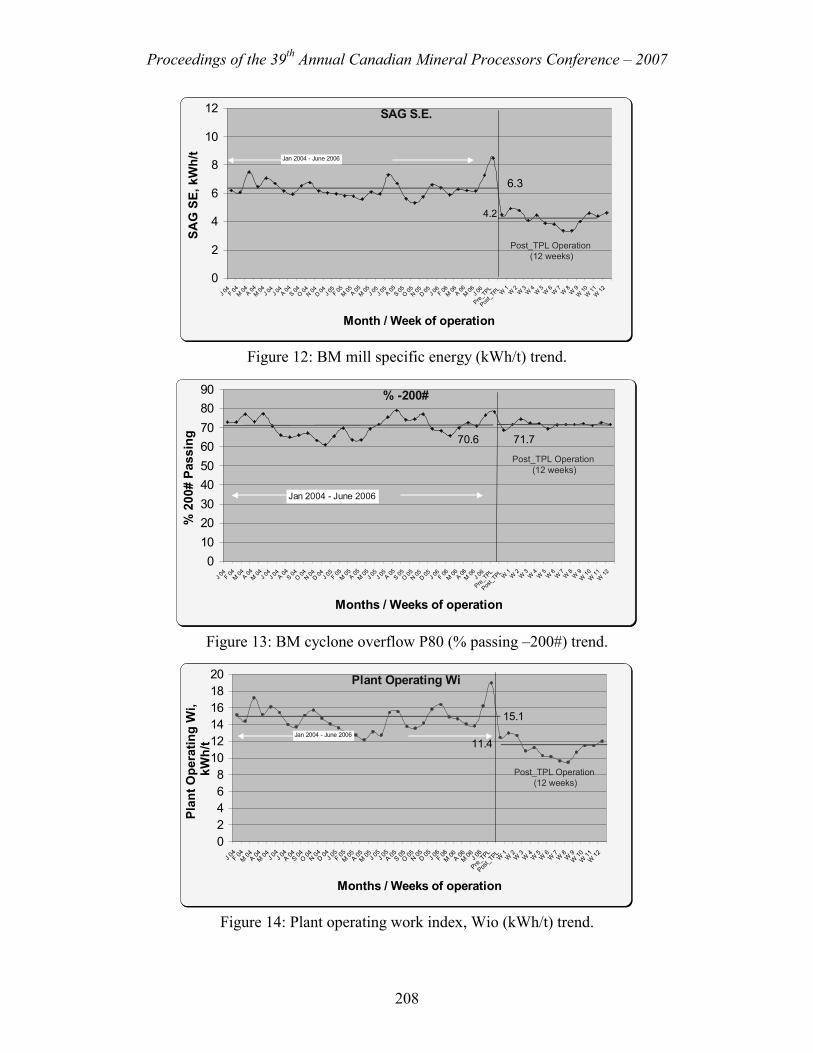
Figure 12: BM mill specific energy (kWh/t) trend.
% -200#
0102030405060708090
J 04F 04M 04A 04M 04 J 0
4J 0
4A 04S 04O 04N 04D 04 J 0
5F 0
5M 05A 05M 05J 0
5J 0
5A 05S 05O 05N 05D 05 J 0
6F 06M 06A 06M 06 J 0
6
Pre_TPL
Post_T
PL W 1
W 2
W 3
W 4
W 5
W 6
W 7
W 8
W 9W 10W 11W 12
Months / Weeks of operation
% 2
00#
Pass
ing 70.6 71.7
Jan 2004 - June 2006
Post_TPL Operation (12 weeks)
Figure 13: BM cyclone overflow P80 (% passing –200#) trend.
Plant Operating Wi
02468
101214161820
J 04F 04
M 04A 04M 04 J 04J 0
4A 04S 04O 04N 04D 04J 0
5F 05
M 05A 05M 05J 05J 0
5A 05S 05O 05N 05D 05J 0
6F 0
6M 06A 06M 06J 0
6
Pre_TPL
Post_T
PLW
1W
2W
3W
4W
5W
6W
7W
8W
9W
10W
11W
12
Months / Weeks of operation
Plan
t Ope
ratin
g W
i, kW
h/t
15.1
11.4Jan 2004 - June 2006
Post_TPL Operation (12 weeks)
Figure 14: Plant operating work index, Wio (kWh/t) trend.

Proceedings of the 39th Annual Canadian Mineral Processors Conference – 2007
209
CONCLUSIONS Outokumpu’s patented Turbo Pulp Lifter (TPLTM) design eliminates all the material transport problems associated with the conventional radial and curved designs and achieves the following:
• TPLTM significantly increases the energy efficiency of AG/SAG mill. • TPLTM allows the mill to operate at its maximum possible capacity. • TPLTM allows steady and smooth operation.
The consistent and significantly improved performance of SAG mill with TPLTM proves that application of TPLTM will significantly benefit all AG/SAG mills. Flow-MODTM – an efficient design tool with appropriate mathematical models can be effectively used to precisely design TPLTM to handle the maximum capacity. As proven at Cortez Gold Mines, TPLTM can be easily retro-fitted to existing mills. In summation, the TPLTM design can improve the overall grinding performance of AG/SAG mills with predictable performance gains. ACKNOWLEDGEMENTS The author would like to acknowledge the trust, input, cooperation, and support of all mill operations, maintenance, and management employees at Cortez Gold Mines. REFERCENCES Latchireddi, S R and Morrell, S, 1997. A new design of pulp lifter for grate discharge mills. Sixth Mill Operators Conference, , Madang, PNG, October : 57-61 Latchireddi, S R.,2002. Modeling the performance of grates and pulp lifters in autogenous and semiautogenous mills, Ph.D. Thesis, University of Queensland, Australia. Latchireddi, S R and Morrell, S, 2003a. Slurry flow in mills: Grate-only discharge mechanism part-1, Minerals Engineering, 16(7), 625-633. Latchireddi, S R and Morrell, S, 2003b. Slurry flow in Mills: Grate-Pulp lifter discharge mechanism part-2, Minerals Engineering, 16(7), 635-642. Latchireddi, S., (2005) Apparatus for discharging a material from a mill, Patent pending, Outokumpu OY.

Proceedings of the 39th Annual Canadian Mineral Processors Conference – 2007
210
Steiger, J., Plummer, D., Latchireddi, S. and Rajamani, R.K., SAG Mill Operation at Cortez: Evolution of Liner Design from Current to Future Operations. Accepted for presentation at CMP 2007, Ottawa, Canada.