Embed Size (px)
Citation preview
Report n. 24
TUNNEL “UMBERTO I”, IN ROME Monitoring program results Gian Luca Guerrini, Enrico Peccati Bergamo, 22 April 2008
Direzione Laboratori Laboratorio Materiali, Tecnologie
e Additivi
Page 2 of 50
COPYRIGHT Copyright in this document is reserved to CTG, Italcementi S.p.A. and Calci Idrate Marcellina (C.I.M.) S.p.A. CTG and Italcementi S.p.A. are part of Italcementi Group. This document is supplied as a technical support to everyone interested in the technology of photocatalytic cement-base materials and their applications. Any person is hereby authorized to view, copy, print, and distribute this document subject to the following conditions: 1) the document may only be used as a source of technical information. 2) all results and any information from this report can be used only with an appropriate citation of the source and its owners.
Page 3 of 50
Summary This report deals with the results of an environmental monitoring campaign entailing the analysis of NOx levels registered before and after the renovation work of the tunnel “Umberto I” in Rome, Italy. The renovation of the tunnel (350 m long), was completed in late August 2007. Environmental monitoring was accomplished through two campaigns (lasting two weeks each), in July 2007 (before the renovation) and September-October 2007 (after the renovation). Results of monitoring campaigns highlighted efficient abatement of pollutants by the photocatalytic treatment of the tunnel vault, as evidenced by the lower concentrations fount after the renovation, even considering higher pollution level in Rome, in autumn 2007. A NOx reduction of about 20% was calculated in the centre of the tunnel (as an absolute comparison between the two periods) and a NOx reduction of over 50%, considering the reference data registered in the official stations of the city of Rome (Official Environmental Agency – ARPA). The duration of the monitoring campaigns performed seems to be considered significant from the statistical point of view, unlike all previous experiments which were carried out on the photocatalytic materials. This work is the result of a sponsoring action by Italcementi and C.I.M. (Calci Idrate Marcellina), accepted by the Municipality of Rome, for the re-qualification of the most significant (and Historical) tunnel in the city. It represents the first example of en “environmentally friendly” private initiative, for the improvement of quality life, in an Italian city.

Page 4 of 50
INTRODUCTION Photocatalysis has been applied for over a decade to various materials - among which cementitious binders - to obtain a “self cleaning” and, more recently, “depolluting” effects. In particular, on-going research shows that cement-based materials containing TiO2 have a good potential in urban pollution control. Examples of pollutants which can be eliminated by the photocatalytic cementitious products are NOx, SOx, NH3, CO, volatile organic carbons (VOCs) such as benzene and toluene, organic chlorides, aldehydes, and polycondensated aromatics. This technique is particularly effective when wide surfaces (horizontal or vertical) are applied. In this sense, the construction of pavements for busy streets, roads, parking lots, intersections, gas stations and toll gates seems to be the best solution in order to optimize the photocatalytic depollution. Significant experiences have been recently carried out in Japan, Italy, France, Belgium and the Netherlands (concrete roads and pavements built by means of paving blocks, mainly). At this point, several possible solutions can be adopted, for a wider use of this environmentally friendly technology which can make in a significant contribution to a healthier life. Indeed, several cementitious materials and related products are by now widely validated in laboratory. However, the crucial point still seems to be the demonstration of their photocatalytic properties in real conditions. For this reason, some pilot projects, including a monitoring programme for demonstrating the degree of depolluting action (referred to NOx) by means of photocatalytic cement-based materials, have already been carried out. Due to the high investments for equipment or costs related to the monitoring program management, this activity is still limited to relevant projects or to short duration of measurement, which sometimes means limited quantities of data for an acceptable statistical evaluation. Furthermore, the variation of local weather conditions must be also considered, so that the complexity of the approach results to be higher. Two pioneering experiences were carried out in Italy, and relevant NOx abatement levels were registered in Segrate (a concrete road) and in Calusco (paving blocks). Another relevant experience has been performed in Bergamo (via Borgo Palazzo, renovation of a main road using paving blocks). In this case, a broader monitoring approach was adopted in order to collect high quantities of data, both before and after the renovation work. This report describes the first example of a monitoring approach adopted for an indoor application of photocatalytic product in a tunnel.
Page 5 of 50
Indeed, in this case pollution and weather conditions are less variable than in any outdoor, so that it is possible to evaluate the photocatalytic depolluting action with a reduced number of parameters and the interpretation of collected data results to be less complex. Furthermore, for this special project, the level of lighting can be considered constant, due to the complete substitution of the lighting system – by means of dedicated lamps, having a high amount of UV-A light, as well as the tunnel geometry, of course. For the above mentioned reasons, the most relevant parameters considered in our evaluation will be: - Level of pollution (strictly connected to the traffic pollution); - Wind speed. This report deals with the results of an environmental monitoring campaign entailing the analysis of NOx levels registered before and after the renovation work of the tunnel “Umberto I” in Rome, Italy. Before presenting the results, a description of the tunnel and the renovation works will be given. DESCRIPTION OF THE TUNNEL The tunnel is located in the centre of Rome (Figure 1) and represents the most famous tunnel in the Capital, very relevant from the road system of the whole city centre. It is situated under the Quirinale Hill, near the Italian Republic President’s Building (Quirinale). The tunnel was built for these (main) reasons: - To facilitate the road circulation in the centre of Rome; - To build a direct connection between Via Nazionale and Piazza di Spagna/Via
del Tritone, Figures 2 and 3; - To improve the circulation between the Esquilino district and the Flaminio
district; - To make the circulation more efficient between the Central Railway Station
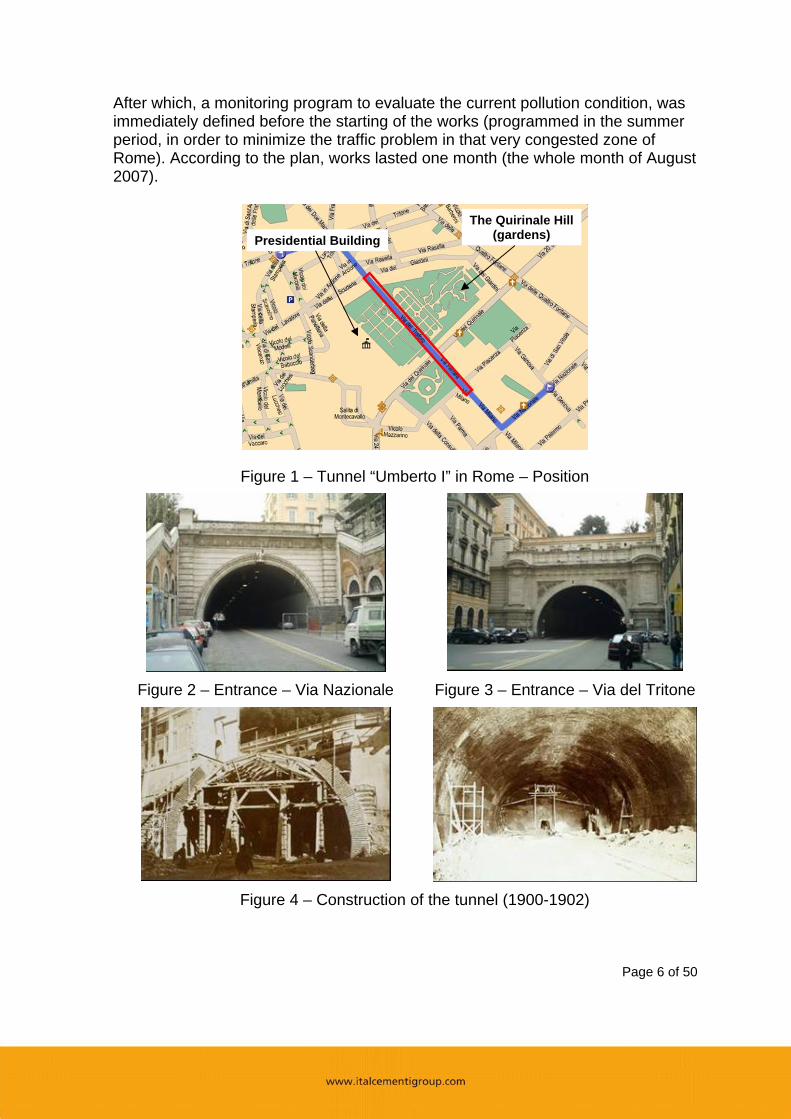
(Termini Station) and the historical centre of Rome. Its construction started in June 1900 (Figure 4) and the official opening was October 20, 1902. Its dimensions are: length 347.70 m, width: 17 m, height: 8.5 m. Its renovation was absolutely necessary, due to the need of substituting the lighting system (lamps) and the electrical lines (according to the current regulations and safety rules), and to the dirtiness of the vaults, coated by an oily thickness of smog, Figure 5. An official decision concerning the tunnel renovation was taken in May 2007.
Page 6 of 50
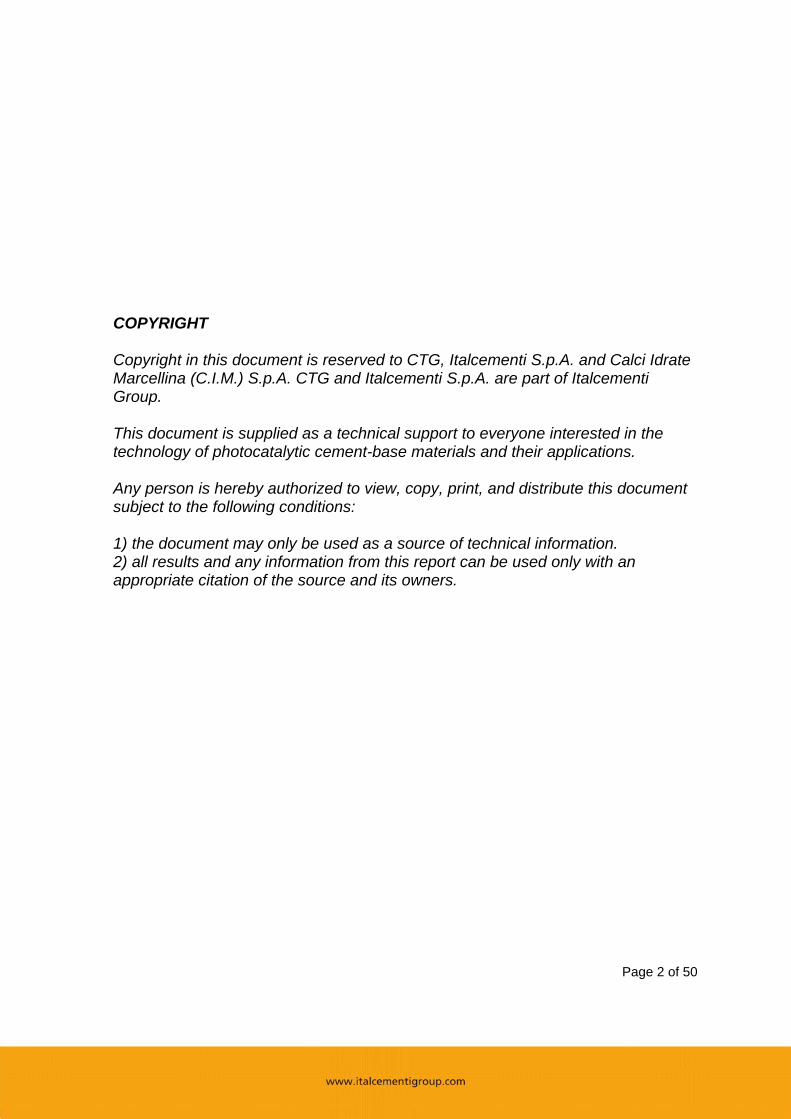
After which, a monitoring program to evaluate the current pollution condition, was immediately defined before the starting of the works (programmed in the summer period, in order to minimize the traffic problem in that very congested zone of Rome). According to the plan, works lasted one month (the whole month of August 2007).
Figure 1 – Tunnel “Umberto I” in Rome – Position
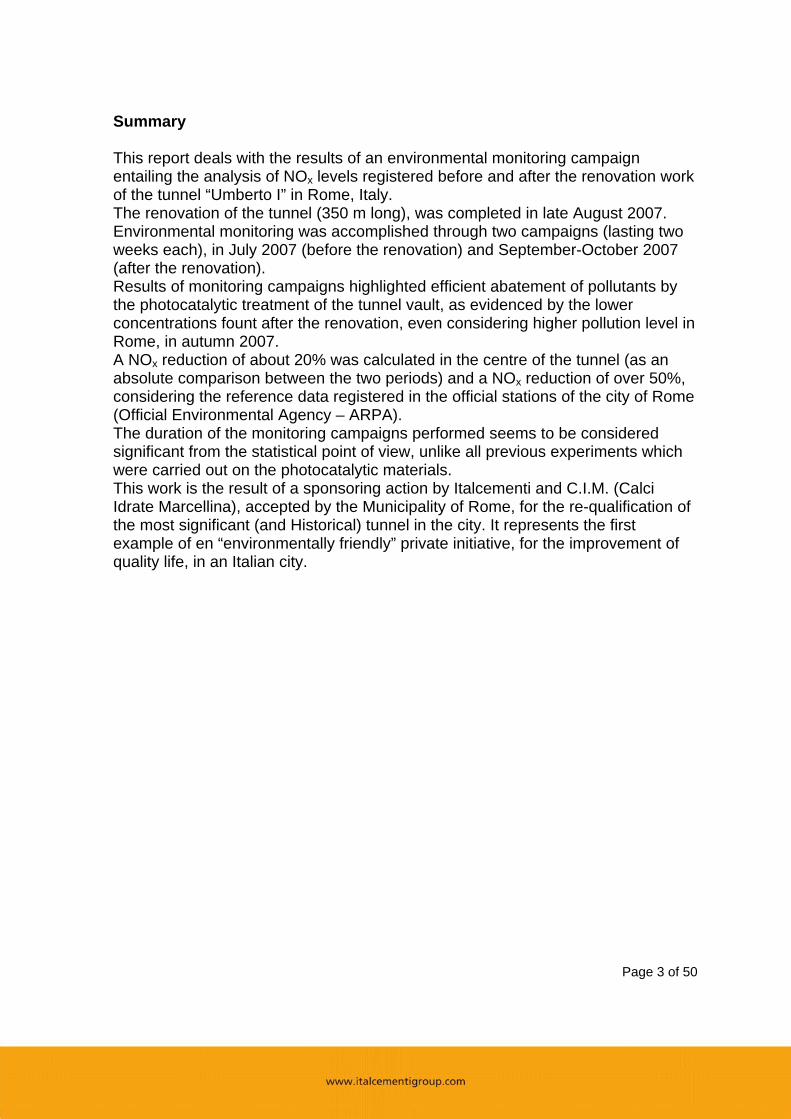
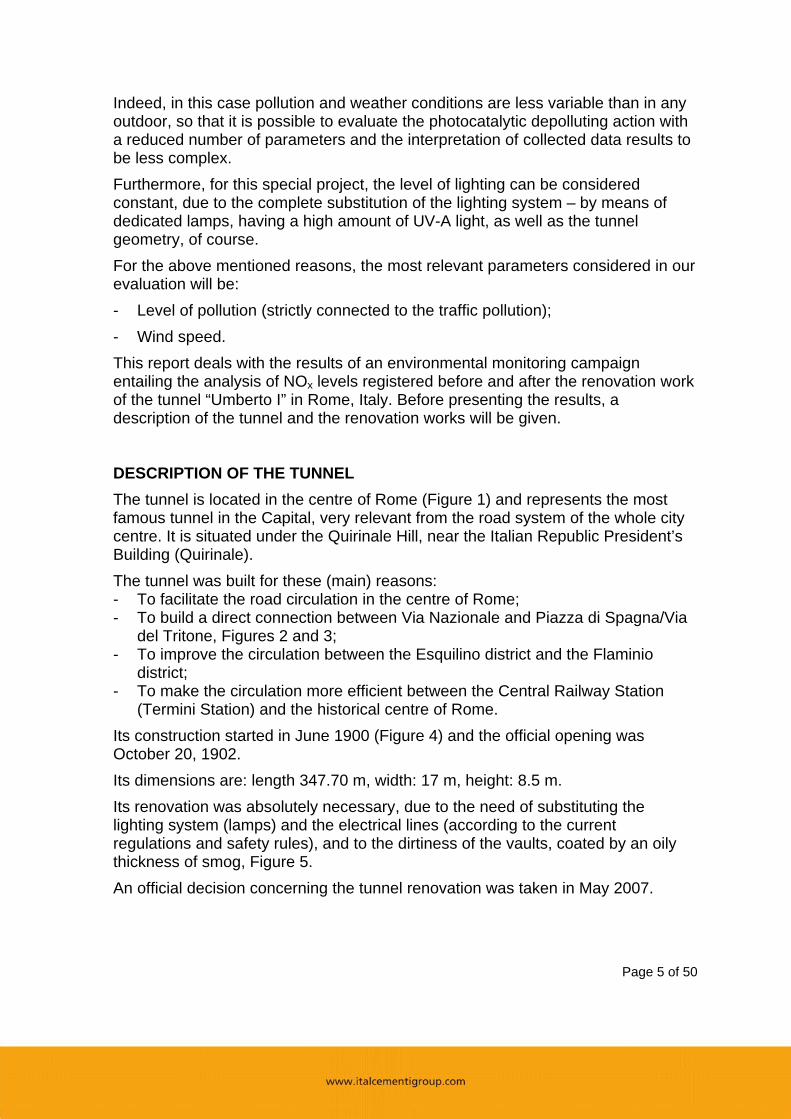
Figure 2 – Entrance – Via Nazionale Figure 3 – Entrance – Via del Tritone
Figure 4 – Construction of the tunnel (1900-1902)
The Quirinale Hill (gardens) Presidential Building
Page 7 of 50
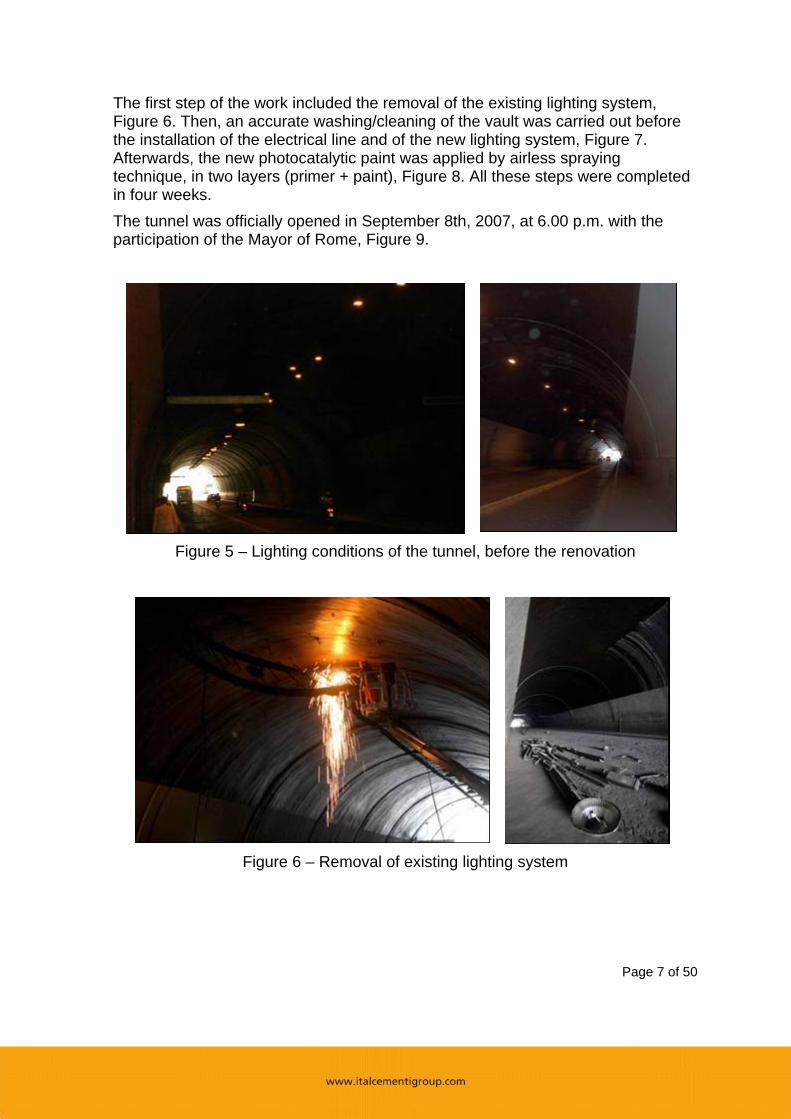
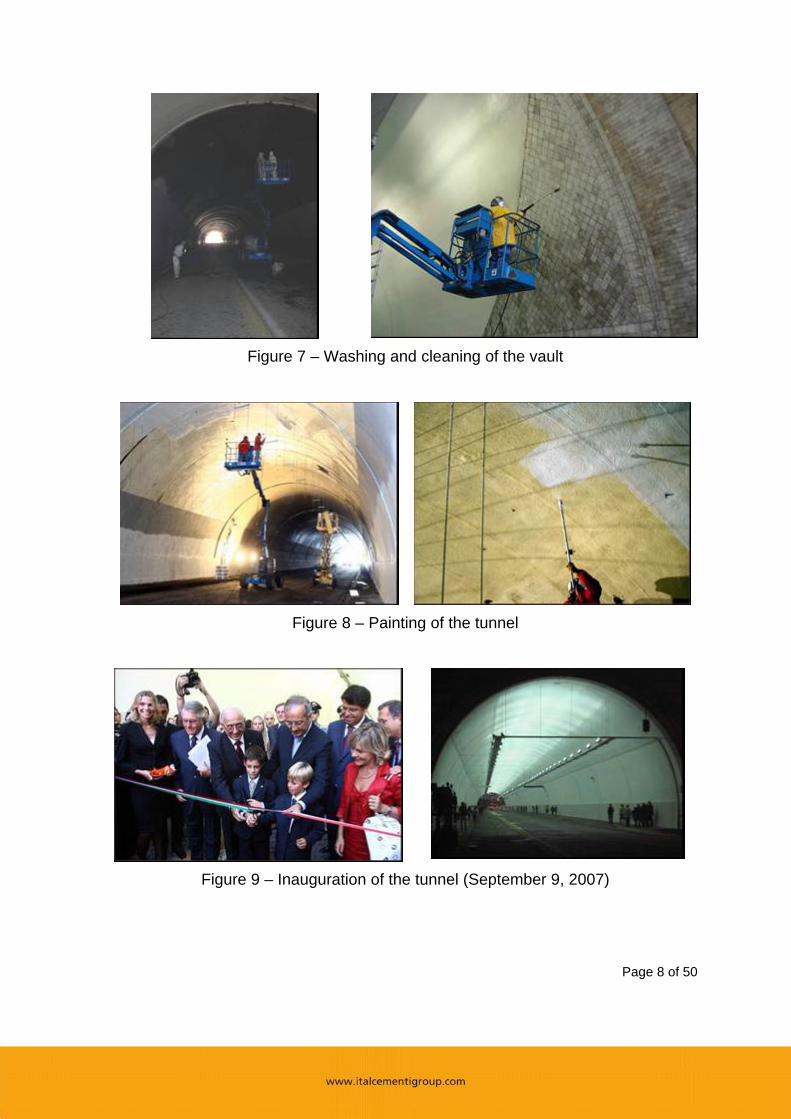
The first step of the work included the removal of the existing lighting system, Figure 6. Then, an accurate washing/cleaning of the vault was carried out before the installation of the electrical line and of the new lighting system, Figure 7. Afterwards, the new photocatalytic paint was applied by airless spraying technique, in two layers (primer + paint), Figure 8. All these steps were completed in four weeks. The tunnel was officially opened in September 8th, 2007, at 6.00 p.m. with the participation of the Mayor of Rome, Figure 9.
Figure 5 – Lighting conditions of the tunnel, before the renovation
Figure 6 – Removal of existing lighting system
Page 8 of 50
Figure 7 – Washing and cleaning of the vault
Figure 8 – Painting of the tunnel
Figure 9 – Inauguration of the tunnel (September 9, 2007)
Page 9 of 50
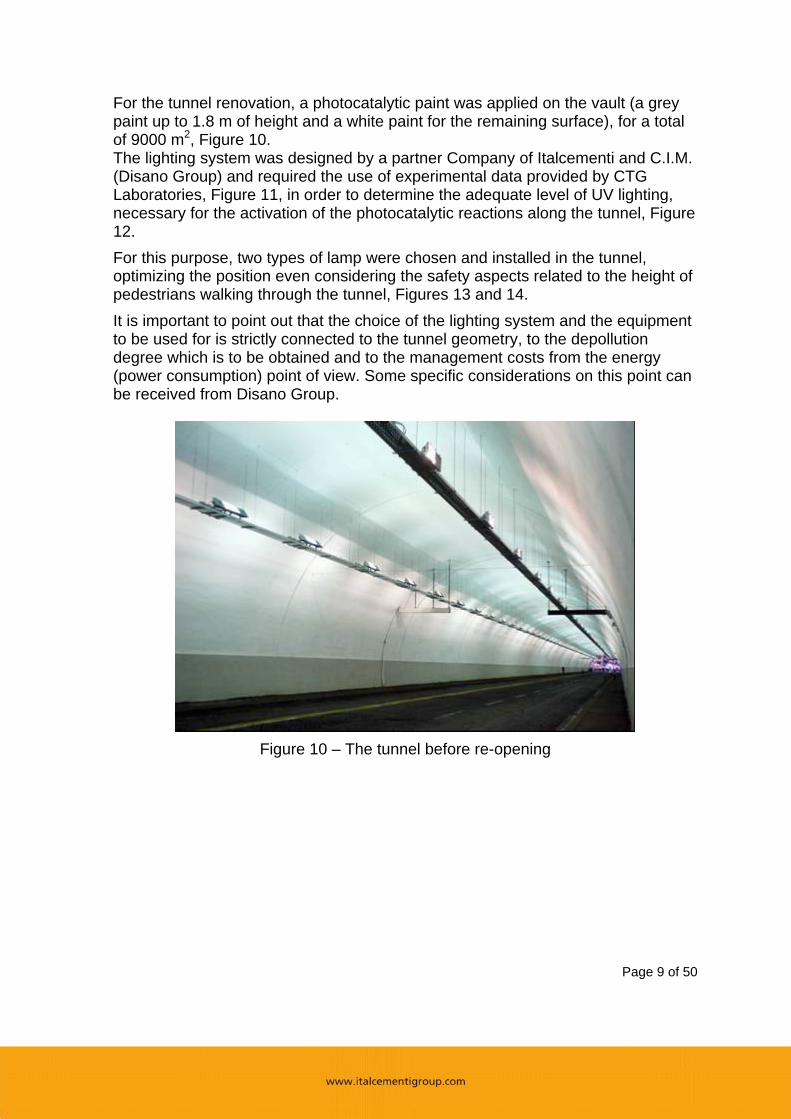
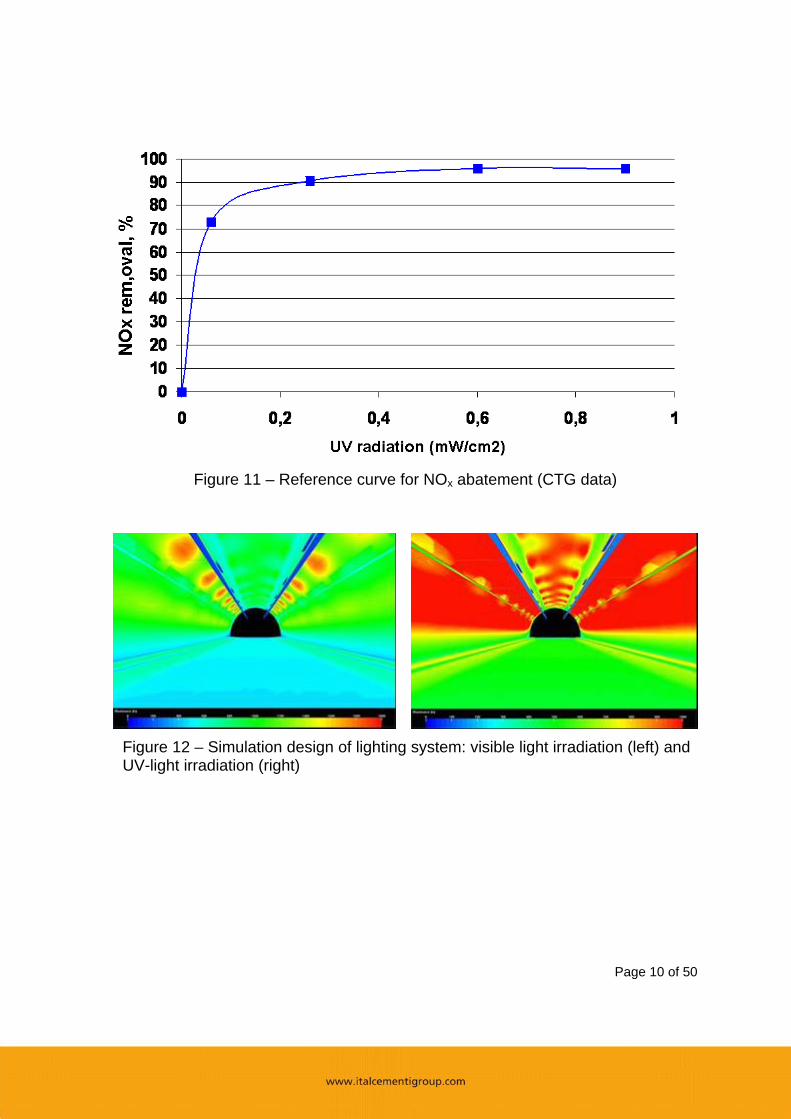
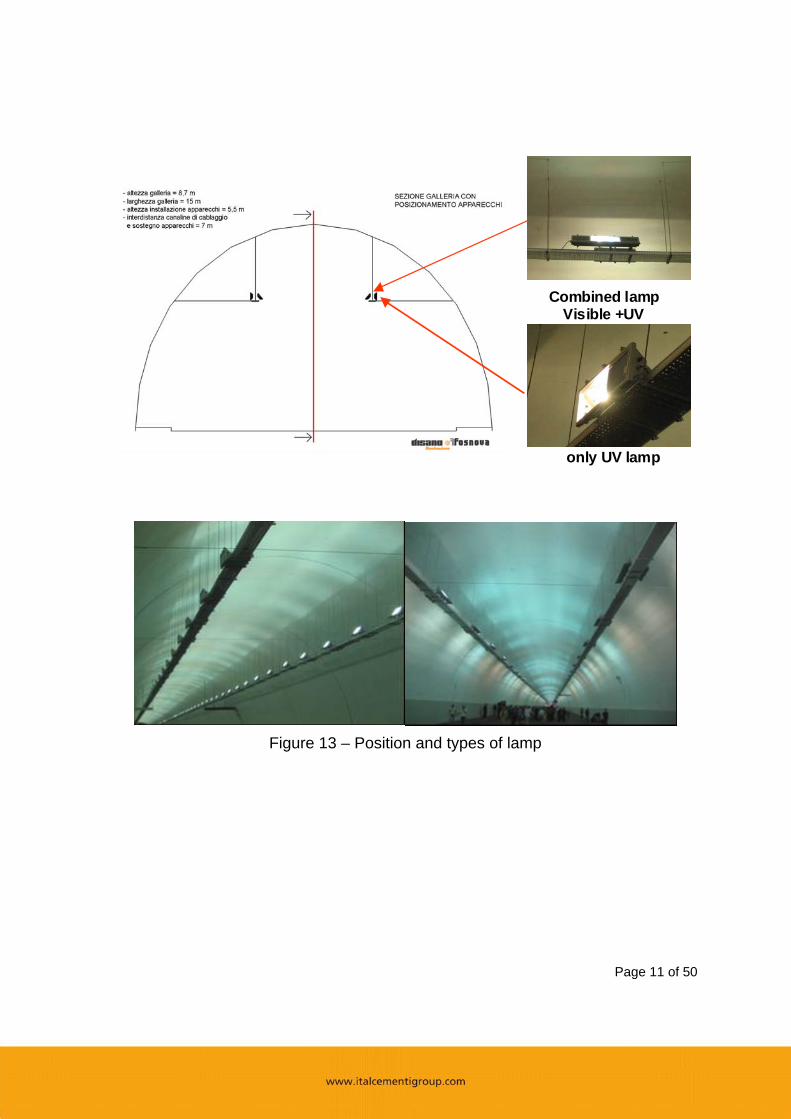
For the tunnel renovation, a photocatalytic paint was applied on the vault (a grey paint up to 1.8 m of height and a white paint for the remaining surface), for a total of 9000 m2, Figure 10. The lighting system was designed by a partner Company of Italcementi and C.I.M. (Disano Group) and required the use of experimental data provided by CTG Laboratories, Figure 11, in order to determine the adequate level of UV lighting, necessary for the activation of the photocatalytic reactions along the tunnel, Figure 12. For this purpose, two types of lamp were chosen and installed in the tunnel, optimizing the position even considering the safety aspects related to the height of pedestrians walking through the tunnel, Figures 13 and 14. It is important to point out that the choice of the lighting system and the equipment to be used for is strictly connected to the tunnel geometry, to the depollution degree which is to be obtained and to the management costs from the energy (power consumption) point of view. Some specific considerations on this point can be received from Disano Group.
Figure 10 – The tunnel before re-opening
Page 10 of 50
Figure 11 – Reference curve for NOx abatement (CTG data)
Figure 12 – Simulation design of lighting system: visible light irradiation (left) and UV-light irradiation (right)
Page 11 of 50
Combined lampVisible +UV
only UV lamp
Figure 13 – Position and types of lamp
Page 12 of 50
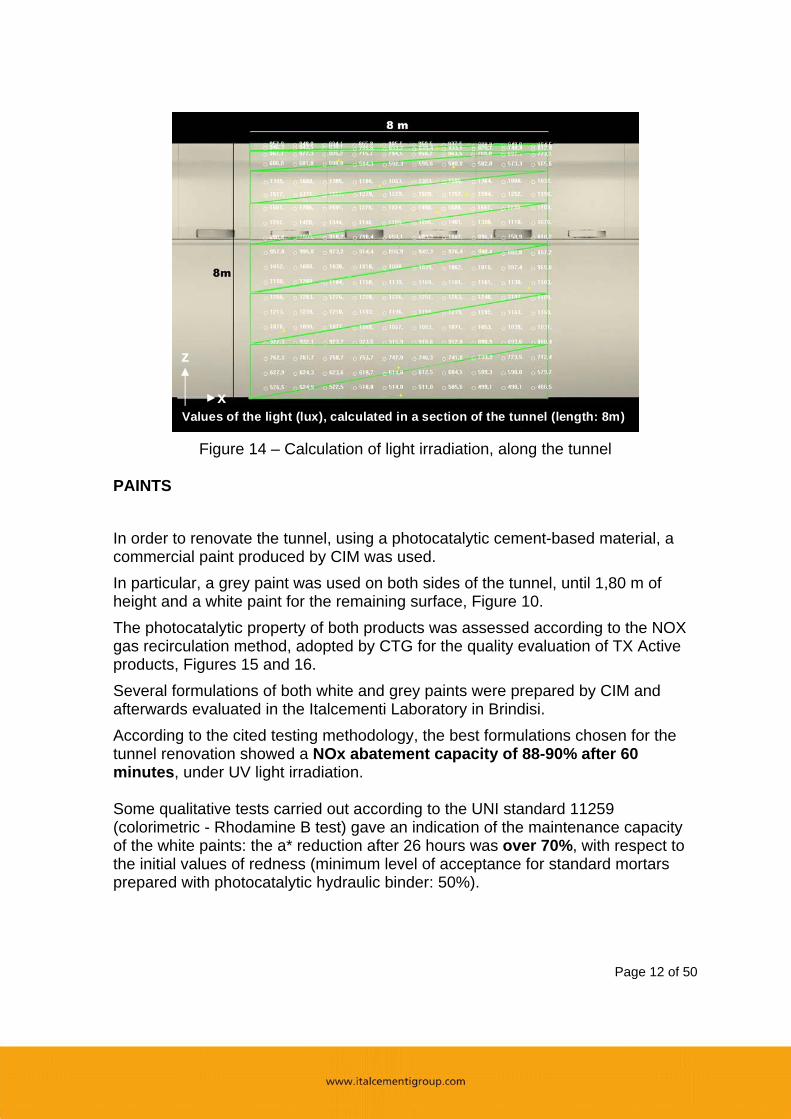
Figure 14 – Calculation of light irradiation, along the tunnel
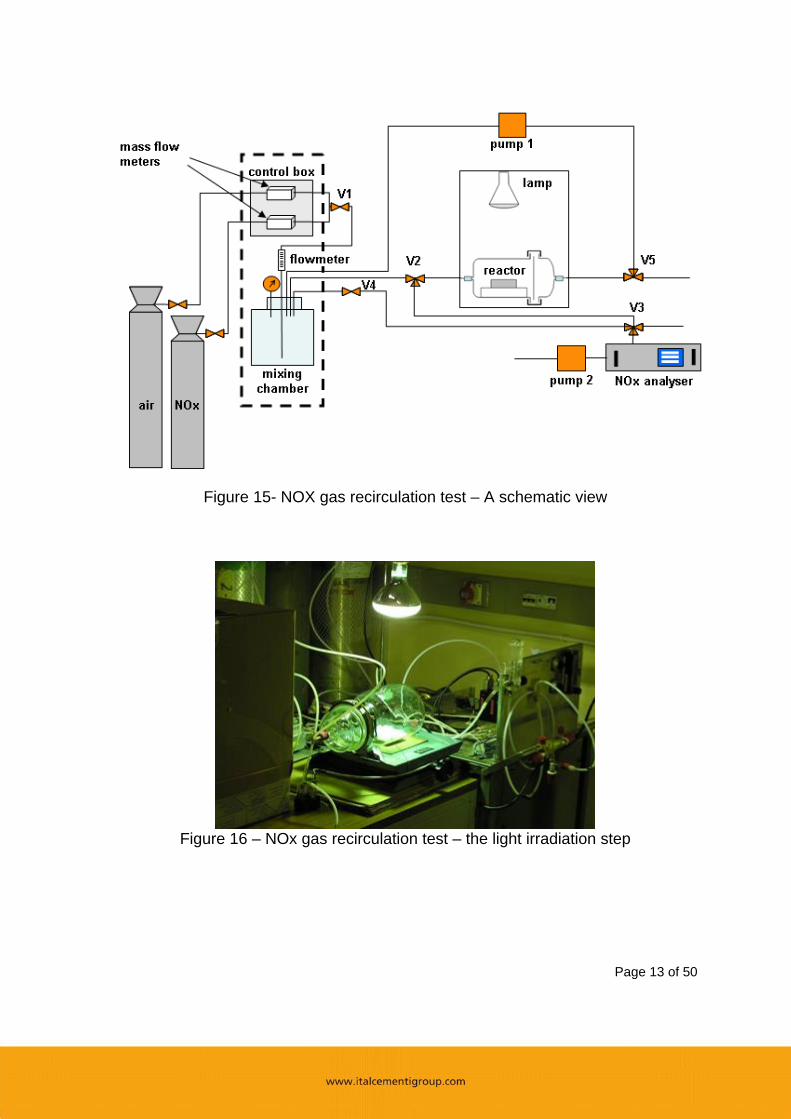
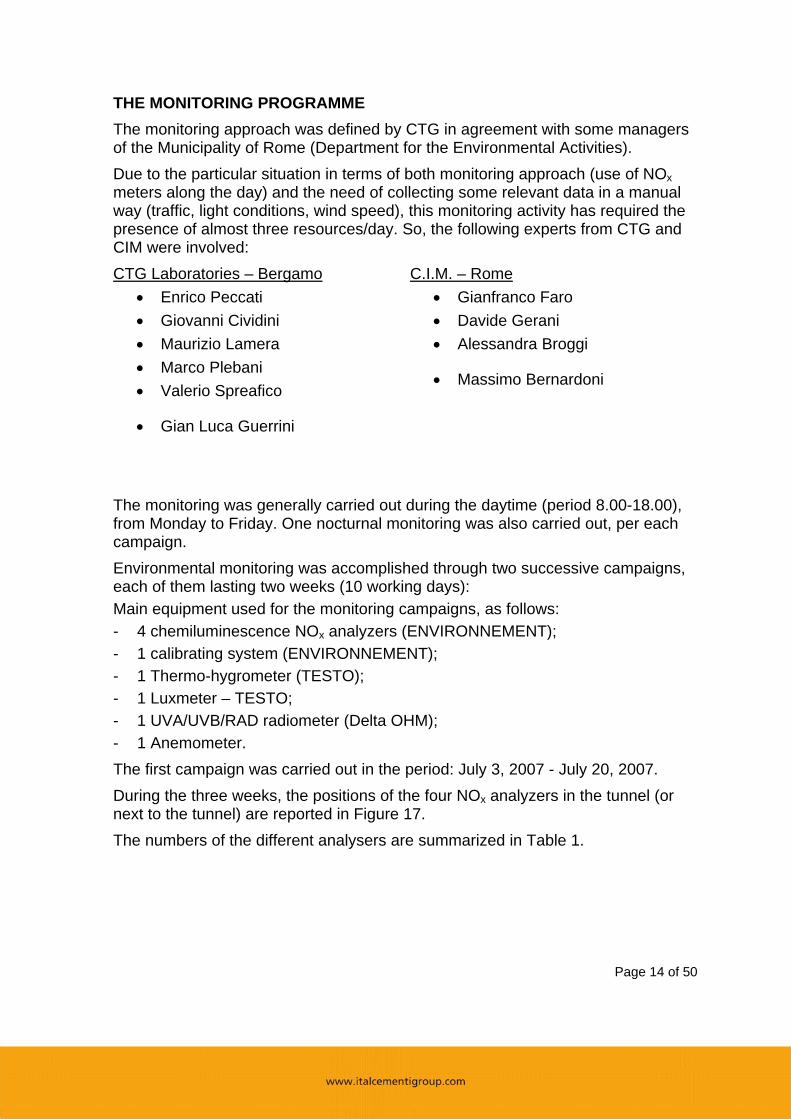
PAINTS In order to renovate the tunnel, using a photocatalytic cement-based material, a commercial paint produced by CIM was used. In particular, a grey paint was used on both sides of the tunnel, until 1,80 m of height and a white paint for the remaining surface, Figure 10. The photocatalytic property of both products was assessed according to the NOX gas recirculation method, adopted by CTG for the quality evaluation of TX Active products, Figures 15 and 16. Several formulations of both white and grey paints were prepared by CIM and afterwards evaluated in the Italcementi Laboratory in Brindisi. According to the cited testing methodology, the best formulations chosen for the tunnel renovation showed a NOx abatement capacity of 88-90% after 60 minutes, under UV light irradiation. Some qualitative tests carried out according to the UNI standard 11259 (colorimetric - Rhodamine B test) gave an indication of the maintenance capacity of the white paints: the a* reduction after 26 hours was over 70%, with respect to the initial values of redness (minimum level of acceptance for standard mortars prepared with photocatalytic hydraulic binder: 50%).
Values of the light (lux), calculated in a section of the tunnel (length: 8m)x
z
Page 13 of 50
Figure 15- NOX gas recirculation test – A schematic view
Figure 16 – NOx gas recirculation test – the light irradiation step
Page 14 of 50
THE MONITORING PROGRAMME The monitoring approach was defined by CTG in agreement with some managers of the Municipality of Rome (Department for the Environmental Activities). Due to the particular situation in terms of both monitoring approach (use of NOx meters along the day) and the need of collecting some relevant data in a manual way (traffic, light conditions, wind speed), this monitoring activity has required the presence of almost three resources/day. So, the following experts from CTG and CIM were involved: CTG Laboratories – Bergamo
• Enrico Peccati • Giovanni Cividini • Maurizio Lamera • Marco Plebani • Valerio Spreafico
• Gian Luca Guerrini
C.I.M. – Rome • Gianfranco Faro • Davide Gerani • Alessandra Broggi
• Massimo Bernardoni
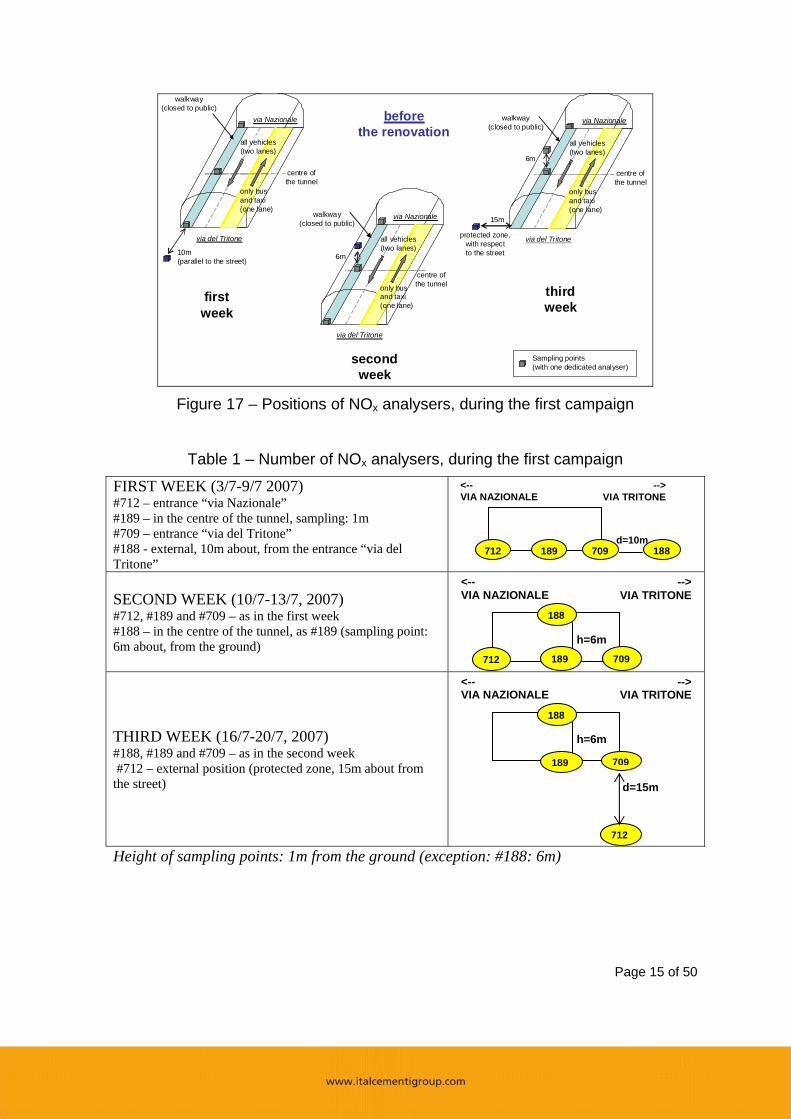
The monitoring was generally carried out during the daytime (period 8.00-18.00), from Monday to Friday. One nocturnal monitoring was also carried out, per each campaign. Environmental monitoring was accomplished through two successive campaigns, each of them lasting two weeks (10 working days): Main equipment used for the monitoring campaigns, as follows: - 4 chemiluminescence NOx analyzers (ENVIRONNEMENT); - 1 calibrating system (ENVIRONNEMENT); - 1 Thermo-hygrometer (TESTO); - 1 Luxmeter – TESTO; - 1 UVA/UVB/RAD radiometer (Delta OHM); - 1 Anemometer. The first campaign was carried out in the period: July 3, 2007 - July 20, 2007. During the three weeks, the positions of the four NOx analyzers in the tunnel (or next to the tunnel) are reported in Figure 17. The numbers of the different analysers are summarized in Table 1.
Page 15 of 50
via del Tritone
via Nazionale
all vehicles(two lanes)
only busand taxi(one lane)
10m(parallel to the street)
centre ofthe tunnel
walkway(closed to public)
firstweek
secondweek
thirdweek
via del Tritone
via Nazionale
all vehicles(two lanes)
only busand taxi(one lane)
6m
centre ofthe tunnel
walkway(closed to public)
via del Tritone
via Nazionale
all vehicles(two lanes)
only busand taxi(one lane)
6m
centre ofthe tunnel
walkway(closed to public)
15m
protected zone,with respectto the street
beforethe renovation
Sampling points(with one dedicated analyser)
Figure 17 – Positions of NOx analysers, during the first campaign
Table 1 – Number of NOx analysers, during the first campaign
FIRST WEEK (3/7-9/7 2007) #712 – entrance “via Nazionale” #189 – in the centre of the tunnel, sampling: 1m #709 – entrance “via del Tritone” #188 - external, 10m about, from the entrance “via del Tritone”
SECOND WEEK (10/7-13/7, 2007) #712, #189 and #709 – as in the first week #188 – in the centre of the tunnel, as #189 (sampling point: 6m about, from the ground)
THIRD WEEK (16/7-20/7, 2007) #188, #189 and #709 – as in the second week #712 – external position (protected zone, 15m about from the street)
Height of sampling points: 1m from the ground (exception: #188: 6m)
712
189 709
188
h=6m
<--VIA NAZIONALE
-->VIA TRITONE
d=15m
712 189 709
188
h=6m
<--VIA NAZIONALE
-->VIA TRITONE
712 189 709 188d=10m
<--VIA NAZIONALE
-->VIA TRITONE
Page 16 of 50
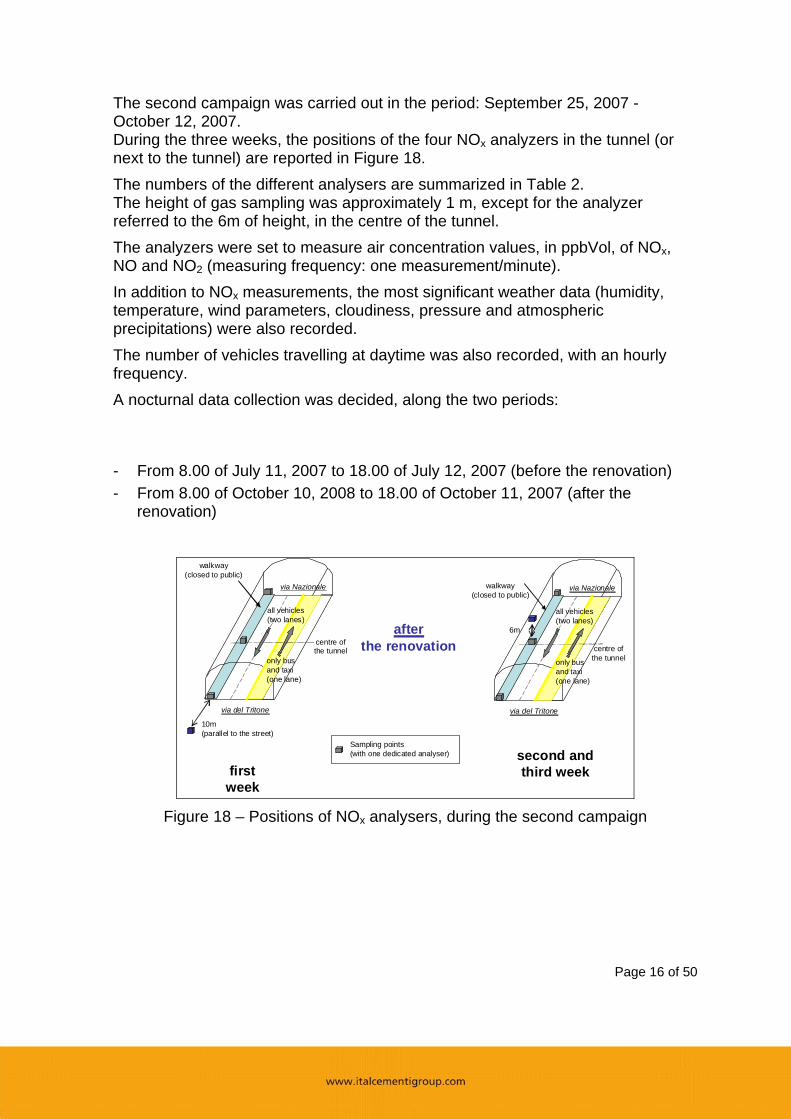
The second campaign was carried out in the period: September 25, 2007 - October 12, 2007. During the three weeks, the positions of the four NOx analyzers in the tunnel (or next to the tunnel) are reported in Figure 18. The numbers of the different analysers are summarized in Table 2. The height of gas sampling was approximately 1 m, except for the analyzer referred to the 6m of height, in the centre of the tunnel. The analyzers were set to measure air concentration values, in ppbVol, of NOx, NO and NO2 (measuring frequency: one measurement/minute). In addition to NOx measurements, the most significant weather data (humidity, temperature, wind parameters, cloudiness, pressure and atmospheric precipitations) were also recorded. The number of vehicles travelling at daytime was also recorded, with an hourly frequency. A nocturnal data collection was decided, along the two periods: - From 8.00 of July 11, 2007 to 18.00 of July 12, 2007 (before the renovation) - From 8.00 of October 10, 2008 to 18.00 of October 11, 2007 (after the
renovation)
via del Tritone
via Nazionale
all vehicles(two lanes)
only busand taxi(one lane)
10m(parallel to the street)
centre ofthe tunnel
Sampling points(with one dedicated analyser)
walkway(closed to public)
firstweek
second andthird week
via del Tritone
via Nazionale
all vehicles(two lanes)
only busand taxi(one lane)
6m
centre ofthe tunnel
walkway(closed to public)
afterthe renovation
Figure 18 – Positions of NOx analysers, during the second campaign
Page 17 of 50
Table 2 – Number of NOx analysers, during the second campaign
FIRST WEEK (25/9-28/9, 2007) #189 – entrance “via Nazionale” #709 – in the centre of the tunnel, sampling: 1m #785 – entrance “via del Tritone” #712 - external, 10m about, from the entrance “via del Tritone”
SECOND AND THIRD WEEK (1/10-12/10, 2007) #189 #709 and #785 – as in the first week #712 – in the centre of the tunnel, as #709 (sampling point: 6m about, from the ground)
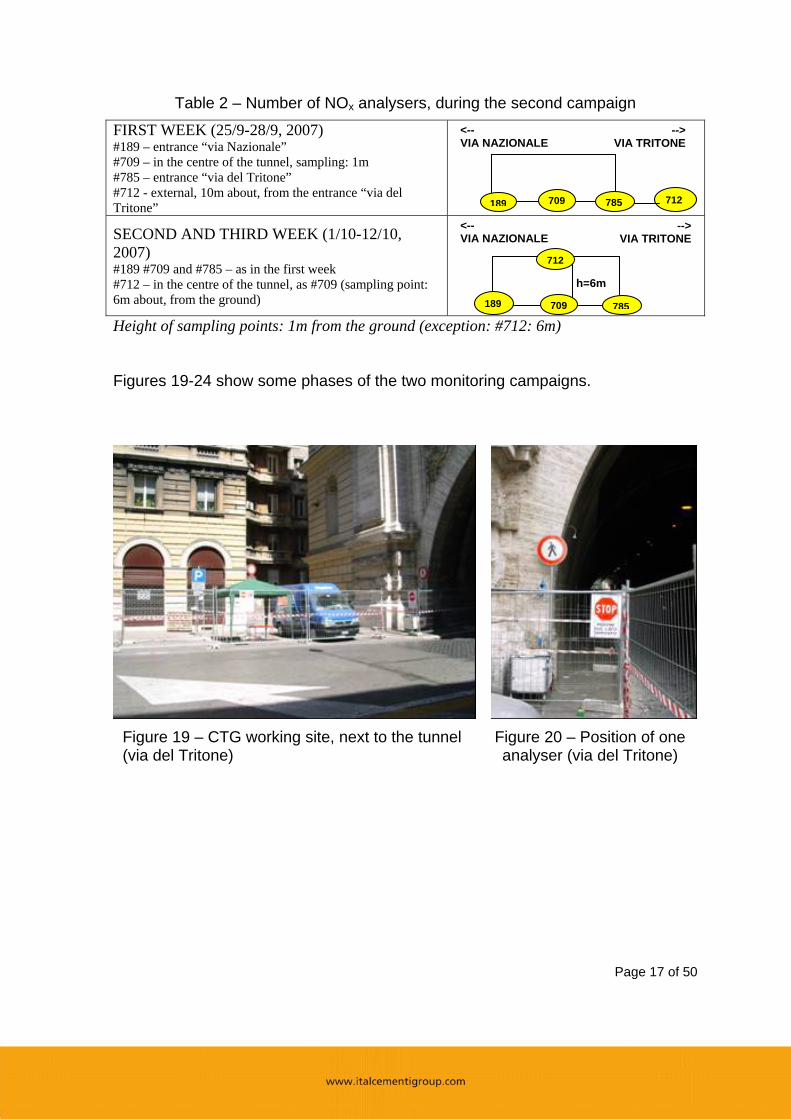
Height of sampling points: 1m from the ground (exception: #712: 6m) Figures 19-24 show some phases of the two monitoring campaigns.
Figure 19 – CTG working site, next to the tunnel (via del Tritone)
Figure 20 – Position of one analyser (via del Tritone)
189 709 785
712
h=6m
<--VIA NAZIONALE
-->VIA TRITONE
189 709 785 712
<--VIA NAZIONALE
-->VIA TRITONE
Page 18 of 50
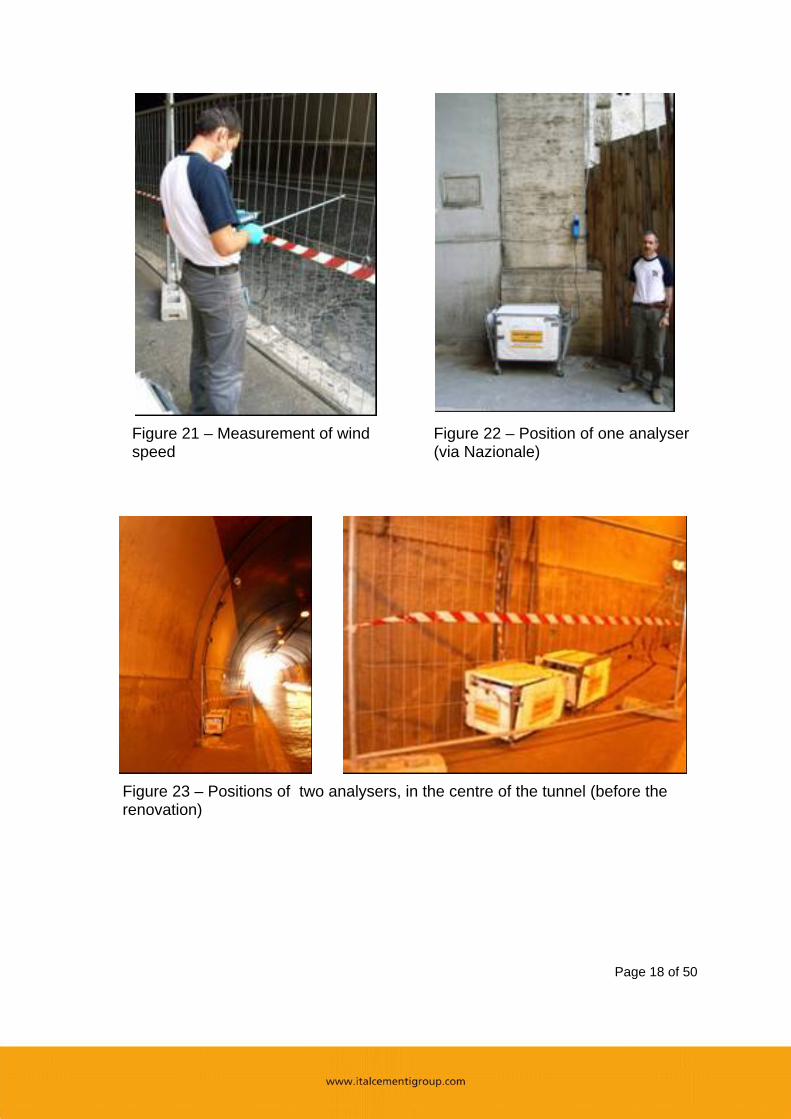
Figure 21 – Measurement of wind speed
Figure 22 – Position of one analyser (via Nazionale)
Figure 23 – Positions of two analysers, in the centre of the tunnel (before the renovation)
Page 19 of 50
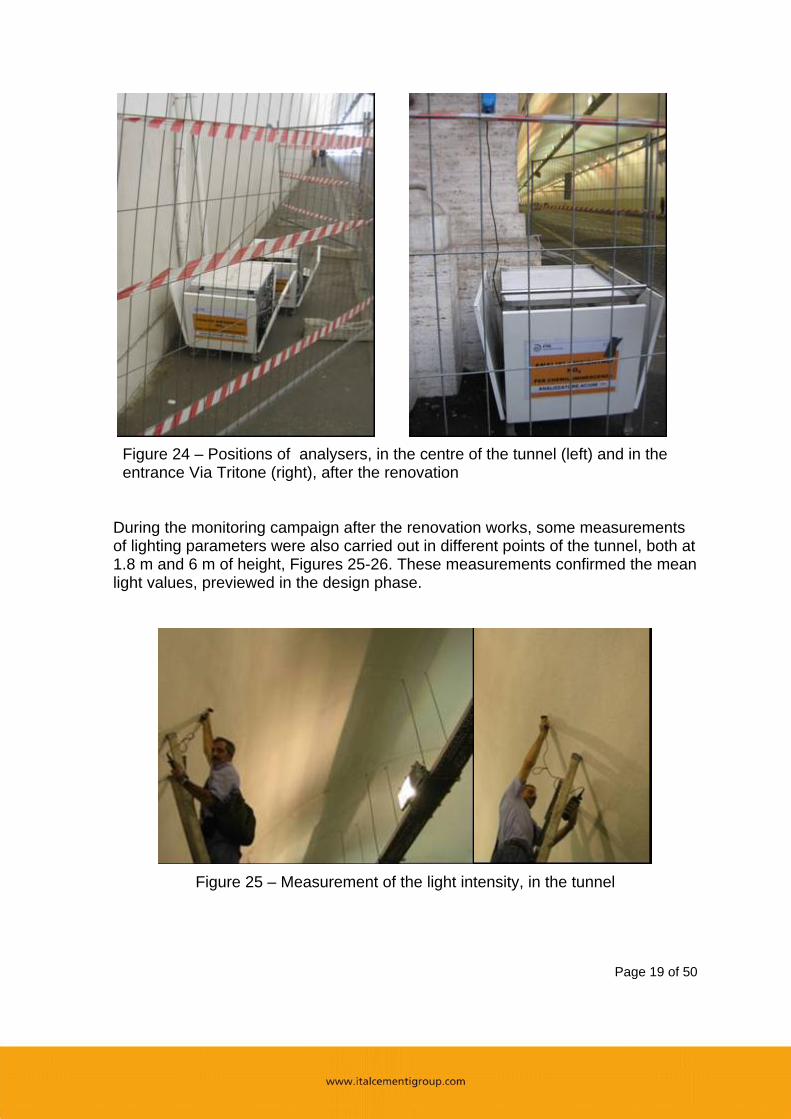
Figure 24 – Positions of analysers, in the centre of the tunnel (left) and in the entrance Via Tritone (right), after the renovation
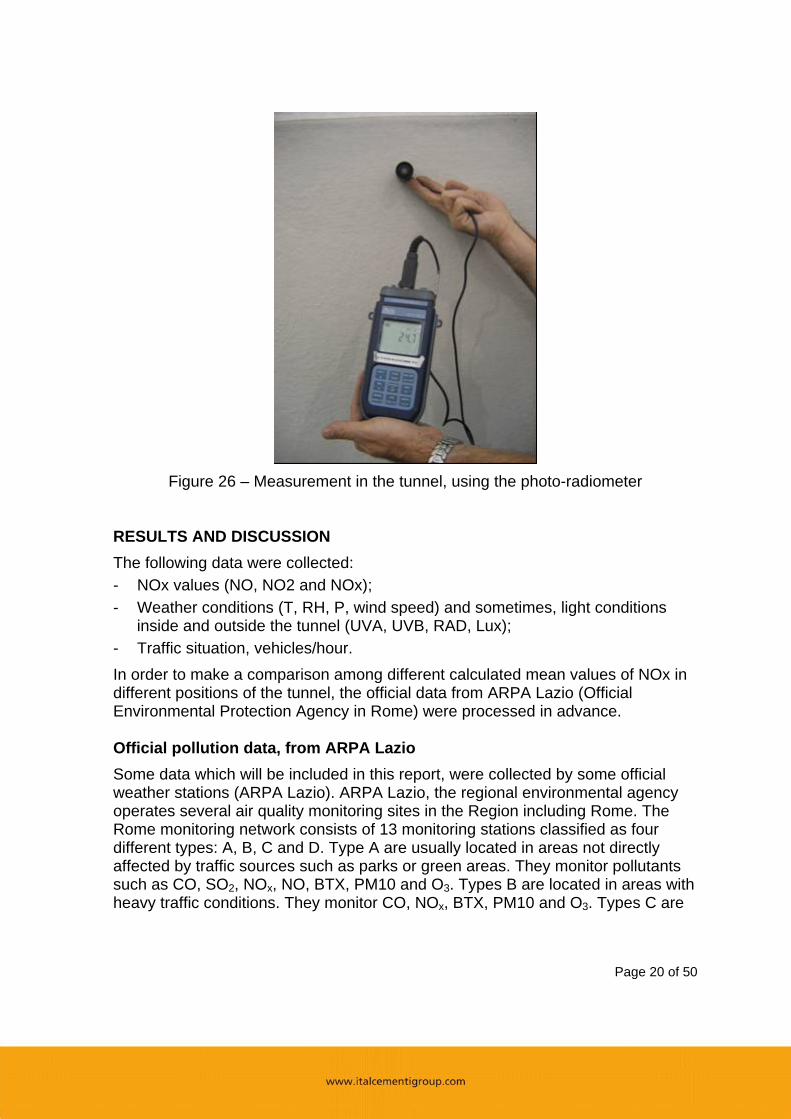
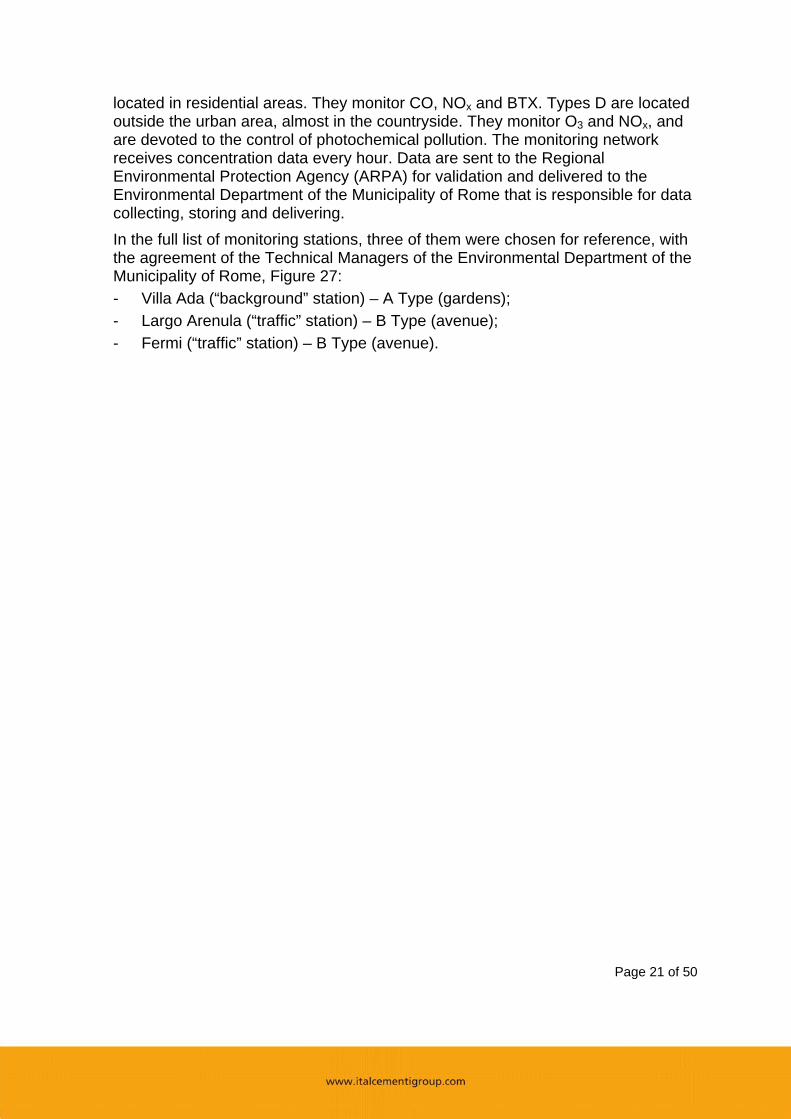
During the monitoring campaign after the renovation works, some measurements of lighting parameters were also carried out in different points of the tunnel, both at 1.8 m and 6 m of height, Figures 25-26. These measurements confirmed the mean light values, previewed in the design phase.
Figure 25 – Measurement of the light intensity, in the tunnel
Page 20 of 50
Figure 26 – Measurement in the tunnel, using the photo-radiometer
RESULTS AND DISCUSSION The following data were collected: - NOx values (NO, NO2 and NOx); - Weather conditions (T, RH, P, wind speed) and sometimes, light conditions
inside and outside the tunnel (UVA, UVB, RAD, Lux); - Traffic situation, vehicles/hour. In order to make a comparison among different calculated mean values of NOx in different positions of the tunnel, the official data from ARPA Lazio (Official Environmental Protection Agency in Rome) were processed in advance. Official pollution data, from ARPA Lazio Some data which will be included in this report, were collected by some official weather stations (ARPA Lazio). ARPA Lazio, the regional environmental agency operates several air quality monitoring sites in the Region including Rome. The Rome monitoring network consists of 13 monitoring stations classified as four different types: A, B, C and D. Type A are usually located in areas not directly affected by traffic sources such as parks or green areas. They monitor pollutants such as CO, SO2, NOx, NO, BTX, PM10 and O3. Types B are located in areas with heavy traffic conditions. They monitor CO, NOx, BTX, PM10 and O3. Types C are
Page 21 of 50
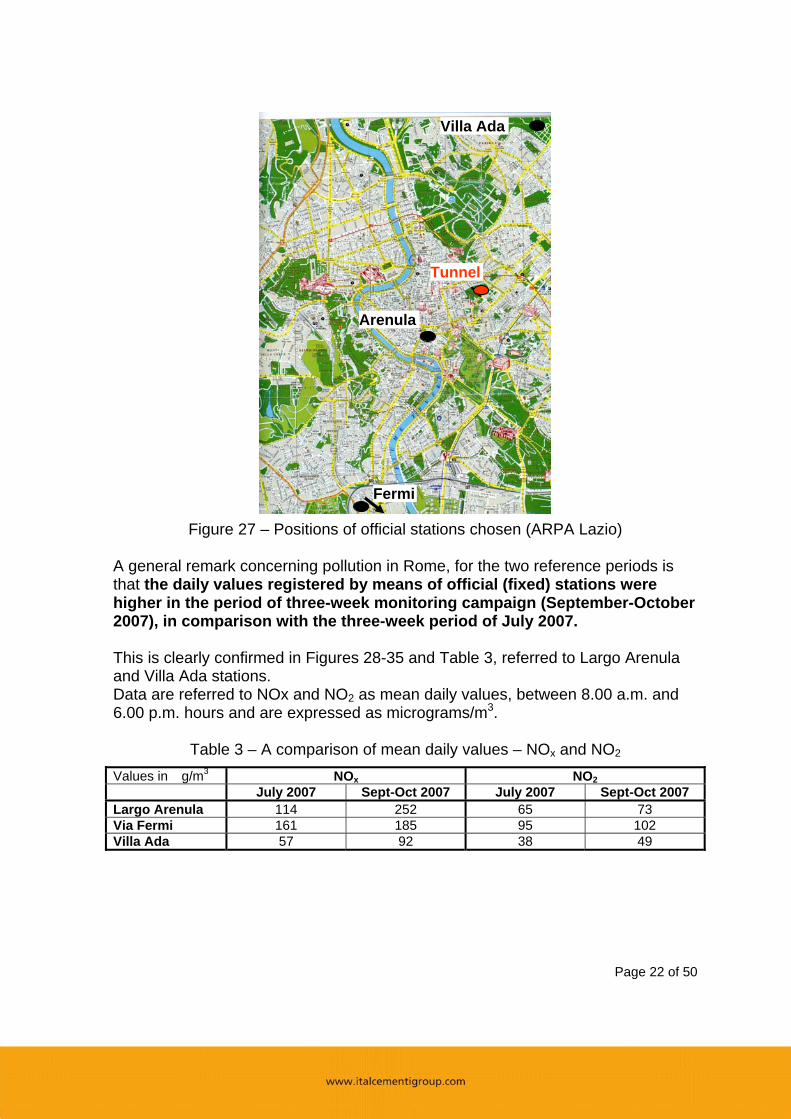
located in residential areas. They monitor CO, NOx and BTX. Types D are located outside the urban area, almost in the countryside. They monitor O3 and NOx, and are devoted to the control of photochemical pollution. The monitoring network receives concentration data every hour. Data are sent to the Regional Environmental Protection Agency (ARPA) for validation and delivered to the Environmental Department of the Municipality of Rome that is responsible for data collecting, storing and delivering. In the full list of monitoring stations, three of them were chosen for reference, with the agreement of the Technical Managers of the Environmental Department of the Municipality of Rome, Figure 27: - Villa Ada (“background” station) – A Type (gardens); - Largo Arenula (“traffic” station) – B Type (avenue); - Fermi (“traffic” station) – B Type (avenue).
Page 22 of 50
Figure 27 – Positions of official stations chosen (ARPA Lazio)
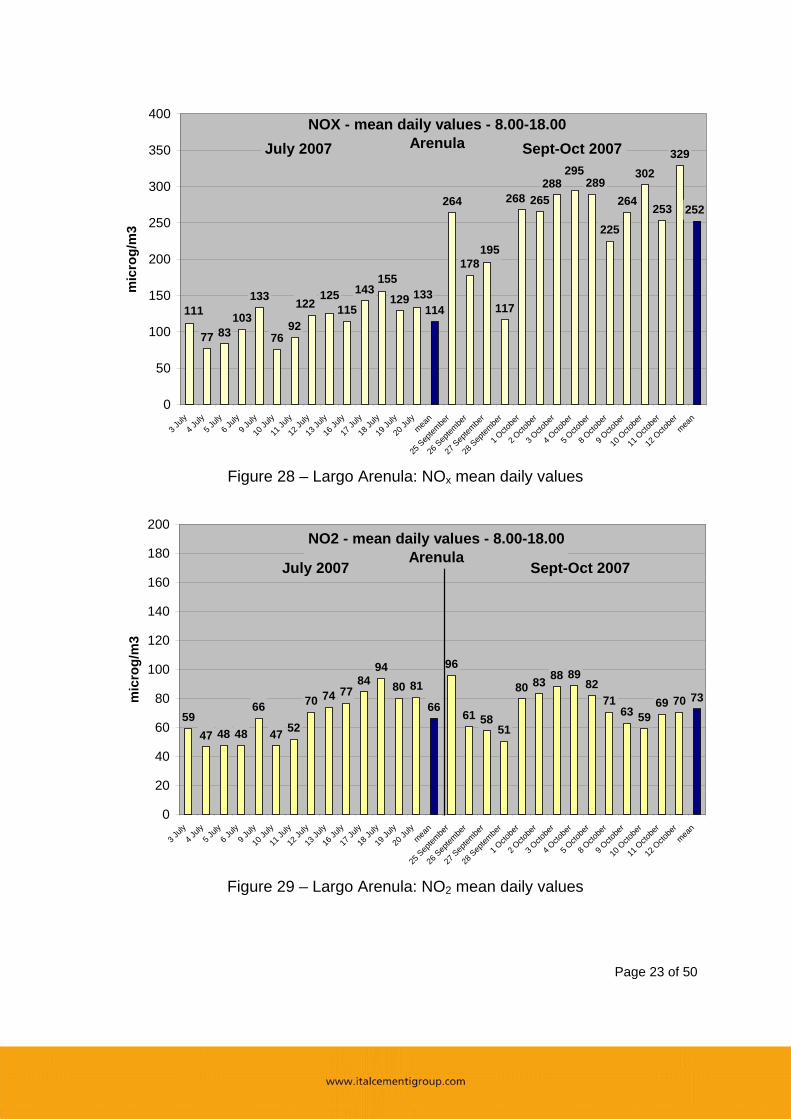
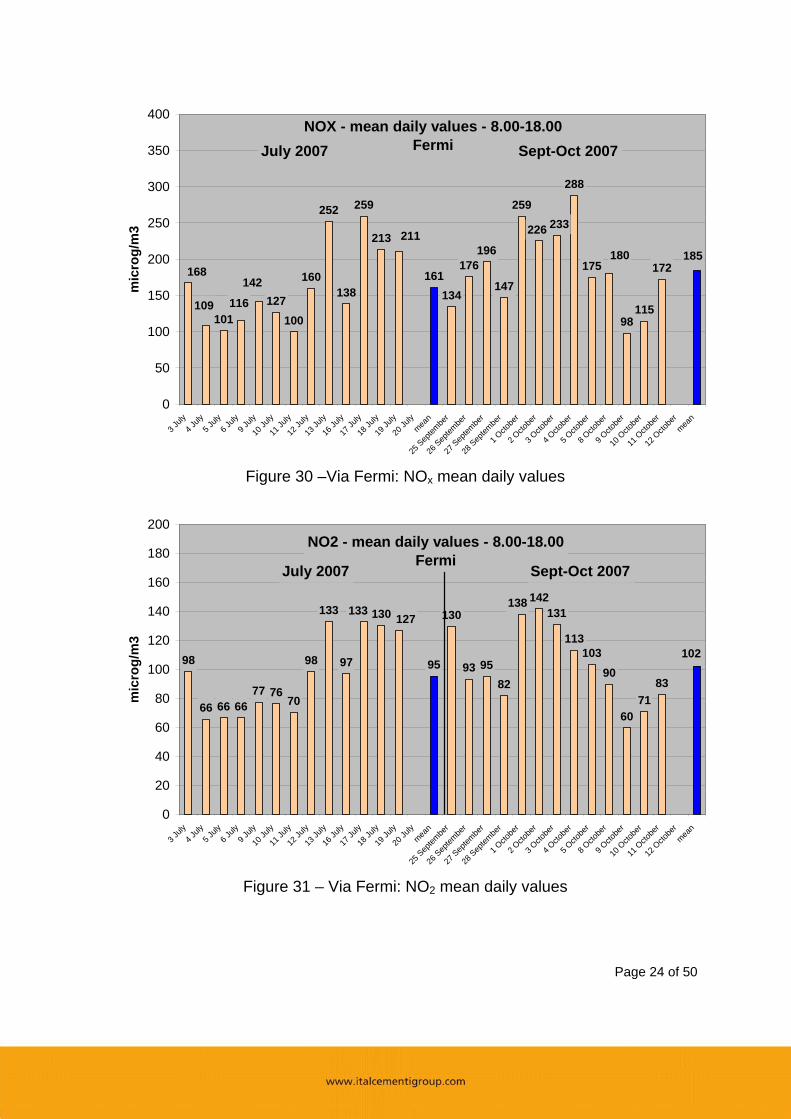
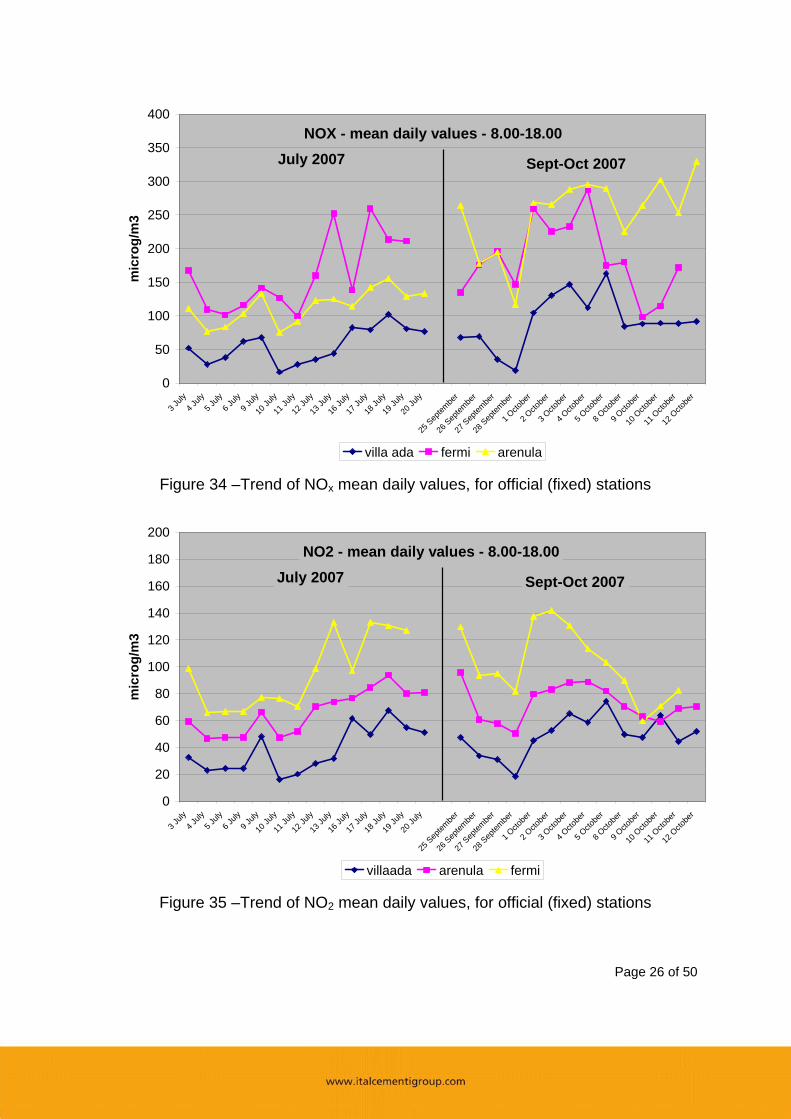
A general remark concerning pollution in Rome, for the two reference periods is that the daily values registered by means of official (fixed) stations were higher in the period of three-week monitoring campaign (September-October 2007), in comparison with the three-week period of July 2007. This is clearly confirmed in Figures 28-35 and Table 3, referred to Largo Arenula and Villa Ada stations. Data are referred to NOx and NO2 as mean daily values, between 8.00 a.m. and 6.00 p.m. hours and are expressed as micrograms/m3.
Table 3 – A comparison of mean daily values – NOx and NO2 Values in �g/m3 NOx NO2 July 2007 Sept-Oct 2007 July 2007 Sept-Oct 2007 Largo Arenula 114 252 65 73 Via Fermi 161 185 95 102 Villa Ada 57 92 38 49
Arenula
Tunnel
Fermi
Villa Ada
Page 23 of 50
77 83103
133
7692
115
143129
114
264
178
117
265
225
264
302
253
329
252
289288
195
133155
125122111
268
295
0
50
100
150
200
250
300
350
400
3 July
4 July
5 July
6 July
9 July
10 Ju
ly
11 Ju
ly
12 Ju
ly
13 Ju
ly
16 Ju
ly
17 Ju
ly
18 Ju
ly
19 Ju
ly
20 Ju
lymea
n
25 S
eptem
ber
26 S
eptem
ber
27 S
eptem
ber
28 S
eptem
ber
1 Octo
ber
2 Octo
ber
3 Octo
ber
4 Octo
ber
5 Octo
ber
8 Octo
ber
9 Octo
ber
10 O
ctobe
r
11 O
ctobe
r
12 O
ctobe
rmea
n
mic
rog/
m3
NOX - mean daily values - 8.00-18.00ArenulaJuly 2007 Sept-Oct 2007
Figure 28 – Largo Arenula: NOx mean daily values
5947 48 48
66
47 52
70 74 7784
9480 81
66
96
61 5851
80 83 88 8982
7163 59
69 70 73
0
20
40
60
80
100
120
140
160
180
200
3 July
4 July
5 July
6 July
9 July
10 Ju
ly
11 Ju
ly
12 Ju
ly
13 Ju
ly
16 Ju
ly
17 Ju
ly
18 Ju
ly
19 Ju
ly
20 Ju
lymea
n
25 S
eptem
ber
26 S
eptem
ber
27 S
eptem
ber
28 S
eptem
ber
1 Octo
ber
2 Octo
ber
3 Octo
ber
4 Octo
ber
5 Octo
ber
8 Octo
ber
9 Octo
ber
10 O
ctobe
r
11 O
ctobe
r
12 O
ctobe
rmea
n
mic
rog/
m3
NO2 - mean daily values - 8.00-18.00Arenula
July 2007 Sept-Oct 2007
Figure 29 – Largo Arenula: NO2 mean daily values
Page 24 of 50
127100
160
252
138
259
213
161134
176196
147
259
288
175
98115
172
233
168
116101
109
211
142
185
226
180
0
50
100
150
200
250
300
350
400
3 July
4 July
5 July
6 July
9 July
10 Ju
ly
11 Ju
ly
12 Ju
ly
13 Ju
ly
16 Ju
ly
17 Ju
ly
18 Ju
ly
19 Ju
ly
20 Ju
lymea
n
25 S
eptem
ber
26 S
eptem
ber
27 S
eptem
ber
28 S
eptem
ber
1 Octo
ber
2 Octo
ber
3 Octo
ber
4 Octo
ber
5 Octo
ber
8 Octo
ber
9 Octo
ber
10 O
ctobe
r
11 O
ctobe
r
12 O
ctobe
rmea
n
mic
rog/
m3
NOX - mean daily values - 8.00-18.00FermiJuly 2007 Sept-Oct 2007
Figure 30 –Via Fermi: NOx mean daily values
98
66 66 6677 76
70
98
133
97
130
95
130
93 9582
142131
113103
90
6071
83
138
102
133127
0
20
40
60
80
100
120
140
160
180
200
3 July
4 July
5 July
6 July
9 July
10 Ju
ly
11 Ju
ly
12 Ju
ly
13 Ju
ly
16 Ju
ly
17 Ju
ly
18 Ju
ly
19 Ju
ly
20 Ju
lymea
n
25 S
eptem
ber
26 S
eptem
ber
27 S
eptem
ber
28 S
eptem
ber
1 Octo
ber
2 Octo
ber
3 Octo
ber
4 Octo
ber
5 Octo
ber
8 Octo
ber
9 Octo
ber
10 O
ctobe
r
11 O
ctobe
r
12 O
ctobe
rmea
n
mic
rog/
m3
NO2 - mean daily values - 8.00-18.00Fermi
July 2007 Sept-Oct 2007
Figure 31 – Via Fermi: NO2 mean daily values

Page 25 of 50
5238
68
1628 35
44
82 79
103
81 7757
68 69
3519
104
131147
112
163
84 88 89 89 92 92
28
62
0
50
100
150
200
250
300
3 July
4 July
5 July
6 July
9 July
10 Ju
ly
11 Ju
ly
12 Ju
ly
13 Ju
ly
16 Ju
ly
17 Ju
ly
18 Ju
ly
19 Ju
ly
20 Ju
lymea
n
25 S
eptem
ber
26 S
eptem
ber
27 S
eptem
ber
28 S
eptem
ber
1 Octo
ber
2 Octo
ber
3 Octo
ber
4 Octo
ber
5 Octo
ber
8 Octo
ber
9 Octo
ber
10 O
ctobe
r
11 O
ctobe
r
12 O
ctobe
rmea
n
mic
rog/
m3
NOX - mean daily values - 8.00-18.00Villa AdaJuly 2007 Sept-Oct 2007
Figure 32 – Villa Ada: NOx mean daily values
3323 25 25
48
16 2028 32
6249
6755 51
3847
34 3119
4553
6559
74
50 48
64
4452 49
0
20
40
60
80
100
120
140
160
180
200
3 July
4 July
5 July
6 July
9 July
10 Ju
ly
11 Ju
ly
12 Ju
ly
13 Ju
ly
16 Ju
ly
17 Ju
ly
18 Ju
ly
19 Ju
ly
20 Ju
lymea
n
25 S
eptem
ber
26 S
eptem
ber
27 S
eptem
ber
28 S
eptem
ber
1 Octo
ber
2 Octo
ber
3 Octo
ber
4 Octo
ber
5 Octo
ber
8 Octo
ber
9 Octo
ber
10 O
ctobe
r
11 O
ctobe
r
12 O
ctobe
rmea
n
mic
rog/
m3
NO2 - mean daily values - 8.00-18.00Villa Ada
July 2007 Sept-Oct 2007
Figure 33 – Villa Ada: NO2 mean daily values
Page 26 of 50
0
50
100
150
200
250
300
350
400
3 July
4 July
5 July
6 July
9 July
10 Ju
ly
11 Ju
ly
12 Ju
ly
13 Ju
ly
16 Ju
ly
17 Ju
ly
18 Ju
ly
19 Ju
ly
20 Ju
ly
25 S
eptem
ber
26 S
eptem
ber
27 S
eptem
ber
28 S
eptem
ber
1 Octo
ber
2 Octo
ber
3 Octo
ber
4 Octo
ber
5 Octo
ber
8 Octo
ber
9 Octo
ber
10 O
ctobe
r
11 O
ctobe
r
12 O
ctobe
r
mic
rog/
m3
villa ada fermi arenula
NOX - mean daily values - 8.00-18.00July 2007 Sept-Oct 2007
Figure 34 –Trend of NOx mean daily values, for official (fixed) stations
0
20
40
60
80
100
120
140
160
180
200
3 July
4 July
5 July
6 July
9 July
10 Ju
ly
11 Ju
ly
12 Ju
ly
13 Ju
ly
16 Ju
ly
17 Ju
ly
18 Ju
ly
19 Ju
ly
20 Ju
ly
25 S
eptem
ber
26 S
eptem
ber
27 S
eptem
ber
28 S
eptem
ber
1 Octo
ber
2 Octo
ber
3 Octo
ber
4 Octo
ber
5 Octo
ber
8 Octo
ber
9 Octo
ber
10 O
ctobe
r
11 O
ctobe
r
12 O
ctobe
r
mic
rog/
m3
villaada arenula fermi
NO2 - mean daily values - 8.00-18.00July 2007 Sept-Oct 2007
Figure 35 –Trend of NO2 mean daily values, for official (fixed) stations
Page 27 of 50
Crossing the tunnel from via Nazionale to via del Tritone, the mean daily NOx values increase, probably due to the already mentioned windy conditions and to the pollution effects derived from the other entrance (“via del Tritone”). The NOx mean values are very high, but lower than the values registered in the previous, similar experience in Milan (via Porpora, 2004): daily values of 400-800 ppb (Rome) against 1200-1400 ppb (Milan). An increase of NOx values during the afternoon was almost regularly observed, due to the tourist traffic above described (especially for the positions next to the entrance “via del Tritone”) and very high pollution peaks were sometimes registered. Traffic The number of vehicles per hr (mean hourly value), which was manually registered in occasion of the two monitoring campaigns, was similar for both periods (July 2007 and September-October 2007): 1100 vehicle/hr, about. During the two campaigns, the range was between 940 and 1240 vehicles/hr, from Monday to Friday, without any possibility to define a weekly trend for the traffic. The location of the tunnel is in the historical centre of Rome, corresponds to the Restricted Access Zone (LTZ, Limited Traffic Zone, “Zona a Traffico Limitato”), where public traffic is stopped daily from 7.00 a.m. to 6.00 p.m. (from Monday to Friday). During evening and night hours and during week-ends, no restrictions are applied on public circulation (exception: Saturday afternoon). During the LTZ period, the traffic is mainly consisting of public transport, tourist buses, taxies (more or less, 50%) and private transport or “blue cars”. Indeed, a large number of tourist buses were observed along the day, mainly in the range: 10.00 a.m. - 4.00 p.m. (both in July and in Sept-Oct period). Environmental conditions, in the tunnel In relation to the semi-confined conditions, the values of temperature, relative humidity and pressure in the tunnel were almost constant, along the day and in the interested weeks. During the first period (July), the average temperature measured in daylight period was in the range 28-40°C (entrance “via del Tritone”), around 30-32°C (in the tunnel). In the second period, the average temperature was 20-28°C (outside) and 23-25°C (tunnel).
Page 28 of 50
The average relative humidity was in the range 15-40% during the first campaign and in the range 40-70%, during the second campaign (a few days of rain which have not influenced the conditions in the tunnel). The speed of the wind was influenced by the traffic variations along the two periods, because of the high speed of vehicles passing through the tunnel. However, typical values registered in the entrance “via del Tritone” range between 0.10 and 1.70 m/sec, corresponding to an average value of 0.38 m/sec. Highest values along the tunnel were always detected in the centre. The direction of the wind was always the same: from the entrance “Via Nazionale” towards “Via del Tritone”. NOx monitoring results: preliminary remarks Before considering and discussing the numerical results, some preliminary remarks can be summarized, as follows: a) In relation to the specific application (a tunnel, that is a semi-confined place,
rather than a road or another open space), we can consider lighting conditions as steady. However, due to the large dimensions of the tunnel, a certain amount of sunlight could reinforce the photocatalytic action, in addition to the artificial light (in some hours of the day).
b) On this basis, the most relevant parameters which could influence the monitoring results are traffic (number of vehicles per hour) and wind speed.
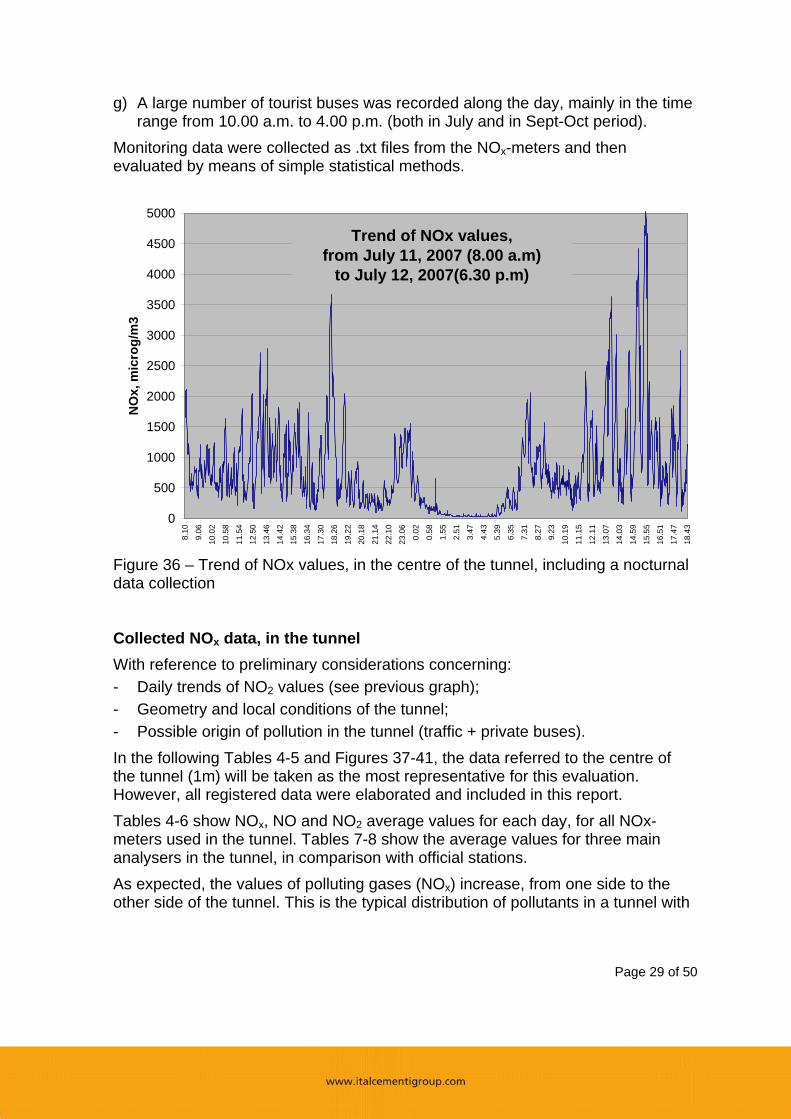
c) In order to evaluate the trend of traffic along a day, a nocturnal data collection was carried out, along the two periods: - from 8.00 a.m. of July 11, 2007 to 6.00 p.m of July 12, 2007 (before the renovation), Figure 36; - from 8.00 a.m. of October 10, 2007 to 6.00 p.m. of October 11, 2007 (after the renovation).
d) The data collection of analysers positioned just outside the entrance “via del Tritone” was strongly influenced by local traffic, due to the temporary parking (few minutes) of tourist buses (the tunnel is a few hundred meters far from the famous “Fontana di Trevi”). This phenomenon is seasonal, from spring period to the end of summer period). It is particularly evident in the central part of the day (from 10.00-11.00 a.m. to 4.00-5.00 p.m., according to the days).
e) The tunnel is quite windy, due to its large size and, above all, due to the volume of traffic which is predominant in one direction (from via Nazionale to via del Tritone), as well as to its two lanes (in the opposite direction the circulation is allowed only to public vehicles (buses, taxi) service vehicles and “official cars” (no private vehicles).
f) The tunnel is slightly downhill, from via Nazionale to via del Tritone.
Page 29 of 50
g) A large number of tourist buses was recorded along the day, mainly in the time range from 10.00 a.m. to 4.00 p.m. (both in July and in Sept-Oct period).
Monitoring data were collected as .txt files from the NOx-meters and then evaluated by means of simple statistical methods.
0
500
1000
1500
2000
2500
3000
3500
4000
4500
5000
8.10
9.06
10.0
2
10.5
8
11.5
4
12.5
0
13.4
6
14.4
2
15.3
8
16.3
4
17.3
0
18.2
6
19.2
2
20.1
8
21.1
4
22.1
0
23.0
6
0.02
0.58
1.55
2.51
3.47
4.43
5.39
6.35
7.31
8.27
9.23
10.1
9
11.1
5
12.1
1
13.0
7
14.0
3
14.5
9
15.5
5
16.5
1
17.4
7
18.4
3
NO
x, m
icro
g/m
3
Trend of NOx values,from July 11, 2007 (8.00 a.m)
to July 12, 2007(6.30 p.m)
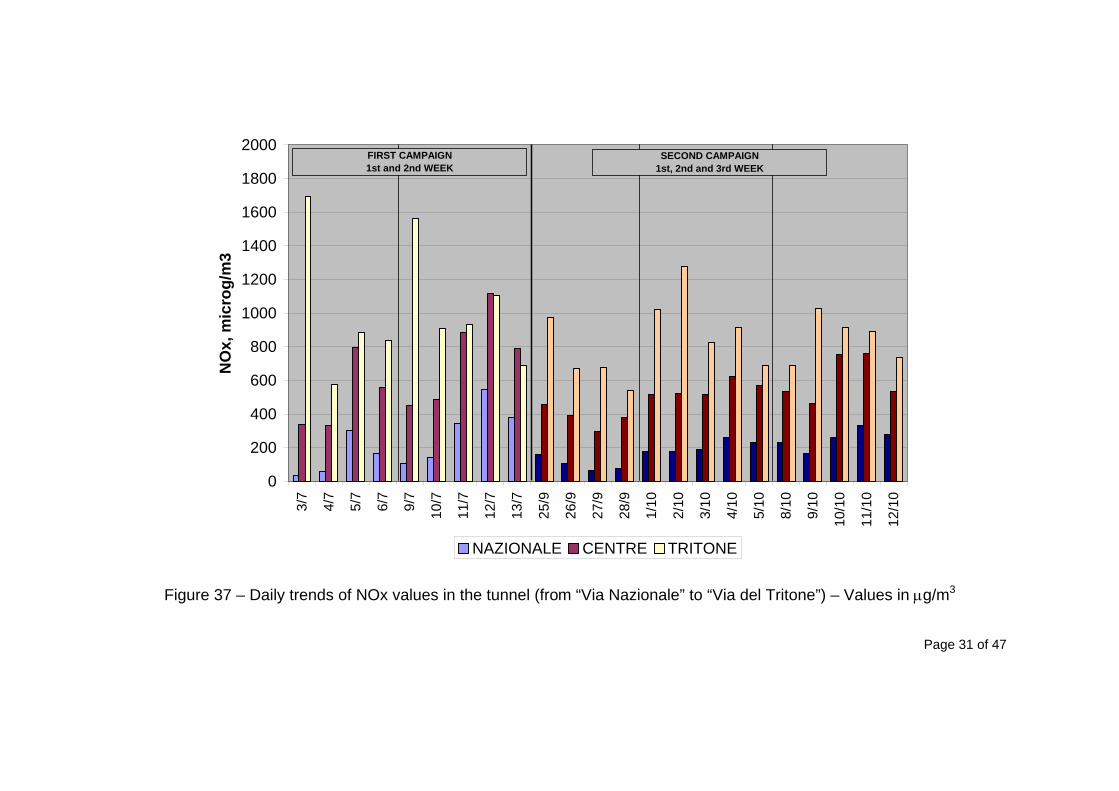
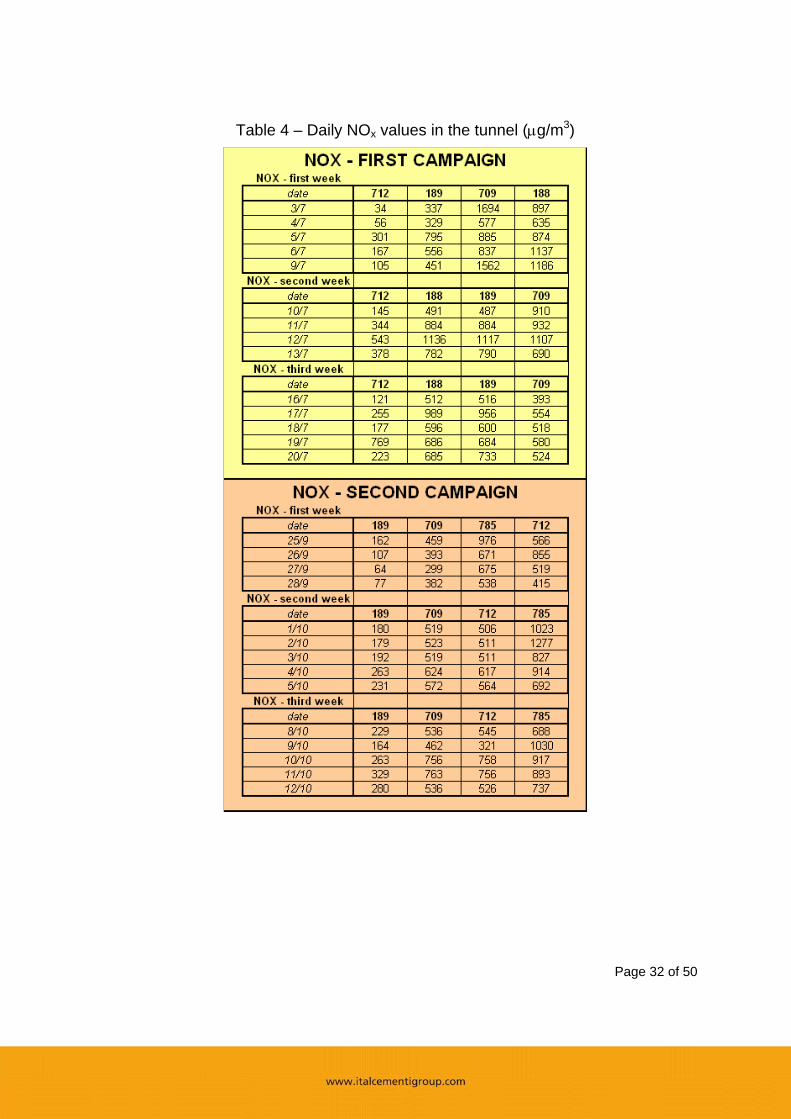
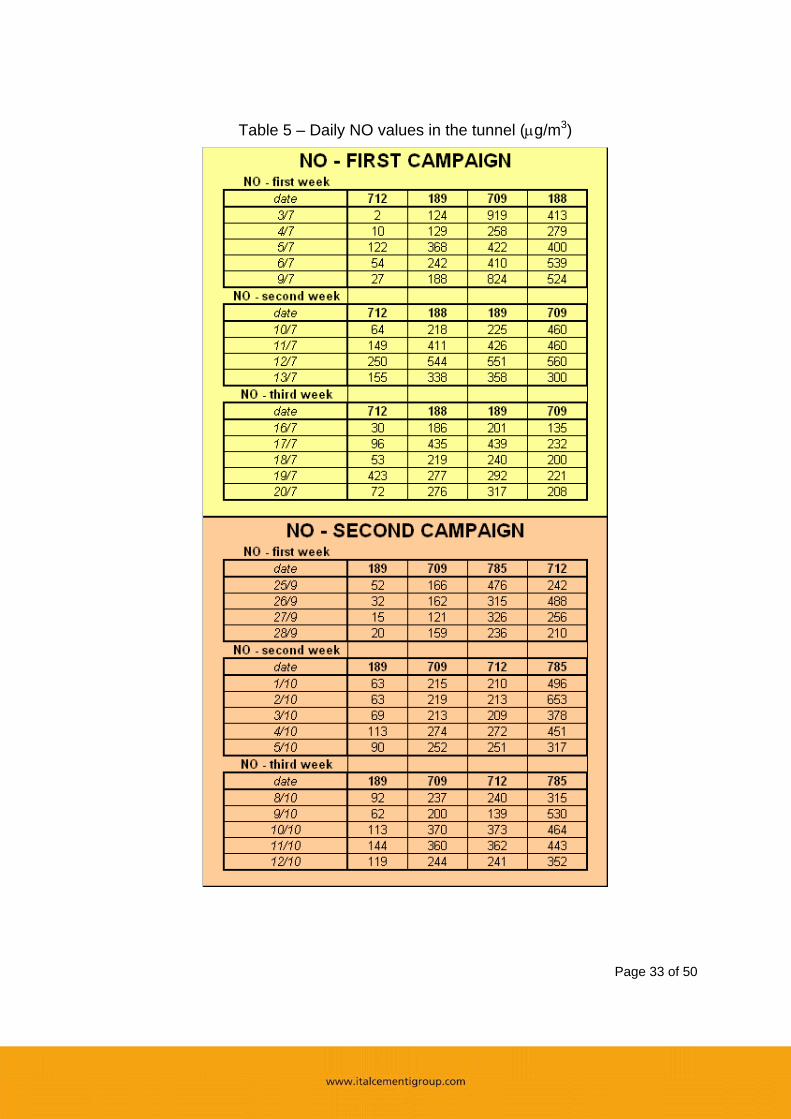
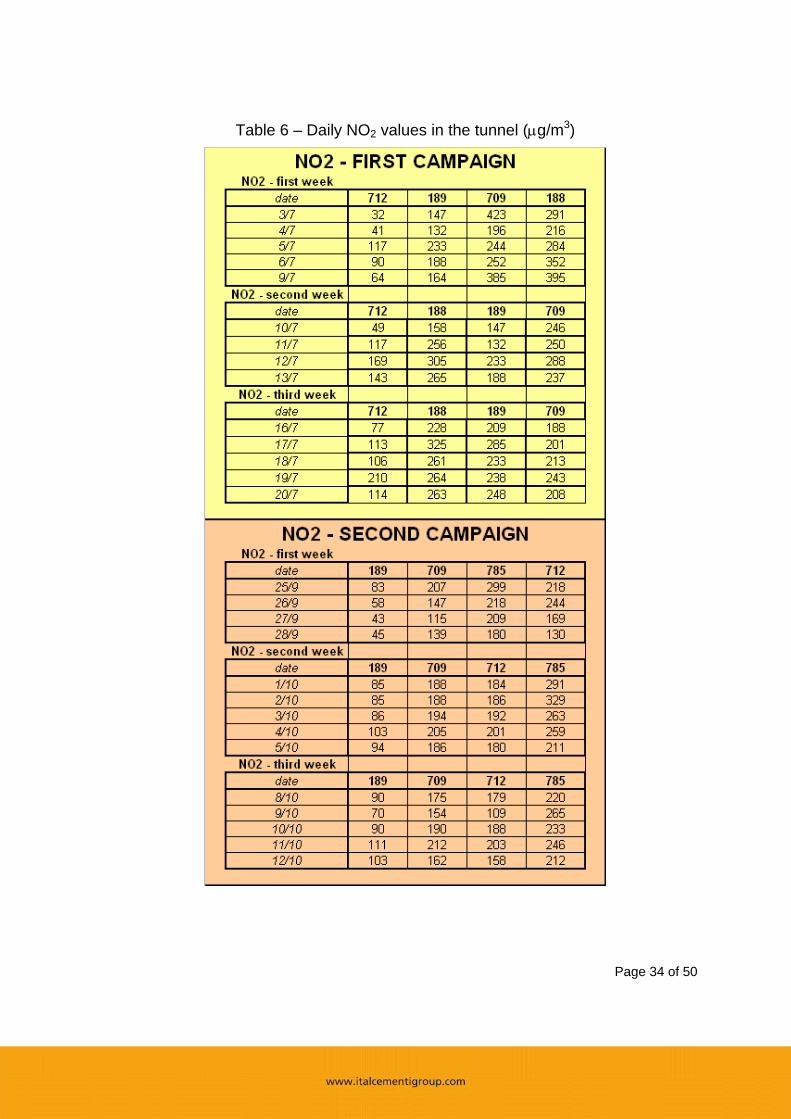
Figure 36 – Trend of NOx values, in the centre of the tunnel, including a nocturnal data collection Collected NOx data, in the tunnel With reference to preliminary considerations concerning: - Daily trends of NO2 values (see previous graph); - Geometry and local conditions of the tunnel; - Possible origin of pollution in the tunnel (traffic + private buses). In the following Tables 4-5 and Figures 37-41, the data referred to the centre of the tunnel (1m) will be taken as the most representative for this evaluation. However, all registered data were elaborated and included in this report. Tables 4-6 show NOx, NO and NO2 average values for each day, for all NOx-meters used in the tunnel. Tables 7-8 show the average values for three main analysers in the tunnel, in comparison with official stations. As expected, the values of polluting gases (NOx) increase, from one side to the other side of the tunnel. This is the typical distribution of pollutants in a tunnel with
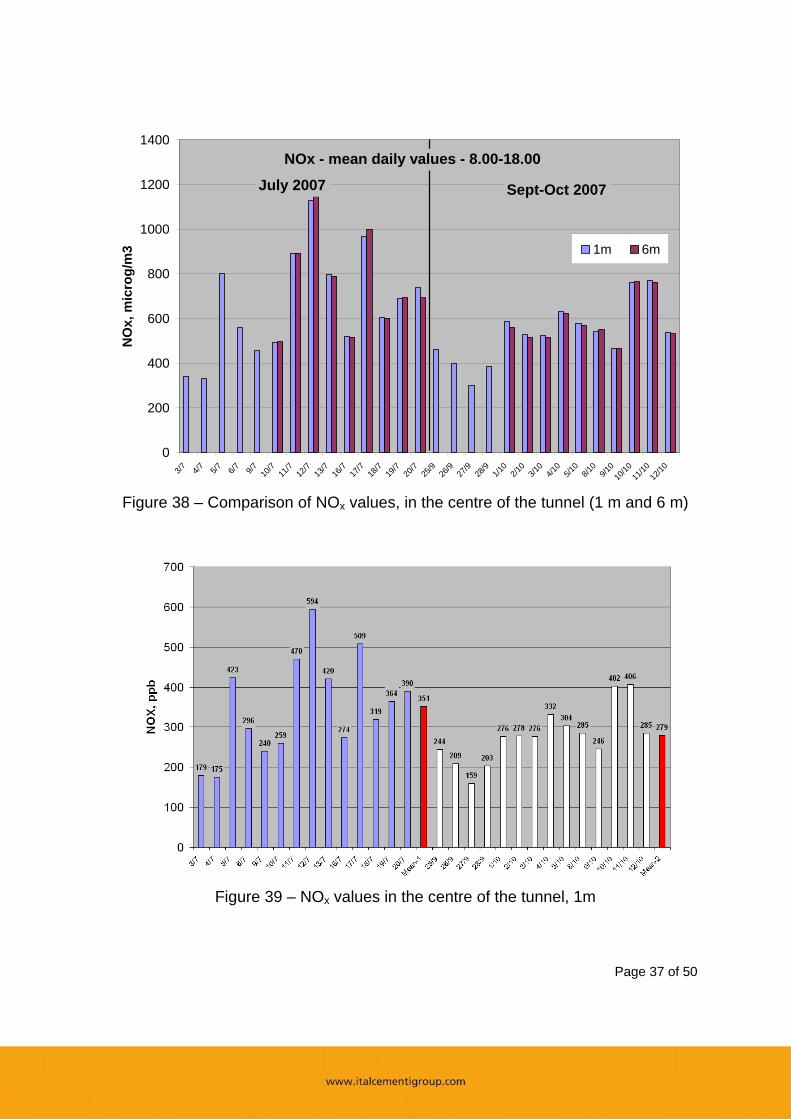
Page 30 of 50
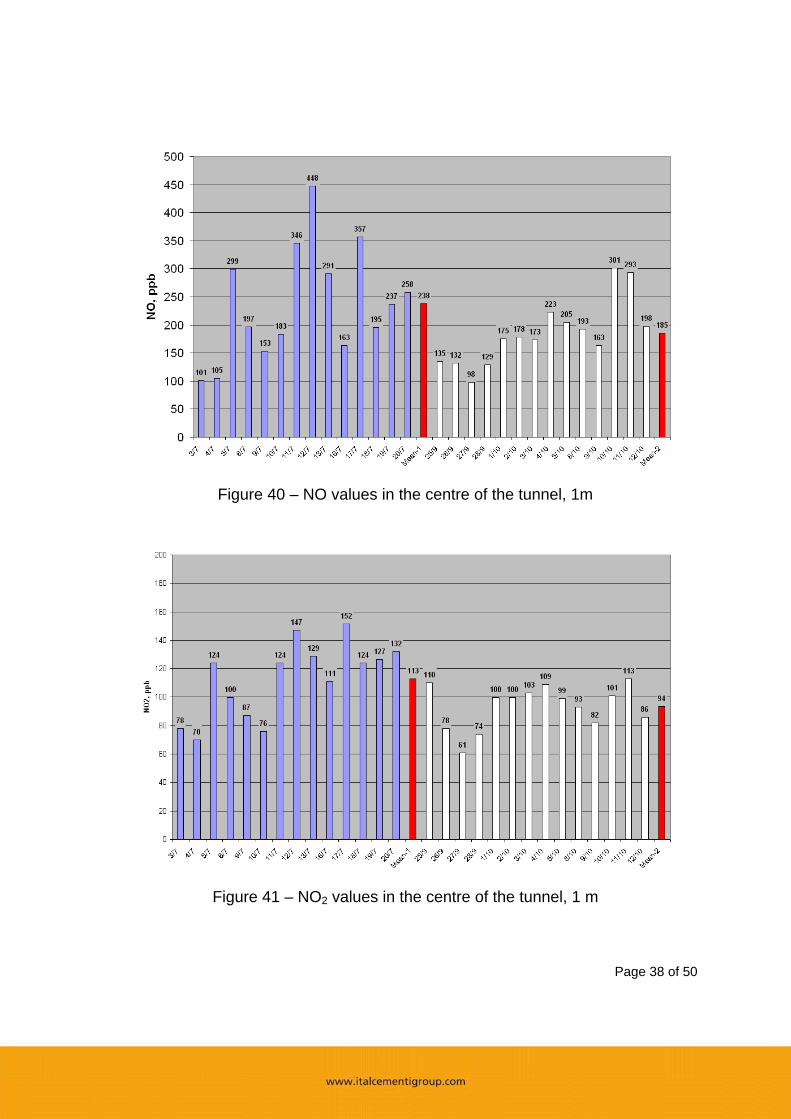
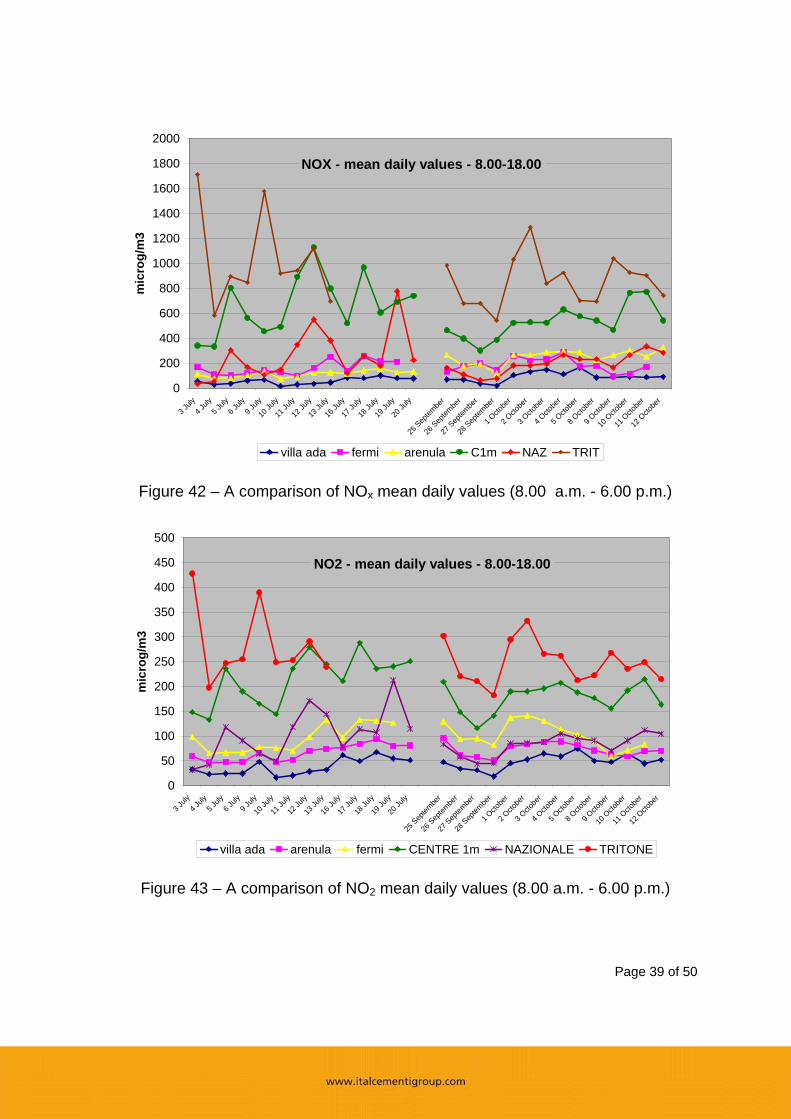
a natural ventilation, due to a “plug effect”, Figure 37. Indeed, there is a homogenization of the gas concentration in the cross-section of the tunnel, which was confirmed by the direct comparison of NOx concentrations at the centre of the tunnel, at two different heights (1 m and 6 m). A slight difference for these values was registered only in occasion of a very windy day (July 20, 2007), Figure 38. As to the values registered in the centre of the tunnel, the reduction of pollution is clear (in absolute value), Figures 39-41. The reduction of average daily values after the tunnel renovation is also clear, if compared with the corresponding values registered in the official stations, Figures 42-43. In particular, values referred to the centre of the tunnel and to the entrance “via del Tritone” clearly decrease, but this reduction is even more significant for the entrance “via Nazionale” as it has the same order of magnitude referred to the “open space” official stations, both for NOx and NO2. Besides, the values of NO2 in the centre of the tunnel are within the reference limit value of 200 mg/m3, defined for outdoor urban situations (and these values are certainly lower if referred to the 24 hr period, in relation to the lower volume of traffic during night hours). Indeed, even if the tunnel situation is critical, as it is a semi-confined zone where an accumulation of pollution can be registered, after the tunnel renovation a better environment is definitively obtained.
Page 31 of 47
Figure 37 – Daily trends of NOx values in the tunnel (from “Via Nazionale” to “Via del Tritone”) – Values in µg/m3
0
200
400
600
800
1000
1200
1400
1600
1800
2000
3/7
4/7
5/7
6/7
9/7
10/7
11/7
12/7
13/7
25/9
26/9
27/9
28/9
1/10
2/10
3/10
4/10
5/10
8/10
9/10
10/1
0
11/1
0
12/1
0
NO
x, m
icro
g/m
3
NAZIONALE CENTRE TRITONE
FIRST CAMPAIGN1st and 2nd WEEK
SECOND CAMPAIGN1st, 2nd and 3rd WEEK
Page 32 of 50
Table 4 – Daily NOx values in the tunnel (µg/m3)
Page 33 of 50
Table 5 – Daily NO values in the tunnel (µg/m3)
Page 34 of 50
Table 6 – Daily NO2 values in the tunnel (µg/m3)
Page 35 of 50
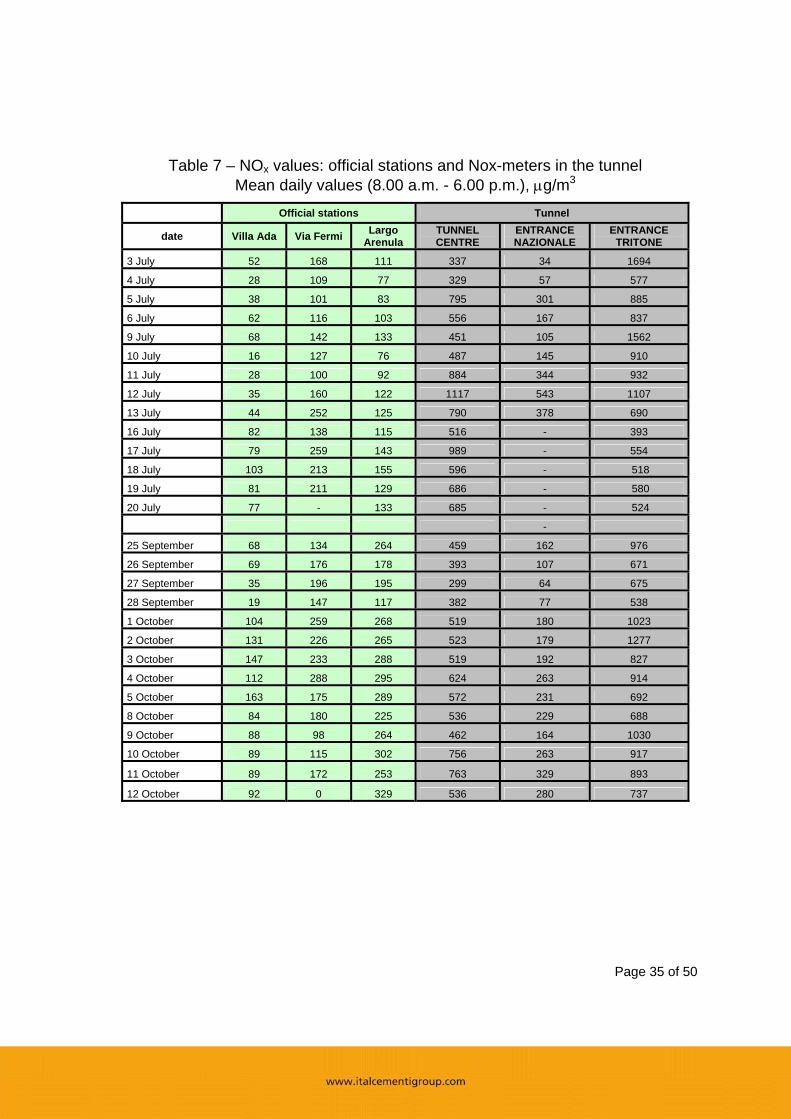
Table 7 – NOx values: official stations and Nox-meters in the tunnel Mean daily values (8.00 a.m. - 6.00 p.m.), µg/m3
Official stations Tunnel
date Villa Ada Via Fermi Largo Arenula
TUNNEL CENTRE
ENTRANCE NAZIONALE
ENTRANCE TRITONE
3 July 52 168 111 337 34 1694
4 July 28 109 77 329 57 577
5 July 38 101 83 795 301 885
6 July 62 116 103 556 167 837
9 July 68 142 133 451 105 1562
10 July 16 127 76 487 145 910
11 July 28 100 92 884 344 932
12 July 35 160 122 1117 543 1107
13 July 44 252 125 790 378 690
16 July 82 138 115 516 - 393
17 July 79 259 143 989 - 554
18 July 103 213 155 596 - 518
19 July 81 211 129 686 - 580
20 July 77 - 133 685 - 524
-
25 September 68 134 264 459 162 976
26 September 69 176 178 393 107 671
27 September 35 196 195 299 64 675
28 September 19 147 117 382 77 538
1 October 104 259 268 519 180 1023
2 October 131 226 265 523 179 1277
3 October 147 233 288 519 192 827
4 October 112 288 295 624 263 914
5 October 163 175 289 572 231 692
8 October 84 180 225 536 229 688
9 October 88 98 264 462 164 1030
10 October 89 115 302 756 263 917
11 October 89 172 253 763 329 893
12 October 92 0 329 536 280 737
Page 36 of 50
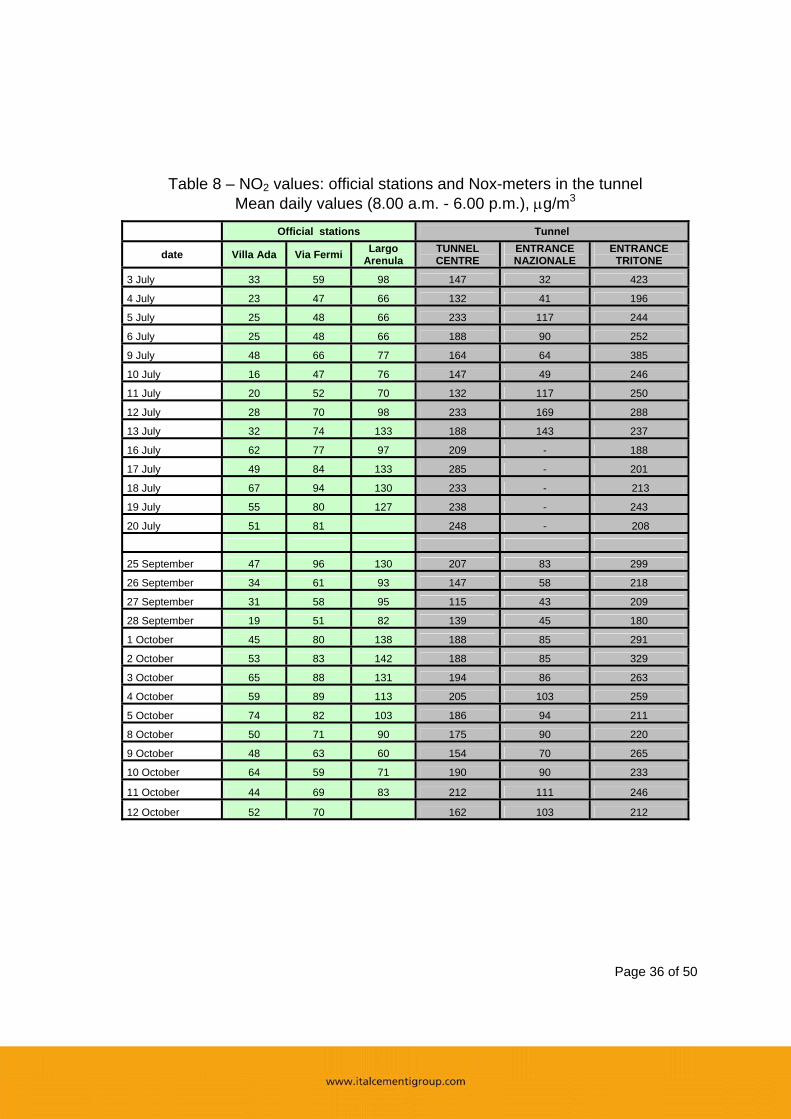
Table 8 – NO2 values: official stations and Nox-meters in the tunnel Mean daily values (8.00 a.m. - 6.00 p.m.), µg/m3
Official stations Tunnel
date Villa Ada Via Fermi Largo Arenula
TUNNEL CENTRE
ENTRANCE NAZIONALE
ENTRANCE TRITONE
3 July 33 59 98 147 32 423
4 July 23 47 66 132 41 196
5 July 25 48 66 233 117 244
6 July 25 48 66 188 90 252
9 July 48 66 77 164 64 385
10 July 16 47 76 147 49 246
11 July 20 52 70 132 117 250
12 July 28 70 98 233 169 288
13 July 32 74 133 188 143 237
16 July 62 77 97 209 - 188
17 July 49 84 133 285 - 201
18 July 67 94 130 233 - 213
19 July 55 80 127 238 - 243
20 July 51 81 248 - 208
25 September 47 96 130 207 83 299
26 September 34 61 93 147 58 218
27 September 31 58 95 115 43 209
28 September 19 51 82 139 45 180
1 October 45 80 138 188 85 291
2 October 53 83 142 188 85 329
3 October 65 88 131 194 86 263
4 October 59 89 113 205 103 259
5 October 74 82 103 186 94 211
8 October 50 71 90 175 90 220
9 October 48 63 60 154 70 265
10 October 64 59 71 190 90 233
11 October 44 69 83 212 111 246
12 October 52 70 162 103 212
Page 37 of 50
0
200
400
600
800
1000
1200
1400
3/7 4/7 5/7 6/7 9/7 10/7
11/7
12/7
13/7
16/7
17/7
18/7
19/7
20/7
25/9
26/9
27/9
28/9
1/10
2/10
3/10
4/10
5/10
8/10
9/10
10/10
11/10
12/10
NO
x, m
icro
g/m
3 1m 6m
NOx - mean daily values - 8.00-18.00
July 2007 Sept-Oct 2007
Figure 38 – Comparison of NOx values, in the centre of the tunnel (1 m and 6 m)
Figure 39 – NOx values in the centre of the tunnel, 1m
Page 38 of 50
Figure 40 – NO values in the centre of the tunnel, 1m
Figure 41 – NO2 values in the centre of the tunnel, 1 m
Page 39 of 50
0
200
400
600
800
1000
1200
1400
1600
1800
2000
3 July
4 July
5 July
6 July
9 July
10 Ju
ly
11 Ju
ly
12 Ju
ly
13 Ju
ly
16 Ju
ly
17 Ju
ly
18 Ju
ly
19 Ju
ly
20 Ju
ly
25 S
eptem
ber
26 S
eptem
ber
27 S
eptem
ber
28 S
eptem
ber
1 Octo
ber
2 Octo
ber
3 Octo
ber
4 Octo
ber
5 Octo
ber
8 Octo
ber
9 Octo
ber
10 O
ctobe
r
11 O
ctobe
r
12 O
ctobe
r
mic
rog/
m3
villa ada fermi arenula C1m NAZ TRIT
NOX - mean daily values - 8.00-18.00
Figure 42 – A comparison of NOx mean daily values (8.00 a.m. - 6.00 p.m.)
0
50
100
150
200
250
300
350
400
450
500
3 July
4 July
5 July
6 July
9 July
10 Ju
ly
11 Ju
ly
12 Ju
ly
13 Ju
ly
16 Ju
ly
17 Ju
ly
18 Ju
ly
19 Ju
ly
20 Ju
ly
25 S
eptem
ber
26 S
eptem
ber
27 S
eptem
ber
28 S
eptem
ber
1 Octo
ber
2 Octo
ber
3 Octo
ber
4 Octo
ber
5 Octo
ber
8 Octo
ber
9 Octo
ber
10 O
ctobe
r
11 O
ctobe
r
12 O
ctobe
r
mic
rog/
m3
villa ada arenula fermi CENTRE 1m NAZIONALE TRITONE
NO2 - mean daily values - 8.00-18.00
Figure 43 – A comparison of NO2 mean daily values (8.00 a.m. - 6.00 p.m.)
Page 40 of 50
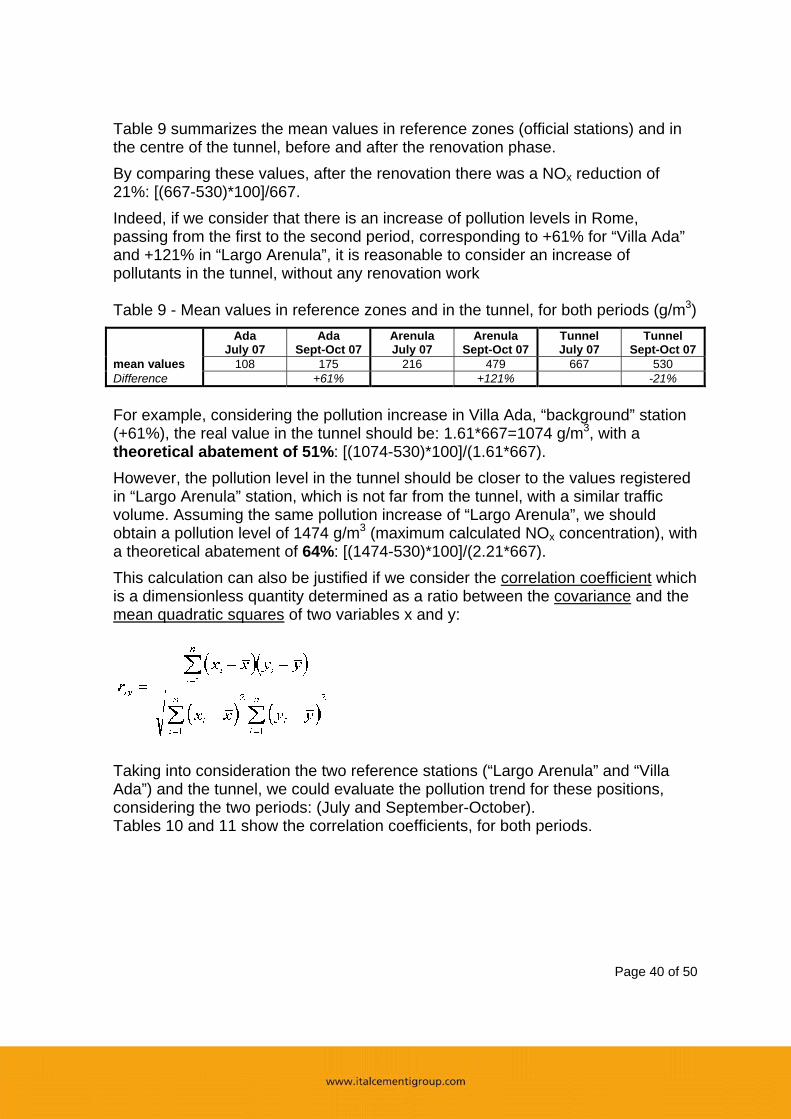
Table 9 summarizes the mean values in reference zones (official stations) and in the centre of the tunnel, before and after the renovation phase. By comparing these values, after the renovation there was a NOx reduction of 21%: [(667-530)*100]/667. Indeed, if we consider that there is an increase of pollution levels in Rome, passing from the first to the second period, corresponding to +61% for “Villa Ada” and +121% in “Largo Arenula”, it is reasonable to consider an increase of pollutants in the tunnel, without any renovation work Table 9 - Mean values in reference zones and in the tunnel, for both periods (g/m3) Ada
July 07 Ada
Sept-Oct 07 Arenula July 07
Arenula Sept-Oct 07
Tunnel July 07
Tunnel Sept-Oct 07
mean values 108 175 216 479 667 530 Difference +61% +121% -21% For example, considering the pollution increase in Villa Ada, “background” station (+61%), the real value in the tunnel should be: 1.61*667=1074 g/m3, with a theoretical abatement of 51%: [(1074-530)*100]/(1.61*667). However, the pollution level in the tunnel should be closer to the values registered in “Largo Arenula” station, which is not far from the tunnel, with a similar traffic volume. Assuming the same pollution increase of “Largo Arenula”, we should obtain a pollution level of 1474 g/m3 (maximum calculated NOx concentration), with a theoretical abatement of 64%: [(1474-530)*100]/(2.21*667). This calculation can also be justified if we consider the correlation coefficient which is a dimensionless quantity determined as a ratio between the covariance and the mean quadratic squares of two variables x and y:
Taking into consideration the two reference stations (“Largo Arenula” and “Villa Ada”) and the tunnel, we could evaluate the pollution trend for these positions, considering the two periods: (July and September-October). Tables 10 and 11 show the correlation coefficients, for both periods.
Page 41 of 50
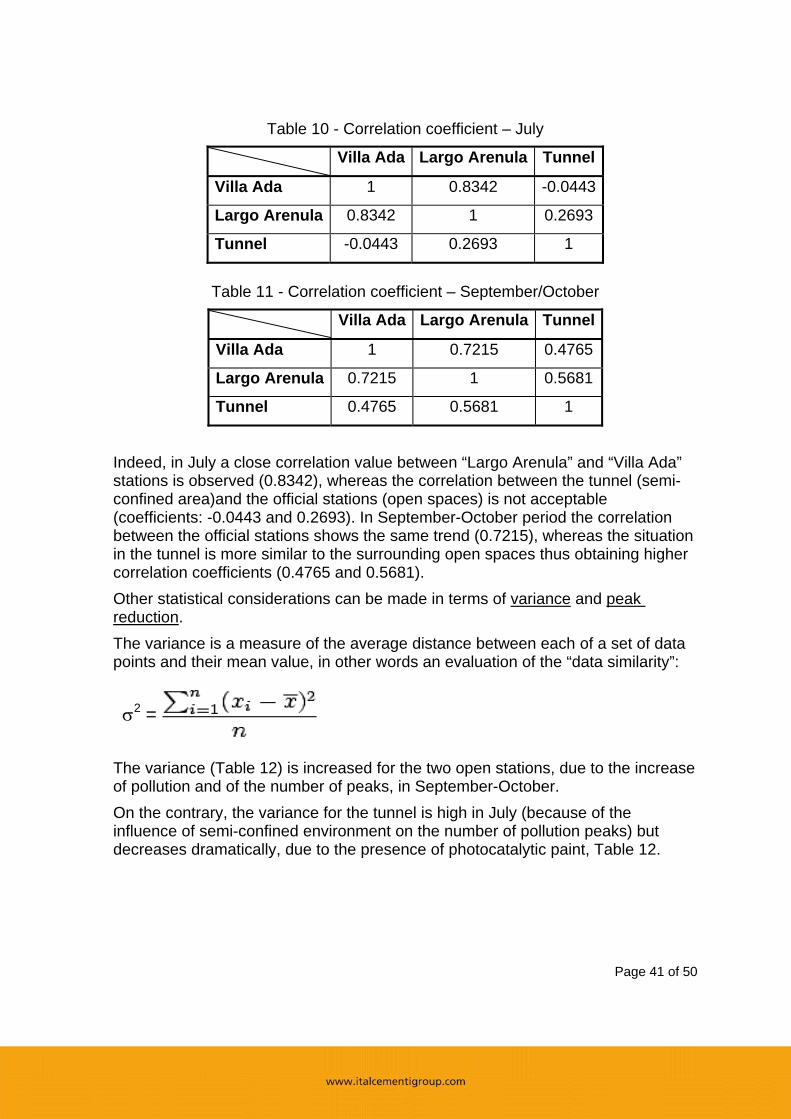
Table 10 - Correlation coefficient – July
Villa Ada Largo Arenula Tunnel
Villa Ada 1 0.8342 -0.0443
Largo Arenula 0.8342 1 0.2693
Tunnel -0.0443 0.2693 1
Table 11 - Correlation coefficient – September/October
Villa Ada Largo Arenula Tunnel
Villa Ada 1 0.7215 0.4765
Largo Arenula 0.7215 1 0.5681
Tunnel 0.4765 0.5681 1
Indeed, in July a close correlation value between “Largo Arenula” and “Villa Ada” stations is observed (0.8342), whereas the correlation between the tunnel (semi-confined area)and the official stations (open spaces) is not acceptable (coefficients: -0.0443 and 0.2693). In September-October period the correlation between the official stations shows the same trend (0.7215), whereas the situation in the tunnel is more similar to the surrounding open spaces thus obtaining higher correlation coefficients (0.4765 and 0.5681). Other statistical considerations can be made in terms of variance and peak reduction. The variance is a measure of the average distance between each of a set of data points and their mean value, in other words an evaluation of the “data similarity”:
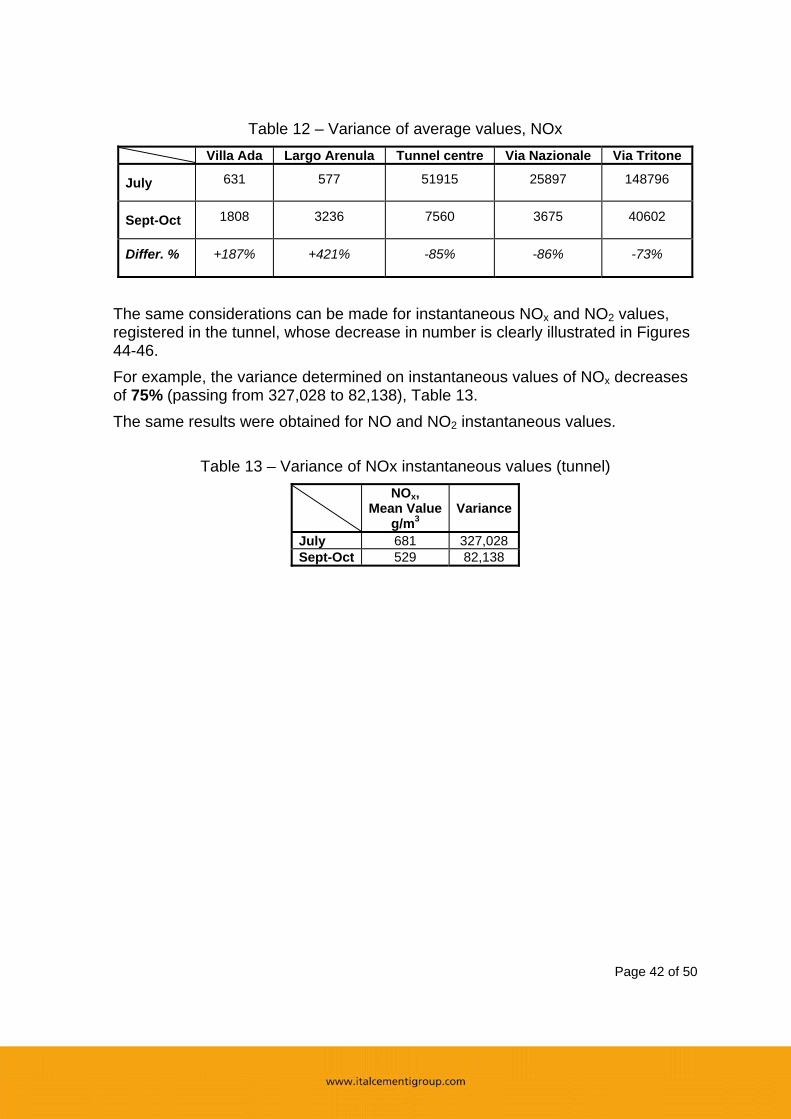
The variance (Table 12) is increased for the two open stations, due to the increase of pollution and of the number of peaks, in September-October. On the contrary, the variance for the tunnel is high in July (because of the influence of semi-confined environment on the number of pollution peaks) but decreases dramatically, due to the presence of photocatalytic paint, Table 12.
σ2 =
Page 42 of 50
Table 12 – Variance of average values, NOx Villa Ada Largo Arenula Tunnel centre Via Nazionale Via Tritone
July 631 577 51915 25897 148796
Sept-Oct 1808 3236 7560 3675 40602
Differ. % +187% +421% -85% -86% -73%
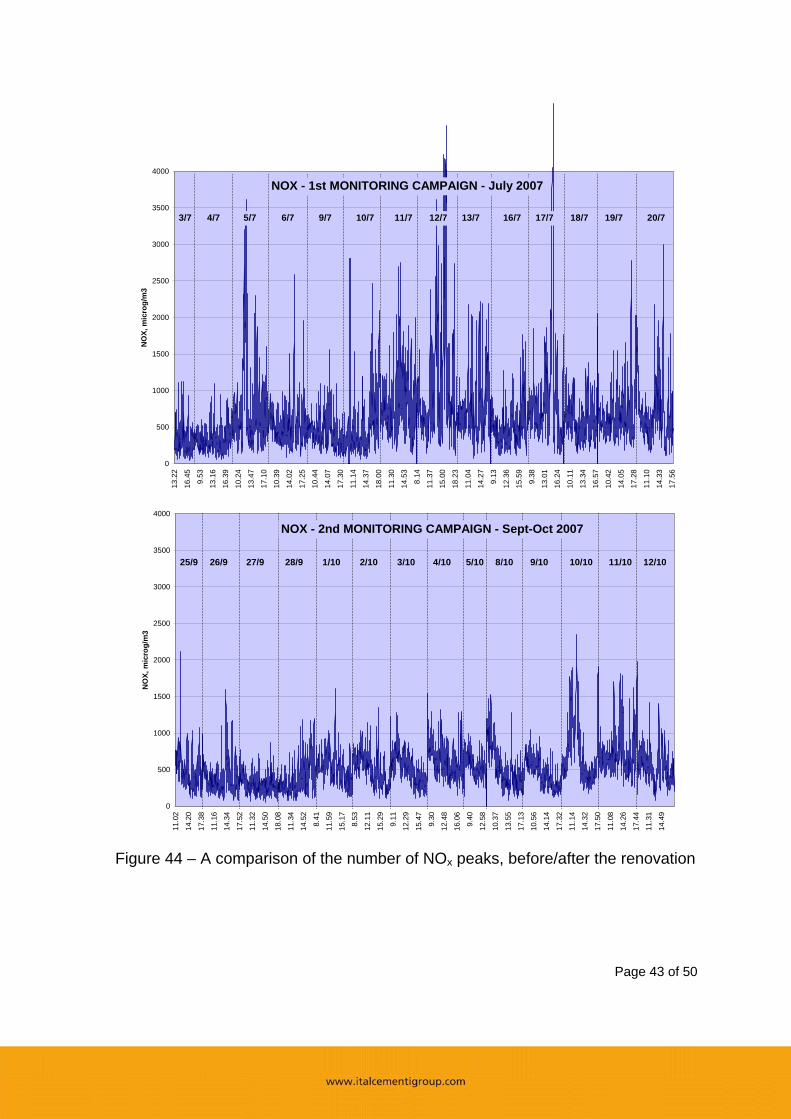
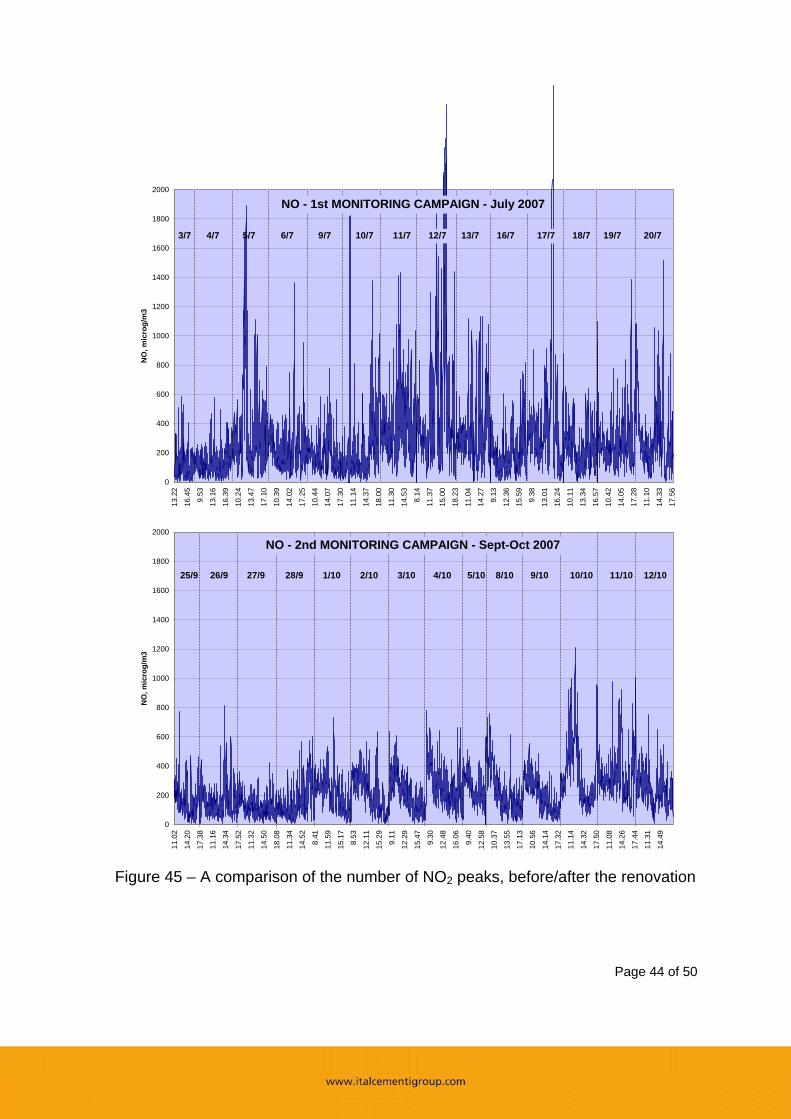
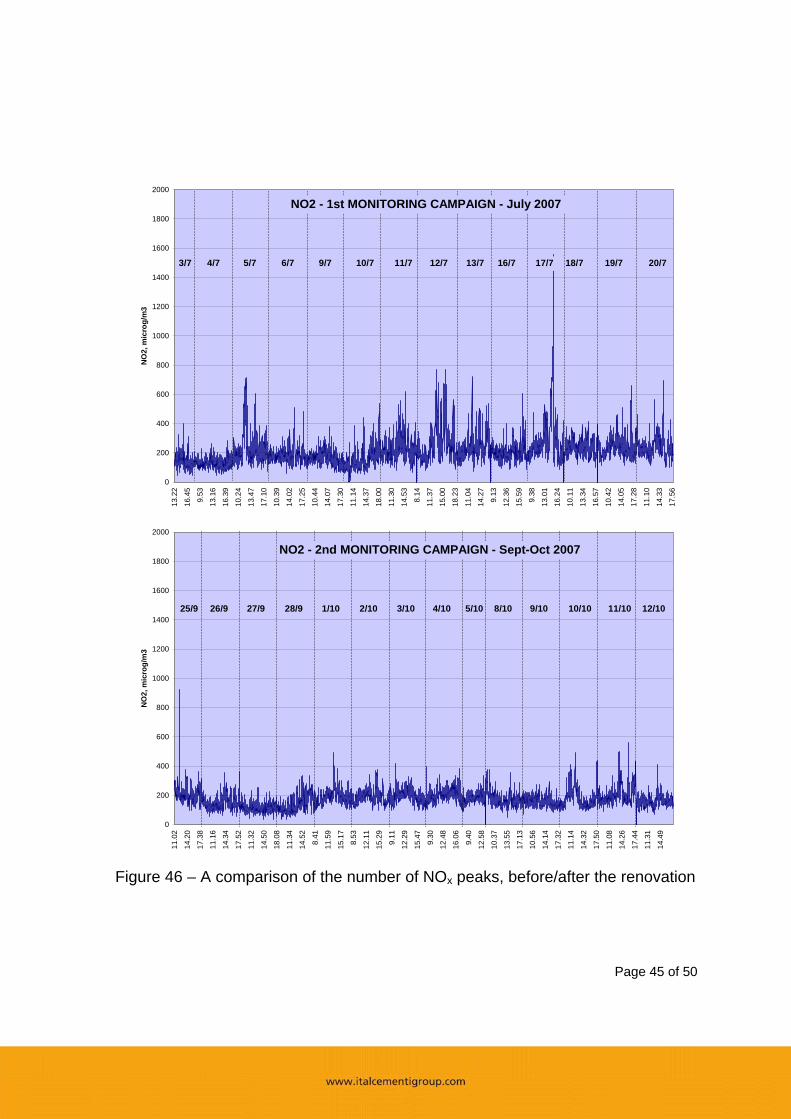
The same considerations can be made for instantaneous NOx and NO2 values, registered in the tunnel, whose decrease in number is clearly illustrated in Figures 44-46. For example, the variance determined on instantaneous values of NOx decreases of 75% (passing from 327,028 to 82,138), Table 13. The same results were obtained for NO and NO2 instantaneous values.
Table 13 – Variance of NOx instantaneous values (tunnel)
NOx,
Mean Valueg/m3
Variance
July 681 327,028 Sept-Oct 529 82,138
Page 43 of 50
0
500
1000
1500
2000
2500
3000
3500
400013
.22
16.4
5
9.53
13.1
6
16.3
9
10.2
4
13.4
7
17.1
0
10.3
9
14.0
2
17.2
5
10.4
4
14.0
7
17.3
0
11.1
4
14.3
7
18.0
0
11.3
0
14.5
3
8.14
11.3
7
15.0
0
18.2
3
11.0
4
14.2
7
9.13
12.3
6
15.5
9
9.38
13.0
1
16.2
4
10.1
1
13.3
4
16.5
7
10.4
2
14.0
5
17.2
8
11.1
0
14.3
3
17.5
6
NO
X, m
icro
g/m
3
NOX - 1st MONITORING CAMPAIGN - July 2007
3/7 4/7 5/7 6/7 10/79/7 11/7 13/712/7 16/7 17/7 18/7 19/7 20/7
0
500
1000
1500
2000
2500
3000
3500
4000
11.0
2
14.2
0
17.3
8
11.1
6
14.3
4
17.5
2
11.3
2
14.5
0
18.0
8
11.3
4
14.5
2
8.41
11.5
9
15.1
7
8.53
12.1
1
15.2
9
9.11
12.2
9
15.4
7
9.30
12.4
8
16.0
6
9.40
12.5
8
10.3
7
13.5
5
17.1
3
10.5
6
14.1
4
17.3
2
11.1
4
14.3
2
17.5
0
11.0
8
14.2
6
17.4
4
11.3
1
14.4
9
NO
X, m
icro
g/m
3
NOX - 2nd MONITORING CAMPAIGN - Sept-Oct 2007
25/9 26/9 27/9 28/9 2/101/10 3/10 5/104/10 8/10 9/10 10/10 11/10 12/10
Figure 44 – A comparison of the number of NOx peaks, before/after the renovation
Page 44 of 50
0
200
400
600
800
1000
1200
1400
1600
1800
2000
13.2
2
16.4
5
9.53
13.1
6
16.3
9
10.2
4
13.4
7
17.1
0
10.3
9
14.0
2
17.2
5
10.4
4
14.0
7
17.3
0
11.1
4
14.3
7
18.0
0
11.3
0
14.5
3
8.14
11.3
7
15.0
0
18.2
3
11.0
4
14.2
7
9.13
12.3
6
15.5
9
9.38
13.0
1
16.2
4
10.1
1
13.3
4
16.5
7
10.4
2
14.0
5
17.2
8
11.1
0
14.3
3
17.5
6
NO
, mic
rog/
m3
NO - 1st MONITORING CAMPAIGN - July 2007
3/7 4/7 5/7 6/7 10/79/7 11/7 13/712/7 16/7 17/7 18/7 19/7 20/7
0
200
400
600
800
1000
1200
1400
1600
1800
2000
11.0
2
14.2
0
17.3
8
11.1
6
14.3
4
17.5
2
11.3
2
14.5
0
18.0
8
11.3
4
14.5
2
8.41
11.5
9
15.1
7
8.53
12.1
1
15.2
9
9.11
12.2
9
15.4
7
9.30
12.4
8
16.0
6
9.40
12.5
8
10.3
7
13.5
5
17.1
3
10.5
6
14.1
4
17.3
2
11.1
4
14.3
2
17.5
0
11.0
8
14.2
6
17.4
4
11.3
1
14.4
9
NO
, mic
rog/
m3
NO - 2nd MONITORING CAMPAIGN - Sept-Oct 2007
25/9 26/9 27/9 28/9 2/101/10 3/10 5/104/10 8/10 9/10 10/10 11/10 12/10
Figure 45 – A comparison of the number of NO2 peaks, before/after the renovation
Page 45 of 50
0
200
400
600
800
1000
1200
1400
1600
1800
2000
13.2
2
16.4
5
9.53
13.1
6
16.3
9
10.2
4
13.4
7
17.1
0
10.3
9
14.0
2
17.2
5
10.4
4
14.0
7
17.3
0
11.1
4
14.3
7
18.0
0
11.3
0
14.5
3
8.14
11.3
7
15.0
0
18.2
3
11.0
4
14.2
7
9.13
12.3
6
15.5
9
9.38
13.0
1
16.2
4
10.1
1
13.3
4
16.5
7
10.4
2
14.0
5
17.2
8
11.1
0
14.3
3
17.5
6
NO
2, m
icro
g/m
3
NO2 - 1st MONITORING CAMPAIGN - July 2007
3/7 4/7 5/7 6/7 10/79/7 11/7 13/712/7 16/7 17/7 18/7 19/7 20/7
0
200
400
600
800
1000
1200
1400
1600
1800
2000
11.0
2
14.2
0
17.3
8
11.1
6
14.3
4
17.5
2
11.3
2
14.5
0
18.0
8
11.3
4
14.5
2
8.41
11.5
9
15.1
7
8.53
12.1
1
15.2
9
9.11
12.2
9
15.4
7
9.30
12.4
8
16.0
6
9.40
12.5
8
10.3
7
13.5
5
17.1
3
10.5
6
14.1
4
17.3
2
11.1
4
14.3
2
17.5
0
11.0
8
14.2
6
17.4
4
11.3
1
14.4
9
NO
2, m
icro
g/m
3
NO2 - 2nd MONITORING CAMPAIGN - Sept-Oct 2007
25/9 26/9 27/9 28/9 2/101/10 3/10 5/104/10 8/10 9/10 10/10 11/10 12/10
Figure 46 – A comparison of the number of NOx peaks, before/after the renovation
Page 46 of 50
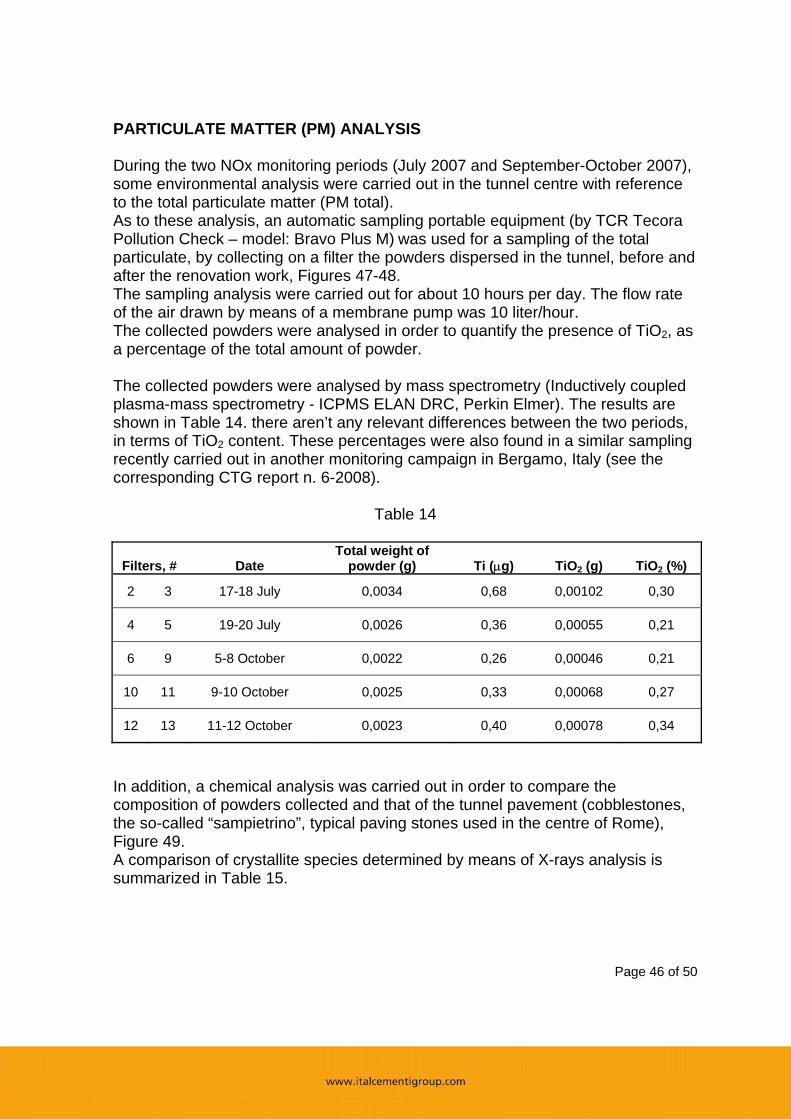
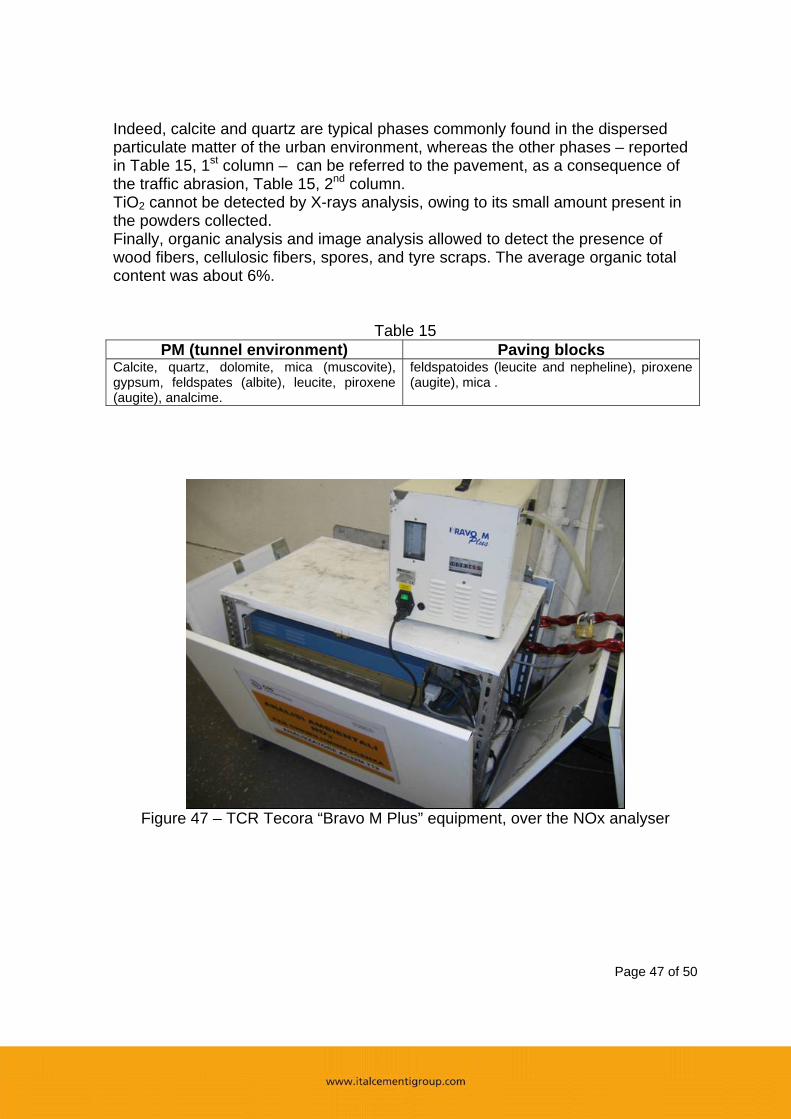
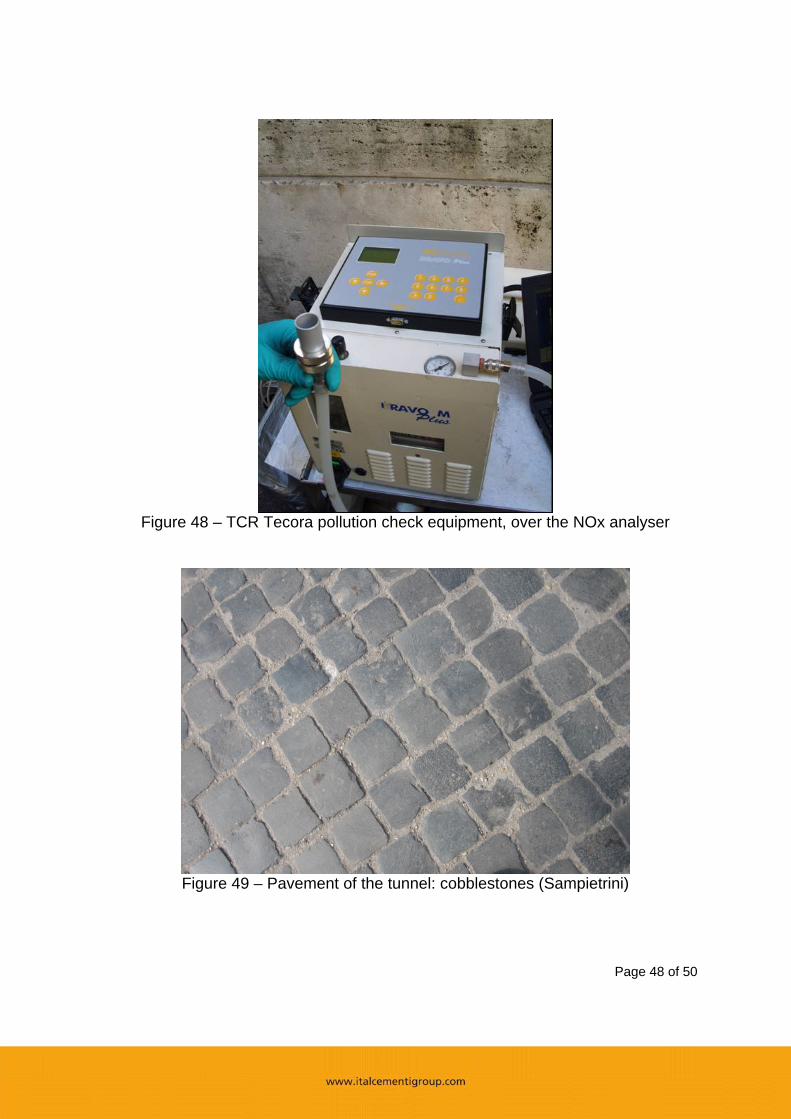
PARTICULATE MATTER (PM) ANALYSIS During the two NOx monitoring periods (July 2007 and September-October 2007), some environmental analysis were carried out in the tunnel centre with reference to the total particulate matter (PM total). As to these analysis, an automatic sampling portable equipment (by TCR Tecora Pollution Check – model: Bravo Plus M) was used for a sampling of the total particulate, by collecting on a filter the powders dispersed in the tunnel, before and after the renovation work, Figures 47-48. The sampling analysis were carried out for about 10 hours per day. The flow rate of the air drawn by means of a membrane pump was 10 liter/hour. The collected powders were analysed in order to quantify the presence of TiO2, as a percentage of the total amount of powder. The collected powders were analysed by mass spectrometry (Inductively coupled plasma-mass spectrometry - ICPMS ELAN DRC, Perkin Elmer). The results are shown in Table 14. there aren’t any relevant differences between the two periods, in terms of TiO2 content. These percentages were also found in a similar sampling recently carried out in another monitoring campaign in Bergamo, Italy (see the corresponding CTG report n. 6-2008).
Table 14
Filters, # Date Total weight of
powder (g) Ti (µg) TiO2 (g) TiO2 (%)
2 3 17-18 July 0,0034 0,68 0,00102 0,30
4 5 19-20 July 0,0026 0,36 0,00055 0,21
6 9 5-8 October 0,0022 0,26 0,00046 0,21
10 11 9-10 October 0,0025 0,33 0,00068 0,27
12 13 11-12 October 0,0023 0,40 0,00078 0,34
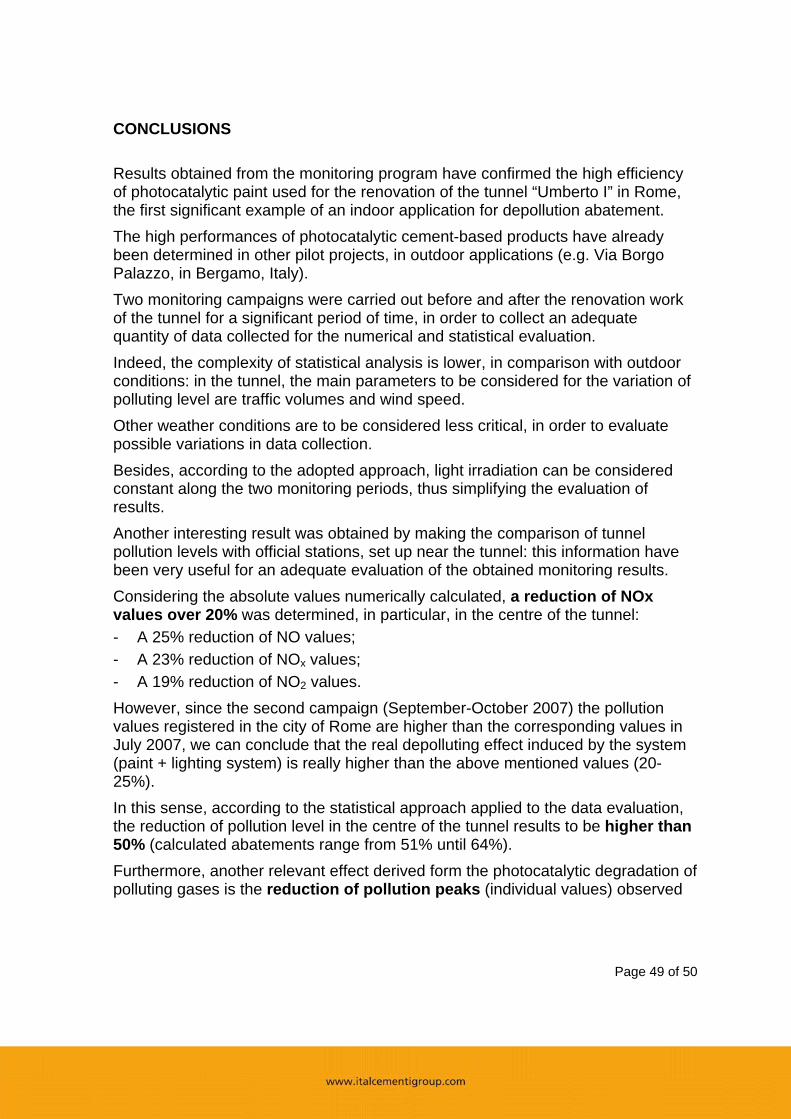
In addition, a chemical analysis was carried out in order to compare the composition of powders collected and that of the tunnel pavement (cobblestones, the so-called “sampietrino”, typical paving stones used in the centre of Rome), Figure 49. A comparison of crystallite species determined by means of X-rays analysis is summarized in Table 15.
Page 47 of 50
Indeed, calcite and quartz are typical phases commonly found in the dispersed particulate matter of the urban environment, whereas the other phases – reported in Table 15, 1st column – can be referred to the pavement, as a consequence of the traffic abrasion, Table 15, 2nd column. TiO2 cannot be detected by X-rays analysis, owing to its small amount present in the powders collected. Finally, organic analysis and image analysis allowed to detect the presence of wood fibers, cellulosic fibers, spores, and tyre scraps. The average organic total content was about 6%.
Table 15 PM (tunnel environment) Paving blocks
Calcite, quartz, dolomite, mica (muscovite), gypsum, feldspates (albite), leucite, piroxene (augite), analcime.
feldspatoides (leucite and nepheline), piroxene (augite), mica .
Figure 47 – TCR Tecora “Bravo M Plus” equipment, over the NOx analyser
Page 48 of 50
Figure 48 – TCR Tecora pollution check equipment, over the NOx analyser
Figure 49 – Pavement of the tunnel: cobblestones (Sampietrini)
Page 49 of 50
CONCLUSIONS
Results obtained from the monitoring program have confirmed the high efficiency of photocatalytic paint used for the renovation of the tunnel “Umberto I” in Rome, the first significant example of an indoor application for depollution abatement. The high performances of photocatalytic cement-based products have already been determined in other pilot projects, in outdoor applications (e.g. Via Borgo Palazzo, in Bergamo, Italy). Two monitoring campaigns were carried out before and after the renovation work of the tunnel for a significant period of time, in order to collect an adequate quantity of data collected for the numerical and statistical evaluation. Indeed, the complexity of statistical analysis is lower, in comparison with outdoor conditions: in the tunnel, the main parameters to be considered for the variation of polluting level are traffic volumes and wind speed. Other weather conditions are to be considered less critical, in order to evaluate possible variations in data collection. Besides, according to the adopted approach, light irradiation can be considered constant along the two monitoring periods, thus simplifying the evaluation of results. Another interesting result was obtained by making the comparison of tunnel pollution levels with official stations, set up near the tunnel: this information have been very useful for an adequate evaluation of the obtained monitoring results. Considering the absolute values numerically calculated, a reduction of NOx values over 20% was determined, in particular, in the centre of the tunnel: - A 25% reduction of NO values; - A 23% reduction of NOx values; - A 19% reduction of NO2 values. However, since the second campaign (September-October 2007) the pollution values registered in the city of Rome are higher than the corresponding values in July 2007, we can conclude that the real depolluting effect induced by the system (paint + lighting system) is really higher than the above mentioned values (20-25%). In this sense, according to the statistical approach applied to the data evaluation, the reduction of pollution level in the centre of the tunnel results to be higher than 50% (calculated abatements range from 51% until 64%). Furthermore, another relevant effect derived form the photocatalytic degradation of polluting gases is the reduction of pollution peaks (individual values) observed
Page 50 of 50
for all NOx gases (NO and NO2), also confirmed by the statistical calculation of the variance for data population. The photocatalytic treatment of the vault is really effective and enables reduce the pollution level up to nearly outdoor conditions, for the city of Rome. In reference with the quantitative chemical analysis of powders sampled with a dedicated equipment, results confirmed that the presence of TiO2 after the renovation work was unchanged. The origin of powder seems to be referred to the abrasion of paving stoned used for the pavement. Gian Luca Guerrini Enrico Peccati
/mb