Embed Size (px)
Citation preview
Performance Analysis September 2009
reg
SOA Performance on Linux
Tuning Hardware Linux and WebSphere for Web Services Service Mediations and Business Processes
Examining the Impact of Server Virtualization and WebSphere Virtual Enterprise on Business Processes in Linux Environment
Khoa Huynh Steve Dobbelstein Mark Peloquin Vivek Kashyap
IBM Systems and Technology Group
SOA Performance on LinuxPage 2
Contents
Abstract 3
1 Introduction 4
2 Background information and performance evaluation methodology 4
21 WebSphere Application Server structure 4
22 WebSphere Process Server environment 5
23 WebSphere Virtual Enterprise environment 5
24 Benchmark 6
3 Systems configurations 9
31 Hardware 9
32 Software 10
4 Performance results 11
41 Tuning Web services 11
42 Tuning routing and transformation service mediations 15
43 Tuning business process management (no clustering) 24
44 Tuning dynamic operations with WebSphere Virtual Enterprise (WVE) 29
5 SOA People entry point 39
6 SOA Information entry point 40
7 Conclusions and recommendations 41
References 46
SOA Performance on Linux Page 3
Abstract reg
This paper examines the service-oriented architecture (SOA) performance in the Linux environment IBM has defined five SOA Foundation entry points to help businesses get started with SOA This paper focuses on the performance tuning for Web services (Reuse entry point) service mediations (Connectivity entry point) and business processes (Process entry point) in the Linux environment The paper also provides some discussion on the two remaining SOA People and Information entry points In addition we
regalso look at the impact of server virtualization and WebSphere Virtual Enterprise dynamic operations on the performance of business processes in the Linux environment WebSphere Virtual Enterprise supports dynamic operations by providing the capability to manage a dynamic cluster of application servers that can be activated on a pool of physical servers in response to changes in the workload mix to
reg regmeet user-defined performance goals We include IBM X-Architecture servers as well as IBM Power servers with PowerVMtrade virtualization technology in our study For performance measurements we use a benchmark that models the business processes and Web services provided for a typical automobile insurance company
SOA Performance on Linux Page 4
1 Introduction IBM has defined five service-oriented architecture (SOA) Foundation entry points to help businesses get started with SOA in their enterprise environment These five entry points are People Process Information Connectivity and Reuse [1] This paper focuses on the following entry points
bull Reuse entry point which is the enablement of Web services and how they can be reused throughout the SOA implementation
bull Connectivity entry point which encompasses the transformation and routing service mediations on the Enterprise Service Bus (ESB)
bull Process entry point which encompasses the Business Process and Service Choreography aspect of SOA
This paper examines how we can tune hardware Linux WebSphere and DB2reg components to achieve
optimal performance for an SOA benchmark that models the Web services business processes and service routing mechanisms for a typical automobile insurance company We will conclude with a set of specific recommendations for each of the SOA entry points Additionally we will briefly discuss the components of the People and Information entry points and provide some references to tuning guides for these entry points
2 Background information and performance evaluation methodology In this paper we evaluate the performance of Web services transformation and routing mediations on the service requests as well as business processes hosted on the WebSphere Process Server (WPS) V61 Let us first discuss some basic WebSphere terminology and structure
WebSphere Process Server is an SCA-compliant runtime element that provides a standards-based process engine [3] The foundation of WPS is the WebSphere Application Server which is the IBM implementation of the Javatrade 2 Enterprise Edition (J2EE) platform which conforms to V14 of the J2EE specifications [2]
21 WebSphere Application Server structure
A base WebSphere Application Server (WAS) installation includes everything needed for a single application server instance Additional server definitions can be logically grouped into nodes A node can contain many application servers but cannot span multiple physical servers A single physical server can have multiple nodes installed on it each with multiple managed application servers Multiple nodes can be grouped together into a node group or into another logical grouping called a cluster A cell contains one or more node groups clusters or both
A WebSphere Network Deployment installation provides centralized administration and workload management for a cell A cell has a master administrative repository that holds the configuration information for all nodes in the cell There is a Deployment Manager through which all nodes in the cell can be managed The Deployment Manager has a graphical interface called the Integrated Solutions Console through which a WebSphere administrator can perform everything from managing a node to deploying an application to any node or cluster in the cell The Deployment Manager communicates to each node through a node agent The node agent which is a specialized application server must be started on a node before the Deployment Manager can find it
WebSphere Virtual Enterprise extends the Network Deployment environment by providing on-demand capabilities that allow a dynamic cluster of application servers to respond in real time to changing workload demands thereby improving the operational efficiency of the servers
SOA Performance on Linux Page 5
22 WebSphere Process Server environment
Every WebSphere Process Server (WPS) environment involves three fundamental layers WPS applications a messaging infrastructure and one or more relational databases More specifically
bull WPS applications include the process server infrastructure code such as the Business Process Choreographer (BPC) and any user applications that exploit the process server functions These applications require a WPS application server to be installed and run
bull A messaging infrastructure is required for WPS and uses four WebSphere Service Integration (SI) buses
o Two buses for the Service Component Architecture (SCA) support (SCASYSTEM and SCAAPPLICATION buses)
o One bus for the BPC (BPC SI bus) o One bus for Common Event Infrastructure (CEI) asynchronous event publishing (CEI
bus)
When an application server (or a cluster of application servers) is added to an SI bus a Message Engine (ME) is created The ME is the component in the WAS process which implements the logic of the messaging infrastructure
bull Relational databases are required for WPS and the messaging infrastructure to store certain application configurations runtime information and persistent data Two main databases must handle much of the traffic in a WPS environment
o The Business Process Choreographer database (BPEDB) which stores data objects related to business processes
o The Service Integration Bus database (SIBDB) which stores data objects for events and message persistence
23 WebSphere Virtual Enterprise environment
In our setup we also use WebSphere Virtual Enterprise (WVE) V61 which provides application server virtualization resource management and a host of advanced operational facilities such as performance and health monitoring This combination of capabilities is sometimes collectively referred to as dynamic operations One key feature of dynamic operations is that they can respond in real time to changes in the workload mix (without human intervention if so desired) to ensure that performance goals set by the user can be met Following are the key elements and features of WVE
bull A dynamic cluster of application servers which run the same applications Applications are first installed and configured on the dynamic cluster They are then propagated to all active application servers in the cluster
bull A service policy that defines a performance goal for one or more applications
bull An On-Demand Router (ODR) which is a gateway through which Web service requests flow to the back-end dynamic cluster of application servers The ODRrsquos primary functions include classification of incoming requests based on rules defined by the user and intelligent request routing based on sense and response mechanisms from the back-end servers
bull A Web server which is placed in front of the ODR as a trusted proxy server In this study we use the IBM HTTP Server
bull Web service requests flow through the Web server and are intelligently routed to active application servers in the dynamic cluster by the ODR based on the performance information collected from the cluster members Workload is balanced across all servers in the cluster to
SOA Performance on Linux Page 6
achieve the performance goals that are specified in the service policy This dynamic workload balancing is based on load distribution service policy and available resources This capability is provided by three autonomic managers associated with the ODR the Application Placement Controller (APC) Dynamic Workload Manager (DWLM) and Autonomic Request Flow Manager (ARFM) They make decisions on health management traffic shaping and application placement for the ODR
Dynamic clustering in the WVE environment involves the clustering of WPS applications and the messaging infrastructure Conceptually the clustering of WPS applications is not very different from clustering plain J2EE applications in the WebSphere Application Server environment WebSphere clustering techniques in the static environment are also applicable to the dynamic WVE environment These techniques are discussed in Clustering WebSphere Process Server V602 Part 1 Understanding the topology [4] however the messaging infrastructure is significantly more complex
If a cluster of application servers is added to a Service Integration (SI) bus each server in the cluster is capable of running the Message Engine (ME) created for that cluster However only one server can have an active instance of the Message Engine at any given time A Message Engine can be configured to work with WPS applications by using two approaches
bull The Message Engine is local to the cluster of WPS applications In this case the ME runs within the same application cluster as the WPS applications
bull The Message Engine is located in its own cluster separate from the WPS applications This is also called the ldquoSilverrdquo topology in a classification of WebSphere clustering topologies [4]
In this study we consider both approaches
24 Benchmark
In this study we use a benchmark that models the business processes and Web services that are provided for a typical automobile insurance company [10] The benchmark specifies a macro workload whose driver can generate an end-to-end workload similar to that of an actual production system in an SOA environment Figure 21 shows the components of the benchmark
The benchmark makes extensive use of IBM SOA platform products in the following areas bull Enablement of Web services using IBM WebSphere Application Server (WAS) bull Business process choreography using integration and choreography features of IBM WebSphere
Process Server (WPS) bull Integration of Web services using IBM WebSphere Enterprise Service Bus (WESB) or
DataPower appliances
Each of the areas mentioned above can be included or excluded from performance evaluations The use of DataPower appliances is out of the scope of this paper
In the benchmark the Web services are implemented as part of a ClaimServices application These Web services represent typical services that are involved in the processing of an automobile insurance claim such as creating a claim updating a claim approving or denying a claim checking insurance coverage generating a list of approved repair shops selecting a repair shop and informing the customer Some business logic is embedded in the implementation of these services However the presence of business logic might hinder us in evaluating the performance of the underlying middleware layers supporting Web services as well as investigating potential problems that might occur As a result we decided to run the benchmark in Infrastructure Mode which keeps the business logic in the Web services to a minimum it only performs minimal calculations and returns responses
BusinessData
CallClaimService
Handle ClaimProcess
(Macro flow)
Handle Claimprocess
(micro flow)
Web servicebinding
Claim Service
Fraud CheckSCA component
Business Processes Service Choreography
Claim ApprovalBusiness Rule
EnterpriseService Bus
Mediations
Route transform andadapt requests
Claim serviceimplementation(Web service)
Service providers
CallClaimService
Mediations
Route transform andadapt requestssts
Claim serviceimplementation(Web service)
Service providers
SOA Performance on Linux Page 7
Submit Claim
Workload Driver
Simulate service
requestors
Human Tasks Simulator
Adjuster
Underwriter
ndash
Call center
Process Human Tasks
Business Data
SubmitClaim
Workload Driver
Simulateservice
requestors
Human TasksSimulator
Adjuster
Underwriter
Handle Claim Process
(Macro flow)
Handle Claim process
(micro flow)
Web service binding
Claim Service
Fraud Check SCA component
Business Processes Service Choreography
Claim Approval Business Rule
Enterprise Service Bus
Mediations Route transform and
adapt reque
Claim service implementation (Web service)
Service providers
ndash
Call center
ProcessHuman Tasks
Figure 21 ndash Architecture of benchmark used in our evaluation
For service mediations we consider both routing and transformation mediations Transformation mediations can be performed on service requests and in some cases responses using Extensible Stylesheet Language Transformations (XSLT) XSLT is an XML-based language used for the transformation of XML documents into other XML or human-readable documents There are different levels of complexity for these transformations and we will consider the following
bull XSLT Value Transformation which transforms the value of a single element in the service request message using XSLT
bull XSLT Namespace Transformation which transforms service requests and responses from one schema to another using XSLT In this case the schemas are largely the same but the name of an element differs and the two schemas have different namespaces
bull XSLT Schema Transformation which transforms service request and response messages from one schema to another using XSLT In this case the schemas are completely different but they contain similar data which is mapped from one to the other In addition to the transformation a value from the service request is transferred to the response message by storing it in a context header
bull Composite Module mediation consists of three mediation primitives wired together inside a single composite mediation module The three mediation primitives are authorization (a routing mediation that checks a password field in the body of the service request) route on body and transform The composite module approach is good for performance because it saves the overhead of inter-module calls but at the expense of the ability to individually administer the pieces of the overall mediation
Routing mediations route requests to different Web services based on content In particular we will examine route-on-body mediation which routes each request to the appropriate Web service based on the content of a field in the body of that request
The processing of auto insurance claims is done through a Business Process Execution Language (BPEL) application called HandleClaim Figure 22 illustrates the HandleClaim application which is implemented using the business process choreography features that are provided by WebSphere Process Server (WPS) After a customer submits a claim the HandleClaim process calls an SCA component called FraudCheck to determine whether the claim is fraudulent or not If a claim is
CreateClaim
CreateClaim
Fraudcheck
Fraudcheck
as
CompleteClaim
CompleteClaim
UpdateClaim
Bus RuleClaimlt$500
CreateClaim
Fraudcheck
CompleteClaim
SOA Performance on Linux Page 8
fraudulent it is rejected and the processing of the claim is completed On the other hand if the claim is found to be valid an Adjuster is called upon to evaluate and update the claim Next there is a business rule which determines whether the value of the claim is less than $500 If so the claim is approved automatically otherwise it would have to be approved in person by an Underwriter The actions of Adjusters and Underwriters are simulated by another application ndash the HumanTaskSimulator ndash which polls and performs the roles of adjusters and underwriters After much experimentation we found that setting the parameters of the HumanTaskSimulator to the following values was more than adequate for the workloads considered in this study
bull Number of adjusters = 30 bull Number of underwriters = 20 bull Polling period for adjusters = 200 ms bull Polling period for underwriters = 400 ms
After a claim is approved a check is sent to the customer and the processing of the claim is completed The underlying business logic of the claim services such as creating updating rejecting approving and completing a claim is performed by calling the Web services implemented in the ClaimServices application In Figure 22 the claim services are represented by the rectangular boxes in blue
The benchmarkrsquos Workload Driver is a stand-alone multithreaded HTTP client which can generate concurrent insurance claim requests to the HandleClaim application using the Service Oriented Access Protocol (SOAP) implemented on top of the HTTP transport protocol [9]
Figure 22 ndash Insurance claim processing workflows
In this paper we consider both IBM X-Architecture and IBM Power Architecturereg server platforms
In most of our tests we start warm-up runs (which can take as long as 300 seconds depending on the workload level) prior to actual data collection to ensure optimal and consistent results Warm-up runs
Policy holder Submits claim
Underwriter ndash Approves Denies Claim (Human
T k)
Adjuster Evaluates
Claim (Human Task)
Fraud Check (SCA call)
Approve Claim (send check)
Yes Auto
Approval
Reject Claim
Auto accident
Is Claim Valid
Manual Approval
No
Calls to Claim Services
Create Claim
Fraud check
Policy holderSubmits claim
Underwriter ndashApproves Denies Claim (Human
Task)
AdjusterEvaluates
Claim (HumanTask)
Fraud Check(SCA call)
Approve Claim(send check)
YesAuto
Approval
RejectClaim
Auto accident
Is ClaimValid
ManualApproval
No
Complete Claim
Update Claim
Bus Rule Claim lt$500
Calls to Claim Services
SOA Performance on Linux Page 9
were especially needed because by default the IBM Java Virtual Machine (JVM) in WebSphere Application Server uses a higher optimization level for compiles thus resulting in faster runtime performance but at the expense of slower server startups
3 Systems configurations
31 Hardware
As mentioned previously we consider both IBM X-Architecture and Power Architecture server platforms for hosting the benchmarkrsquos Web services and business processes
311 IBM X-Architecture servers
In this study we employ the IBM System x3850 M2 (Table 31) which implements the IBM eX4 chipset [78] to host WebSphere DB2 and the benchmarkrsquos Web services and business process components
Server IBM System x3850 M2
CPU 4 x 64-bit Quad-Core Intelreg Xeonreg Processor X7350 (293 GHz)
Memory 64 GB (667 MHz DDR2)
Network Integrated Dual-Port Gigabit Ethernet with TCPIP offload engine
Table 31 ndash IBM System x3850 M2 configuration
The benchmarkrsquos Workload Driver runs on an IBM System x3650 (Table 32)
Workload Driver IBM System x3650
CPU 2 x 64-bit Quad-Core Intel Xeon X5460 (316 GHz)
Memory 24 GB (667 MHz DDR2)
Network Integrated Dual-port Gigabit Ethernet
Table 32 ndash IBM System x3650 configuration
312 IBM Power architecture servers
For the Power platform we use an IBM Power 570 (Table 33) [5] with POWER6trade processors [6] to host WebSphere and the benchmarkrsquos applications in some tests and two IBM OpenPowerreg 720 servers (Table 34) [11] with POWER5trade processors in other tests
Server IBM Power 570
CPU 2 x 64-bit Dual-Core IBM POWER6 (47 GHz) 4 MB L2 cache per core 32 MB L3 cache shared per two cores
Memory 32 GB (667 MHz DDR2)
Network Dual-Port Gigabit Ethernet
Internal Storage 1 x SAS controller with 2 x 300 GB 15K rpm SAS drives
Threading Simultaneous multi-threading (SMT) technology
Table 33 ndash IBM Power 570 configuration
SOA Performance on Linux Page 10
Server IBM OpenPower 720
CPU 2 x 64-bit Dual-Core IBM POWER5 (15 GHz) 19 MB L2 cache 36 MB L3 cache
Memory 16 GB
Network Dual-Port Gigabit Ethernet
Internal Storage 1 x SAS controller with 4 x 36 GB 72 GB 15K rpm SAS drives
Threading Simultaneous multi-threading (SMT) technology
Table 34 ndash IBM OpenPower 720 configuration
All servers are connected to a Cisco Systems Catalyst 3750 Series Gigabit Switch (Model WS-C3750G-24TS-S)
32 Software
The Linux operating system on the IBM System x3850 M2 server is Novell SUSE Linux Enterprise Server (SLES) 10 Service Pack (SP) 1 for AMD64 and EM64T (x86_64)
The Linux operating system on the IBM Power 570 and OpenPower 720 is Novell SUSE Linux Enterprise Server (SLES) 10 Service Pack (SP) 1 for PPC (ppc64)
The operating system on the workload driver system (IBM System x3650) is Novell SUSE Linux Enterprise Server (SLES) 10 Service Pack (SP) 2 for AMD64 and EM64T (x86_64)
All servers run with WebSphere Application Server (WAS) V61017 WebSphere Process Server V6102 and WebSphere Virtual Enterprise V6104
SOA Performance on Linux Page 11
4 Performance results First let us look at how we can tune Linux and WebSphere components for Web services We then examine how we can tune those components for routing and transformation mediations on Web services Finally we discuss how to create an optimal environment for business processes using those Web services
41 Tuning Web services
For tuning Web services let us consider the setup illustrated in Figure 411 The Workload Driver generates Web service requests to the benchmarkrsquos ClaimServices application using the Service Oriented Access Protocol (SOAP) implemented on top of the HTTP transport protocol [9] The Workload Driver uses up to 50 concurrent threads to generate as many service requests as the ClaimServices application can handle The server that hosts the Web services (that is the one that runs WPS and the ClaimServices application) is an IBM Power 570 server with POWER6 processors Alternatively we also configure an x86 server ndash an IBM x3850 M2 server ndash as the Web server While we focus on the performance results obtained on the Power 570 server we will note the performance data obtained on the x3850 M2 server as well The Workload Driver runs on a separate x86 server (an IBM x3650)
Figure 411 ndash Setup for tuning Web services
Figure 412 shows the geometric means of the service request rates obtained for each of the tuning items considered in this section
Figure 412 ndash Performance impact of tuning items
SOA Performance on Linux Page 12
bull Out-of-the-box configuration The leftmost column in Figure 412 shows the geometric mean of the Web service request rates in the out-of-the-box configuration ndash with all default settings for WebSphere Application Server and Linux Note that administrative security is enabled in the default profile for WebSphere Application Server Enforcing security involves additional overhead for authentication and access validation
Result This configuration has a geometric mean score of 725490 requests per second on the Power 570 server
bull Without administrative security As mentioned previously administrative security is enabled in the default profile for WebSphere Application Server Enforcing security involves additional overhead for authentication and access validation If there is no requirement to enforce administrative security it is better to create a WebSphere Application Server profile with administrative security disabled
Result As shown in Figure 412 the geometric mean score is 744544 requests per second on the Power 570 server ndash a 26 improvement over the out-of-the-box configuration On an x86 server (x3850 M2) disabling administrative security yields an 86 improvement over the out-of-the-box configuration
bull JVM heap tuning In the Java world the JVM heap configuration has a significant impact on performance Several parameters are available for tuning the JVM heap for better performance Two basic JVM heap parameters are the size of the heap and the garbage collection policy
The size of the WAS JVM heap is probably the most important factor for its performance A too-small heap causes garbage collection to happen more frequently A too-large heap causes garbage collection to happen less frequently or to take longer to compact the large heap There are several tools available such as the Tivolireg Performance Viewer (included with WebSphere) that can help analyze and monitor the heap usage and garbage collection so that the heap can be specifically tuned for a particular workload
The default size of the JVM heap is typically too small In our tests by looking at the number of memory pages allocated to the heap that are actually in use while the Web service scenarios are being run we find that the heap usage is between 1536 MB and 2048 MB As a result we set the JVM heap size to 2048 MB This larger heap gives us a significant performance improvement over the default heap size Because the Power 570 server has 32 GB of physical memory which is more than adequate for our tests we set the minimum and maximum heap size to the same value (2048 MB) to avoid the overhead of frequent heap size changes and to ensure optimal performance
In addition to the JVM heap size the garbage collection policy can also affect performance The WAS JVM supports four different garbage collection policies The default garbage collection policy is optthruput During a garbage collection cycle under the optthruput policy all application threads are stopped for mark sweep and compaction if needed The garbage collector scans all the objects in the heap marking any object that is in use sweeps up the unused objects reclaims their memory and then compacts the remaining memory to reduce fragmentation The entire process can take some time All application threads are paused while the garbage is collected Consequently the optthruput policy results in longer garbage collection pause times but more often than not it yields the best overall throughput However we decided to use the gencon (Generation Concurrent) garbage collection policy which handles short-lived objects differently from long-lived objects because our testing shows that the gencon policy is more suitable for Web service scenarios Under the gencon policy the heap is split into new and old segments Long-lived objects are promoted to the old space while short-lived objects are garbage collected quickly in the new space (called a nursery)
We set the size of the nursery to 1536 MB (75 of the total heap size) by going through the WAS
SOA Performance on Linux Page 13
Administration Console
1 Go to Servers rarr Application Servers rarr server name rarr Server Infrastructure rarr Java and Process Management rarr Process Definition rarr Additional Properties rarr Java Virtual Machine
2 Enter ndashndashndashndash Xgcpolicygencon ndashXmn1536M in the Generic JVM arguments field Note that the JVM heaprsquos maximum and minimum sizes can also be set on this page In our test both the minimum and maximum heap sizes were set to 2048 MB
Result The WAS JVM Heap Tuning column in Figure 412 shows the geometric mean of the Web service request rates on the Power 570 server with the WAS JVM heap size of 2048 MB gencon garbage collection policy and a 1536 MB nursery The geometric mean score is
979722 requests per second ndash an improvement of more than 35 over the out-of-the-box configuration On an x86 server (x3850 M2) increasing the WAS JVM heap size to 2048 MB results in a 75 performance improvement over the out-of-the-box configuration and switching the garbage collection policy to gencon yields another 7 performance gain
bull Huge page support in Linux One of the factors to consider in system performance is memory
access Processors keep a cache of mappings from virtual addresses to physical addresses in a translation look-aside buffer (TLB) so that they do not have to walk through the page tables for every virtual address used The TLB holds a fixed number of entries When the processor encounters a virtual address that is not in the TLB called a TLB miss it must walk the virtual address through the page tables to get its physical address The new mapping is then written to the TLB overriding an existing entry Linux has support for huge pages (sometimes also known as large pages) Normal pages are 4 KB in size but the size of each huge page is 16 MB in the Power architecture and 2 MB in the Intel x86 architecture The use of huge pages can improve memory performance in two ways First with huge pages a single entry in the TLB maps to more memory therefore fewer TLB entries are needed to map an area of memory With fewer TLB entries the frequency of TLB misses is reduced Secondly the page table setup for mapping huge pages uses one less table to determine the physical addresses thus making virtual-to-physical-address mapping for huge pages faster than for normal pages Since the WAS JVM heap size is set to 2048 MB (larger than the default size) the CPU overhead of managing and keeping track of memory in this large heap can be reduced by exploiting the huge page support that is provided in the Linux kernel To allow WAS JVM heap to use huge pages we must first enable Linux to create and maintain a pool of huge pages On the Power 570 server we created a pool of 3 GB of huge pages (a total of 192 of 16 MB huge pages) by adding the following lines to the etcsyscltconf file Number of huge pages (192 x 16 MB = 3 GB)
vmnr_hugepages = 192
Size of shared memory is set to 4 GB (4294967296 bytes)
kernelshmmax = 4294967296
kernelshmall = 4294967296
(Note that we set the amount of shared memory to 4 GB so that there would be enough room for the 3 GB of huge pages in the shared memory pool) Result The Huge Page Support column in Figure 412 shows the result that is obtained by exploiting the Linux huge page support on the Power 570 server The geometric mean of the Web service request rates is now 999953 requests per second which is another 21 improvement over what we are able to achieve by tuning the WAS JVM heap Cumulatively the WAS JVM heap tuning and the huge page support yield a total of 38 performance improvement over the out-of-the-box configuration on the Power 570 On an x86 (x3850 M2) server with the huge page size of only 2 MB we find that huge pages only help when the Java heap is
SOA Performance on Linux Page 14
constrained to a size that cannot accommodate all objects if the heap could be made large enough huge pages would not make much difference
bull HTTP connection settings Several WAS Web Container settings can be tweaked for maximum concurrency in our tests If there are not enough HTTP connections available incoming clients cannot connect until a connection is freed If the servers CPUs are not fully utilized if there is no memory constraint and if there is available network bandwidth the number of persistent HTTP connections for each port can be increased from the default value of 100 for better performance In our tests setting the maximum number of HTTP persistent requests to unlimited gave us a noticeable performance improvement over what we had with WAS JVM tuning and huge page support The results are shown in Figure 412
To change the number of HTTP connections available for a given port we used the WAS Administration Console as follows
1 Go to Servers rarr Application Servers rarr server name rarr Communications and click Ports
2 Find the port number in the table and click on View associated transports for that port 3 Click on the transport chain that is listed 4 Click on HTTP inbound channel (HTTP_n) where n denotes channels 1 to 4 5 Either click on Maximum persistent requests per connection and enter a number in the
Specify maximum number of persistent requests field or click Unlimited persistent requests per connection
Result As shown in the Unlimited HTTP Connections column in Figure 412 the geometric mean of the Web service request rates on the Power 570 is 1060797 requests per second which is another 61 improvement over what we are able to achieve by tuning the WAS JVM heap and exploiting the huge page support Together with the WAS JVM heap tuning and huge page support the Unlimited HTTP connection setting cumulatively yields a total of 46 performance improvement over the out-of-the-box configuration on the Power 570 server On an x86 (x3850 M2) server the Unlimited HTTP connection setting produces an 83 improvement
bull Thread pool settings There is another area that we can tune for maximum concurrency the number of threads available to service requests from the clients For example threads in the Web Container thread pool are used for handling incoming HTTP and Web service requests These thread pools are shared by all applications that are deployed on the server so in many cases these pools need to be larger than their default sizes We experiment with larger maximum numbers of threads in the default thread pool as well as the Web container thread pool These numbers partly depend on the number of CPUs on the Web server because the more CPUs we have the more threads can be executed concurrently In our test setup the Power 570 server has two dual-core POWER6 processors and if we take simultaneous multi-threading (SMT) into account we would actually have eight logical processors that can be seen by Linux Based on recommendations from the WebSphere Performance Team with eight logical processors we set the maximum number of threads in the default thread pool to 200 (default value is 20) and in the Web container thread pool to 100 (default value is 50) However we find that in our tests just increasing the thread pool maximum values alone would actually degrade the performance because the JVM heap would become too small to accommodate the higher number of threads that can be executed concurrently To get any performance benefit from the larger thread pools we would need a larger JVM heap Our test results confirm that larger thread pools together with a larger 3-GB JVM heap yield a small but noticeable performance improvement
Changing the number of threads in a thread pool can be done through the WAS Administration Console as follows
1 Go to Servers rarr Application Servers rarr server name rarr Additional Properties rarr Thread Pools
SOA Performance on Linux Page 15
2 Click the thread pool that you want to change and enter new values in the Maximum Size fields
Result The Thread Pool Tuning column in Figure 412 shows the cumulative performance impact of WAS JVM heap tuning (including the larger 3-GB heap) huge page support Web container tuning and larger thread pools on the Web services (in terms of average requests per second) The geometric mean of the Web service request rates on the Power 570 is now 1079384 requests per second ndash another 18 improvement over what the preceding configuration All of our tuning items so far have yielded a total of 49 performance improvement over the out-of-the-box configuration on the Power 570 server On the x3850 M2 server however we find that larger thread pools do not make much performance difference
bull Disabling Performance Monitoring Infrastructure (PMI) To further optimize the performance of Web services in our tests we next turned off all performance monitoring tracing and logging These are often necessary when setting up a server or when debugging problems or issues but they do introduce some performance overhead As a result it is recommended that tracing and monitoring be used judiciously and whenever possible turned off entirely to ensure optimal performance Disabling the WAS Performance Monitoring Infrastructure (PMI) can be done through the WAS Administration Console as follows
1 Go to Monitoring and Tuning rarr Performance Monitoring Infrastructure (PMI) rarr server name
2 Clear the Enable Performance Monitoring Infrastructure (PMI) box and in the Currently Monitored Statistic Set box select None
Result The Disabling PMI column in Figure 412 shows the performance of Web services when we disable all performance monitoring tracing and logging (on top of the previous tunings that we have done) The geometric mean of the Web service request rates on the Power 570 is now 1087847 requests per second ndash another 08 improvement over the preceding configuration On the x3850 M2 server disabling PMI only results in a negligible 04 performance improvement
Summary All of the tuning items discussed in this section have yielded a cumulative total of 50 performance improvement over the out-of-the-box configuration on the Power 570 server On the x3850 M2 server the same tuning items produce 120 improvement over the out-of-the-box configuration due to the 75 performance improvement when the WAS JVM heap is increased to 2048 MB From the data shown in Figure 412 it is clear that tuning the WAS JVM heap (increasing the heap size to 2 GB using the gencon garbage collection policy with a nursery size of 15 GB) gives us the most performance gain followed by setting the maximum number of persistent HTTP connections for Web container ports to unlimited Other tuning items produce discernable but not significant performance benefits
Finally we want to see if there is any performance bottleneck in the most optimal configuration ndash with all tuning items applied ndash in our setup Although it varies a little during different Web service invocations the CPU utilization on the Power 570 server never goes above 80 The network throughput between the Workload Driver and the Power 570 server always remains below 50 Mbytess ndash well within the available bandwidth of the private Gigabit Ethernet network in our laboratory As for the physical memory usage on the Power 570 server the entire workload uses only 6 GB of the 32 GB of physical memory available The disk IO traffic is fairly negligible ndash less than 100 Kbytessec on the Power 570 server Similarly no performance bottleneck is observed on the x3850 M2 Web server
42 Tuning routing and transformation service mediations
For tuning routing and transformation service mediations consider the setup illustrated in Figure 421 The Workload Driver generates Web service requests which go through the service mediations provided by the Enterprise Service Bus (ESB) before getting to the benchmarkrsquos ClaimServices application that is hosted on WebSphere Application Server The Workload Driver is a stand-alone multi-threaded HTTP
(Web
SOA Performance on Linux Page 16
client which uses up to 50 threads with 20 maximum transactions to generate SOAP service requests to the ClaimServices application The service mediations include XSLT transformation and route-on-body mediations In other words the Web service mediation tests have the following characteristics
bull Stand-alone multi-threaded HTTP client to produce SOAP service requests bull Synchronous SOAP HTTP request and response invocation bull XSLT transformation and route-on-body service mediations bull ClaimServices application hosts Web services
The Web services and the ESBrsquos service mediations are hosted on an IBM Power 570 server with POWER6 processors We also consider an IBM x3850 M2 for this role and its performance data is noted in this section along with the data for the Power 570 server The Workload Driver runs on another server ndash an IBM x3650
WESB
Claim Service
Service providers Workload Driver
50 threads (20
maximum transactions)
Enterprise Service Bus
Service Mediations
Service Requests and Responses (SOAP HTTP)
Figure 421 ndash Setup for tuning Web service mediations
Our testing indicates that WebSphere JVM heap optimization Linux huge page support and tuning for maximum concurrency appear to yield the most performance improvement for service mediation scenarios Let us first look at the service mediation performance with the payload size set to 3 KB for both service request and response messages
bull JVM heap tuning In Section 41 we found that the WAS JVM heap configuration had a significant impact on the performance of Web services therefore we are going to start by looking at the WAS JVM heap configuration for the mediation scenarios here As in Section 41 in order to change the WAS JVM heap size or set the garbage collection policy we can use the WebSphere Application Server Administrative Console as follows
o Go to Servers rarr Application Servers rarr server name rarr Server Infrastructure rarr Java and Process Management rarr Process Definition rarr Additional Properties rarr Java Virtual Machine
o Enter new sizes (in MB) in the Initial Heap Size and Maximum Heap Size fields o Enter appropriate JVM command line option for the garbage collection policy into the
Generic JVM arguments field For example if we want to use the gencon garbage collection policy with a nursery size of 1536 MB we would enter -Xgcpolicygencon -Xmn1536M in the Generic JVM arguments field
Result With payload size for both requests and responses set to 3 KB and with the default WAS JVM settings we could only achieve an average Web service request rate of 11103 requests per second in the Composite Module mediation scenario as shown in Table 421 To optimize the JVM heap we first consider the default GC policy (optthruput) By setting both the initial JVM heap size and the maximum heap size to 2048 MB we immediately get a significant performance boost to 66426 requests per second ndash a 600 improvement The overall garbage collection overhead is 5 which is quite acceptable
Increasing the JVM heap size to 3072 MB yields another 6 performance improvement However increasing the JVM heap size to 4096 MB and beyond does not seem to make much difference As a result we decide to keep the heap size at 3072 MB but try to see if we could optimize the heap usage further by switching to another garbage collection policy
SOA Performance on Linux Page 17
The WAS JVM supports four different garbage collection policies as shown in Table 422 With the JVM heap size kept at 3072 MB the Generational Concurrent (gencon) garbage collection policy delivers the best performance for the Composite Module mediation scenario ndash as shown in Table 421 The optavgpause policy delivers the worst performance The subpool policy which is available only on IBM System p and zreg
servers produces approximately the same performance as the default policy (optthruput) but not as good as the gencon policy
Based on the data in Table 421 we can conclude that the gencon garbage collection policy together with the JVM heap size of 3072 MB represent the most optimal JVM heap configuration for the Composite Module mediation scenario (with payload size of 3KB for both requests and responses) on the Power 570 server In fact as Figure 421 shows this optimal WAS JVM heap configuration accounts for the largest performance gain across all Web service mediation scenarios considered in our study However on the x3850 M2 server we find that the best WAS JVM heap configuration requires a much larger heap ndash 6144 MB ndash with the gencon garbage collection policy
Table 421 ndash Impact of tuning on Composite Module mediation scenario with payload size of 3 KB on the Power 570 server
GC Policy JVM Command Line Option Description Optimize for throughput -Xgcpolicyoptthroughput (default) This is the default policy It is typically used for
applications where raw throughput is more important than short GC pauses The application is paused every time while garbage is being collected
Optimize for pause time -Xgcpolicyoptavgpause This policy trades high throughput for shorter GC pauses by performing some of the garbage collection concurrently The application is paused for shorter periods
Generational concurrent -Xgcpolicygencon This policy handles short-lived objects differently from long-lived objects Applications that have many short-lived objects can see shorter pause times with this policy while still producing good throughput
Subpooling -Xgcpolicysubpool This policy uses an algorithm similar to the default policy but employs an allocation strategy that is more suitable for multiprocessor machines This policy is recommended for SMP machines with 16 or more processors This policy is only available on IBM pSeriesreg and zSeriesreg platforms Applications that need to scale on large machines can benefit from this policy
Table 422 ndash Garbage collection policies supported in WebSphere 61
SOA Performance on Linux Page 18
Impact of Tuning on WESB Mediations (Power 570)
(50 Client Threads 20 Max Transactions
Request Response Payload Size = 3KB)
0
500
1000
1500
2000
2500
Composite Module
Xform Value Xform Namespace Xform Schema Route on Body
WESB Service Mediation Scenarios
Th
rou
gh
pu
t (R
eq
sS
ec
)
Default Configuration
JVM Heap Tuning
Huge Page Support
Concurrency Tuning
Figure 421 ndash Cumulative performance impact of WAS JVM heap tuning Linux huge page support and WAS concurrency tuning
bull Huge page support in Linux With the WebSphere JVM heap size now set to 3072 MB the CPU overhead of managing and keeping track of memory in this large heap can be reduced by exploiting the Huge (Large) Page support provided in the Linux kernel The Power processors support huge page size of 16 MB while x86 processors support only 2 MB huge page size Huge pages are configured in Linux by adding the following lines to the etcsysctlconf file
vmnr_hugepages = ltnumber of pagesgt kernelshmmax = ltnumber of bytesgt kernelshmall = ltnumber of bytesgt
In our study we want to configure enough huge pages for the WebSphere JVM heap To allow the WebSphere JVM heap to use huge pages we must first enable Linux to create and maintain a pool of huge pages In our tests we create a 4 GB pool of huge pages by adding the following lines to the etcsysctlconf file
Number of huge pages (256 x 16 MB = 4 GB) vmnr_hugepages = 256 Size of shared memory is set to 6 GB (6442450944 bytes) kernelshmmax = 6442450944 kernelshmall = 6442450944
(Note that we set the amount of shared memory to 6 GB so that there would be enough room for 4 GB pool of huge pages in the shared memory pool)
The WebSphere JVM can then be configured to use huge pages by adding the parameter -Xlp in the same ldquoGeneric JVM argumentsrdquo box where the garbage collector parameters are set
The data in Figure 421 shows that the huge page support does not result in any significant performance improvement for the transformation mediation scenarios that have a payload size of 3 KB although it does yield a noticeable (8) performance gain for the routing mediation scenario This is somewhat expected because the transformation operations on 3 KB payloads are not expected to cross normal 4 KB page boundaries too frequently On the other hand route-
SOA Performance on Linux Page 19
on-body service mediations involve fetching certain values in the message bodies and then based on those values jumping to different Web services in memory at comparatively higher service request rates (more than 2000 requests per second) This would cause more cache and TLB misses than other mediation types so the huge page support is expected to help here Indeed it provides an 8 performance improvement for routing mediation scenarios Similar behavior is also observed on the x3850 M2 server
bull Tuning for maximum concurrency After optimizing the JVM heap memory usage the next area for potential performance improvement is concurrency There are several WebSphere Web Container settings that can be tweaked for maximum concurrency If there are not enough HTTP connections available incoming service requests cannot connect until a connection is freed If the servers CPUs are not fully utilized if there is no memory constraint and if there is available network bandwidth the number of persistent HTTP connections for each port can be increased from the default value of 100 to improve the serverrsquos performance In our tests we found that setting the maximum number of HTTP persistent requests to unlimited gave us a noticeable performance gain
To change the number of HTTP connections available for a given port we used the WAS Administration Console as follows
1 Go to Servers rarr Application Servers rarr server name rarr Communications and click Ports
2 Find the port number in the table and click on View associated transports for that port
3 Click the transport chain that is listed
4 Click HTTP inbound channel (HTTP_n) where n denotes channels 1 to 4
5 Either click Maximum persistent requests per connection and enter a number in the Specify maximum number of persistent requests field or click Unlimited persistent requests per connection
There is another area that we can tune for maximum concurrency the number of threads available to service requests from the clients For example threads in the Web Container thread pool are used for handling incoming HTTP and Web service requests These thread pools are shared by all applications that are deployed on the server therefore in many cases these pools need to be larger than their default sizes
Changing the number of threads in a thread pool can be done through the WAS Administration Console as follows
1 Go to Servers rarr Application Servers rarr server name rarr Additional Properties rarr Thread Pools
2 Click on the thread pool you want to change and enter new values in the Maximum Size fields
We experiment with larger maximum numbers of threads in the default thread pool as well as the Web Container thread pool These numbers partly depend on the number of CPUs on the server because the more CPUs we have the more threads can be executed concurrently The Power 570 server has two dual-core POWER6 processors with simultaneous multi-threading (SMT) enabled so thatrsquos eight logical processors working in parallel To ensure that we have enough available threads in the thread pools we increase the maximum number of threads in the default thread pool to 200 (default value is 20) and in the Web Container thread pool to 100 (default value is 50)
To further optimize the performance of Web service mediation scenarios in our tests we turn off all performance monitoring tracing and logging These are often necessary when setting up a server or when debugging problems or issues but they do introduce some performance overhead As a result it is recommended that tracing and monitoring be used judiciously and whenever possible turned off entirely to ensure optimal performance
SOA Performance on Linux Page 20
Disabling the WebSphere Performance Monitoring Infrastructure (PMI) can be done through the WAS Administration Console as follows
1 Go to Monitoring and Tuning rarr Performance Monitoring Infrastructure (PMI) rarr server name
2 Clear the Enable Performance Monitoring Infrastructure (PMI) box and in the Currently Monitored Statistic Set box select None
Figure 421 shows the cumulative impact of increasing the maximum number of persistent HTTP connections the maximum number of threads in the default and Web Container thread pools as well as disabling PMI These tweaks provide the most performance gain for the Transform Value mediation scenario ndash a 6 gain over what we are able to achieve with optimal JVM heap configuration and huge page support The Transform Value mediation scenario is the least compute-intensive of all scenarios considered in our study and therefore it can sustain relatively high service request rates so setting up for maximum concurrency resulted in a sizable performance boost In contrast the other transformation mediation scenarios are much more compute-intensive and have relatively low service request rates so tuning for maximum concurrency does not help much Similar observations can be made on the x3850 M2 server
bull Impact of large payload sizes Let us now look at the performance of the Web service mediation scenarios with payload (message) sizes greater than 3 KB Figures 422 through 426 show the impact of the tuning items on these mediation scenarios with payload sizes greater than 3 KB
As payload size increases the Web service rates (throughput) drop as expected The size of the drop in throughput depends on the amount of processing that is required to perform the mediation on the payload in the service requests and responses For example Figure 422 shows that the Composite Module mediation scenario posts approximately the same throughput for both Request = 3 KB Response = 10 KB and Request = 10 KB Response = 3 KB configurations because the same amount of mediation processing is done on both requests and responses On the other hand the fact that the Transform Value mediation scenario posted approximately the same throughput for both Request = 10 KB Response = 3 KB and Request = 10 KB Response = 10 KB configurations as shown in Figure 423 indicates that the Transform Value mediation is only performed on requests (not responses) because the difference in the response payload size does not affect throughput The relatively high throughput for the Transform Value and Route-On-Body mediation scenarios indicates that the amount of processing required to perform these mediations is less than the processing required by the other mediations
It is important to note that the default WebSphere settings do not have enough capacity to even support payload sizes greater than 3 KB (all scenarios would fail after some time) Setting the initial and maximum JVM heap sizes to 1024 MB is the first step that allows all mediation scenarios to complete successfully Indeed the JVM heap optimizations discussed earlier in this section account for the largest performance improvement across all mediation scenarios ndash regardless of payload sizes
For many mediation scenarios such as Composite Module and Transform Schema the Linux huge page support provides larger performance gains at payload sizes greater than 3 KB This is expected because performing transformations on payloads larger than 3 KB would cross normal 4 KB page boundaries more frequently therefore huge pages would help in these cases
Concurrency tuning (which includes setting the maximum persistent HTTP connections to unlimited increasing the sizes of the default and Web Container thread pools as well as disabling all performance monitoring tracing and logging) provides larger benefits at higher throughput In fact based on the data in Figures 422 through 425 it appears that concurrency tuning only provides noticeable performance gains at service request rates higher than 600 requests per second
SOA Performance on Linux Page 21
Figure 427 shows the optimized performance for transformation mediation scenarios at different payload sizes As the payload size increases the Web service request rate drops due to larger computational requirements for performing transformation and routing mediations on larger payloads In fact as we increase the payload size to 100 KB for both requests and responses the eight processor cores on the Power 570 server start to become the limiting factor the CPU utilization approaches 99 preventing us from obtaining higher throughput
Similar observations can also be made on the x3850 M2 server ndash with the exception of the Transform Value mediation scenario The Transform Value scenario requires the least amount of computational power because it is the simplest among the mediation scenarios considered in our study therefore it can sustain relatively high service request rates On the x3850 M2 with its 16 processor cores the network actually becomes the performance limiting factor before the CPUs in the Transform Value scenario with 100-KB payloads the network traffic between the client and the server is measured approaching 500 Mbps limiting the CPU utilization on the x3850 M2 to less than 80
Summary On the Power 570 server the default WebSphere and Linux settings can only support 3 KB payloads in the service requests and responses for the Web service mediation scenarios considered in our study Setting the WAS JVM heap size to 3072 MB and using the Generational Concurrent (gencon) garbage collection policy yield more than 600 performance improvement The Linux huge page support provides another 8 performance boost for routing mediations and the concurrency tuning yields an average of 6 performance improvement for all mediation scenarios across different payload sizes However as we increase the payload size to 100 KB the CPU utilization on the Power 570 server approaches 99 so the server CPUs become the limiting factor preventing us from obtaining higher throughput Similar observations can be made for the x3850 M2 server ndash except for the Transform Value mediation scenario where the network actually becomes the performance bottleneck before the CPUs as the payload size is increased to 100 KB
Impact of Tuning on Composite Module Mediation
(Power 570 Server)
0
100
200
300
400
500
600
700
800
Baseline JVM Heap Tuning
Huge Page Support
Concurrency Tuning
Th
rou
gh
pu
t (R
eq
ss
ec)
Req=3K Resp=3K
Req=3K Resp=10K
Req=10K Resp=3K
Req=10K Resp=10K
Req=100K Resp=100K
Figure 422 ndash Impact of tuning on Composite Module mediation at different payload sizes
SOA Performance on LinuxPage 22
Impact of Tuning on Transform Value Mediation
(Power 570 Server)
0
500
1000
1500
2000
2500
Baseline JVM Heap Tuning
Huge Page Support
Concurrency Tuning
Th
rou
gh
pu
t (R
eq
ss
ec)
Req=3K Resp=3K
Req=3K Resp=10K
Req=10K Resp=3K
Req=10K Resp=10K
Req=100K Resp=100K
Figure 423 ndash Impact of tuning on Transform Value mediation at different payload sizes
Impact of Tuning on Transform Namespace Mediation
(Power 570 Server)
0
200
400
600
800
1000
1200
1400
1600
1800
Baseline JVM Heap Tuning
Huge Page Support
Concurrency Tuning
Th
rou
gh
pu
t (R
eq
ss
ec
)
Req=3K Resp=3K
Req=3K Resp=10K
Req=10K Resp=3K
Req=10K Resp=10K
Req=100K Resp=100K
Figure 424 ndash Impact of tuning on Transform Namespace mediation at different payload sizes
SOA Performance on Linux Page 23
Impact of Tuning on Transform Schema Mediation
(Power 570 Server)
0
100
200
300
400
500
600
700
800
900
Baseline JVM Heap Tuning
Huge Page Support
Concurrency Tuning
Th
rou
gh
pu
t (R
eq
ss
ec)
Req=3K Resp=3K
Req=3K Resp=10K
Req=10K Resp=3K
Req=10K Resp=10K
Req=100K Resp=100K
Figure 425 ndash Impact of tuning on Transform Schema mediation at different payload sizes
Impact of Tuning on Route On Body Mediation
(Power 570 Server)
0
500
1000
1500
2000
2500
Th
rou
gh
pu
t (R
eq
ss
ec
)
Req=3K Resp=3K
Req=10K Resp=10K
Baseline JVM Heap Tuning Huge Page ConcurrencySupport Tuning
Figure 426 ndash Impact of tuning on Route On Body mediation at different payload sizes
HandleClaim
Javabased
WorkloadDriver
ClaimServices
BPEDBSIBDBLOGS
WPS DB2
SOA Performance on Linux Page 24
Optimized Performance of Transform Mediations
(Power 570 Server 50 Client Threads 20 Max Transactions)
0
500
1000
1500
2000
2500
3K 3K 3K 10K 10K 3K 10K 10K 100K 100K
Request - Response Payload Size
Th
rou
gh
pu
t (R
eq
ss
ec)
Composite Module
Transform Value
Transform Namespace
Transform Schema
Figure 427 ndash Optimized performance for transformation mediation scenarios across different payload sizes
43 Tuning business process management (no clustering)
First let us consider the setup illustrated in Figure 431 where everything runs on a single IBM Power 570 server In this setup both WPS and DB2 are installed on an IBM Power 570 with dual POWER6 processors (a total of four Processing Units or cores) Both HandleClaim and ClaimServices applications are also installed and executed on this server There is a single disk where the BPEDB SIBDB and all WPS logs for transaction and compensation services reside The data for this configuration is shown in the first two rows in Table 431 under Configurations 1 and 11
IBM Power 570IBM Power 570IBM x3650IBM x3650
-
HandleClaim
Java-based
Workload Driver
ClaimServices
BPEDB SIBDB LOGS
WPS DB2
Figure 431 ndash Single server setup (Configurations 1 and 11)
SOA Performance on Linux Page 25
Table 431 ndash Tuning business process management (non-cluster)
As you can see in Table 431
bull Default configuration Configuration 1 shows the out-of-the-box configuration where there is no tuning Result In this configuration the benchmark cannot even run The default configuration for the WAS JVM is too small to handle the necessary processing for the benchmark used in our study
bull JVM heap tuning Configuration 11 shows what happens when we tune the WAS JVM heap configuration Two basic JVM heap parameters are the size of the heap and the garbage collection policy Several tools are available such as the Tivoli Performance Viewer (included with WebSphere) that can help analyze and monitor the heap usage and garbage collection so that the heap can be specifically tuned for a particular workload In our tests by looking at the number of memory pages allocated to the heap that are actually in use while the benchmark scenarios are being run we find that the heap usage is usually at 2048 MB As a result we set the JVM heap size for WAS at 2048 MB Because the Power 570 server has 32 GB of physical memory which is more than adequate for our tests we set the minimum and maximum heap size to the same value (2048 MB) to avoid the overhead of frequent heap size changes In addition to the JVM heap size the garbage collection policy can also affect performance The WAS JVM supports four different garbage collection policies The default garbage collection policy is optthruput However we decided to use the gencon (Generation Concurrent) garbage collection policy which handles short-lived objects differently from long-lived objects because our earlier testing for Web service scenarios showed that the gencon policy was more
suitable for Web service scenarios [12] Under the gencon policy the heap is split into new and old segments Long-lived objects are promoted to the old space while short-lived objects are garbage collected quickly in the new space (called a nursery) We also set the size of the nursery to 1536 MB (75 of the total heap size) through the Integrated Solution Console (ISC)
1 Go to Servers rarr Application Servers rarr server name rarr Server Infrastructure rarr
Java and Process Management rarr Process Definition rarr Additional Properties rarr Java Virtual Machine
2 Set the Initial Heap Size and Maximum Heap Size fields to 2048 MB
3 Enter ndashndashndashndash Xgcpolicygencon ndashXmn1536M in the Generic JVM arguments field Result Tuning the WAS JVM heap configuration allows the benchmark to run but its overall throughput is only 259 business transactions per second (BTPS) The data in Table 431 for Configuration 11 shows that the CPU utilization for the IBM Power 570 server is 53 while the disk utilization for the single disk is 996 This single disk is obviously the system performance bottleneck
bull Adding another server for DB2 Configuration 2 in Table 431 shows the result of our effort to remove the single disk as the system performance bottleneck First we use another server ndash the IBM x3850 M2 ndash as the DB2 server and move the BPEDB and SIBDB databases over to the disk
RECLOG
TXLOG
Javabased
WorkloadDriver
BPEDBSIBDBBPELOGS
WPS DB2
HandleClaim
ClaimServices BPEDBSIBDBBPELOGS
BPEDBSIBDBBPELOG
PEDBIBDBBPELOGS
PEDBIBDBBPELOGS
SOA Performance on Linux Page 26
arrays attached to the x3850 M2 This configuration is illustrated in Figure 432 More specifically we partition the workload as follows
o The x3850 M2 server runs the HumanTaskSimulator DB2 and hosts the databases on its disk arrays
BPEDB on a 24-disk array attached to the IBM System Storagetrade DS3400 controller
BPE logs on a 12-disk array attached to the IBM ServeRAID MR10M controller SIBDB on a 12-disk array attached to the same IBM ServeRAID MR10M
controller
o The Power 570 server now only runs WPS and the benchmarkrsquos HandleClaim and ClaimServices applications We also make some additional improvements on this serverrsquos configuration
One disk for transaction logs only Another separate disk for compensation (recovery) logs only The WAS JVM heap size increased from 2048 MB to 4096 MB with the nursery
size set to 3072 MB (75 of the heap size)
Result With these changes the overall benchmark throughput is now 217 BTPS ndash a significant improvement over 259 BTPS for Configuration 11
IBM Power 570 IBM x3850 M2IBM Power 570 IBM x3850 M2 Disk ArraysDisk ArraysIBM x3650IBM x3650
-
REC LOG
TX LOG
Java-based
Workload Driver
B S
WPS DB2
HandleClaim
ClaimServices B S BPEDB
SIBDB BPE LOG
Figure 432 ndash Separate WPS and DB2 servers (Configurations 2 21 22 and 3)
bull WASWPS concurrency optimization Configuration 21 in Table 431 shows the performance impact of additional WAS and WPS tuning that maximizes concurrency These are recommended by the WebSphere Performance Teams [13] In particular since the Power 570 server has a total of four cores or eight logical CPUs with simultaneous multi-threading (SMT) we follow the recommendations for eight CPUs in setting the following parameters
o Thread pools Default thread pool max = 200 Web containerrsquos thread pool max = 100
o Connection pools BPEDB data sourcersquos connection pool max = 150 CEI ME data sourcersquos connection pool max = 80 SIBDB system data sourcersquos connection pool max = 30 SIBDB BPC data sourcersquos connection pool max = 50
o J2C connection factories BPECF connection pool max = 40 BPECFC connection pool max = 40 HTMCF connection pool max = 20
o J2C activation specifications BPEInternalActivationSpec Custom properties maxConcurrency = 60 ltBenchmarkgt Custom properties maxConcurrency = 40
SOA Performance on Linux Page 27
Result With the concurrency optimizations we essentially double the benchmarkrsquos overall throughput to 457 BTPS (as compared to 217 BTPS for Configuration 2)
bull DB2 tuning Configuration 22 in Table 431 shows the performance impact of applying DB2 tunings to optimize the log data rates We set the following DB2 parameters
o Max storage for lock list (4 KB) = 400 o Log buffer size (4 KB) = 512 o Log file size (4 KB) = 8000 o Number of primary log files = 10 o Number of secondary log files = 10 o Maximum number of active applications = 250 o Average number of active applications = 50 o Percent log file reclaimed before soft checkpoint = 300 o Percentage of lock lists per application = 20 o Buffer pool size (pages) = 64000
Result As can be seen in Table 431 tuning DB2 delivers a benchmark throughput rate of 4628 BTPS ndash only a small improvement (13) over what we are able to get for Configuration 21 Table 431 also shows that this Configuration 22 has the CPU utilization of the WPS server (Power 570) at 97 and the disk utilization at 67 and 60 respectively for transaction and compensation (recovery) logs This indicates that the system performance bottleneck is no longer the disk subsystem but rather the Power 570rsquos two dual-core POWER6 processors Adding more processors to the WPS Server would certainly increase the benchmark throughput ndash provided that some J2C Connection Factories and Activation Specifications would also be increased to accommodate the higher number of processors as recommended by the WebSphere Performance Team [13]
bull Cache mirroring in the IBM System Storage DS3400 Configurations 3 and 31 in Table 431 show the performance impact of the cache mirroring capability in the DS3400 Starting with Configuration 3 we also use a more powerful Power 570 server Cache mirroring which is the default setting on the DS3400 can remain enabled for reliability or availability reasons In our setup the BPEDB disk array is attached to the DS3400 controller In Configuration 3 in order to achieve higher benchmark throughput we disable cache mirroring In Configuration 31 we leave the cache mirroring enabled (the default setting)
Result As we can see in Table 431 with cache mirroring enabled the disk array utilization for BPEDB jumps from 30 to 47 and the benchmark throughput drops from 6112 BTPS to 5584 BTPS ndash an 86 performance drop This is a classic trade-off between performance and reliabilityavailability
bull Reducing WAS JVM heap size in memory-constrained environment Configuration 32 in Table 431 shows the impact of reducing the WAS JVM heap size from 4096 MB to 2048 MB This could be necessary in memory-constrained environments
Result Reducing the WAS JVM heap from 4096 MB to 2048 MB drops the benchmarkrsquos overall throughput from 5584 BTPS to 4456 BTPS a significant 20 performance drop As a result it is highly recommended that the WAS JVM heap be adjusted accordingly after adding CPUs to the WPS server
bull Write-back caching in IBM ServeRAID MR10M controller Configuration 33 in Table 431 shows what happens when we use write-through caching policy in the MR10M disk array controller (instead of write-back) Write-back caching is always good for the performance of disk writes because the disk write operations are considered done as soon as the data is written to the cache (instead of physical disks) Data in the cache would then be written (ldquoflushedrdquo) to physical disks at a later time However in an environment where there is no battery backup for the controller or for the disk subsystem write-through caching could help protect the integrity of data
SOA Performance on Linux Page 28
when there is a power outage In our setup the SIBDB and BPE log disk arrays are attached to the MR10M controller
Result Using the write-though caching policy for the SIBDB disk array results in a 6 performance drop ndash from 4456 BTPS with write-back caching in Configure 32 to 4179 BTPS with write-through caching in this Configuration 33 Note that for Configuration 33 in Table 431 the utilization of the disk array for BPEDB jumps to 70 because we now use a single 24-disk array for both BPEDB and BPE logs However our test data (not shown in Table 431) indicates that the 70 utilization of the disk array does not have any noticeable impact on the benchmark throughput This is because even at 70 utilization the disk IO queue depth for the 24-disk array is still less than 1 indicating that the disk array is not the performance bottleneck In fact this is lower than the CPU utilization (75) for the WPS server
bull Linux logical disk striping In Configurations 3 and 31 the utilization for the disks holding the transaction log and compensation (recovery) log on the WPS server is quite high ndash around 80 for transaction log and 75 for compensation log While this is still lower than the CPU utilization it would be interesting to try to lower the disk utilization and see if that would have any impact on the benchmarkrsquos overall throughput We do not have any extra disk array controller that could be installed in the WPS server but we have two extra disks that could be used to set up a four-disk logical array through the Linux Logical Volume Manager (LVM) to handle both transaction and compensation log traffic
Result Table 432 shows the results For a four-disk logical array the stripe size of 64 KB provides better performance than smaller stripe sizes of 4 KB and 16 KB given that the size of each log data write is between 4 KB and 5 KB The utilization of the device manager is found to be over 90 while the utilization of each individual disk ranges from 27 to 36 However dedicating a single disk to each log without any logical disk striping produces the best benchmark throughput even though we use only two disks and each disk is used more than 75 of the time This indicates that the overhead of the Linux logical volume manager in managing a logical disk array has a negative performance impact when it comes to transaction and compensation logs on the WPS server As a result for the rest of our study we dedicate a single physical disk for each WPS log
Table 412 ndash Logical disk striping (through Linux Logical Volume Manager)
bull Linux large (huge) page support We configure large (huge) pages (16 MB page size) on the Power 570 server (WPS server) for the WAS JVM heap and find that it does not result in any performance improvement In fact with large page support the benchmarkrsquos overall throughput decreases from 6112 BTPS (Configuration 3) to 5970 BTPS a performance degradation of about 2 As a result for the remainder of this study we do not configure large pages
Figure 433 shows the cumulative performance improvement as we go from the default (out-of-the-box) configuration to tuning DB2 The tuning items are shown in a chronological order from left to right in the figure
It should also be noted that the x3650 server that hosts the benchmarkrsquos Workload Driver does not have any impact on our performance results because the CPU utilization of this server is less than 5 and the utilization of the only disk used on this server is less than 6
SOA Performance on Linux Page 29
Cumulative Performance Improvement Tuning Business Process Management
Non-Clustered Environment
0
5
10
15
20
25
30
35
40
45
50
Out Of The Box JVM Heap (2GB
gencon)
Add DB2
Server+Disk
Arrays
WASWPS
Concurrency
DB2 Log Tuning
Tuning Actions (Performed in Chronological Order From Left to Right)
Ben
ch
mark
s O
vera
ll
Th
rou
gh
pu
t (B
TP
S)
Figure 433 ndash Cumulative Impact of BPM Tuning Actions in Non-Clustered Environment
44 Tuning dynamic operations with WebSphere Virtual Enterprise (WVE)
In this section we evaluate a virtual goals-driven autonomic environment for SOA applications like the benchmark used in this study We use WebSphere Virtual Enterprise (WVE) to create this environment which is illustrated in Figure 441
The dynamic cluster of WPS servers called application cluster in Figure 441 consists of WPS servers on which the benchmarkrsquos applications are deployed These applications include HandleClaim and ClaimServices applications denoted as B and S respectively In response to an increase in workload demands or an on-going failure to meet a service policyrsquos performance objective WebSphere Virtual Enterprisersquos autonomic managers can start an instance of WPS server on the x3850 M2 server or on any of the two logical partitions (LPARs) on the OpenPower 720 server Based on the results in Section 43 each instance of the WPS server has a single disk for transaction log and another single disk for compensation (recovery) log In Figure 441 the LPARs are virtualized with PowerVM technology so IO operations to these (virtual) disks must go through the Virtual IO Server (VIOS) The LPARs use shared capped virtual CPUs In general it is recommended that we configure shared uncapped virtual CPUs across the LPARs however in this study the number of (virtual) CPUs that each LPAR is allowed to use is capped so that we can more accurately measure the workload impact on each LPAR and the performance impact of logical partitioning
By default there can only be a maximum of one WPS server instance per node in the dynamic application cluster
The service policy in WVE only allows two types of performance goals to be specified ndash the average response time or the percentile response time goals In this study we use the average response time goal for simplicity To set a reasonable response time goal we examine the response times reported in
Javabased
WorkloadDriver
IBMHTTPServer
OnDemandRouter(ODR)
DeploymentManager
NodeAgent
B
S
LPAR 1
B
S
WPS
BPEDBSIBDBLOGSBPEDBSIBDBLOGSBPEDBSIBDBLOGS
NodeAgent
B
S
WPS Human TaskSimulator
SCA SYS
SCA APP
ME Cluster
DB2
DB2
AdjustersUnderwriters
BPEDBSIBDBLOGS
Node Agent
LPAR 2
NodeAgent
VIOS
RECOVERYLOGS
TRANSACTLOGS
TRANSACTLOGS
RECOVERYLOGS
B
S
WPSIntegratedSolutionConsole
B
S
WPS
PEDBIBDBLOGS
PEDBIBDBLOGS
PEDBIBDBLOGS
B
S
WPS
SOA Performance on Linux Page 30
Table 441 for all configurations that we evaluate in this study We note that the best response time that we are able to achieve is about 14 ms As a rule of thumb (best practices) the average response time goal should be at least two times higher than the best response time observed on a lightly loaded cluster Consequently we set the average response time goal in the service policy to be 30 ms This should enable the autonomic managers to activate additional WPS servers (instances) when the average response time for claim requests exceeds 30 ms (the performance goal) Setting the average response time goal too close to 14 ms would never result in additional servers to be started because the autonomic managers would determine that starting additional servers would not improve the chances of meeting the performance goal
We specify the service policy to be applicable to HTTP and SOAP requests that are handled by the benchmarkrsquos applications We also assign the highest priority to this service policy
We use the default settings for the On-Demand Router (ODR) and its associated autonomic managers
As described in Section 23 there are two approaches to cluster the Message Engines (MEs)
bull The Message Engines are local to the dynamic application cluster bull The Message Engines are in their own cluster (called ME Cluster) separate from the dynamic
application cluster
In this section we consider both approaches and see which one performs better In those configurations where the ME Cluster is configured it runs on the x3850 M2 server As such the ME Cluster is a static cluster
IBM OpenPower 720
- -
Disk Arrays
IBM x3850 M2
IBM x3650
ClaimServices Application
HandleClaim Application
Application Cluster
IBM OpenPower 720
Java-based
Workload Driver
IBM HTTP Server
On-Demand Router (ODR)
Deployment Manager
Node Agent
B
S
LPAR 1
B
S
WPS
B S B
S B S
Disk Arrays
IBM x3850 M2
Node Agent
B
S
WPS Human Task Simulator
SCA SYS
SCA APP
ME Cluster
DB2
DB2
Adjusters Underwriters
BPEDB SIBDB LOGS
Node Agent
LPAR 2
Node Agent
VIOS
RECOVERY LOGS
TRANSACT LOGS
TRANSACT LOGS
RECOVERY LOGS
B
S
WPS Integrated Solution Console
IBM x3650
ClaimServices Application
HandleClaim Application
Application Cluster
Figure 441 ndash Dynamic application cluster with separate cluster for Message Engines
SOA Performance on Linux Page 31
In general for the configurations considered in this section the physical servers host the following components (see Figure 441)
bull IBM x3650 server o Benchmarkrsquos Java Workload Driver o WebSphere Deployment Manager o IBM HTTP Server (Web Server) o WebSphere On-Demand Router (ODR) o WebSphere Node Agent
bull IBM x3850 M2 server o DB2 hosting SIBDB and BPEDB databases (including their logs) o Benchmarkrsquos HumanTaskSimulator simulating the actions of adjusters and underwriters o WPS server (initial instance ndash unless otherwise specified) hosting the benchmarkrsquos
HandleClaim and ClaimServices applications o WebSphere Node Agent o ME Cluster (if configured)
bull IBM OpenPower 720 server (VIOS with 05 POWER5 core LPAR1 with 15 POWER5 cores LPAR2 with 20 POWER5 cores)
o Virtual IO Server (VIOS) o LPAR1 WPS server (one instance maximum) and WebSphere Node Agent o LPAR2 WPS server (one instance maximum) and WebSphere Node Agent
On the x3850 M2 server the BPEDB database is hosted on a 24-disk array managed by the IBM System Storage DS3400 controller Because of the large amount of disk writes the BPEDB log resides on a separate 12-disk array that is attached to the IBM ServeRAID MR10M adapter The SIBDB database and its log are hosted on another 12-disk array that is attached to the same MR10M adapter As in Section 43 each WPS server has two disks one dedicated for the transaction log and one for the compensation (recovery) log For optimal performance cache mirroring is disabled for the DS3400 controller and the write-back caching policy is used for the MR10M controller In addition all of the WPS and DB2 tuning items discussed in Section 43 are applied to the WVE environment
For the remainder of this paper we denote the maximum number of concurrent insurance claim requests generated by the benchmarkrsquos Workload Driver as Max Tx and the number of threads used to generate this traffic as simply Threads We will look at two performance measurements the number of business transactions per second (BTPS) as reported by the benchmark and the average response time for service requests as reported by WebSphere Virtual Enterprise
Let us first consider the configurations with the Message Engines in a separate cluster (ME Cluster) The performance results for these configurations are shown in Table 441
bull Single node performance (with separate ME Cluster) Configuration 5 in Table 441 shows what can be achieved with a single node (the x3850 M2 server) in the dynamic cluster The dynamic application cluster is put in Manual Mode so that the autonomic managers do not attempt to activate additional WPS servers on the other nodes ndash even when the average response time exceeds the performance goal of 30 ms
Result With the Workload Driver using two threads to generate a maximum of 60 concurrent requests (Max Tx = 60 Threads = 2) the x3850 M2 is able to handle an average of 2829 BTPS The CPU utilization on the x3850 M2 is 83 and the disk subsystem still has quite a bit of bandwidth available (the disk IO queue depth is less than 060) The average response time for the claim requests ranges from 2285 ms with a Max Tx of 20 to 5274 ms with a Max Tx of 60 Setting the maximum number of concurrent requests higher than 60 introduces some instability only a few runs are completed successfully as the CPU utilization moves above 90
SOA Performance on Linux Page 32
Table 441 ndash Performance data for dynamic cluster configurations
bull Multi-node performance (with separate ME Cluster) Configuration 51 in Table 441 shows that we can achieve higher service rates when we put the dynamic application cluster in Automatic Mode This allows the On-Demand Routerrsquos autonomic managers to activate additional servers on the OpenPower 720rsquos LPARs automatically (without human intervention) to help handle the workload generated by the benchmarkrsquos Workload Driver This configuration is illustrated in Figure 441
Initially after we turn on the benchmarkrsquos Workload Driver (with Max Tx = 20 Threads =1) the initial WPS server running on the x3850 M2 takes a while to warm up During this warm-up period the average response time for service requests exceeds the service goal of 30 ms for more than 30 seconds as shown in Figure 442 The autonomic managers sense this condition and generate a runtime task to activate additional WPS servers on the clusterrsquos remaining nodes The runtime task appears on the System Administration View of the Integrated Solutions Console (ISC) at approximately 2 minutes after the start of the run Since the application cluster is in Automatic Mode the runtime task starts immediately without further human intervention after it appears on the ISC It takes about 2 minutes for the new WPS servers to be activated on the two LPARs on the OpenPower 720 server Finally about 4 minutes after the start of the run the WPS servers on the LPARs start running Of course these new servers need time to warm up and that is the reason for the initial high response times recorded on these servers
In the mean time as the new WPS servers are starting on the LPARs their Message Engines are starting to run in the ME cluster on the x3850 M2 causing the average response time on the x3850 M2 server to jump higher as well However after about 90 seconds the average response time on the x3850 M2 starts to stabilize and falls to about 1877 ms ndash well below the service goal of 30 ms and better than the best average response time in the single-node configuration (Configuration 5) This shows the benefit of offloading the workload to new additional servers in the dynamic cluster However on the OpenPower 720 the LPARs (with 15 POWER5 cores for LPAR1 and 20 POWER5 cores for LPAR2) that host the new servers are not powerful enough to achieve a response time of less than 30 ms for the service requests sent to them Because of this the maximum throughput data collected at each node indicates that the On-Demand Router routes more service requests to the more powerful x3850 M2 server than to the two POWER5 LPARs
SOA Performance on Linux Page 33
Dynamic Workload Management
w WebSphere Virtual Enterprise
0
100
200
300
400
500
600
700
800
0 30 100
130
200
230
300
330
400
430
500
530
600
630
Time (MinSec)
Resp
on
se T
ime (
ms) x3850M2 (4 x 4-Core Intel
X7350)
P5 LPAR (PowerVM 15 PUs)
P5 LPAR (PowerVM 2 PUs)
Service Goal
Figure 442 ndash WebSphere Virtual Enterprisersquos autonomic managers activating additional WPS servers
After everything settles down the best benchmark throughput that we can get for this multi-node configuration is 3556 BTPS a 25 improvement over the single-node configuration In addition as can be seen in Table 441 the multi-node configuration provides more stability at much higher workloads (up to Max Tx = 160 Threads = 4) than the single-node configuration At the highest workloads (Max Tx = 160 Threads = 4) the CPU utilization is 92 93 and 86 for LPAR1 LPAR2 and x3850 M2 servers respectively indicating that we are running out of CPU bandwidth on the LPARs The disk subsystem is still okay with the maximum IO queue depth of 104 and the disk with the highest utilization (70) being the compensation log disk in LPAR2
Figure 443 shows the throughput that is contributed by each node in the dynamic cluster As the workload increases the throughput at the LPARs begins to level off running out of CPU bandwidth However with 16 processor cores the x3850 M2 just keeps going while the ODR sends more requests to it
bull Multi-node performance (with separate ME Cluster and without PowerVM) Configuration 52 in Table 441 shows the benchmark throughput when we effectively remove the PowerVM virtualization layer from the OpenPower 720 server In the previous configuration (Configuration 51) because we are running out of CPU bandwidth and the disk utilization is high on the LPARs with Max Tx = 160 and Threads = 4 removing the virtualization layer might result in higher benchmark throughput To do this we only configure a single LPAR on the OpenPower 720 server assign all CPUs (4 cores) and memory to this single LPAR and remove the Virtual IO Server (VIOS) All IO operations now go directly to the disk subsystem without going through the VIOS reducing the IO latency This configuration is illustrated in Figure 444
SOA Performance on Linux Page 34
Node Throughput (As Seen By WebSphere Virtual Enterprises Autonomic Managers)
3-Node Dynamic Cluster with Remote ME Cluster and PowerVM
0
5
10
15
20
25
30
1 20 1 40 1 60 2 60 2 80 3 80 3 100 4 160
Threads MaxTx
Th
rou
gh
pu
t (B
TP
S)
x3850 M2 (16-core)
P5 LPAR (15-core)
P5 LPAR (2-core)
Figure 443 ndash Node throughput as reported by WebSphere Virtual Enterprise
Result As can be seen in Table 441 this configuration is now able to support up to 6 threads with MaxTx = 160 and the overall benchmark throughput is now 4047 BTPS a 14 improvement over Configuration 51 The CPU utilization on the x3850 M2 server now moves above 90 but the disk subsystem still has available bandwidth because the disk IO queue depth is 126 and the highest disk utilization is only 50 If we look at the data for MaxTx = 160 Threads = 4 and compare it against the data for the same workload in the previous configuration we see that the average response time on the single 4-core LPAR is less than half the response times observed on the 15-core LPAR1 and 2-core LPAR2 in the previous configuration While the maximum throughput observed at the single 4-core LPAR is about 10 higher than the sum of maximum throughput for both LPAR1 and LPAR2 in the previous configuration it is interesting to note that the performance of the WPS server running on the x3850 M2 is also better (that is lower average response time higher maximum throughput) This indicates that a single 4-core LPAR can offload more workload from the x3850 M2 than both the 15-core LPAR1 and 2-core LPAR2 can in the previous configuration Later on in this paper we will measure the performance impact of the VIOS more accurately
bull Single-node performance (with local Message Engines) Configuration 6 in Table 441 shows the performance data when using only a single node (x3850 M2) with local Message Engines running in the same dynamic cluster as the WPS servers
Result The data indicates that for this single-node configuration with local Message Engines the benchmark throughput is much higher and the average response time is much lower than in Configuration 5 where we have remote Message Engines located in a separate cluster Depending on the workload level the extra latency in going to Message Engines in a remote cluster results in 30 - 60 drop in the benchmark throughput and 25 - 40 jump in the average service response time Consequently having the Message Engines running locally in
Javabased
WorkloadDriver
IBMHTTPServer
OnDemandRouter(ODR)
DeploymentManager
NodeAgent
B
S
LPAR 1
B
S
WPS
BPEDBSIBDBLOGSBPEDBSIBDBLOGSBPEDBSIBDBLOGS
NodeAgent
B
S
WPS Human TaskSimulator
SCA SYS
SCA APP
ME Cluster
DB2
DB2
AdjustersUnderwriters
BPEDBSIBDBLOGS
Node Agent
RECOVERYLOGS
TRANSACTLOGS
IntegratedSolutionConsole
B
S
WPS
PEDBIBDBLOGS
PEDBIBDBLOGS
PEDBIBDBLOGS
SOA Performance on Linux Page 35
the same cluster as the applications is faster in the single-node configuration but it severely limits the scalability of a multi-node configuration a fact that is very obvious when we consider the next configuration
IBM OpenPower 720
- -
Disk Arrays
IBM x3850 M2
IBM x3650
ClaimServices Application
HandleClaim Application
Application Cluster
IBM OpenPower 720
Java-based
Workload Driver
IBM HTTP Server
On-Demand Router (ODR)
Deployment Manager
Node Agent
B
S
LPAR 1
B
S
WPS
B S B
S B S
Disk Arrays
IBM x3850 M2
Node Agent
B
S
WPS Human Task Simulator
SCA SYS
SCA APP
ME Cluster
DB2
DB2
Adjusters Underwriters
BPEDB SIBDB LOGS
Node Agent
RECOVERY LOGS
TRANSACT LOGS
Integrated Solution Console
IBM x3650
ClaimServices Application
HandleClaim Application
Application Cluster
Figure 444 ndash Dynamic application cluster with separate ME Cluster but without PowerVM
bull Multi-node performance (with local Message Engines) Configuration 61 in Table 441 shows the performance data obtained for a two-node application cluster with local Message Engines This application cluster is illustrated in Figure 445 When we start the Workload Driver the initial WPS server runs on a two-core POWER5 LPAR As the CPU utilization on this LPAR quickly rises above 90 and the average service response time is far above the service goal of 30 ms the autonomic managers generate a runtime task to activate the remaining node (the x3850 M2) in the cluster However even after a new WPS server is started on the x3850 M2 most (approximately 80) of the workload still goes to the initial node (the two-core POWER5 LPAR) leaving the second node (the x3850 M2) under-utilized ndash the CPU utilization on the x3850 M2 is only 13 The benchmarkrsquos overall throughput (94 BTPS) is much smaller than in the case with remote Message Engines (3556 BTPS) This is because of a design limitation for the Service Integration (SI) buses if a Message-Driven Bean (MDB) has a local ME available it is always forcibly ldquoboundrdquo to it even if the ME is inactive Because only one ME instance can be active at any given time only one WPS server can have active instances of that MDB In other words all but one of the WPS servers in the cluster is essentially in stand-by mode This imposes serious limitation on the overall scalability of the dynamic cluster if we have long-running business processes or asynchronous SCA invocations As a result for multi-node dynamic clusters we recommend configuring the Message Engines in a separate cluster The WebSphere clustering topologies are classified into three types [4]
o Bronze topology where all components (WPS applications Message Engines CEI) are run in a single cluster
o Silver topology where there are two separate clusters one for WPS applications and CEI and one for the Message Engines
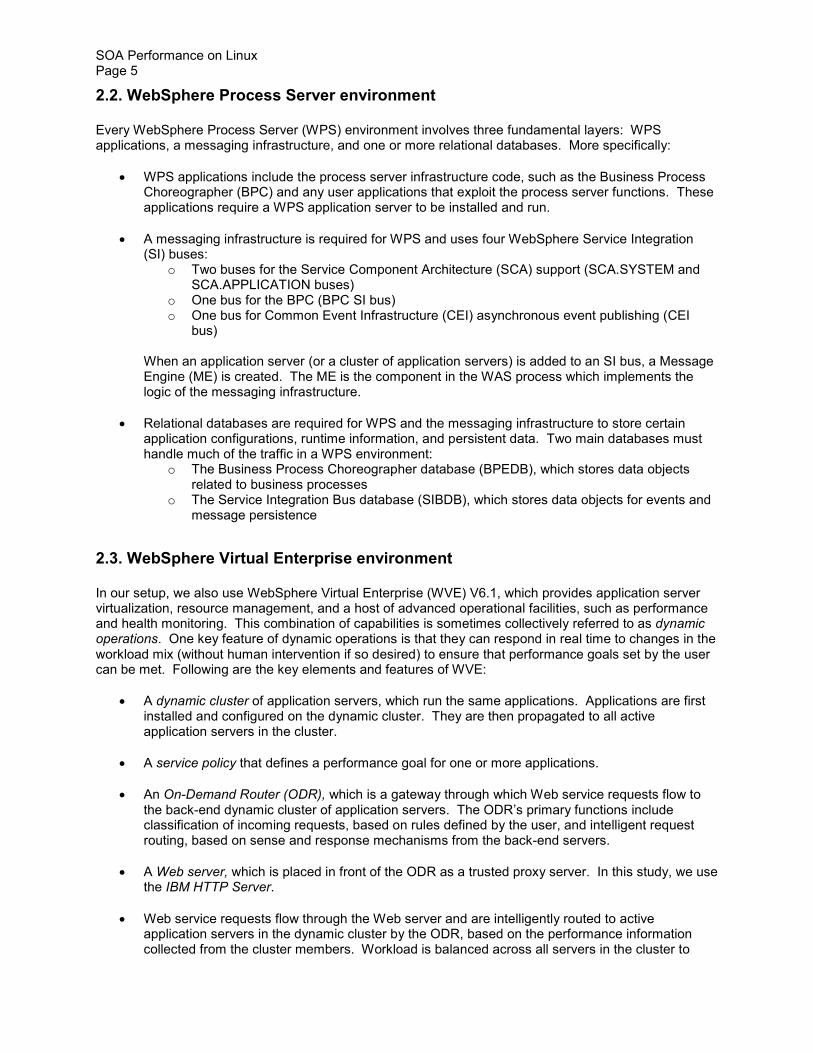
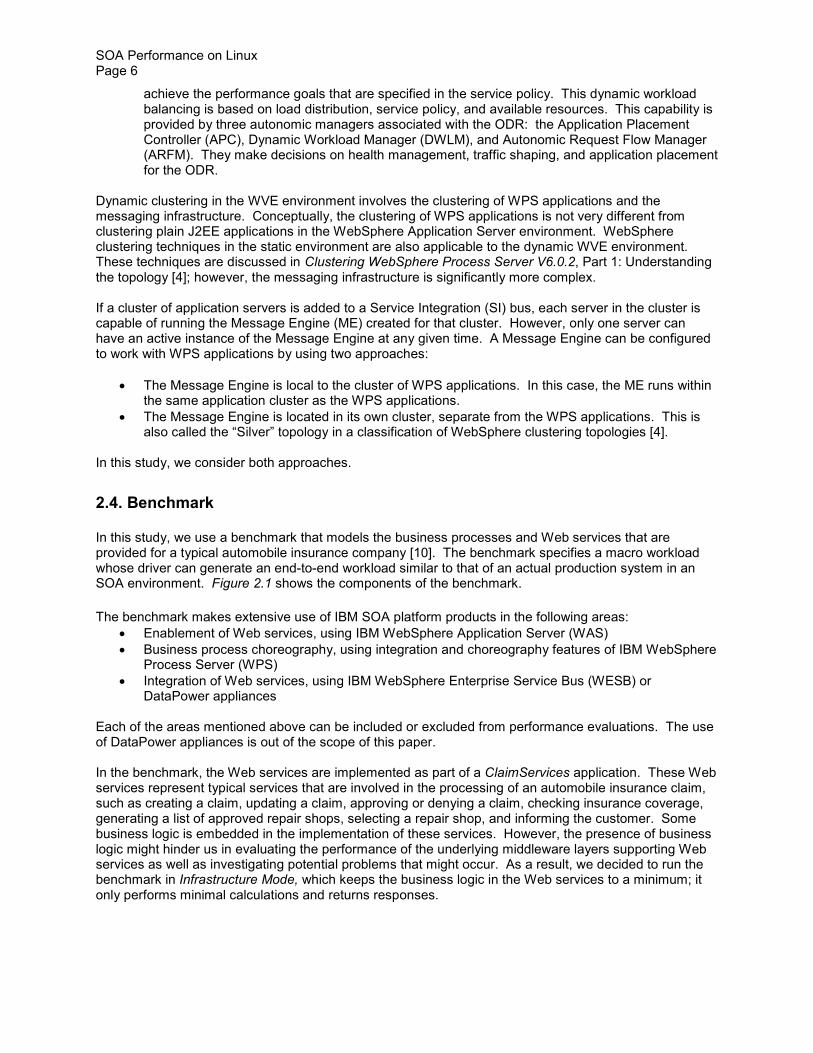
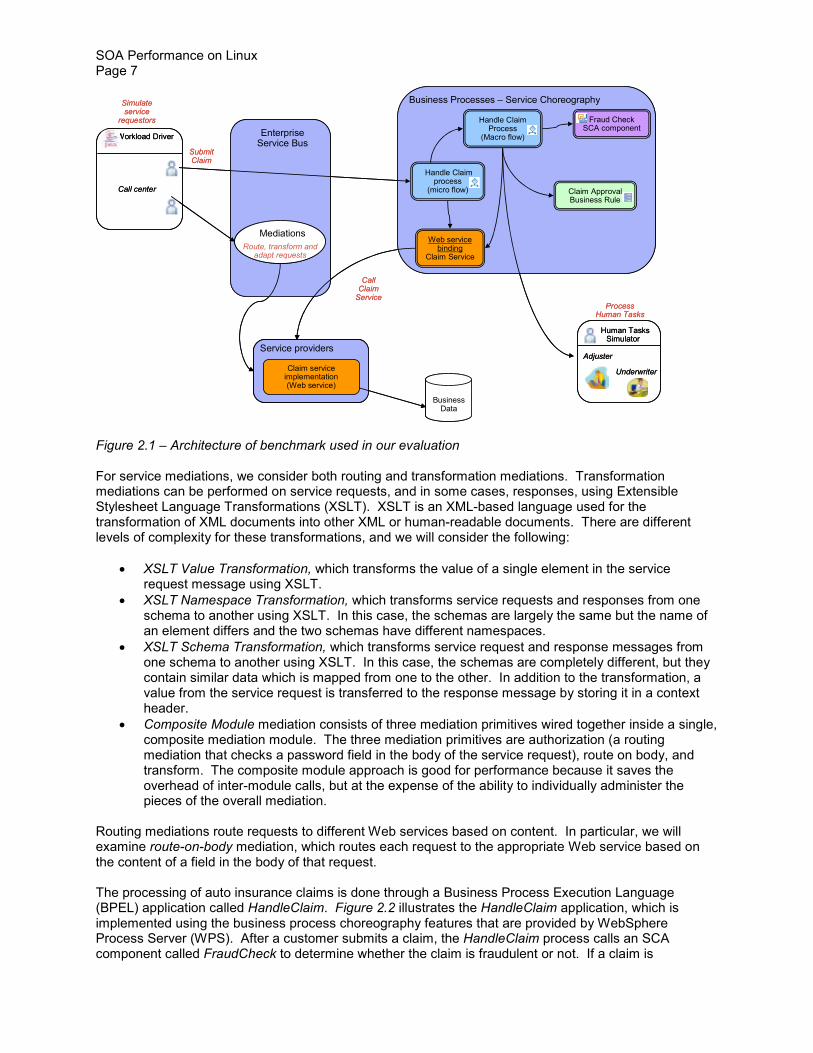
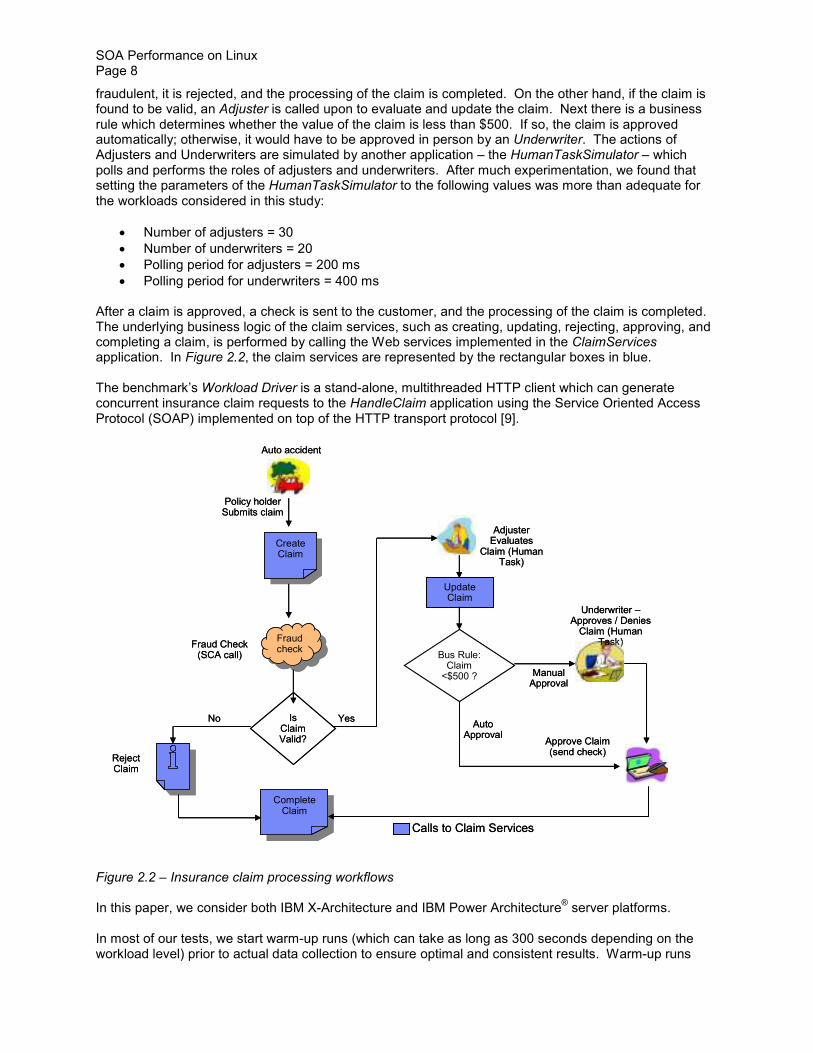
CreateClaim
CreateClaim
Fraudcheck
Fraudcheck
as
CompleteClaim
CompleteClaim
UpdateClaim
Bus RuleClaimlt$500
CreateClaim
Fraudcheck
CompleteClaim
SOA Performance on Linux Page 8
fraudulent it is rejected and the processing of the claim is completed On the other hand if the claim is found to be valid an Adjuster is called upon to evaluate and update the claim Next there is a business rule which determines whether the value of the claim is less than $500 If so the claim is approved automatically otherwise it would have to be approved in person by an Underwriter The actions of Adjusters and Underwriters are simulated by another application ndash the HumanTaskSimulator ndash which polls and performs the roles of adjusters and underwriters After much experimentation we found that setting the parameters of the HumanTaskSimulator to the following values was more than adequate for the workloads considered in this study
bull Number of adjusters = 30 bull Number of underwriters = 20 bull Polling period for adjusters = 200 ms bull Polling period for underwriters = 400 ms
After a claim is approved a check is sent to the customer and the processing of the claim is completed The underlying business logic of the claim services such as creating updating rejecting approving and completing a claim is performed by calling the Web services implemented in the ClaimServices application In Figure 22 the claim services are represented by the rectangular boxes in blue
The benchmarkrsquos Workload Driver is a stand-alone multithreaded HTTP client which can generate concurrent insurance claim requests to the HandleClaim application using the Service Oriented Access Protocol (SOAP) implemented on top of the HTTP transport protocol [9]
Figure 22 ndash Insurance claim processing workflows
In this paper we consider both IBM X-Architecture and IBM Power Architecturereg server platforms
In most of our tests we start warm-up runs (which can take as long as 300 seconds depending on the workload level) prior to actual data collection to ensure optimal and consistent results Warm-up runs
Policy holder Submits claim
Underwriter ndash Approves Denies Claim (Human
T k)
Adjuster Evaluates
Claim (Human Task)
Fraud Check (SCA call)
Approve Claim (send check)
Yes Auto
Approval
Reject Claim
Auto accident
Is Claim Valid
Manual Approval
No
Calls to Claim Services
Create Claim
Fraud check
Policy holderSubmits claim
Underwriter ndashApproves Denies Claim (Human
Task)
AdjusterEvaluates
Claim (HumanTask)
Fraud Check(SCA call)
Approve Claim(send check)
YesAuto
Approval
RejectClaim
Auto accident
Is ClaimValid
ManualApproval
No
Complete Claim
Update Claim
Bus Rule Claim lt$500
Calls to Claim Services
SOA Performance on Linux Page 9
were especially needed because by default the IBM Java Virtual Machine (JVM) in WebSphere Application Server uses a higher optimization level for compiles thus resulting in faster runtime performance but at the expense of slower server startups
3 Systems configurations
31 Hardware
As mentioned previously we consider both IBM X-Architecture and Power Architecture server platforms for hosting the benchmarkrsquos Web services and business processes
311 IBM X-Architecture servers
In this study we employ the IBM System x3850 M2 (Table 31) which implements the IBM eX4 chipset [78] to host WebSphere DB2 and the benchmarkrsquos Web services and business process components
Server IBM System x3850 M2
CPU 4 x 64-bit Quad-Core Intelreg Xeonreg Processor X7350 (293 GHz)
Memory 64 GB (667 MHz DDR2)
Network Integrated Dual-Port Gigabit Ethernet with TCPIP offload engine
Table 31 ndash IBM System x3850 M2 configuration
The benchmarkrsquos Workload Driver runs on an IBM System x3650 (Table 32)
Workload Driver IBM System x3650
CPU 2 x 64-bit Quad-Core Intel Xeon X5460 (316 GHz)
Memory 24 GB (667 MHz DDR2)
Network Integrated Dual-port Gigabit Ethernet
Table 32 ndash IBM System x3650 configuration
312 IBM Power architecture servers
For the Power platform we use an IBM Power 570 (Table 33) [5] with POWER6trade processors [6] to host WebSphere and the benchmarkrsquos applications in some tests and two IBM OpenPowerreg 720 servers (Table 34) [11] with POWER5trade processors in other tests
Server IBM Power 570
CPU 2 x 64-bit Dual-Core IBM POWER6 (47 GHz) 4 MB L2 cache per core 32 MB L3 cache shared per two cores
Memory 32 GB (667 MHz DDR2)
Network Dual-Port Gigabit Ethernet
Internal Storage 1 x SAS controller with 2 x 300 GB 15K rpm SAS drives
Threading Simultaneous multi-threading (SMT) technology
Table 33 ndash IBM Power 570 configuration
SOA Performance on Linux Page 10
Server IBM OpenPower 720
CPU 2 x 64-bit Dual-Core IBM POWER5 (15 GHz) 19 MB L2 cache 36 MB L3 cache
Memory 16 GB
Network Dual-Port Gigabit Ethernet
Internal Storage 1 x SAS controller with 4 x 36 GB 72 GB 15K rpm SAS drives
Threading Simultaneous multi-threading (SMT) technology
Table 34 ndash IBM OpenPower 720 configuration
All servers are connected to a Cisco Systems Catalyst 3750 Series Gigabit Switch (Model WS-C3750G-24TS-S)
32 Software
The Linux operating system on the IBM System x3850 M2 server is Novell SUSE Linux Enterprise Server (SLES) 10 Service Pack (SP) 1 for AMD64 and EM64T (x86_64)
The Linux operating system on the IBM Power 570 and OpenPower 720 is Novell SUSE Linux Enterprise Server (SLES) 10 Service Pack (SP) 1 for PPC (ppc64)
The operating system on the workload driver system (IBM System x3650) is Novell SUSE Linux Enterprise Server (SLES) 10 Service Pack (SP) 2 for AMD64 and EM64T (x86_64)
All servers run with WebSphere Application Server (WAS) V61017 WebSphere Process Server V6102 and WebSphere Virtual Enterprise V6104
SOA Performance on Linux Page 11
4 Performance results First let us look at how we can tune Linux and WebSphere components for Web services We then examine how we can tune those components for routing and transformation mediations on Web services Finally we discuss how to create an optimal environment for business processes using those Web services
41 Tuning Web services
For tuning Web services let us consider the setup illustrated in Figure 411 The Workload Driver generates Web service requests to the benchmarkrsquos ClaimServices application using the Service Oriented Access Protocol (SOAP) implemented on top of the HTTP transport protocol [9] The Workload Driver uses up to 50 concurrent threads to generate as many service requests as the ClaimServices application can handle The server that hosts the Web services (that is the one that runs WPS and the ClaimServices application) is an IBM Power 570 server with POWER6 processors Alternatively we also configure an x86 server ndash an IBM x3850 M2 server ndash as the Web server While we focus on the performance results obtained on the Power 570 server we will note the performance data obtained on the x3850 M2 server as well The Workload Driver runs on a separate x86 server (an IBM x3650)
Figure 411 ndash Setup for tuning Web services
Figure 412 shows the geometric means of the service request rates obtained for each of the tuning items considered in this section
Figure 412 ndash Performance impact of tuning items
SOA Performance on Linux Page 12
bull Out-of-the-box configuration The leftmost column in Figure 412 shows the geometric mean of the Web service request rates in the out-of-the-box configuration ndash with all default settings for WebSphere Application Server and Linux Note that administrative security is enabled in the default profile for WebSphere Application Server Enforcing security involves additional overhead for authentication and access validation
Result This configuration has a geometric mean score of 725490 requests per second on the Power 570 server
bull Without administrative security As mentioned previously administrative security is enabled in the default profile for WebSphere Application Server Enforcing security involves additional overhead for authentication and access validation If there is no requirement to enforce administrative security it is better to create a WebSphere Application Server profile with administrative security disabled
Result As shown in Figure 412 the geometric mean score is 744544 requests per second on the Power 570 server ndash a 26 improvement over the out-of-the-box configuration On an x86 server (x3850 M2) disabling administrative security yields an 86 improvement over the out-of-the-box configuration
bull JVM heap tuning In the Java world the JVM heap configuration has a significant impact on performance Several parameters are available for tuning the JVM heap for better performance Two basic JVM heap parameters are the size of the heap and the garbage collection policy
The size of the WAS JVM heap is probably the most important factor for its performance A too-small heap causes garbage collection to happen more frequently A too-large heap causes garbage collection to happen less frequently or to take longer to compact the large heap There are several tools available such as the Tivolireg Performance Viewer (included with WebSphere) that can help analyze and monitor the heap usage and garbage collection so that the heap can be specifically tuned for a particular workload
The default size of the JVM heap is typically too small In our tests by looking at the number of memory pages allocated to the heap that are actually in use while the Web service scenarios are being run we find that the heap usage is between 1536 MB and 2048 MB As a result we set the JVM heap size to 2048 MB This larger heap gives us a significant performance improvement over the default heap size Because the Power 570 server has 32 GB of physical memory which is more than adequate for our tests we set the minimum and maximum heap size to the same value (2048 MB) to avoid the overhead of frequent heap size changes and to ensure optimal performance
In addition to the JVM heap size the garbage collection policy can also affect performance The WAS JVM supports four different garbage collection policies The default garbage collection policy is optthruput During a garbage collection cycle under the optthruput policy all application threads are stopped for mark sweep and compaction if needed The garbage collector scans all the objects in the heap marking any object that is in use sweeps up the unused objects reclaims their memory and then compacts the remaining memory to reduce fragmentation The entire process can take some time All application threads are paused while the garbage is collected Consequently the optthruput policy results in longer garbage collection pause times but more often than not it yields the best overall throughput However we decided to use the gencon (Generation Concurrent) garbage collection policy which handles short-lived objects differently from long-lived objects because our testing shows that the gencon policy is more suitable for Web service scenarios Under the gencon policy the heap is split into new and old segments Long-lived objects are promoted to the old space while short-lived objects are garbage collected quickly in the new space (called a nursery)
We set the size of the nursery to 1536 MB (75 of the total heap size) by going through the WAS
SOA Performance on Linux Page 13
Administration Console
1 Go to Servers rarr Application Servers rarr server name rarr Server Infrastructure rarr Java and Process Management rarr Process Definition rarr Additional Properties rarr Java Virtual Machine
2 Enter ndashndashndashndash Xgcpolicygencon ndashXmn1536M in the Generic JVM arguments field Note that the JVM heaprsquos maximum and minimum sizes can also be set on this page In our test both the minimum and maximum heap sizes were set to 2048 MB
Result The WAS JVM Heap Tuning column in Figure 412 shows the geometric mean of the Web service request rates on the Power 570 server with the WAS JVM heap size of 2048 MB gencon garbage collection policy and a 1536 MB nursery The geometric mean score is
979722 requests per second ndash an improvement of more than 35 over the out-of-the-box configuration On an x86 server (x3850 M2) increasing the WAS JVM heap size to 2048 MB results in a 75 performance improvement over the out-of-the-box configuration and switching the garbage collection policy to gencon yields another 7 performance gain
bull Huge page support in Linux One of the factors to consider in system performance is memory
access Processors keep a cache of mappings from virtual addresses to physical addresses in a translation look-aside buffer (TLB) so that they do not have to walk through the page tables for every virtual address used The TLB holds a fixed number of entries When the processor encounters a virtual address that is not in the TLB called a TLB miss it must walk the virtual address through the page tables to get its physical address The new mapping is then written to the TLB overriding an existing entry Linux has support for huge pages (sometimes also known as large pages) Normal pages are 4 KB in size but the size of each huge page is 16 MB in the Power architecture and 2 MB in the Intel x86 architecture The use of huge pages can improve memory performance in two ways First with huge pages a single entry in the TLB maps to more memory therefore fewer TLB entries are needed to map an area of memory With fewer TLB entries the frequency of TLB misses is reduced Secondly the page table setup for mapping huge pages uses one less table to determine the physical addresses thus making virtual-to-physical-address mapping for huge pages faster than for normal pages Since the WAS JVM heap size is set to 2048 MB (larger than the default size) the CPU overhead of managing and keeping track of memory in this large heap can be reduced by exploiting the huge page support that is provided in the Linux kernel To allow WAS JVM heap to use huge pages we must first enable Linux to create and maintain a pool of huge pages On the Power 570 server we created a pool of 3 GB of huge pages (a total of 192 of 16 MB huge pages) by adding the following lines to the etcsyscltconf file Number of huge pages (192 x 16 MB = 3 GB)
vmnr_hugepages = 192
Size of shared memory is set to 4 GB (4294967296 bytes)
kernelshmmax = 4294967296
kernelshmall = 4294967296
(Note that we set the amount of shared memory to 4 GB so that there would be enough room for the 3 GB of huge pages in the shared memory pool) Result The Huge Page Support column in Figure 412 shows the result that is obtained by exploiting the Linux huge page support on the Power 570 server The geometric mean of the Web service request rates is now 999953 requests per second which is another 21 improvement over what we are able to achieve by tuning the WAS JVM heap Cumulatively the WAS JVM heap tuning and the huge page support yield a total of 38 performance improvement over the out-of-the-box configuration on the Power 570 On an x86 (x3850 M2) server with the huge page size of only 2 MB we find that huge pages only help when the Java heap is
SOA Performance on Linux Page 14
constrained to a size that cannot accommodate all objects if the heap could be made large enough huge pages would not make much difference
bull HTTP connection settings Several WAS Web Container settings can be tweaked for maximum concurrency in our tests If there are not enough HTTP connections available incoming clients cannot connect until a connection is freed If the servers CPUs are not fully utilized if there is no memory constraint and if there is available network bandwidth the number of persistent HTTP connections for each port can be increased from the default value of 100 for better performance In our tests setting the maximum number of HTTP persistent requests to unlimited gave us a noticeable performance improvement over what we had with WAS JVM tuning and huge page support The results are shown in Figure 412
To change the number of HTTP connections available for a given port we used the WAS Administration Console as follows
1 Go to Servers rarr Application Servers rarr server name rarr Communications and click Ports
2 Find the port number in the table and click on View associated transports for that port 3 Click on the transport chain that is listed 4 Click on HTTP inbound channel (HTTP_n) where n denotes channels 1 to 4 5 Either click on Maximum persistent requests per connection and enter a number in the
Specify maximum number of persistent requests field or click Unlimited persistent requests per connection
Result As shown in the Unlimited HTTP Connections column in Figure 412 the geometric mean of the Web service request rates on the Power 570 is 1060797 requests per second which is another 61 improvement over what we are able to achieve by tuning the WAS JVM heap and exploiting the huge page support Together with the WAS JVM heap tuning and huge page support the Unlimited HTTP connection setting cumulatively yields a total of 46 performance improvement over the out-of-the-box configuration on the Power 570 server On an x86 (x3850 M2) server the Unlimited HTTP connection setting produces an 83 improvement
bull Thread pool settings There is another area that we can tune for maximum concurrency the number of threads available to service requests from the clients For example threads in the Web Container thread pool are used for handling incoming HTTP and Web service requests These thread pools are shared by all applications that are deployed on the server so in many cases these pools need to be larger than their default sizes We experiment with larger maximum numbers of threads in the default thread pool as well as the Web container thread pool These numbers partly depend on the number of CPUs on the Web server because the more CPUs we have the more threads can be executed concurrently In our test setup the Power 570 server has two dual-core POWER6 processors and if we take simultaneous multi-threading (SMT) into account we would actually have eight logical processors that can be seen by Linux Based on recommendations from the WebSphere Performance Team with eight logical processors we set the maximum number of threads in the default thread pool to 200 (default value is 20) and in the Web container thread pool to 100 (default value is 50) However we find that in our tests just increasing the thread pool maximum values alone would actually degrade the performance because the JVM heap would become too small to accommodate the higher number of threads that can be executed concurrently To get any performance benefit from the larger thread pools we would need a larger JVM heap Our test results confirm that larger thread pools together with a larger 3-GB JVM heap yield a small but noticeable performance improvement
Changing the number of threads in a thread pool can be done through the WAS Administration Console as follows
1 Go to Servers rarr Application Servers rarr server name rarr Additional Properties rarr Thread Pools
SOA Performance on Linux Page 15
2 Click the thread pool that you want to change and enter new values in the Maximum Size fields
Result The Thread Pool Tuning column in Figure 412 shows the cumulative performance impact of WAS JVM heap tuning (including the larger 3-GB heap) huge page support Web container tuning and larger thread pools on the Web services (in terms of average requests per second) The geometric mean of the Web service request rates on the Power 570 is now 1079384 requests per second ndash another 18 improvement over what the preceding configuration All of our tuning items so far have yielded a total of 49 performance improvement over the out-of-the-box configuration on the Power 570 server On the x3850 M2 server however we find that larger thread pools do not make much performance difference
bull Disabling Performance Monitoring Infrastructure (PMI) To further optimize the performance of Web services in our tests we next turned off all performance monitoring tracing and logging These are often necessary when setting up a server or when debugging problems or issues but they do introduce some performance overhead As a result it is recommended that tracing and monitoring be used judiciously and whenever possible turned off entirely to ensure optimal performance Disabling the WAS Performance Monitoring Infrastructure (PMI) can be done through the WAS Administration Console as follows
1 Go to Monitoring and Tuning rarr Performance Monitoring Infrastructure (PMI) rarr server name
2 Clear the Enable Performance Monitoring Infrastructure (PMI) box and in the Currently Monitored Statistic Set box select None
Result The Disabling PMI column in Figure 412 shows the performance of Web services when we disable all performance monitoring tracing and logging (on top of the previous tunings that we have done) The geometric mean of the Web service request rates on the Power 570 is now 1087847 requests per second ndash another 08 improvement over the preceding configuration On the x3850 M2 server disabling PMI only results in a negligible 04 performance improvement
Summary All of the tuning items discussed in this section have yielded a cumulative total of 50 performance improvement over the out-of-the-box configuration on the Power 570 server On the x3850 M2 server the same tuning items produce 120 improvement over the out-of-the-box configuration due to the 75 performance improvement when the WAS JVM heap is increased to 2048 MB From the data shown in Figure 412 it is clear that tuning the WAS JVM heap (increasing the heap size to 2 GB using the gencon garbage collection policy with a nursery size of 15 GB) gives us the most performance gain followed by setting the maximum number of persistent HTTP connections for Web container ports to unlimited Other tuning items produce discernable but not significant performance benefits
Finally we want to see if there is any performance bottleneck in the most optimal configuration ndash with all tuning items applied ndash in our setup Although it varies a little during different Web service invocations the CPU utilization on the Power 570 server never goes above 80 The network throughput between the Workload Driver and the Power 570 server always remains below 50 Mbytess ndash well within the available bandwidth of the private Gigabit Ethernet network in our laboratory As for the physical memory usage on the Power 570 server the entire workload uses only 6 GB of the 32 GB of physical memory available The disk IO traffic is fairly negligible ndash less than 100 Kbytessec on the Power 570 server Similarly no performance bottleneck is observed on the x3850 M2 Web server
42 Tuning routing and transformation service mediations
For tuning routing and transformation service mediations consider the setup illustrated in Figure 421 The Workload Driver generates Web service requests which go through the service mediations provided by the Enterprise Service Bus (ESB) before getting to the benchmarkrsquos ClaimServices application that is hosted on WebSphere Application Server The Workload Driver is a stand-alone multi-threaded HTTP
(Web
SOA Performance on Linux Page 16
client which uses up to 50 threads with 20 maximum transactions to generate SOAP service requests to the ClaimServices application The service mediations include XSLT transformation and route-on-body mediations In other words the Web service mediation tests have the following characteristics
bull Stand-alone multi-threaded HTTP client to produce SOAP service requests bull Synchronous SOAP HTTP request and response invocation bull XSLT transformation and route-on-body service mediations bull ClaimServices application hosts Web services
The Web services and the ESBrsquos service mediations are hosted on an IBM Power 570 server with POWER6 processors We also consider an IBM x3850 M2 for this role and its performance data is noted in this section along with the data for the Power 570 server The Workload Driver runs on another server ndash an IBM x3650
WESB
Claim Service
Service providers Workload Driver
50 threads (20
maximum transactions)
Enterprise Service Bus
Service Mediations
Service Requests and Responses (SOAP HTTP)
Figure 421 ndash Setup for tuning Web service mediations
Our testing indicates that WebSphere JVM heap optimization Linux huge page support and tuning for maximum concurrency appear to yield the most performance improvement for service mediation scenarios Let us first look at the service mediation performance with the payload size set to 3 KB for both service request and response messages
bull JVM heap tuning In Section 41 we found that the WAS JVM heap configuration had a significant impact on the performance of Web services therefore we are going to start by looking at the WAS JVM heap configuration for the mediation scenarios here As in Section 41 in order to change the WAS JVM heap size or set the garbage collection policy we can use the WebSphere Application Server Administrative Console as follows
o Go to Servers rarr Application Servers rarr server name rarr Server Infrastructure rarr Java and Process Management rarr Process Definition rarr Additional Properties rarr Java Virtual Machine
o Enter new sizes (in MB) in the Initial Heap Size and Maximum Heap Size fields o Enter appropriate JVM command line option for the garbage collection policy into the
Generic JVM arguments field For example if we want to use the gencon garbage collection policy with a nursery size of 1536 MB we would enter -Xgcpolicygencon -Xmn1536M in the Generic JVM arguments field
Result With payload size for both requests and responses set to 3 KB and with the default WAS JVM settings we could only achieve an average Web service request rate of 11103 requests per second in the Composite Module mediation scenario as shown in Table 421 To optimize the JVM heap we first consider the default GC policy (optthruput) By setting both the initial JVM heap size and the maximum heap size to 2048 MB we immediately get a significant performance boost to 66426 requests per second ndash a 600 improvement The overall garbage collection overhead is 5 which is quite acceptable
Increasing the JVM heap size to 3072 MB yields another 6 performance improvement However increasing the JVM heap size to 4096 MB and beyond does not seem to make much difference As a result we decide to keep the heap size at 3072 MB but try to see if we could optimize the heap usage further by switching to another garbage collection policy
SOA Performance on Linux Page 17
The WAS JVM supports four different garbage collection policies as shown in Table 422 With the JVM heap size kept at 3072 MB the Generational Concurrent (gencon) garbage collection policy delivers the best performance for the Composite Module mediation scenario ndash as shown in Table 421 The optavgpause policy delivers the worst performance The subpool policy which is available only on IBM System p and zreg
servers produces approximately the same performance as the default policy (optthruput) but not as good as the gencon policy
Based on the data in Table 421 we can conclude that the gencon garbage collection policy together with the JVM heap size of 3072 MB represent the most optimal JVM heap configuration for the Composite Module mediation scenario (with payload size of 3KB for both requests and responses) on the Power 570 server In fact as Figure 421 shows this optimal WAS JVM heap configuration accounts for the largest performance gain across all Web service mediation scenarios considered in our study However on the x3850 M2 server we find that the best WAS JVM heap configuration requires a much larger heap ndash 6144 MB ndash with the gencon garbage collection policy
Table 421 ndash Impact of tuning on Composite Module mediation scenario with payload size of 3 KB on the Power 570 server
GC Policy JVM Command Line Option Description Optimize for throughput -Xgcpolicyoptthroughput (default) This is the default policy It is typically used for
applications where raw throughput is more important than short GC pauses The application is paused every time while garbage is being collected
Optimize for pause time -Xgcpolicyoptavgpause This policy trades high throughput for shorter GC pauses by performing some of the garbage collection concurrently The application is paused for shorter periods
Generational concurrent -Xgcpolicygencon This policy handles short-lived objects differently from long-lived objects Applications that have many short-lived objects can see shorter pause times with this policy while still producing good throughput
Subpooling -Xgcpolicysubpool This policy uses an algorithm similar to the default policy but employs an allocation strategy that is more suitable for multiprocessor machines This policy is recommended for SMP machines with 16 or more processors This policy is only available on IBM pSeriesreg and zSeriesreg platforms Applications that need to scale on large machines can benefit from this policy
Table 422 ndash Garbage collection policies supported in WebSphere 61
SOA Performance on Linux Page 18
Impact of Tuning on WESB Mediations (Power 570)
(50 Client Threads 20 Max Transactions
Request Response Payload Size = 3KB)
0
500
1000
1500
2000
2500
Composite Module
Xform Value Xform Namespace Xform Schema Route on Body
WESB Service Mediation Scenarios
Th
rou
gh
pu
t (R
eq
sS
ec
)
Default Configuration
JVM Heap Tuning
Huge Page Support
Concurrency Tuning
Figure 421 ndash Cumulative performance impact of WAS JVM heap tuning Linux huge page support and WAS concurrency tuning
bull Huge page support in Linux With the WebSphere JVM heap size now set to 3072 MB the CPU overhead of managing and keeping track of memory in this large heap can be reduced by exploiting the Huge (Large) Page support provided in the Linux kernel The Power processors support huge page size of 16 MB while x86 processors support only 2 MB huge page size Huge pages are configured in Linux by adding the following lines to the etcsysctlconf file
vmnr_hugepages = ltnumber of pagesgt kernelshmmax = ltnumber of bytesgt kernelshmall = ltnumber of bytesgt
In our study we want to configure enough huge pages for the WebSphere JVM heap To allow the WebSphere JVM heap to use huge pages we must first enable Linux to create and maintain a pool of huge pages In our tests we create a 4 GB pool of huge pages by adding the following lines to the etcsysctlconf file
Number of huge pages (256 x 16 MB = 4 GB) vmnr_hugepages = 256 Size of shared memory is set to 6 GB (6442450944 bytes) kernelshmmax = 6442450944 kernelshmall = 6442450944
(Note that we set the amount of shared memory to 6 GB so that there would be enough room for 4 GB pool of huge pages in the shared memory pool)
The WebSphere JVM can then be configured to use huge pages by adding the parameter -Xlp in the same ldquoGeneric JVM argumentsrdquo box where the garbage collector parameters are set
The data in Figure 421 shows that the huge page support does not result in any significant performance improvement for the transformation mediation scenarios that have a payload size of 3 KB although it does yield a noticeable (8) performance gain for the routing mediation scenario This is somewhat expected because the transformation operations on 3 KB payloads are not expected to cross normal 4 KB page boundaries too frequently On the other hand route-
SOA Performance on Linux Page 19
on-body service mediations involve fetching certain values in the message bodies and then based on those values jumping to different Web services in memory at comparatively higher service request rates (more than 2000 requests per second) This would cause more cache and TLB misses than other mediation types so the huge page support is expected to help here Indeed it provides an 8 performance improvement for routing mediation scenarios Similar behavior is also observed on the x3850 M2 server
bull Tuning for maximum concurrency After optimizing the JVM heap memory usage the next area for potential performance improvement is concurrency There are several WebSphere Web Container settings that can be tweaked for maximum concurrency If there are not enough HTTP connections available incoming service requests cannot connect until a connection is freed If the servers CPUs are not fully utilized if there is no memory constraint and if there is available network bandwidth the number of persistent HTTP connections for each port can be increased from the default value of 100 to improve the serverrsquos performance In our tests we found that setting the maximum number of HTTP persistent requests to unlimited gave us a noticeable performance gain
To change the number of HTTP connections available for a given port we used the WAS Administration Console as follows
1 Go to Servers rarr Application Servers rarr server name rarr Communications and click Ports
2 Find the port number in the table and click on View associated transports for that port
3 Click the transport chain that is listed
4 Click HTTP inbound channel (HTTP_n) where n denotes channels 1 to 4
5 Either click Maximum persistent requests per connection and enter a number in the Specify maximum number of persistent requests field or click Unlimited persistent requests per connection
There is another area that we can tune for maximum concurrency the number of threads available to service requests from the clients For example threads in the Web Container thread pool are used for handling incoming HTTP and Web service requests These thread pools are shared by all applications that are deployed on the server therefore in many cases these pools need to be larger than their default sizes
Changing the number of threads in a thread pool can be done through the WAS Administration Console as follows
1 Go to Servers rarr Application Servers rarr server name rarr Additional Properties rarr Thread Pools
2 Click on the thread pool you want to change and enter new values in the Maximum Size fields
We experiment with larger maximum numbers of threads in the default thread pool as well as the Web Container thread pool These numbers partly depend on the number of CPUs on the server because the more CPUs we have the more threads can be executed concurrently The Power 570 server has two dual-core POWER6 processors with simultaneous multi-threading (SMT) enabled so thatrsquos eight logical processors working in parallel To ensure that we have enough available threads in the thread pools we increase the maximum number of threads in the default thread pool to 200 (default value is 20) and in the Web Container thread pool to 100 (default value is 50)
To further optimize the performance of Web service mediation scenarios in our tests we turn off all performance monitoring tracing and logging These are often necessary when setting up a server or when debugging problems or issues but they do introduce some performance overhead As a result it is recommended that tracing and monitoring be used judiciously and whenever possible turned off entirely to ensure optimal performance
SOA Performance on Linux Page 20
Disabling the WebSphere Performance Monitoring Infrastructure (PMI) can be done through the WAS Administration Console as follows
1 Go to Monitoring and Tuning rarr Performance Monitoring Infrastructure (PMI) rarr server name
2 Clear the Enable Performance Monitoring Infrastructure (PMI) box and in the Currently Monitored Statistic Set box select None
Figure 421 shows the cumulative impact of increasing the maximum number of persistent HTTP connections the maximum number of threads in the default and Web Container thread pools as well as disabling PMI These tweaks provide the most performance gain for the Transform Value mediation scenario ndash a 6 gain over what we are able to achieve with optimal JVM heap configuration and huge page support The Transform Value mediation scenario is the least compute-intensive of all scenarios considered in our study and therefore it can sustain relatively high service request rates so setting up for maximum concurrency resulted in a sizable performance boost In contrast the other transformation mediation scenarios are much more compute-intensive and have relatively low service request rates so tuning for maximum concurrency does not help much Similar observations can be made on the x3850 M2 server
bull Impact of large payload sizes Let us now look at the performance of the Web service mediation scenarios with payload (message) sizes greater than 3 KB Figures 422 through 426 show the impact of the tuning items on these mediation scenarios with payload sizes greater than 3 KB
As payload size increases the Web service rates (throughput) drop as expected The size of the drop in throughput depends on the amount of processing that is required to perform the mediation on the payload in the service requests and responses For example Figure 422 shows that the Composite Module mediation scenario posts approximately the same throughput for both Request = 3 KB Response = 10 KB and Request = 10 KB Response = 3 KB configurations because the same amount of mediation processing is done on both requests and responses On the other hand the fact that the Transform Value mediation scenario posted approximately the same throughput for both Request = 10 KB Response = 3 KB and Request = 10 KB Response = 10 KB configurations as shown in Figure 423 indicates that the Transform Value mediation is only performed on requests (not responses) because the difference in the response payload size does not affect throughput The relatively high throughput for the Transform Value and Route-On-Body mediation scenarios indicates that the amount of processing required to perform these mediations is less than the processing required by the other mediations
It is important to note that the default WebSphere settings do not have enough capacity to even support payload sizes greater than 3 KB (all scenarios would fail after some time) Setting the initial and maximum JVM heap sizes to 1024 MB is the first step that allows all mediation scenarios to complete successfully Indeed the JVM heap optimizations discussed earlier in this section account for the largest performance improvement across all mediation scenarios ndash regardless of payload sizes
For many mediation scenarios such as Composite Module and Transform Schema the Linux huge page support provides larger performance gains at payload sizes greater than 3 KB This is expected because performing transformations on payloads larger than 3 KB would cross normal 4 KB page boundaries more frequently therefore huge pages would help in these cases
Concurrency tuning (which includes setting the maximum persistent HTTP connections to unlimited increasing the sizes of the default and Web Container thread pools as well as disabling all performance monitoring tracing and logging) provides larger benefits at higher throughput In fact based on the data in Figures 422 through 425 it appears that concurrency tuning only provides noticeable performance gains at service request rates higher than 600 requests per second
SOA Performance on Linux Page 21
Figure 427 shows the optimized performance for transformation mediation scenarios at different payload sizes As the payload size increases the Web service request rate drops due to larger computational requirements for performing transformation and routing mediations on larger payloads In fact as we increase the payload size to 100 KB for both requests and responses the eight processor cores on the Power 570 server start to become the limiting factor the CPU utilization approaches 99 preventing us from obtaining higher throughput
Similar observations can also be made on the x3850 M2 server ndash with the exception of the Transform Value mediation scenario The Transform Value scenario requires the least amount of computational power because it is the simplest among the mediation scenarios considered in our study therefore it can sustain relatively high service request rates On the x3850 M2 with its 16 processor cores the network actually becomes the performance limiting factor before the CPUs in the Transform Value scenario with 100-KB payloads the network traffic between the client and the server is measured approaching 500 Mbps limiting the CPU utilization on the x3850 M2 to less than 80
Summary On the Power 570 server the default WebSphere and Linux settings can only support 3 KB payloads in the service requests and responses for the Web service mediation scenarios considered in our study Setting the WAS JVM heap size to 3072 MB and using the Generational Concurrent (gencon) garbage collection policy yield more than 600 performance improvement The Linux huge page support provides another 8 performance boost for routing mediations and the concurrency tuning yields an average of 6 performance improvement for all mediation scenarios across different payload sizes However as we increase the payload size to 100 KB the CPU utilization on the Power 570 server approaches 99 so the server CPUs become the limiting factor preventing us from obtaining higher throughput Similar observations can be made for the x3850 M2 server ndash except for the Transform Value mediation scenario where the network actually becomes the performance bottleneck before the CPUs as the payload size is increased to 100 KB
Impact of Tuning on Composite Module Mediation
(Power 570 Server)
0
100
200
300
400
500
600
700
800
Baseline JVM Heap Tuning
Huge Page Support
Concurrency Tuning
Th
rou
gh
pu
t (R
eq
ss
ec)
Req=3K Resp=3K
Req=3K Resp=10K
Req=10K Resp=3K
Req=10K Resp=10K
Req=100K Resp=100K
Figure 422 ndash Impact of tuning on Composite Module mediation at different payload sizes
SOA Performance on LinuxPage 22
Impact of Tuning on Transform Value Mediation
(Power 570 Server)
0
500
1000
1500
2000
2500
Baseline JVM Heap Tuning
Huge Page Support
Concurrency Tuning
Th
rou
gh
pu
t (R
eq
ss
ec)
Req=3K Resp=3K
Req=3K Resp=10K
Req=10K Resp=3K
Req=10K Resp=10K
Req=100K Resp=100K
Figure 423 ndash Impact of tuning on Transform Value mediation at different payload sizes
Impact of Tuning on Transform Namespace Mediation
(Power 570 Server)
0
200
400
600
800
1000
1200
1400
1600
1800
Baseline JVM Heap Tuning
Huge Page Support
Concurrency Tuning
Th
rou
gh
pu
t (R
eq
ss
ec
)
Req=3K Resp=3K
Req=3K Resp=10K
Req=10K Resp=3K
Req=10K Resp=10K
Req=100K Resp=100K
Figure 424 ndash Impact of tuning on Transform Namespace mediation at different payload sizes
SOA Performance on Linux Page 23
Impact of Tuning on Transform Schema Mediation
(Power 570 Server)
0
100
200
300
400
500
600
700
800
900
Baseline JVM Heap Tuning
Huge Page Support
Concurrency Tuning
Th
rou
gh
pu
t (R
eq
ss
ec)
Req=3K Resp=3K
Req=3K Resp=10K
Req=10K Resp=3K
Req=10K Resp=10K
Req=100K Resp=100K
Figure 425 ndash Impact of tuning on Transform Schema mediation at different payload sizes
Impact of Tuning on Route On Body Mediation
(Power 570 Server)
0
500
1000
1500
2000
2500
Th
rou
gh
pu
t (R
eq
ss
ec
)
Req=3K Resp=3K
Req=10K Resp=10K
Baseline JVM Heap Tuning Huge Page ConcurrencySupport Tuning
Figure 426 ndash Impact of tuning on Route On Body mediation at different payload sizes
HandleClaim
Javabased
WorkloadDriver
ClaimServices
BPEDBSIBDBLOGS
WPS DB2
SOA Performance on Linux Page 24
Optimized Performance of Transform Mediations
(Power 570 Server 50 Client Threads 20 Max Transactions)
0
500
1000
1500
2000
2500
3K 3K 3K 10K 10K 3K 10K 10K 100K 100K
Request - Response Payload Size
Th
rou
gh
pu
t (R
eq
ss
ec)
Composite Module
Transform Value
Transform Namespace
Transform Schema
Figure 427 ndash Optimized performance for transformation mediation scenarios across different payload sizes
43 Tuning business process management (no clustering)
First let us consider the setup illustrated in Figure 431 where everything runs on a single IBM Power 570 server In this setup both WPS and DB2 are installed on an IBM Power 570 with dual POWER6 processors (a total of four Processing Units or cores) Both HandleClaim and ClaimServices applications are also installed and executed on this server There is a single disk where the BPEDB SIBDB and all WPS logs for transaction and compensation services reside The data for this configuration is shown in the first two rows in Table 431 under Configurations 1 and 11
IBM Power 570IBM Power 570IBM x3650IBM x3650
-
HandleClaim
Java-based
Workload Driver
ClaimServices
BPEDB SIBDB LOGS
WPS DB2
Figure 431 ndash Single server setup (Configurations 1 and 11)
SOA Performance on Linux Page 25
Table 431 ndash Tuning business process management (non-cluster)
As you can see in Table 431
bull Default configuration Configuration 1 shows the out-of-the-box configuration where there is no tuning Result In this configuration the benchmark cannot even run The default configuration for the WAS JVM is too small to handle the necessary processing for the benchmark used in our study
bull JVM heap tuning Configuration 11 shows what happens when we tune the WAS JVM heap configuration Two basic JVM heap parameters are the size of the heap and the garbage collection policy Several tools are available such as the Tivoli Performance Viewer (included with WebSphere) that can help analyze and monitor the heap usage and garbage collection so that the heap can be specifically tuned for a particular workload In our tests by looking at the number of memory pages allocated to the heap that are actually in use while the benchmark scenarios are being run we find that the heap usage is usually at 2048 MB As a result we set the JVM heap size for WAS at 2048 MB Because the Power 570 server has 32 GB of physical memory which is more than adequate for our tests we set the minimum and maximum heap size to the same value (2048 MB) to avoid the overhead of frequent heap size changes In addition to the JVM heap size the garbage collection policy can also affect performance The WAS JVM supports four different garbage collection policies The default garbage collection policy is optthruput However we decided to use the gencon (Generation Concurrent) garbage collection policy which handles short-lived objects differently from long-lived objects because our earlier testing for Web service scenarios showed that the gencon policy was more
suitable for Web service scenarios [12] Under the gencon policy the heap is split into new and old segments Long-lived objects are promoted to the old space while short-lived objects are garbage collected quickly in the new space (called a nursery) We also set the size of the nursery to 1536 MB (75 of the total heap size) through the Integrated Solution Console (ISC)
1 Go to Servers rarr Application Servers rarr server name rarr Server Infrastructure rarr
Java and Process Management rarr Process Definition rarr Additional Properties rarr Java Virtual Machine
2 Set the Initial Heap Size and Maximum Heap Size fields to 2048 MB
3 Enter ndashndashndashndash Xgcpolicygencon ndashXmn1536M in the Generic JVM arguments field Result Tuning the WAS JVM heap configuration allows the benchmark to run but its overall throughput is only 259 business transactions per second (BTPS) The data in Table 431 for Configuration 11 shows that the CPU utilization for the IBM Power 570 server is 53 while the disk utilization for the single disk is 996 This single disk is obviously the system performance bottleneck
bull Adding another server for DB2 Configuration 2 in Table 431 shows the result of our effort to remove the single disk as the system performance bottleneck First we use another server ndash the IBM x3850 M2 ndash as the DB2 server and move the BPEDB and SIBDB databases over to the disk
RECLOG
TXLOG
Javabased
WorkloadDriver
BPEDBSIBDBBPELOGS
WPS DB2
HandleClaim
ClaimServices BPEDBSIBDBBPELOGS
BPEDBSIBDBBPELOG
PEDBIBDBBPELOGS
PEDBIBDBBPELOGS
SOA Performance on Linux Page 26
arrays attached to the x3850 M2 This configuration is illustrated in Figure 432 More specifically we partition the workload as follows
o The x3850 M2 server runs the HumanTaskSimulator DB2 and hosts the databases on its disk arrays
BPEDB on a 24-disk array attached to the IBM System Storagetrade DS3400 controller
BPE logs on a 12-disk array attached to the IBM ServeRAID MR10M controller SIBDB on a 12-disk array attached to the same IBM ServeRAID MR10M
controller
o The Power 570 server now only runs WPS and the benchmarkrsquos HandleClaim and ClaimServices applications We also make some additional improvements on this serverrsquos configuration
One disk for transaction logs only Another separate disk for compensation (recovery) logs only The WAS JVM heap size increased from 2048 MB to 4096 MB with the nursery
size set to 3072 MB (75 of the heap size)
Result With these changes the overall benchmark throughput is now 217 BTPS ndash a significant improvement over 259 BTPS for Configuration 11
IBM Power 570 IBM x3850 M2IBM Power 570 IBM x3850 M2 Disk ArraysDisk ArraysIBM x3650IBM x3650
-
REC LOG
TX LOG
Java-based
Workload Driver
B S
WPS DB2
HandleClaim
ClaimServices B S BPEDB
SIBDB BPE LOG
Figure 432 ndash Separate WPS and DB2 servers (Configurations 2 21 22 and 3)
bull WASWPS concurrency optimization Configuration 21 in Table 431 shows the performance impact of additional WAS and WPS tuning that maximizes concurrency These are recommended by the WebSphere Performance Teams [13] In particular since the Power 570 server has a total of four cores or eight logical CPUs with simultaneous multi-threading (SMT) we follow the recommendations for eight CPUs in setting the following parameters
o Thread pools Default thread pool max = 200 Web containerrsquos thread pool max = 100
o Connection pools BPEDB data sourcersquos connection pool max = 150 CEI ME data sourcersquos connection pool max = 80 SIBDB system data sourcersquos connection pool max = 30 SIBDB BPC data sourcersquos connection pool max = 50
o J2C connection factories BPECF connection pool max = 40 BPECFC connection pool max = 40 HTMCF connection pool max = 20
o J2C activation specifications BPEInternalActivationSpec Custom properties maxConcurrency = 60 ltBenchmarkgt Custom properties maxConcurrency = 40
SOA Performance on Linux Page 27
Result With the concurrency optimizations we essentially double the benchmarkrsquos overall throughput to 457 BTPS (as compared to 217 BTPS for Configuration 2)
bull DB2 tuning Configuration 22 in Table 431 shows the performance impact of applying DB2 tunings to optimize the log data rates We set the following DB2 parameters
o Max storage for lock list (4 KB) = 400 o Log buffer size (4 KB) = 512 o Log file size (4 KB) = 8000 o Number of primary log files = 10 o Number of secondary log files = 10 o Maximum number of active applications = 250 o Average number of active applications = 50 o Percent log file reclaimed before soft checkpoint = 300 o Percentage of lock lists per application = 20 o Buffer pool size (pages) = 64000
Result As can be seen in Table 431 tuning DB2 delivers a benchmark throughput rate of 4628 BTPS ndash only a small improvement (13) over what we are able to get for Configuration 21 Table 431 also shows that this Configuration 22 has the CPU utilization of the WPS server (Power 570) at 97 and the disk utilization at 67 and 60 respectively for transaction and compensation (recovery) logs This indicates that the system performance bottleneck is no longer the disk subsystem but rather the Power 570rsquos two dual-core POWER6 processors Adding more processors to the WPS Server would certainly increase the benchmark throughput ndash provided that some J2C Connection Factories and Activation Specifications would also be increased to accommodate the higher number of processors as recommended by the WebSphere Performance Team [13]
bull Cache mirroring in the IBM System Storage DS3400 Configurations 3 and 31 in Table 431 show the performance impact of the cache mirroring capability in the DS3400 Starting with Configuration 3 we also use a more powerful Power 570 server Cache mirroring which is the default setting on the DS3400 can remain enabled for reliability or availability reasons In our setup the BPEDB disk array is attached to the DS3400 controller In Configuration 3 in order to achieve higher benchmark throughput we disable cache mirroring In Configuration 31 we leave the cache mirroring enabled (the default setting)
Result As we can see in Table 431 with cache mirroring enabled the disk array utilization for BPEDB jumps from 30 to 47 and the benchmark throughput drops from 6112 BTPS to 5584 BTPS ndash an 86 performance drop This is a classic trade-off between performance and reliabilityavailability
bull Reducing WAS JVM heap size in memory-constrained environment Configuration 32 in Table 431 shows the impact of reducing the WAS JVM heap size from 4096 MB to 2048 MB This could be necessary in memory-constrained environments
Result Reducing the WAS JVM heap from 4096 MB to 2048 MB drops the benchmarkrsquos overall throughput from 5584 BTPS to 4456 BTPS a significant 20 performance drop As a result it is highly recommended that the WAS JVM heap be adjusted accordingly after adding CPUs to the WPS server
bull Write-back caching in IBM ServeRAID MR10M controller Configuration 33 in Table 431 shows what happens when we use write-through caching policy in the MR10M disk array controller (instead of write-back) Write-back caching is always good for the performance of disk writes because the disk write operations are considered done as soon as the data is written to the cache (instead of physical disks) Data in the cache would then be written (ldquoflushedrdquo) to physical disks at a later time However in an environment where there is no battery backup for the controller or for the disk subsystem write-through caching could help protect the integrity of data
SOA Performance on Linux Page 28
when there is a power outage In our setup the SIBDB and BPE log disk arrays are attached to the MR10M controller
Result Using the write-though caching policy for the SIBDB disk array results in a 6 performance drop ndash from 4456 BTPS with write-back caching in Configure 32 to 4179 BTPS with write-through caching in this Configuration 33 Note that for Configuration 33 in Table 431 the utilization of the disk array for BPEDB jumps to 70 because we now use a single 24-disk array for both BPEDB and BPE logs However our test data (not shown in Table 431) indicates that the 70 utilization of the disk array does not have any noticeable impact on the benchmark throughput This is because even at 70 utilization the disk IO queue depth for the 24-disk array is still less than 1 indicating that the disk array is not the performance bottleneck In fact this is lower than the CPU utilization (75) for the WPS server
bull Linux logical disk striping In Configurations 3 and 31 the utilization for the disks holding the transaction log and compensation (recovery) log on the WPS server is quite high ndash around 80 for transaction log and 75 for compensation log While this is still lower than the CPU utilization it would be interesting to try to lower the disk utilization and see if that would have any impact on the benchmarkrsquos overall throughput We do not have any extra disk array controller that could be installed in the WPS server but we have two extra disks that could be used to set up a four-disk logical array through the Linux Logical Volume Manager (LVM) to handle both transaction and compensation log traffic
Result Table 432 shows the results For a four-disk logical array the stripe size of 64 KB provides better performance than smaller stripe sizes of 4 KB and 16 KB given that the size of each log data write is between 4 KB and 5 KB The utilization of the device manager is found to be over 90 while the utilization of each individual disk ranges from 27 to 36 However dedicating a single disk to each log without any logical disk striping produces the best benchmark throughput even though we use only two disks and each disk is used more than 75 of the time This indicates that the overhead of the Linux logical volume manager in managing a logical disk array has a negative performance impact when it comes to transaction and compensation logs on the WPS server As a result for the rest of our study we dedicate a single physical disk for each WPS log
Table 412 ndash Logical disk striping (through Linux Logical Volume Manager)
bull Linux large (huge) page support We configure large (huge) pages (16 MB page size) on the Power 570 server (WPS server) for the WAS JVM heap and find that it does not result in any performance improvement In fact with large page support the benchmarkrsquos overall throughput decreases from 6112 BTPS (Configuration 3) to 5970 BTPS a performance degradation of about 2 As a result for the remainder of this study we do not configure large pages
Figure 433 shows the cumulative performance improvement as we go from the default (out-of-the-box) configuration to tuning DB2 The tuning items are shown in a chronological order from left to right in the figure
It should also be noted that the x3650 server that hosts the benchmarkrsquos Workload Driver does not have any impact on our performance results because the CPU utilization of this server is less than 5 and the utilization of the only disk used on this server is less than 6
SOA Performance on Linux Page 29
Cumulative Performance Improvement Tuning Business Process Management
Non-Clustered Environment
0
5
10
15
20
25
30
35
40
45
50
Out Of The Box JVM Heap (2GB
gencon)
Add DB2
Server+Disk
Arrays
WASWPS
Concurrency
DB2 Log Tuning
Tuning Actions (Performed in Chronological Order From Left to Right)
Ben
ch
mark
s O
vera
ll
Th
rou
gh
pu
t (B
TP
S)
Figure 433 ndash Cumulative Impact of BPM Tuning Actions in Non-Clustered Environment
44 Tuning dynamic operations with WebSphere Virtual Enterprise (WVE)
In this section we evaluate a virtual goals-driven autonomic environment for SOA applications like the benchmark used in this study We use WebSphere Virtual Enterprise (WVE) to create this environment which is illustrated in Figure 441
The dynamic cluster of WPS servers called application cluster in Figure 441 consists of WPS servers on which the benchmarkrsquos applications are deployed These applications include HandleClaim and ClaimServices applications denoted as B and S respectively In response to an increase in workload demands or an on-going failure to meet a service policyrsquos performance objective WebSphere Virtual Enterprisersquos autonomic managers can start an instance of WPS server on the x3850 M2 server or on any of the two logical partitions (LPARs) on the OpenPower 720 server Based on the results in Section 43 each instance of the WPS server has a single disk for transaction log and another single disk for compensation (recovery) log In Figure 441 the LPARs are virtualized with PowerVM technology so IO operations to these (virtual) disks must go through the Virtual IO Server (VIOS) The LPARs use shared capped virtual CPUs In general it is recommended that we configure shared uncapped virtual CPUs across the LPARs however in this study the number of (virtual) CPUs that each LPAR is allowed to use is capped so that we can more accurately measure the workload impact on each LPAR and the performance impact of logical partitioning
By default there can only be a maximum of one WPS server instance per node in the dynamic application cluster
The service policy in WVE only allows two types of performance goals to be specified ndash the average response time or the percentile response time goals In this study we use the average response time goal for simplicity To set a reasonable response time goal we examine the response times reported in
Javabased
WorkloadDriver
IBMHTTPServer
OnDemandRouter(ODR)
DeploymentManager
NodeAgent
B
S
LPAR 1
B
S
WPS
BPEDBSIBDBLOGSBPEDBSIBDBLOGSBPEDBSIBDBLOGS
NodeAgent
B
S
WPS Human TaskSimulator
SCA SYS
SCA APP
ME Cluster
DB2
DB2
AdjustersUnderwriters
BPEDBSIBDBLOGS
Node Agent
LPAR 2
NodeAgent
VIOS
RECOVERYLOGS
TRANSACTLOGS
TRANSACTLOGS
RECOVERYLOGS
B
S
WPSIntegratedSolutionConsole
B
S
WPS
PEDBIBDBLOGS
PEDBIBDBLOGS
PEDBIBDBLOGS
B
S
WPS
SOA Performance on Linux Page 30
Table 441 for all configurations that we evaluate in this study We note that the best response time that we are able to achieve is about 14 ms As a rule of thumb (best practices) the average response time goal should be at least two times higher than the best response time observed on a lightly loaded cluster Consequently we set the average response time goal in the service policy to be 30 ms This should enable the autonomic managers to activate additional WPS servers (instances) when the average response time for claim requests exceeds 30 ms (the performance goal) Setting the average response time goal too close to 14 ms would never result in additional servers to be started because the autonomic managers would determine that starting additional servers would not improve the chances of meeting the performance goal
We specify the service policy to be applicable to HTTP and SOAP requests that are handled by the benchmarkrsquos applications We also assign the highest priority to this service policy
We use the default settings for the On-Demand Router (ODR) and its associated autonomic managers
As described in Section 23 there are two approaches to cluster the Message Engines (MEs)
bull The Message Engines are local to the dynamic application cluster bull The Message Engines are in their own cluster (called ME Cluster) separate from the dynamic
application cluster
In this section we consider both approaches and see which one performs better In those configurations where the ME Cluster is configured it runs on the x3850 M2 server As such the ME Cluster is a static cluster
IBM OpenPower 720
- -
Disk Arrays
IBM x3850 M2
IBM x3650
ClaimServices Application
HandleClaim Application
Application Cluster
IBM OpenPower 720
Java-based
Workload Driver
IBM HTTP Server
On-Demand Router (ODR)
Deployment Manager
Node Agent
B
S
LPAR 1
B
S
WPS
B S B
S B S
Disk Arrays
IBM x3850 M2
Node Agent
B
S
WPS Human Task Simulator
SCA SYS
SCA APP
ME Cluster
DB2
DB2
Adjusters Underwriters
BPEDB SIBDB LOGS
Node Agent
LPAR 2
Node Agent
VIOS
RECOVERY LOGS
TRANSACT LOGS
TRANSACT LOGS
RECOVERY LOGS
B
S
WPS Integrated Solution Console
IBM x3650
ClaimServices Application
HandleClaim Application
Application Cluster
Figure 441 ndash Dynamic application cluster with separate cluster for Message Engines
SOA Performance on Linux Page 31
In general for the configurations considered in this section the physical servers host the following components (see Figure 441)
bull IBM x3650 server o Benchmarkrsquos Java Workload Driver o WebSphere Deployment Manager o IBM HTTP Server (Web Server) o WebSphere On-Demand Router (ODR) o WebSphere Node Agent
bull IBM x3850 M2 server o DB2 hosting SIBDB and BPEDB databases (including their logs) o Benchmarkrsquos HumanTaskSimulator simulating the actions of adjusters and underwriters o WPS server (initial instance ndash unless otherwise specified) hosting the benchmarkrsquos
HandleClaim and ClaimServices applications o WebSphere Node Agent o ME Cluster (if configured)
bull IBM OpenPower 720 server (VIOS with 05 POWER5 core LPAR1 with 15 POWER5 cores LPAR2 with 20 POWER5 cores)
o Virtual IO Server (VIOS) o LPAR1 WPS server (one instance maximum) and WebSphere Node Agent o LPAR2 WPS server (one instance maximum) and WebSphere Node Agent
On the x3850 M2 server the BPEDB database is hosted on a 24-disk array managed by the IBM System Storage DS3400 controller Because of the large amount of disk writes the BPEDB log resides on a separate 12-disk array that is attached to the IBM ServeRAID MR10M adapter The SIBDB database and its log are hosted on another 12-disk array that is attached to the same MR10M adapter As in Section 43 each WPS server has two disks one dedicated for the transaction log and one for the compensation (recovery) log For optimal performance cache mirroring is disabled for the DS3400 controller and the write-back caching policy is used for the MR10M controller In addition all of the WPS and DB2 tuning items discussed in Section 43 are applied to the WVE environment
For the remainder of this paper we denote the maximum number of concurrent insurance claim requests generated by the benchmarkrsquos Workload Driver as Max Tx and the number of threads used to generate this traffic as simply Threads We will look at two performance measurements the number of business transactions per second (BTPS) as reported by the benchmark and the average response time for service requests as reported by WebSphere Virtual Enterprise
Let us first consider the configurations with the Message Engines in a separate cluster (ME Cluster) The performance results for these configurations are shown in Table 441
bull Single node performance (with separate ME Cluster) Configuration 5 in Table 441 shows what can be achieved with a single node (the x3850 M2 server) in the dynamic cluster The dynamic application cluster is put in Manual Mode so that the autonomic managers do not attempt to activate additional WPS servers on the other nodes ndash even when the average response time exceeds the performance goal of 30 ms
Result With the Workload Driver using two threads to generate a maximum of 60 concurrent requests (Max Tx = 60 Threads = 2) the x3850 M2 is able to handle an average of 2829 BTPS The CPU utilization on the x3850 M2 is 83 and the disk subsystem still has quite a bit of bandwidth available (the disk IO queue depth is less than 060) The average response time for the claim requests ranges from 2285 ms with a Max Tx of 20 to 5274 ms with a Max Tx of 60 Setting the maximum number of concurrent requests higher than 60 introduces some instability only a few runs are completed successfully as the CPU utilization moves above 90
SOA Performance on Linux Page 32
Table 441 ndash Performance data for dynamic cluster configurations
bull Multi-node performance (with separate ME Cluster) Configuration 51 in Table 441 shows that we can achieve higher service rates when we put the dynamic application cluster in Automatic Mode This allows the On-Demand Routerrsquos autonomic managers to activate additional servers on the OpenPower 720rsquos LPARs automatically (without human intervention) to help handle the workload generated by the benchmarkrsquos Workload Driver This configuration is illustrated in Figure 441
Initially after we turn on the benchmarkrsquos Workload Driver (with Max Tx = 20 Threads =1) the initial WPS server running on the x3850 M2 takes a while to warm up During this warm-up period the average response time for service requests exceeds the service goal of 30 ms for more than 30 seconds as shown in Figure 442 The autonomic managers sense this condition and generate a runtime task to activate additional WPS servers on the clusterrsquos remaining nodes The runtime task appears on the System Administration View of the Integrated Solutions Console (ISC) at approximately 2 minutes after the start of the run Since the application cluster is in Automatic Mode the runtime task starts immediately without further human intervention after it appears on the ISC It takes about 2 minutes for the new WPS servers to be activated on the two LPARs on the OpenPower 720 server Finally about 4 minutes after the start of the run the WPS servers on the LPARs start running Of course these new servers need time to warm up and that is the reason for the initial high response times recorded on these servers
In the mean time as the new WPS servers are starting on the LPARs their Message Engines are starting to run in the ME cluster on the x3850 M2 causing the average response time on the x3850 M2 server to jump higher as well However after about 90 seconds the average response time on the x3850 M2 starts to stabilize and falls to about 1877 ms ndash well below the service goal of 30 ms and better than the best average response time in the single-node configuration (Configuration 5) This shows the benefit of offloading the workload to new additional servers in the dynamic cluster However on the OpenPower 720 the LPARs (with 15 POWER5 cores for LPAR1 and 20 POWER5 cores for LPAR2) that host the new servers are not powerful enough to achieve a response time of less than 30 ms for the service requests sent to them Because of this the maximum throughput data collected at each node indicates that the On-Demand Router routes more service requests to the more powerful x3850 M2 server than to the two POWER5 LPARs
SOA Performance on Linux Page 33
Dynamic Workload Management
w WebSphere Virtual Enterprise
0
100
200
300
400
500
600
700
800
0 30 100
130
200
230
300
330
400
430
500
530
600
630
Time (MinSec)
Resp
on
se T
ime (
ms) x3850M2 (4 x 4-Core Intel
X7350)
P5 LPAR (PowerVM 15 PUs)
P5 LPAR (PowerVM 2 PUs)
Service Goal
Figure 442 ndash WebSphere Virtual Enterprisersquos autonomic managers activating additional WPS servers
After everything settles down the best benchmark throughput that we can get for this multi-node configuration is 3556 BTPS a 25 improvement over the single-node configuration In addition as can be seen in Table 441 the multi-node configuration provides more stability at much higher workloads (up to Max Tx = 160 Threads = 4) than the single-node configuration At the highest workloads (Max Tx = 160 Threads = 4) the CPU utilization is 92 93 and 86 for LPAR1 LPAR2 and x3850 M2 servers respectively indicating that we are running out of CPU bandwidth on the LPARs The disk subsystem is still okay with the maximum IO queue depth of 104 and the disk with the highest utilization (70) being the compensation log disk in LPAR2
Figure 443 shows the throughput that is contributed by each node in the dynamic cluster As the workload increases the throughput at the LPARs begins to level off running out of CPU bandwidth However with 16 processor cores the x3850 M2 just keeps going while the ODR sends more requests to it
bull Multi-node performance (with separate ME Cluster and without PowerVM) Configuration 52 in Table 441 shows the benchmark throughput when we effectively remove the PowerVM virtualization layer from the OpenPower 720 server In the previous configuration (Configuration 51) because we are running out of CPU bandwidth and the disk utilization is high on the LPARs with Max Tx = 160 and Threads = 4 removing the virtualization layer might result in higher benchmark throughput To do this we only configure a single LPAR on the OpenPower 720 server assign all CPUs (4 cores) and memory to this single LPAR and remove the Virtual IO Server (VIOS) All IO operations now go directly to the disk subsystem without going through the VIOS reducing the IO latency This configuration is illustrated in Figure 444
SOA Performance on Linux Page 34
Node Throughput (As Seen By WebSphere Virtual Enterprises Autonomic Managers)
3-Node Dynamic Cluster with Remote ME Cluster and PowerVM
0
5
10
15
20
25
30
1 20 1 40 1 60 2 60 2 80 3 80 3 100 4 160
Threads MaxTx
Th
rou
gh
pu
t (B
TP
S)
x3850 M2 (16-core)
P5 LPAR (15-core)
P5 LPAR (2-core)
Figure 443 ndash Node throughput as reported by WebSphere Virtual Enterprise
Result As can be seen in Table 441 this configuration is now able to support up to 6 threads with MaxTx = 160 and the overall benchmark throughput is now 4047 BTPS a 14 improvement over Configuration 51 The CPU utilization on the x3850 M2 server now moves above 90 but the disk subsystem still has available bandwidth because the disk IO queue depth is 126 and the highest disk utilization is only 50 If we look at the data for MaxTx = 160 Threads = 4 and compare it against the data for the same workload in the previous configuration we see that the average response time on the single 4-core LPAR is less than half the response times observed on the 15-core LPAR1 and 2-core LPAR2 in the previous configuration While the maximum throughput observed at the single 4-core LPAR is about 10 higher than the sum of maximum throughput for both LPAR1 and LPAR2 in the previous configuration it is interesting to note that the performance of the WPS server running on the x3850 M2 is also better (that is lower average response time higher maximum throughput) This indicates that a single 4-core LPAR can offload more workload from the x3850 M2 than both the 15-core LPAR1 and 2-core LPAR2 can in the previous configuration Later on in this paper we will measure the performance impact of the VIOS more accurately
bull Single-node performance (with local Message Engines) Configuration 6 in Table 441 shows the performance data when using only a single node (x3850 M2) with local Message Engines running in the same dynamic cluster as the WPS servers
Result The data indicates that for this single-node configuration with local Message Engines the benchmark throughput is much higher and the average response time is much lower than in Configuration 5 where we have remote Message Engines located in a separate cluster Depending on the workload level the extra latency in going to Message Engines in a remote cluster results in 30 - 60 drop in the benchmark throughput and 25 - 40 jump in the average service response time Consequently having the Message Engines running locally in
Javabased
WorkloadDriver
IBMHTTPServer
OnDemandRouter(ODR)
DeploymentManager
NodeAgent
B
S
LPAR 1
B
S
WPS
BPEDBSIBDBLOGSBPEDBSIBDBLOGSBPEDBSIBDBLOGS
NodeAgent
B
S
WPS Human TaskSimulator
SCA SYS
SCA APP
ME Cluster
DB2
DB2
AdjustersUnderwriters
BPEDBSIBDBLOGS
Node Agent
RECOVERYLOGS
TRANSACTLOGS
IntegratedSolutionConsole
B
S
WPS
PEDBIBDBLOGS
PEDBIBDBLOGS
PEDBIBDBLOGS
SOA Performance on Linux Page 35
the same cluster as the applications is faster in the single-node configuration but it severely limits the scalability of a multi-node configuration a fact that is very obvious when we consider the next configuration
IBM OpenPower 720
- -
Disk Arrays
IBM x3850 M2
IBM x3650
ClaimServices Application
HandleClaim Application
Application Cluster
IBM OpenPower 720
Java-based
Workload Driver
IBM HTTP Server
On-Demand Router (ODR)
Deployment Manager
Node Agent
B
S
LPAR 1
B
S
WPS
B S B
S B S
Disk Arrays
IBM x3850 M2
Node Agent
B
S
WPS Human Task Simulator
SCA SYS
SCA APP
ME Cluster
DB2
DB2
Adjusters Underwriters
BPEDB SIBDB LOGS
Node Agent
RECOVERY LOGS
TRANSACT LOGS
Integrated Solution Console
IBM x3650
ClaimServices Application
HandleClaim Application
Application Cluster
Figure 444 ndash Dynamic application cluster with separate ME Cluster but without PowerVM
bull Multi-node performance (with local Message Engines) Configuration 61 in Table 441 shows the performance data obtained for a two-node application cluster with local Message Engines This application cluster is illustrated in Figure 445 When we start the Workload Driver the initial WPS server runs on a two-core POWER5 LPAR As the CPU utilization on this LPAR quickly rises above 90 and the average service response time is far above the service goal of 30 ms the autonomic managers generate a runtime task to activate the remaining node (the x3850 M2) in the cluster However even after a new WPS server is started on the x3850 M2 most (approximately 80) of the workload still goes to the initial node (the two-core POWER5 LPAR) leaving the second node (the x3850 M2) under-utilized ndash the CPU utilization on the x3850 M2 is only 13 The benchmarkrsquos overall throughput (94 BTPS) is much smaller than in the case with remote Message Engines (3556 BTPS) This is because of a design limitation for the Service Integration (SI) buses if a Message-Driven Bean (MDB) has a local ME available it is always forcibly ldquoboundrdquo to it even if the ME is inactive Because only one ME instance can be active at any given time only one WPS server can have active instances of that MDB In other words all but one of the WPS servers in the cluster is essentially in stand-by mode This imposes serious limitation on the overall scalability of the dynamic cluster if we have long-running business processes or asynchronous SCA invocations As a result for multi-node dynamic clusters we recommend configuring the Message Engines in a separate cluster The WebSphere clustering topologies are classified into three types [4]
o Bronze topology where all components (WPS applications Message Engines CEI) are run in a single cluster
o Silver topology where there are two separate clusters one for WPS applications and CEI and one for the Message Engines
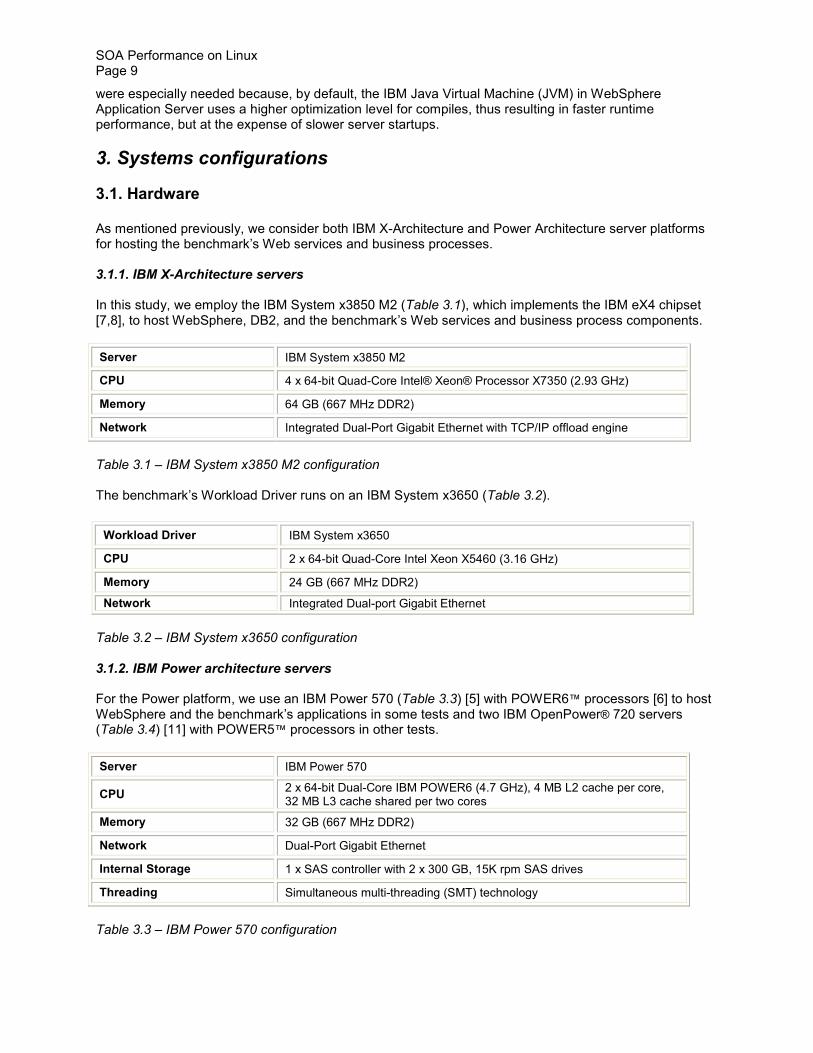
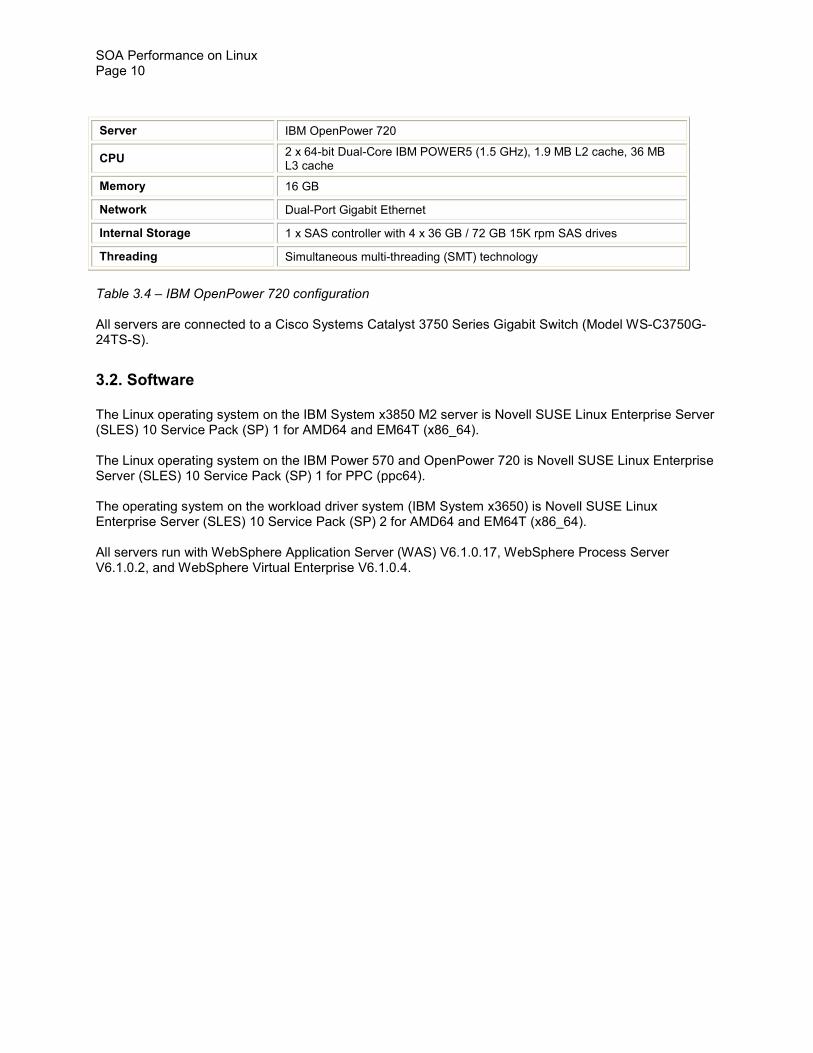
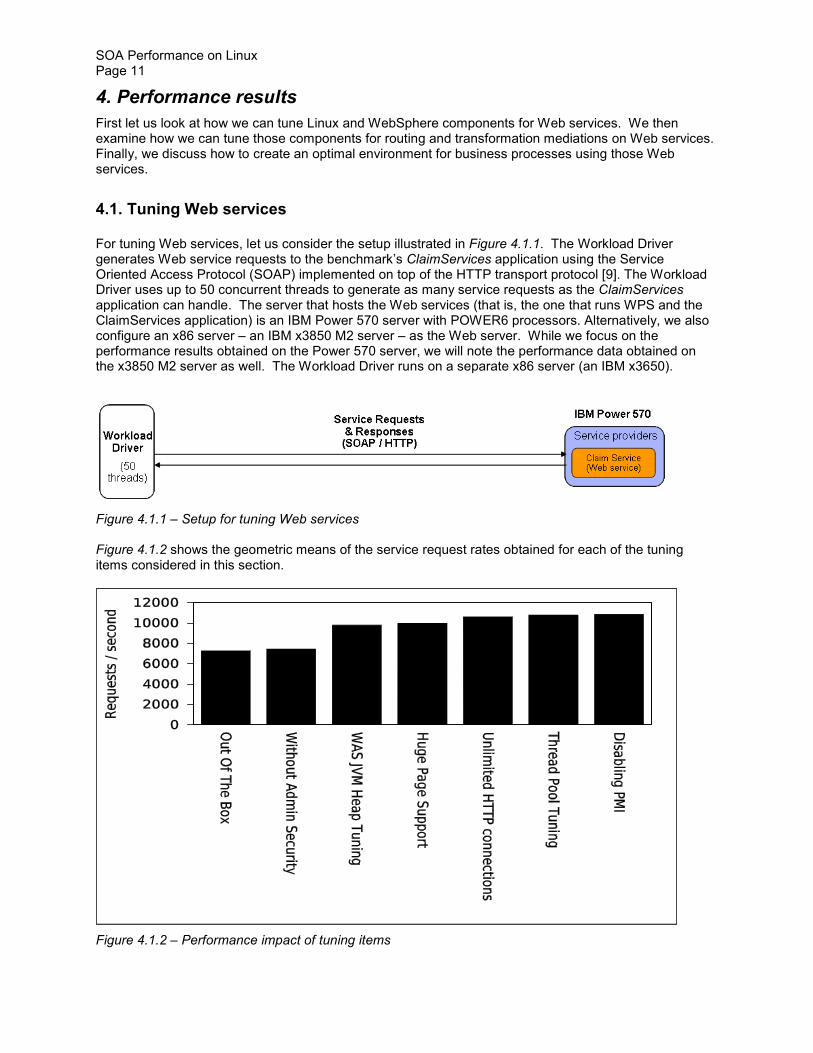
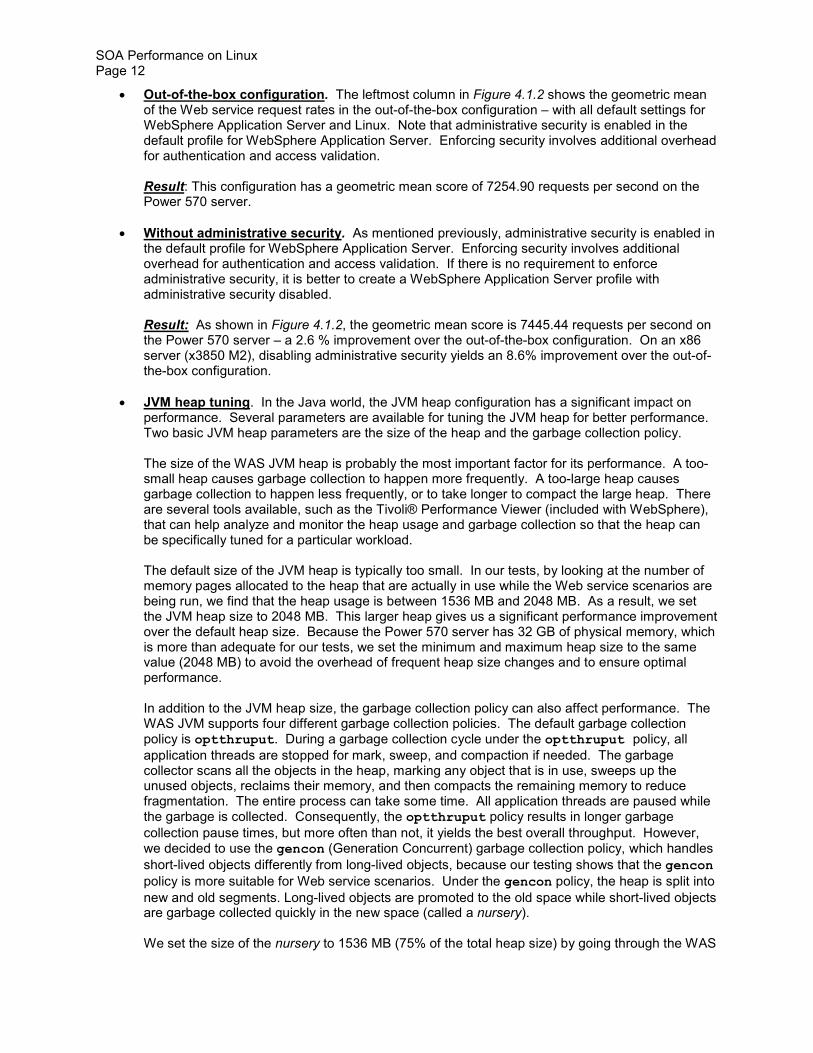
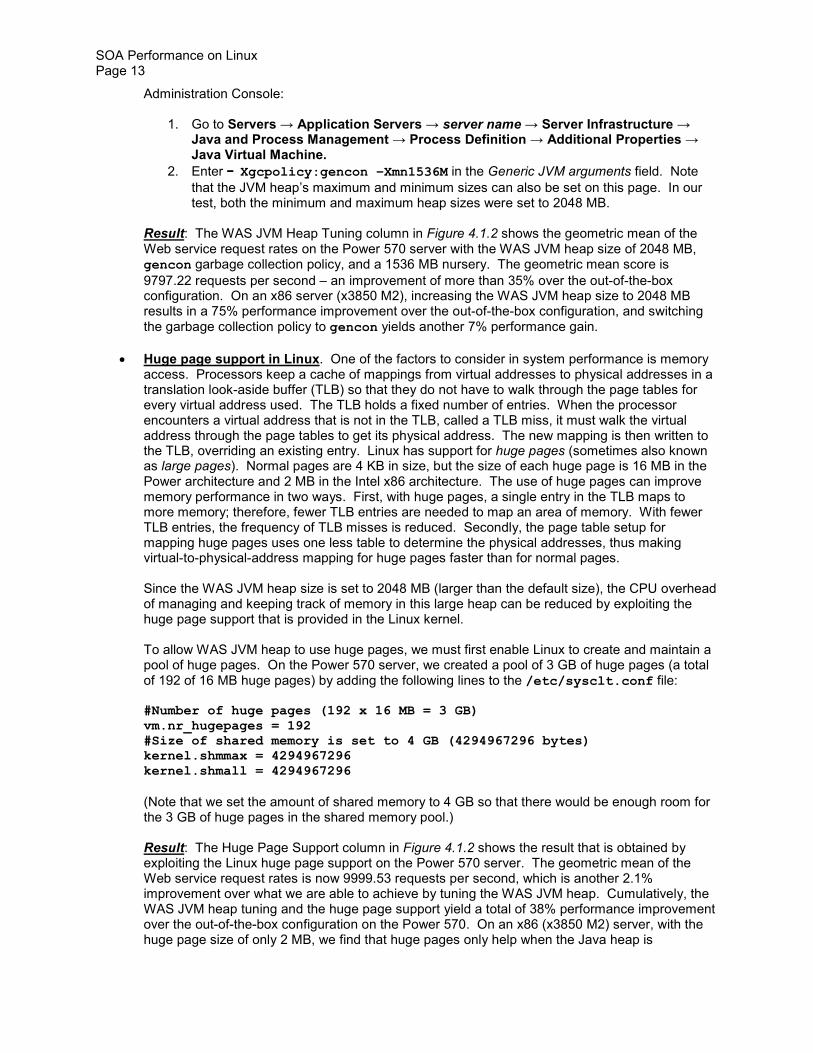
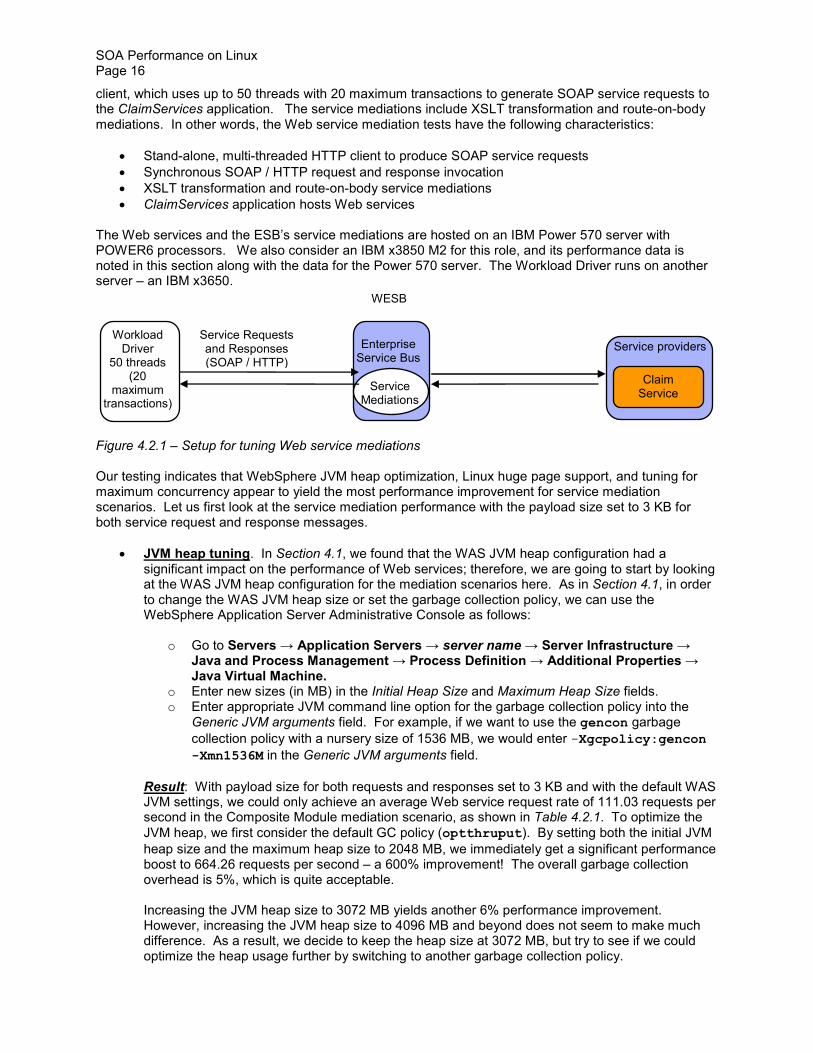
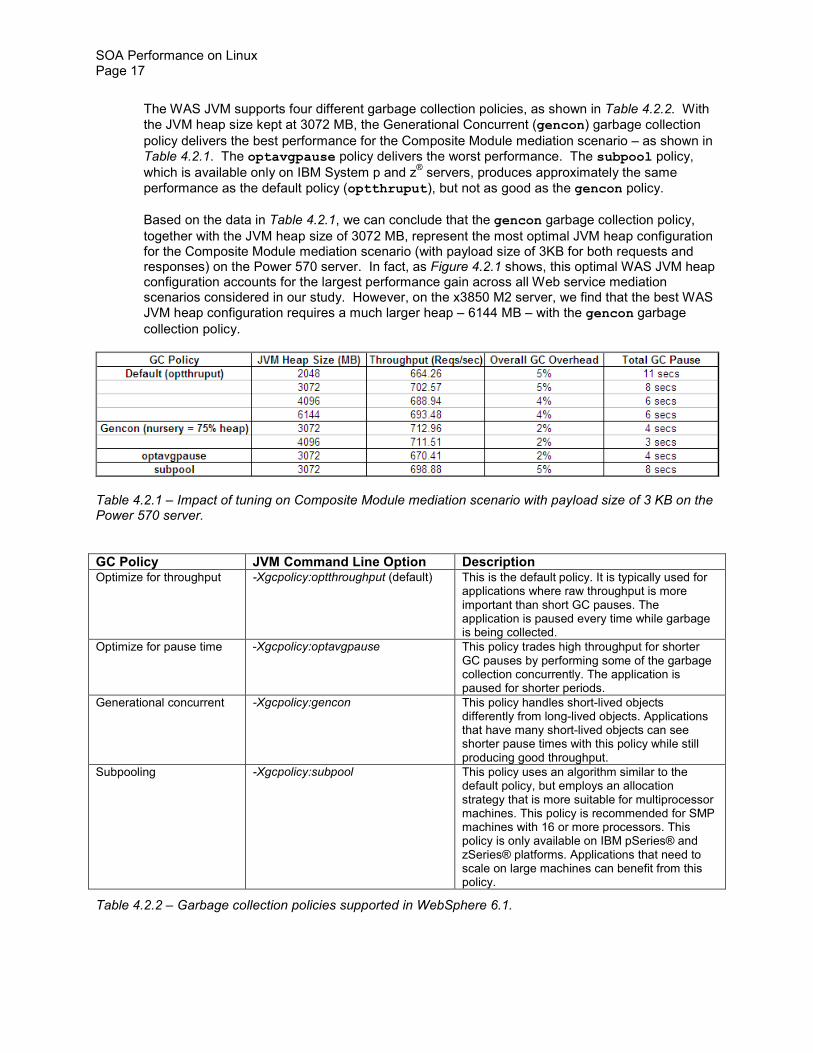
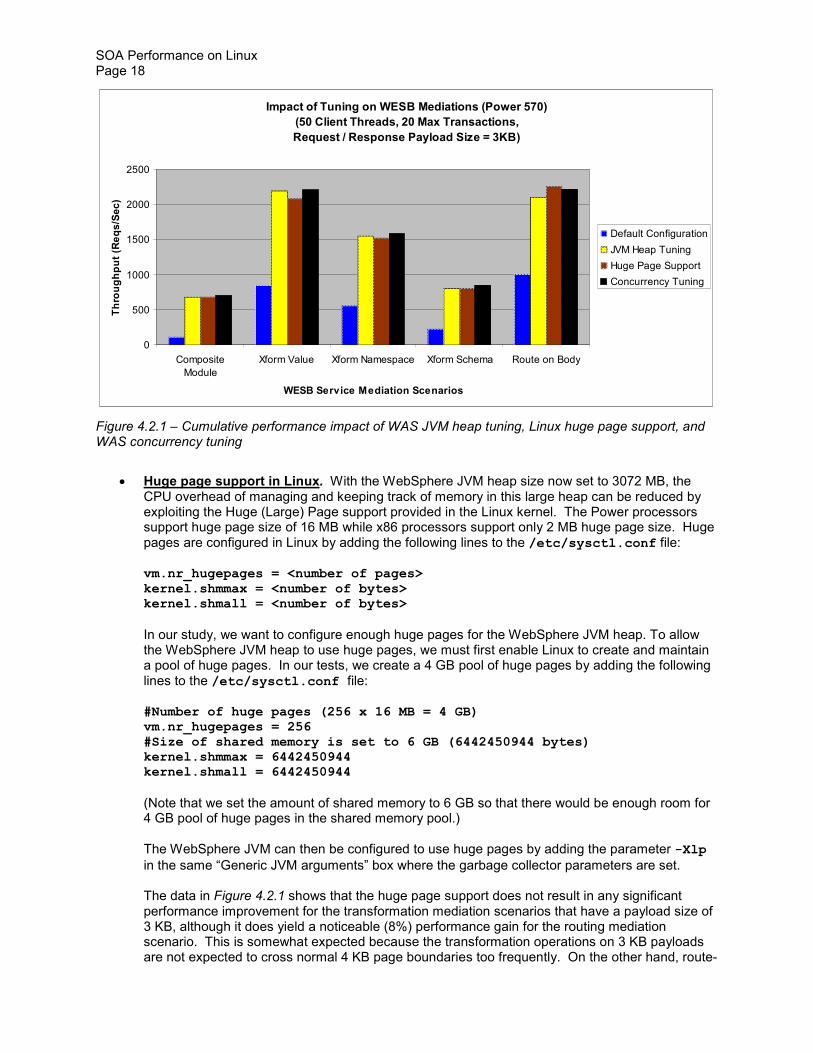
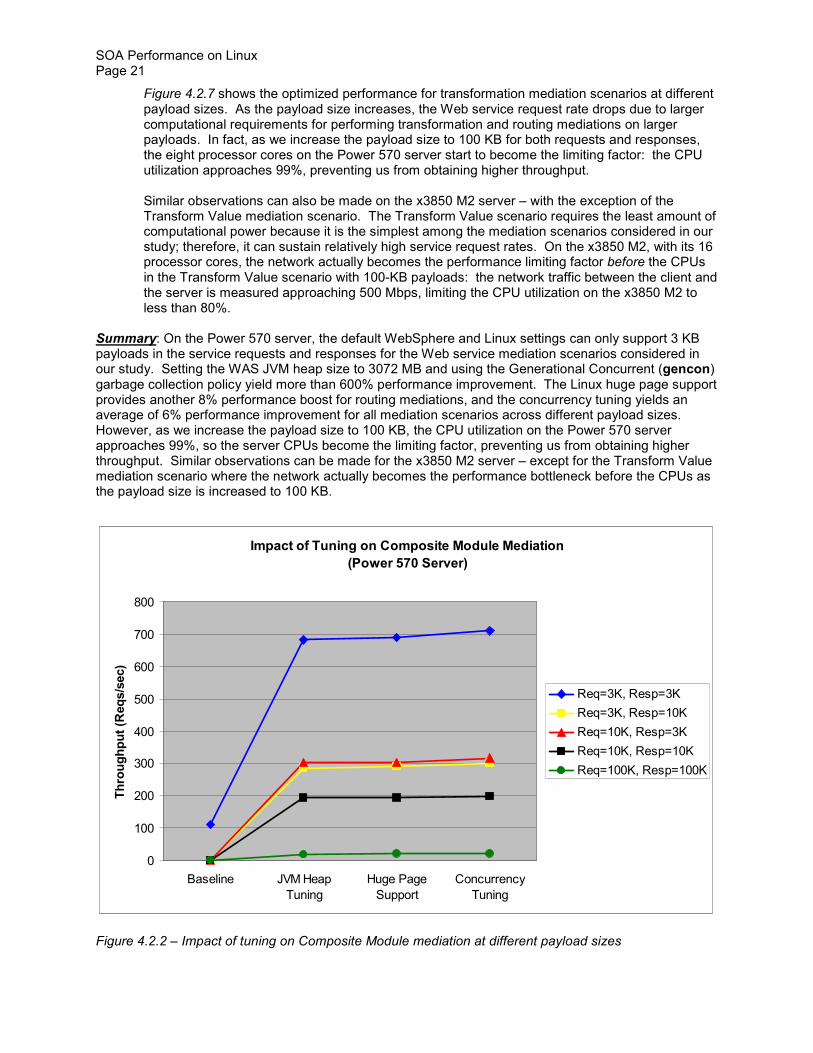
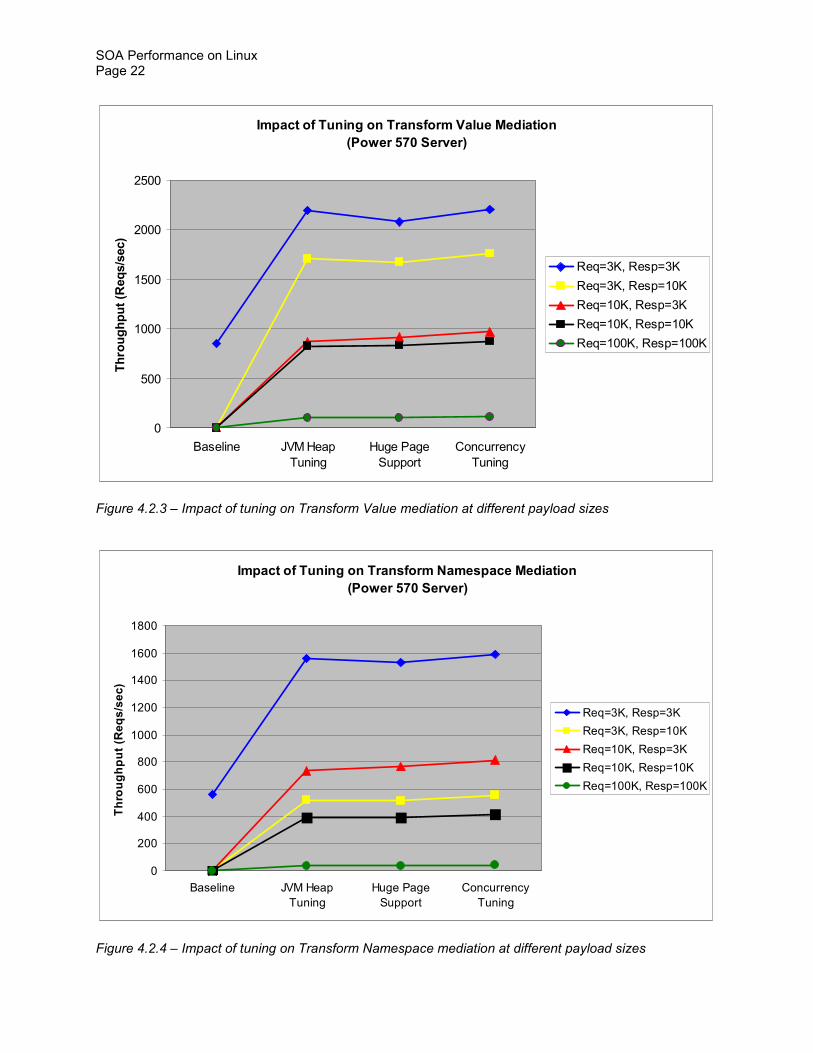
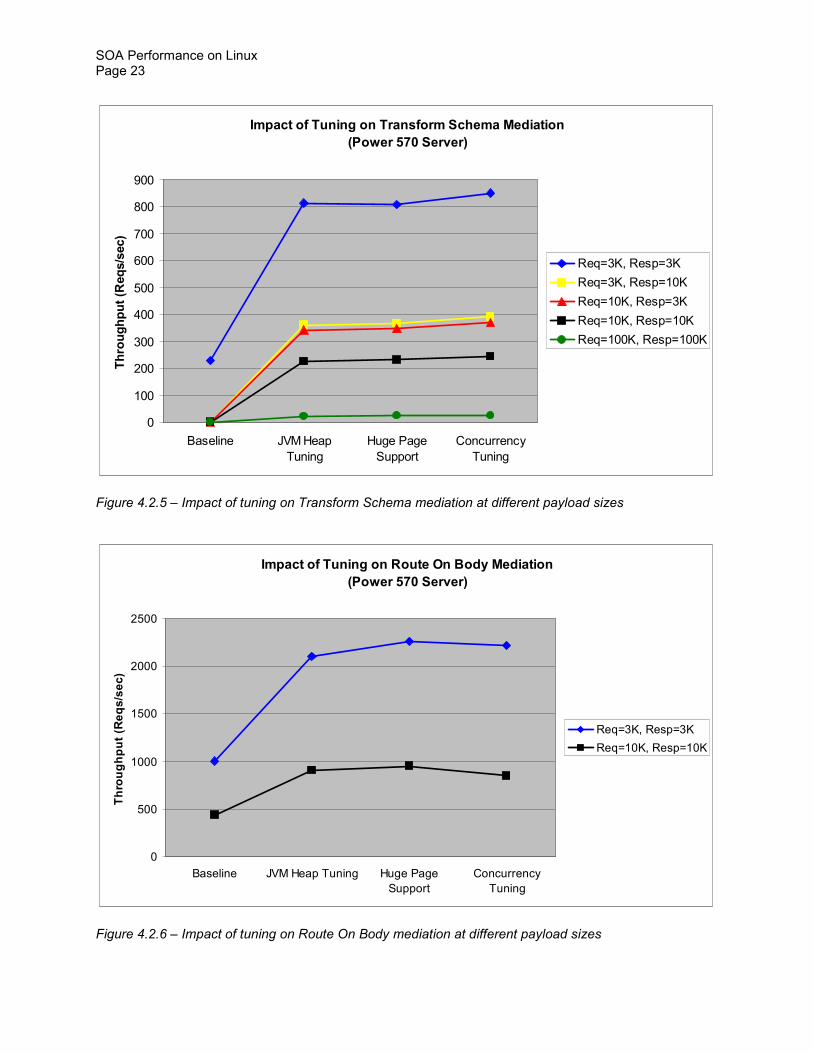
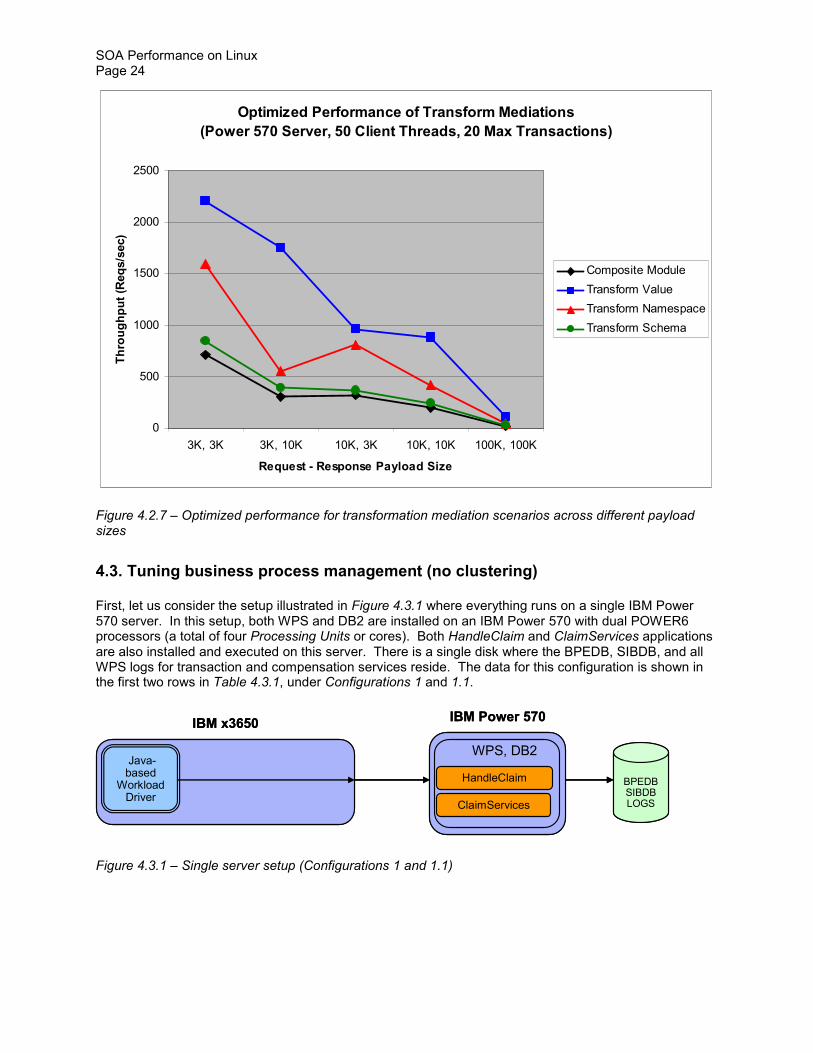
HandleClaim
Javabased
WorkloadDriver
ClaimServices
BPEDBSIBDBLOGS
WPS DB2
SOA Performance on Linux Page 24
Optimized Performance of Transform Mediations
(Power 570 Server 50 Client Threads 20 Max Transactions)
0
500
1000
1500
2000
2500
3K 3K 3K 10K 10K 3K 10K 10K 100K 100K
Request - Response Payload Size
Th
rou
gh
pu
t (R
eq
ss
ec)
Composite Module
Transform Value
Transform Namespace
Transform Schema
Figure 427 ndash Optimized performance for transformation mediation scenarios across different payload sizes
43 Tuning business process management (no clustering)
First let us consider the setup illustrated in Figure 431 where everything runs on a single IBM Power 570 server In this setup both WPS and DB2 are installed on an IBM Power 570 with dual POWER6 processors (a total of four Processing Units or cores) Both HandleClaim and ClaimServices applications are also installed and executed on this server There is a single disk where the BPEDB SIBDB and all WPS logs for transaction and compensation services reside The data for this configuration is shown in the first two rows in Table 431 under Configurations 1 and 11
IBM Power 570IBM Power 570IBM x3650IBM x3650
-
HandleClaim
Java-based
Workload Driver
ClaimServices
BPEDB SIBDB LOGS
WPS DB2
Figure 431 ndash Single server setup (Configurations 1 and 11)
SOA Performance on Linux Page 25
Table 431 ndash Tuning business process management (non-cluster)
As you can see in Table 431
bull Default configuration Configuration 1 shows the out-of-the-box configuration where there is no tuning Result In this configuration the benchmark cannot even run The default configuration for the WAS JVM is too small to handle the necessary processing for the benchmark used in our study
bull JVM heap tuning Configuration 11 shows what happens when we tune the WAS JVM heap configuration Two basic JVM heap parameters are the size of the heap and the garbage collection policy Several tools are available such as the Tivoli Performance Viewer (included with WebSphere) that can help analyze and monitor the heap usage and garbage collection so that the heap can be specifically tuned for a particular workload In our tests by looking at the number of memory pages allocated to the heap that are actually in use while the benchmark scenarios are being run we find that the heap usage is usually at 2048 MB As a result we set the JVM heap size for WAS at 2048 MB Because the Power 570 server has 32 GB of physical memory which is more than adequate for our tests we set the minimum and maximum heap size to the same value (2048 MB) to avoid the overhead of frequent heap size changes In addition to the JVM heap size the garbage collection policy can also affect performance The WAS JVM supports four different garbage collection policies The default garbage collection policy is optthruput However we decided to use the gencon (Generation Concurrent) garbage collection policy which handles short-lived objects differently from long-lived objects because our earlier testing for Web service scenarios showed that the gencon policy was more
suitable for Web service scenarios [12] Under the gencon policy the heap is split into new and old segments Long-lived objects are promoted to the old space while short-lived objects are garbage collected quickly in the new space (called a nursery) We also set the size of the nursery to 1536 MB (75 of the total heap size) through the Integrated Solution Console (ISC)
1 Go to Servers rarr Application Servers rarr server name rarr Server Infrastructure rarr
Java and Process Management rarr Process Definition rarr Additional Properties rarr Java Virtual Machine
2 Set the Initial Heap Size and Maximum Heap Size fields to 2048 MB
3 Enter ndashndashndashndash Xgcpolicygencon ndashXmn1536M in the Generic JVM arguments field Result Tuning the WAS JVM heap configuration allows the benchmark to run but its overall throughput is only 259 business transactions per second (BTPS) The data in Table 431 for Configuration 11 shows that the CPU utilization for the IBM Power 570 server is 53 while the disk utilization for the single disk is 996 This single disk is obviously the system performance bottleneck
bull Adding another server for DB2 Configuration 2 in Table 431 shows the result of our effort to remove the single disk as the system performance bottleneck First we use another server ndash the IBM x3850 M2 ndash as the DB2 server and move the BPEDB and SIBDB databases over to the disk
RECLOG
TXLOG
Javabased
WorkloadDriver
BPEDBSIBDBBPELOGS
WPS DB2
HandleClaim
ClaimServices BPEDBSIBDBBPELOGS
BPEDBSIBDBBPELOG
PEDBIBDBBPELOGS
PEDBIBDBBPELOGS
SOA Performance on Linux Page 26
arrays attached to the x3850 M2 This configuration is illustrated in Figure 432 More specifically we partition the workload as follows
o The x3850 M2 server runs the HumanTaskSimulator DB2 and hosts the databases on its disk arrays
BPEDB on a 24-disk array attached to the IBM System Storagetrade DS3400 controller
BPE logs on a 12-disk array attached to the IBM ServeRAID MR10M controller SIBDB on a 12-disk array attached to the same IBM ServeRAID MR10M
controller
o The Power 570 server now only runs WPS and the benchmarkrsquos HandleClaim and ClaimServices applications We also make some additional improvements on this serverrsquos configuration
One disk for transaction logs only Another separate disk for compensation (recovery) logs only The WAS JVM heap size increased from 2048 MB to 4096 MB with the nursery
size set to 3072 MB (75 of the heap size)
Result With these changes the overall benchmark throughput is now 217 BTPS ndash a significant improvement over 259 BTPS for Configuration 11
IBM Power 570 IBM x3850 M2IBM Power 570 IBM x3850 M2 Disk ArraysDisk ArraysIBM x3650IBM x3650
-
REC LOG
TX LOG
Java-based
Workload Driver
B S
WPS DB2
HandleClaim
ClaimServices B S BPEDB
SIBDB BPE LOG
Figure 432 ndash Separate WPS and DB2 servers (Configurations 2 21 22 and 3)
bull WASWPS concurrency optimization Configuration 21 in Table 431 shows the performance impact of additional WAS and WPS tuning that maximizes concurrency These are recommended by the WebSphere Performance Teams [13] In particular since the Power 570 server has a total of four cores or eight logical CPUs with simultaneous multi-threading (SMT) we follow the recommendations for eight CPUs in setting the following parameters
o Thread pools Default thread pool max = 200 Web containerrsquos thread pool max = 100
o Connection pools BPEDB data sourcersquos connection pool max = 150 CEI ME data sourcersquos connection pool max = 80 SIBDB system data sourcersquos connection pool max = 30 SIBDB BPC data sourcersquos connection pool max = 50
o J2C connection factories BPECF connection pool max = 40 BPECFC connection pool max = 40 HTMCF connection pool max = 20
o J2C activation specifications BPEInternalActivationSpec Custom properties maxConcurrency = 60 ltBenchmarkgt Custom properties maxConcurrency = 40
SOA Performance on Linux Page 27
Result With the concurrency optimizations we essentially double the benchmarkrsquos overall throughput to 457 BTPS (as compared to 217 BTPS for Configuration 2)
bull DB2 tuning Configuration 22 in Table 431 shows the performance impact of applying DB2 tunings to optimize the log data rates We set the following DB2 parameters
o Max storage for lock list (4 KB) = 400 o Log buffer size (4 KB) = 512 o Log file size (4 KB) = 8000 o Number of primary log files = 10 o Number of secondary log files = 10 o Maximum number of active applications = 250 o Average number of active applications = 50 o Percent log file reclaimed before soft checkpoint = 300 o Percentage of lock lists per application = 20 o Buffer pool size (pages) = 64000
Result As can be seen in Table 431 tuning DB2 delivers a benchmark throughput rate of 4628 BTPS ndash only a small improvement (13) over what we are able to get for Configuration 21 Table 431 also shows that this Configuration 22 has the CPU utilization of the WPS server (Power 570) at 97 and the disk utilization at 67 and 60 respectively for transaction and compensation (recovery) logs This indicates that the system performance bottleneck is no longer the disk subsystem but rather the Power 570rsquos two dual-core POWER6 processors Adding more processors to the WPS Server would certainly increase the benchmark throughput ndash provided that some J2C Connection Factories and Activation Specifications would also be increased to accommodate the higher number of processors as recommended by the WebSphere Performance Team [13]
bull Cache mirroring in the IBM System Storage DS3400 Configurations 3 and 31 in Table 431 show the performance impact of the cache mirroring capability in the DS3400 Starting with Configuration 3 we also use a more powerful Power 570 server Cache mirroring which is the default setting on the DS3400 can remain enabled for reliability or availability reasons In our setup the BPEDB disk array is attached to the DS3400 controller In Configuration 3 in order to achieve higher benchmark throughput we disable cache mirroring In Configuration 31 we leave the cache mirroring enabled (the default setting)
Result As we can see in Table 431 with cache mirroring enabled the disk array utilization for BPEDB jumps from 30 to 47 and the benchmark throughput drops from 6112 BTPS to 5584 BTPS ndash an 86 performance drop This is a classic trade-off between performance and reliabilityavailability
bull Reducing WAS JVM heap size in memory-constrained environment Configuration 32 in Table 431 shows the impact of reducing the WAS JVM heap size from 4096 MB to 2048 MB This could be necessary in memory-constrained environments
Result Reducing the WAS JVM heap from 4096 MB to 2048 MB drops the benchmarkrsquos overall throughput from 5584 BTPS to 4456 BTPS a significant 20 performance drop As a result it is highly recommended that the WAS JVM heap be adjusted accordingly after adding CPUs to the WPS server
bull Write-back caching in IBM ServeRAID MR10M controller Configuration 33 in Table 431 shows what happens when we use write-through caching policy in the MR10M disk array controller (instead of write-back) Write-back caching is always good for the performance of disk writes because the disk write operations are considered done as soon as the data is written to the cache (instead of physical disks) Data in the cache would then be written (ldquoflushedrdquo) to physical disks at a later time However in an environment where there is no battery backup for the controller or for the disk subsystem write-through caching could help protect the integrity of data
SOA Performance on Linux Page 28
when there is a power outage In our setup the SIBDB and BPE log disk arrays are attached to the MR10M controller
Result Using the write-though caching policy for the SIBDB disk array results in a 6 performance drop ndash from 4456 BTPS with write-back caching in Configure 32 to 4179 BTPS with write-through caching in this Configuration 33 Note that for Configuration 33 in Table 431 the utilization of the disk array for BPEDB jumps to 70 because we now use a single 24-disk array for both BPEDB and BPE logs However our test data (not shown in Table 431) indicates that the 70 utilization of the disk array does not have any noticeable impact on the benchmark throughput This is because even at 70 utilization the disk IO queue depth for the 24-disk array is still less than 1 indicating that the disk array is not the performance bottleneck In fact this is lower than the CPU utilization (75) for the WPS server
bull Linux logical disk striping In Configurations 3 and 31 the utilization for the disks holding the transaction log and compensation (recovery) log on the WPS server is quite high ndash around 80 for transaction log and 75 for compensation log While this is still lower than the CPU utilization it would be interesting to try to lower the disk utilization and see if that would have any impact on the benchmarkrsquos overall throughput We do not have any extra disk array controller that could be installed in the WPS server but we have two extra disks that could be used to set up a four-disk logical array through the Linux Logical Volume Manager (LVM) to handle both transaction and compensation log traffic
Result Table 432 shows the results For a four-disk logical array the stripe size of 64 KB provides better performance than smaller stripe sizes of 4 KB and 16 KB given that the size of each log data write is between 4 KB and 5 KB The utilization of the device manager is found to be over 90 while the utilization of each individual disk ranges from 27 to 36 However dedicating a single disk to each log without any logical disk striping produces the best benchmark throughput even though we use only two disks and each disk is used more than 75 of the time This indicates that the overhead of the Linux logical volume manager in managing a logical disk array has a negative performance impact when it comes to transaction and compensation logs on the WPS server As a result for the rest of our study we dedicate a single physical disk for each WPS log
Table 412 ndash Logical disk striping (through Linux Logical Volume Manager)
bull Linux large (huge) page support We configure large (huge) pages (16 MB page size) on the Power 570 server (WPS server) for the WAS JVM heap and find that it does not result in any performance improvement In fact with large page support the benchmarkrsquos overall throughput decreases from 6112 BTPS (Configuration 3) to 5970 BTPS a performance degradation of about 2 As a result for the remainder of this study we do not configure large pages
Figure 433 shows the cumulative performance improvement as we go from the default (out-of-the-box) configuration to tuning DB2 The tuning items are shown in a chronological order from left to right in the figure
It should also be noted that the x3650 server that hosts the benchmarkrsquos Workload Driver does not have any impact on our performance results because the CPU utilization of this server is less than 5 and the utilization of the only disk used on this server is less than 6
SOA Performance on Linux Page 29
Cumulative Performance Improvement Tuning Business Process Management
Non-Clustered Environment
0
5
10
15
20
25
30
35
40
45
50
Out Of The Box JVM Heap (2GB
gencon)
Add DB2
Server+Disk
Arrays
WASWPS
Concurrency
DB2 Log Tuning
Tuning Actions (Performed in Chronological Order From Left to Right)
Ben
ch
mark
s O
vera
ll
Th
rou
gh
pu
t (B
TP
S)
Figure 433 ndash Cumulative Impact of BPM Tuning Actions in Non-Clustered Environment
44 Tuning dynamic operations with WebSphere Virtual Enterprise (WVE)
In this section we evaluate a virtual goals-driven autonomic environment for SOA applications like the benchmark used in this study We use WebSphere Virtual Enterprise (WVE) to create this environment which is illustrated in Figure 441
The dynamic cluster of WPS servers called application cluster in Figure 441 consists of WPS servers on which the benchmarkrsquos applications are deployed These applications include HandleClaim and ClaimServices applications denoted as B and S respectively In response to an increase in workload demands or an on-going failure to meet a service policyrsquos performance objective WebSphere Virtual Enterprisersquos autonomic managers can start an instance of WPS server on the x3850 M2 server or on any of the two logical partitions (LPARs) on the OpenPower 720 server Based on the results in Section 43 each instance of the WPS server has a single disk for transaction log and another single disk for compensation (recovery) log In Figure 441 the LPARs are virtualized with PowerVM technology so IO operations to these (virtual) disks must go through the Virtual IO Server (VIOS) The LPARs use shared capped virtual CPUs In general it is recommended that we configure shared uncapped virtual CPUs across the LPARs however in this study the number of (virtual) CPUs that each LPAR is allowed to use is capped so that we can more accurately measure the workload impact on each LPAR and the performance impact of logical partitioning
By default there can only be a maximum of one WPS server instance per node in the dynamic application cluster
The service policy in WVE only allows two types of performance goals to be specified ndash the average response time or the percentile response time goals In this study we use the average response time goal for simplicity To set a reasonable response time goal we examine the response times reported in
Javabased
WorkloadDriver
IBMHTTPServer
OnDemandRouter(ODR)
DeploymentManager
NodeAgent
B
S
LPAR 1
B
S
WPS
BPEDBSIBDBLOGSBPEDBSIBDBLOGSBPEDBSIBDBLOGS
NodeAgent
B
S
WPS Human TaskSimulator
SCA SYS
SCA APP
ME Cluster
DB2
DB2
AdjustersUnderwriters
BPEDBSIBDBLOGS
Node Agent
LPAR 2
NodeAgent
VIOS
RECOVERYLOGS
TRANSACTLOGS
TRANSACTLOGS
RECOVERYLOGS
B
S
WPSIntegratedSolutionConsole
B
S
WPS
PEDBIBDBLOGS
PEDBIBDBLOGS
PEDBIBDBLOGS
B
S
WPS
SOA Performance on Linux Page 30
Table 441 for all configurations that we evaluate in this study We note that the best response time that we are able to achieve is about 14 ms As a rule of thumb (best practices) the average response time goal should be at least two times higher than the best response time observed on a lightly loaded cluster Consequently we set the average response time goal in the service policy to be 30 ms This should enable the autonomic managers to activate additional WPS servers (instances) when the average response time for claim requests exceeds 30 ms (the performance goal) Setting the average response time goal too close to 14 ms would never result in additional servers to be started because the autonomic managers would determine that starting additional servers would not improve the chances of meeting the performance goal
We specify the service policy to be applicable to HTTP and SOAP requests that are handled by the benchmarkrsquos applications We also assign the highest priority to this service policy
We use the default settings for the On-Demand Router (ODR) and its associated autonomic managers
As described in Section 23 there are two approaches to cluster the Message Engines (MEs)
bull The Message Engines are local to the dynamic application cluster bull The Message Engines are in their own cluster (called ME Cluster) separate from the dynamic
application cluster
In this section we consider both approaches and see which one performs better In those configurations where the ME Cluster is configured it runs on the x3850 M2 server As such the ME Cluster is a static cluster
IBM OpenPower 720
- -
Disk Arrays
IBM x3850 M2
IBM x3650
ClaimServices Application
HandleClaim Application
Application Cluster
IBM OpenPower 720
Java-based
Workload Driver
IBM HTTP Server
On-Demand Router (ODR)
Deployment Manager
Node Agent
B
S
LPAR 1
B
S
WPS
B S B
S B S
Disk Arrays
IBM x3850 M2
Node Agent
B
S
WPS Human Task Simulator
SCA SYS
SCA APP
ME Cluster
DB2
DB2
Adjusters Underwriters
BPEDB SIBDB LOGS
Node Agent
LPAR 2
Node Agent
VIOS
RECOVERY LOGS
TRANSACT LOGS
TRANSACT LOGS
RECOVERY LOGS
B
S
WPS Integrated Solution Console
IBM x3650
ClaimServices Application
HandleClaim Application
Application Cluster
Figure 441 ndash Dynamic application cluster with separate cluster for Message Engines
SOA Performance on Linux Page 31
In general for the configurations considered in this section the physical servers host the following components (see Figure 441)
bull IBM x3650 server o Benchmarkrsquos Java Workload Driver o WebSphere Deployment Manager o IBM HTTP Server (Web Server) o WebSphere On-Demand Router (ODR) o WebSphere Node Agent
bull IBM x3850 M2 server o DB2 hosting SIBDB and BPEDB databases (including their logs) o Benchmarkrsquos HumanTaskSimulator simulating the actions of adjusters and underwriters o WPS server (initial instance ndash unless otherwise specified) hosting the benchmarkrsquos
HandleClaim and ClaimServices applications o WebSphere Node Agent o ME Cluster (if configured)
bull IBM OpenPower 720 server (VIOS with 05 POWER5 core LPAR1 with 15 POWER5 cores LPAR2 with 20 POWER5 cores)
o Virtual IO Server (VIOS) o LPAR1 WPS server (one instance maximum) and WebSphere Node Agent o LPAR2 WPS server (one instance maximum) and WebSphere Node Agent
On the x3850 M2 server the BPEDB database is hosted on a 24-disk array managed by the IBM System Storage DS3400 controller Because of the large amount of disk writes the BPEDB log resides on a separate 12-disk array that is attached to the IBM ServeRAID MR10M adapter The SIBDB database and its log are hosted on another 12-disk array that is attached to the same MR10M adapter As in Section 43 each WPS server has two disks one dedicated for the transaction log and one for the compensation (recovery) log For optimal performance cache mirroring is disabled for the DS3400 controller and the write-back caching policy is used for the MR10M controller In addition all of the WPS and DB2 tuning items discussed in Section 43 are applied to the WVE environment
For the remainder of this paper we denote the maximum number of concurrent insurance claim requests generated by the benchmarkrsquos Workload Driver as Max Tx and the number of threads used to generate this traffic as simply Threads We will look at two performance measurements the number of business transactions per second (BTPS) as reported by the benchmark and the average response time for service requests as reported by WebSphere Virtual Enterprise
Let us first consider the configurations with the Message Engines in a separate cluster (ME Cluster) The performance results for these configurations are shown in Table 441
bull Single node performance (with separate ME Cluster) Configuration 5 in Table 441 shows what can be achieved with a single node (the x3850 M2 server) in the dynamic cluster The dynamic application cluster is put in Manual Mode so that the autonomic managers do not attempt to activate additional WPS servers on the other nodes ndash even when the average response time exceeds the performance goal of 30 ms
Result With the Workload Driver using two threads to generate a maximum of 60 concurrent requests (Max Tx = 60 Threads = 2) the x3850 M2 is able to handle an average of 2829 BTPS The CPU utilization on the x3850 M2 is 83 and the disk subsystem still has quite a bit of bandwidth available (the disk IO queue depth is less than 060) The average response time for the claim requests ranges from 2285 ms with a Max Tx of 20 to 5274 ms with a Max Tx of 60 Setting the maximum number of concurrent requests higher than 60 introduces some instability only a few runs are completed successfully as the CPU utilization moves above 90
SOA Performance on Linux Page 32
Table 441 ndash Performance data for dynamic cluster configurations
bull Multi-node performance (with separate ME Cluster) Configuration 51 in Table 441 shows that we can achieve higher service rates when we put the dynamic application cluster in Automatic Mode This allows the On-Demand Routerrsquos autonomic managers to activate additional servers on the OpenPower 720rsquos LPARs automatically (without human intervention) to help handle the workload generated by the benchmarkrsquos Workload Driver This configuration is illustrated in Figure 441
Initially after we turn on the benchmarkrsquos Workload Driver (with Max Tx = 20 Threads =1) the initial WPS server running on the x3850 M2 takes a while to warm up During this warm-up period the average response time for service requests exceeds the service goal of 30 ms for more than 30 seconds as shown in Figure 442 The autonomic managers sense this condition and generate a runtime task to activate additional WPS servers on the clusterrsquos remaining nodes The runtime task appears on the System Administration View of the Integrated Solutions Console (ISC) at approximately 2 minutes after the start of the run Since the application cluster is in Automatic Mode the runtime task starts immediately without further human intervention after it appears on the ISC It takes about 2 minutes for the new WPS servers to be activated on the two LPARs on the OpenPower 720 server Finally about 4 minutes after the start of the run the WPS servers on the LPARs start running Of course these new servers need time to warm up and that is the reason for the initial high response times recorded on these servers
In the mean time as the new WPS servers are starting on the LPARs their Message Engines are starting to run in the ME cluster on the x3850 M2 causing the average response time on the x3850 M2 server to jump higher as well However after about 90 seconds the average response time on the x3850 M2 starts to stabilize and falls to about 1877 ms ndash well below the service goal of 30 ms and better than the best average response time in the single-node configuration (Configuration 5) This shows the benefit of offloading the workload to new additional servers in the dynamic cluster However on the OpenPower 720 the LPARs (with 15 POWER5 cores for LPAR1 and 20 POWER5 cores for LPAR2) that host the new servers are not powerful enough to achieve a response time of less than 30 ms for the service requests sent to them Because of this the maximum throughput data collected at each node indicates that the On-Demand Router routes more service requests to the more powerful x3850 M2 server than to the two POWER5 LPARs
SOA Performance on Linux Page 33
Dynamic Workload Management
w WebSphere Virtual Enterprise
0
100
200
300
400
500
600
700
800
0 30 100
130
200
230
300
330
400
430
500
530
600
630
Time (MinSec)
Resp
on
se T
ime (
ms) x3850M2 (4 x 4-Core Intel
X7350)
P5 LPAR (PowerVM 15 PUs)
P5 LPAR (PowerVM 2 PUs)
Service Goal
Figure 442 ndash WebSphere Virtual Enterprisersquos autonomic managers activating additional WPS servers
After everything settles down the best benchmark throughput that we can get for this multi-node configuration is 3556 BTPS a 25 improvement over the single-node configuration In addition as can be seen in Table 441 the multi-node configuration provides more stability at much higher workloads (up to Max Tx = 160 Threads = 4) than the single-node configuration At the highest workloads (Max Tx = 160 Threads = 4) the CPU utilization is 92 93 and 86 for LPAR1 LPAR2 and x3850 M2 servers respectively indicating that we are running out of CPU bandwidth on the LPARs The disk subsystem is still okay with the maximum IO queue depth of 104 and the disk with the highest utilization (70) being the compensation log disk in LPAR2
Figure 443 shows the throughput that is contributed by each node in the dynamic cluster As the workload increases the throughput at the LPARs begins to level off running out of CPU bandwidth However with 16 processor cores the x3850 M2 just keeps going while the ODR sends more requests to it
bull Multi-node performance (with separate ME Cluster and without PowerVM) Configuration 52 in Table 441 shows the benchmark throughput when we effectively remove the PowerVM virtualization layer from the OpenPower 720 server In the previous configuration (Configuration 51) because we are running out of CPU bandwidth and the disk utilization is high on the LPARs with Max Tx = 160 and Threads = 4 removing the virtualization layer might result in higher benchmark throughput To do this we only configure a single LPAR on the OpenPower 720 server assign all CPUs (4 cores) and memory to this single LPAR and remove the Virtual IO Server (VIOS) All IO operations now go directly to the disk subsystem without going through the VIOS reducing the IO latency This configuration is illustrated in Figure 444
SOA Performance on Linux Page 34
Node Throughput (As Seen By WebSphere Virtual Enterprises Autonomic Managers)
3-Node Dynamic Cluster with Remote ME Cluster and PowerVM
0
5
10
15
20
25
30
1 20 1 40 1 60 2 60 2 80 3 80 3 100 4 160
Threads MaxTx
Th
rou
gh
pu
t (B
TP
S)
x3850 M2 (16-core)
P5 LPAR (15-core)
P5 LPAR (2-core)
Figure 443 ndash Node throughput as reported by WebSphere Virtual Enterprise
Result As can be seen in Table 441 this configuration is now able to support up to 6 threads with MaxTx = 160 and the overall benchmark throughput is now 4047 BTPS a 14 improvement over Configuration 51 The CPU utilization on the x3850 M2 server now moves above 90 but the disk subsystem still has available bandwidth because the disk IO queue depth is 126 and the highest disk utilization is only 50 If we look at the data for MaxTx = 160 Threads = 4 and compare it against the data for the same workload in the previous configuration we see that the average response time on the single 4-core LPAR is less than half the response times observed on the 15-core LPAR1 and 2-core LPAR2 in the previous configuration While the maximum throughput observed at the single 4-core LPAR is about 10 higher than the sum of maximum throughput for both LPAR1 and LPAR2 in the previous configuration it is interesting to note that the performance of the WPS server running on the x3850 M2 is also better (that is lower average response time higher maximum throughput) This indicates that a single 4-core LPAR can offload more workload from the x3850 M2 than both the 15-core LPAR1 and 2-core LPAR2 can in the previous configuration Later on in this paper we will measure the performance impact of the VIOS more accurately
bull Single-node performance (with local Message Engines) Configuration 6 in Table 441 shows the performance data when using only a single node (x3850 M2) with local Message Engines running in the same dynamic cluster as the WPS servers
Result The data indicates that for this single-node configuration with local Message Engines the benchmark throughput is much higher and the average response time is much lower than in Configuration 5 where we have remote Message Engines located in a separate cluster Depending on the workload level the extra latency in going to Message Engines in a remote cluster results in 30 - 60 drop in the benchmark throughput and 25 - 40 jump in the average service response time Consequently having the Message Engines running locally in
Javabased
WorkloadDriver
IBMHTTPServer
OnDemandRouter(ODR)
DeploymentManager
NodeAgent
B
S
LPAR 1
B
S
WPS
BPEDBSIBDBLOGSBPEDBSIBDBLOGSBPEDBSIBDBLOGS
NodeAgent
B
S
WPS Human TaskSimulator
SCA SYS
SCA APP
ME Cluster
DB2
DB2
AdjustersUnderwriters
BPEDBSIBDBLOGS
Node Agent
RECOVERYLOGS
TRANSACTLOGS
IntegratedSolutionConsole
B
S
WPS
PEDBIBDBLOGS
PEDBIBDBLOGS
PEDBIBDBLOGS
SOA Performance on Linux Page 35
the same cluster as the applications is faster in the single-node configuration but it severely limits the scalability of a multi-node configuration a fact that is very obvious when we consider the next configuration
IBM OpenPower 720
- -
Disk Arrays
IBM x3850 M2
IBM x3650
ClaimServices Application
HandleClaim Application
Application Cluster
IBM OpenPower 720
Java-based
Workload Driver
IBM HTTP Server
On-Demand Router (ODR)
Deployment Manager
Node Agent
B
S
LPAR 1
B
S
WPS
B S B
S B S
Disk Arrays
IBM x3850 M2
Node Agent
B
S
WPS Human Task Simulator
SCA SYS
SCA APP
ME Cluster
DB2
DB2
Adjusters Underwriters
BPEDB SIBDB LOGS
Node Agent
RECOVERY LOGS
TRANSACT LOGS
Integrated Solution Console
IBM x3650
ClaimServices Application
HandleClaim Application
Application Cluster
Figure 444 ndash Dynamic application cluster with separate ME Cluster but without PowerVM
bull Multi-node performance (with local Message Engines) Configuration 61 in Table 441 shows the performance data obtained for a two-node application cluster with local Message Engines This application cluster is illustrated in Figure 445 When we start the Workload Driver the initial WPS server runs on a two-core POWER5 LPAR As the CPU utilization on this LPAR quickly rises above 90 and the average service response time is far above the service goal of 30 ms the autonomic managers generate a runtime task to activate the remaining node (the x3850 M2) in the cluster However even after a new WPS server is started on the x3850 M2 most (approximately 80) of the workload still goes to the initial node (the two-core POWER5 LPAR) leaving the second node (the x3850 M2) under-utilized ndash the CPU utilization on the x3850 M2 is only 13 The benchmarkrsquos overall throughput (94 BTPS) is much smaller than in the case with remote Message Engines (3556 BTPS) This is because of a design limitation for the Service Integration (SI) buses if a Message-Driven Bean (MDB) has a local ME available it is always forcibly ldquoboundrdquo to it even if the ME is inactive Because only one ME instance can be active at any given time only one WPS server can have active instances of that MDB In other words all but one of the WPS servers in the cluster is essentially in stand-by mode This imposes serious limitation on the overall scalability of the dynamic cluster if we have long-running business processes or asynchronous SCA invocations As a result for multi-node dynamic clusters we recommend configuring the Message Engines in a separate cluster The WebSphere clustering topologies are classified into three types [4]
o Bronze topology where all components (WPS applications Message Engines CEI) are run in a single cluster
o Silver topology where there are two separate clusters one for WPS applications and CEI and one for the Message Engines
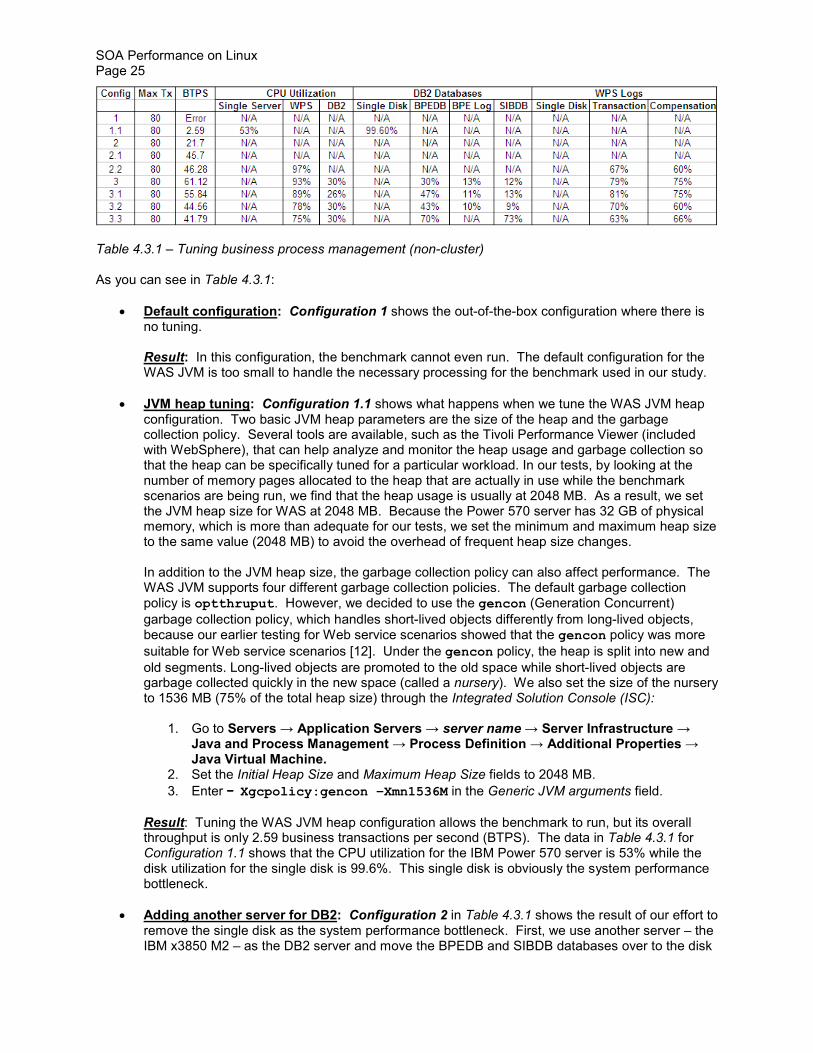
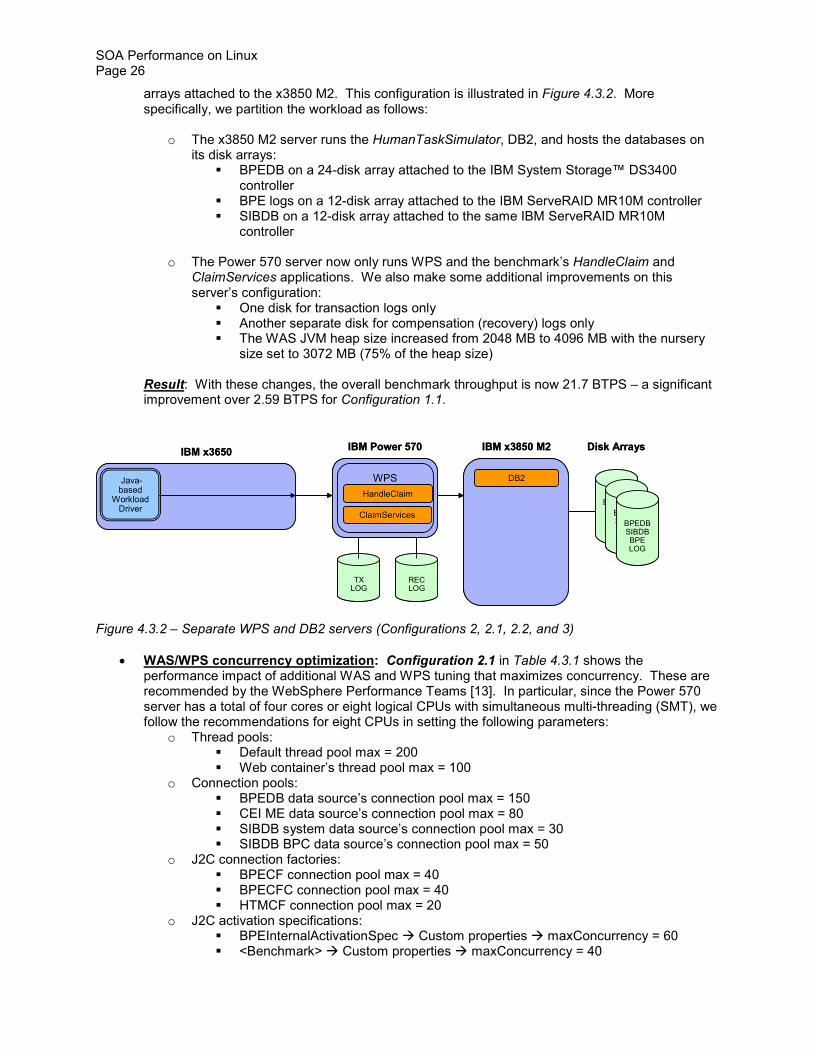
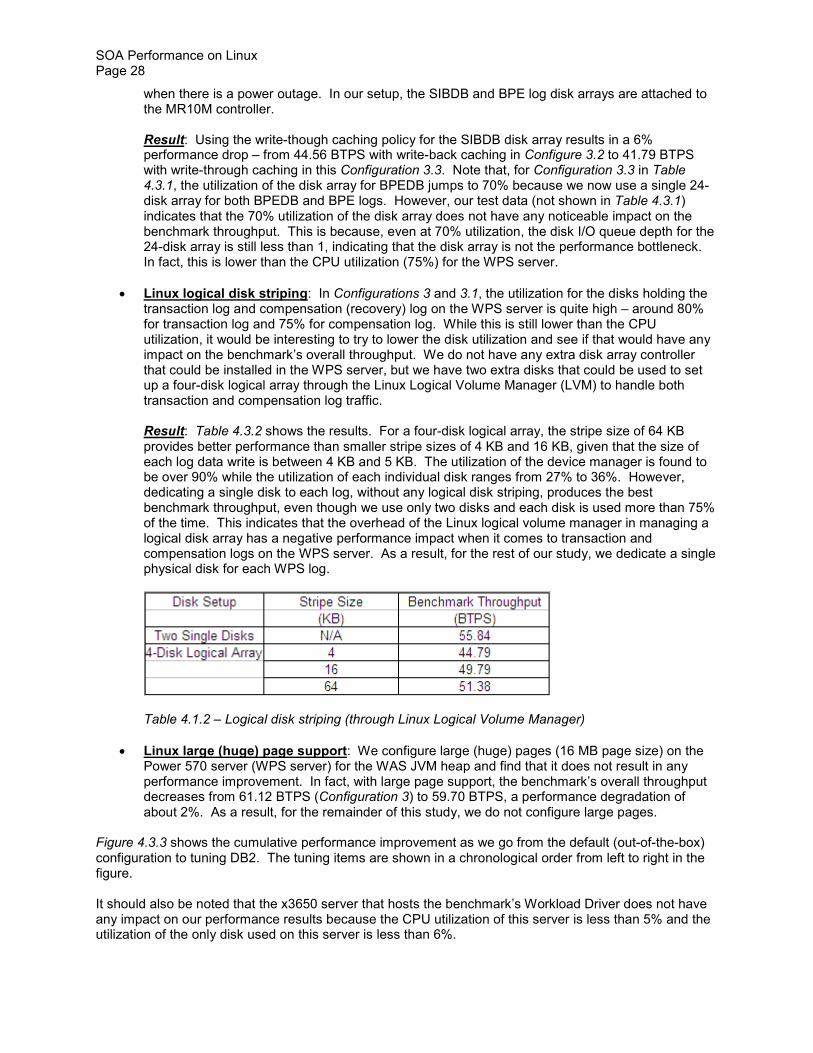
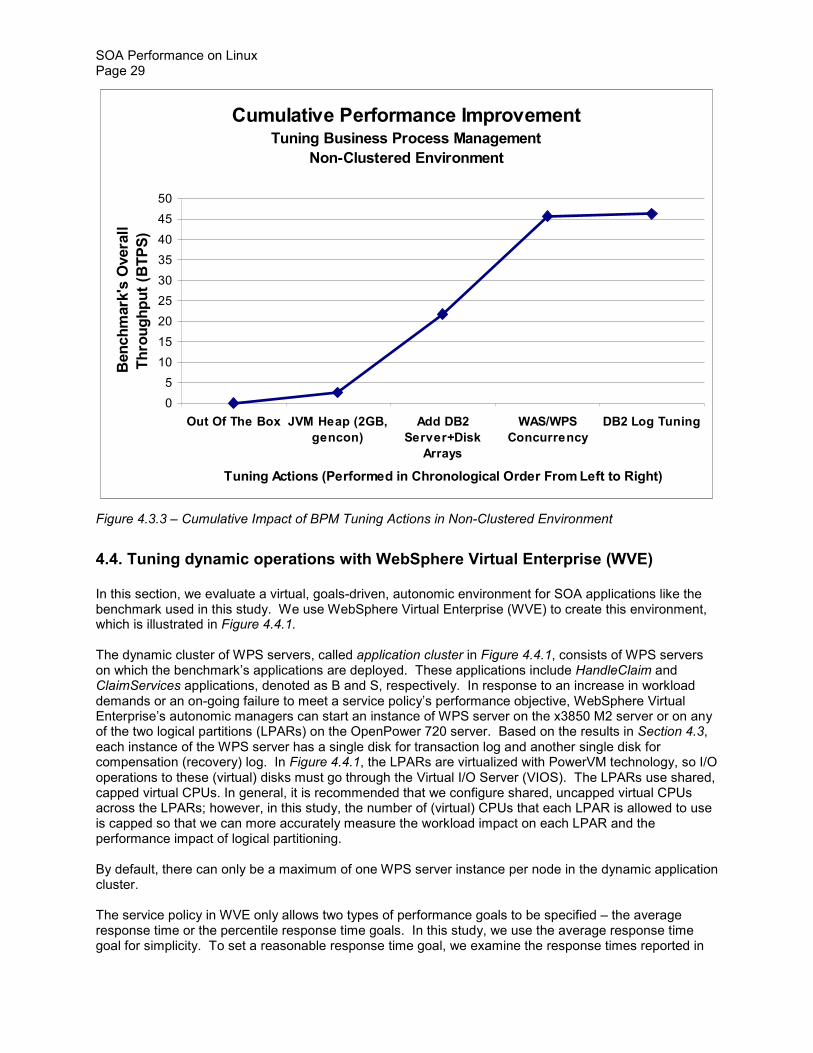
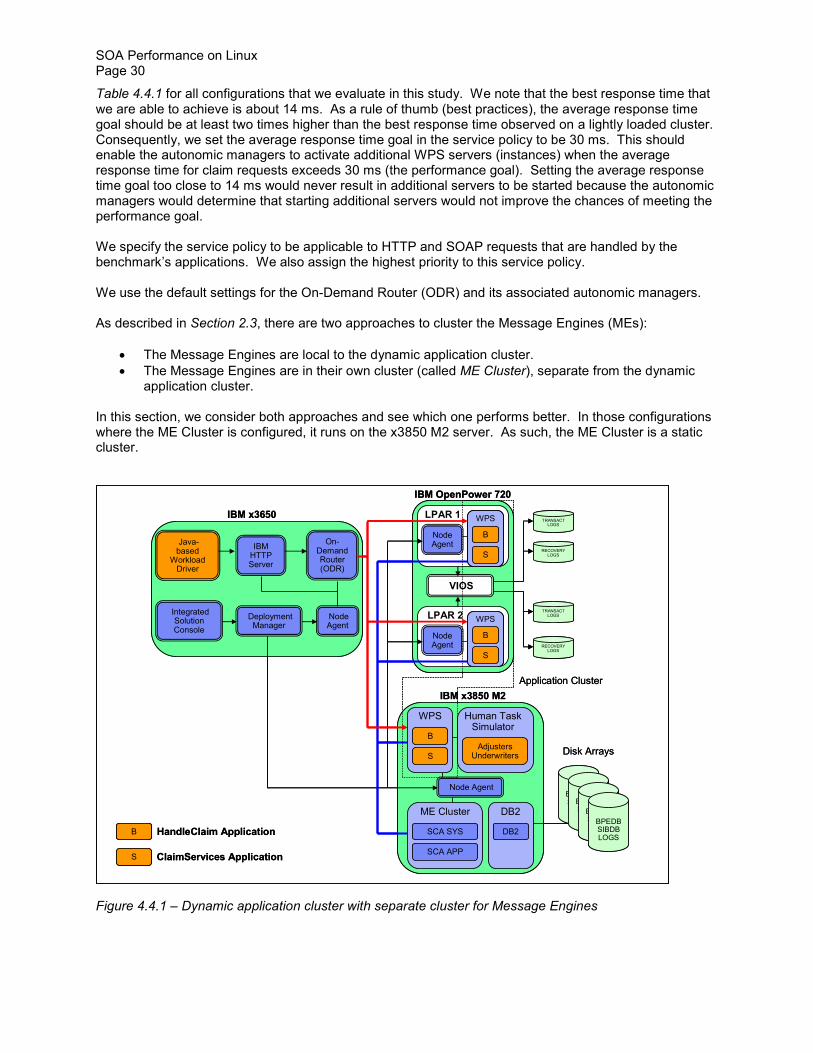
Javabased
WorkloadDriver
IBMHTTPServer
OnDemandRouter(ODR)
DeploymentManager
NodeAgent
B
S
LPAR 1
B
S
WPS
BPEDBSIBDBLOGSBPEDBSIBDBLOGSBPEDBSIBDBLOGS
NodeAgent
B
S
WPS Human TaskSimulator
SCA SYS
SCA APP
ME Cluster
DB2
DB2
AdjustersUnderwriters
BPEDBSIBDBLOGS
Node Agent
LPAR 2
NodeAgent
VIOS
RECOVERYLOGS
TRANSACTLOGS
TRANSACTLOGS
RECOVERYLOGS
B
S
WPSIntegratedSolutionConsole
B
S
WPS
PEDBIBDBLOGS
PEDBIBDBLOGS
PEDBIBDBLOGS
B
S
WPS
SOA Performance on Linux Page 30
Table 441 for all configurations that we evaluate in this study We note that the best response time that we are able to achieve is about 14 ms As a rule of thumb (best practices) the average response time goal should be at least two times higher than the best response time observed on a lightly loaded cluster Consequently we set the average response time goal in the service policy to be 30 ms This should enable the autonomic managers to activate additional WPS servers (instances) when the average response time for claim requests exceeds 30 ms (the performance goal) Setting the average response time goal too close to 14 ms would never result in additional servers to be started because the autonomic managers would determine that starting additional servers would not improve the chances of meeting the performance goal
We specify the service policy to be applicable to HTTP and SOAP requests that are handled by the benchmarkrsquos applications We also assign the highest priority to this service policy
We use the default settings for the On-Demand Router (ODR) and its associated autonomic managers
As described in Section 23 there are two approaches to cluster the Message Engines (MEs)
bull The Message Engines are local to the dynamic application cluster bull The Message Engines are in their own cluster (called ME Cluster) separate from the dynamic
application cluster
In this section we consider both approaches and see which one performs better In those configurations where the ME Cluster is configured it runs on the x3850 M2 server As such the ME Cluster is a static cluster
IBM OpenPower 720
- -
Disk Arrays
IBM x3850 M2
IBM x3650
ClaimServices Application
HandleClaim Application
Application Cluster
IBM OpenPower 720
Java-based
Workload Driver
IBM HTTP Server
On-Demand Router (ODR)
Deployment Manager
Node Agent
B
S
LPAR 1
B
S
WPS
B S B
S B S
Disk Arrays
IBM x3850 M2
Node Agent
B
S
WPS Human Task Simulator
SCA SYS
SCA APP
ME Cluster
DB2
DB2
Adjusters Underwriters
BPEDB SIBDB LOGS
Node Agent
LPAR 2
Node Agent
VIOS
RECOVERY LOGS
TRANSACT LOGS
TRANSACT LOGS
RECOVERY LOGS
B
S
WPS Integrated Solution Console
IBM x3650
ClaimServices Application
HandleClaim Application
Application Cluster
Figure 441 ndash Dynamic application cluster with separate cluster for Message Engines
SOA Performance on Linux Page 31
In general for the configurations considered in this section the physical servers host the following components (see Figure 441)
bull IBM x3650 server o Benchmarkrsquos Java Workload Driver o WebSphere Deployment Manager o IBM HTTP Server (Web Server) o WebSphere On-Demand Router (ODR) o WebSphere Node Agent
bull IBM x3850 M2 server o DB2 hosting SIBDB and BPEDB databases (including their logs) o Benchmarkrsquos HumanTaskSimulator simulating the actions of adjusters and underwriters o WPS server (initial instance ndash unless otherwise specified) hosting the benchmarkrsquos
HandleClaim and ClaimServices applications o WebSphere Node Agent o ME Cluster (if configured)
bull IBM OpenPower 720 server (VIOS with 05 POWER5 core LPAR1 with 15 POWER5 cores LPAR2 with 20 POWER5 cores)
o Virtual IO Server (VIOS) o LPAR1 WPS server (one instance maximum) and WebSphere Node Agent o LPAR2 WPS server (one instance maximum) and WebSphere Node Agent
On the x3850 M2 server the BPEDB database is hosted on a 24-disk array managed by the IBM System Storage DS3400 controller Because of the large amount of disk writes the BPEDB log resides on a separate 12-disk array that is attached to the IBM ServeRAID MR10M adapter The SIBDB database and its log are hosted on another 12-disk array that is attached to the same MR10M adapter As in Section 43 each WPS server has two disks one dedicated for the transaction log and one for the compensation (recovery) log For optimal performance cache mirroring is disabled for the DS3400 controller and the write-back caching policy is used for the MR10M controller In addition all of the WPS and DB2 tuning items discussed in Section 43 are applied to the WVE environment
For the remainder of this paper we denote the maximum number of concurrent insurance claim requests generated by the benchmarkrsquos Workload Driver as Max Tx and the number of threads used to generate this traffic as simply Threads We will look at two performance measurements the number of business transactions per second (BTPS) as reported by the benchmark and the average response time for service requests as reported by WebSphere Virtual Enterprise
Let us first consider the configurations with the Message Engines in a separate cluster (ME Cluster) The performance results for these configurations are shown in Table 441
bull Single node performance (with separate ME Cluster) Configuration 5 in Table 441 shows what can be achieved with a single node (the x3850 M2 server) in the dynamic cluster The dynamic application cluster is put in Manual Mode so that the autonomic managers do not attempt to activate additional WPS servers on the other nodes ndash even when the average response time exceeds the performance goal of 30 ms
Result With the Workload Driver using two threads to generate a maximum of 60 concurrent requests (Max Tx = 60 Threads = 2) the x3850 M2 is able to handle an average of 2829 BTPS The CPU utilization on the x3850 M2 is 83 and the disk subsystem still has quite a bit of bandwidth available (the disk IO queue depth is less than 060) The average response time for the claim requests ranges from 2285 ms with a Max Tx of 20 to 5274 ms with a Max Tx of 60 Setting the maximum number of concurrent requests higher than 60 introduces some instability only a few runs are completed successfully as the CPU utilization moves above 90
SOA Performance on Linux Page 32
Table 441 ndash Performance data for dynamic cluster configurations
bull Multi-node performance (with separate ME Cluster) Configuration 51 in Table 441 shows that we can achieve higher service rates when we put the dynamic application cluster in Automatic Mode This allows the On-Demand Routerrsquos autonomic managers to activate additional servers on the OpenPower 720rsquos LPARs automatically (without human intervention) to help handle the workload generated by the benchmarkrsquos Workload Driver This configuration is illustrated in Figure 441
Initially after we turn on the benchmarkrsquos Workload Driver (with Max Tx = 20 Threads =1) the initial WPS server running on the x3850 M2 takes a while to warm up During this warm-up period the average response time for service requests exceeds the service goal of 30 ms for more than 30 seconds as shown in Figure 442 The autonomic managers sense this condition and generate a runtime task to activate additional WPS servers on the clusterrsquos remaining nodes The runtime task appears on the System Administration View of the Integrated Solutions Console (ISC) at approximately 2 minutes after the start of the run Since the application cluster is in Automatic Mode the runtime task starts immediately without further human intervention after it appears on the ISC It takes about 2 minutes for the new WPS servers to be activated on the two LPARs on the OpenPower 720 server Finally about 4 minutes after the start of the run the WPS servers on the LPARs start running Of course these new servers need time to warm up and that is the reason for the initial high response times recorded on these servers
In the mean time as the new WPS servers are starting on the LPARs their Message Engines are starting to run in the ME cluster on the x3850 M2 causing the average response time on the x3850 M2 server to jump higher as well However after about 90 seconds the average response time on the x3850 M2 starts to stabilize and falls to about 1877 ms ndash well below the service goal of 30 ms and better than the best average response time in the single-node configuration (Configuration 5) This shows the benefit of offloading the workload to new additional servers in the dynamic cluster However on the OpenPower 720 the LPARs (with 15 POWER5 cores for LPAR1 and 20 POWER5 cores for LPAR2) that host the new servers are not powerful enough to achieve a response time of less than 30 ms for the service requests sent to them Because of this the maximum throughput data collected at each node indicates that the On-Demand Router routes more service requests to the more powerful x3850 M2 server than to the two POWER5 LPARs
SOA Performance on Linux Page 33
Dynamic Workload Management
w WebSphere Virtual Enterprise
0
100
200
300
400
500
600
700
800
0 30 100
130
200
230
300
330
400
430
500
530
600
630
Time (MinSec)
Resp
on
se T
ime (
ms) x3850M2 (4 x 4-Core Intel
X7350)
P5 LPAR (PowerVM 15 PUs)
P5 LPAR (PowerVM 2 PUs)
Service Goal
Figure 442 ndash WebSphere Virtual Enterprisersquos autonomic managers activating additional WPS servers
After everything settles down the best benchmark throughput that we can get for this multi-node configuration is 3556 BTPS a 25 improvement over the single-node configuration In addition as can be seen in Table 441 the multi-node configuration provides more stability at much higher workloads (up to Max Tx = 160 Threads = 4) than the single-node configuration At the highest workloads (Max Tx = 160 Threads = 4) the CPU utilization is 92 93 and 86 for LPAR1 LPAR2 and x3850 M2 servers respectively indicating that we are running out of CPU bandwidth on the LPARs The disk subsystem is still okay with the maximum IO queue depth of 104 and the disk with the highest utilization (70) being the compensation log disk in LPAR2
Figure 443 shows the throughput that is contributed by each node in the dynamic cluster As the workload increases the throughput at the LPARs begins to level off running out of CPU bandwidth However with 16 processor cores the x3850 M2 just keeps going while the ODR sends more requests to it
bull Multi-node performance (with separate ME Cluster and without PowerVM) Configuration 52 in Table 441 shows the benchmark throughput when we effectively remove the PowerVM virtualization layer from the OpenPower 720 server In the previous configuration (Configuration 51) because we are running out of CPU bandwidth and the disk utilization is high on the LPARs with Max Tx = 160 and Threads = 4 removing the virtualization layer might result in higher benchmark throughput To do this we only configure a single LPAR on the OpenPower 720 server assign all CPUs (4 cores) and memory to this single LPAR and remove the Virtual IO Server (VIOS) All IO operations now go directly to the disk subsystem without going through the VIOS reducing the IO latency This configuration is illustrated in Figure 444
SOA Performance on Linux Page 34
Node Throughput (As Seen By WebSphere Virtual Enterprises Autonomic Managers)
3-Node Dynamic Cluster with Remote ME Cluster and PowerVM
0
5
10
15
20
25
30
1 20 1 40 1 60 2 60 2 80 3 80 3 100 4 160
Threads MaxTx
Th
rou
gh
pu
t (B
TP
S)
x3850 M2 (16-core)
P5 LPAR (15-core)
P5 LPAR (2-core)
Figure 443 ndash Node throughput as reported by WebSphere Virtual Enterprise
Result As can be seen in Table 441 this configuration is now able to support up to 6 threads with MaxTx = 160 and the overall benchmark throughput is now 4047 BTPS a 14 improvement over Configuration 51 The CPU utilization on the x3850 M2 server now moves above 90 but the disk subsystem still has available bandwidth because the disk IO queue depth is 126 and the highest disk utilization is only 50 If we look at the data for MaxTx = 160 Threads = 4 and compare it against the data for the same workload in the previous configuration we see that the average response time on the single 4-core LPAR is less than half the response times observed on the 15-core LPAR1 and 2-core LPAR2 in the previous configuration While the maximum throughput observed at the single 4-core LPAR is about 10 higher than the sum of maximum throughput for both LPAR1 and LPAR2 in the previous configuration it is interesting to note that the performance of the WPS server running on the x3850 M2 is also better (that is lower average response time higher maximum throughput) This indicates that a single 4-core LPAR can offload more workload from the x3850 M2 than both the 15-core LPAR1 and 2-core LPAR2 can in the previous configuration Later on in this paper we will measure the performance impact of the VIOS more accurately
bull Single-node performance (with local Message Engines) Configuration 6 in Table 441 shows the performance data when using only a single node (x3850 M2) with local Message Engines running in the same dynamic cluster as the WPS servers
Result The data indicates that for this single-node configuration with local Message Engines the benchmark throughput is much higher and the average response time is much lower than in Configuration 5 where we have remote Message Engines located in a separate cluster Depending on the workload level the extra latency in going to Message Engines in a remote cluster results in 30 - 60 drop in the benchmark throughput and 25 - 40 jump in the average service response time Consequently having the Message Engines running locally in
Javabased
WorkloadDriver
IBMHTTPServer
OnDemandRouter(ODR)
DeploymentManager
NodeAgent
B
S
LPAR 1
B
S
WPS
BPEDBSIBDBLOGSBPEDBSIBDBLOGSBPEDBSIBDBLOGS
NodeAgent
B
S
WPS Human TaskSimulator
SCA SYS
SCA APP
ME Cluster
DB2
DB2
AdjustersUnderwriters
BPEDBSIBDBLOGS
Node Agent
RECOVERYLOGS
TRANSACTLOGS
IntegratedSolutionConsole
B
S
WPS
PEDBIBDBLOGS
PEDBIBDBLOGS
PEDBIBDBLOGS
SOA Performance on Linux Page 35
the same cluster as the applications is faster in the single-node configuration but it severely limits the scalability of a multi-node configuration a fact that is very obvious when we consider the next configuration
IBM OpenPower 720
- -
Disk Arrays
IBM x3850 M2
IBM x3650
ClaimServices Application
HandleClaim Application
Application Cluster
IBM OpenPower 720
Java-based
Workload Driver
IBM HTTP Server
On-Demand Router (ODR)
Deployment Manager
Node Agent
B
S
LPAR 1
B
S
WPS
B S B
S B S
Disk Arrays
IBM x3850 M2
Node Agent
B
S
WPS Human Task Simulator
SCA SYS
SCA APP
ME Cluster
DB2
DB2
Adjusters Underwriters
BPEDB SIBDB LOGS
Node Agent
RECOVERY LOGS
TRANSACT LOGS
Integrated Solution Console
IBM x3650
ClaimServices Application
HandleClaim Application
Application Cluster
Figure 444 ndash Dynamic application cluster with separate ME Cluster but without PowerVM
bull Multi-node performance (with local Message Engines) Configuration 61 in Table 441 shows the performance data obtained for a two-node application cluster with local Message Engines This application cluster is illustrated in Figure 445 When we start the Workload Driver the initial WPS server runs on a two-core POWER5 LPAR As the CPU utilization on this LPAR quickly rises above 90 and the average service response time is far above the service goal of 30 ms the autonomic managers generate a runtime task to activate the remaining node (the x3850 M2) in the cluster However even after a new WPS server is started on the x3850 M2 most (approximately 80) of the workload still goes to the initial node (the two-core POWER5 LPAR) leaving the second node (the x3850 M2) under-utilized ndash the CPU utilization on the x3850 M2 is only 13 The benchmarkrsquos overall throughput (94 BTPS) is much smaller than in the case with remote Message Engines (3556 BTPS) This is because of a design limitation for the Service Integration (SI) buses if a Message-Driven Bean (MDB) has a local ME available it is always forcibly ldquoboundrdquo to it even if the ME is inactive Because only one ME instance can be active at any given time only one WPS server can have active instances of that MDB In other words all but one of the WPS servers in the cluster is essentially in stand-by mode This imposes serious limitation on the overall scalability of the dynamic cluster if we have long-running business processes or asynchronous SCA invocations As a result for multi-node dynamic clusters we recommend configuring the Message Engines in a separate cluster The WebSphere clustering topologies are classified into three types [4]
o Bronze topology where all components (WPS applications Message Engines CEI) are run in a single cluster
o Silver topology where there are two separate clusters one for WPS applications and CEI and one for the Message Engines
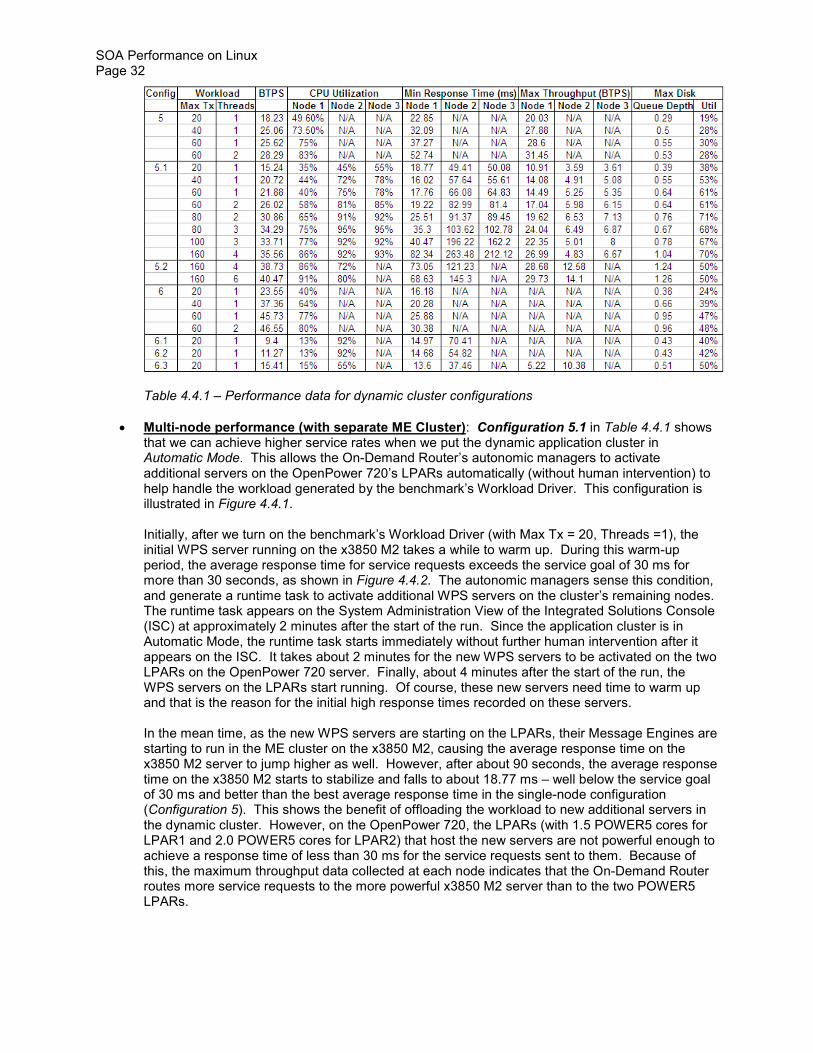
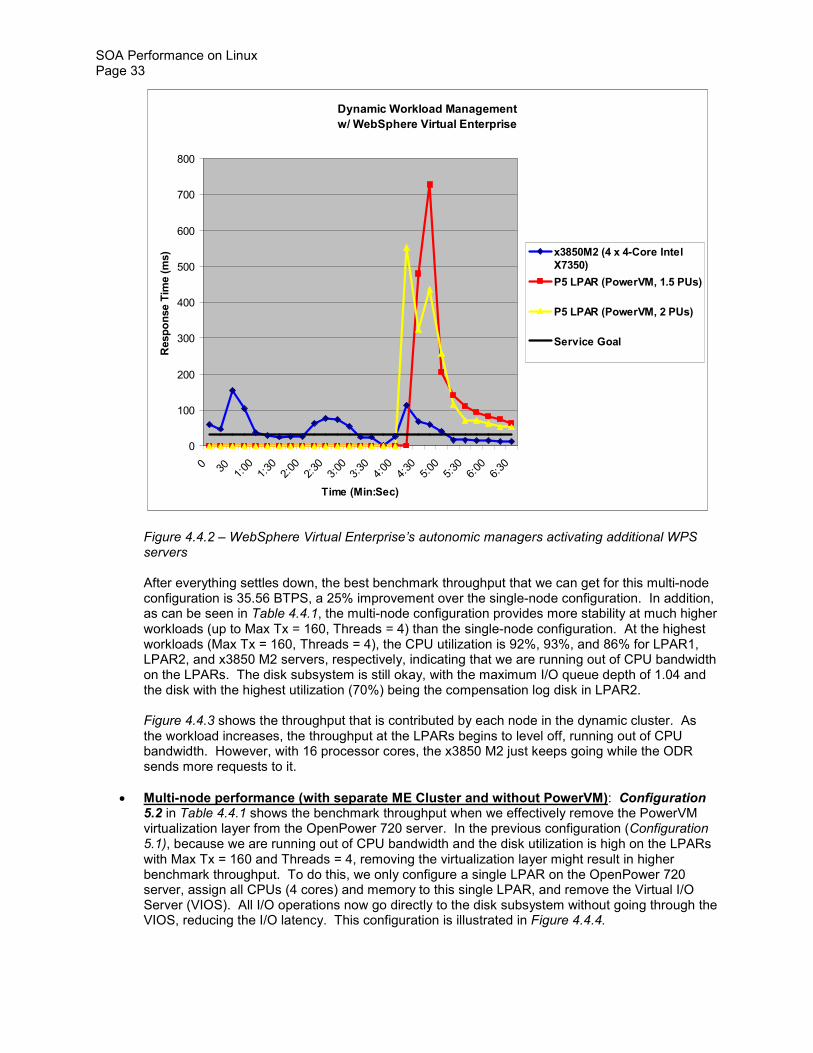
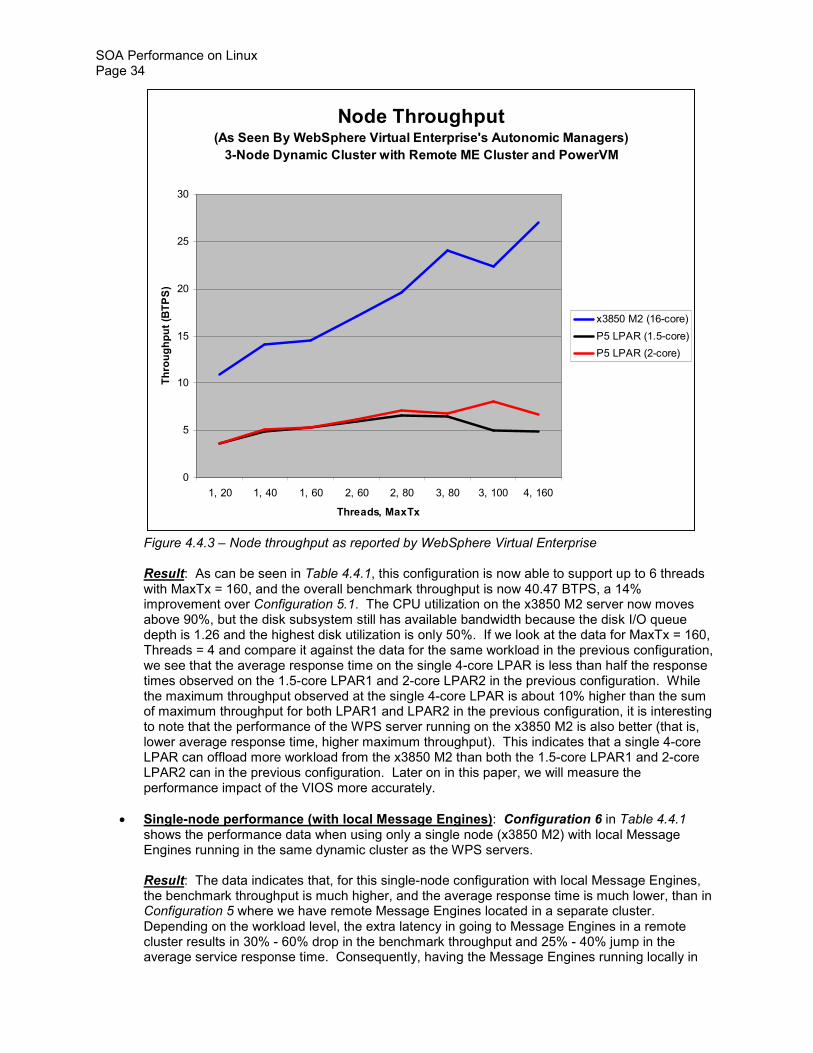
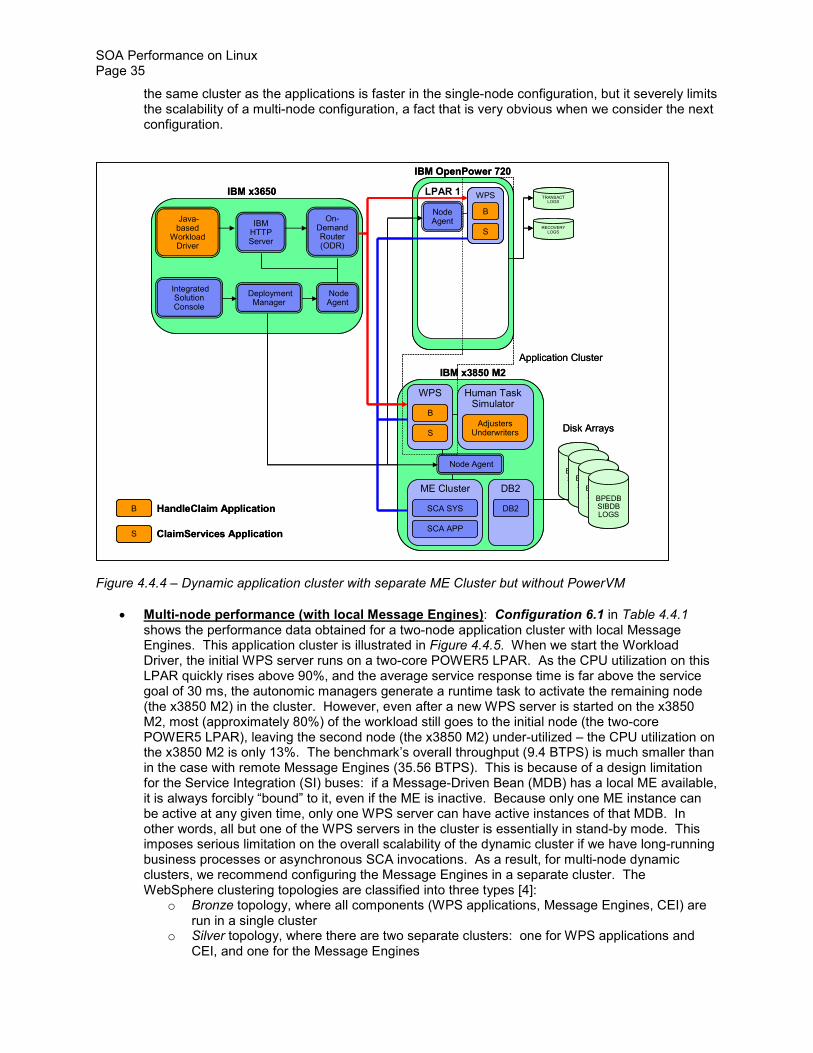