Embed Size (px)
Citation preview
Tunas in hot water:forecasts of population trends for
two species of tuna under a scenario of Climate Change
Patrick Lehodey
Marine Ecosystems Modeling and Monitoring by SatellitesCLS, Satellite Oceanography Division, Toulouse, France
International Symposium, Gijón, Spain, May 19 - 23, 2008
Contact: [email protected]
Effects of Climate Change on the World's Oceans
PFRP SPC
Co-authors and collaborators
Tunas in hot water
Inna Senina, Beatriz Calmettes- CLS, Toulouse, France
John Sibert- Pelagic Fisheries Research Program, JIMAR, UH, Honolulu, USA
Laurent Bopp- Laboratoire des Sciences du Climat et de l'Environnement (LSCE), Gif-sur-Yvette, France
John Hampton- Oceanic Fisheries Programme, SPC, Noumea, New Caledonia
Raghu Murtugudde- ESSIC, University of Maryland, USA
GLOBEC-CLIOTOP Working Group 4
Tunas in hot waterEffects of Climate Change on the World's Oceans, Gijon, Spain, 19-23 May
PFRP SPC
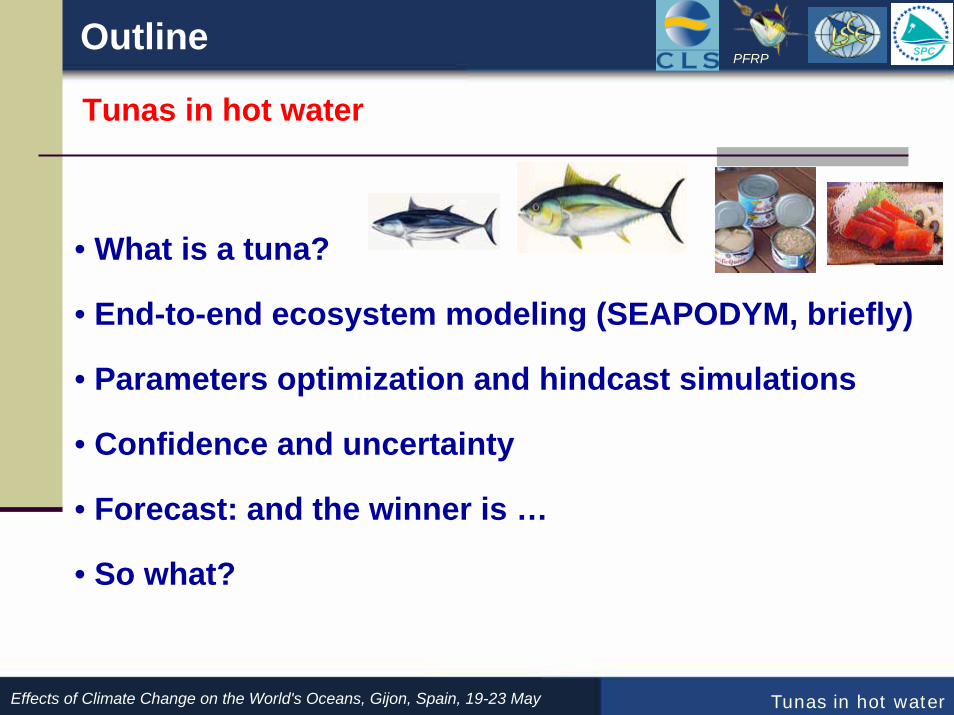
Outline
• What is a tuna?
• End-to-end ecosystem modeling (SEAPODYM, briefly)
• Parameters optimization and hindcast simulations
• Confidence and uncertainty
• Forecast: and the winner is …
• So what?
Tunas in hot water
Tunas in hot water
Effects of Climate Change on the World's Oceans, Gijon, Spain, 19-23 May
PFRP SPC
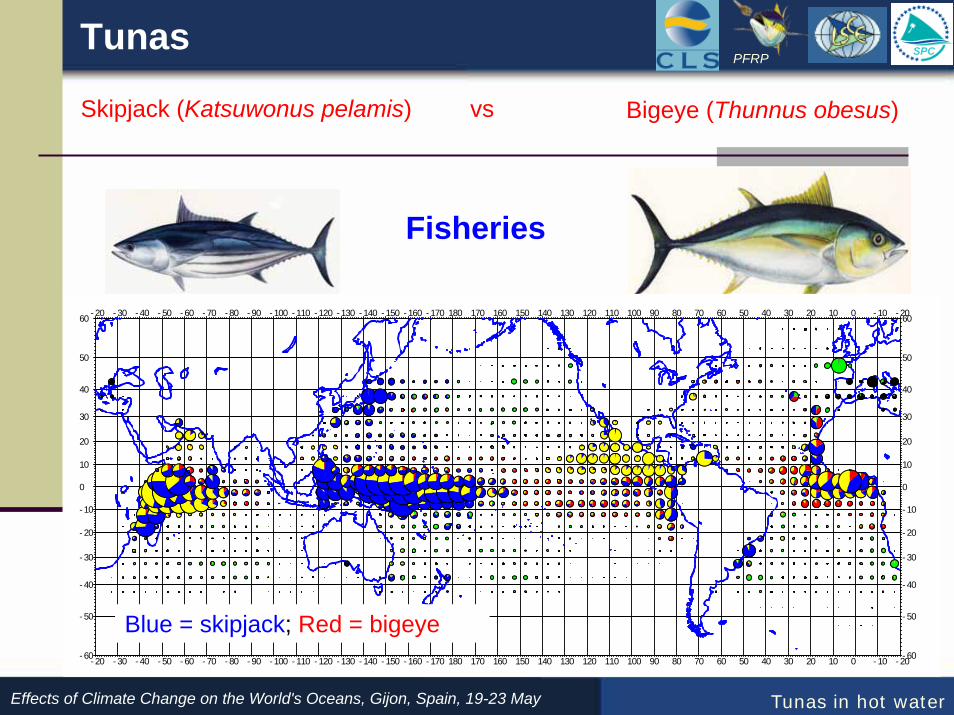
Tunas
Skipjack (Katsuwonus pelamis) Bigeye (Thunnus obesus)vs
← Total annual catch →
← Fishing gears →
← Economical value →
← Status of stocks →
~2 million tonnes
Surface (purse seine)
Low (canneries) but high volume of catch
Approaching full exploitation
~0.5 million tonnes
Longline + surface
High (sashimi) but low volume of catch
Fully exploited to over-fished.
Fisheries
- 60
- 50
- 40
- 30
- 20
- 10
0
10
20
30
40
50
60- 20- 100102030405060708090100110120130140150160170180- 170- 160- 150- 140- 130- 120- 110- 100- 90- 80- 70- 60- 50- 40- 30- 20
- 20- 100102030405060708090100110120130140150160170180- 170- 160- 150- 140- 130- 120- 110- 100- 90- 80- 70- 60- 50- 40- 30- 20- 60
- 50
- 40
- 30
- 20
- 10
0
10
20
30
40
50
60
Blue = skipjack; Red = bigeye
Tunas in hot waterEffects of Climate Change on the World's Oceans, Gijon, Spain, 19-23 May
PFRP SPC
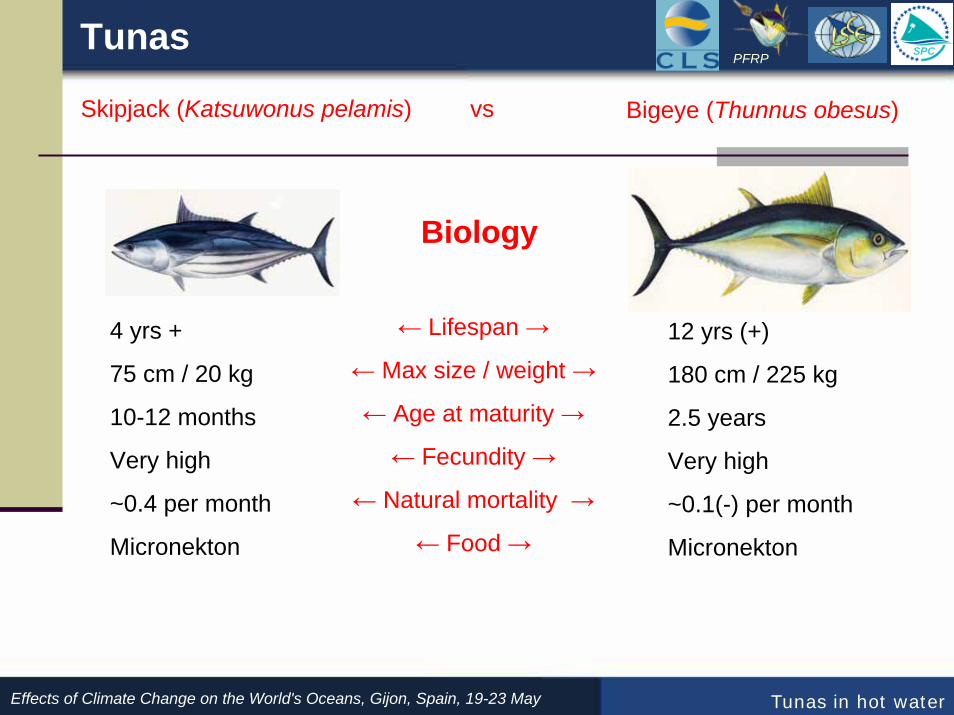
Tunas
Skipjack (Katsuwonus pelamis) Bigeye (Thunnus obesus)vs
← Lifespan →
← Max size / weight →
← Age at maturity →
← Fecundity →
← Natural mortality →
← Food →
4 yrs +
75 cm / 20 kg
10-12 months
Very high
~0.4 per month
Micronekton
12 yrs (+)
180 cm / 225 kg
2.5 years
Very high
~0.1(-) per month
Micronekton
Biology
Tunas in hot waterEffects of Climate Change on the World's Oceans, Gijon, Spain, 19-23 May
PFRP SPC
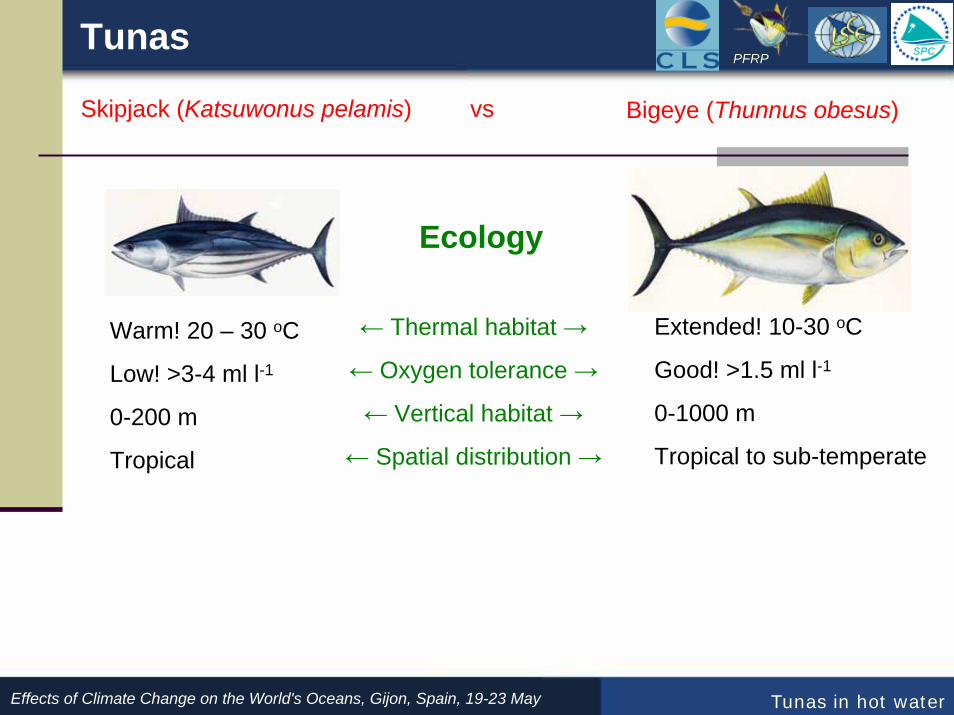
Tunas
Skipjack (Katsuwonus pelamis) Bigeye (Thunnus obesus)vs
← Thermal habitat →
← Oxygen tolerance →
← Vertical habitat →
← Spatial distribution →
Warm! 20 – 30 oC
Low! >3-4 ml l-1
0-200 m
Tropical
Extended! 10-30 oC
Good! >1.5 ml l-1
0-1000 m
Tropical to sub-temperate
Ecology
Tunas in hot waterEffects of Climate Change on the World's Oceans, Gijon, Spain, 19-23 May
PFRP SPC
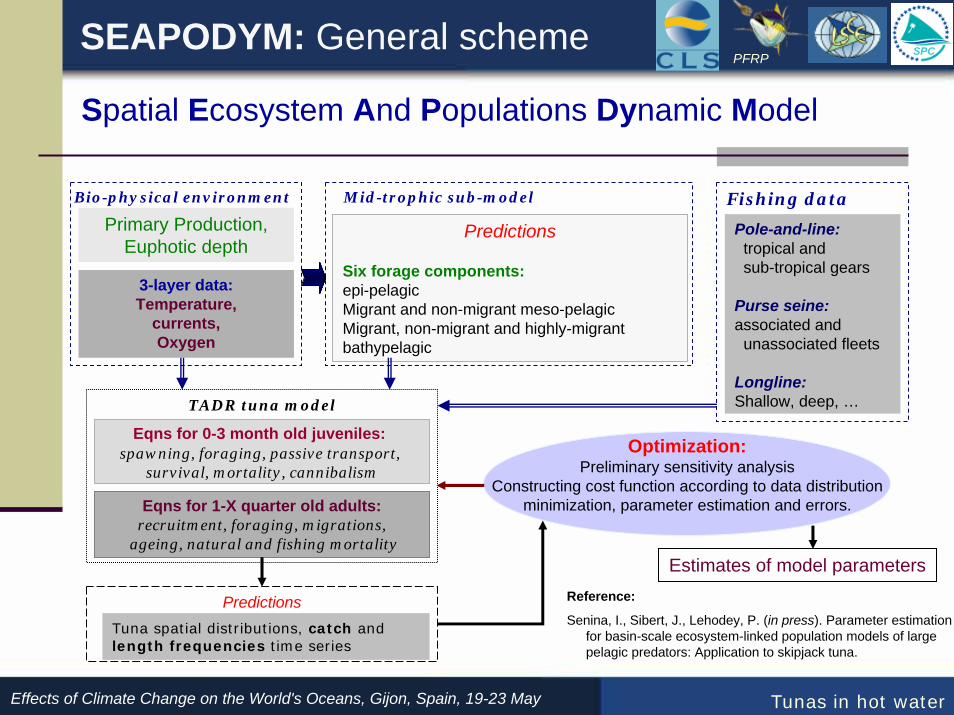
SEAPODYM: General scheme
TADR tuna model
Eqns for 0-3 month old juveniles:spawning, foraging, passive transport,
survival, mortality, cannibalism
Predictions
Six forage components:epi-pelagicMigrant and non-migrant meso-pelagicMigrant, non-migrant and highly-migrant bathypelagic
Pole-and-line:tropical and sub-tropical gears
Purse seine: associated and
unassociated fleets
Longline: Shallow, deep, …
3-layer data:Temperature,
currents,Oxygen
PredictionsTuna spatial distributions, catch andlength frequencies time series
Primary Production, Euphotic depth
Eqns for 1-X quarter old adults:recruitment, foraging, migrations,
ageing, natural and fishing mortality
Bio-physical environment Mid-trophic sub-model Fishing data
Optimization:Preliminary sensitivity analysis
Constructing cost function according to data distributionminimization, parameter estimation and errors.
Estimates of model parametersReference:
Senina, I., Sibert, J., Lehodey, P. (in press). Parameter estimation for basin-scale ecosystem-linked population models of large pelagic predators: Application to skipjack tuna.
Tunas in hot waterEffects of Climate Change on the World's Oceans, Gijon, Spain, 19-23 May
PFRP SPC
Spatial Ecosystem And Populations Dynamic Model
SEAPODYM
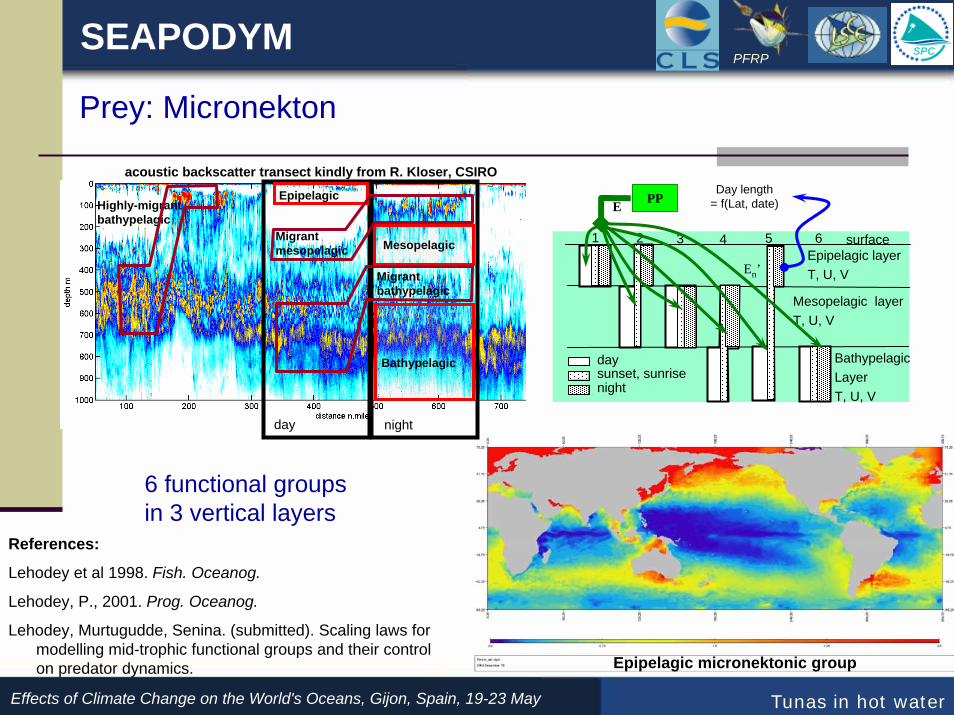
day night
Epipelagic
Mesopelagic
Bathypelagic
Migrant bathypelagic
Migrant mesopelagic
Highly-migrant bathypelagic
acoustic backscatter transect kindly from R. Kloser, CSIRO
day
nightsunset, sunrise
Epipelagic layerT, U, V
surface1 2 3 4 5 6
Mesopelagic layerT, U, V
BathypelagicLayerT, U, V
Day length= f(Lat, date)PPE
En’
References:
Lehodey et al 1998. Fish. Oceanog.
Lehodey, P., 2001. Prog. Oceanog.
Lehodey, Murtugudde, Senina. (submitted). Scaling laws for modelling mid-trophic functional groups and their control on predator dynamics.
Tunas in hot waterEffects of Climate Change on the World's Oceans, Gijon, Spain, 19-23 May
PFRP SPC
Prey: Micronekton
Epipelagic micronektonic group
6 functional groups in 3 vertical layers
SEAPODYM
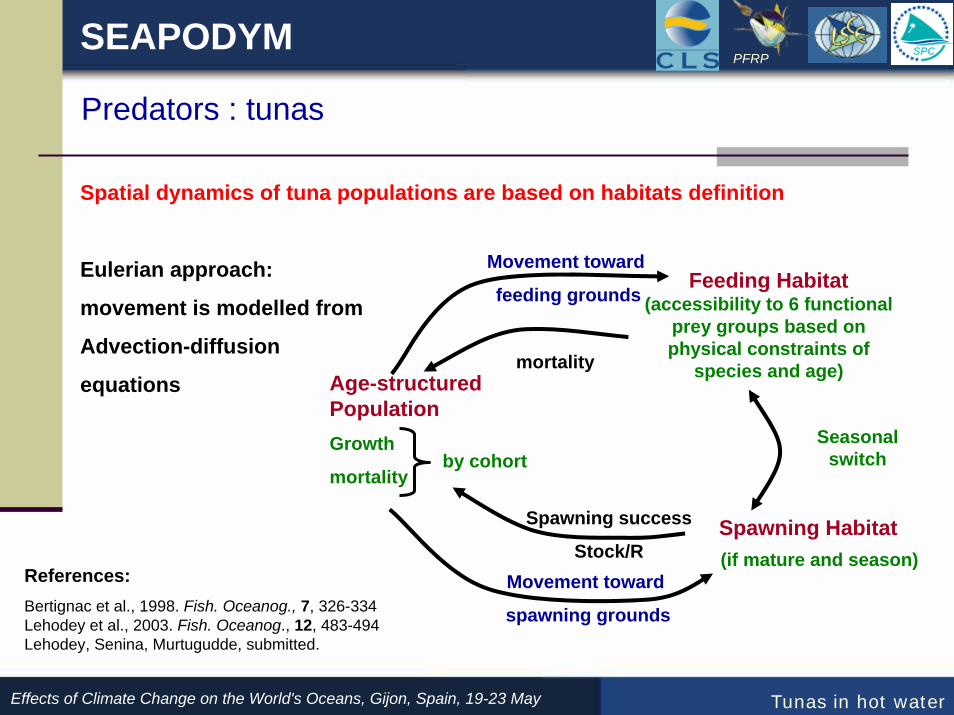
Predators : tunas
Age-structured PopulationGrowth
mortalityby cohort
Feeding Habitat(accessibility to 6 functional
prey groups based on physical constraints of
species and age)
Spawning Habitat
Seasonal switch
Movement toward
feeding grounds
Spatial dynamics of tuna populations are based on habitats definition
Eulerian approach:
movement is modelled from
Advection-diffusion
equations
Movement toward
spawning grounds
mortality
Spawning success
Stock/R (if mature and season)References:Bertignac et al., 1998. Fish. Oceanog., 7, 326-334Lehodey et al., 2003. Fish. Oceanog., 12, 483-494Lehodey, Senina, Murtugudde, submitted.
Tunas in hot waterEffects of Climate Change on the World's Oceans, Gijon, Spain, 19-23 May
PFRP SPC
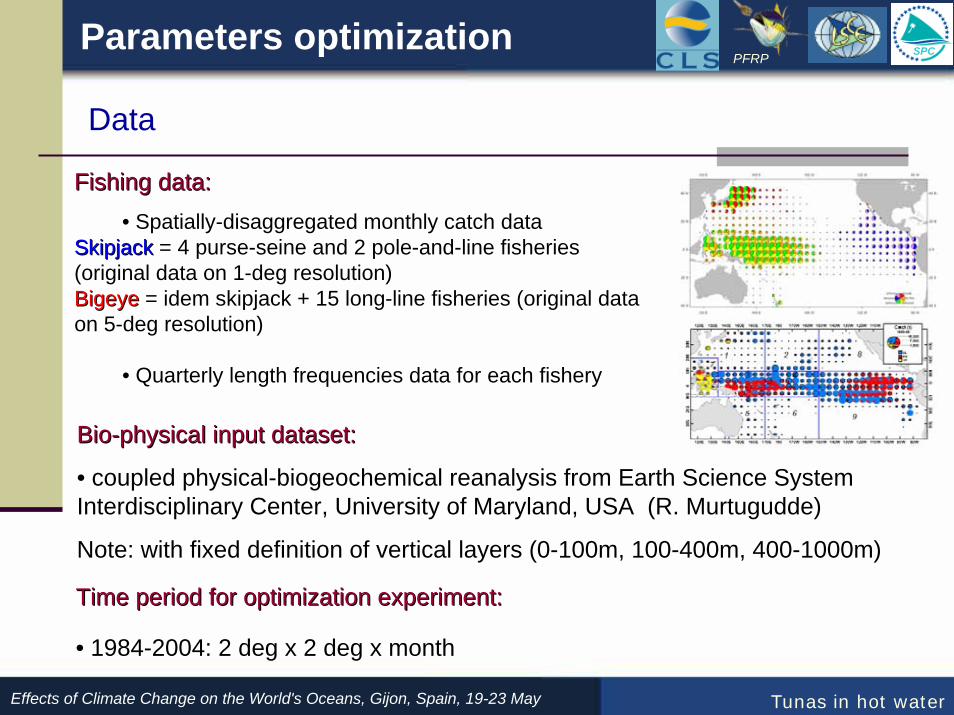
Parameters optimization
Data
PFRP SPC
Tunas in hot waterEffects of Climate Change on the World's Oceans, Gijon, Spain, 19-23 May
Fishing data:Fishing data:
•• SpatiallySpatially--disaggregated monthly catch data disaggregated monthly catch data SkipjackSkipjack = 4 purse= 4 purse--seine and 2 poleseine and 2 pole--andand--line fisheries line fisheries (original data on 1(original data on 1--deg resolution)deg resolution)BigeyeBigeye = idem skipjack + 15 long= idem skipjack + 15 long--line fisheries (original data line fisheries (original data on 5on 5--deg resolution)deg resolution)
•• Quarterly length frequencies data for each fisheryQuarterly length frequencies data for each fishery
BioBio--physical input dataset:physical input dataset:
• coupled physical-biogeochemical reanalysis from Earth Science System Interdisciplinary Center, University of Maryland, USA (R. Murtugudde)
Note: with fixed definition of vertical layers (0-100m, 100-400m, 400-1000m)
Time period for optimization experiment:Time period for optimization experiment:
• 1984-2004: 2 deg x 2 deg x month
Parameters optimization
Method
PFRP SPC
Tunas in hot waterEffects of Climate Change on the World's Oceans, Gijon, Spain, 19-23 May
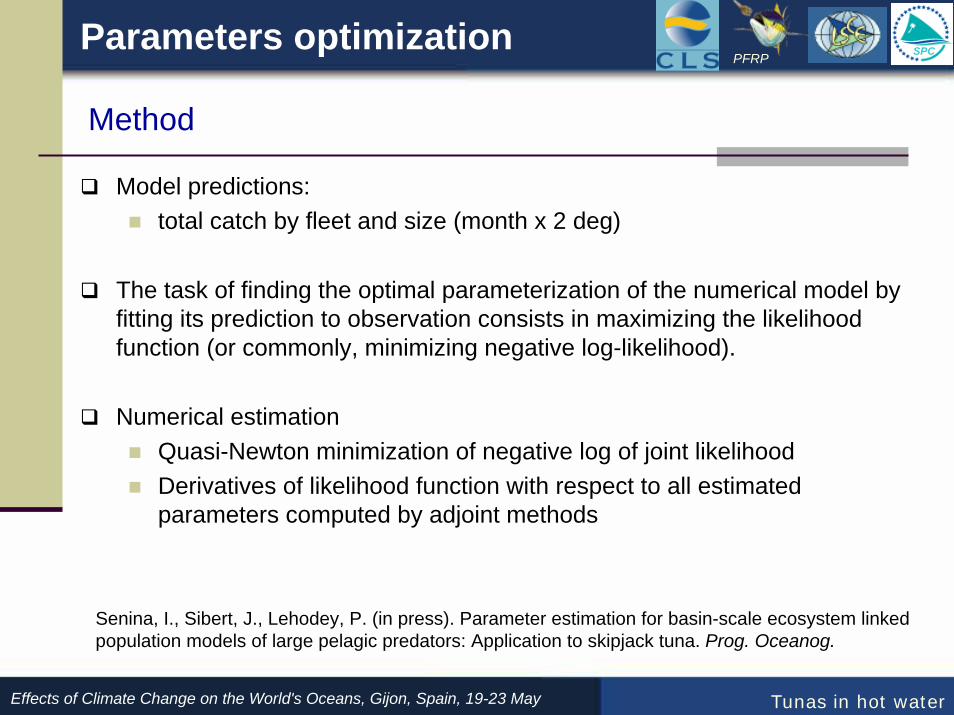
Model predictions: total catch by fleet and size (month x 2 deg)
The task of finding the optimal parameterization of the numerical model by fitting its prediction to observation consists in maximizing the likelihood function (or commonly, minimizing negative log-likelihood).
Numerical estimationQuasi-Newton minimization of negative log of joint likelihoodDerivatives of likelihood function with respect to all estimatedparameters computed by adjoint methods
Senina, I., Sibert, J., Lehodey, P. (in press). Parameter estimation for basin-scale ecosystem linked population models of large pelagic predators: Application to skipjack tuna. Prog. Oceanog.
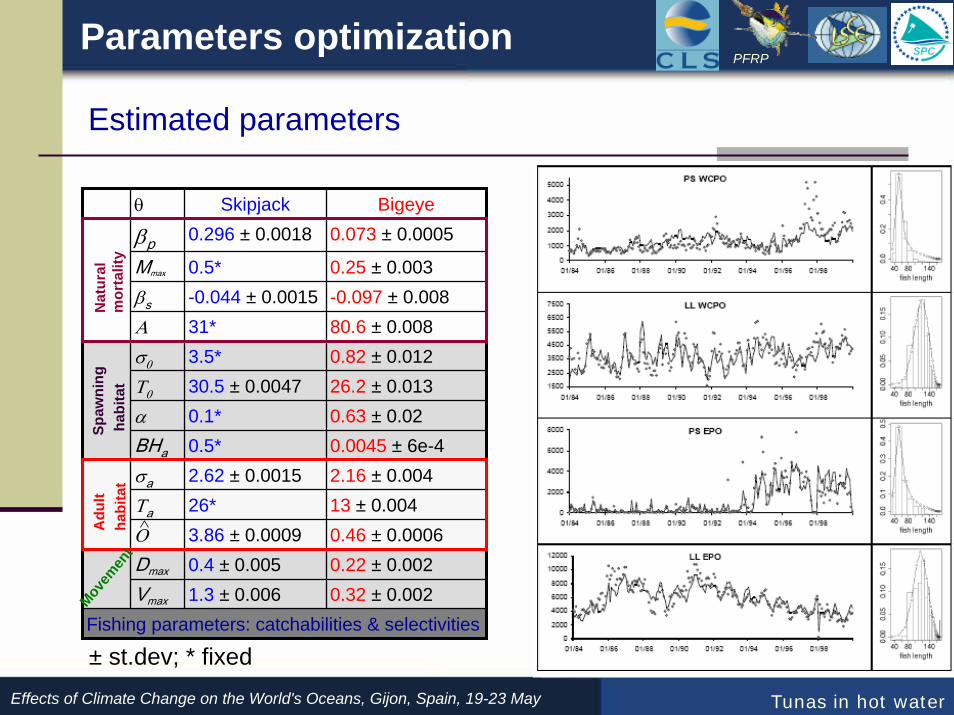
θ Skipjack Bigeye
βp 0.296 ± 0.0018 0.073 ± 0.0005
Mmax 0.5* 0.25 ± 0.003βs -0.044 ± 0.0015 -0.097 ± 0.008Α 31* 80.6 ± 0.008σ0 3.5* 0.82 ± 0.012Τ0 30.5 ± 0.0047 26.2 ± 0.013α 0.1* 0.63 ± 0.02BHa 0.5* 0.0045 ± 6e-4σa 2.62 ± 0.0015 2.16 ± 0.004Τa 26* 13 ± 0.004Ο 3.86 ± 0.0009 0.46 ± 0.0006Dmax 0.4 ± 0.005 0.22 ± 0.002Vmax 1.3 ± 0.006 0.32 ± 0.002
Fishing parameters: catchabilities & selectivities
Parameters optimization
Estimated parameters
PFRP SPC
Tunas in hot waterEffects of Climate Change on the World's Oceans, Gijon, Spain, 19-23 May
Nat
ural
m
orta
lity
Spaw
ning
habi
tat
Adu
lt ha
bita
t
Movem
ent
∧
± st.dev; * fixed
Hindcast simulations
Pacific skipjack
PFRP SPC
Tunas in hot waterEffects of Climate Change on the World's Oceans, Gijon, Spain, 19-23 May
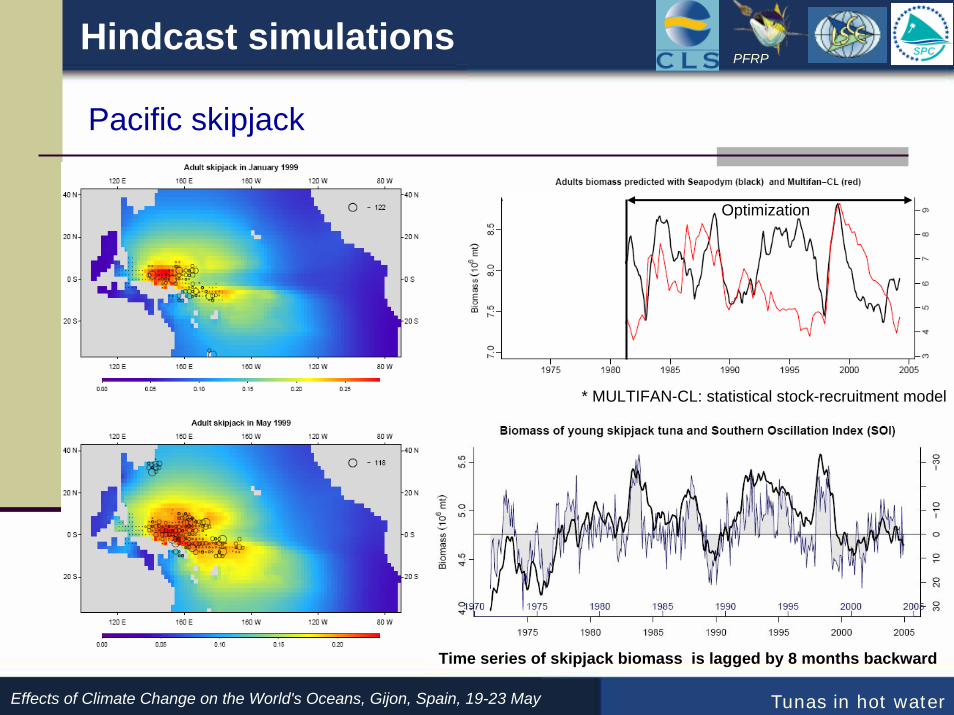
OptimizationHindcast
Time series of skipjack biomassTime series of skipjack biomass is lagged by 8 months backwardis lagged by 8 months backward
* MULTIFANMULTIFAN--CL: statistical stockCL: statistical stock--recruitment modelrecruitment model
Hindcast simulations
Pacific bigeye stock
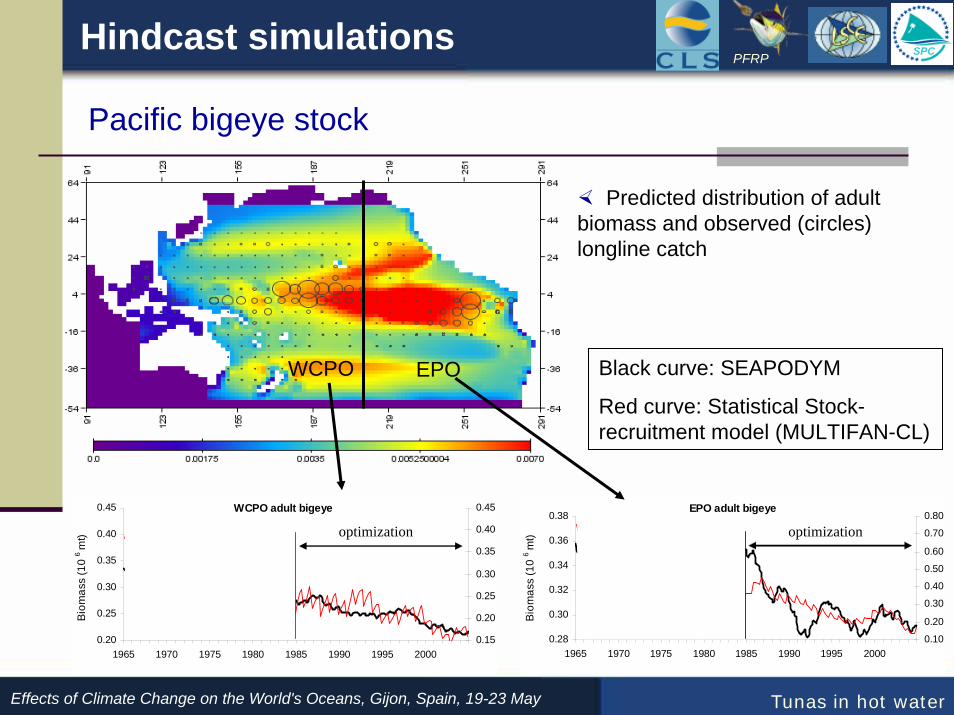
Predicted distribution of adult biomass and observed (circles) longline catch
WCPO adult bigeye
0.20
0.25
0.30
0.35
0.40
0.45
1965 1970 1975 1980 1985 1990 1995 20000.15
0.20
0.25
0.30
0.35
0.40
0.45
Bio
mas
s (1
06 m
t)
EPO adult bigeye
0.28
0.30
0.32
0.34
0.36
0.38
1965 1970 1975 1980 1985 1990 1995 20000.10
0.20
0.30
0.40
0.50
0.60
0.70
0.80Bi
omas
s (1
06 m
t)
optimization hindcast optimization hindcast
WCPO EPO Black curve: SEAPODYM
Red curve: Statistical Stock-recruitment model (MULTIFAN-CL)
PFRP SPC
Tunas in hot waterEffects of Climate Change on the World's Oceans, Gijon, Spain, 19-23 May
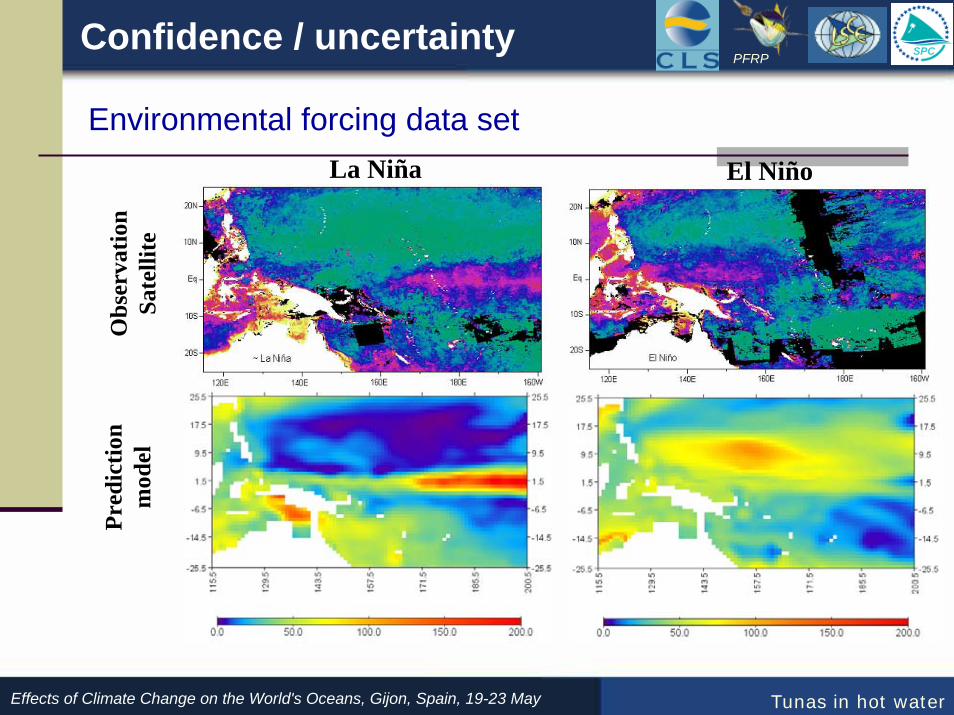
Confidence / uncertainty
Environmental forcing data set
PFRP SPC
Tunas in hot waterEffects of Climate Change on the World's Oceans, Gijon, Spain, 19-23 May
La Niña El Niño
Obs
erva
tion
Sate
llite
Pr
edic
tion
mod
el
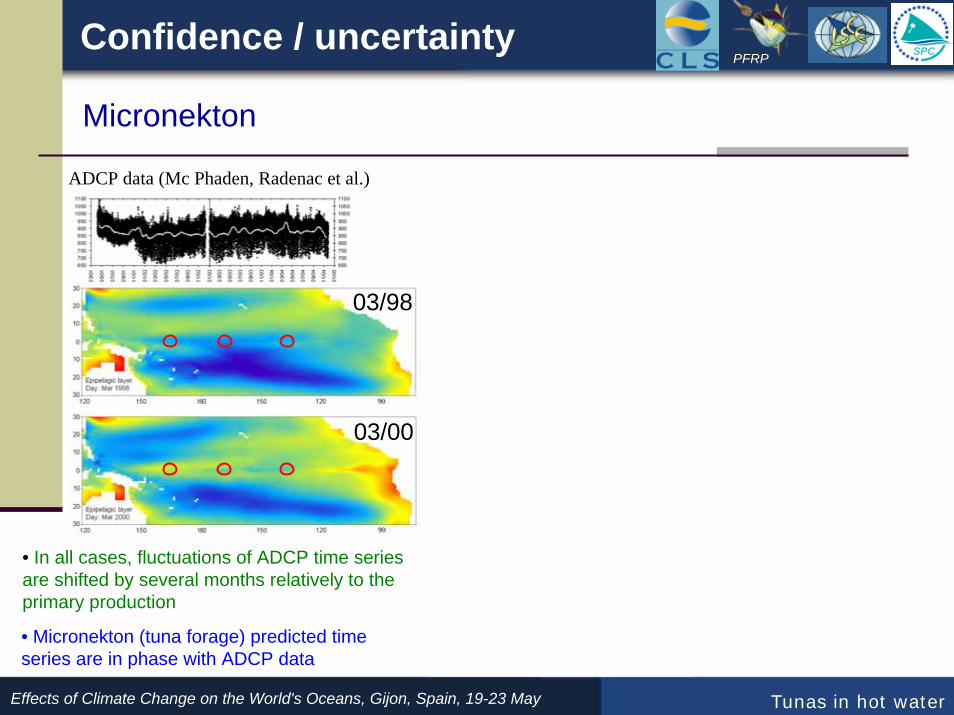
Micronekton
PFRP SPC
Tunas in hot waterEffects of Climate Change on the World's Oceans, Gijon, Spain, 19-23 May
ADCP data (Mc Phaden, Radenac et al.)
800
820
840
860
880
900
920
940
960
06-0
0
10-0
0
02-0
1
06-0
1
10-0
1
02-0
2
06-0
2
10-0
2
02-0
3
06-0
3
10-0
3
02-0
4
06-0
4
10-0
4
0,60,70,80,91,01,11,21,31,41,51,6Obs. ADCP night total
Model Pred. epipelagic night
800
820
840
860
880
900
920
940
960
06-0
0
10-0
0
02-0
1
06-0
1
10-0
1
02-0
2
06-0
2
10-0
2
02-0
3
06-0
3
10-0
3
02-0
4
06-0
4
10-0
4
0
20
40
60
80
100
120Obs. ADCP night totalModel Pred. PPtot
800
850
900
950
1000
1050
01/0
6/00
01/0
9/00
01/1
2/00
01/0
3/01
01/0
6/01
01/0
9/01
01/1
2/01
01/0
3/02
01/0
6/02
01/0
9/02
01/1
2/02
01/0
3/03
01/0
6/03
01/0
9/03
1,00
1,20
1,401,60
1,80
2,00
2,20
2,40
2,60Obs. ADCP night totalModel Pred. epipelagic night
800
850
900
950
1000
1050
01/0
6/00
01/0
9/00
01/1
2/00
01/0
3/01
01/0
6/01
01/0
9/01
01/1
2/01
01/0
3/02
01/0
6/02
01/0
9/02
01/1
2/02
01/0
3/03
01/0
6/03
01/0
9/03
020406080100120140160180200Obs. ADCP night total
Model Pred. PPtot
820
840
860
880
900
920
940
960
980
01/0
9/96
01/1
2/96
01/0
3/97
01/0
6/97
01/0
9/97
01/1
2/97
01/0
3/98
01/0
6/98
01/0
9/98
01/1
2/98
01/0
3/99
01/0
6/99
01/0
9/99
1,5
2,0
2,5
3,0
3,5
4,0Obs. ADCP night totalModel Pred. epipelagic night
820
840
860
880
900
920
940
960
980
01/0
9/96
01/1
2/96
01/0
3/97
01/0
6/97
01/0
9/97
01/1
2/97
01/0
3/98
01/0
6/98
01/0
9/98
01/1
2/98
01/0
3/99
01/0
6/99
01/0
9/99
0
50
100
150
200
250
300
Obs. ADCP night totalModel Pred. PPtot
165E
170W
140W
Confidence / uncertainty
• Micronekton (tuna forage) predicted time series are in phase with ADCP data
03/98
03/00
• In all cases, fluctuations of ADCP time series are shifted by several months relatively to the primary production
Confidence / uncertainty
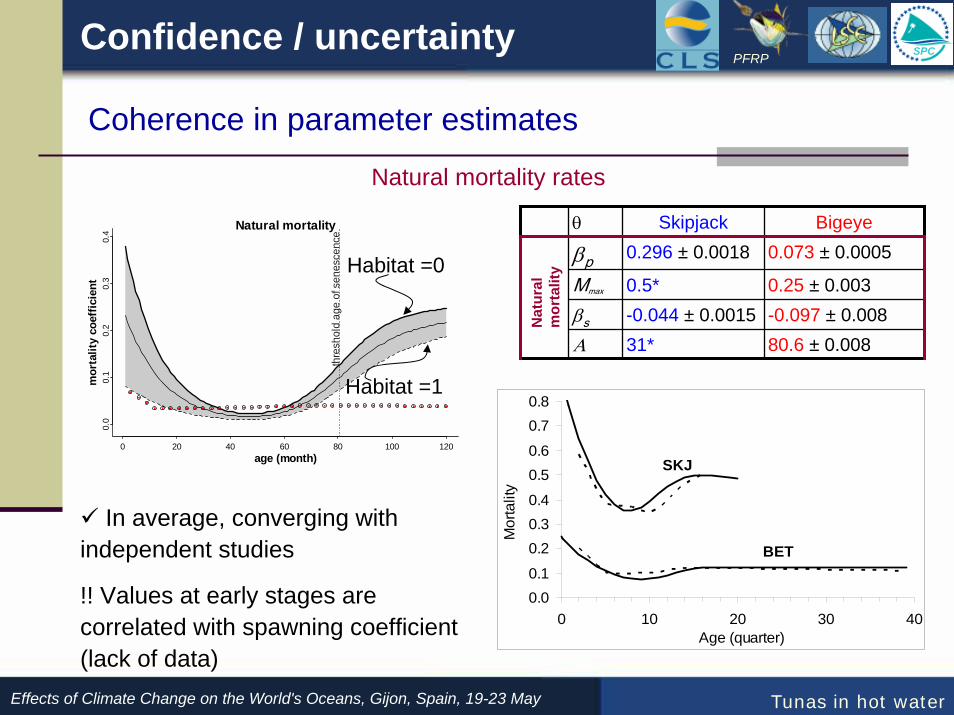
Coherence in parameter estimates
PFRP SPC
Tunas in hot waterEffects of Climate Change on the World's Oceans, Gijon, Spain, 19-23 May
θ Skipjack Bigeye
βp 0.296 ± 0.0018 0.073 ± 0.0005
Mmax 0.5* 0.25 ± 0.003βs -0.044 ± 0.0015 -0.097 ± 0.008Α 31* 80.6 ± 0.008
Nat
ural
m
orta
lity
0 20 40 60 80 100 120
0.0
0.1
0.2
0.3
0.4
Natural mortality
age (month)
mor
talit
y co
effic
ient
thre
shol
d ag
e of
sen
esce
nce
Habitat =0
Habitat =1
0.00.1
0.20.30.4
0.50.6
0.70.8
0 10 20 30 40Age (quarter)
Mor
talit
y
SKJ
BET
Natural mortality rates
In average, converging with independent studies
!! Values at early stages are correlated with spawning coefficient (lack of data)
θ Skipjack Bigeyeσ0 3.5* 0.82 ± 0.012Τ0 30.5 ± 0.0047 26.2 ± 0.013
σa 1.62 ± 0.0015 2.16 ± 0.004Τa 26* 13 ± 0.004Ο 3.86 ± 0.0009 0.46 ± 0.0006
Thermal habitat and oxygen tolerance
PFRP SPC
Tunas in hot waterEffects of Climate Change on the World's Oceans, Gijon, Spain, 19-23 May
Spaw
ning
habi
tat
Adu
lt ha
bita
t
Bigeye
0.0
0.5
1.0
5 15 25oC
Inde
x
1st cohort 2yr4 yr last cohort
∧
0.0
0.5
1.0
0 1 2 3 4 5Oxygen (ml/l)
Inde
x
skipjack bigeyeOxygen:ok for bigeyeok for skipjack
Temperature:ok for bigeye
!! difficult for skipjack
Coherence in parameter estimates
Confidence / uncertainty
Skipjack
0.0
0.5
1.0
5 15 25oC
Inde
x
1st cohort 2yr4 yr last cohort
Confidence / uncertaintyPFRP SPC
Tunas in hot waterEffects of Climate Change on the World's Oceans, Gijon, Spain, 19-23 May
Coherence in parameter estimates
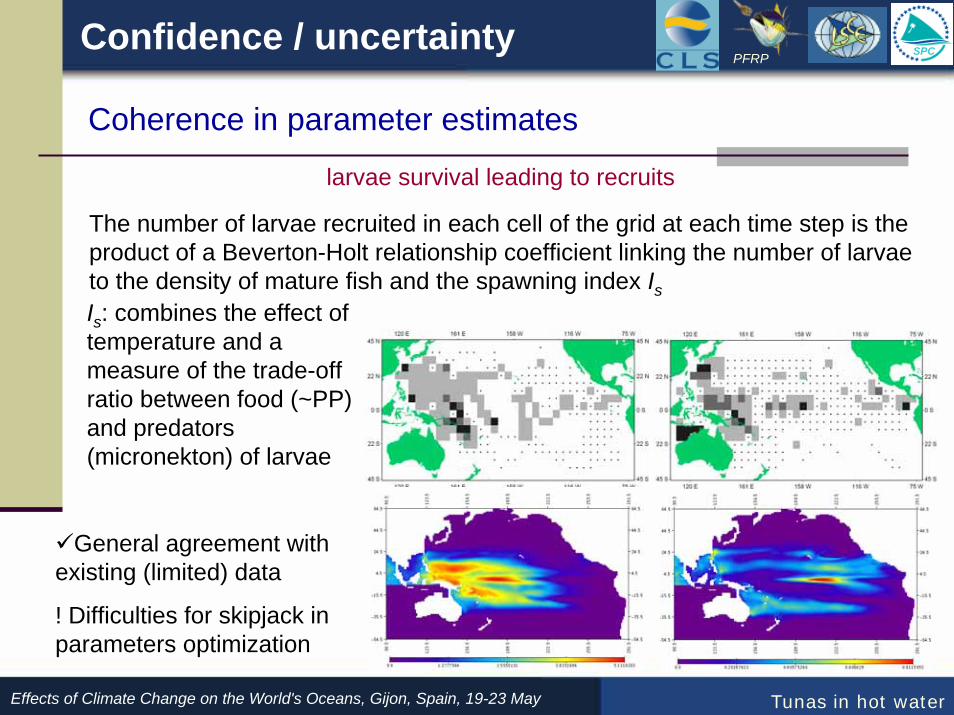
larvae survival leading to recruits
The number of larvae recruited in each cell of the grid at each time step is the product of a Beverton-Holt relationship coefficient linking the number of larvae to the density of mature fish and the spawning index IsIs: combines the effect of temperature and a measure of the trade-off ratio between food (~PP) and predators (micronekton) of larvae
General agreement with existing (limited) data
! Difficulties for skipjack in parameters optimization
Confidence / uncertaintyPFRP SPC
Tunas in hot waterEffects of Climate Change on the World's Oceans, Gijon, Spain, 19-23 May
Coherence in parameter estimates
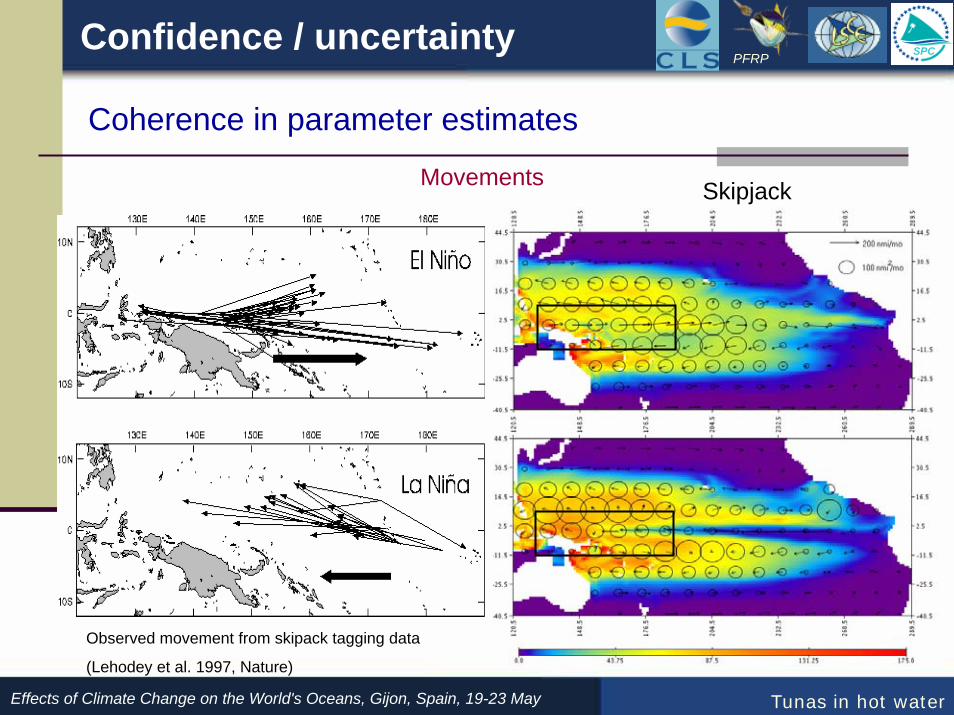
Movements Skipjack
Observed movement from skipack tagging data
(Lehodey et al. 1997, Nature)
Half-time…PFRP SPC
Tunas in hot waterEffects of Climate Change on the World's Oceans, Gijon, Spain, 19-23 May
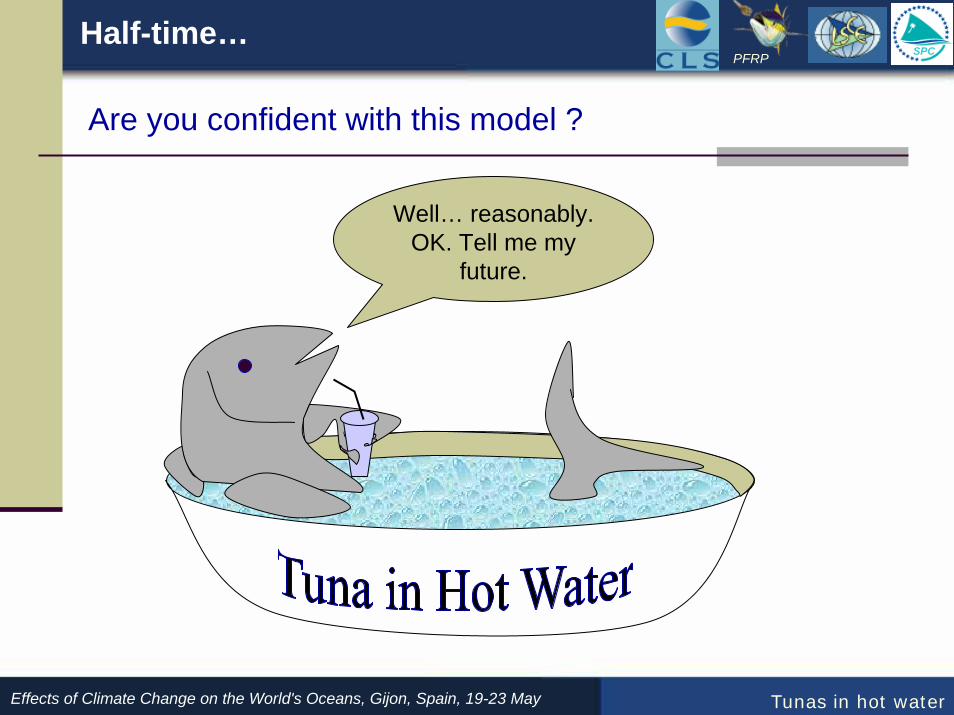
Are you confident with this model ?
Well… reasonably. OK. Tell me my
future.
Forecast: IPSL Simulation
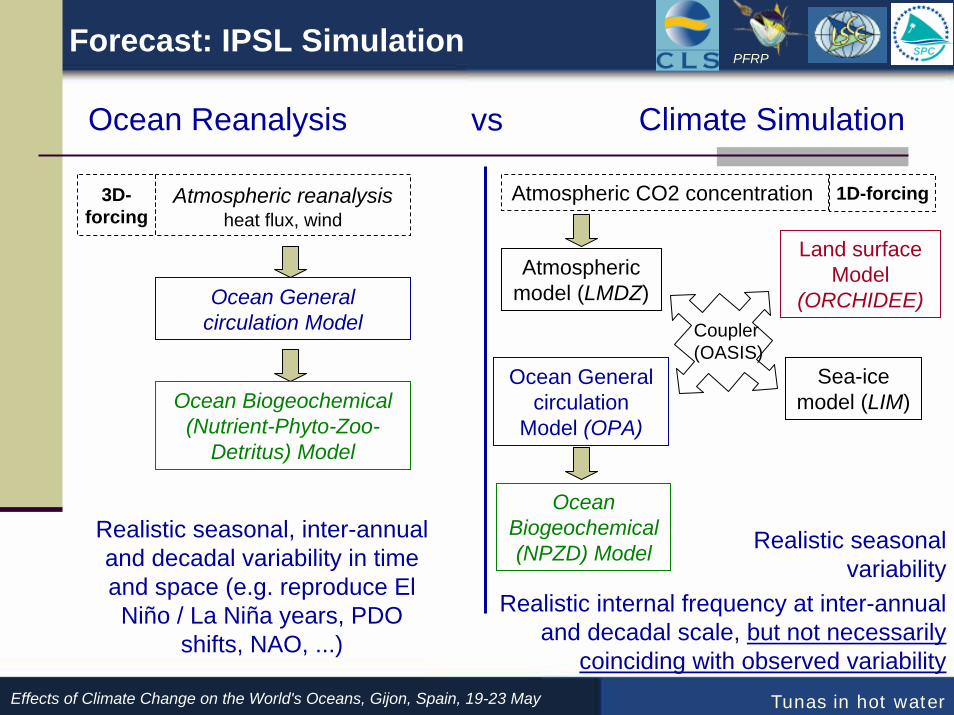
Ocean Reanalysis
Atmospheric reanalysisheat flux, wind
Ocean General circulation Model
Ocean Biogeochemical (Nutrient-Phyto-Zoo-
Detritus) Model
Climate Simulationvs
Ocean General circulation
Model (OPA)
Ocean Biogeochemical (NPZD) Model
Sea-ice model (LIM)
Atmospheric model (LMDZ)
Realistic seasonal, inter-annual and decadal variability in time and space (e.g. reproduce El Niño / La Niña years, PDO
shifts, NAO, ...)
Land surface Model
(ORCHIDEE)
Atmospheric CO2 concentration
Coupler (OASIS)
Realistic seasonal variability
Realistic internal frequency at inter-annual and decadal scale, but not necessarily
coinciding with observed variability
3D-forcing
1D-forcing
PFRP SPC
Tunas in hot waterEffects of Climate Change on the World's Oceans, Gijon, Spain, 19-23 May
PFRP SPC
Tunas in hot waterEffects of Climate Change on the World's Oceans, Gijon, Spain, 19-23 May
Nino3Nino5
STN0
200
400
600
800
1000
Sep
-97
Sep
-98
Sep
-99
Sep
-00
Sep
-01
Sep
-02
Sep
-03
Sep
-04
Sep
-05
Sep
-06
Sep
-07
PP
PP-sat SubTrop N PP-IPSL SubTrop N
0
200
400
600
800
Sep
-97
Sep
-98
Sep
-99
Sep
-00
Sep
-01
Sep
-02
Sep
-03
Sep
-04
Sep
-05
Sep
-06
Sep
-07
PP
PP-sat Nino3 PP-IPSL Nino3
100
150
200
250
300
Sep
-97
Sep
-98
Sep
-99
Sep
-00
Sep
-01
Sep
-02
Sep
-03
Sep
-04
Sep
-05
Sep
-06
Sep
-07
PP
PP-sat Nino5 PP-IPSL Nino5
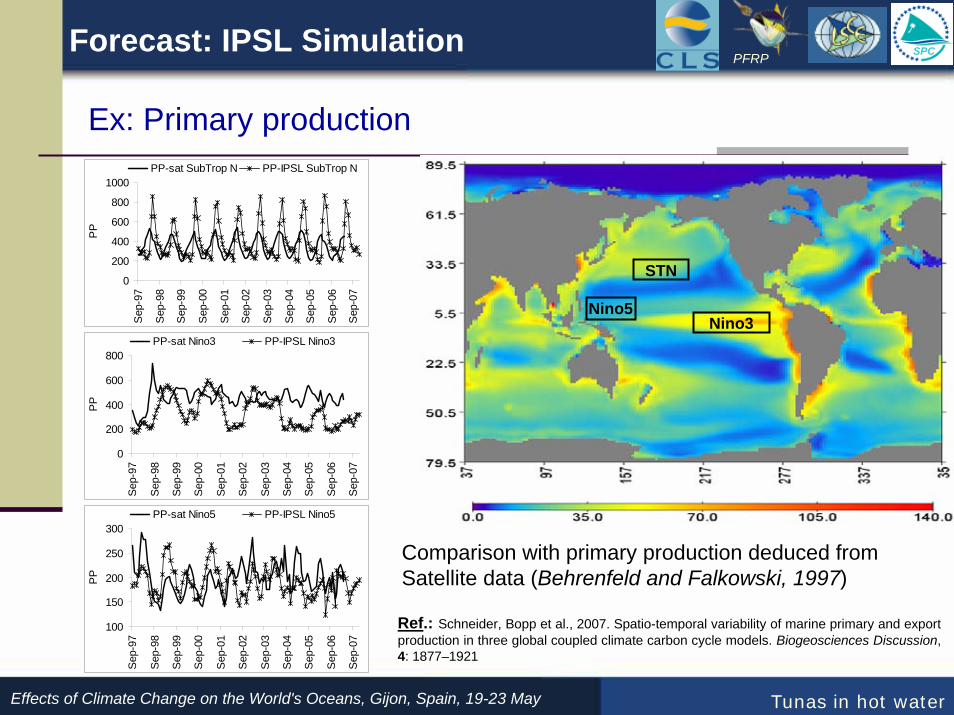
Ex: Primary production
Comparison with primary production deduced from Satellite data (Behrenfeld and Falkowski, 1997)
Ref.: Schneider, Bopp et al., 2007. Spatio-temporal variability of marine primary and export production in three global coupled climate carbon cycle models. Biogeosciences Discussion, 4: 1877–1921
Forecast: IPSL Simulation
PFRP SPC
Tunas in hot waterEffects of Climate Change on the World's Oceans, Gijon, Spain, 19-23 May
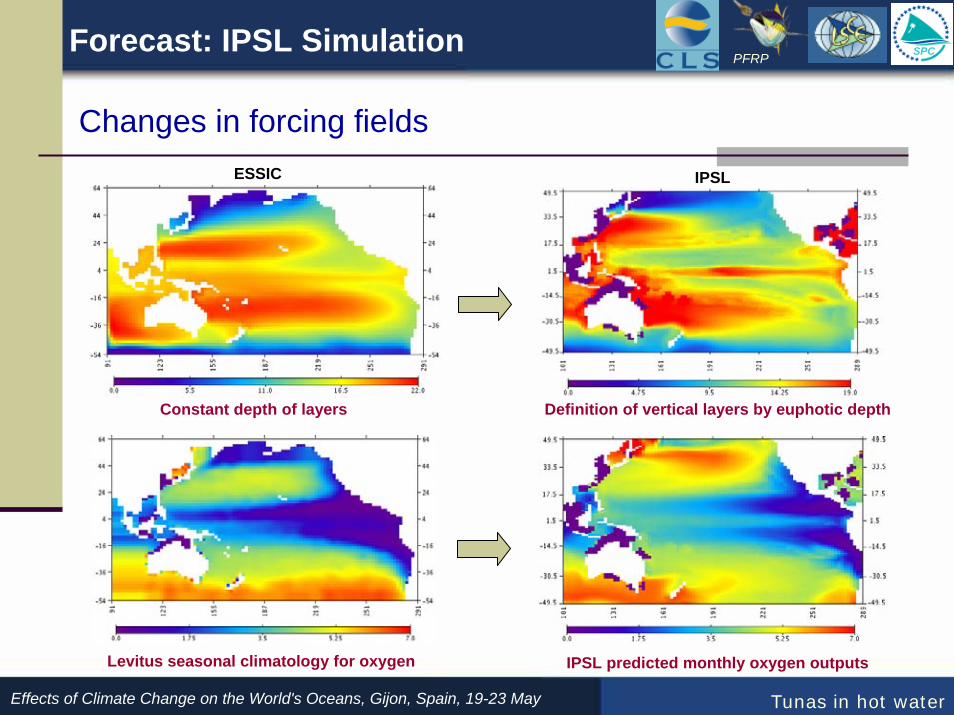
Changes in forcing fields
Levitus seasonal climatology for oxygen IPSL predicted monthly oxygen outputs
ESSIC IPSL
Constant depth of layers Definition of vertical layers by euphotic depth
Forecast: IPSL Simulation
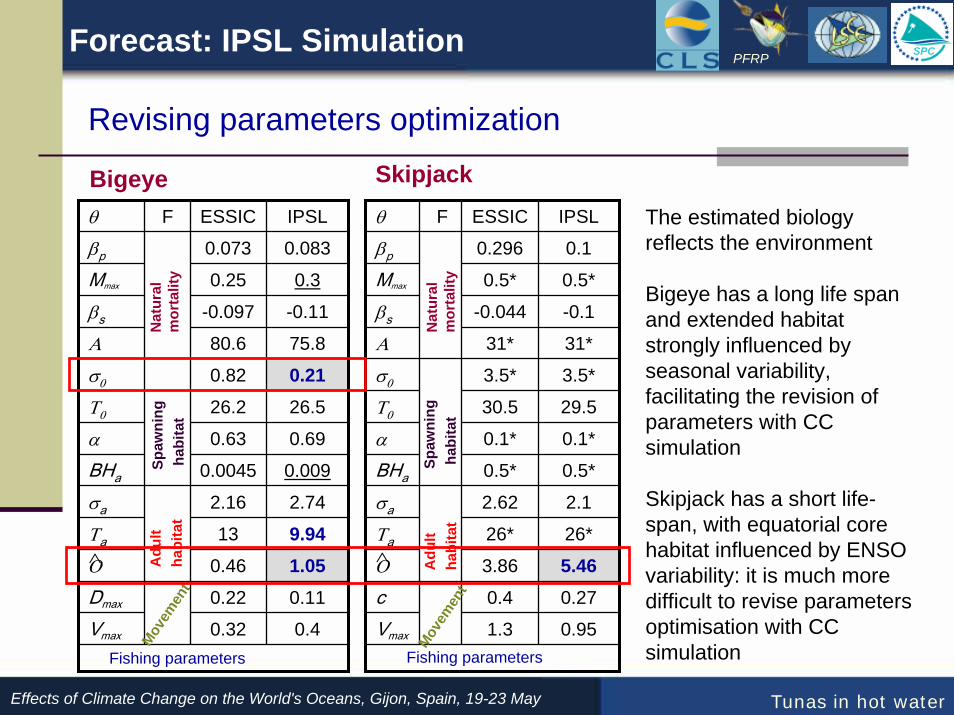
Revising parameters optimization
PFRP SPC
Tunas in hot waterEffects of Climate Change on the World's Oceans, Gijon, Spain, 19-23 May
θ F ESSIC IPSL
βp 0.073 0.083
Mmax 0.25 0.3
βs -0.097 -0.11
Α 80.6 75.8
σ0 0.82 0.21Τ0 26.2 26.5
α 0.63 0.69
BHa 0.0045 0.009
σa 2.16 2.74
Τa 13 9.94Ο 0.46 1.05Dmax 0.22 0.11
Vmax 0.32 0.4
Nat
ural
m
orta
lity
Spaw
ning
habi
tat
Adu
lt ha
bita
t
Movem
ent
Fishing parameters
∧ 5.463.86 Ο
0.951.3 Vmax
0.270.4 c
26*26*Τa
2.12.62 σa
0.5*0.5*BHa
0.1*0.1*α
29.530.5 Τ0
3.5*3.5*σ0
31*31*Α
-0.1-0.044 βs
0.5*0.5*Mmax
0.1 0.296 βp
IPSLESSICFθ
Nat
ural
m
orta
lity
Spaw
ning
habi
tat
Adu
lt ha
bita
t
Movem
ent
Fishing parameters
∧
Bigeye Skipjack
Forecast: IPSL Simulation
The estimated biology reflects the environment
Bigeye has a long life span and extended habitat strongly influenced by seasonal variability, facilitating the revision of parameters with CC simulation
Skipjack has a short life-span, with equatorial core habitat influenced by ENSO variability: it is much more difficult to revise parameters optimisation with CC simulation
PFRP SPC
Tunas in hot waterEffects of Climate Change on the World's Oceans, Gijon, Spain, 19-23 May
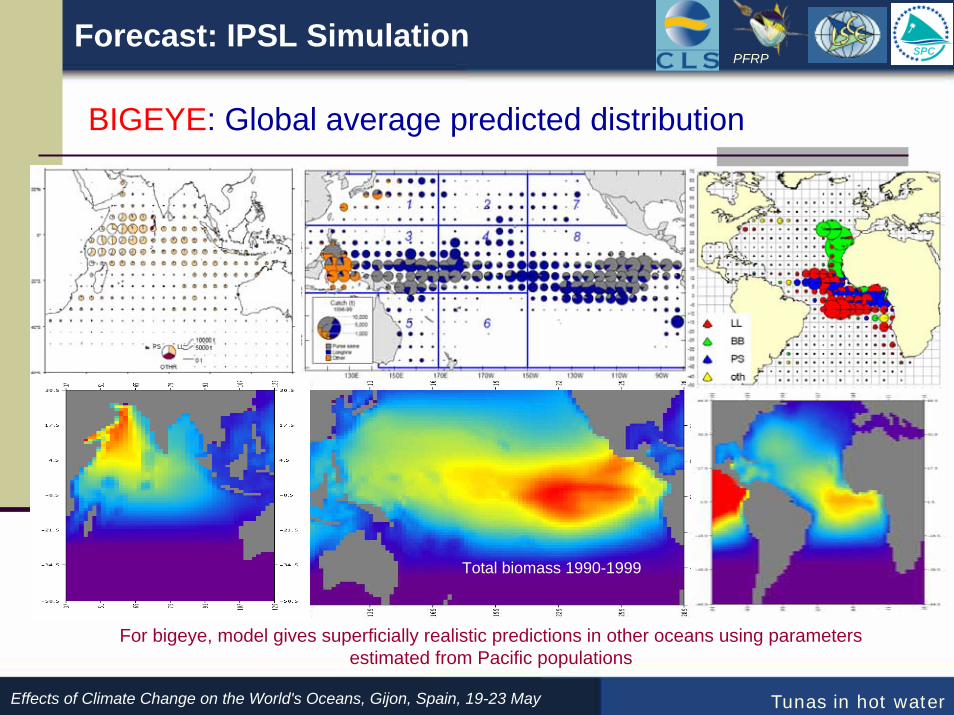
BIGEYE: Global average predicted distribution
Total biomass 1990-1999
For bigeye, model gives superficially realistic predictions in other oceans using parameters estimated from Pacific populations
Forecast: IPSL Simulation
PFRP SPC
Tunas in hot waterEffects of Climate Change on the World's Oceans, Gijon, Spain, 19-23 May
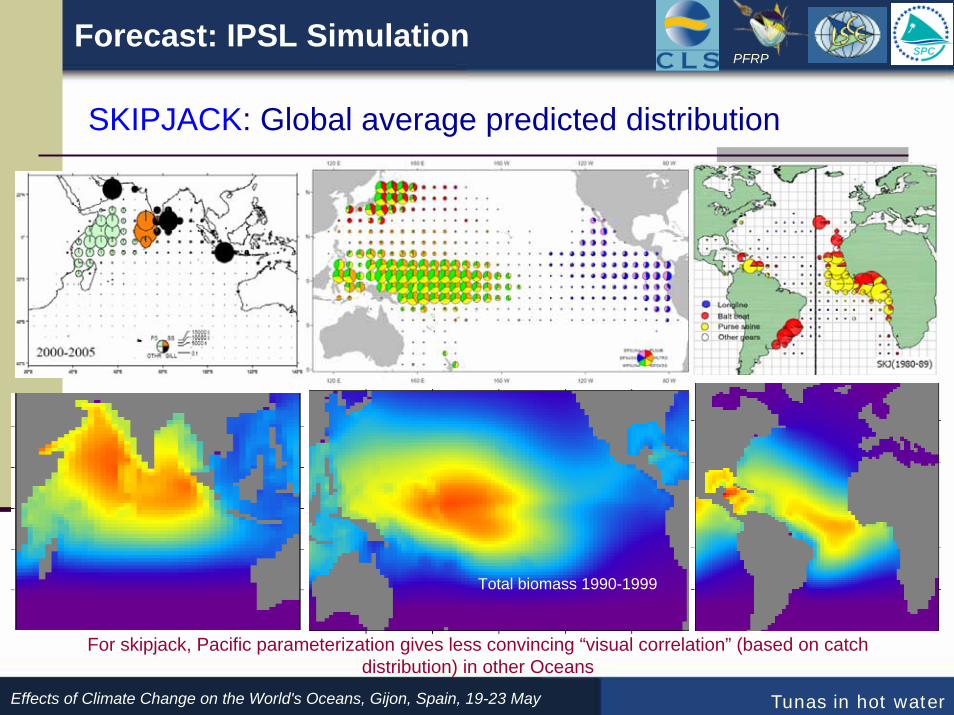
SKIPJACK: Global average predicted distribution
Total biomass 1990-1999
For skipjack, Pacific parameterization gives less convincing “visual correlation” (based on catch distribution) in other Oceans
Forecast: IPSL Simulation
Total biomass 1990-1999
PFRP SPC
Tunas in hot waterEffects of Climate Change on the World's Oceans, Gijon, Spain, 19-23 May
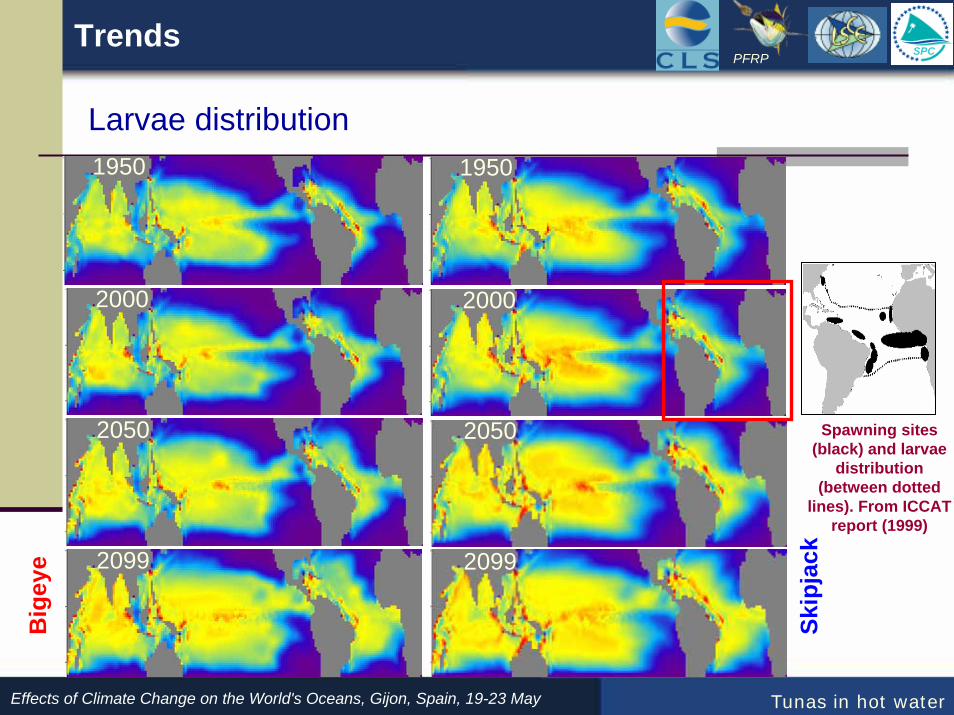
Larvae distribution
Total biomass 1990-1999
Trends
2000
2050
2099
Big
eye
1950
2000
2050
2099
1950
Skip
jack
Spawning sites (black) and larvae
distribution (between dotted
lines). From ICCAT report (1999)
PFRP SPC
Tunas in hot waterEffects of Climate Change on the World's Oceans, Gijon, Spain, 19-23 May
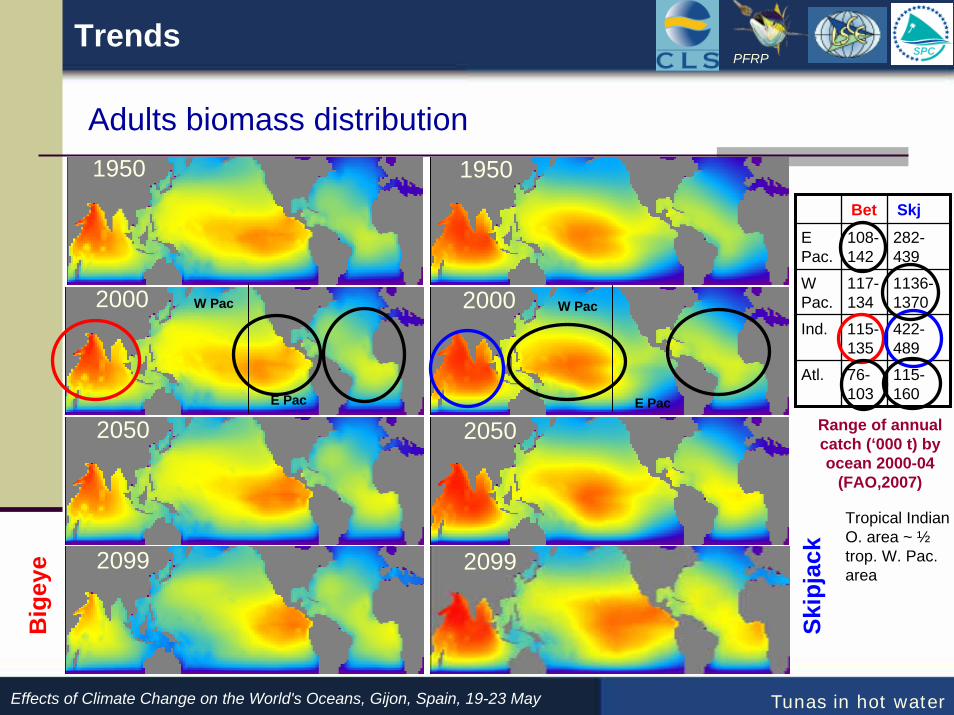
Adults biomass distribution
Trends
2000
2050
2099
Big
eye
1950
2000
2050
2099
1950
Skip
jack
Bet SkjE Pac.
108-142
282-439
W Pac.
117-134
1136-1370
Ind. 115-135
422-489
Atl. 76-103
115-160
W Pac
E Pac
W Pac
E PacRange of annual catch (‘000 t) by ocean 2000-04
(FAO,2007)
Tropical Indian O. area ~ ½trop. W. Pac. area
1E+02
3E+02
5E+02
7E+02
9E+02
1950
1960
1970
1980
1990
2000
2010
2020
2030
2040
2050
2060
2070
2080
2090
2100
Indian Pacific Atlantic
PFRP SPC
Tunas in hot waterEffects of Climate Change on the World's Oceans, Gijon, Spain, 19-23 May
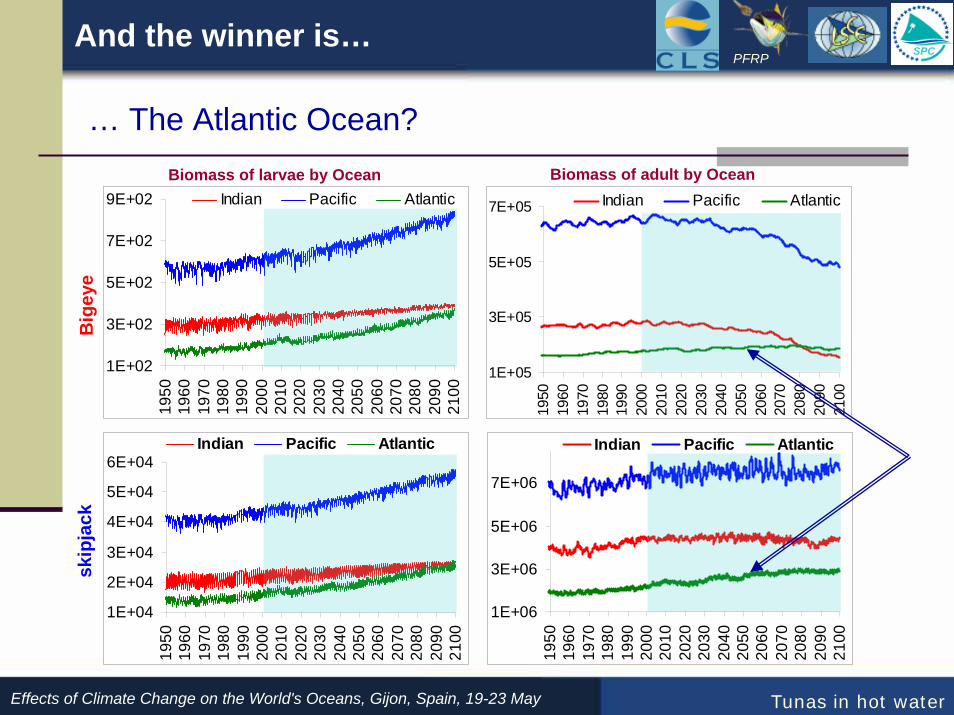
And the winner is…
1E+05
3E+05
5E+05
7E+05
1950
1960
1970
1980
1990
2000
2010
2020
2030
2040
2050
2060
2070
2080
2090
2100
Indian Pacific AtlanticBiomass of larvae by Ocean
skip
jack
Big
eye
Biomass of adult by Ocean
1E+04
2E+04
3E+04
4E+04
5E+04
6E+04
1950
1960
1970
1980
1990
2000
2010
2020
2030
2040
2050
2060
2070
2080
2090
2100
Indian Pacific Atlantic
1E+06
3E+06
5E+06
7E+06
1950
1960
1970
1980
1990
2000
2010
2020
2030
2040
2050
2060
2070
2080
2090
2100
Indian Pacific Atlantic
… The Atlantic Ocean?
1E+02
3E+02
5E+02
7E+02
9E+02
1950
1960
1970
1980
1990
2000
2010
2020
2030
2040
2050
2060
2070
2080
2090
2100
Indian Pacific Atlantic
PFRP SPC
Tunas in hot waterEffects of Climate Change on the World's Oceans, Gijon, Spain, 19-23 May
By the way…
1E+05
3E+05
5E+05
7E+05
1950
1960
1970
1980
1990
2000
2010
2020
2030
2040
2050
2060
2070
2080
2090
2100
Indian Pacific AtlanticBiomass of larvae by Ocean
skip
jack
Big
eye
Biomass of adult by Ocean
1E+04
2E+04
3E+04
4E+04
5E+04
6E+04
1950
1960
1970
1980
1990
2000
2010
2020
2030
2040
2050
2060
2070
2080
2090
2100
Indian Pacific Atlantic
1E+06
3E+06
5E+06
7E+06
1950
1960
1970
1980
1990
2000
2010
2020
2030
2040
2050
2060
2070
2080
2090
2100
Indian Pacific Atlantic
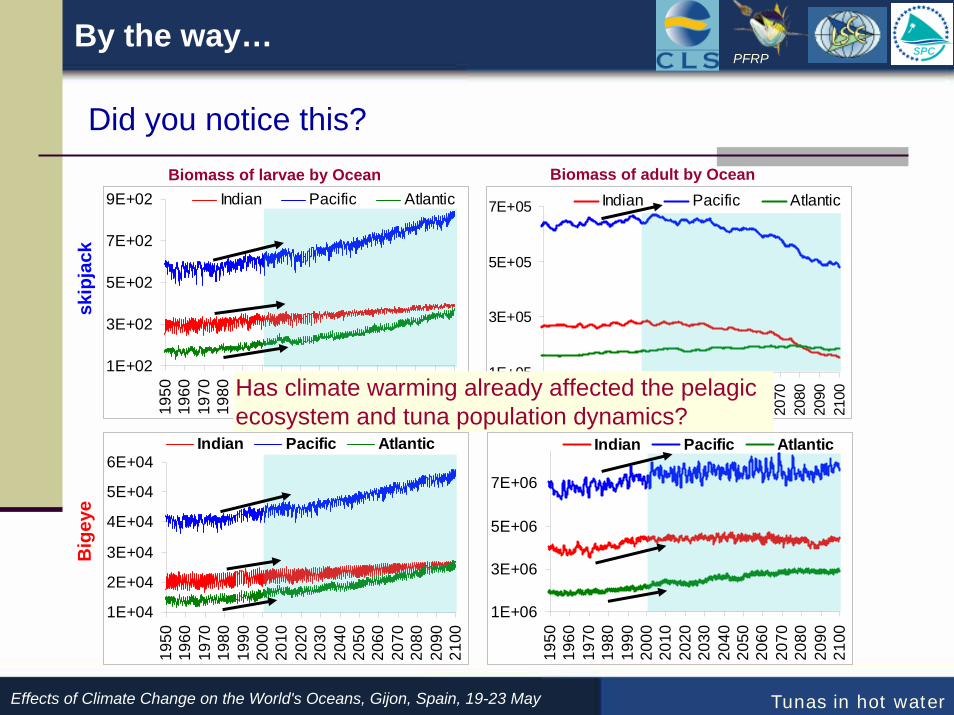
Did you notice this?
Has climate warming already affected the pelagic ecosystem and tuna population dynamics?
PFRP SPC
Tunas in hot waterEffects of Climate Change on the World's Oceans, Gijon, Spain, 19-23 May
Conclusions
Summary
UncertaintySingle reanalysis and some changes in forcing fields of climate change scenarioDifficulties in optimization of some parameters for skipjackVery few estimate of accuracy of forage componentsInteraction between species?
ConfidenceRigorous optimization leads to meaningful biological parameters
Many mechanisms in the model based on relative rather than absolute parameterization
Predictions in agreement with independent stock assessment estimates (MFCL) including for hindcast simulations
Limited and coherent changes in parameter estimates between reanalysis and CC simulations
Realistic distribution in three oceans with one single (Pacific) parameterization
Coherent changes in habitats and dynamic
So what?
Modeling• End-to-end ecosystem modelling is possible by avoiding excessive reductionism.
• Optimized parametrization is key issue to investigate the top-down & bottom-up control of marine ecosystems.
• SEAPODYM will find application in evaluation of tuna fishery management
Climate change simulation1. We got different (complex) responses by species and Ocean.
2. Despite general increase in larvae abundance, adult biomass decrease in some places but not in others: e.g., increase in the Atlantic, abrupt decrease of bigeye in the Indian and western Pacific… Which mechanisms? thresholds?
3. Tuna populations may have been already impacted by CC. Any evidence of that?
4. Large pelagic highly migratory animals are sentinelle species of the CC. We should monitor these animals carefully.
PFRP SPC
Tunas in hot waterEffects of Climate Change on the World's Oceans, Gijon, Spain, 19-23 May
Conclusions
Next steps
PFRP SPC
Tunas in hot waterEffects of Climate Change on the World's Oceans, Gijon, Spain, 19-23 May
Conclusions
Compare fishery and climate effects during historical period in Atlantic and Indian O.
Apply to yellowfin tuna
Optimization using other reanalysis and simulation products
Optimization with multi-species for testing species-interaction (need parallel code)
Verify forage components; implement MAAS project (CLIOTOP: next meeting in Bergen, Norway, June 24)
Forecast fishing effects into the future (needs model of fishery dynamics, topic for CLIOTOP WG5)
CLIOTOP web site: http://web.pml.ac.uk/globec/structure/regional/cliotop/cliotop.htm
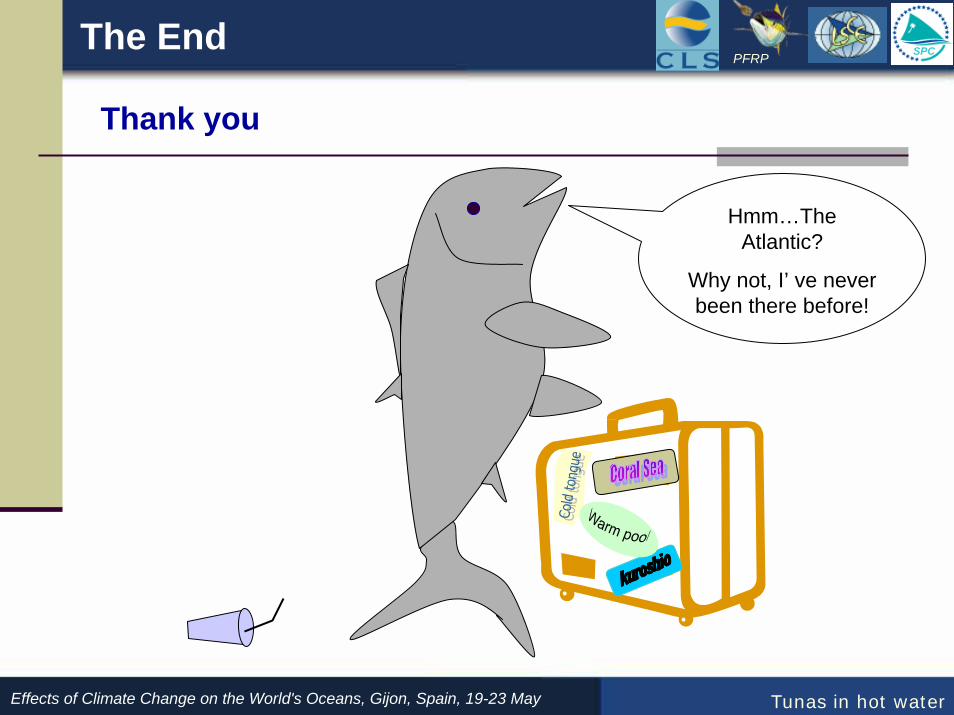
PFRP SPCThe End
Thank you
Hmm…The Atlantic?
Why not, I’ ve never been there before!
Tunas in hot waterEffects of Climate Change on the World's Oceans, Gijon, Spain, 19-23 May