Embed Size (px)
Citation preview
Atmospheric Environment 37 (2003) 1583–1591
Tunable diode laser absorption spectrometer measurementsof ambient nitrogen dioxide, nitric acid, formaldehyde,
and hydrogen peroxide in Parlier, California
Claudia G. Sauer, John T. Pisano, Dennis R. Fitz*
College of Engineering-Center for Environmental Research and Technology (CE-CERT),
University of California Riverside, Riverside, CA 92521-0434, USA
Received 12 August 2002; accepted 22 December 2002
Abstract
Field measurements were conducted to determine atmospheric concentrations of nitrogen dioxide, nitric acid,
formaldehyde, and hydrogen peroxide gases using two dual-channel tunable diode laser absorption systems. These
measurements were made as part of the Central California Ozone Study (CCOS) and were conducted for a total of 28
days from July to September 2000 at the Kearney Agricultural Research Station in Parlier, California. All four trace
gases exhibit marked diurnal cycles. Ranges of measured concentrations: 1–38 ppb NO2, 0–26 ppb HNO3, 1–17 ppb
HCHO, and 0–1.2 ppb H2O2. Formaldehyde, nitric acid and hydrogen peroxide mixing ratios showed unusual behavior
during the last intensive measurement period in September 2000.
r 2003 Elsevier Science Ltd. All rights reserved.
Keywords: CCOS; Field study; Diurnal profile; Gas phase; Ozone episode
1. Introduction
Nitrogen dioxide (NO2), nitric acid (HNO3), formal-
dehyde (HCHO), and hydrogen peroxide (H2O2) are
important atmospheric pollutants. Although there has
been significant effort in developing techniques for the
measurement of these trace gases, few methods have
shown the capability of making the required measure-
ments with the degree of specificity and sensitivity
necessary for atmospheric assessment. Accurate mea-
surements of these species are important for assessing
the environmental impacts and devising emission con-
trol strategies to reduce these impacts. Finlayson-Pitts
and Pitts (2000) summarize the atmospheric importance,
reactions, and measurement methods for these com-
pounds.
Nitrogen dioxide is the precursor for tropospheric
ozone, which is known to be harmful to organic tissues,
including crops as well as humans (Haagen-Smit et al.,
1952). It has been shown to be measurable in ambient air
by various techniques: ozone chemiluminescence after
reduction to NO (Fontijn et al., 1970), direct luminol
chemiluminescence (Gaffney et al., 1998, 1999), tunable
diode laser absorption spectroscopy (TDLAS) (Schiff
et al., 1994; Fried et al., 1998), and laser induced
fluorescence (LIF) (Thornton et al., 2000; Matsumoto
et al., 2001). A prototype luminol-based chemilumines-
cence instrument, which measures NO2 directly, was
operated at the site. Because luminol is known to react
with ozone, PAN and SO2 (Pisano et al., 1996) this
instrument employed a capillary column to minimize
these interferences. The TDLAS technique is advanta-
geous for two major reasons. First, it is spectroscopically
specific as the line width of a typical diode laser is better
than 10 MHz, far narrower than the 200 MHz, typical of
absorption line widths (Reid et al., 1978). Second, it is a
AE International – North America
*Corresponding author. Fax: +1-909-781-5790.
E-mail address: [email protected] (D. Fitz).
1352-2310/03/$ - see front matter r 2003 Elsevier Science Ltd. All rights reserved.
doi:10.1016/S1352-2310(03)00004-9
direct measurement technique since it does not require
conversion of NO2 into another species (e.g., NO) before
detection.
Nitric acid is an important gaseous species to measure
because it serves as the major sink for ambient airborne
nitrogen oxides as well as a significant sink for hydroxyl
radicals. The latter radical initiates many of the gas
phase reactions that degrade hydrocarbons in ambient
air. Due to its sorptive properties and equilibrium with
ammonium nitrate, nitric acid has proved to be a
difficult species to quantify in ambient air and it has
been the subject of a number of comparison studies
(Spicer et al., 1982; Anlauf et al., 1985; Fox et al., 1988;
Hering et al., 1988; Tanner et al., 1989; Fitz et al., 2003).
The present methods for measuring nitric acid include
denuder-based collection and infrared spectroscopic
techniques such as FTIR and TDLAS. Although there
has been moderate success during their use in short-term
monitoring programs, none of the methods has become
widely accepted as meeting the combined criteria of high
sensitivity, accuracy, portability, and consistency of
performance. The TDLAS was again chosen as the
measurement method of choice due to overall perfor-
mance and commercial availability.
Formaldehyde is emitted directly into the troposphere
and is also a product of the photochemical degradation
of hydrocarbons. Furthermore, HCHO in itself acts as a
photolytic radical source contributing to ozone forma-
tion. Commonly HCHO is measured via its reaction
with 2,4-dinitrophenyl hydrazine (DNPH). However,
ozone and other pollutants have been shown to interfere
with this technique (Kleindienst et al., 1998). For typical
ambient levels, DNPH cartridges must be collected for
1 h or more. Spectroscopic methods such as TDLAS,
long-path FTIR, and differential optical absorption
spectroscopy (DOAS) can provide measurements with
both high specificity and fast time resolution. A number
of inter-comparison studies (Lawson et al., 1990;
Kleindienst et al., 1988; Sirju and Shepson, 1995;
Benning and Wahner, 1998) have shown reasonable
agreement between these methods, especially if ozone is
removed prior to reaction with DNPH. TDLAS was
used in the present study because of availability and
compatibility with the simultaneous measurement of the
other trace pollutants.
Hydrogen peroxide is the product of ambient hydro-
carbon degradation in the absence of excess nitric oxide.
As a result it forms a sink for HOx radicals. At the same
time it also photolyzes to OH radicals, and, therefore,
contributes to ozone formation. The most commonly
used methods to measure atmospheric hydrogen per-
oxide use water absorption followed by reaction with a
reagent to form a colored adduct (Li and Dasgupta,
2000; Komazaki et al., 2001). Ozone and sulfur dioxide
are known to be interferents, and it is likely that other
ambient oxidants may interfere as well. TDLAS and
long-path FTIR have both shown to provide measure-
ments with high time resolution and specificity. The
TDLAS was chosen for its direct measurement cap-
ability.
2. Experimental
2.1. Measurement site
The TDLAS measurement equipment was installed at
the University of California Kearney Agricultural
Station near Parlier, California, as a part of the air-
monitoring component of the Central California Ozone
Study (CCOS). The primary objectives of CCOS were to
gather an aerometric database for modeling and to
apply air models for the attainment demonstration
portion of the State Implementation Plan (SIP) for the
Federal 8-h and State 1-h ozone standards. To meet this
objective additional temporary monitoring was added
and existing sites were supplemented with additional
equipment. Parlier was an existing site chosen because it
is rural and E25 km downwind (during the prevailing
daytime wind pattern) of Fresno, a major metropolitan
area of the San Joaquin Valley with a population of
400,000. In addition to the TDLAS measurement
system, this site was equipped to measure ozone,
JNO2; NO, NOx, NOy, NOy–HNO3, NO2, PAN, NO3
�,
CO, PM2.5 (mass), PM2.5 (light scattering), CO2, VOC
and organic carbonyl compounds. All parameters
except the last two were measured continuously. The
VOC and organic carbonyl compounds were measured
at 1- and 3-h intervals, respectively, during 14 intensive
measurement days. The days were determined by
forecasts of high levels of ozone based on meteor-
ology.
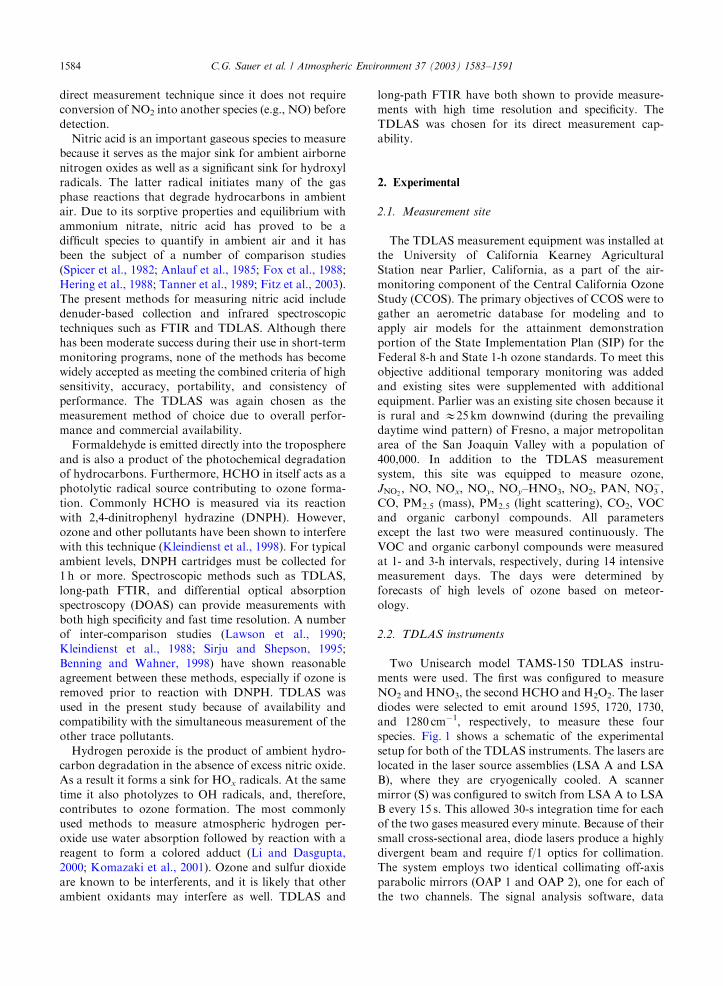
2.2. TDLAS instruments
Two Unisearch model TAMS-150 TDLAS instru-
ments were used. The first was configured to measure
NO2 and HNO3, the second HCHO and H2O2. The laser
diodes were selected to emit around 1595, 1720, 1730,
and 1280 cm�1, respectively, to measure these four
species. Fig. 1 shows a schematic of the experimental
setup for both of the TDLAS instruments. The lasers are
located in the laser source assemblies (LSA A and LSA
B), where they are cryogenically cooled. A scanner
mirror (S) was configured to switch from LSA A to LSA
B every 15 s. This allowed 30-s integration time for each
of the two gases measured every minute. Because of their
small cross-sectional area, diode lasers produce a highly
divergent beam and require f/1 optics for collimation.
The system employs two identical collimating off-axis
parabolic mirrors (OAP 1 and OAP 2), one for each of
the two channels. The signal analysis software, data
C.G. Sauer et al. / Atmospheric Environment 37 (2003) 1583–15911584
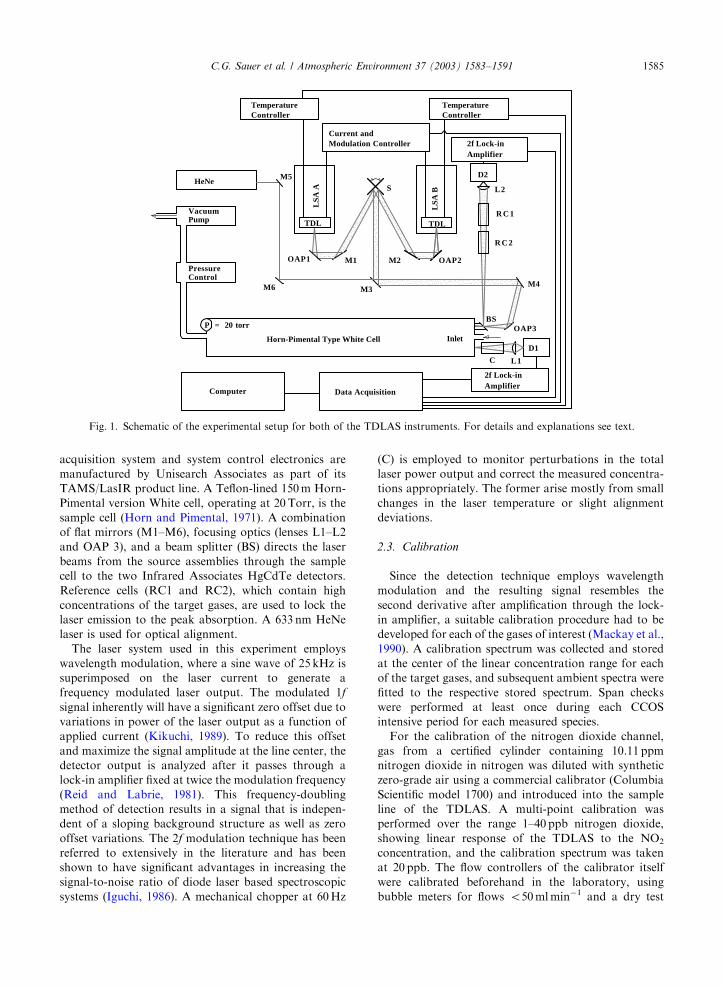
acquisition system and system control electronics are
manufactured by Unisearch Associates as part of its
TAMS/LasIR product line. A Teflon-lined 150m Horn-
Pimental version White cell, operating at 20 Torr, is the
sample cell (Horn and Pimental, 1971). A combination
of flat mirrors (M1–M6), focusing optics (lenses L1–L2
and OAP 3), and a beam splitter (BS) directs the laser
beams from the source assemblies through the sample
cell to the two Infrared Associates HgCdTe detectors.
Reference cells (RC1 and RC2), which contain high
concentrations of the target gases, are used to lock the
laser emission to the peak absorption. A 633 nm HeNe
laser is used for optical alignment.
The laser system used in this experiment employs
wavelength modulation, where a sine wave of 25 kHz is
superimposed on the laser current to generate a
frequency modulated laser output. The modulated 1f
signal inherently will have a significant zero offset due to
variations in power of the laser output as a function of
applied current (Kikuchi, 1989). To reduce this offset
and maximize the signal amplitude at the line center, the
detector output is analyzed after it passes through a
lock-in amplifier fixed at twice the modulation frequency
(Reid and Labrie, 1981). This frequency-doubling
method of detection results in a signal that is indepen-
dent of a sloping background structure as well as zero
offset variations. The 2f modulation technique has been
referred to extensively in the literature and has been
shown to have significant advantages in increasing the
signal-to-noise ratio of diode laser based spectroscopic
systems (Iguchi, 1986). A mechanical chopper at 60Hz
(C) is employed to monitor perturbations in the total
laser power output and correct the measured concentra-
tions appropriately. The former arise mostly from small
changes in the laser temperature or slight alignment
deviations.
2.3. Calibration
Since the detection technique employs wavelength
modulation and the resulting signal resembles the
second derivative after amplification through the lock-
in amplifier, a suitable calibration procedure had to be
developed for each of the gases of interest (Mackay et al.,
1990). A calibration spectrum was collected and stored
at the center of the linear concentration range for each
of the target gases, and subsequent ambient spectra were
fitted to the respective stored spectrum. Span checks
were performed at least once during each CCOS
intensive period for each measured species.
For the calibration of the nitrogen dioxide channel,
gas from a certified cylinder containing 10.11 ppm
nitrogen dioxide in nitrogen was diluted with synthetic
zero-grade air using a commercial calibrator (Columbia
Scientific model 1700) and introduced into the sample
line of the TDLAS. A multi-point calibration was
performed over the range 1–40 ppb nitrogen dioxide,
showing linear response of the TDLAS to the NO2
concentration, and the calibration spectrum was taken
at 20 ppb. The flow controllers of the calibrator itself
were calibrated beforehand in the laboratory, using
bubble meters for flows o50ml min�1 and a dry test
P = 20 torr
2f Lock-inAmplifier
D1
C
OAP3Horn-Pimental Type White Cell
Computer Data Acquisition
Vacuum
HeNeM5
M6
OAP1 M1
S
TDL TDL
OAP2M2
M3
LSA
A
LSA
B
TemperatureController
Modulation Controller
D2
L2
R C 2
R C 1
M4
2f Lock-in Amplifier
L1
TemperatureController
Current and
Inlet
Pump
ControlPressure
BS
Fig. 1. Schematic of the experimental setup for both of the TDLAS instruments. For details and explanations see text.
C.G. Sauer et al. / Atmospheric Environment 37 (2003) 1583–1591 1585
meter (referenced to the NIST) for the dilution flows.
The NO2 calibration was performed twice during the
measurement program. No deviation from linearity
(o2%) was observed in either of these calibrations.
The calibration source of nitric acid was a diffusion
tube containing 70% (w/w) nitric acid held in a water
bath at 45�C and flushed with synthetic air at about
20 cm3 min�1. This stream of span gas was diluted with
10 lmin�1 of synthetic zero-grade air to 60 ppb and
introduced into the sample line of the TDLAS. The
concentration of this calibration gas was measured by
bubbling the 20 cm3 min�1 flow through a diluted
sodium hydroxide solution of known concentration
and recording the titration curve.
The formaldehyde calibration gas was generated using
a diffusion tube held at 69�C and flushed with synthetic
air at about 20 cm3 min�1. This stream of span gas was
diluted with 10 lmin�1 of zero-grade synthetic air to
30 ppb and introduced into the sample line of the
TDLAS. To determine the concentration of formalde-
hyde in the calibration gas, the diffusion tube was
weighed before and after the study period. The
permeation rate was calculated based on the weight
loss, the elapsed time between the two mass determina-
tions and the assumption that the permeation rate was
constant during this time period.
The hydrogen peroxide calibration gas was generated
using an inverse diffusion tube held at 40�C and purged
with zero-grade synthetic air at about 20 cm3 min�1.
This stream of span gas was diluted to 15 ppb with
7 lmin�1 of ambient air, which was passed through a
charcoal filter to remove ambient hydrogen peroxide,
and subsequently introduced into the sample line of the
TDLAS. The permeation rate of the H2O2 calibration
source was measured by the colorimetric TiCl4 method
of Pilz and Johann (1974). Span checks were conducted
daily.
2.4. Data processing
The instruments were configured to record 1-min
averages for all concentrations. Each day the collected
data were compared with the operational records. Data
points that were deemed invalid due to operator
interventions (changing of the sample inlet filter,
conducting a calibration, necessary repairs, etc.) or
instrument failure were excluded from further proces-
sing. To improve the signal/noise ratio the data reported
here are 15-min averages, except for hydrogen peroxide
where, due to the low concentrations below 1 ppb,
averaging over 1 h was necessary to obtain a sufficient
signal/noise ratio to monitor ambient concentrations.
The detection limits for nitrogen dioxide, nitric acid,
and formaldehyde were 0.5 ppb, 1.0 ppb, and 1.0 ppb,
respectively. The detection limit for hydrogen peroxide
was 0.1 ppb in August and 0.25 ppb during September.
These values are calculated as three standard deviations
over the respective averaging period, i.e. 15 min for NO2,
HNO3, and HCHO, and 1 h for H2O2, respectively.
2.5. Sample train
The ambient sample was collected about 1m above
the roof of the trailer and building, respectively, where
the two instruments were located. A 5mm pore 47 mm
Teflon filter held in a PFA holder was used to remove
particles from the sampled air. Behind the filter a PFA
needle valve provided the necessary pressure drop from
ambient pressure to 20Torr. The sample line itself was a
6 m long 14
00(6mm) PFA tube; the sample rate was
7 lmin�1.
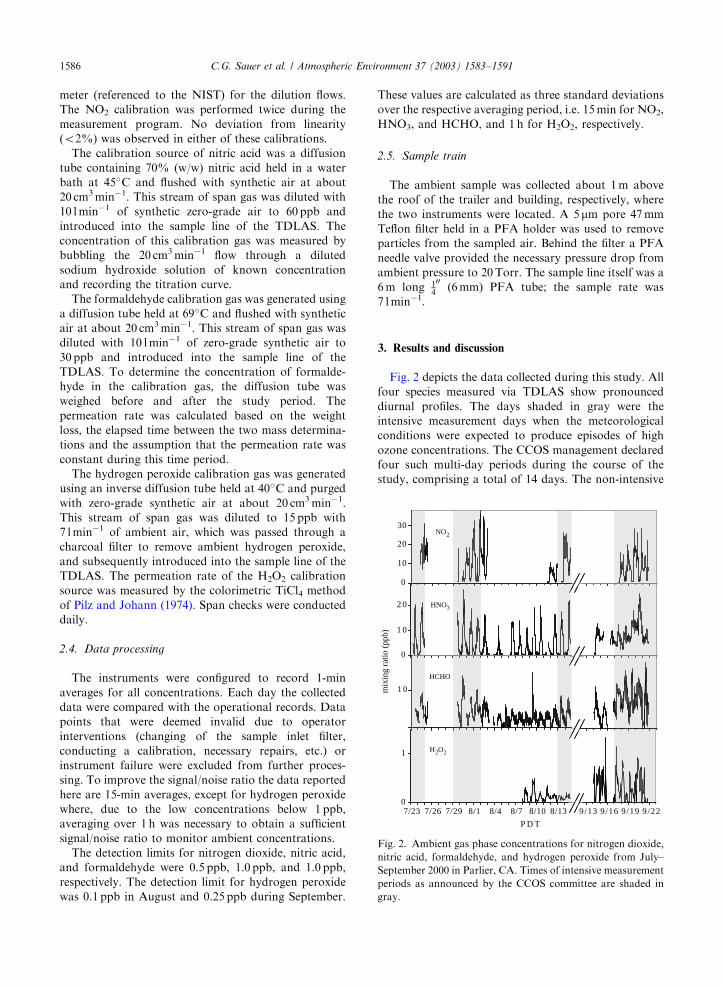
3. Results and discussion
Fig. 2 depicts the data collected during this study. All
four species measured via TDLAS show pronounced
diurnal profiles. The days shaded in gray were the
intensive measurement days when the meteorological
conditions were expected to produce episodes of high
ozone concentrations. The CCOS management declared
four such multi-day periods during the course of the
study, comprising a total of 14 days. The non-intensive
9/13 9/16 9/19 9/220
1
7/23 7/26 7/29 8/1 8/4 8/7 8/10 8/13
P D T
0
1 0
2 0
1 0
H2O2
3
0
10
20
302
mix
ing
ratio
(pp
b)
HCHO
HNO
NO
Fig. 2. Ambient gas phase concentrations for nitrogen dioxide,
nitric acid, formaldehyde, and hydrogen peroxide from July–
September 2000 in Parlier, CA. Times of intensive measurement
periods as announced by the CCOS committee are shaded in
gray.
C.G. Sauer et al. / Atmospheric Environment 37 (2003) 1583–15911586
measurement days were primarily between the second
and third intensive periods.
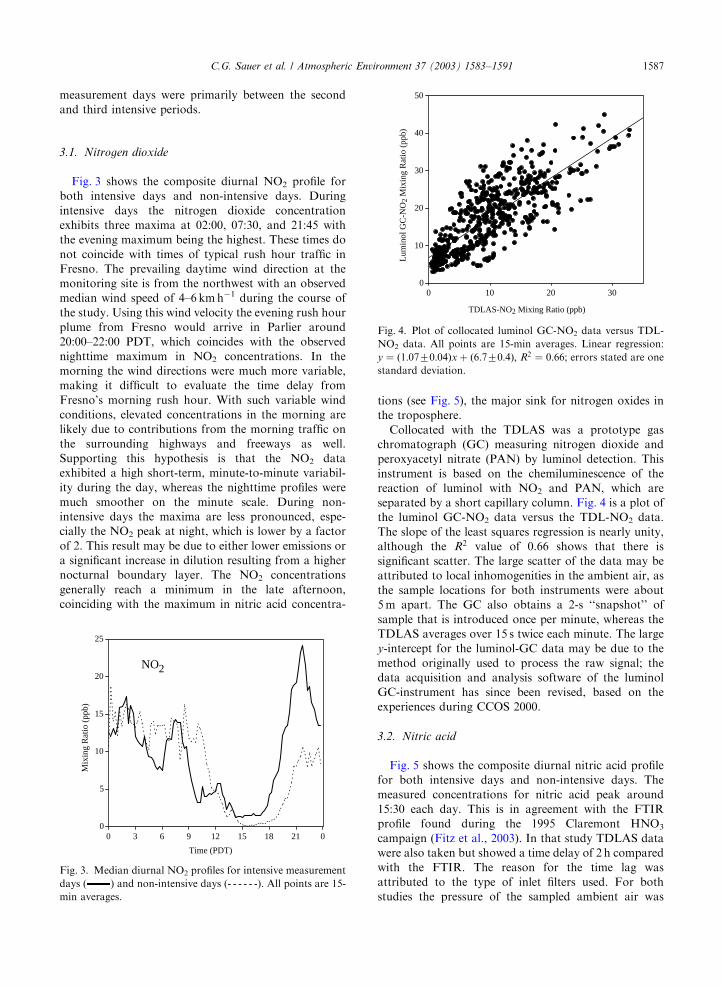
3.1. Nitrogen dioxide
Fig. 3 shows the composite diurnal NO2 profile for
both intensive days and non-intensive days. During
intensive days the nitrogen dioxide concentration
exhibits three maxima at 02:00, 07:30, and 21:45 with
the evening maximum being the highest. These times do
not coincide with times of typical rush hour traffic in
Fresno. The prevailing daytime wind direction at the
monitoring site is from the northwest with an observed
median wind speed of 4–6 km h�1 during the course of
the study. Using this wind velocity the evening rush hour
plume from Fresno would arrive in Parlier around
20:00–22:00 PDT, which coincides with the observed
nighttime maximum in NO2 concentrations. In the
morning the wind directions were much more variable,
making it difficult to evaluate the time delay from
Fresno’s morning rush hour. With such variable wind
conditions, elevated concentrations in the morning are
likely due to contributions from the morning traffic on
the surrounding highways and freeways as well.
Supporting this hypothesis is that the NO2 data
exhibited a high short-term, minute-to-minute variabil-
ity during the day, whereas the nighttime profiles were
much smoother on the minute scale. During non-
intensive days the maxima are less pronounced, espe-
cially the NO2 peak at night, which is lower by a factor
of 2. This result may be due to either lower emissions or
a significant increase in dilution resulting from a higher
nocturnal boundary layer. The NO2 concentrations
generally reach a minimum in the late afternoon,
coinciding with the maximum in nitric acid concentra-
tions (see Fig. 5), the major sink for nitrogen oxides in
the troposphere.
Collocated with the TDLAS was a prototype gas
chromatograph (GC) measuring nitrogen dioxide and
peroxyacetyl nitrate (PAN) by luminol detection. This
instrument is based on the chemiluminescence of the
reaction of luminol with NO2 and PAN, which are
separated by a short capillary column. Fig. 4 is a plot of
the luminol GC-NO2 data versus the TDL-NO2 data.
The slope of the least squares regression is nearly unity,
although the R2 value of 0.66 shows that there is
significant scatter. The large scatter of the data may be
attributed to local inhomogenities in the ambient air, as
the sample locations for both instruments were about
5 m apart. The GC also obtains a 2-s ‘‘snapshot’’ of
sample that is introduced once per minute, whereas the
TDLAS averages over 15 s twice each minute. The large
y-intercept for the luminol-GC data may be due to the
method originally used to process the raw signal; the
data acquisition and analysis software of the luminol
GC-instrument has since been revised, based on the
experiences during CCOS 2000.
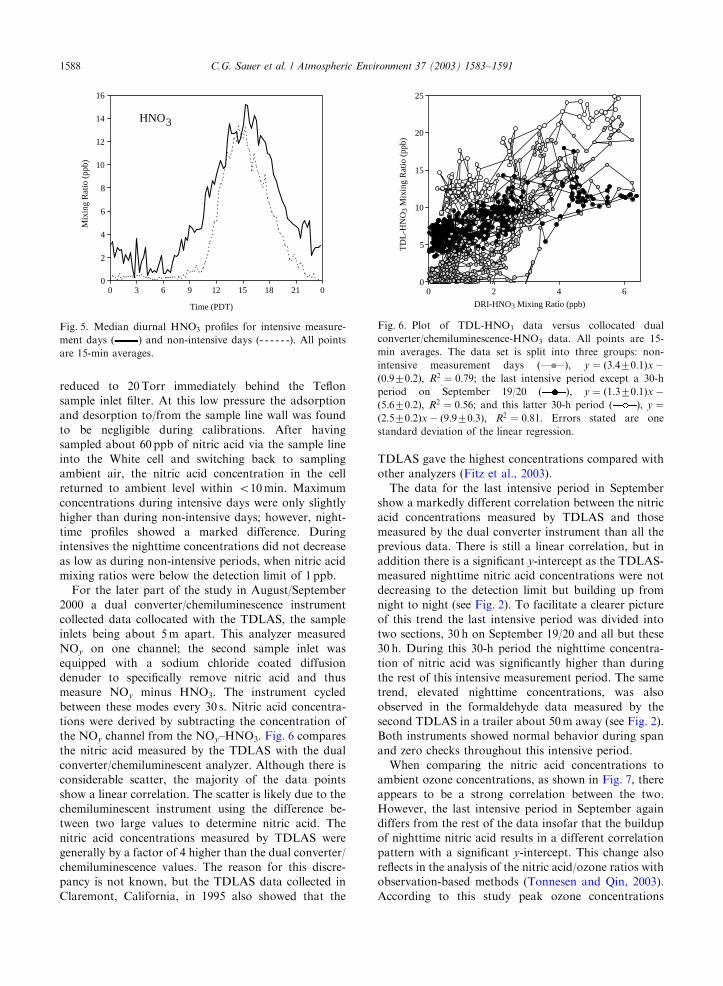
3.2. Nitric acid
Fig. 5 shows the composite diurnal nitric acid profile
for both intensive days and non-intensive days. The
measured concentrations for nitric acid peak around
15:30 each day. This is in agreement with the FTIR
profile found during the 1995 Claremont HNO3
campaign (Fitz et al., 2003). In that study TDLAS data
were also taken but showed a time delay of 2 h compared
with the FTIR. The reason for the time lag was
attributed to the type of inlet filters used. For both
studies the pressure of the sampled ambient air was
0
5
10
15
20
25
0 3 6 9 12 15 18 21 0
Time (PDT)
Mix
ing
Rat
io (
ppb)
NO2
Fig. 3. Median diurnal NO2 profiles for intensive measurement
days ( ) and non-intensive days (- - - - - -). All points are 15-
min averages.
0
10
20
30
40
50
0 10 20 30
TDLAS-NO2 Mixing Ratio (ppb)
Lum
inol
GC
-NO
2 M
ixin
g R
atio
(pp
b)
Fig. 4. Plot of collocated luminol GC-NO2 data versus TDL-
NO2 data. All points are 15-min averages. Linear regression:
y ¼ ð1:0770:04Þx þ ð6:770:4Þ; R2 ¼ 0:66; errors stated are one
standard deviation.
C.G. Sauer et al. / Atmospheric Environment 37 (2003) 1583–1591 1587
reduced to 20 Torr immediately behind the Teflon
sample inlet filter. At this low pressure the adsorption
and desorption to/from the sample line wall was found
to be negligible during calibrations. After having
sampled about 60 ppb of nitric acid via the sample line
into the White cell and switching back to sampling
ambient air, the nitric acid concentration in the cell
returned to ambient level within o10 min. Maximum
concentrations during intensive days were only slightly
higher than during non-intensive days; however, night-
time profiles showed a marked difference. During
intensives the nighttime concentrations did not decrease
as low as during non-intensive periods, when nitric acid
mixing ratios were below the detection limit of 1 ppb.
For the later part of the study in August/September
2000 a dual converter/chemiluminescence instrument
collected data collocated with the TDLAS, the sample
inlets being about 5m apart. This analyzer measured
NOy on one channel; the second sample inlet was
equipped with a sodium chloride coated diffusion
denuder to specifically remove nitric acid and thus
measure NOy minus HNO3. The instrument cycled
between these modes every 30 s. Nitric acid concentra-
tions were derived by subtracting the concentration of
the NOy channel from the NOy–HNO3. Fig. 6 compares
the nitric acid measured by the TDLAS with the dual
converter/chemiluminescent analyzer. Although there is
considerable scatter, the majority of the data points
show a linear correlation. The scatter is likely due to the
chemiluminescent instrument using the difference be-
tween two large values to determine nitric acid. The
nitric acid concentrations measured by TDLAS were
generally by a factor of 4 higher than the dual converter/
chemiluminescence values. The reason for this discre-
pancy is not known, but the TDLAS data collected in
Claremont, California, in 1995 also showed that the
TDLAS gave the highest concentrations compared with
other analyzers (Fitz et al., 2003).
The data for the last intensive period in September
show a markedly different correlation between the nitric
acid concentrations measured by TDLAS and those
measured by the dual converter instrument than all the
previous data. There is still a linear correlation, but in
addition there is a significant y-intercept as the TDLAS-
measured nighttime nitric acid concentrations were not
decreasing to the detection limit but building up from
night to night (see Fig. 2). To facilitate a clearer picture
of this trend the last intensive period was divided into
two sections, 30 h on September 19/20 and all but these
30 h. During this 30-h period the nighttime concentra-
tion of nitric acid was significantly higher than during
the rest of this intensive measurement period. The same
trend, elevated nighttime concentrations, was also
observed in the formaldehyde data measured by the
second TDLAS in a trailer about 50m away (see Fig. 2).
Both instruments showed normal behavior during span
and zero checks throughout this intensive period.
When comparing the nitric acid concentrations to
ambient ozone concentrations, as shown in Fig. 7, there
appears to be a strong correlation between the two.
However, the last intensive period in September again
differs from the rest of the data insofar that the buildup
of nighttime nitric acid results in a different correlation
pattern with a significant y-intercept. This change also
reflects in the analysis of the nitric acid/ozone ratios with
observation-based methods (Tonnesen and Qin, 2003).
According to this study peak ozone concentrations
0
2
4
6
8
10
12
14
16
0 3 6 9 12 15 18 21 0
Time (PDT)
Mix
ing
Rat
io (
ppb)
HNO3
Fig. 5. Median diurnal HNO3 profiles for intensive measure-
ment days ( ) and non-intensive days (- - - - - -). All points
are 15-min averages.
0
5
10
15
20
25
0 2 4 6
DRI-HNO3 Mixing Ratio (ppb)
TD
L-H
NO
3 M
ixin
g R
atio
(pp
b)
Fig. 6. Plot of TDL-HNO3 data versus collocated dual
converter/chemiluminescence-HNO3 data. All points are 15-
min averages. The data set is split into three groups: non-
intensive measurement days ( ), y ¼ ð3:470:1Þx �ð0:970:2Þ; R2 ¼ 0:79; the last intensive period except a 30-h
period on September 19/20 ( ), y ¼ ð1:370:1Þx �ð5:670:2Þ; R2 ¼ 0:56; and this latter 30-h period ( ), y ¼ð2:570:2Þx � ð9:970:3Þ; R2 ¼ 0:81: Errors stated are one
standard deviation of the linear regression.
C.G. Sauer et al. / Atmospheric Environment 37 (2003) 1583–15911588
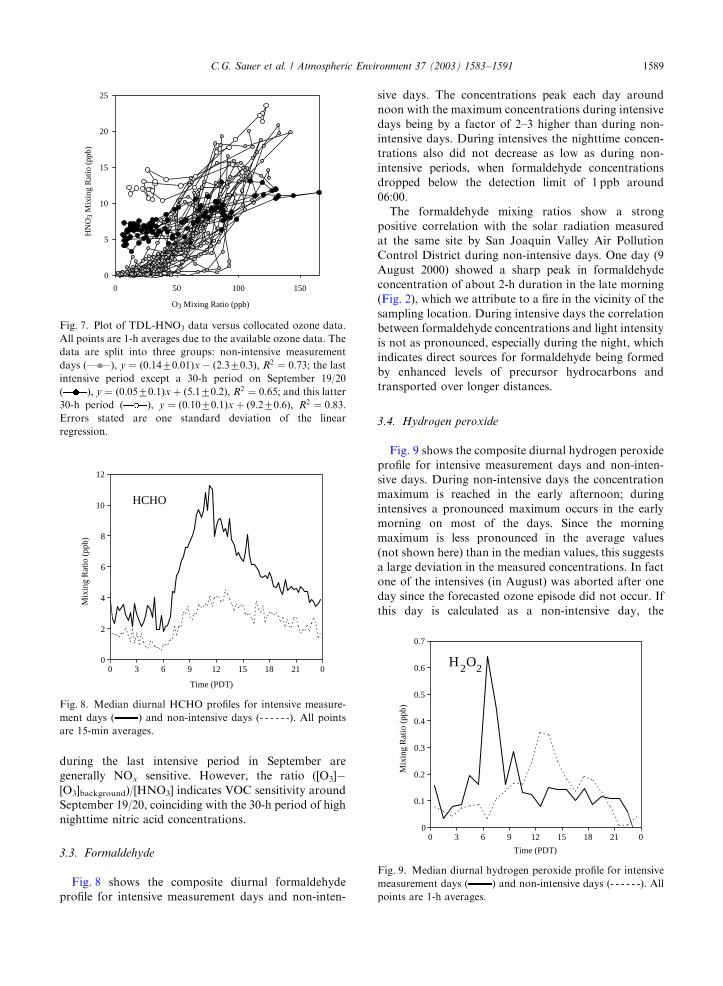
during the last intensive period in September are
generally NOx sensitive. However, the ratio ([O3]�[O3]background)/[HNO3] indicates VOC sensitivity around
September 19/20, coinciding with the 30-h period of high
nighttime nitric acid concentrations.
3.3. Formaldehyde
Fig. 8 shows the composite diurnal formaldehyde
profile for intensive measurement days and non-inten-
sive days. The concentrations peak each day around
noon with the maximum concentrations during intensive
days being by a factor of 2–3 higher than during non-
intensive days. During intensives the nighttime concen-
trations also did not decrease as low as during non-
intensive periods, when formaldehyde concentrations
dropped below the detection limit of 1 ppb around
06:00.
The formaldehyde mixing ratios show a strong
positive correlation with the solar radiation measured
at the same site by San Joaquin Valley Air Pollution
Control District during non-intensive days. One day (9
August 2000) showed a sharp peak in formaldehyde
concentration of about 2-h duration in the late morning
(Fig. 2), which we attribute to a fire in the vicinity of the
sampling location. During intensive days the correlation
between formaldehyde concentrations and light intensity
is not as pronounced, especially during the night, which
indicates direct sources for formaldehyde being formed
by enhanced levels of precursor hydrocarbons and
transported over longer distances.
3.4. Hydrogen peroxide
Fig. 9 shows the composite diurnal hydrogen peroxide
profile for intensive measurement days and non-inten-
sive days. During non-intensive days the concentration
maximum is reached in the early afternoon; during
intensives a pronounced maximum occurs in the early
morning on most of the days. Since the morning
maximum is less pronounced in the average values
(not shown here) than in the median values, this suggests
a large deviation in the measured concentrations. In fact
one of the intensives (in August) was aborted after one
day since the forecasted ozone episode did not occur. If
this day is calculated as a non-intensive day, the
0
5
10
15
20
25
0 50 100 150
O3 Mixing Ratio (ppb)
HN
O3
Mix
ing
Rat
io (
ppb)
Fig. 7. Plot of TDL-HNO3 data versus collocated ozone data.
All points are 1-h averages due to the available ozone data. The
data are split into three groups: non-intensive measurement
days ( ), y ¼ ð0:1470:01Þx � ð2:370:3Þ; R2 ¼ 0:73; the last
intensive period except a 30-h period on September 19/20
( ), y ¼ ð0:0570:1Þx þ ð5:170:2Þ; R2 ¼ 0:65; and this latter
30-h period ( ), y ¼ ð0:1070:1Þx þ ð9:270:6Þ; R2 ¼ 0:83:Errors stated are one standard deviation of the linear
regression.
0
2
4
6
8
10
12
0 3 6 9 12 15 18 21 0
Time (PDT)
Mix
ing
Rat
io (
ppb)
HCHO
Fig. 8. Median diurnal HCHO profiles for intensive measure-
ment days ( ) and non-intensive days (- - - - - -). All points
are 15-min averages.
0
0.1
0.2
0.3
0.4
0.5
0.6
0.7
0 3 6 9 12 15 18 21 0
Time (PDT)
Mix
ing
Rat
io (
ppb)
H2O2
Fig. 9. Median diurnal hydrogen peroxide profile for intensive
measurement days ( ) and non-intensive days (- - - - - -). All
points are 1-h averages.
C.G. Sauer et al. / Atmospheric Environment 37 (2003) 1583–1591 1589
difference between the average and median diurnal
hydrogen peroxide patterns becomes significantly smal-
ler. Detection limits were 0.1–0.25 ppb. This is close
to most of the actually measured concentrations. Thus,
it can be assumed that much of the scatter observed
in the data and responsible for the discrepancies
between average and median diurnal patterns is due
to instrument noise rather than changing ambient
concentrations.
The pattern on non-intensive days agrees with
findings on other sites (Watkins et al., 1995a; Watkins
et al., 1995b; Balasubramanian and Husain, 1997; Das
and Husain, 1999), while other groups have not yet
reported the pattern observed on intensive measurement
days. However, there have been some findings of
nighttime hydrogen peroxide maxima, which were
attributed to meteorological factors rather than gas
phase chemistry (Das and Husain, 1999; Clairborn and
Aneja, 1991). The early morning maximum also possibly
could indicate the buildup of hydrogen peroxide
precursors during the night that react upon sunrise to
give increased levels of H2O2. This is supported by the
nighttime buildup of formaldehyde and nitric acid
during the last intensive measurement period. Formal-
dehyde is known to photolyze in sunlight acting as a
radical source.
4. Conclusions
Two tunable diode laser systems were successfully
employed for the measurement of four trace gases as
part of the CCOS study. Results for non-intensive and
three of the four intensive measurement periods are in
accordance to what was previously recorded in the
literature for similar areas. The data from the last
intensive period in September 2000 are contrary to what
has been published concerning HNO3, H2O2 and HCHO
in similar studies. The buildup of nitric acid and
formaldehyde from night to night indicates that there
was a deviation from the normal source/sink equilibrium
during these nights. The early morning peak of
hydrogen peroxide concentrations suggests a photolytic
source of H2O2. Modeling studies are ongoing to explain
this unusual diurnal hydrogen peroxide profile.
Acknowledgements
This study was funded by the San Joaquin Valleywide
Air Pollution Study Agency through contract 00-
6CCOS. The authors would like to thank Chuck
Bufalino and Carl Camp for their help during the setup
and dismantling of the instruments. Jill Locke and Carl
Camp from the San Joaquin Valley Air Pollution
Control District in Fresno provided the ozone and
weather data; John Bowen from the Desert Research
Institute in Reno made the dual converter nitric acid
measurements available, and Kurt Bumiller and Mark
Chitjian from CE-CERT shared the luminol-GC data
for NO2. A special thank goes to Dave Karecki from
Unisearch-Associates, Toronto, Canada, for his help
and support with the TDL systems.
References
Anlauf, K.G., Fellin, P., Wiebe, H.A., Schiff, H.I., Mackay,
G.I., Braman, R.S., Gilbert, R., 1985. A comparison of
three methods for measurement of atmospheric nitric acid
and aerosol nitrate and ammonium. Atmospheric Environ-
ment 19, 325–333.
Balasubramanian, R., Husain, L., 1997. Observations of gas-
phase hydrogen peroxide at an elevated rural site in New
York. Journal of Geophysical Research-Atmospheres 102-
D17, 21209–21220.
Benning, L., Wahner, A., 1998. Measurement of atmospheric
formaldehyde (HCHO) and acetaldehyde (CH3CHO)
during POPCORN 1994 using 2,4-DNPH coated
silica cartridges. Journal of Atmospheric Chemistry 31,
105–117.
Clairborn, C.S., Aneja, V.P., 1991. Measurements of
atmospheric hydrogen peroxide in the gas phase and
in cloud water at Mt. Mitchell, North-Carolina.
Journal of Geophysical Research-Atmospheres 96-D10,
18771–18787.
Das, M., Husain, L., 1999. Photochemical and dynamical
processes affecting gaseous H2O2 concentrations in the
lower troposphere. Journal of Geophysical Research-Atmo-
spheres 104-D17, 21367–21383.
Finlayson-Pitts, B.J., Pitts Jr., J.N., 2000. Chemistry of the
Upper and Lower Atmosphere,. Academic Press, San
Diego, CA.
Fitz, D.R., Pisano, J.T., Tuazon, E.C., 2003. Comparison of
methods for measuring nitric acid in Southern California.
Atmospheric Environment, submitted for publication.
Fontijn, A., Sabadell, A.J., -Ronco, R.J., 1970. Homogeneous
chemiluminescent measurement of nitric oxide with ozone.
Analytical Chemistry 42, 575–579.
Fox, D.L., Stockburger, L., Weathers, W., Spicer, C.W.,
Mackay, G.I., Schiff, H.I., Eatough, D.J., Mortensen, F.,
Hansen, L.D., Shepson, P.B., Kleindienst, T.E., Edney,
E.O., 1988. Intercomparison of nitric acid diffusion denuder
methods with tunable diode laser absorption spectroscopy.
Atmospheric Environment 22, 575–585.
Fried, A., Henry, B., Wert, B., Sewell, S., Drummond, J.R.,
1998. Laboratory, ground-based and airborne tunable diode
laser systems: performance characteristics and applications
in atmospheric studies. Applied Physics B-Lasers and Optics
67, 317–330.
Gaffney, J.S., Bornick, R.M., Chen, Y.H., Marley, N.A., 1998.
Capillary gas chromatographic analysis of nitrogen dioxide
and PANs with luminol chemiluminescent detection. Atmo-
spheric Environment 32, 1445–1454.
Gaffney, J.S., Marley, N.A., Steele, H.D., Drayton, P.J.,
Hubbe, J.M., 1999. Aircraft measurements of nitrogen
C.G. Sauer et al. / Atmospheric Environment 37 (2003) 1583–15911590
dioxide and peroxyacyl nitrates using luminol chemilumi-
nescence with fast capillary gas chromatography. Environ-
mental Science and Technology 33, 3285–3289.
Haagen-Smit, A.J., Darley, E.F., Zaitlin, M., Hull, H., Noble,
W., 1952. Investigation on injury to plants from air
pollution in the Los Angeles area. Plant Physiology 27,
18–34.
Hering, S.V., Lawson, D.R., 38 other authors, 1988. The nitric
acid shootout: field comparison of measurement methods.
Atmospheric Environment 22, 1519–1539.
Horn, D., Pimental, G.C., 1971. 2.5 km low-temperature multi-
reflection cell. Applied Optics 10, 1892–1898.
Iguchi, T., 1986. Modulation waveforms for 2nd-harmonic
detection with tunable diode lasers. Journal of the Optical
Society of America B3, 419–423.
Kikuchi, K., 1989. Effect of 1f.-type FN noise on semiconduc-
tor laser linewidth residual in high power limit. Journal of
Quantum Electronics 25, 684–688.
Kleindienst, T.E., Shepson, P.B., Nero, C.M., Arnts, R.R.,
Tejada, S.B., Mackay, G.I., Mayne, L.K., Schiff, H.I., Lind,
J.A., Kok, G.L., Lazrus, A.L., Dasgupta, P.K., Dong, S.,
1988. An intercomparison of formaldehyde measurement
techniques at ambient concentrations. Atmospheric Envir-
onment 22, 1931–1939.
Kleindienst, T.E., Corse, E.W., Blanchard, F.T., Lonneman,
W.A., 1998. Evaluation of the performance of DNPH-
coated silica gel and C-18 cartridges in the measurement of
formaldehyde in the presence and absence of ozone.
Environmental Science and Technology 32, 124–130.
Komazaki, Y., Inoue, T., Tanaka, S., 2001. Automated
measurement system for H2O2 in the atmosphere by
diffusion scrubber sampling and HPLC analysis of Ti(IV)–
PAR–H2O2 complex. Analyst 126, 587–593.
Lawson, D.R., Biermann, H.W., Tuazon, E.C., Winer, A.M.,
Mackay, G.I., Schiff, H.I., Kok, G.L., Dasgupta, P.K.,
Fung, K., 1990. Formaldehyde measurement methods
evaluation and ambient concentrations during the carbo-
naceous species methods comparison study. Atmospheric
Environment 12, 64–76.
Li, J.Z., Dasgupta, P.K., 2000. Measurement of atmospheric
hydrogen peroxide and hydroxymethyl hydroperoxide with
a diffusion scrubber and light emitting diode-liquid core
waveguide-based fluorometry. Analytical Chemistry 72,
5338–5347.
Mackay, G.I., Mayne, L.K., Schiff, H.I., 1990. Measurements
of H2O2 and HCHO by tunable diode-laser absorption-
spectroscopy during the 1986 carbonaceos species methods
comparison study in Glendora, California. Aerosol Science
and Technology 12, 56–63.
Matsumoto, J., Hirokawa, J., Akimoto, H., Kajii, Y., 2001.
Direct measurement of NO2 in the marine atmosphere by
laser-induced fluorescence technique. Atmospheric Envir-
onment 35, 2803–2814.
Pilz, W., Johann, I., 1974. Die Bestimmung Kleinster Mengen
von Wasserstoffperoxyd in Luft. International Journal for
Environmental Analytical Chemistry 3, 257–270.
Pisano, J.T., Drummond, J.W., Hastie, D.R., 1996. A light-
weight NO2 instrument for vertical height profiles. Journal
of Atmospheric and Oceanic Technology 13, 400–405.
Reid, J., Labrie, D., 1981. 2nd-harmonic detection with tunable
diode lasers-comparison of experiment and theory. Applied
Physics B 26, 203–210.
Reid, J., Shewchen, J., Garside, B.K., Ballik, E.A., 1978. High
sensitivity detection employing tunable diode lasers. Ap-
plied Optics 17, 300–306.
Schiff, H.I., Mackay, G.I., Bechara, J., 1994. The use of tunable
diode laser absorption spectroscopy for atmospheric
measurements. Research on Chemical Intermediates 20,
525–556.
Sirju, A.-P., Shepson, P.B., 1995. Laboratory and field
investigation of the DNPH cartridge technique for the
measurement of atmospheric carbonyl compounds. Envir-
onmental Science and Technology 29, 384–392.
Spicer, C.W., Howes Jr., J.E., Bishop, T.A., Arnold, L.H.,
Stevens, R.K., 1982. Nitric acid measurement methods: an
intercomparison. Atmospheric Environment 16, 1487–1500.
Tanner, R.L., Kelley, T.J., Dezaro, D.A., Forrest, J., 1989. A
comparison of filter, denuder, and real-time chemilumines-
cent techniques for nitric acid determination in ambient air.
Atmospheric Environment 23, 2213–2222.
Thornton, J.A., Wooldridge, P.J., Cohen, R.C., 2000. Atmo-
spheric NO2: in situ laser-induced fluorescence detection at
parts per trillion mixing ratios. Analytical Chemistry 72,
528–539.
Tonnesen, G.S., Qin, Y., 2003. Evaluation of consistency
among photochemical indicators of ozone sensitivity in the
2000 central California ozone study, in preparation.
Watkins, B.A., Parrish, D.D., Trainer, M., Norton, R.B., Yee,
J.E., Fehsenfeld, F.C., Heikes, B.G., 1995a. Factors
influencing the concentration of gas phase hydrogen
peroxide during the summer at Niwot Ridge, Colorado.
Journal of Geophysical Research-Atmospheres 100-D11,
22831–22840.
Watkins, B.A., Parrish, D.D., Buhr, S., Norton, R.B., Trainer,
M., Yee, J.E., Fehsenfeld, F.C., 1995b. Factors influencing
the concentration of gas phase hydrogen peroxide during
the summer at Kinterbish, Alabama. Journal of Geophysi-
cal Research-Atmospheres 100-D11, 22841–22851.
C.G. Sauer et al. / Atmospheric Environment 37 (2003) 1583–1591 1591