Embed Size (px)
Citation preview
TUMOUR ROI ESTIMATION IN ULTRASOUND IMAGES VIA RADON BARCODESIN PATIENTS WITH LOCALLY ADVANCED BREAST CANCER
Hamid R. Tizhoosh1, Mehrdad J. Gangeh∗2, 3, Hadi Tadayyon2, 3, Gregory J. Czarnota2, 3
1 KIMIA Lab, University of Waterloo, Canada, [email protected] Depts. of Medical Biophysics and Radiation Oncology, University of Toronto, Canada
3 Dept. of Radiation Oncology and Imaging Research, Sunnybrook Health Sciences Center, Canada{∗mehrdad.gangeh,hadi.tadayyon,gregory.czarnota}@sunnybrook.ca
ABSTRACTQuantitative ultrasound (QUS) methods provide a promisingframework that can non-invasively and inexpensively be usedto predict or assess the tumour response to cancer treatment.The first step in using the QUS methods is to select a re-gion of interest (ROI) inside the tumour in ultrasound images.Manual segmentation, however, is very time consuming andtedious. In this paper, a semi-automated approach will beproposed to roughly localize an ROI for a tumour in ultra-sound images of patients with locally advanced breast cancer(LABC). Content-based barcodes, a recently introduced bi-nary descriptor based on Radon transform, were used in orderto find similar cases and estimate a bounding box surroundingthe tumour. Experiments with 33 B-scan images resulted inpromising results with an accuracy of 81%.
Index Terms— Breast cancer, Radon barcodes, responsemonitoring, segmentation, treatment prediction, ultrasound.
1. INTRODUCTION
Therapeutic cancer response monitoring has long been facili-tated using several functional imaging modalities [1] such aspositron emission tomography (PET) [2], magnetic resonanceimaging (MRI) [3], and diffuse optical imaging (DOI) [4]. Al-though these imaging technologies can potentially provide anearly assessment of cell death at microscopic level [1], theysuffer from two main drawbacks: being expensive, and re-quiring an exogenous agent, which is also costly and maycause some side effects and allergic reactions [5]. In compari-son, techniques based on quantitative ultrasound (QUS) [6, 7]facilitate a promising cost-effective, non-invasive, and rapidframework for the early assessment of cancer therapy effectsusing ultrasound. Moreover, QUS methods rely on endoge-nous contrast – generated by the very process of cell deathitself – to evaluate treatment effectiveness, which alleviatesthe requirement for injecting external contrast agents.
In addition to the recent advances in cancer response mon-itoring using QUS methods [8, 9, 10], the applications ofthese techniques have recently been extended to treatment
prediction [11] and tissue characterization using 3-D auto-mated breast ultrasound (ABUS) technology [12].
Irrespective of the applications for which the QUS meth-ods are to be used, no matter whether it is response monitor-ing, response prediction, or tissue characterization, the firststep is to identify the frames containing the tumour, and sub-sequently contouring a region of interest (ROI) inside the tu-mour for further analysis such as the computation of paramet-ric maps using spectroscopy methods [13], etc. This step hasto be done on ultrasound B-mode images and since currently,there is no automated software to contour inside the tumours,performing this initial step manually, is very tedious, timeconsuming, and accounts for a huge amount of efforts placedin each research project related to QUS methods. In order tohave an idea on the timing required for this step, we highlightthat for a typical preclinical study involving 100 mice, evenif we select ROIs from only 10 frames in “pre-treatment” andanother 10 from “post-treatment” scans, 100 × 20 = 2000ROIs should be contoured that may take days to weeks tocomplete depending to the speed and experience of the tech-nician. The problem is even more severe when dealing with3-D ultrasound scanners such as ABUS systems when tensof ROIs should be contoured for each patient particularly forthose with large tumour size, which is usually the case, for ex-ample, in aggressive types of cancer tumours such as locallyadvanced breast cancer (LABC) [14].
This research addresses the aforementioned problem, tosome extent, by proposing a novel semi-automated tumourlocalization approach for ROI estimation in patients withLABC. The ultrasound B-mode images were acquired fromLABC patients before treatment onset and the ultimate goalwas to use the automated selected ROIs for cancer responseprediction [11]. This paper, however, only focuses on themethods and results for a proposed barcode approach forrough tumour localization. Content-based barcodes representa novel class of binary descriptors to tag digital images [15].The ultimate goal is to find similar images when a query im-age is provided by the user. In this paper, instead of extractingthe contour of the tumour, we estimate the coordinates of a
bounding box which surrounds the tumour by finding similarimages, and by building a weighted average of their boundingboxes.
2. PATIENT DATA
Patient data collection, from ten LABC patients with tumoursizes between 5 and 15 cm, was performed in accordance withthe clinical research ethics approved by Sunnybrook HealthSciences Centre. Cancer diagnosis was confirmed via biopsyon all patients and magnetic resonance imaging (MRI) wasperformed in order to measure the size of tumour. Ultrasound(US) data was acquired from all patients before the start ofneoadjuvant chemotherapy (“pre-treatment”). The US dataacquisition was carried out using a Sonix RP ultrasound sys-tem, equipped with an L14-5/60 linear transducer with a cen-tre frequency of ∼7 MHz. The transducer’s focus was set atthe midline of the tumour with a maximum depth of 4-6 cm,depending on tumour size and location. Three to five scanplanes were obtained from the tumour, depending on its size,with a scan plane separation of ∼1 cm.
3. SEGMENTATION APPROACH
As evident from the relatively low contrast images shown inFig. 3, any segmentation technique will have difficulty to ex-tract the tumours as marked by the expert. This was veri-fied by experimenting using several methods such as thresh-olding, active contours, and watershed segmentation. As theultimate goal is to characterize the tumour for treatment pre-diction, we can aim to get an ROI segmented that roughlysketches the tumour region instead of attempting to extractthe precise tumour contour. Hence, we propose to use a novelapproach, namely barcode-guided ROI segmentation, whichaims at finding a bounding box around the tumour instead ofactual tumour contour.
The proposed approach indexed all available ground-truthimages first by assigning two barcodes to each bounding box(of each ground-truth): a “global” barcode for the entire im-age, and a “local” (ROI-based) barcode for the bounding box.Similar to atlas-based methods, segmentation (in this case,ROI estimation) was subsequently performed through findingsimilar cases in the database. As for a query (new) image, afixed-size ROI was first defined by asking the user to providea mouse click in the centre of the tumour. The query imagewas subsequently tagged with two barcodes (global and ROI-based). By comparing the bar codes computed for the queryimage with those in the training set using a similarity mea-sure, the top most similar tumours were identified and used toestimate the location of the tumour in the query image.
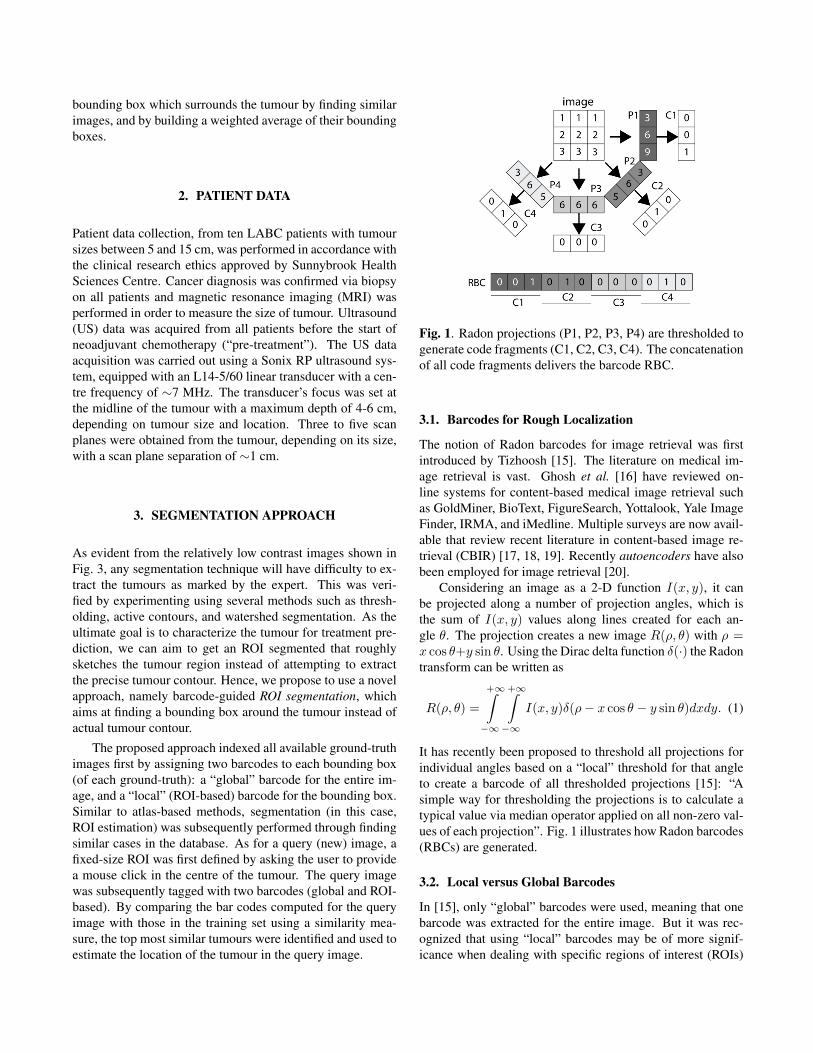
Fig. 1. Radon projections (P1, P2, P3, P4) are thresholded togenerate code fragments (C1, C2, C3, C4). The concatenationof all code fragments delivers the barcode RBC.
3.1. Barcodes for Rough Localization
The notion of Radon barcodes for image retrieval was firstintroduced by Tizhoosh [15]. The literature on medical im-age retrieval is vast. Ghosh et al. [16] have reviewed on-line systems for content-based medical image retrieval suchas GoldMiner, BioText, FigureSearch, Yottalook, Yale ImageFinder, IRMA, and iMedline. Multiple surveys are now avail-able that review recent literature in content-based image re-trieval (CBIR) [17, 18, 19]. Recently autoencoders have alsobeen employed for image retrieval [20].
Considering an image as a 2-D function I(x, y), it canbe projected along a number of projection angles, which isthe sum of I(x, y) values along lines created for each an-gle θ. The projection creates a new image R(ρ, θ) with ρ =x cos θ+y sin θ. Using the Dirac delta function δ(·) the Radontransform can be written as
R(ρ, θ) =
+∞∫−∞
+∞∫−∞
I(x, y)δ(ρ− x cos θ − y sin θ)dxdy. (1)
It has recently been proposed to threshold all projections forindividual angles based on a “local” threshold for that angleto create a barcode of all thresholded projections [15]: “Asimple way for thresholding the projections is to calculate atypical value via median operator applied on all non-zero val-ues of each projection”. Fig. 1 illustrates how Radon barcodes(RBCs) are generated.
3.2. Local versus Global Barcodes
In [15], only “global” barcodes were used, meaning that onebarcode was extracted for the entire image. But it was rec-ognized that using “local” barcodes may be of more signif-icance when dealing with specific regions of interest (ROIs)
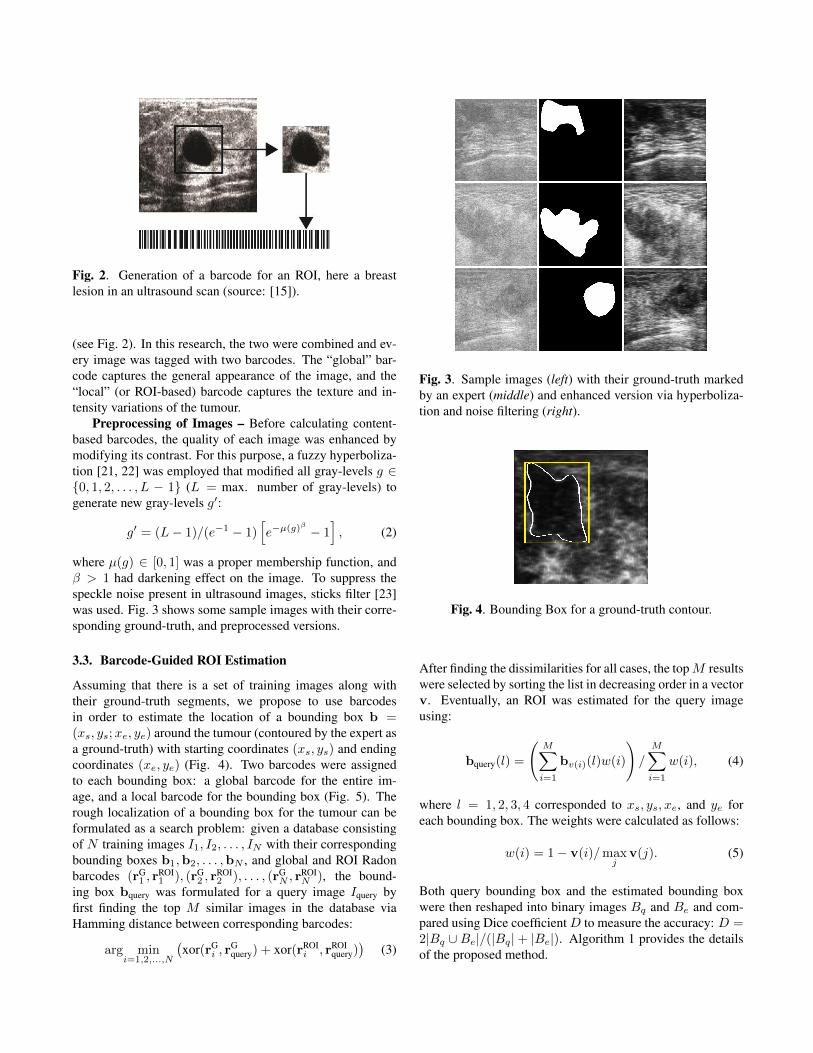
Fig. 2. Generation of a barcode for an ROI, here a breastlesion in an ultrasound scan (source: [15]).
(see Fig. 2). In this research, the two were combined and ev-ery image was tagged with two barcodes. The “global” bar-code captures the general appearance of the image, and the“local” (or ROI-based) barcode captures the texture and in-tensity variations of the tumour.
Preprocessing of Images – Before calculating content-based barcodes, the quality of each image was enhanced bymodifying its contrast. For this purpose, a fuzzy hyperboliza-tion [21, 22] was employed that modified all gray-levels g ∈{0, 1, 2, . . . , L − 1} (L = max. number of gray-levels) togenerate new gray-levels g′:
g′ = (L− 1)/(e−1 − 1)[e−µ(g)
β
− 1], (2)
where µ(g) ∈ [0, 1] was a proper membership function, andβ > 1 had darkening effect on the image. To suppress thespeckle noise present in ultrasound images, sticks filter [23]was used. Fig. 3 shows some sample images with their corre-sponding ground-truth, and preprocessed versions.
3.3. Barcode-Guided ROI Estimation
Assuming that there is a set of training images along withtheir ground-truth segments, we propose to use barcodesin order to estimate the location of a bounding box b =(xs, ys;xe, ye) around the tumour (contoured by the expert asa ground-truth) with starting coordinates (xs, ys) and endingcoordinates (xe, ye) (Fig. 4). Two barcodes were assignedto each bounding box: a global barcode for the entire im-age, and a local barcode for the bounding box (Fig. 5). Therough localization of a bounding box for the tumour can beformulated as a search problem: given a database consistingof N training images I1, I2, . . . , IN with their correspondingbounding boxes b1,b2, . . . ,bN , and global and ROI Radonbarcodes (rG
1 , rROI1 ), (rG
2 , rROI2 ), . . . , (rG
N , rROIN ), the bound-
ing box bquery was formulated for a query image Iquery byfirst finding the top M similar images in the database viaHamming distance between corresponding barcodes:
arg mini=1,2,...,N
(xor(rG
i , rGquery) + xor(rROI
i , rROIquery)
)(3)
Fig. 3. Sample images (left) with their ground-truth markedby an expert (middle) and enhanced version via hyperboliza-tion and noise filtering (right).
Fig. 4. Bounding Box for a ground-truth contour.
After finding the dissimilarities for all cases, the topM resultswere selected by sorting the list in decreasing order in a vectorv. Eventually, an ROI was estimated for the query imageusing:
bquery(l) =
(M∑i=1
bv(i)(l)w(i)
)/
M∑i=1
w(i), (4)
where l = 1, 2, 3, 4 corresponded to xs, ys, xe, and ye foreach bounding box. The weights were calculated as follows:
w(i) = 1− v(i)/maxj
v(j). (5)
Both query bounding box and the estimated bounding boxwere then reshaped into binary images Bq and Be and com-pared using Dice coefficientD to measure the accuracy: D =2|Bq ∪Be|/(|Bq|+ |Be|). Algorithm 1 provides the detailsof the proposed method.
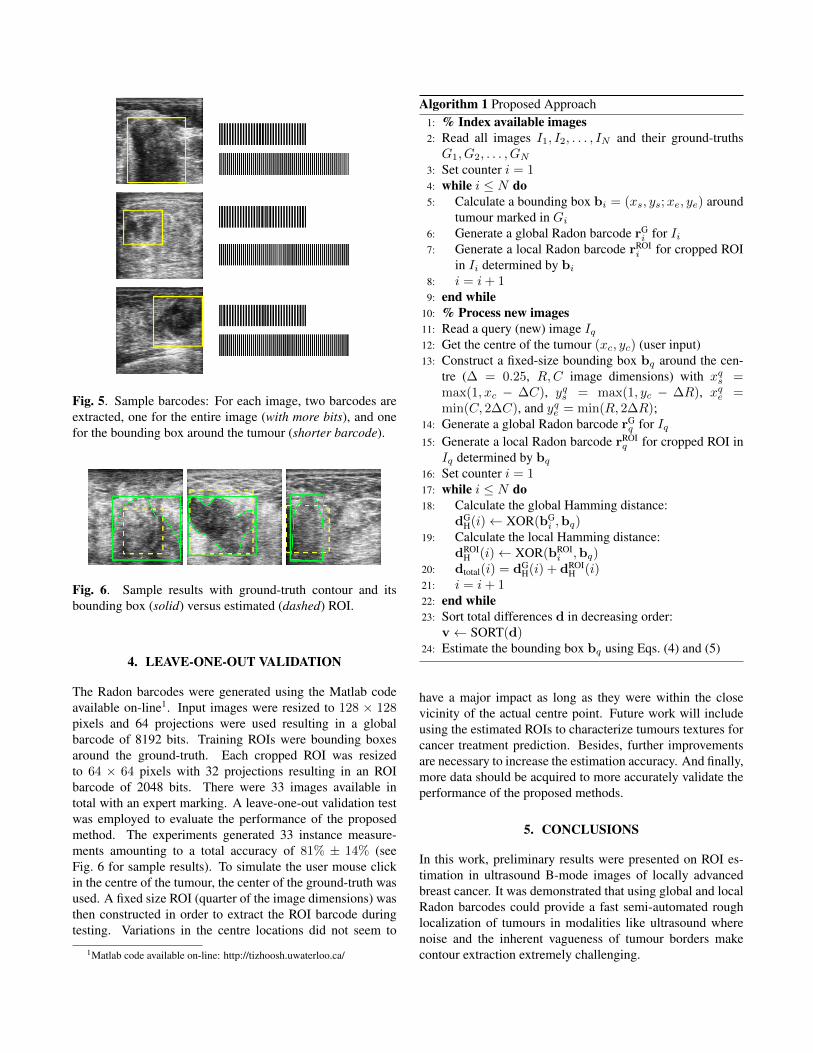
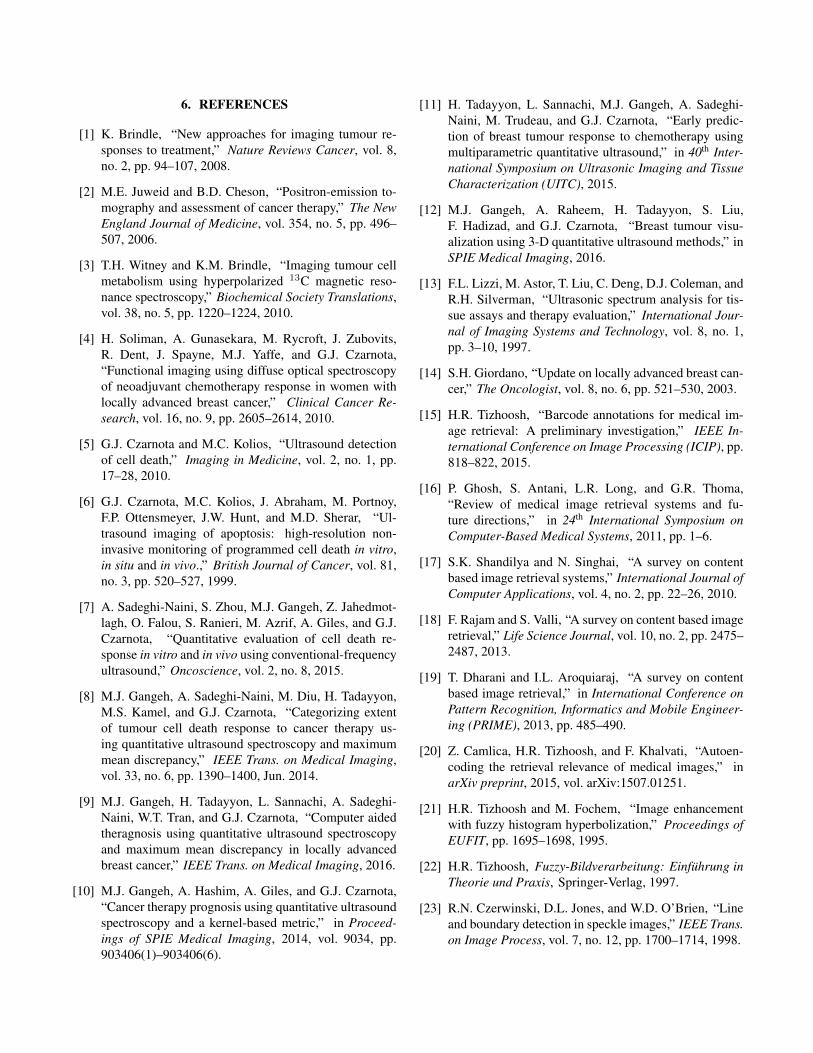
Fig. 5. Sample barcodes: For each image, two barcodes areextracted, one for the entire image (with more bits), and onefor the bounding box around the tumour (shorter barcode).
Fig. 6. Sample results with ground-truth contour and itsbounding box (solid) versus estimated (dashed) ROI.
4. LEAVE-ONE-OUT VALIDATION
The Radon barcodes were generated using the Matlab codeavailable on-line1. Input images were resized to 128 × 128pixels and 64 projections were used resulting in a globalbarcode of 8192 bits. Training ROIs were bounding boxesaround the ground-truth. Each cropped ROI was resizedto 64 × 64 pixels with 32 projections resulting in an ROIbarcode of 2048 bits. There were 33 images available intotal with an expert marking. A leave-one-out validation testwas employed to evaluate the performance of the proposedmethod. The experiments generated 33 instance measure-ments amounting to a total accuracy of 81% ± 14% (seeFig. 6 for sample results). To simulate the user mouse clickin the centre of the tumour, the center of the ground-truth wasused. A fixed size ROI (quarter of the image dimensions) wasthen constructed in order to extract the ROI barcode duringtesting. Variations in the centre locations did not seem to
1Matlab code available on-line: http://tizhoosh.uwaterloo.ca/
Algorithm 1 Proposed Approach1: % Index available images2: Read all images I1, I2, . . . , IN and their ground-truthsG1, G2, . . . , GN
3: Set counter i = 14: while i ≤ N do5: Calculate a bounding box bi = (xs, ys;xe, ye) around
tumour marked in Gi6: Generate a global Radon barcode rG
i for Ii7: Generate a local Radon barcode rROI
i for cropped ROIin Ii determined by bi
8: i = i+ 19: end while
10: % Process new images11: Read a query (new) image Iq12: Get the centre of the tumour (xc, yc) (user input)13: Construct a fixed-size bounding box bq around the cen-
tre (∆ = 0.25, R,C image dimensions) with xqs =max(1, xc − ∆C), yqs = max(1, yc − ∆R), xqe =min(C, 2∆C), and yqe = min(R, 2∆R);
14: Generate a global Radon barcode rGq for Iq
15: Generate a local Radon barcode rROIq for cropped ROI in
Iq determined by bq16: Set counter i = 117: while i ≤ N do18: Calculate the global Hamming distance:
dGH(i)← XOR(bG
i ,bq)19: Calculate the local Hamming distance:
dROIH (i)← XOR(bROI
i ,bq)20: dtotal(i) = dG
H(i) + dROIH (i)
21: i = i+ 122: end while23: Sort total differences d in decreasing order:
v← SORT(d)24: Estimate the bounding box bq using Eqs. (4) and (5)
have a major impact as long as they were within the closevicinity of the actual centre point. Future work will includeusing the estimated ROIs to characterize tumours textures forcancer treatment prediction. Besides, further improvementsare necessary to increase the estimation accuracy. And finally,more data should be acquired to more accurately validate theperformance of the proposed methods.
5. CONCLUSIONS
In this work, preliminary results were presented on ROI es-timation in ultrasound B-mode images of locally advancedbreast cancer. It was demonstrated that using global and localRadon barcodes could provide a fast semi-automated roughlocalization of tumours in modalities like ultrasound wherenoise and the inherent vagueness of tumour borders makecontour extraction extremely challenging.
6. REFERENCES
[1] K. Brindle, “New approaches for imaging tumour re-sponses to treatment,” Nature Reviews Cancer, vol. 8,no. 2, pp. 94–107, 2008.
[2] M.E. Juweid and B.D. Cheson, “Positron-emission to-mography and assessment of cancer therapy,” The NewEngland Journal of Medicine, vol. 354, no. 5, pp. 496–507, 2006.
[3] T.H. Witney and K.M. Brindle, “Imaging tumour cellmetabolism using hyperpolarized 13C magnetic reso-nance spectroscopy,” Biochemical Society Translations,vol. 38, no. 5, pp. 1220–1224, 2010.
[4] H. Soliman, A. Gunasekara, M. Rycroft, J. Zubovits,R. Dent, J. Spayne, M.J. Yaffe, and G.J. Czarnota,“Functional imaging using diffuse optical spectroscopyof neoadjuvant chemotherapy response in women withlocally advanced breast cancer,” Clinical Cancer Re-search, vol. 16, no. 9, pp. 2605–2614, 2010.
[5] G.J. Czarnota and M.C. Kolios, “Ultrasound detectionof cell death,” Imaging in Medicine, vol. 2, no. 1, pp.17–28, 2010.
[6] G.J. Czarnota, M.C. Kolios, J. Abraham, M. Portnoy,F.P. Ottensmeyer, J.W. Hunt, and M.D. Sherar, “Ul-trasound imaging of apoptosis: high-resolution non-invasive monitoring of programmed cell death in vitro,in situ and in vivo.,” British Journal of Cancer, vol. 81,no. 3, pp. 520–527, 1999.
[7] A. Sadeghi-Naini, S. Zhou, M.J. Gangeh, Z. Jahedmot-lagh, O. Falou, S. Ranieri, M. Azrif, A. Giles, and G.J.Czarnota, “Quantitative evaluation of cell death re-sponse in vitro and in vivo using conventional-frequencyultrasound,” Oncoscience, vol. 2, no. 8, 2015.
[8] M.J. Gangeh, A. Sadeghi-Naini, M. Diu, H. Tadayyon,M.S. Kamel, and G.J. Czarnota, “Categorizing extentof tumour cell death response to cancer therapy us-ing quantitative ultrasound spectroscopy and maximummean discrepancy,” IEEE Trans. on Medical Imaging,vol. 33, no. 6, pp. 1390–1400, Jun. 2014.
[9] M.J. Gangeh, H. Tadayyon, L. Sannachi, A. Sadeghi-Naini, W.T. Tran, and G.J. Czarnota, “Computer aidedtheragnosis using quantitative ultrasound spectroscopyand maximum mean discrepancy in locally advancedbreast cancer,” IEEE Trans. on Medical Imaging, 2016.
[10] M.J. Gangeh, A. Hashim, A. Giles, and G.J. Czarnota,“Cancer therapy prognosis using quantitative ultrasoundspectroscopy and a kernel-based metric,” in Proceed-ings of SPIE Medical Imaging, 2014, vol. 9034, pp.903406(1)–903406(6).
[11] H. Tadayyon, L. Sannachi, M.J. Gangeh, A. Sadeghi-Naini, M. Trudeau, and G.J. Czarnota, “Early predic-tion of breast tumour response to chemotherapy usingmultiparametric quantitative ultrasound,” in 40th Inter-national Symposium on Ultrasonic Imaging and TissueCharacterization (UITC), 2015.
[12] M.J. Gangeh, A. Raheem, H. Tadayyon, S. Liu,F. Hadizad, and G.J. Czarnota, “Breast tumour visu-alization using 3-D quantitative ultrasound methods,” inSPIE Medical Imaging, 2016.
[13] F.L. Lizzi, M. Astor, T. Liu, C. Deng, D.J. Coleman, andR.H. Silverman, “Ultrasonic spectrum analysis for tis-sue assays and therapy evaluation,” International Jour-nal of Imaging Systems and Technology, vol. 8, no. 1,pp. 3–10, 1997.
[14] S.H. Giordano, “Update on locally advanced breast can-cer,” The Oncologist, vol. 8, no. 6, pp. 521–530, 2003.
[15] H.R. Tizhoosh, “Barcode annotations for medical im-age retrieval: A preliminary investigation,” IEEE In-ternational Conference on Image Processing (ICIP), pp.818–822, 2015.
[16] P. Ghosh, S. Antani, L.R. Long, and G.R. Thoma,“Review of medical image retrieval systems and fu-ture directions,” in 24th International Symposium onComputer-Based Medical Systems, 2011, pp. 1–6.
[17] S.K. Shandilya and N. Singhai, “A survey on contentbased image retrieval systems,” International Journal ofComputer Applications, vol. 4, no. 2, pp. 22–26, 2010.
[18] F. Rajam and S. Valli, “A survey on content based imageretrieval,” Life Science Journal, vol. 10, no. 2, pp. 2475–2487, 2013.
[19] T. Dharani and I.L. Aroquiaraj, “A survey on contentbased image retrieval,” in International Conference onPattern Recognition, Informatics and Mobile Engineer-ing (PRIME), 2013, pp. 485–490.
[20] Z. Camlica, H.R. Tizhoosh, and F. Khalvati, “Autoen-coding the retrieval relevance of medical images,” inarXiv preprint, 2015, vol. arXiv:1507.01251.
[21] H.R. Tizhoosh and M. Fochem, “Image enhancementwith fuzzy histogram hyperbolization,” Proceedings ofEUFIT, pp. 1695–1698, 1995.
[22] H.R. Tizhoosh, Fuzzy-Bildverarbeitung: Einfuhrung inTheorie und Praxis, Springer-Verlag, 1997.
[23] R.N. Czerwinski, D.L. Jones, and W.D. O’Brien, “Lineand boundary detection in speckle images,” IEEE Trans.on Image Process, vol. 7, no. 12, pp. 1700–1714, 1998.