Embed Size (px)
Citation preview

Tulip Telecom LtdEarlier Tulip IT Services Ltd
DATA CONNECTIVITY – VEHICLE FOR GROWTH
DATA CONNECTIVITY – VEHICLE FOR GROWTH

Enterprise Data Connectivity || Network Integration || Data Centre || Managed Services360° Engagement
2
Safe Harbour
Certain statements in this presentation may be forward-looking statements. Such forward-looking statements are subject to certain risks and uncertainties like government actions, economic developments, technological risks, and many other factors that could cause the actual results to differ materially from those contemplated by the relevant forward-looking statements. Tulip Telecom Limited will not be in any way responsible for any action taken based on such statements and undertakes no obligation to publicly update these forward-looking statements to reflect subsequent events or circumstances.
Certain statements in this presentation may be forward-looking statements. Such forward-looking statements are subject to certain risks and uncertainties like government actions, economic developments, technological risks, and many other factors that could cause the actual results to differ materially from those contemplated by the relevant forward-looking statements. Tulip Telecom Limited will not be in any way responsible for any action taken based on such statements and undertakes no obligation to publicly update these forward-looking statements to reflect subsequent events or circumstances.
Enterprise Data Connectivity || Network Integration || Data Centre || Managed Services360° Engagement
3
Industry Accolades
Enterprise Data Connectivity || Network Integration || Data Centre || Managed Services360° Engagement
4
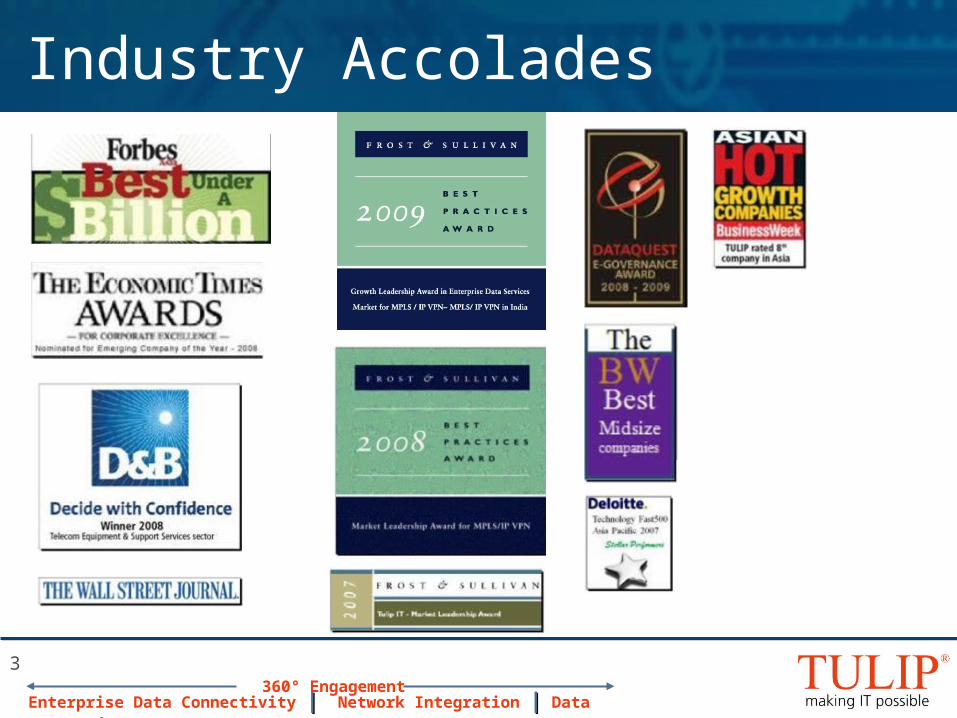
Operational Snapshot
Network reachNetwork reach Over 1,500 cities across almost every district in India
Over 1,500 cities across almost every district in India
Total customersTotal customers In excess of 1,600In excess of 1,600
Network OpsNetwork Ops 2 NOC’s supporting over 300 agents
2 NOC’s supporting over 300 agents
Sales & supportSales & support 12 sales offices160 support offices
12 sales offices160 support offices
Customers from all vertical segments including banking, telco, retail, manufacturing, services, education, healthcare, Utilities and government
India’s largest & fastest growing MPLS network
2,500+ employees across India with over 70% technical staff
MPLS NOCs in Delhi & Mumbai. Global managed service delivery centre in Delhi
Data CentresData Centres 44Tier 3/4 data centres in Delhi, Mumbai, Navi Mumbai & Bangalore. More tier 3/4 data centres under implementation
Enterprise Data Connectivity || Network Integration || Data Centre || Managed Services360° Engagement
5
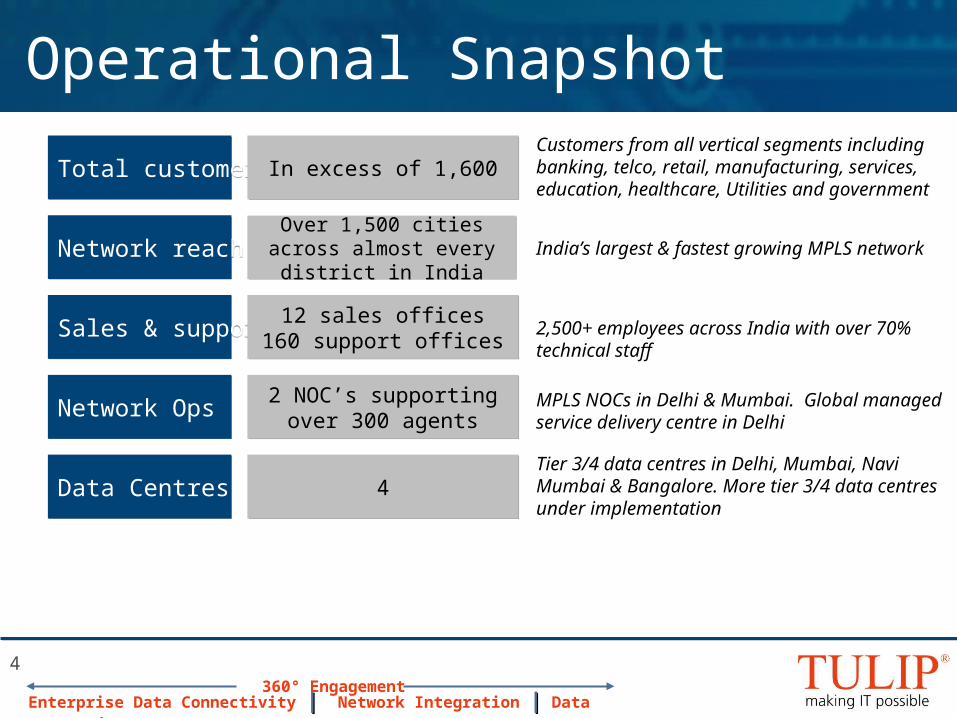
Financial Snapshot
Market CapMarket Cap In excess of Rs. 25,000 millionIn excess of Rs. 25,000 million
Company profileCompany profile Telecom service providerand managed network services provider
Telecom service providerand managed network services provider
Net profitNet profit Rs. 2,505 million, up 34% over previous yearRs. 2,505 million, up 34% over previous year
RevenueRevenue Rs. 16,144 million, up ~33% over previous yearRs. 16,144 million, up ~33% over previous year
Listed on BSE & NSE. Included in BSE-500 and BSE-MIDCAP indices.
*financials are as of financial year ended March 2009.
Enterprise Data Connectivity || Network Integration || Data Centre || Managed Services360° Engagement
6
Our Understanding
• Last mile availability.
• Voice vs. Data.
• Single point for everything related to data.
• Niche players have an advantage of better service.
• Own fibre is not always an advantage.
• Last mile availability.
• Voice vs. Data.
• Single point for everything related to data.
• Niche players have an advantage of better service.
• Own fibre is not always an advantage.
Enterprise Data Connectivity || Network Integration || Data Centre || Managed Services360° Engagement
7
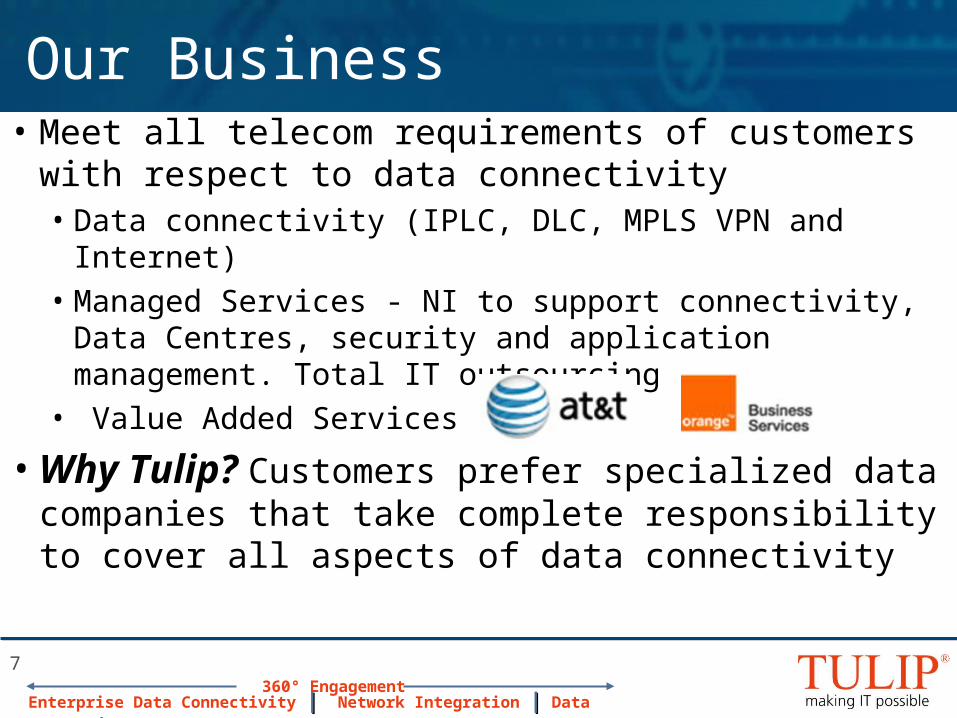
Our Business• Meet all telecom requirements of customers with
respect to data connectivity• Data connectivity (IPLC, DLC, MPLS VPN and Internet)• Managed Services - NI to support connectivity, Data
Centres, security and application management. Total IT outsourcing
• Value Added Services
• Why Tulip? Customers prefer specialized data companies that take complete responsibility to cover all aspects of data connectivity
• Meet all telecom requirements of customers with respect to data connectivity• Data connectivity (IPLC, DLC, MPLS VPN and Internet)• Managed Services - NI to support connectivity, Data
Centres, security and application management. Total IT outsourcing
• Value Added Services
• Why Tulip? Customers prefer specialized data companies that take complete responsibility to cover all aspects of data connectivity
Enterprise Data Connectivity || Network Integration || Data Centre || Managed Services360° Engagement
8
Customer Requirement
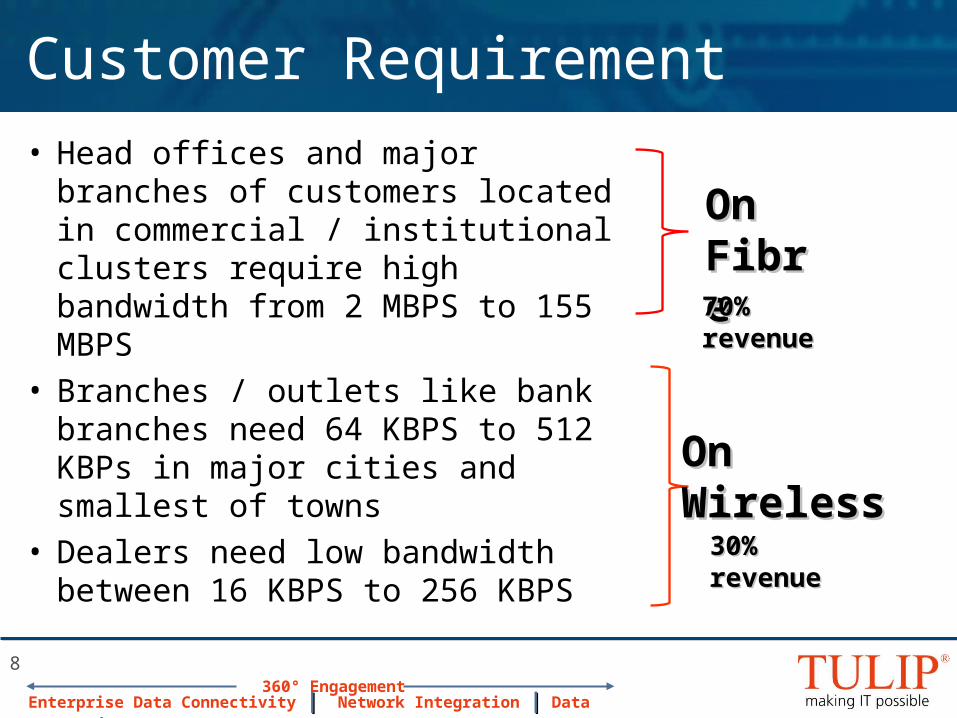
• Head offices and major branches of customers located in commercial / institutional clusters require high bandwidth from 2 MBPS to 155 MBPS
• Branches / outlets like bank branches need 64 KBPS to 512 KBPs in major cities and smallest of towns
• Dealers need low bandwidth between 16 KBPS to 256 KBPS
On On FibreFibre
OnOnWirelessWireless
70% 70% revenuerevenue
30% 30% revenuerevenue
Enterprise Data Connectivity || Network Integration || Data Centre || Managed Services360° Engagement
9
Tulip’s Network
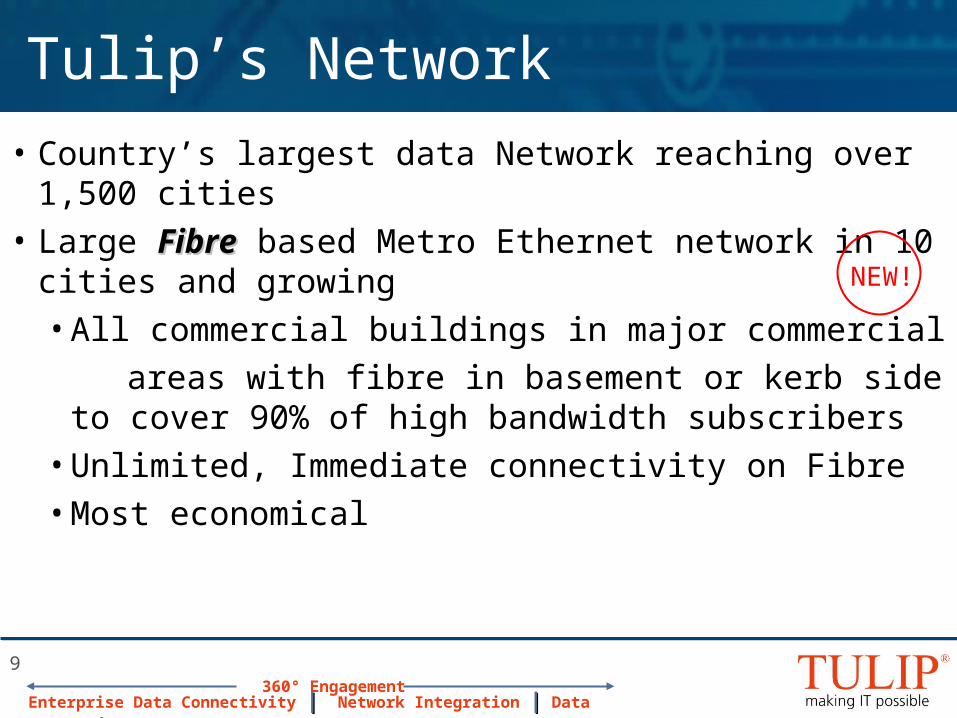
• Country’s largest data Network reaching over 1,500 cities
• Large FibreFibre based Metro Ethernet network in 10 cities and growing
• All commercial buildings in major commercial
areas with fibre in basement or kerb side to cover 90% of high bandwidth subscribers
• Unlimited, Immediate connectivity on Fibre
• Most economical
NEW!
Enterprise Data Connectivity || Network Integration || Data Centre || Managed Services360° Engagement
10
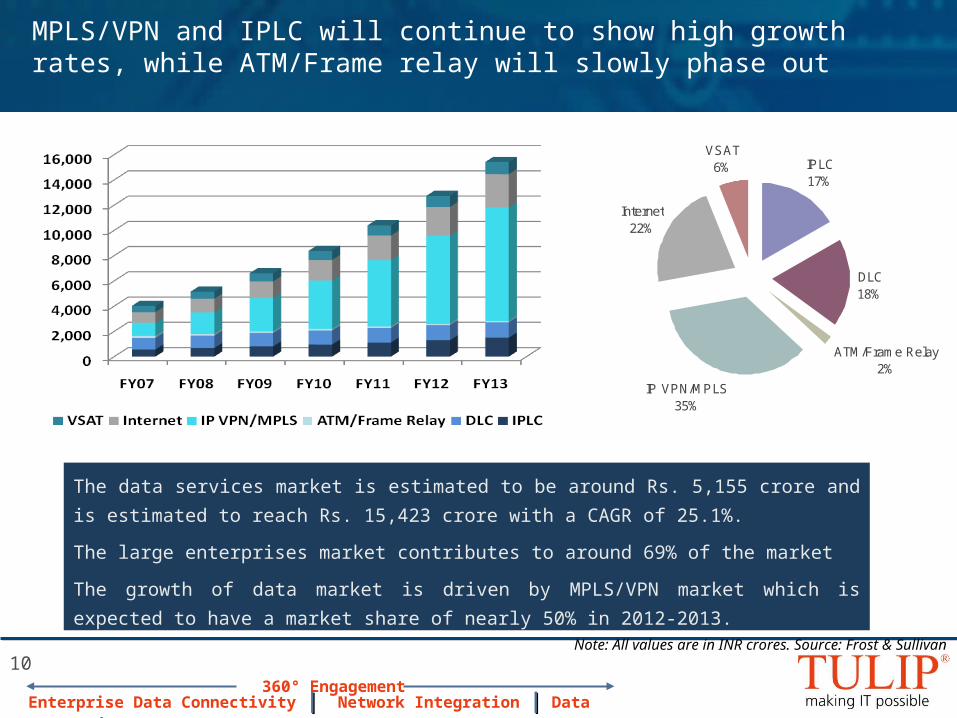
MPLS/VPN and IPLC will continue to show high growth rates, while ATM/Frame relay will slowly phase out
Note: All values are in INR crores. Source: Frost & Sullivan
The data services market is estimated to be around Rs. 5,155 crore and is estimated to reach
Rs. 15,423 crore with a CAGR of 25.1%.
The large enterprises market contributes to around 69% of the market
The growth of data market is driven by MPLS/VPN market which is expected to have a market
share of nearly 50% in 2012-2013.
IPLC17%
DLC18%
ATM/Frame Relay2%
IP VPN/MPLS35%
Internet22%
VSAT6%
Enterprise Data Connectivity || Network Integration || Data Centre || Managed Services360° Engagement
2303 Cr
3839 Cr
1106 Cr
11
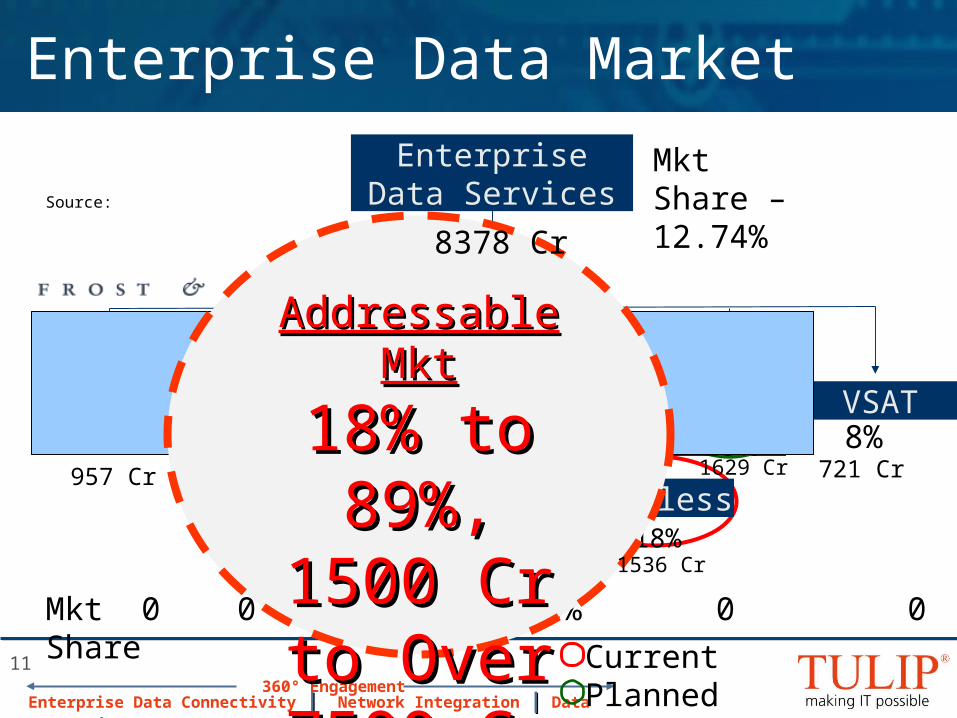
Enterprise Data Market
Enterprise Data Services
IPLC DLC MPLS/IP VPN
Internet
Mkt Share – 12.74%
Mkt 0 0 0 38% 0 0Share Current
Planned
Source:
Fibre Wireless
VSAT11% 8%19%
18%28%
13%46%
Addressable MktAddressable Mkt
18% to 18% to 89%, 1500 89%, 1500 Cr to Over Cr to Over 7500 Cr7500 Cr
957 Cr 1629 Cr
1536 Cr
8378 Cr
721 Cr
Enterprise Data Connectivity || Network Integration || Data Centre || Managed Services360° Engagement
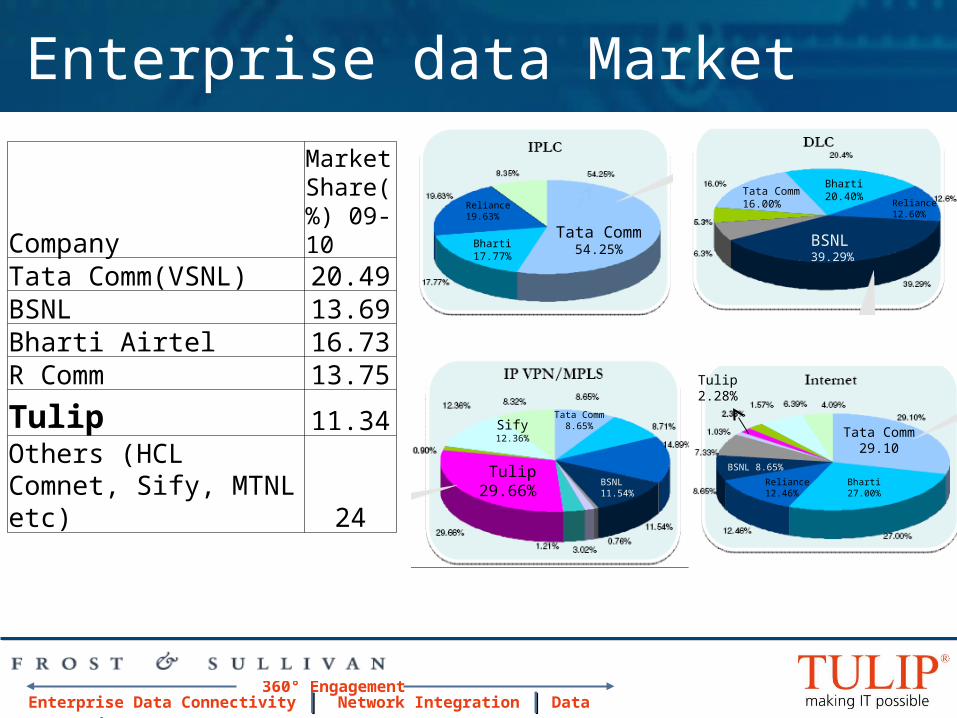
Enterprise data Market
12
Company
Market Share(%) 09-10
Tata Comm(VSNL) 20.49BSNL 13.69Bharti Airtel 16.73R Comm 13.75
Tulip 11.34Others (HCL Comnet, Sify, MTNL etc) 24
BSNL39.29%
Tata Comm29.10
Tata Comm54.25%Bharti
17.77%
Reliance19.63%
Bharti20.40%Tata Comm
16.00% Reliance12.60%
Reliance12.46%
Bharti27.00%
BSNL 8.65%
Tulip 2.28%
Reliance14.89%
Tulip29.66%
Sify12.36%
Tata Comm8.65%
BSNL 11.54%
Enterprise Data Connectivity || Network Integration || Data Centre || Managed Services360° Engagement
13
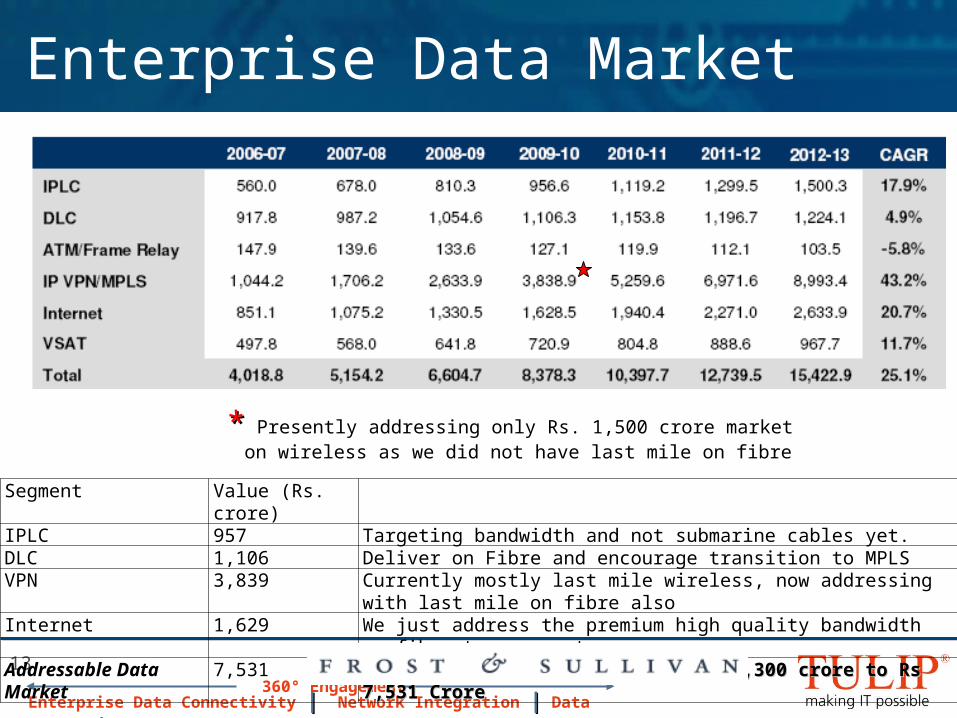
Enterprise Data Market
Segment Value (Rs. crore)IPLC 957 Targeting bandwidth and not submarine cables yet.DLC 1,106 Deliver on Fibre and encourage transition to MPLSVPN 3,839 Currently mostly last mile wireless, now addressing with last mile on fibre
alsoInternet 1,629 We just address the premium high quality bandwidth on fibre to corporates.Addressable Data Market 7,531 Addressable market jumps from Rs 1,300 crore to Rs 7,531 Crore Addressable market jumps from Rs 1,300 crore to Rs 7,531 Crore
** Presently addressing only Rs. 1,500 crore market on wireless as we did not have last mile on fibre
Enterprise Data Connectivity || Network Integration || Data Centre || Managed Services360° Engagement
14
14
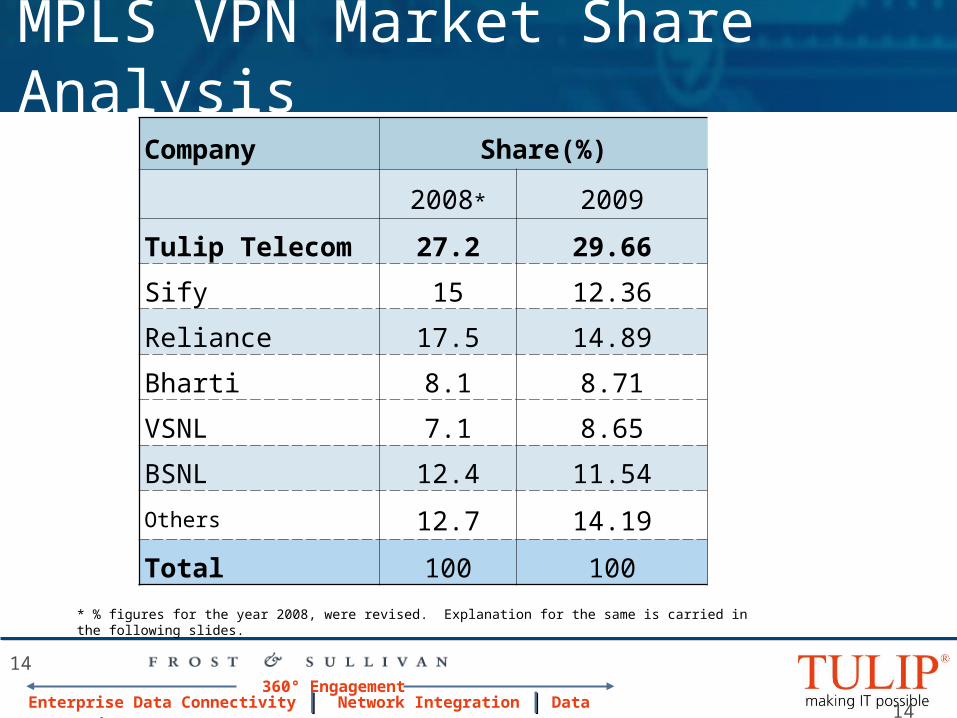
MPLS VPN Market Share Analysis
Company Share(%)
2008* 2009
Tulip Telecom 27.2 29.66
Sify 15 12.36
Reliance 17.5 14.89
Bharti 8.1 8.71
VSNL 7.1 8.65
BSNL 12.4 11.54
Others 12.7 14.19
Total 100 100
* % figures for the year 2008, were revised. Explanation for the same is carried in the following slides.
Enterprise Data Connectivity || Network Integration || Data Centre || Managed Services360° Engagement
15
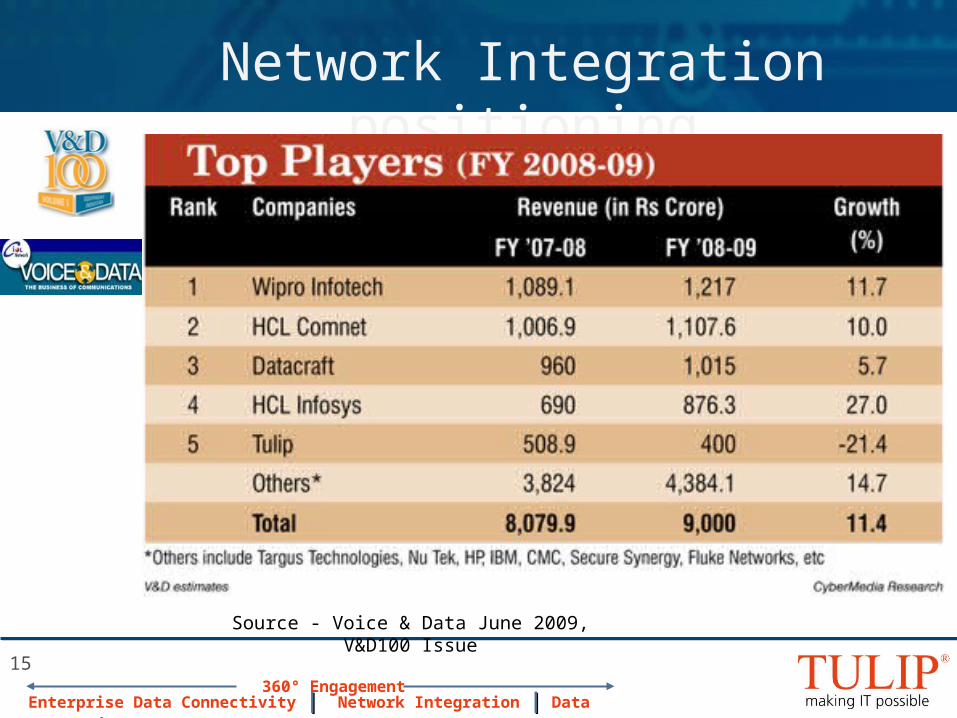
Source - Voice & Data June 2009, V&D100 Issue
Network Integration positioning
Enterprise Data Connectivity || Network Integration || Data Centre || Managed Services360° Engagement
16
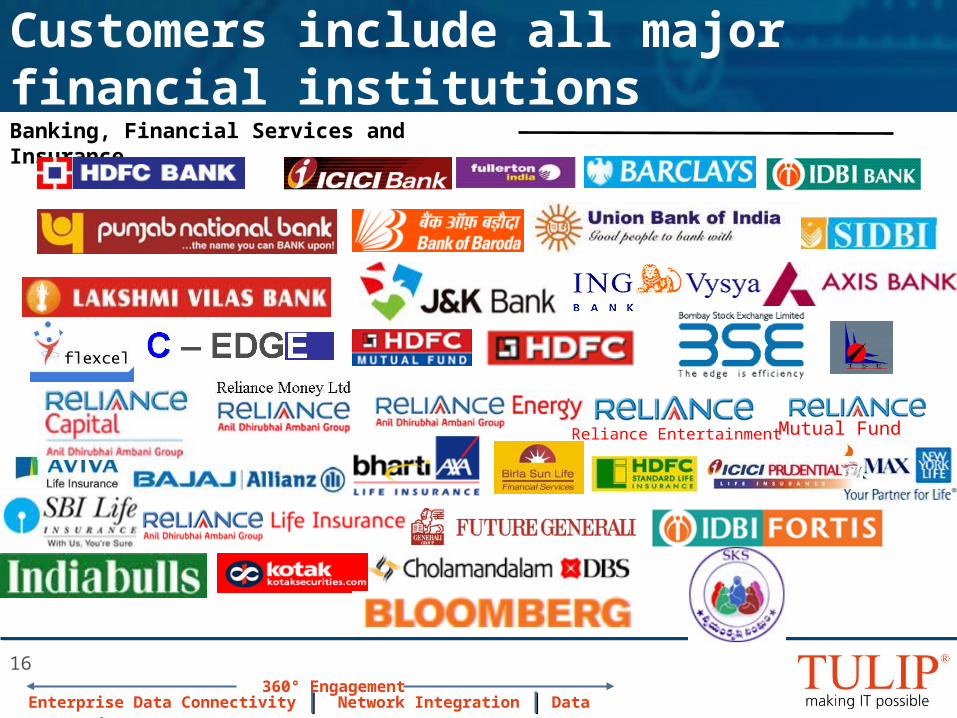
Customers include all major financial institutionsBanking, Financial Services and Insurance
Reliance Entertainment Mutual Fund
Enterprise Data Connectivity || Network Integration || Data Centre || Managed Services360° Engagement
17
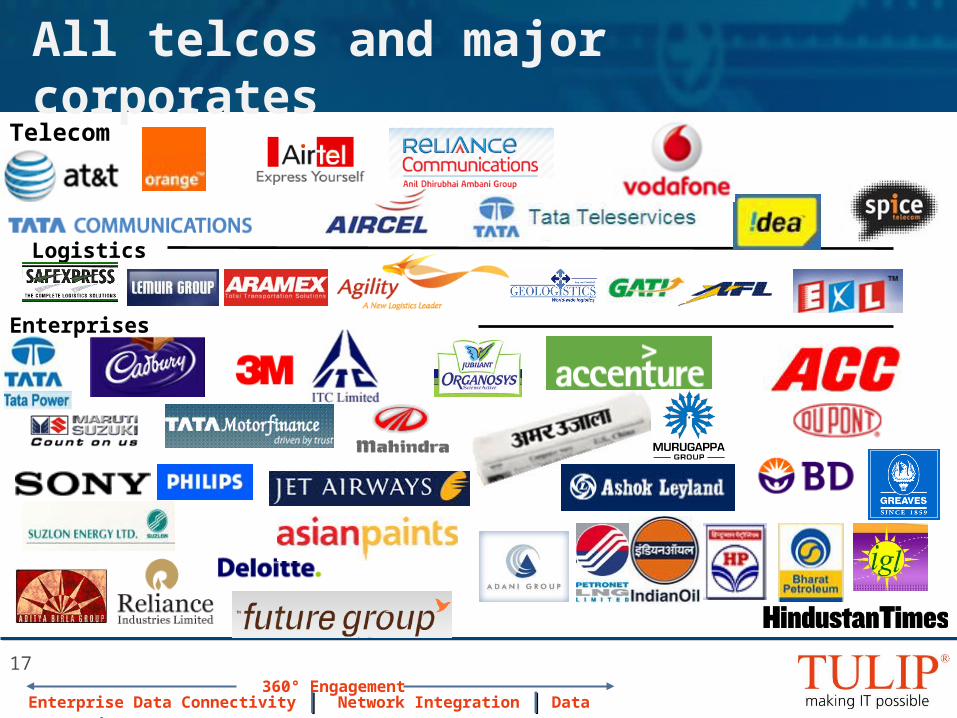
Logistics
Enterprises
All telcos and major corporatesTelecom
Enterprise Data Connectivity || Network Integration || Data Centre || Managed Services360° Engagement
18
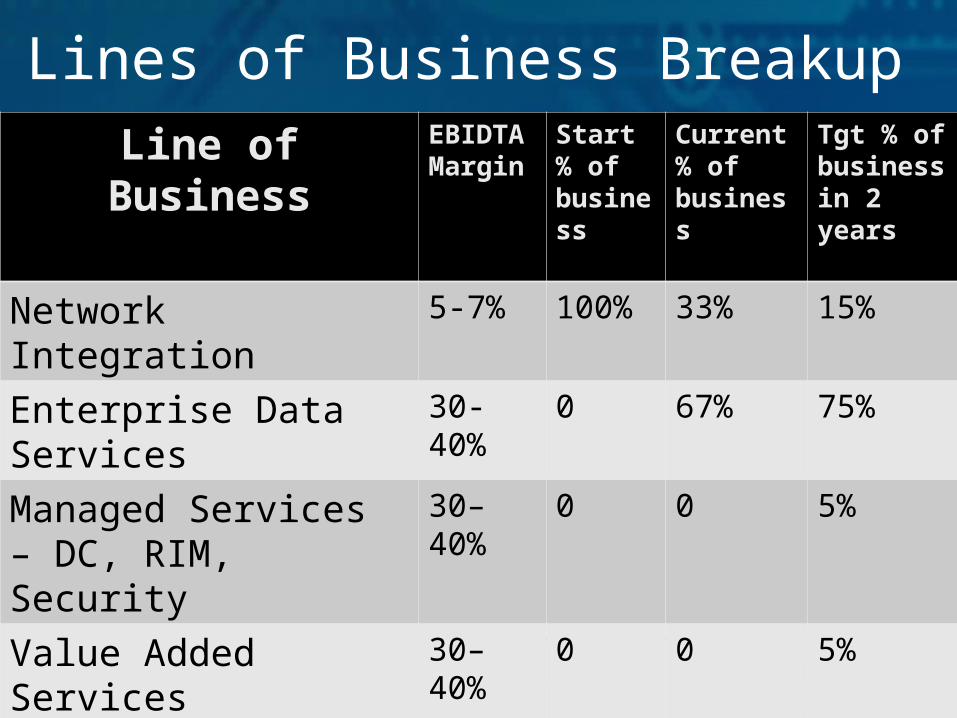
Lines of Business BreakupLine of Business EBIDTA
MarginStart % of business
Current % of business
Tgt % of business in 2 years
Network Integration 5-7% 100% 33% 15%
Enterprise Data Services 30-40% 0 67% 75%
Managed Services – DC, RIM, Security
30–40% 0 0 5%
Value Added Services 30–40% 0 0 5%
Enterprise Data Connectivity || Network Integration || Data Centre || Managed Services360° Engagement
19
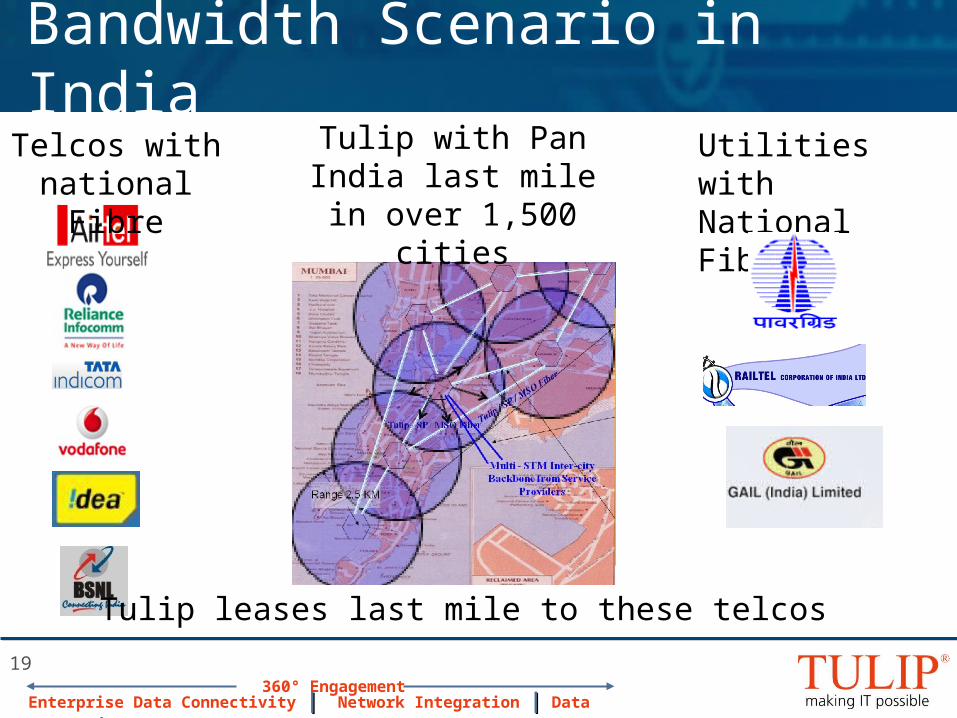
Bandwidth Scenario in IndiaTelcos with
national FibreUtilities with National Fibre
Tulip with Pan India last mile in over 1,500
cities
Tulip leases last mile to these telcos
Enterprise Data Connectivity || Network Integration || Data Centre || Managed Services360° Engagement
20
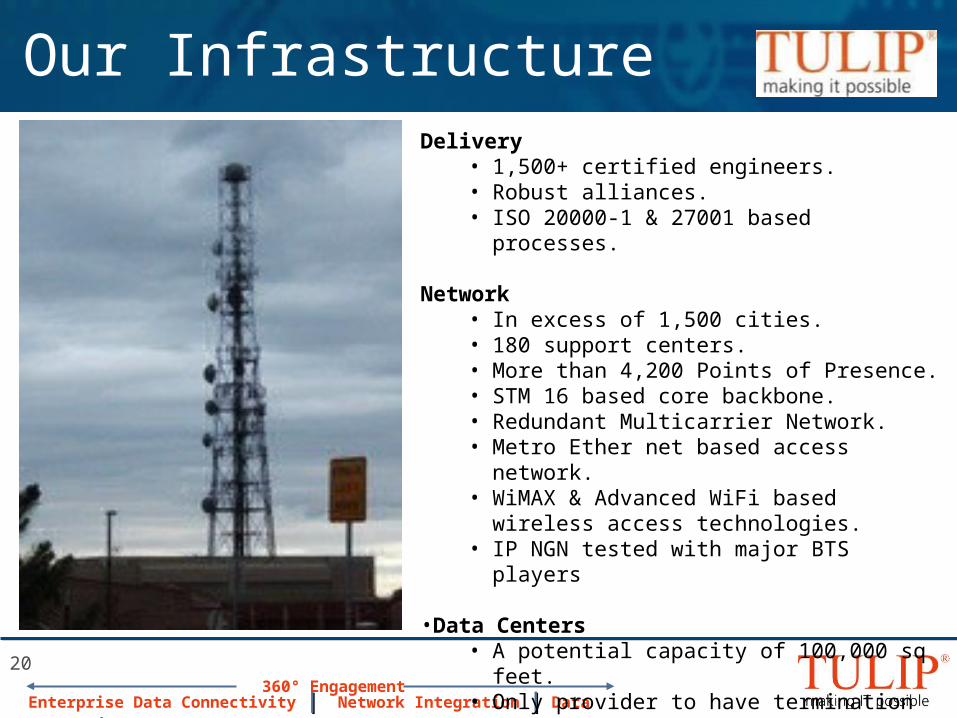
Our InfrastructureDelivery
• 1,500+ certified engineers.• Robust alliances.• ISO 20000-1 & 27001 based processes.
Network • In excess of 1,500 cities.• 180 support centers.• More than 4,200 Points of Presence.• STM 16 based core backbone.• Redundant Multicarrier Network.• Metro Ether net based access network.• WiMAX & Advanced WiFi based wireless access
technologies.• IP NGN tested with major BTS players
•Data Centers• A potential capacity of 100,000 sq feet.• Only provider to have termination from all telcos.• Ready to use NGN head.
Enterprise Data Connectivity || Network Integration || Data Centre || Managed Services360° Engagement
21
High End Router
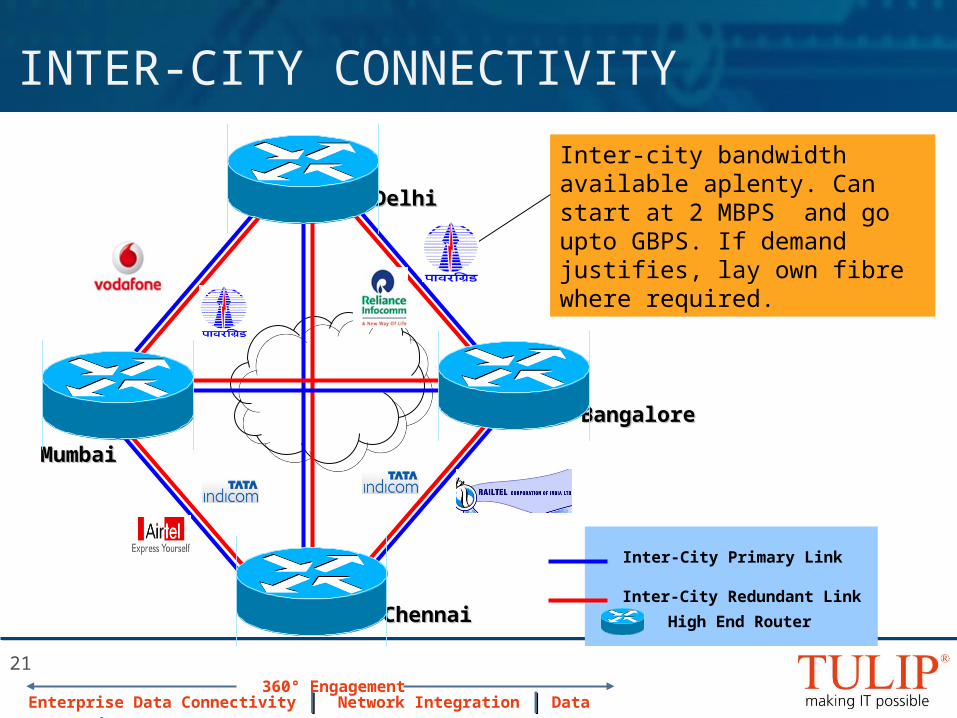
INTER-CITY CONNECTIVITY
MumbaiMumbai
ChennaiChennai
BangaloreBangalore
DelhiDelhi
Inter-City Primary Link
Inter-City Redundant Link
Inter-city bandwidth available aplenty. Can start at 2 MBPS and go upto GBPS. If demand justifies, lay own fibre where required.
Enterprise Data Connectivity || Network Integration || Data Centre || Managed Services360° Engagement
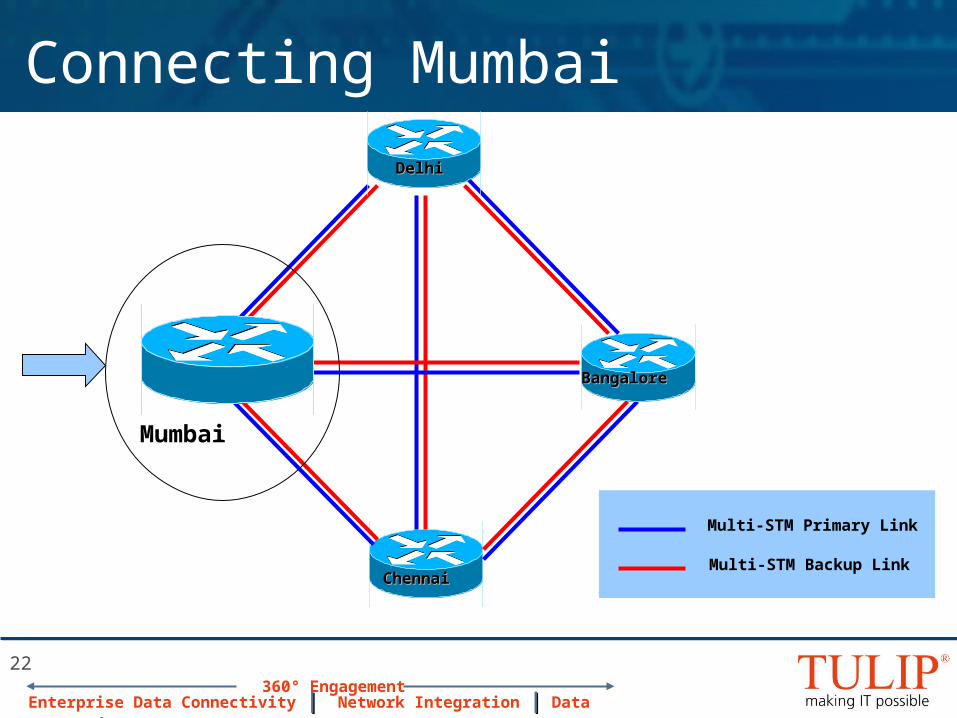
22
ChennaiChennai
BangaloreBangalore
DelhiDelhi
Multi-STM Primary Link
Multi-STM Backup Link
Mumbai
Connecting Mumbai
Enterprise Data Connectivity || Network Integration || Data Centre || Managed Services360° Engagement
23
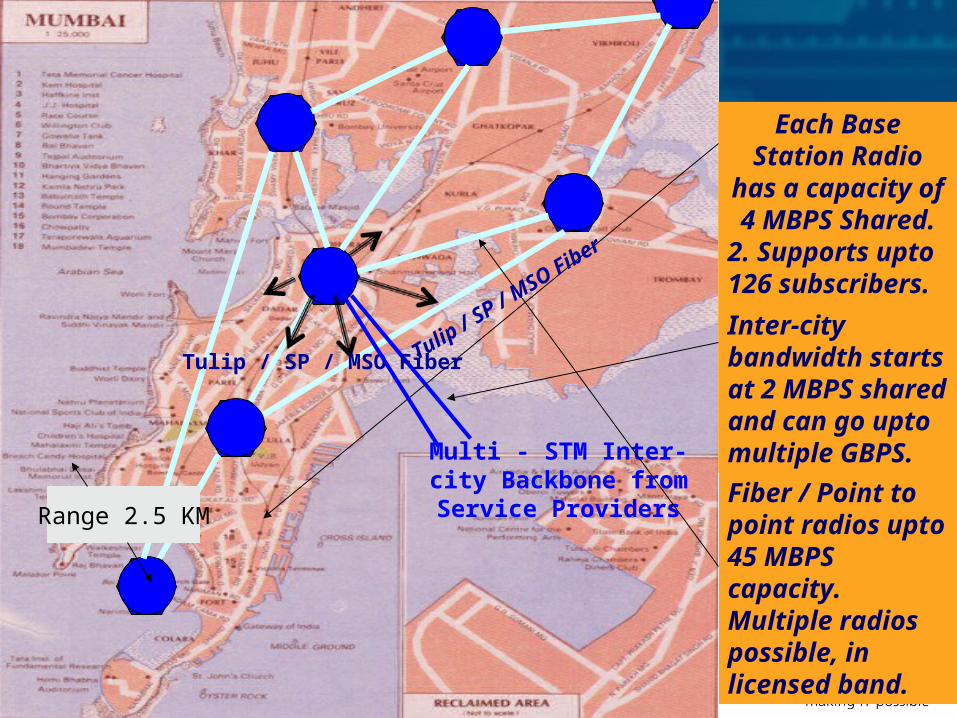
Fiber / Point to point radios upto 45 MBPS capacity. Multiple radios possible, in licensed band.
Multi - STM Inter-city Backbone from Service
Providers
Each Base Station Radio has a
capacity of 4 MBPS Shared.
2. Supports upto 126 subscribers.
Inter-city bandwidth starts at 2 MBPS shared and can go upto multiple GBPS.
Range 2.5 KM
Tulip / SP / M
SO Fiber
Tulip / SP / MSO Fiber
Enterprise Data Connectivity || Network Integration || Data Centre || Managed Services360° Engagement
24
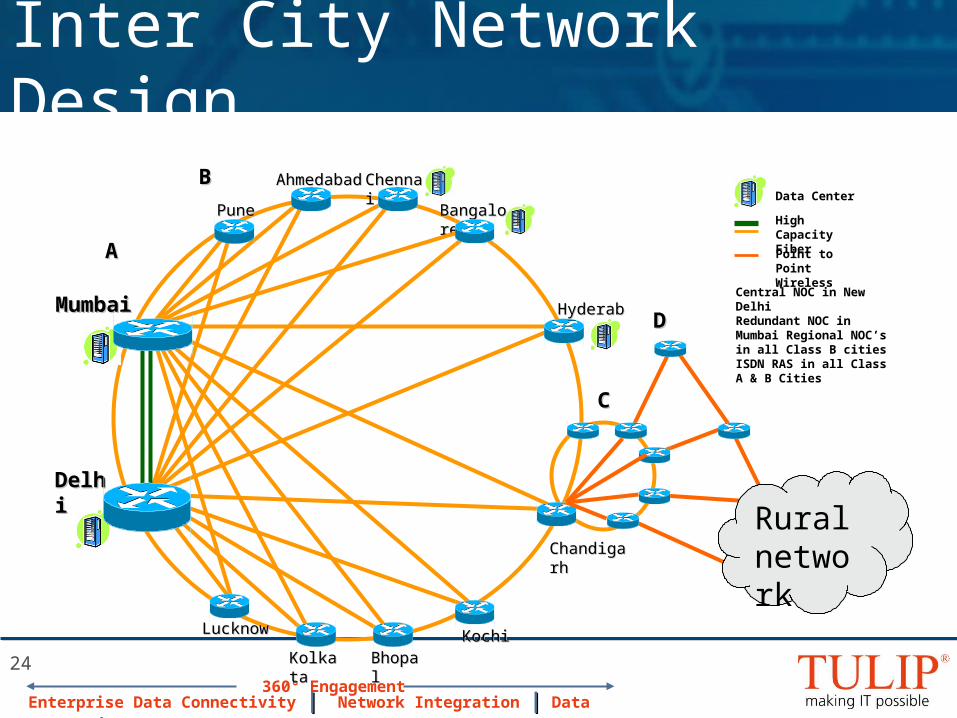
Inter City Network Design
Data Center
High Capacity Fiber
Point to Point Wireless
Central NOC in New DelhiRedundant NOC in Mumbai Regional NOC’s in all Class B citiesISDN RAS in all Class A & B Cities
MumbaiMumbai
DelhiDelhi
AA
BB
CC
DD
PunePune
AhmedabadAhmedabad ChennaiChennai
BangaloreBangalore
HyderabadHyderabad
KochiKochi
ChandigarhChandigarh
BhopalBhopalKolkataKolkata
LucknowLucknow
Rural network
Enterprise Data Connectivity || Network Integration || Data Centre || Managed Services360° Engagement
25
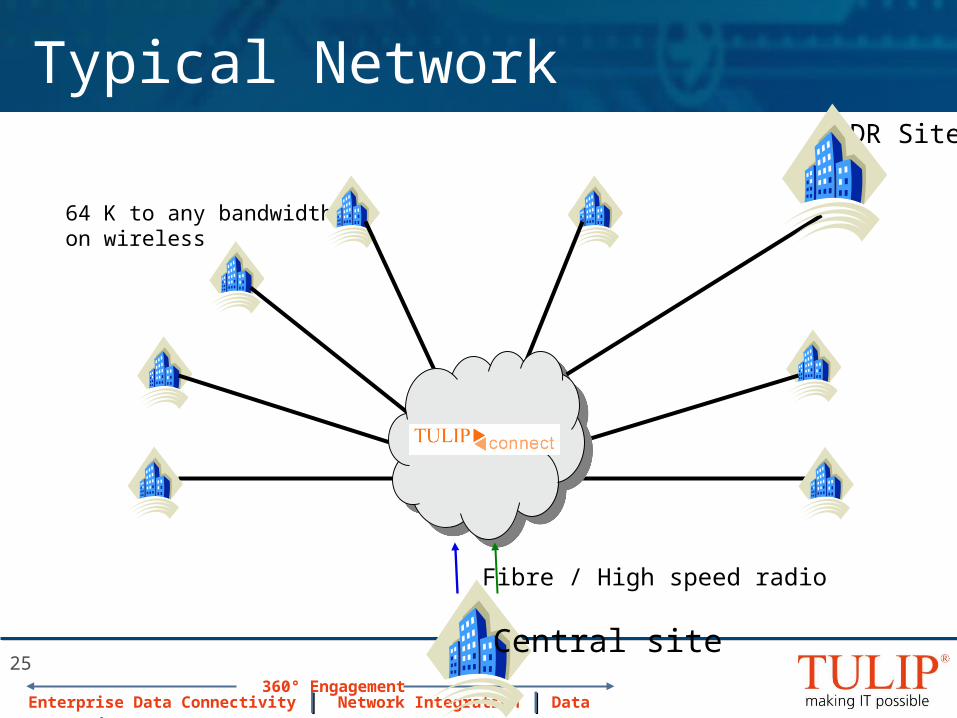
64 K to any bandwidth on wireless
Central site
Fibre / High speed radio
Typical NetworkDR Site
Enterprise Data Connectivity || Network Integration || Data Centre || Managed Services360° Engagement
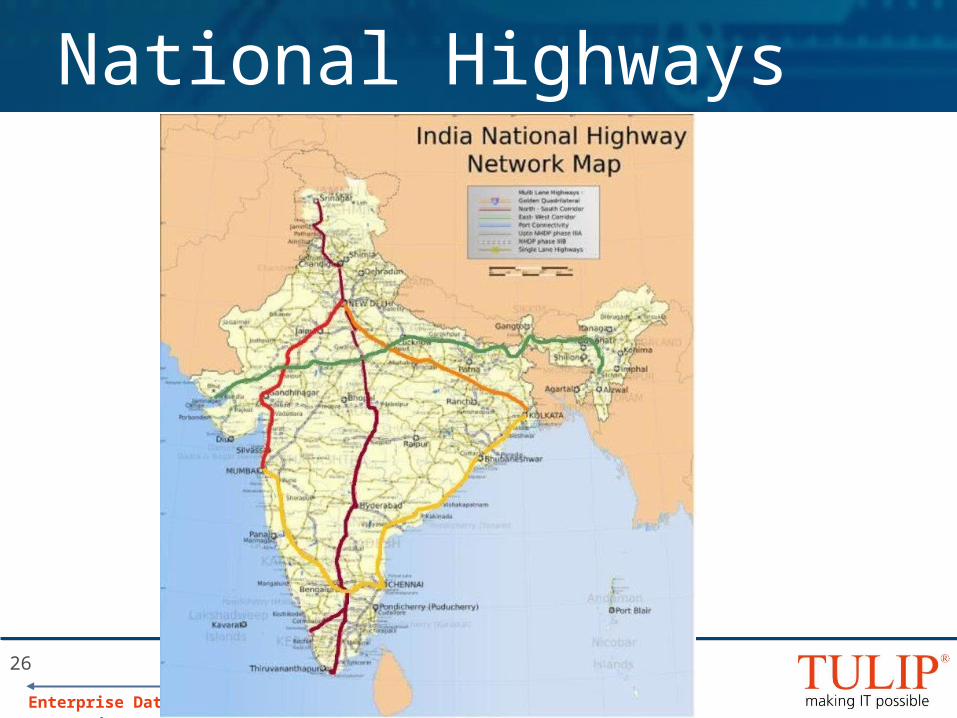
National Highways
26
Enterprise Data Connectivity || Network Integration || Data Centre || Managed Services360° Engagement
27
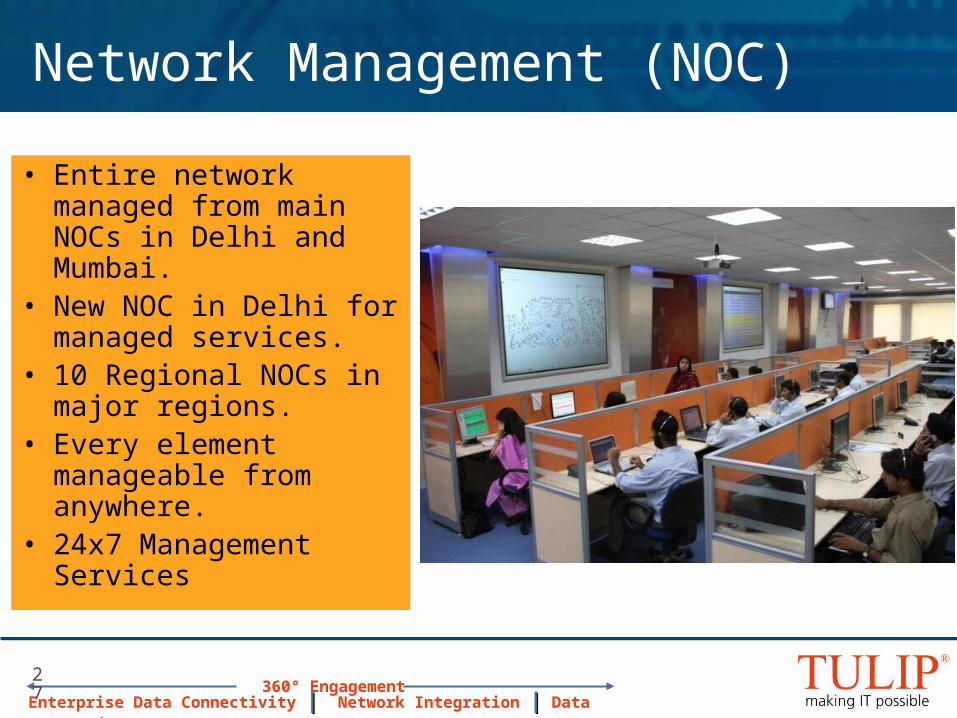
Network Management (NOC)
• Entire network managed from main NOCs in Delhi and Mumbai.
• New NOC in Delhi for managed services.
• 10 Regional NOCs in major regions.
• Every element manageable from anywhere.
• 24x7 Management Services
• Entire network managed from main NOCs in Delhi and Mumbai.
• New NOC in Delhi for managed services.
• 10 Regional NOCs in major regions.
• Every element manageable from anywhere.
• 24x7 Management Services
Enterprise Data Connectivity || Network Integration || Data Centre || Managed Services360° Engagement
28
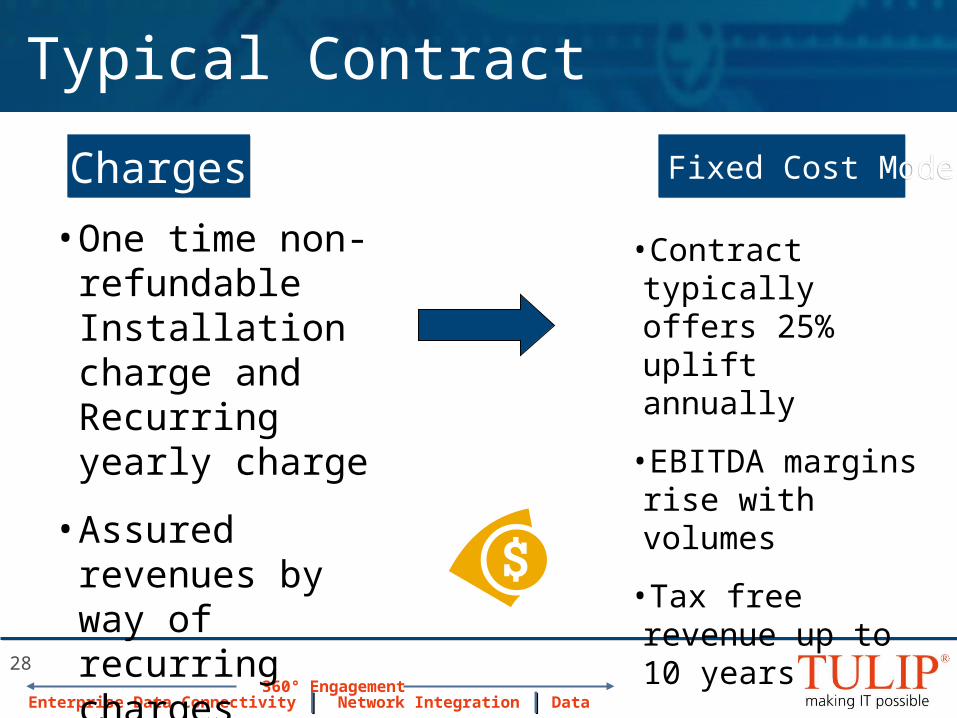
Typical Contract
•Contract typically offers 25% uplift annually
•EBITDA margins rise with volumes
•Tax free revenue up to 10 years
ChargesCharges Fixed Cost ModelFixed Cost Model
• One time non-refundable Installation charge and Recurring yearly charge
• Assured revenues by way of recurring charges
Enterprise Data Connectivity || Network Integration || Data Centre || Managed Services360° Engagement
29
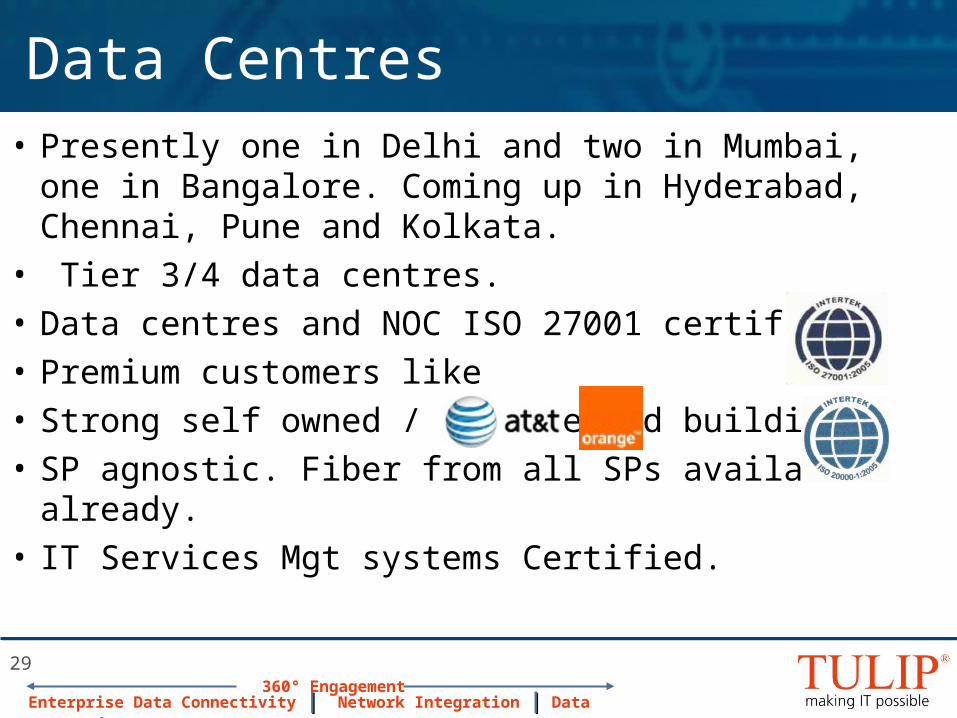
Data Centres
• Presently one in Delhi and two in Mumbai, one in Bangalore. Coming up in Hyderabad, Chennai, Pune and Kolkata.
• Tier 3/4 data centres.
• Data centres and NOC ISO 27001 certified.
• Premium customers like
• Strong self owned / long leased buildings.
• SP agnostic. Fiber from all SPs available already.
• IT Services Mgt systems Certified.
Enterprise Data Connectivity || Network Integration || Data Centre || Managed Services360° Engagement
30
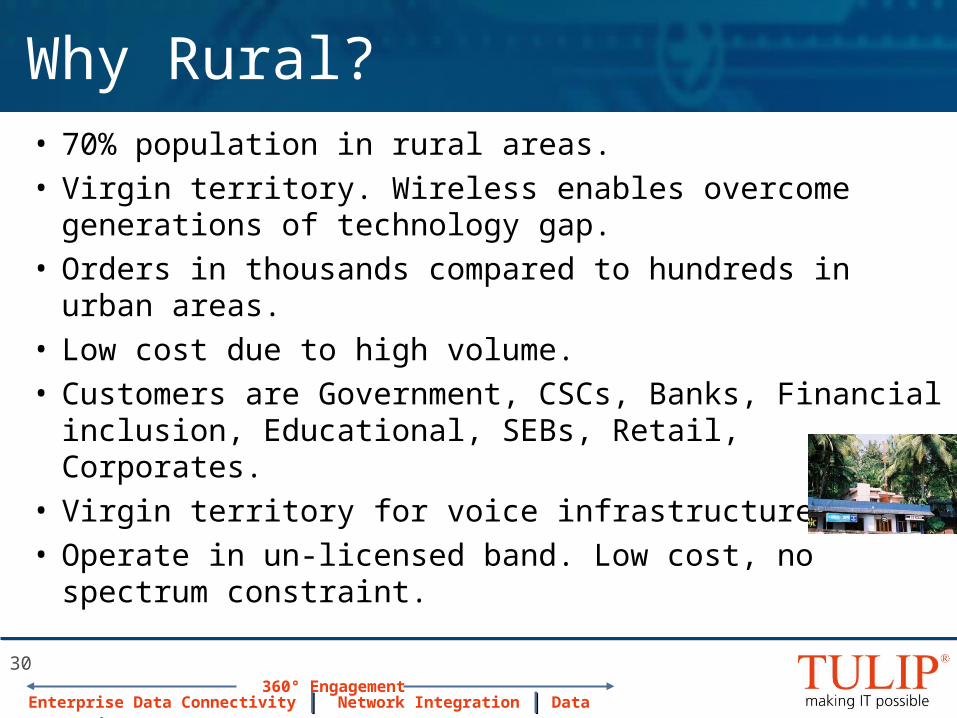
Why Rural?• 70% population in rural areas.• Virgin territory. Wireless enables overcome generations of
technology gap.• Orders in thousands compared to hundreds in urban areas.• Low cost due to high volume.• Customers are Government, CSCs, Banks, Financial
inclusion, Educational, SEBs, Retail, Corporates. • Virgin territory for voice infrastructure.• Operate in un-licensed band. Low cost, no spectrum
constraint.
• 70% population in rural areas.• Virgin territory. Wireless enables overcome generations of
technology gap.• Orders in thousands compared to hundreds in urban areas.• Low cost due to high volume.• Customers are Government, CSCs, Banks, Financial
inclusion, Educational, SEBs, Retail, Corporates. • Virgin territory for voice infrastructure.• Operate in un-licensed band. Low cost, no spectrum
constraint.
Enterprise Data Connectivity || Network Integration || Data Centre || Managed Services360° Engagement
31
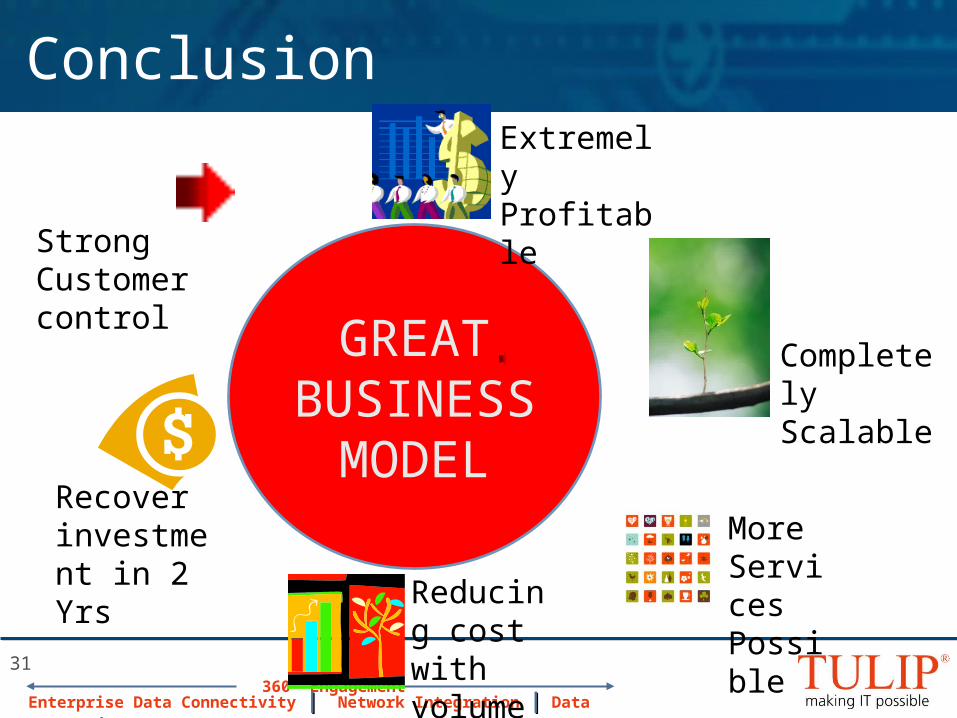
Conclusion
GREAT BUSINESS
MODEL
Extremely Profitable
Completely Scalable
More Services PossibleReducing
cost with volume
Recover investment in 2 Yrs
Strong Customer control
Enterprise Data Connectivity || Network Integration || Data Centre || Managed Services360° Engagement
32
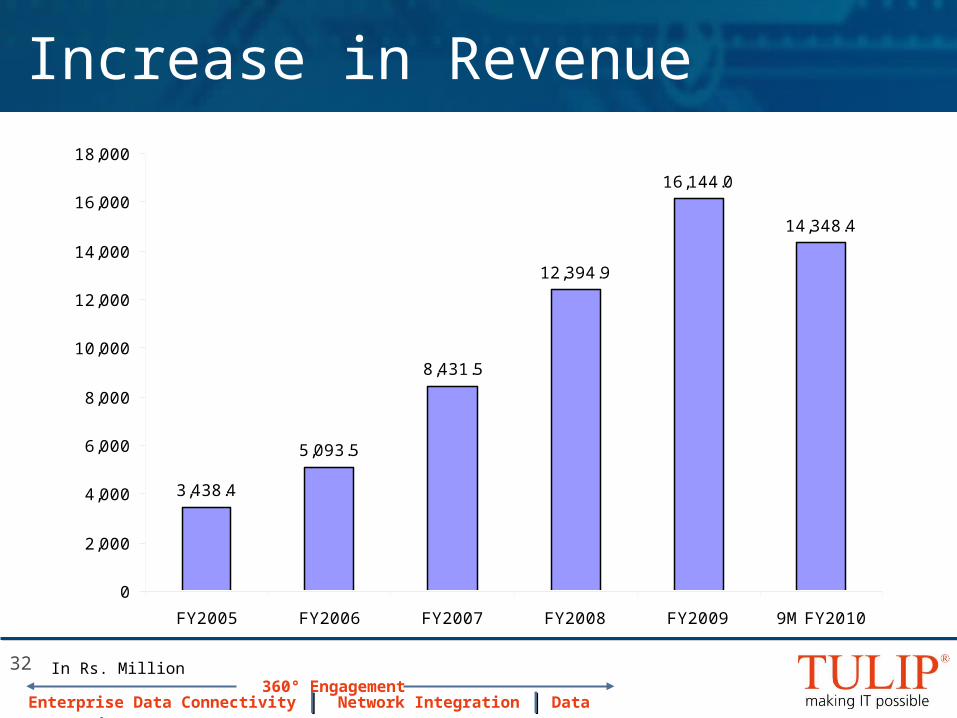
Increase in Revenue
In Rs. Million
3,438.4
5,093.5
8,431.5
12,394.9
16,144.0
14,348.4
0
2,000
4,000
6,000
8,000
10,000
12,000
14,000
16,000
18,000
FY2005 FY2006 FY2007 FY2008 FY2009 9M FY2010
Enterprise Data Connectivity || Network Integration || Data Centre || Managed Services360° Engagement
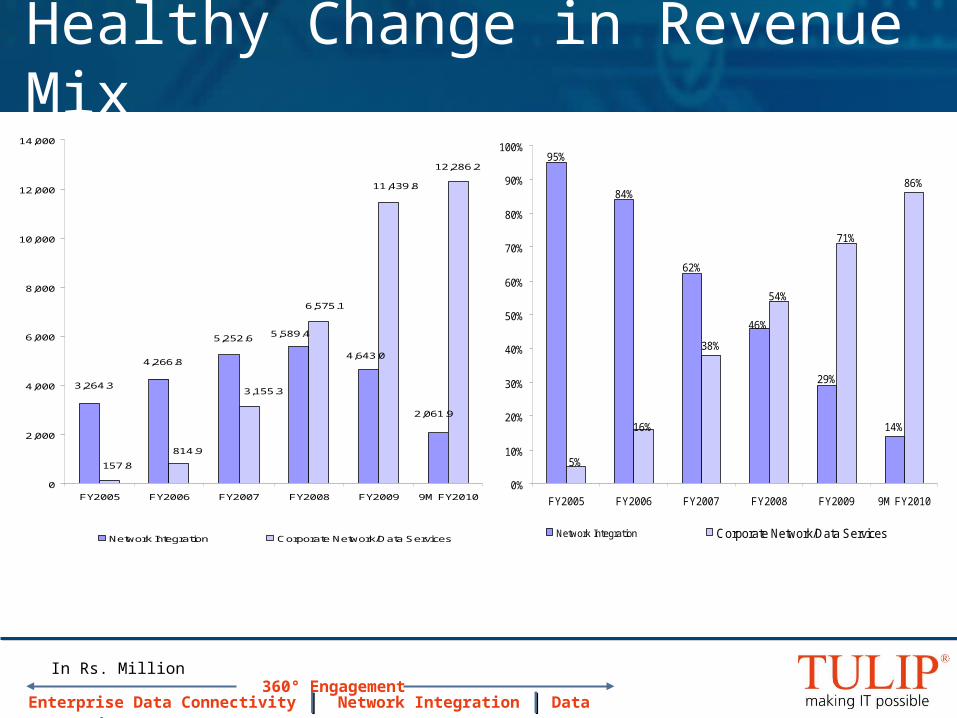
Healthy Change in Revenue Mix
2,061.9
3,264.3
4,266.8
5,252.65,589.4
4,643.0
12,286.2
157.8
814.9
3,155.3
6,575.1
11,439.8
0
2,000
4,000
6,000
8,000
10,000
12,000
14,000
FY2005 FY2006 FY2007 FY2008 FY2009 9M FY2010
Network Integration Corporate Network/Data Services
14%
38%
86%
29%
62%
95%
84%
46%
5%
16%
71%
54%
0%
10%
20%
30%
40%
50%
60%
70%
80%
90%
100%
FY2005 FY2006 FY2007 FY2008 FY2009 9M FY2010
Network Integration Corporate Network/Data Services
In Rs. Million
Enterprise Data Connectivity || Network Integration || Data Centre || Managed Services360° Engagement
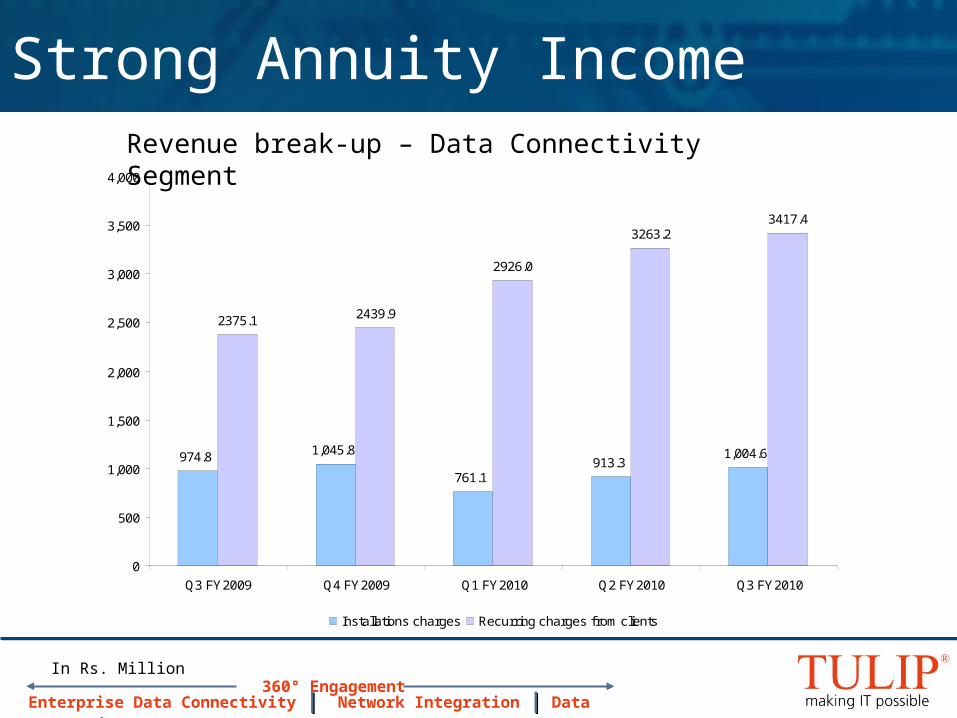
Strong Annuity Income
974.8 1,045.8
761.1913.3
1,004.6
2375.1 2439.9
2926.0
3263.23417.4
0
500
1,000
1,500
2,000
2,500
3,000
3,500
4,000
Q3 FY2009 Q4 FY2009 Q1 FY2010 Q2 FY2010 Q3 FY2010
Installations charges Recurring charges from clients
Revenue break-up – Data Connectivity Segment
In Rs. Million
Enterprise Data Connectivity || Network Integration || Data Centre || Managed Services360° Engagement
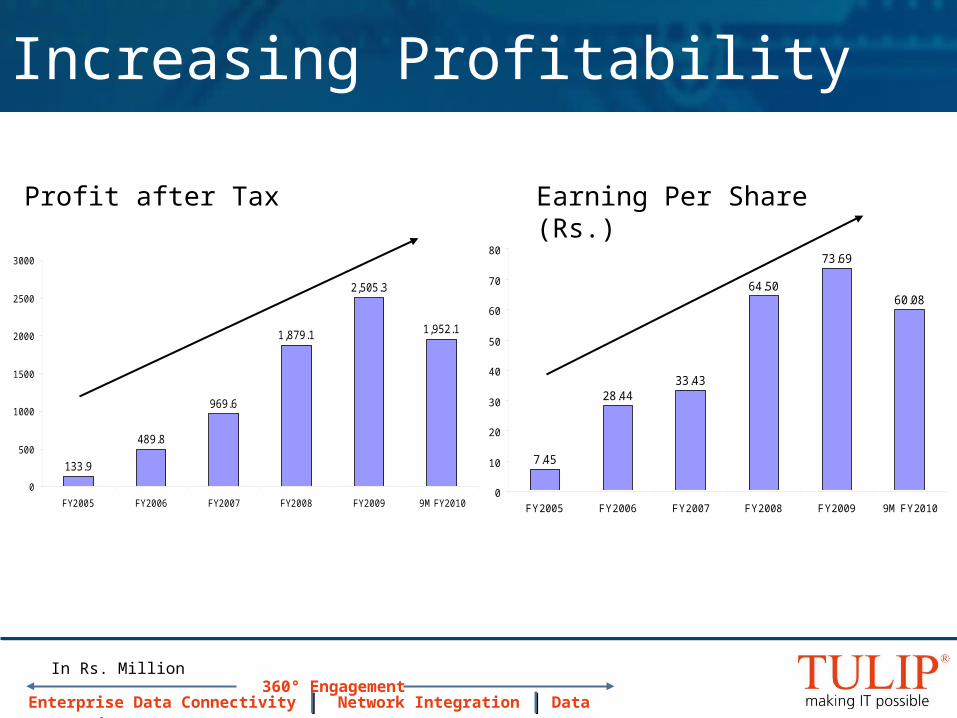
Increasing Profitability
Profit after Tax
133.9
489.8
969.6
1,879.1
2,505.3
1,952.1
0
500
1000
1500
2000
2500
3000
FY2005 FY2006 FY2007 FY2008 FY2009 9M FY2010
7.45
28.4433.43
64.50
73.69
60.08
0
10
20
30
40
50
60
70
80
FY2005 FY2006 FY2007 FY2008 FY2009 9M FY2010
Earning Per Share (Rs.)
In Rs. Million
Enterprise Data Connectivity || Network Integration || Data Centre || Managed Services360° Engagement
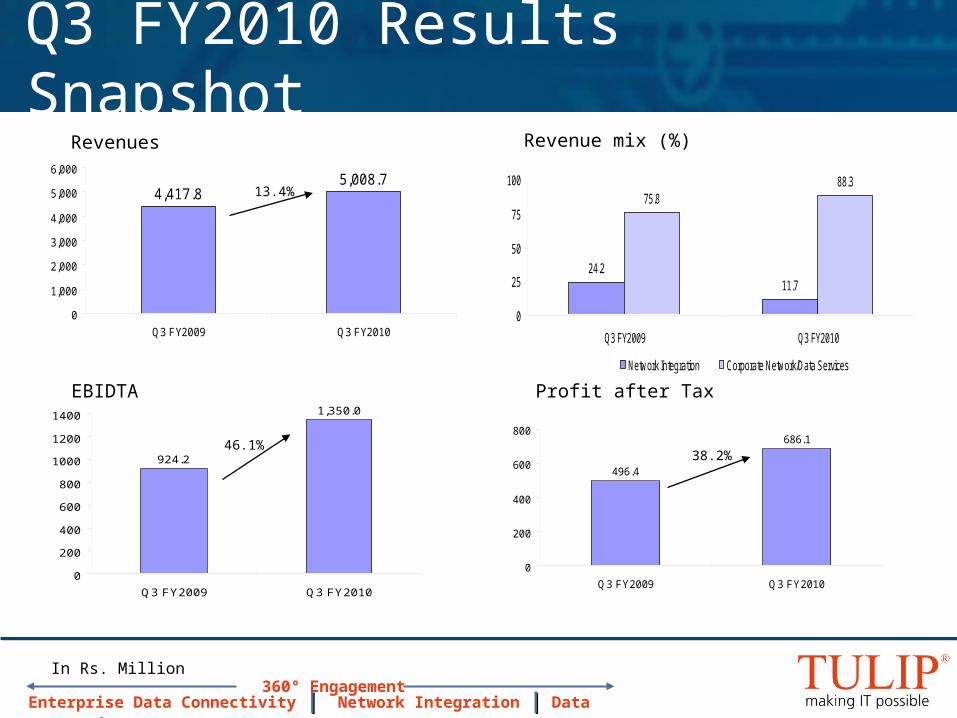
496.4
686.1
0
200
400
600
800
Q3 FY2009 Q3 FY2010
4,417.85,008.7
0
1,000
2,000
3,000
4,000
5,000
6,000
Q3 FY2009 Q3 FY2010
Revenue mix (%)
24.211.7
75.888.3
0
25
50
75
100
Q3 FY2009 Q3 FY2010
Network Integration Corporate Network/Data Services
Q3 FY2010 Results SnapshotRevenues
In Rs. Million
13.4%
Profit after Tax
38.2%
EBIDTA
924.2
1,350.0
0
200
400
600
800
1000
1200
1400
Q3 FY2009 Q3 FY2010
46.1%

Thank You
Tulip Telecom Ltd