Embed Size (px)
Citation preview

TU/e
Polydiagnostics on the COST lamp
Aim: To calibrate various methods against each othersfind the truth & and nothing but the truth
For validating models
Joost van der MullenTechnische Universiteit Eindhoven
MadeiraModel Inventory WorkshopApril 12-16: 2005

TU/e
The problems; the challenges
Three methods to measure the temperature
Usually give three (or even more) answers
Even for so-called “LTE” plasma: differences up to 30%
Difficult to answer the question: is LTE present? Or: are the method (in)correct?
Impossible to validate the models

TU/e
Final Goal
To find Easy/Global observables
To Characterise the plasma: ne, Te etc
To determine the state of the lamp:Light technical propertiesRemaining Lifetime
Candidate Easy/Global observables(Filtered) EmissionElectronic behavior

TU/e
Polydiagnostics on good defined plasma
Different people Various techniques
Limited amount of Lamps
Cost Reference LampFamily

TU/e
The COST reference LampFamily:
Second generation: (in preparation)1) Outer envelope is filled with N_2; Additional convection cooling 2) electrodes simplified (no spirals but rods) Request on last COST meeting: plasma-electrode interactions.
First generationShortcomings: burner wall too hot limitation in life span & power.
Invitation to work on 1ste generation: requests for the final design. The followings types 1 ste generation are available: a) Pure Hg; b) Hg with Na c) Hg with Dy.

TU/e
Provided from: EINLighTRED
Philips Licht
ASML Draka
Tue/N
Eindhoven
INstitute for
Lighting
Technology
Research and
EDucation
Philips NatLab
COSTEuropa
Philips Aachen

TU/e
The plasmas: in MH lamps
10 bar Hg10 mbar add
Color non-uniformity
Segregation

TU/e
2-D
3D
Plasma: orientation dependent
Gravitation

TU/e
Main characteristics
Main feature: Majority plasma propertiesMinority species
Largely non-linear
Example: Color: orientation dependent
Fe(ion) = 109 Fg(ion)
Chemistry: 10 bar Hg : 20 mbar DyI3
TU/e
General exploration phenomena
Demands: High Efficiency RadiationLong life span
T largeHigh Tcentral
Low Twall
High pHg large
Buoyancy
Continuity

TU/e
Elemental: whats in that name ??
Species: H2O; OH; O; H; H+ etc.
[H] = atomic concentration: H atoms per volume
{H} = elemental concentration: all H atoms per volumeirrespective binding/state
{H} = [H] + 2[H2O] + [H+]

TU/e
Radial segregation; Diffusion
Centrum
T high
atoms
small
fast
Wall
T low
Molecules
Large
slow
Nelea va = Nele
m vm
Nelea / Nele
m = vm /va << 1

TU/e
Axial segregation
Large Nele at wall pushed down
Small Nele at centr pushed up
Net effect: Emiting species Pushed-down
Or differently
Quick atoms can leave upstream easilySlow molecules stay streaming downwards

TU/e
Competition
Convection
Diffusion
Chemistry
Radiation

TU/e
Methods
Grand Modeling
Radiation Transport
3D
Polydiagnostics
X-ray Abs Tomo
Emission
Absorption: LaserD
Thomson Sc
Flow Patterns
E-Field
Chemistry
DiffusionX-ray Flouresc
Absorption Broadband
Self-Absorption
In Search for COST cooperation

TU/e
Convergence
Polydiagnostics
X-ray Abs Tomo
X-ray Flouresc
Emission
Laser Diode Abs
Thomson Sc
Normal Terrestial: 1 g Zero g
The Truth

TU/e
The Final Goal
Can we by just looking to easy/global observables
Characterise the plasma: ne; Te, etcAssess the status of the lamp: Efficiency
Remaining lifetime
Examples Easy/Global observables: Emission/FiltersV/I response

TU/e
Settings
Model – Diagnositcs validation for Several settings
Buffer gasRadiation “gas”
Fillings
Power Quantity Waveform
GravitationZero gExtreme g
VesselGeometry

TU/e
Zero g: methods limited

TU/e
Normal conditionsmany possibilities
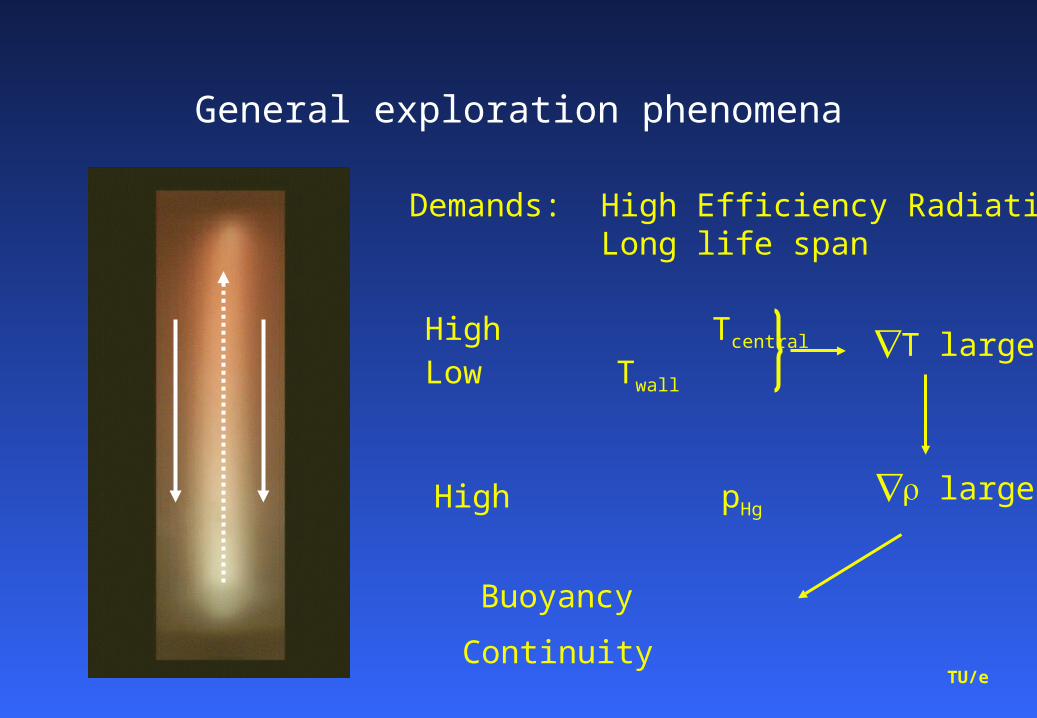
Guided by Atomic State Distribution Function (ASDF)
Passive spectroscopy Emission Intensity: Line ContinuumIntegrated, Line Shape/Reversal
Active SpectroscopyFluorescence: LIF Xray FAbsorption: Laser (line) broadbandScattering: Thomson
TU/e
The ASDF
TS Slope by TS
ES
E
SahaJump
Ion. En.0
by
LIF and AS
Ln
(n/g
)
LiRe

TU/e
Emission Spectroscopy
• Intensity as function of Wavelength• Wavelength calibration big effort• Calibrate Intensity of lines ALI• Calculate Density of Dysprosium• Atomic State Distribution Function (ASDF)• Gives T; gives various n’s

TU/e
Setup ES
Czerny-Turner 1m-monochromator
ST-6 CCD
ST-2000 CCD
lamp lens
dia
Two CCDGlobalPrecise

TU/e
Spectral Impression: grass fieldLine identification: not trivial
400 450 500 550 600 650 700
0
10000
20000
30000
40000
50000
60000
70000
In
ten
sity
(co
un
ts)
Wavelength

TU/e
Radial profile Dy1
0.000 0.001 0.002 0.003 0.0040
2500
5000
7500
10000
12500
15000
17500
Inte
nsity (
W/m2)
Radius (m)

TU/e
Abel inversion
)(xI
(r): emission as a function of radius rI(x): measured lateral emission-line intensity
.35
16
35
8
35
6
7
12
3
8
3
4
5
2
3
2
3
12
2
624426226
4224224
22222
220
xRxRxRxRc
xRxRxRc
xRxRc
xRc
6
0
)(n
nnrcr
R
x
drxr
rrxI
22)(2)(
0
0
),(2)(y
dyyxxI I(x )
y
x
rR
(r)
y 0
-y 0

TU/e
ALI
ln
1ln
pE pI
)(4
1,,
ppql
p nhAD
Ij
DhA
In
pq
lp
4
)ln(ln
eB
p
p
p
Tk
I
g
n
3/22
2
eBeie Tkm
h

TU/e
ASDF for central position
T=5524 K
319103 mg
n
ground
ground
1 2 3 4 5 6 7 8 9 1034
36
38
40
42
ln
(n/g
)
Eup (eV)
DyI DyII
NoteSteeperSlope

TU/e
Future Plans
• Join forces with Plasimo• Compare results with that of other techniques
• Still much work : Spectrum identificationMeasurements
Important Part of the collection Easy/Global Observable
ALI will be The reference frame:For other thechniquesCOST cooperation

TU/e
Absorption Spectroscopy
burnerouter balloon
lens I lens IIlaser lens III interference
filter
diode array
Dy groundstate density
Charlotte Groothuis

TU/e
Linking absorption with density
sIsds
sdI
,
ssnAg
gs qpq
q
p ,8
,2
)(rnq

TU/e
Lateral

TU/e

TU/e
Lateral

TU/e
Segregation parameter
λ ≡ ∂p /∂z

TU/e
X-ray absorption
Xiaoyan Zhu & Evert Ridderhof
X-ray CCD
Cooling plate +shielding frame
d1d2
x-raysource
L

TU/e
Procedure
Hg is dominant
p /p <<1
(n T)any pos = (n T)wall
Pyrometer
Tg on any position
Xray

TU/e
XRA on Helios lamp
• Exposure time: 200s.on off
258
464
788
852
1012

TU/e

TU/e
The Wall temperature as a function axial position z
-4.5 0.0 4.5 9.0 13.5 18.0 22.5
1300
1400
1500
1600
1700
1800-25 0 25 50 75 100 125
wa
ll te
mp
era
ture
(K
)
axial position z (mm)
Hg Hg+NaI Hg+NaI/CeI
3
Z (%)

TU/e
The Radial T profile as a F(z)
-1.0 -0.5 0.0 0.5 1.01000
1500
2000
2500
3000
3500
4000
4500
5000
5500
radi
al te
mpe
ratu
re (
K)
normalized radial position
95% 65% 55% 30% 10%
New

TU/e
The Shape as a F(z)
0 2 4 6 8 10 12 14 16 18
0.9
1.0
1.1
1.2
1.3
1.4
1.50 10 20 30 40 50 60 70 80 90 100
Z (%)F
WH
M
axial position z(mm)
Hg Hg+NaI Hg+NaI/CeI
3

TU/e
The shape as a F(power)
-1.0 -0.5 0.0 0.5 1.0
0.0
0.2
0.4
0.6
0.8
1.0
9.5mm to the bottom boundary of the burner
no
rma
lize
d t
em
pe
ratu
re
normalized radial position
70 W 90 W 120 W 144 W

TU/e
The Radial T profile as a F(z)
-1.0 -0.5 0.0 0.5 1.01000
1500
2000
2500
3000
3500
4000
4500
5000
5500
radi
al te
mpe
ratu
re (
K)
normalized radial position
95% 65% 55% 30% 10%
T of 5000 KIn Hg part
Are low
Blame Abel Inv ?

TU/e
X-ray Induced Fluorescence measurement of segregation in MH lamps
Tanya Nimalasuriya (TU/e)
Evert Ridderhof (TU/e)
John J. Curry (NIST)
Craig J. Sansonetti (NIST)
Sharvjit Shastri (APS)

TU/e
Introduction

TU/e
Advanced Photon Source

TU/e
Experiment station
E.J. Ridderhof

TU/e
XRF sketch
4 cm
X-rayBeam
Ge Detector
7 cm
Ion Chamber
Pb shield
Wslits
Wslits
burnerjacket
The x-ray beam is produced by the Sector 1 Insertion Device beam line at the Advanced Photon Source at the Argonne National Laboratory
J.J.Curry NIST

TU/e
XRF basic principle
An electron in the K shell is ejected from the atom by an external primary excitation x-ray, creating a vacancy.
An electron from the L or M shell "jumps in" to fill the vacancy. In the process, it emits a characteristic x-ray unique to this element and in turn, produces a vacancy in the L or M shell.

TU/e
XRF spectral lines
Principal fluorescence lines produced by K-shell excitation in Dy. The excited levels correspond to a singly ionized atom
X-ray induced fluorescence spectrum excited by 70 keV photons at x/R = 0.56. x is displacement from the arc axis in the direction of the detector and R=4.5 mm is the arc tube radius
J.J.Curry NIST
TU/e
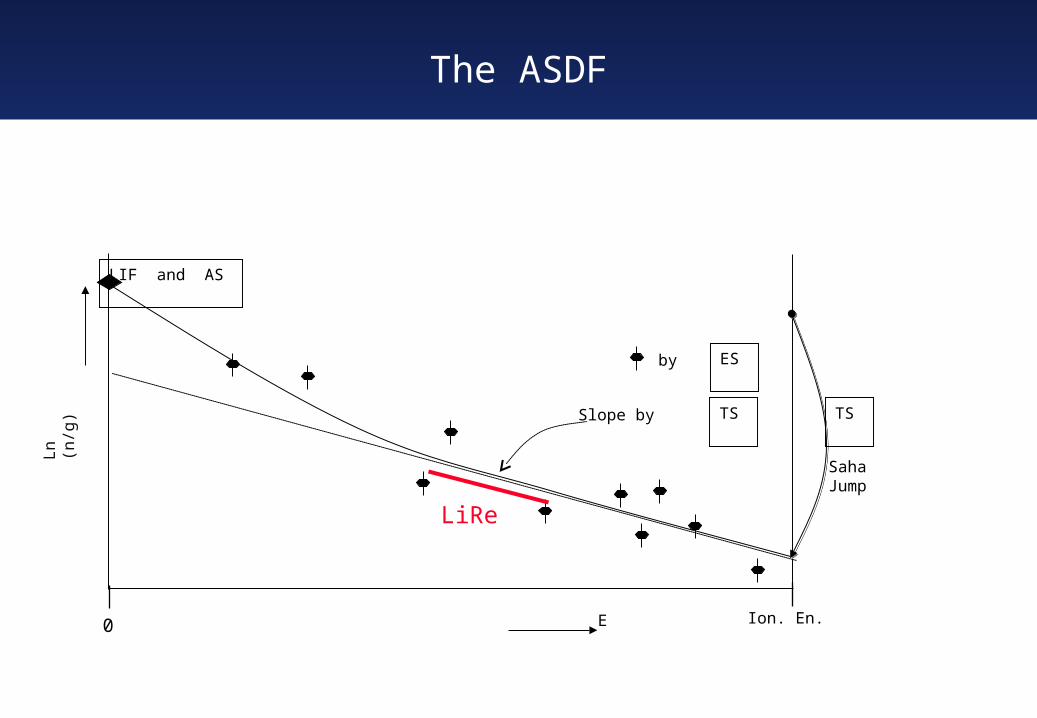
XRF advantages
• X-ray induced fluorescence: - determines elemental densities of Dy,Hg - is effective anywhere in the burner
• No inversion technique is needed
• T profile with Hg densities

TU/e
XRF-Spectra
1mm above bottom electrodex, z: center
1mm above bottom electrode z: center, x: at wall
afiKa
Kai
Kaif NETEVTBYEEC )()(
4)()(
800 1200 1600 20000
20000
40000
60000
80000
100000
120000
Inte
nsity
Channel
800 1200 1600 20000
1000
2000
3000
4000
5000
6000
7000
Inte
nsity
Channel
I
CeDy I
Ce
Dy
W

TU/e
Wall influence
Dy density profile
-1.0 -0.5 0.0 0.5 1.0
1E15
1E16
1E17
Den
sity
(cm
-3)
normalised radial position
6.7% 21 % 36 % 50 %
Dissociation
Ionisation

TU/e
-0.8 -0.6 -0.4 -0.2 0.0 0.2 0.4 0.6 0.8
1E-4
1E-3
0.01
6.7% 21 % 36 % 50 %
Rat
io D
y/H
g
Normalised Radial Position
Ratio elemental densities Dy/ HgRelative concentration
T. Nimalasuriya, J.J. Curry, C.J. Sansonetti, E.J. Ridderhof
Wall influence
Dissociation
Ionisation

TU/e
Diffusion versus (radial) convection
-0.8 -0.6 -0.4 -0.2 0.0 0.2 0.4 0.6 0.8
1E-4
1E-3
0.01
6.7% 21 % 36 % 50 %
Rat
io D
y/H
g
Normalised Radial Position

TU/e
Temperature profile from Hg density
XRF 140 W XRA 142 W, X.Y. Zhu
-1.0 -0.5 0.0 0.5 1.0
1000
1500
2000
2500
3000
3500
4000
4500
5000
T (
K)
normalised radial position
6.7% 21 % 36 % 50 % 64 % 79 % 93 %
-1.0 -0.5 0.0 0.5 1.0
1000
1500
2000
2500
3000
3500
4000
4500
5000
T (
K)
normalised radial position
85% 65% 55% 30% 10%
TXRF < TXRA !!

TU/e
XRF Conclusions
In future: compare results with Absolute Line Intensity measurements and Laser Absorption Spectroscopy
Polydiagnostics
•Axial and radial segregation clearly observed
•T profile XRF shows similarities with XRA; TXRF lower !!

TU/e
Conclusions TS (versus XRA)
• TS for the first time applied on real lamp
• Indications that the LTE assumption is not valid
– Thermal: Te - T gas 2000 K XRA compared
– Chemical: Texc Te, b1 >10.
– Plasma always ionizing even at I-zero-crossing!!

TU/e
Zero g

TU/e
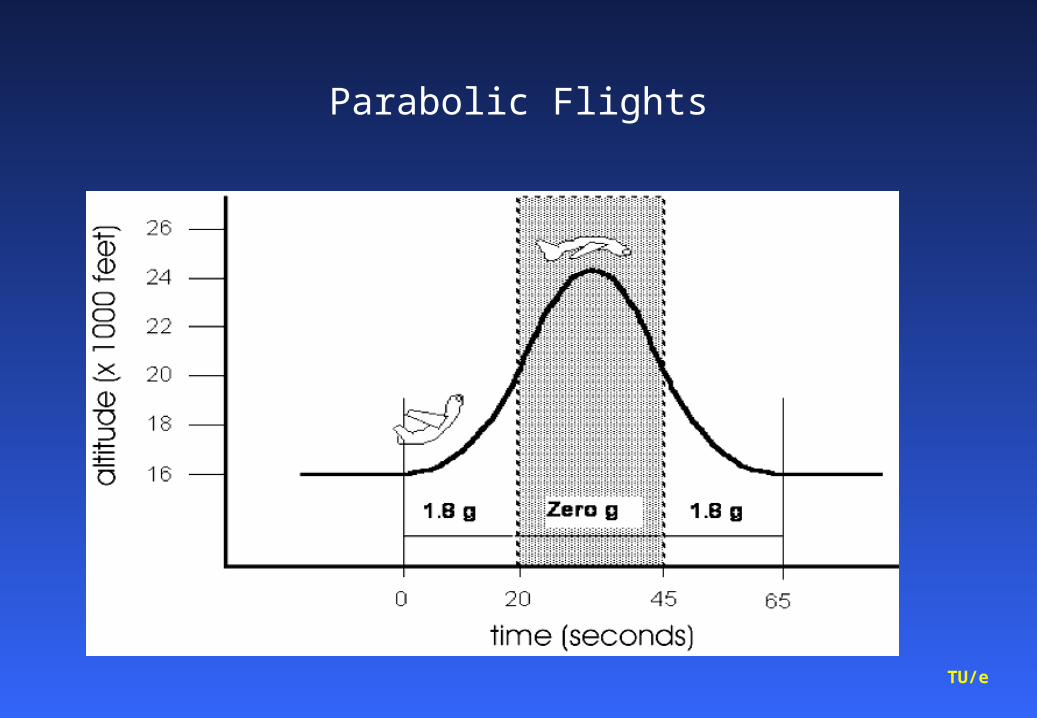
Parabolic flights
20 seconds 1.8 G25 seconds 0 G20 seconds 1.8 G

TU/e
T U E ( E P G ) T U E ( G T D a n d B L N ) P h i l i p s ( C D L )
G e r r i t K r o e s e n , M a r k B a x , D a n n y v a n d e n A k k e r , G u i d o S c h i f f e l e r s , P i m K e m p s , F r a n k v a n d e n H o u t , M a r c v a n K e m e n a d e , J o b B e c k e r s , A r j a nF l i k w e e r t , T a n y a N i m a l a s u r i y a , W i n f r e d S t o f f e l s , J o o s t v a n d e rM u l l e n , X i a o - Y a n Z h u , C h a r l o t t e G r o o t h u i s , A n e t t e S e z i n , R i n a B o o m , J o h a n M e u l e n s t e e n
P e e r B r i n k g r e v e , E r w i n D e k k e r s , J o v i t a M o e r e l , R o b d e K l u i j v e r , H a n s W i j t v l i e t , R u u d d e R e g t , F r e d v a n N i j m w e e g e n , R o e l S m e e t s , G e r a r d H a r k e m a , K l a a s K o p i n g a , P a u l B e i j e r , M e i n d e r t J a n s z e n , N . N . 1 , N . N . 2 , … , N . N . 1 5
M a r c o H a v e r l a g , R o b K e i j s e r , J o s E i j s e r m a n s , J a c q u e s C l a a s s e n s , P a u l H u i j b r e g t s , W a l l y D e k k e r s , J a c q u e s H e u t s , J a n P e e r a e r , J o h n E t m a n , J o o p G e i j t e n b e e k , F o l k e N ö r t e m a n n , C e e s R e y n h o u t , B r u n o S m e t s , H a n s W e r n a r s
E x t e r n a l c o n s u l t a n t sD u t c h S p a c e : R o n H u i j s e r , J a n D o o r n i n k , G e e r t B r o u w e r , F o n s v a n W i j k , K i n g L a m , L u c v a n d e n B e r g hK a y s e r - T h r e d e : R o l a n d S e u r i g , A n d r e a s K e l l i gV e r h a e r t : P i e t R o s i e r s B r a d f o r d : G e r a r d M a a s
A s t r o n a u t : A n d r é K u i p e r s ( E S A )

TU/e

TU/e
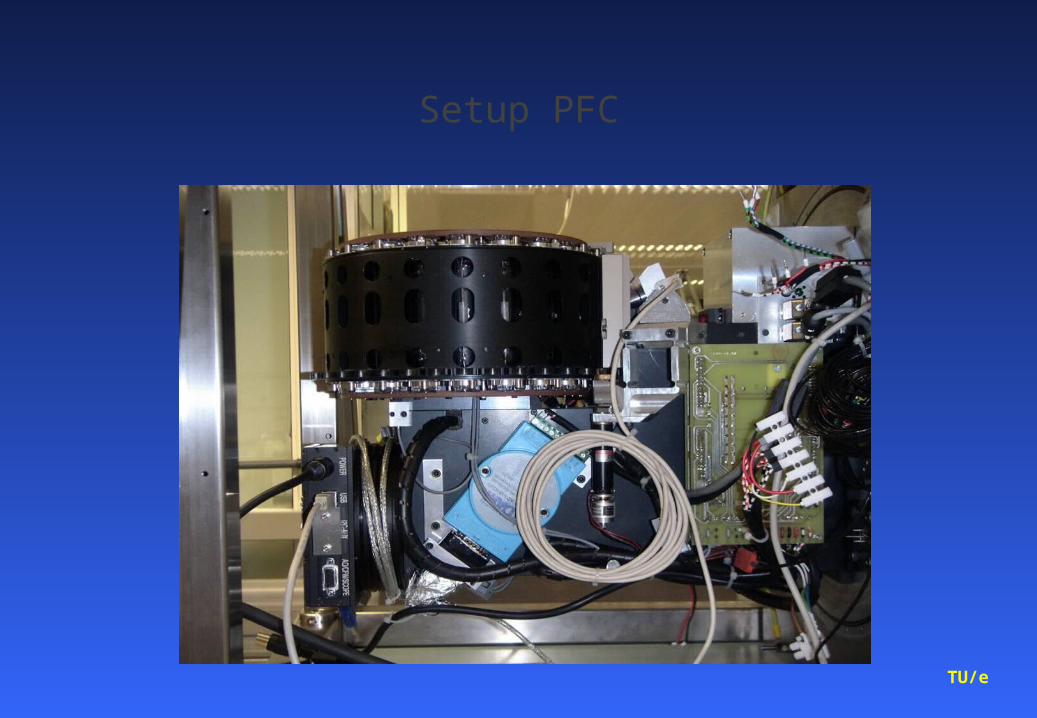
Setup in zero g plane
TU/e
Setup PFC
TU/e
Parabolic Flights

TU/e

TU/e
Fisher model
Competition between Diffusion and Convection.
Gravitation

TU/e
Prediction forincreased convection
Left hand side:• Decrease diffusion• Increase convection• More demixing
Right hand side:• Decrease diffusion• Increase convection• Better mixing

TU/e
λ
The Convection/Diffusion competition
0g: Diffusion solely
1g:Optimal competition
2g: Convection dominant
TU/e
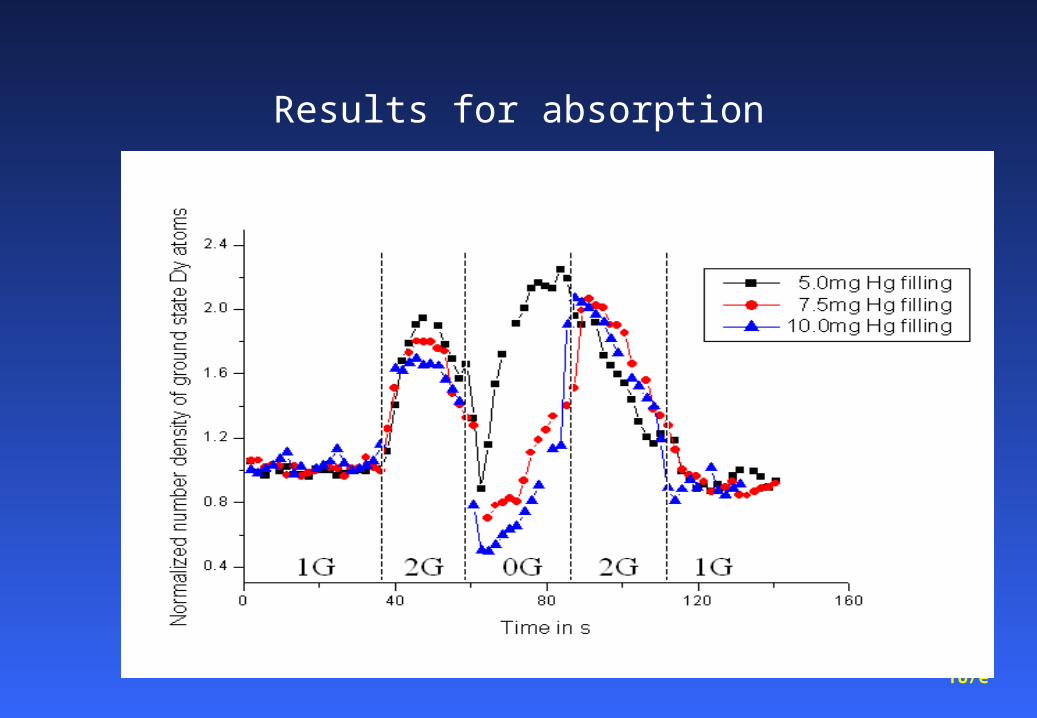
Results for absorption

TU/e
Sphere of Ullbricht: integrated intensityJob Beckers/Winfred Stoffels
Highly reflective diffusive
coating
Integrates all light
Homogenious light
the whole sphere

TU/e
ARGES burner, DyI3-salt, 5 mg Hg
1. Output increases cause of axial de-segregation
2. (right on the “Fischer curve”)
3. Output increases cause of disappearence of axial segregation (totally left on the “Fischer curve”) and new equilibrium.
4. Equilibrium comes back

TU/e
Conclusions
The total Light output varies with gravity.
Difference of the light output can be explained by the theory of axial- <-> radial segregation of lamps at the right side “Fischer curve”.
Lamps do not reach equilibrium at the end of a zero-g phase.
The results inegrated emission agree with absorption

TU/e
International Space Station

TU/e
ISS data analysis
• Dy 642 and Hg 579
• lateral profile
• abel inversion
• T profile using absolute measurement of Hg
• density profile of Dy 642

TU/e
0 200 400 600 800 1000 1200 1400 1600
0
5000
10000
15000
20000
642.73 nm
642.19 nm
Inte
nsi
ty (
cou
nts
)
Pixel column
940 960 980 1000 1020 1040 10600
5000
10000
15000
20000Data: A11593900500_C150Model: Lorentz Chi^2 = 605843.70114R^2 = 0.97897 y0 1518.81979 ±113.25358xc 971.02696 ±0.12266w 14.36558 ±0.42293A 433939.09968 ±11017.97067
Inte
nsi
ty (
cou
nts
)
Pixel column
Analysis Dy 642
TU/e
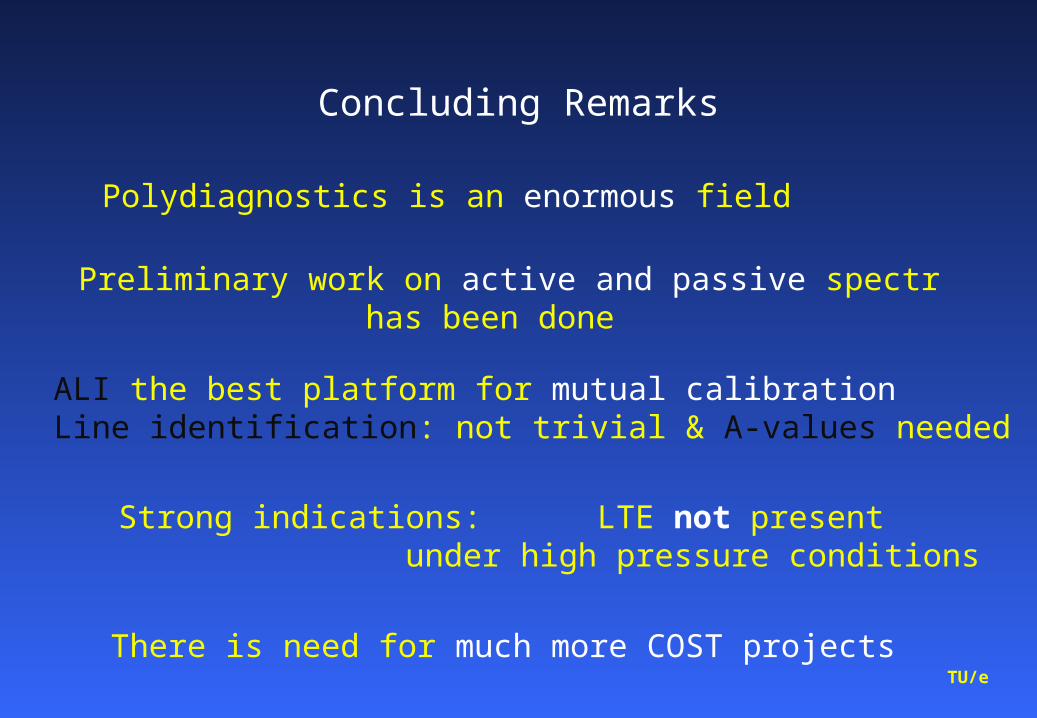
Concluding Remarks
Polydiagnostics is an enormous field
Preliminary work on active and passive spectrhas been done
Strong indications: LTE not present under high pressure conditions
There is need for much more COST projects
ALI the best platform for mutual calibrationLine identification: not trivial & A-values needed