Embed Size (px)
Citation preview
l ---
LIBRARY [Secretarigf of the Pacific
Tuberculosis trends in the Pacific Island Countries and Territories:
2000-2006
Secretariat of the Pacific Community (SPC) Noumea, New Caledonia
zcs control
0 Copyright Secretariat of the Pacific Community (SPC) 2008
Original text: English
Secretariat of the Pacific Community Cataloguing-in-publication data
Tuberculosis trends in the Pacific Islands region: 2000-2006 / Secretariat of the Pacific Community, Tuberculosis Control Section. 1. Tuberculosis - Islands of the Pacific I. Title. II. Secretariat of the Pacific Community
Table of Contents 1 Executive Summary
1 .l Background
1.2 TB data for the Pacific 1.3 Case notifications 1.4 Case detection
1.5 Treatment outcomes 1.6 Mortality
1.7 Future steps
2 Pacific Region 2.1 Introduction
2.2 Background 2.3 Data sources 2.4 Case notifications
2.5 Case detection 3 Treatment Outcomes 3.1 2005 cohort, treatment outcomes 3.2 Treatment outcomes over time
4 Mortality Country and Territory Profiles
5 American Samoa
6 Commonwealth of the Northern Mariana lslands
7 Cook lslands 8 Federated States of Micronesia 9 Fiji lslands
10 French Polynesia 1 1 Guam
12 Kiribati 13 Marshall lslands 14 Nauru 15 New Caledonia 16 Niue
17 Palau
18 Papua New Guinea 19 Samoa 20 Solomon lslands 21 Tonga
22 Tuvalu 23 Vanuatu 24 Wallis and Futuna
25 References
Acknowledgements
The TB section of the Secretariat of the Pacific Community would like to acknowledge the following people:
MS Sandra Clowning' and Dr Helen Cox The Burnet Institute for Medical Research and Public Health, Melbourne, Australia and Australian National University, Canberra, Australia. '
Mr Mark Lambert, The Global Fund to Fight AIDS, Tuberculosis and Malaria section, Secretariat of the Pacific Community, Noumea, New Caledonia.
Mr Gregory Keeble, Statistics and Demography Programme, Secretariat of the Pacific Community, Noumea, New Caledonia.
Acronyms
AIDS
AS
CDR Cl
CNMl DOTS EPTB
FJ FP FSM GFATM
GU HIV
KI MI
NA
NC NI P A
PlCT
PNG PTB
SA SI
SPC SS+ve SS-ve
TB
TO
TU W F
WHO
acquired immune deficiency syndrome
American Samoa case detection rate Cook lslands
Commonwealth of the Northern Mariana lslands directly observed treatment short-course extra-pulmonary tuberculosis
Fiji lslands French Polynesia Federated States of Micronesia
Global Fund to Fight AIDS, Tuberculosis and Malaria
Guam human immunodeficiency virus
Kiribati Marshall lslands
Nauru
New Caledonia Niue Palau
Pacific Island countries and territories
Papua New Guinea pulmonary tuberculosis
Samoa Solomon lslands Secretariat of the Pacific Community
sputum smear positive sputum smear negative
tuberculosis
Tonga
Tuvalu Wallis and Futuna
World Health Organization
Definitions
Registration categories
New
Relapse
Treatment after failure
Treatment after default
Transfer in
Other
A patient who has never had TB treatment or has taken anti-TB drugs for less than one month.
A patent previously treated for TB who has been declared cured or treatment completed, and is diagnosed with bacteriologically positive (positive smear or culture) TB.
A patient who is started on a re-treatment regimen after having failed a previous treatment.
A patient who returns to treatment, positive bacteriologically, following interruption of treatment for two months or more.
A patient who has been transferred from another TB register to continue treatment.
All cases that do not fit the above definitions, and includes chronic cases. A chronic case is defined as a patient who is sputum positive at the end of a re-treatment regimen.
Treatment outcomes in smear positive TB patients
Cure
Treatment completed
Treatment failure
Died
Default
Transfer out
A patient who is smear negative in the last month of treatment and on at least one previous occasion.
A patient who has completed treatment but who does not meet the criteria to be classified as a cure or failure.
A patient who is smear positive at five months or later during treatment. Also, a patient who was initially smear negative before starting treatment and became smear positive after completing the initial phase of treatment.
A patient who dies for any reason during the course of treatment.
A patient whose treatment was interrupted for two or more consecutive months.
A patient who has been transferred to another recording and reporting unit and for whom the treatment outcome is not known.
Foreword
Tuberculosis has caused immense human suffering throughout history and is still a significant public health problem globally. In 2006, there were an estimated 9.2 million new cases of TB worldwide and 1.7 million people died from the disease. In addition, 0.7 million people with TB also had HIV and 0.5 million people had multi-drug resistant TB, a form of TB that has to be managed over a long period, often with a poor outcome.
Pacific Island people are not immune from the scourge of TB. In the 22 island countries and territories that are members of the Secretariat of the Pacific Community (SPC), 14,026 new cases of TB occurred in 2006, and in 2005, 166 people with infectious TB died. Rates of TB in the Pacific have remained relatively stable over time but have increased slightly in recent years, notably in Micronesia. Forty-three per cent of all TB cases in the Pacific occur in young people in the 15-34 age group. This distutbing statistic calls for further strengthening of action in the fight against TB in the region and is a strong reminder that countries and agencies must intensify their efforts.
In the Pacific region, the 'Strategic Plan to Stop TB in the Western Pacific 2006-2010 (WHO)' provides the framework for reducing the prevalence and mortality of TB by half by 2010 relative to 2000, and SPC continues to work closely with Pacific countries and territories, WHO, CDC and other agencies and partners to achieve these goals. This report complements the World Health Organization's Tuberculosis control in the Westem Pacific Region' 2008 report and the 'Global Tuberculosis Control 2008 Suweillance, Planning and Financing' report by providing a more in-depth analysis of progress in TB control since the implementation of the DOTS strategy in the Pacific since 2000.
SPC's vision for the region is 'a secure and prosperous Pacific community, whose people are educated and healthy and manage their resources in an economically, environmentally and socially sustainable way'. As part of achieving this vision, we are committed to enhancing efforts towards eliminating TB as a public health problem in the Pacific. This is an ambitious but achievable aim and I commend the efforts of all those who work towards it and affirm our continued support for them and for the Pacific people and communities they serve.
I
Dr Jimmie Rodgers Director-General
vii


1 Executive Summary
1.1 Background Tuberculosis (TB) is a major cause of illness and death worldwide. In 2006, there were an estimated 9.2 million new TB cases (1391100,000 population) and 1.7 million deaths from TB. In that same year, the 22 Pacific Island countries and territories (PICTs) served by the Secretariat of Pacific Community (SPC) reported 14,026 new TB cases (1531100,000 population). SPC's Tuberculosis Control Section has been collecting TB data since the section's inception in 1998. TB cases are reported to each PICT's national TB control programme, which in turn provides quarterly reports to SPC. Data are verified to the extent possible, and analysed.
The data suggest that whilst the Pacific region as a whole has made some progress in controlling the deadly disease, TB cases continue to gradually increase and remains a major threat to Pacific peoples' health and lives.
1.2 TB data for the Pacific The monitoring of TB through the recording and reporting of accurate data in the Pacific region is essential to TB control programme efforts. This report draws attention to a number of issues, including increasing case notifications in Micronesia, a low proportion of sputum smear positive (SS+ve) cases in new pulmonary TB (PTB) notifications, and a high proportion of extra-pulmonary (EPTB) cases. Further investigation into these findings is required to fully understand the epidemiology of TB in the region. This report is SPC's first comprehensive report on TB trends in the 22 PlCTs using SPC's TB database as the primary source of data. When SPC data were incomplete, data were sourced from the World Health Organization (WHO) reports.
It is timely to take a closer look at TB trends in Pacific countries, especially to understand progress made towards regional targets stipulated in the Strategic Plan to Stop TB in the Western Pacific 2006-201 0.
1.3 Case notifications The 2006 TB total case notification rate (new and previously treated cases) for the Pacific region (excluding Papua New Guinea - PNG) was 54 casesl100,000 population. This was up slightly from 2005 (52 cases1100,000 population), continuing the very gradual upward trend from 2000. In contrast to the Melanesian and Polynesian subregions, which reported relatively stable notification rates, Micronesia reported an almost 40% increase in notification rates from 104 cases11 00,000 population in 2000 to 145 cases/100,000 population in 2006. In countries where there is the directly observed treatment short-course (DOTS) strategy, WHO expects that SS+ve notifications should account for >50% of all TB cases and >65% of new PTB cases.' In the Pacific region (excluding PNG), 54% of new PTB cases notified in 2006 were SS+ve (Melanesia 50% Micronesia 51% and Polynesia 54%). When PNG data are included, these proportions decrease to 26% in Melanesia and to 28% in the Pacific region. This can be attributed to the large number of notifications and low number of SS+ve cases reported from PNG where DOTS is not fully implemented. In 2006, 25% of TB cases were reported as EPTB (33% including PNG), which is considerably higher than the 12% reported globally.2 There was marked variation across the region: Melanesia 23% (33% including PNG), Micronesia 28% Polynesia 15%. Possible reasons for this finding include a high rate of HIV (not likely except for PNG) and more likely an over-diagnosis of EPTB. In 2006, 43OA of all new SS+ve case notifications in the Pacific region were in the 15-34 year age category, with a relatively even sex distribution across all age ranges. In contrast,
1 World Health Organization 2008.

Micronesia reported an unequal sex distribution of new SS+ve cases; 61% were males and 39% were females, although not all Micronesian countries reported age and sex data. Kiribati reported the greatest difference in sex distribution (66% males and 34% females). This result warrants further investigation to determine if it is a true representation of TB epidemiology in Kiribati, or a reflection of biased case detection.
1.4 Case detection The Strategic Plan to Stop TB in the Western Pacific 2006-2010 (WHO 2006) sets a case detection rate (CDR) target of more than 70% by 2010. Further, the strategy states that the case detection rate must be increased to at least 80% to achieve the targets in the Strategy. Using WHO estimated SS+ve incidence data, the Pacific region achieved a 66% CDR (32% including PNG data) in 2006; Melanesia 54% (30% including PNG data), Micronesia 81% and Polynesia 77%. Assessing CDRs is difficult because estimating incidence in small populations with limited data is problematic. An indirect assessment of case detection can be derived from monitoring the number of screened TB suspects who are smear or culture positive, which can assist in interpreting CDRs. In countries where TB is endemic and the control programme is operating effectively, it is expected that approximately 10% of screened suspects will have a smear or culture positive resu~t .~ In the Pacific region, the proportion of suspects screened in 2006 who were found to be smear or culture positive (excluding PNG) was 12% on average (Melanesia 1 l%, Micronesia 16%, Polynesia 8%). Of note are the high rates reported from Fiji (26%) and Kiribati (22%) in 2006, which are consistent with those reported in previous years. These high rates suggest that case detection may be improved by screening more suspects, however, validation of these results is required.
1.5 Treatment outcomes A target of 'Beyond 85% cure rate' has been set by the WHO Strategic Plan to Stop TB in the Western Pacific 2006-2010. The Pacific region (excluding PNG) achieved an 85% treatment success rate for the 2005 cohort (Melanesia 82% Micronesia 91% Polynesia 81%). Including data from PNG, the Melanesian treatment success rate decreased to 58% and the Pacific region rate to 63%. In this 2005 cohort, 108% of cases (excluding PNG) had treatment outcomes recorded, reflecting the fact that eight PlCTs reported more outcomes than notifications. The overall trend since 2000 for reporting outcomes and treatment success rates has been positive.
l . 6 Mortality Globally, the 2005 cohort of new SS+ve cases treated under DOTS had a death rate of 4.3%. This is in contrast to the Pacific subregional SS+ve death rates of 13% in Polynesia, 6% in Micronesia and 9% in Melanesia (4% including PNG). The Pacific region overall reported a SS+ve death rate of 8% (4% when PNG data were included). Actual numbers of deaths reported in the Pacific were lower than WHO estimates.
1.7 Future steps Based on this report's findings and on recommendations from a separate report on data issues, SPC plans to place greater emphasis on collecting high quality TB data from PICTs. To ensure this, SPC will work with PlCTs to improve recording and reporting, and will revise its own data collection processes. Starting in 2009, SPC will collect additional TB data and their data collection form is currently being revised in preparation for this. SPC will continue to work closely with its agency partners (i.e. WHO and the Centers for Disease Control and Prevention - CDC) to ensure that recording and reporting requests are minimised and harmonised. Finally, SPC plans to ensure that TB data are disseminated regularly to PlCTs in the form of annual reports and other forms of communication.
2 Reichmann and Hershfield 2000.
Pacific Region
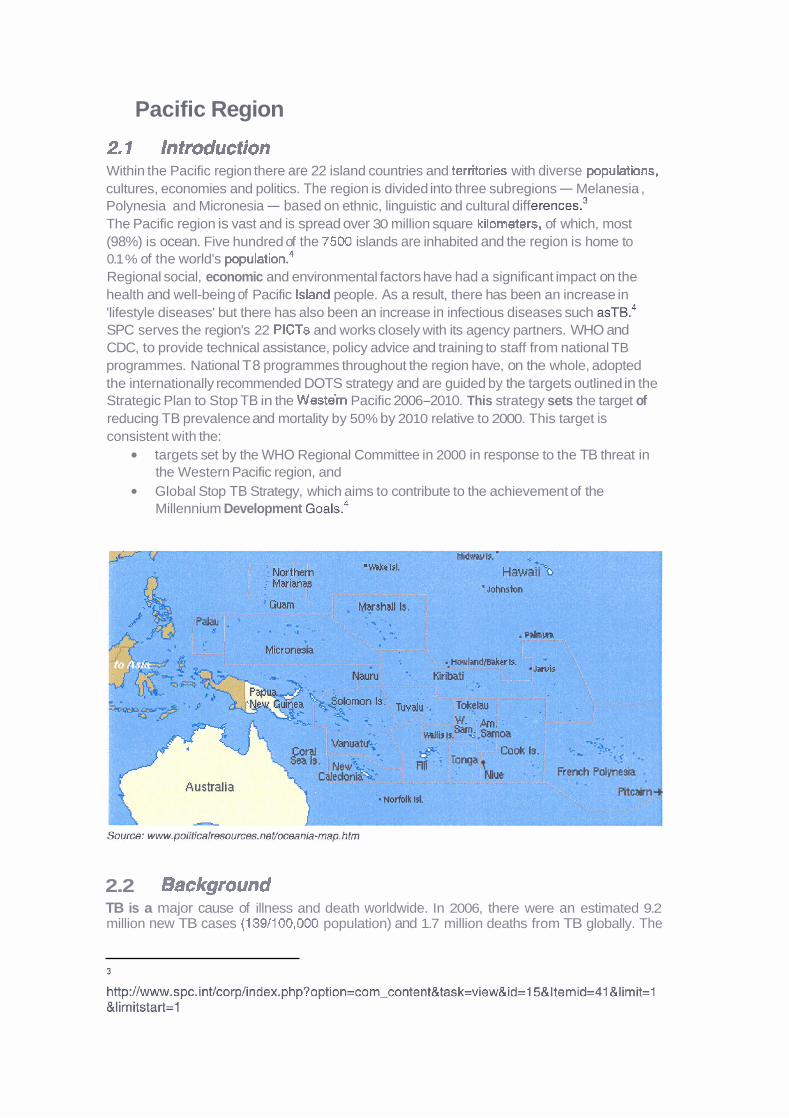
2.1 Introduction Within the Pacific region there are 22 island countries and territories with diverse populations, cultures, economies and politics. The region is divided into three subregions - Melanesia , Polynesia and Micronesia - based on ethnic, linguistic and cultural diff e ren~es.~ The Pacific region is vast and is spread over 30 million square kilorneters, of which, most (98%) is ocean. Five hundred of the 7500 islands are inhabited and the region is home to 0.1 % of the world's popu~ation.~ Regional social, economic and environmental factors have had a significant impact on the health and well-being of Pacific Island people. As a result, there has been an increase in 'lifestyle diseases' but there has also been an increase in infectious diseases such ~ S T B . ~ SPC serves the region's 22 PlCTs and works closely with its agency partners. WHO and CDC, to provide technical assistance, policy advice and training to staff from national TB programmes. National T8 programmes throughout the region have, on the whole, adopted the internationally recommended DOTS strategy and are guided by the targets outlined in the Strategic Plan to Stop TB in the Westein Pacific 2006-2010. This strategy sets the target of reducing TB prevalence and mortality by 50% by 2010 relative to 2000. This target is consistent with the:
targets set by the WHO Regional Committee in 2000 in response to the TB threat in the Western Pacific region, and Global Stop TB Strategy, which aims to contribute to the achievement of the Millennium Development ~ o a l s . ~
2.2 Background TB is a major cause of illness and death worldwide. In 2006, there were an estimated 9.2 million new TB cases (139/100,000 population) and 1.7 million deaths from TB globally. The
African, Southeast Asian and Western Pacific WHO regions accounted for 83% of total case notifications in 2006. SPC's Tuberculosis Control Section was established within SPC's Public Health Programme in 1998 to develop TB control programmes in four Pacific Island countries. Three years later, the programme expanded to include all French territories, and Niue and Tokelau. Since the involvement of the Global Fund to Fight AIDS, TB and Malaria (GFATM) in the Pacific region in 2003, and in collaboration with WHO and the CDC, SPC's responsibilities for TB prevention and control have now expanded to become region wide (Melanesia, Micronesia and Polynesia).
SPC's Tuberculosis Control Section has been collecting and analysing tuberculosis data since the section's inception in 1998. All PlCTs are now committed to providing data on a quarterly basis. Data recording, reporting and analysis are key aspects of SPC's Tuberculosis Section's capacity building and training activities.
This report covers the period 2000-2006 for the following PICTs: American Samoa, Cook Islands, Commonwealth of the Northern Mariana Islands, Fiji Islands, French Polynesia, Federated States of Micronesia, Guam, Kiribati, Nauru, New Caledonia, Niue, Palau, Papua New Guinea, Republic of the Marshall Islands, Samoa, Solomon Islands, Tonga, Tuvalu, Vanuatu and Wallis and Futuna. No data were available for Pitcairn Islands or Tokelau.
The Macfarlane Burnet Institute for Medical Research and Public Health in Melbourne, Australia, was contracted by SPC to provide epidemiological support in the preparation of this report, and to provide a separate report with recommendations for improving TB data collection in the region. It is envisaged that annual reports will be produced using this report as a template.
The intention of this document is to report on TB data from PlCT national TB programmes. While some programmatic indicators have been covered in this report (e.g. CDR, treatment success rate), other indicators and targets (i.e. those pertaining to TB incidence, prevalence, drug susceptibility testing, and HIV) are not reported on. A separate report on anti-TB drug resistance in the Pacific has been compiled by the Pacific TB Laboratory coordinator.
The five principal indicators used to measure the impact and outcome of national TB programmes are: 1) CDR, 2) treatment success rate (outcome indicators), 3) incidence rate, 4) prevalence rate, and 5) mortality rate (3, 4 and 5 being impact indicators). WHO reports more fully on the incidence, prevalence and mortality rates of TB in its annual Global Tuberculosis Control reports.
It is likely that other indicators will be described in future annual reports produced by SPC, and TB data collection forms are being revised to accommodate this.
Six national TB programmes are in the US-affiliated Pacific Islands, and therefore, also report TB data to CDC, while all PlCTs report TB data to WHO annually.
2.3 Data sources TB control programme data were sourced via the SPC Tuberculosis Control Section database. Where data were not available from this database, WHO data were sourced via the annual Global Tuberculosis Control Surveillance, Planning and Finance ~ e ~ o r t s . ~ A comparison of WHO and SPC notification and outcome data was conducted. Where a difference in case notifications numbers was found, the higher figure was used. Outcome data were primarily sourced from SPC's database, however, when the total number of recorded outcomes was less than the number of notifications, then WHO outcome data were compared, and if a higher number of outcomes were recorded, these data were used. Estimated population data were provided by SPC's Statistics and Demography Programme.
2.4 Case notifications
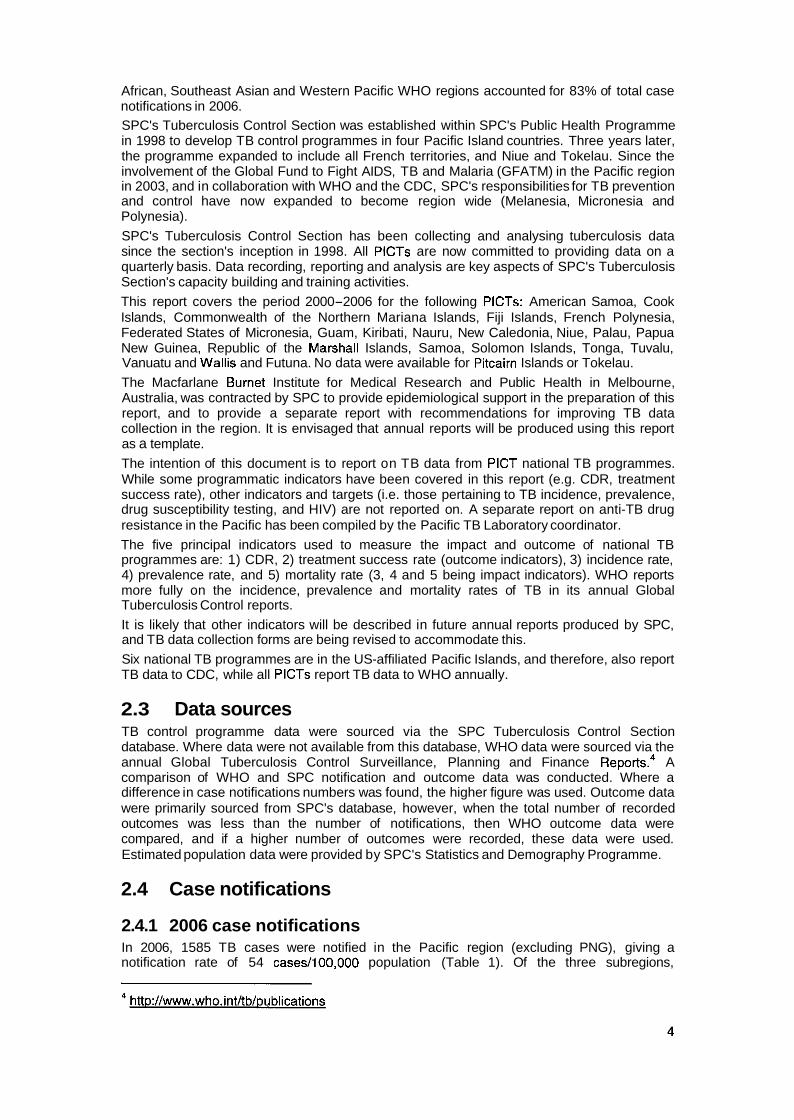
2.4.1 2006 case notifications In 2006, 1585 TB cases were notified in the Pacific region (excluding PNG), giving a notification rate of 54 cases/100,000 population (Table 1). Of the three subregions,

Micronesia reported the highest rate (145 cases1100,OOO population), followed by Melanesia (37 cases1100,OOO population) and Polynesia (22 cases/100,000 population). With PNG data included, the Pacific notification rate increased to 165 cases/100,000 population and the Melanesian rate to 178 cases/100,000 population. Rates varied considerably among PICTs, with Kiribati, Marshall Islands and Papua New Guinea reporting the highest rates (399, 276 and 218 cases1100,000, respectively) and American Samoa, Cook Islands and Wallis and Futuna reporting the lowest rates of 6, 7 and 7 cases/100,000, respectively.
There were similar proportions of notifications that were SS+ve reported across subregions: Melanesia 38% (15% when PNG data were included), Micronesia 34% and Polynesia 42%. DOTS emphasises diagnosis by sputum smear microscopy and WHO expects that approximately 45% of all new and relapse notifications to be SS+ve in DOTS areas5 Among new PTB cases reported, 50% were SS+ve in Melanesia compared with 51% in Micronesia and 54% in Polynesia. When PNG data are included, only 26% of new PTB cases in Melanesia were reported to be SS+ve. WHO expects a minimum of 65% of new PTB cases in DOTS areas to be S S + V ~ . ~ The 2006 notification types as a proportion of all notifications are shown in Figures 1-6. Of note are the differences in EPTB data with Polynesia reporting 15% of all notifications as EPTB compared with Micronesia 28% and Melanesia 23% (33% including PNG data). These rates are higher than the 12% reported globally in 2006.~
5 World Health Organization 2008.
Table 1: TB case notlRcatlons by type In PICTs, by subregion and region: 2006 T m h r
M M ~ W~traatedcw IhklKmn
new Delult Mher Pi A l ~ M h n s pm UwmarpWe S m e a r W k W u l m o n a r y Fdqw & ~ i w previwsly
R. W) SW F l n W bsa[sd
Rate n % Ra$ n % n % n
Yclanerla FJ WC $1
VA PNG TOM
exd, PNG -a
FSM GU
KI MI NA
CNMl PA
Total Polynria
AS Cl
FP N1
SA M TV WF
TOM !'atifre
wrcl. PHG
"Rate = rate per 100,OPO population % = % of all notifications except new PT6 SS+ve; % of which = % of new PT5 reported as SS+ve
Figure 1: Case notifications by type Pacific region, Including PNG, 2006
7% 17% m S&ve
m SS-ve
n m 33% Revbusly treated
Country name abbreviations for all tables in this document are spelled out in the Acronym list.

Figure 2: Case notifications by type, Pacific region, excluding PNG, 2006
1%- I
m SSwe
U SSve
l3 E!'TB
D Reviwsiy treated
h h o w nltransfer In
Figure 3: Case notifications by type, Melanesia, including PNG, 2006
Figure 4: Case notifications by type, Melanesia, excluding PNG, 2006
m RWUUS~ treated
Figure 5: Case notifleatlons by type, Micronesia, 2006
II SS-ve
4a- ra Revbusly treated
M Unlmow n I transf er in
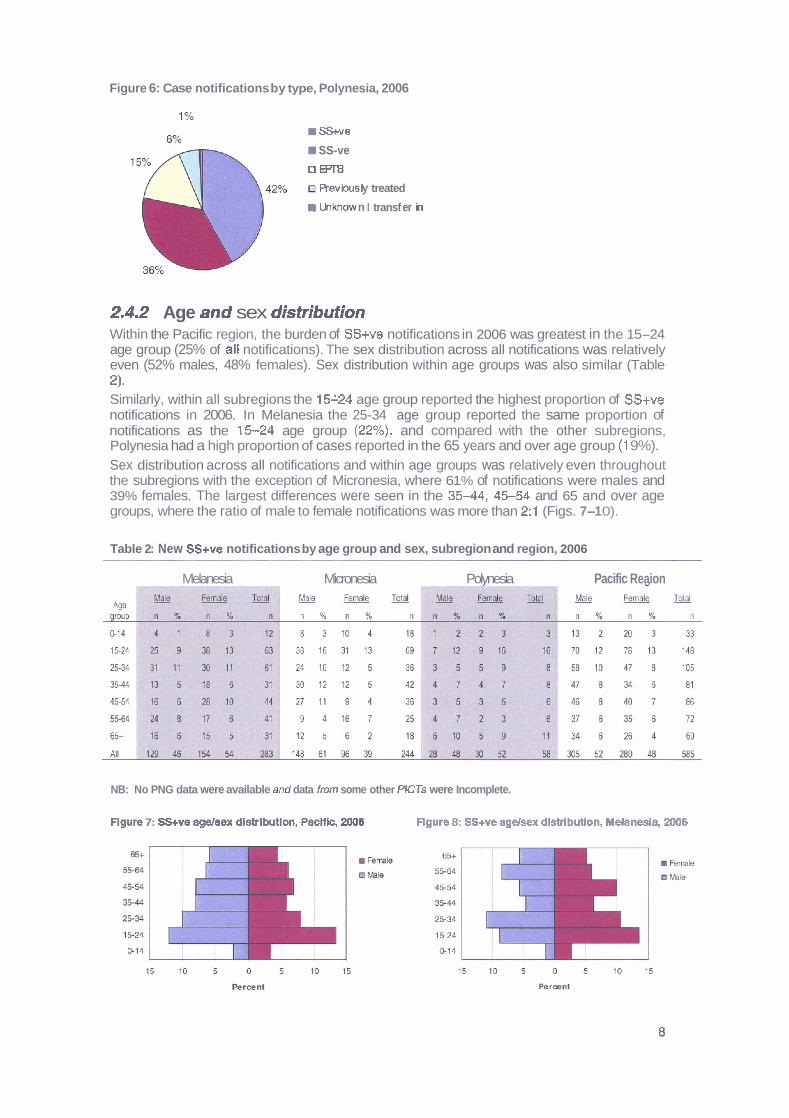
Figure 6: Case notifications by type, Polynesia, 2006
SS+ve
SS-ve
n m a Reviously treated
U1JQIow n I transf er h
2.4.2 Age and sex distribution Within the Pacific region, the burden of SS+ve notifications in 2006 was greatest in the 15-24 age group (25% of all notifications). The sex distribution across all notifications was relatively even (52% males, 48% females). Sex distribution within age groups was also similar (Table 2). Similarly, within all subregions the 15124 age group reported the highest proportion of SS+ve notifications in 2006. In Melanesia the 25-34 age group reported the same proportion of notifications as the 15-24 age group (22%), and compared with the other subregions, Polynesia had a high proportion of cases reported in the 65 years and over age group (1 9%). Sex distribution across all notifications and within age groups was relatively even throughout the subregions with the exception of Micronesia, where 61 % of notifications were males and 39% females. The largest differences were seen in the 3 5 4 4 , 4 5 5 4 and 65 and over age groups, where the ratio of male to female notifications was more than 2:l (Figs. 7-1 0).
Table 2: New SS+ve notifications by age group and sex, subregion and region, 2006
Melanesia Micronesia Polvnesia Pacific Reaion
NB: No PNG data were available am( data from some other PlCTs were Incomplete.
Flgure 7: SS+ve ageisex dlstrlbutlon, PacHlc, 2006 Flgure 8: SS+ve agdsex dlstributlon, Melanesia, 2006
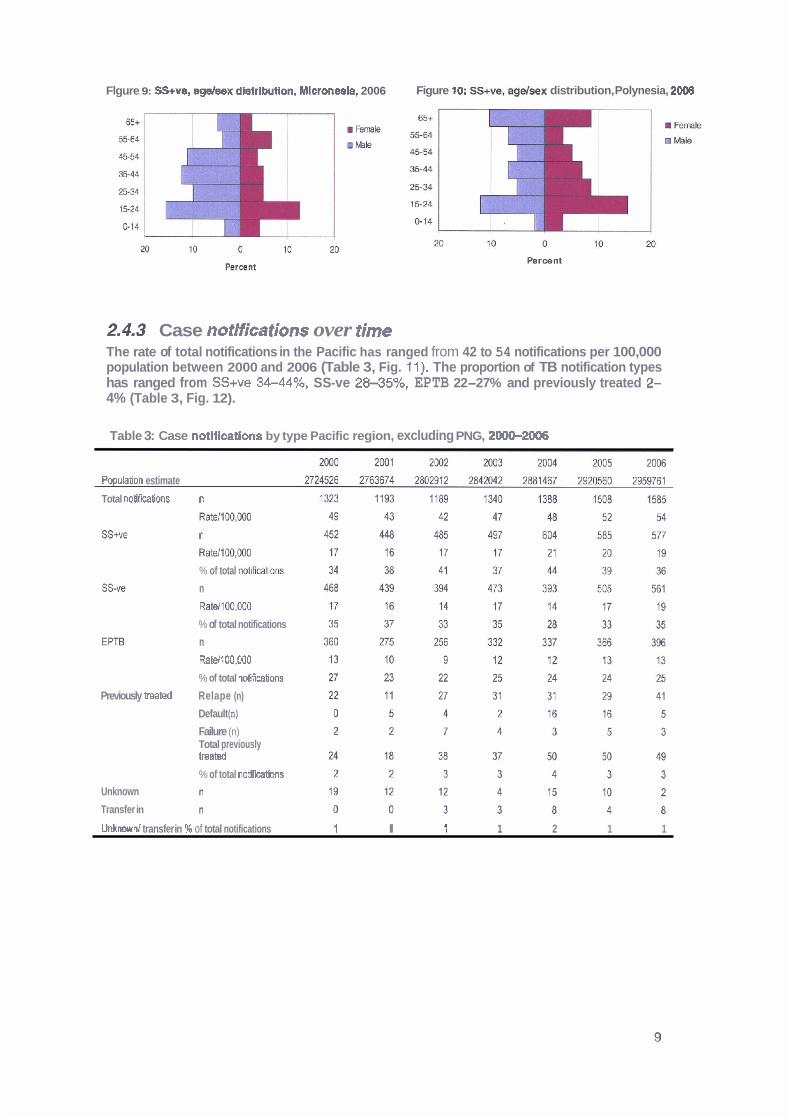
Flgure 9: SS+ve, agdsex dlstrlbution, Mlcronesla, 2006 Figure 10: SS+ve, agdsex distribution, Polynesia, 2008
2,4.3 Case notifications over time The rate of total notifications in the Pacific has ranged from 42 to 54 notifications per 100,000 population between 2000 and 2006 (Table 3, Fig. 11). The proportion of TB notification types has ranged from SS+ve 34-44%, SS-ve 28-35%, EPTB 22-27% and previously treated 2- 4% (Table 3, Fig. 12).
Table 3: Case notifications by type Pacific region, excluding PNG, 200Ck2006
PopulaSon estimate
Total notif~tions n
n
Rale/100,000
% of total nNcations
n
Rate1100,OOO
% of total notifications
n
RaU100,OOO
% of total notificaSons
Previously mted Relape (n)
Default (n)
Failure (n) Total previously treated % of total notifications
Unknown
Transfer in
Unknown1 transfer in % of total notifications Z l 1 1 2 1 1
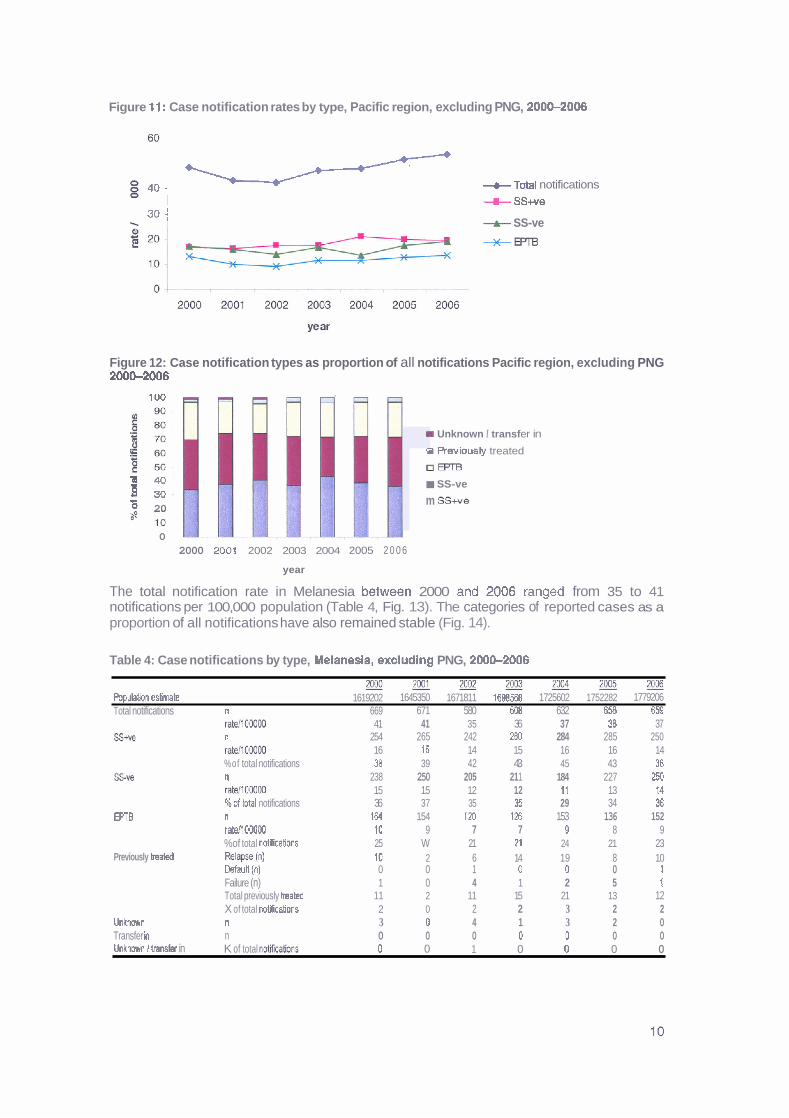
Figure 11: Case notification rates by type, Pacific region, excluding PNG, 200C2006
5 8 4 0 - +Total notifications i + SS+ve
3 0 i + SS-ve
+m
Figure 12: Case notification types as proportion of all notifications Pacific region, excluding PNG 200&2006
1 0 0
m Unknown I transf er in
s R e v ~ o u s l y treated
O W r B 1 40; SS-ve fl 304
*d 20 m S h e
0
2000 2003 2002 2003 2004 2005 2 0 0 6
year
The total notification rate in Melanesia between 2000 and 2006 ranged from 35 to 41 notifications per 100,000 population (Table 4, Fig. 13). The categories of reported cases as a proportion of all notifications have also remained stable (Fig. 14).
Table 4: Case notifications by type, Melanesla, excluding PNG, 200G2006
~ m J ~ 2 & 3 2 0 0 4 m 2 W 6 Popubbn eslimate 1619202 1645350 1671811 1698568 1725602 1752282 1779206 Total notifications n 669 671 580 608 632 6% 659
SS*
S W
EPTB
Previously hated
mtd1000MI 41 41 35 36 37 38 37 n 254 265 242 260 284 285 250 rate/IOCOcQ 16 16 14 15 16 16 14 %of total notifications 38 39 42 43 45 43 38 n 238 250 205 21 1 184 227 250 ratei1000W 15 15 12 12 11 13 14 %of lntal notifications 36 37 35 35 29 34 36 n 164 154 120 126 153 136 152 ~ 1 0 0 0 0 0 10 9 7 7 9 8 9 %of total notifications 25 W 21 21 24 21 23
(n) 10 2 6 14 19 8 10 Default (0) 0 0 1 0 0 0 1 Failure (n) 1 0 4 1 2 5 1 Total previously hated 11 2 11 15 21 13 12 X of total mfications 2 0 2 2 3 2 2
Unlcnow n n 3 0 4 1 3 2 0 Transfer h n 0 0 0 0 0 0 0 Unknwrn / trahsfer in K of total noiikathns 0 0 1 0 0 0 0

Flgure $3: Case notification rates by type, Melanesia, excluding PNG, 2000-2006
+ Total notifications
+ SSwe
Figure 14: Case notlficatlon types as a percent of total notifications, Melanesia, excluding PNG, 2000-2006
100 i
I Unltnow n I transfer in U Reviowly treated
o m m SS-v9
m SS+ve
0 - >
2000 2001 2002 2003 2004 2005 2008
rear
In Micronesia, there was a 73% increase in total notification rates from 84 cases per 100,000 population in 2001, to I45 notificationd100,000 population in 2006 (Table 5). EPTB notification rates showed the greatest increase (2011 00,000 to 41 /100,000) at 105%, followed by SS+ve notification rates with a 100% increase (251100,000 to 501100,000). Notification rates of SS-ve cases rose 37% (35/100,000 to 481100,000) (Fig. 15). There was little variation in TB categories as a proportion of all notifications over this time period (Fig. 16).
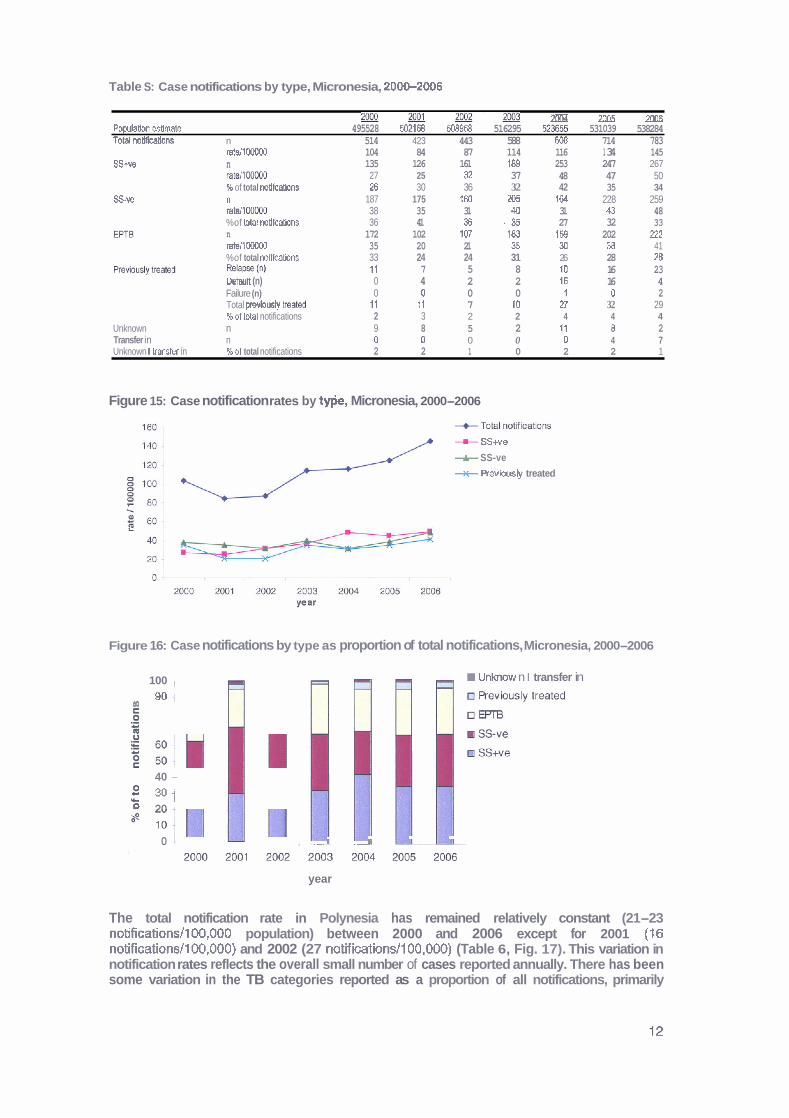
Table S: Case notifications by type, Micronesia, 20W2006
z ! ! I a ! E a - 20W - 2005 - 2006 Population esllmate 495528 502168 508958 516295 5Z3W 531039 538284 Totd notlflcatlons n 514 423 443 588 6-3 714 783
ralell WDD 104 84 87 114 116 1 34 145 S S w n 135 126 161 189 253 247 267
mtsllMx1DD 27 25 9 37 48 47 50 96 of total notlkaMns 26 30 36 32 42 35 34
S v e n 187 175 260 205 164 228 259 ratell WOO0 38 35 31 40 31 U 48 %of total notlfcations 36 41 X . 3 5 27 32 33 n 172 102 107 183 158 202 222 rate110000D 35 20 21 35 30 38 41 %of total mtlfmbns 33 24 24 31 26 28 26 R ~ ~ P W (a) 11 7 5 8 10 16 23 Default (n) 0 4 2 2 16 16 4 Failure (n) 0 0 0 0 1 0 2 Total prevlous~y beat& 11 t l 7 10 n 32 29 %of MtaI notifications 2 3 2 2 4 4 4
Unknown n 9 8 5 2 11 8 2 Transfer in n 0 0 0 0 0 4 7 Unknown I !ranger in %of total notifications 2 2 1 0 2 2 1
Figure 15: Case notification rates by t*, Micronesia, 2000-2006
-m- SSwe
+ SS-ve
+ Revbsty treated
-
Figure 16: Case notifications by type as proportion of total notifications, Micronesia, 2000-2006
100 , Unlmow n I transfer in
(R 90 1
40 -
g 301 r 0 20 2
0 I , I II I---
year
The total notification rate in Polynesia has remained relatively constant (21-23 notificationsll00,000 population) between 2000 and 2006 except for 2001 ( I6 notificationsll00,000) and 2002 (27 notifications/l00,000) (Table 6, Fig. 17). This variation in notification rates reflects the overall small number of cases reported annually. There has been some variation in the TB categories reported as a proportion of all notifications, primarily

influenced by the increase in proportion of previously treated cases reported in 2002 and 2003 (1 2% and 8%, respectively) (Fig. 1 8).
Table 6: Case notifications by type, Polynesia, 2000-2006
2 M l p ~ ~ m m m Population estimate 609496 616156 622143 627179 632210 637240 642271 Total notifications n 140 99 166 144 148 136 143
EPTB
ratellOOOOO 23 16 27 23 23 21 22 SSwe n 63 57 82 ' 4 8 67 53 60
ratellOOOOO 10 9 13 8 l l 8 9 % of total notifications 45 58 49 33 45 39 42 n 43 14 29 57 45 50 52 ratell00000 7 2 5 9 7 8 8 % of total notifications 31 14 17 40 30 37 36 n 24 19 29 23 25 28 22 ratdlOOOO0 4 3 5 4 4 4 3 % of total notiflcatlons 17 19 17 16 17 21 15
Previously treated Relapse (n) 1 2 16 9 2 5 8 Default (n) 0 1 1 0 0 0 0 Failure (n) 1 2 3 3 0 0 0 Total previously treated ' 2 5 20 12 2 5 8 % of total notifications l 5 12 8 1 4 6
Unknown n 7 4 3 1 f 0 0 Transfer in n 0 0 3 3 8 0 1 Unknown l transfer in %of total notifications 5 4 4 3 6 0 1
Figure 17: Case notification rates by type, Polynesia, 2000-2006
.
2000 2001 2002 2003 2004 2005 2006
Year
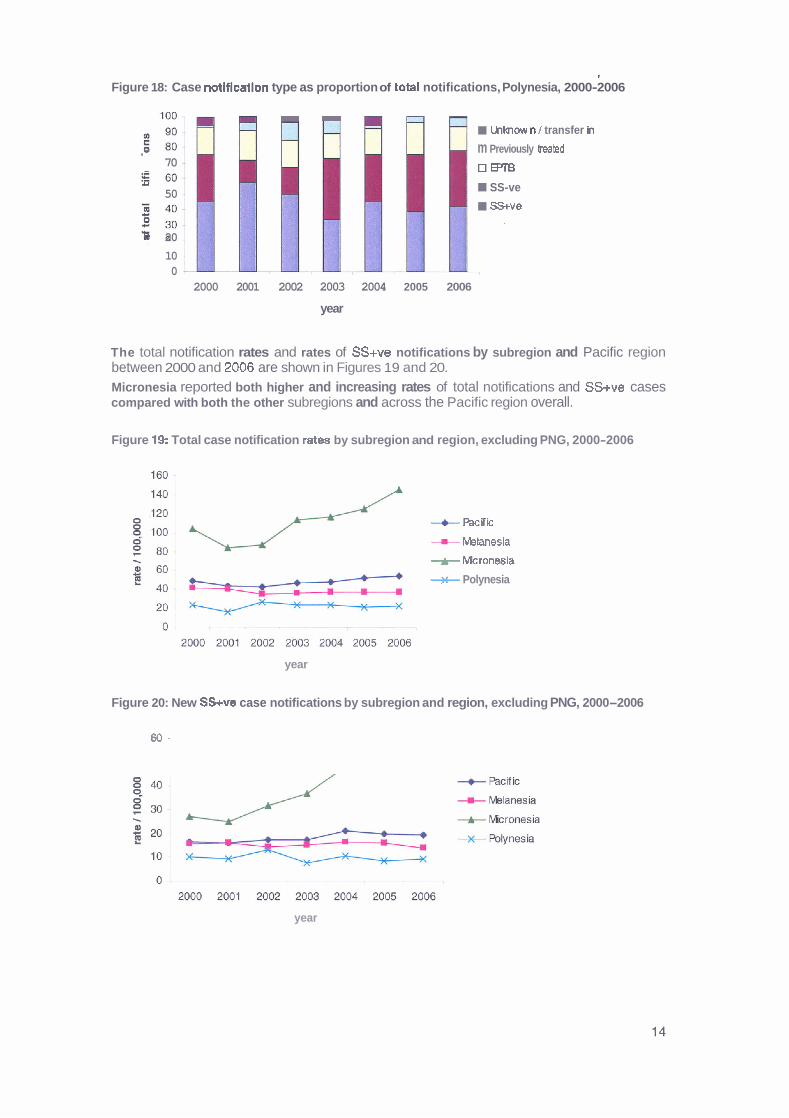
Figure 18: Case notiflcatlon type as proportion of totat notifications, Polynesia, 2000-2006
m m Ullolow n 1 transfer in
.- m Previously lmkd 70 OE'TE
U
50 SS-ve
SS+ve
0 20
10 0
2000 2001 2002 2003 2004 2005 2006
year
The total notification rates and rates of SS+ve notifications by subregion and Pacific region between 2000 and 2006 are shown in Figures 19 and 20.
Micronesia reported both higher and increasing rates of total notifications and SS+ve cases compared with both the other subregions and across the Pacific region overall.
Figure 19: Total case notification rates by subregion and region, excluding PNG, 2000-2006
year
--c hcific
-H- Whnesia
-k- Mcronesia
+ Polynesia
Figure 20: New SS+ve case notifications by subregion and region, excluding PNG, 2000-2006
60;
year

2.5 Case detection CDR, the number of new cases as a proportion of estimated incident cases, is difficult to assess because estimating incidence in small populations with limited data is problematic. Overall, estimated CDR for SS+ve cases in 2006 was 66% (32% including PNG) with considerable variation between PICTs. This variation reflects the very small numbers in most PlCTs and the difficulties of estimating incidence (Table 7). Eight PlCTs reported estimated CDRs of greater than loo%, again a likely reflection on the difficulties of estimating incidence. Another indicator for case detection is the proportion of suspects that are screened and found to be smear or culture positive. In countries where TB is endemic and the TB control programme is operating effectively, it is expected that approximately 10% of screened suspects will have a positive smear or culture resu~t .~ Higher proportions than this suggest that case detection may be improved through screening more suspects. The proportion of all TB suspects undergoing laboratory testing who had a positive smear is shown in Table 8. In 2006, 11% of all laboratory tested suspects in Melanesia had a positive smear compared with 16% in Micronesia, 8% in Polynesia and 12% overall. Compared with other PICTs, Fiji and Kiribati report consistently higher proportions of positive tests, while the Cook Islands, Samoa, and Wallis and Futuna report consistently lower proportions of positive tests. No data were available for Papua New Guinea. WHO recommends that all laboratory suspects be screened with three slides, although countries with a functional external quality assurance system and high work load may reduce screening to two s~ ides .~ Within the Pacific region, 65% of laboratory suspects in 2006 were screened with two or three slides; Melanesia 65%. Micronesia 71% and Polynesia 54% (Table 9). Compared with other subregions, Polynesia reported a higher proportion of laboratory suspects screened with one slide, however both Melanesia and Micronesia had higher proportions of laboratory suspects with slide numbers not reported.
7 Reichmann and Hershfield 2000. 8 hn~://www.who.nWtb/dts/laboratorv/policv/en/index.htmI
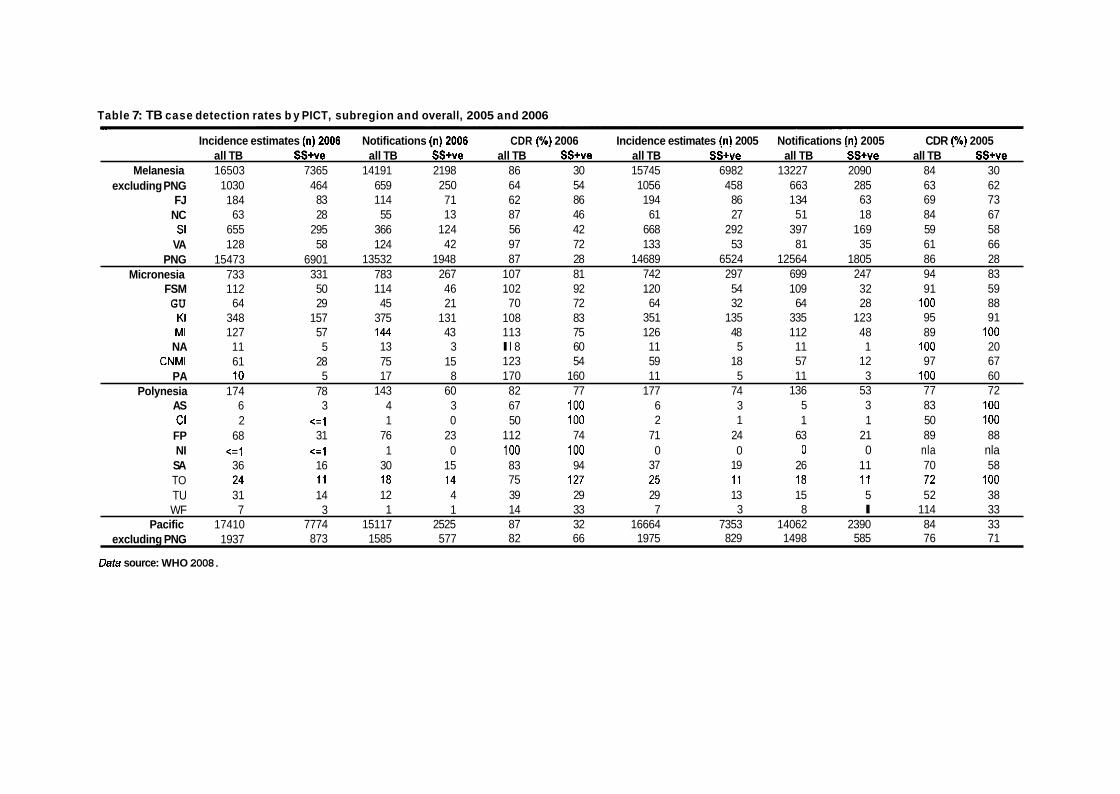
Table 7: TB case detection rates b y PICT, subregion and overall, 2005 and 2006
Incidence estimates in12006 Notifications (nl2006 CDR 1%) 2006 Incidence estimates in1 2005 Notifications (n) 2005 CDR (%) 2005 . . . . . . . . all TB ss+'ve all TB SS+ve all TB SStve all TB S S + " ~ all TB SS+ve all TB SS+ve
Melanesia 16503 7365 14191 2198 86 30 15745 6982 13227 2090 84 30 excluding PNG 1030 464 659 250 64 54 1056 458 663 285 63 62
FJ 184 83 114 71 62 86 194 86 1 34 63 69 73 NC 63 28 55 13 87 46 61 27 51 18 84 67 SI 655 295 366 124 56 42 668 292 397 169 59 58
VA 128 58 124 42 97 72 133 53 81 35 61 66 PNG 15473 6901 13532 1948 87 28 14689 6524 12564 1805 86 28
Micronesia 733 331 783 267 107 81 742 297 699 247 94 83 FSM 112 50 114 46 102 92 120 54 109 32 91 59 GU 64 29 45 21 70 72 64 32 64 28 100 88
KI 348 157 375 131 108 83 351 135 335 123 95 91 MI 127 57 144 43 113 75 126 48 112 48 89 100
N A 11 5 13 3 l l 8 60 11 5 11 1 100 20 CNMl 61 28 75 15 123 54 59 18 57 12 97 67
P A 10 5 17 8 170 160 11 5 11 3 100 60 Polynesia 174 78 143 60 82 77 177 74 136 53 77 72
AS 6 3 4 3 67 100 6 3 5 3 83 100 Cl 2 <=l 1 0 50 100 2 1 1 1 50 100
FP 68 31 76 23 112 74 71 24 63 21 89 88 NI <=I <:l 1 0 100 100 0 0 0 0 nla nla SA 36 16 30 15 83 94 37 19 26 11 70 58 TO 24 11 18 14 75 127 25 11 18 11 72 l o o TU 31 14 12 4 39 29 29 13 15 5 52 38 WF 7 3 1 1 14 33 7 3 8 l 114 33
Pacific 17410 7774 15117 2525 87 32 16664 7353 14062 2390 84 33 excluding PNG 1937 873 1585 577 82 66 1975 829 1498 585 76 71
Data source: WHO 2008.
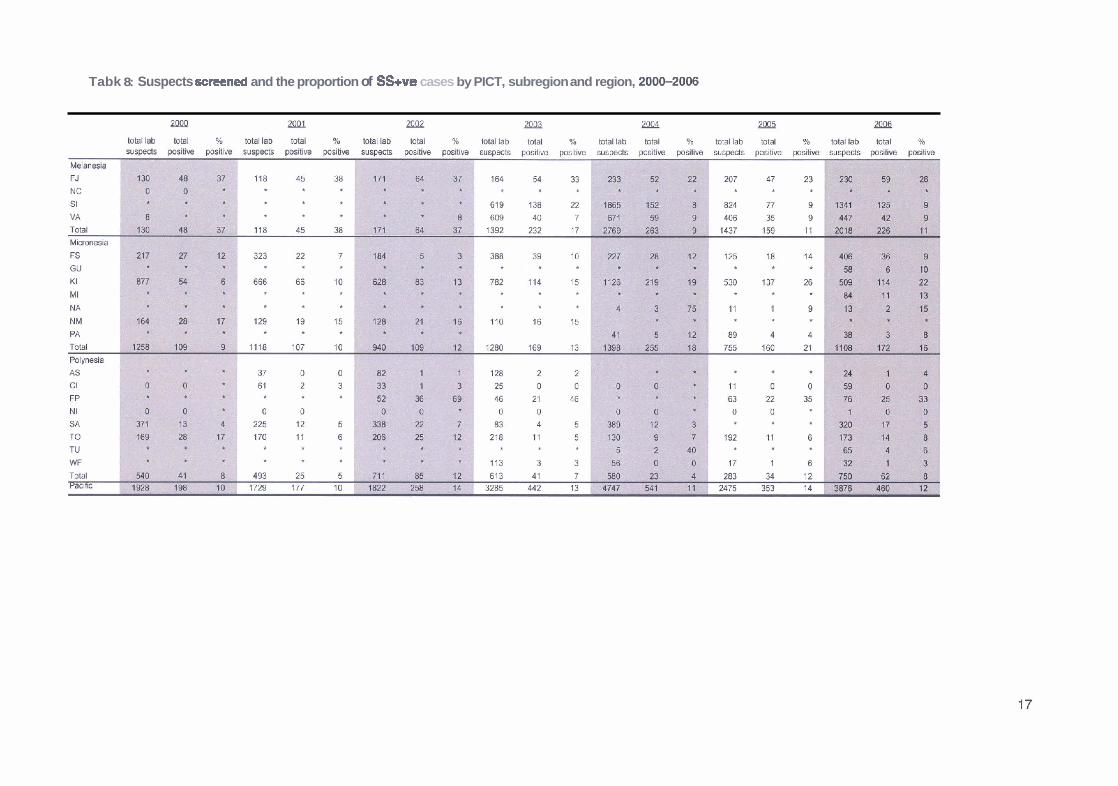
Tabk 8: Suspects screened and the proportion of S%ve cases by PICT, subregion and region, 200CMO06

Table 9: Proportion of laboratory suspects screened with two or three slides by PICT, region and overall, 2006
Total laboratory Suspeclssaeened wth 2or 3 Suspects wth slide numban not Suspects screened u t h 1 sllde
suspects slides reported
n n % n % n Ye
Melanesia FJ 230 94 41 136 59 0 0
NC
S1 1341 149 11 810 60 382 28
VA 447 68 15 369 83 10 2
PNG
Total 2018 311 15 1315 65 392 19
Micronesia FSM 406 10 2 288 71 108 27
Total 1108 69 6 787 71 252 23
Polynes~a AS 24 16 67 4 17 4 17
n o t reooeed
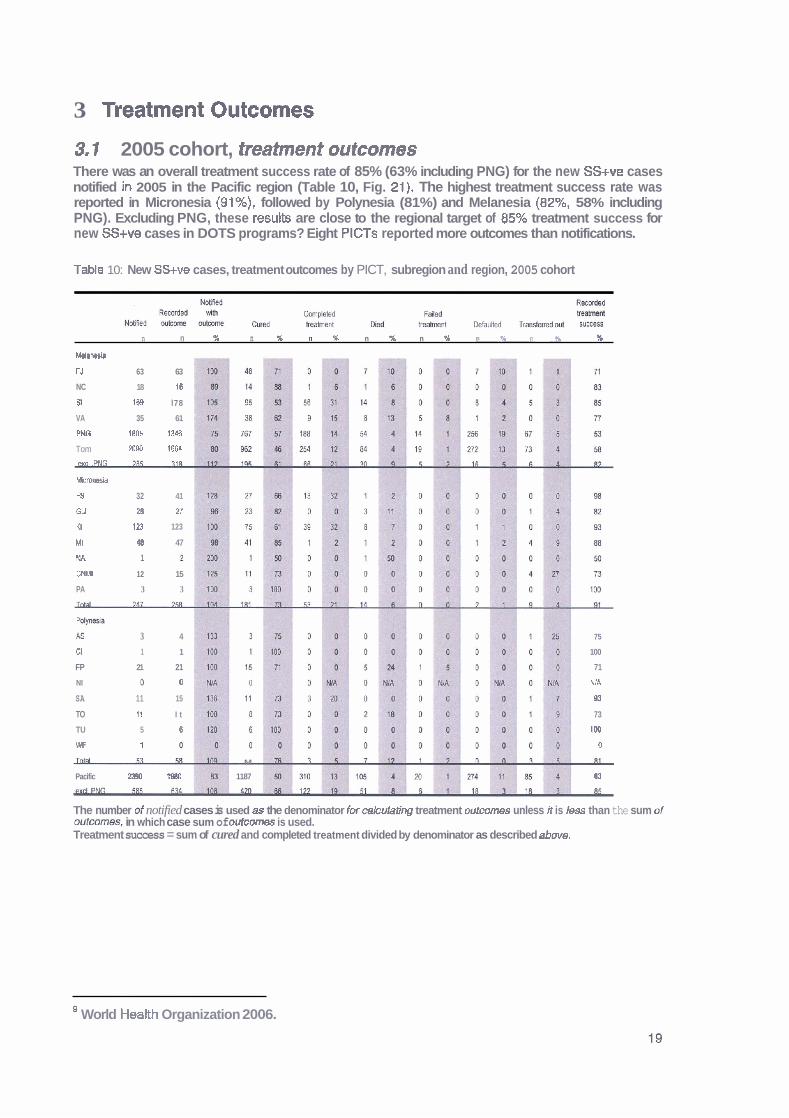
3 Treatment Outcomes
3.1 2005 cohort, treatment outcomes There was an overall treatment success rate of 85% (63% including PNG) for the new SS+ve cases notified in 2005 in the Pacific region (Table 10, Fig. 21). The highest treatment success rate was reported in Micronesia (91%), followed by Polynesia (81%) and Melanesia (82%, 58% including PNG). Excluding PNG, these results are close to the regional target of 85% treatment success for new SS+ve cases in DOTS programs? Eight PlCTs reported more outcomes than notifications.
Table 10: New SS+ve cases, treatment outcomes by PICT, subregion and region, 2005 cohort
n n % n % n # n % n % n % n % ?6
M e l a w
FJ 63 63
NC 18 16
$1 168 l78
VA 35 61
PNG 1805 1346
Tom m40 1664
exel .WG ?M
kmnesia
FS 32 41
GU zo n K I 123 123
MI 48 47
NA 1
CNM 12 15
PA 3 3 - Fdynssia
a 3 4 75
Cl 1 1 100
FP 21 21 71
NI C 0 NIA
SA 11 15 93
TO 11 I t 73
TU 5 6 lW
W 1 0 - M L
Pacific 2340 1880 1187 63
The number of notified cases is used as the denominator for cakulating treatment outcomes unless it is Iess than the sum of outmms, in which case sum of outcomas is used. Treatment success = sum of cured and completed treatment divided by denominator as described above.
World Health Organization 2006.
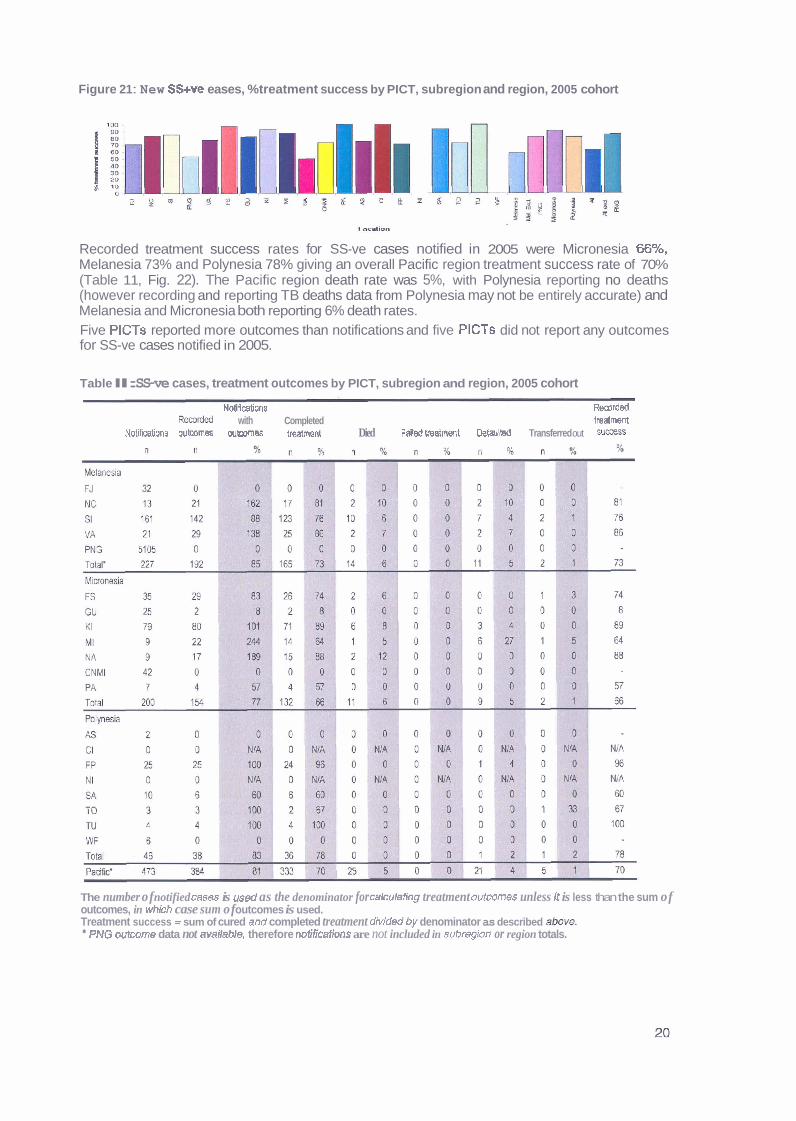
Figure 21 : New SS+ve eases, %treatment success by PICT, subregion and region, 2005 cohort
Recorded treatment success rates for SS-ve cases notified in 2005 were Micronesia 66%, Melanesia 73% and Polynesia 78% giving an overall Pacific region treatment success rate of 70% (Table 11, Fig. 22). The Pacific region death rate was 5%, with Polynesia reporting no deaths (however recording and reporting TB deaths data from Polynesia may not be entirely accurate) and Melanesia and Micronesia both reporting 6% death rates. Five PlCTs reported more outcomes than notifications and five PlCTs did not report any outcomes for SS-ve cases notified in 2005.
Table l l: SS-ve cases, treatment outcomes by PICT, subregion and region, 2005 cohort
NotiCcations Remrdd R&& with Completed treatment
Notifications oubmes wtcomes treatmsnt Died Failed twatment DefauM Transferred out Sumss
The number of notified cases is used as the denominator for calculating treatment outcomes unless # is less than the sum of outcomes, in which case sum of outcomes is used. Treatment success = sum of cured and completed treatment dMded by denominator as described &we. PNG outcome data not available, therefore notifiatlons are not included in subregion or region totals.
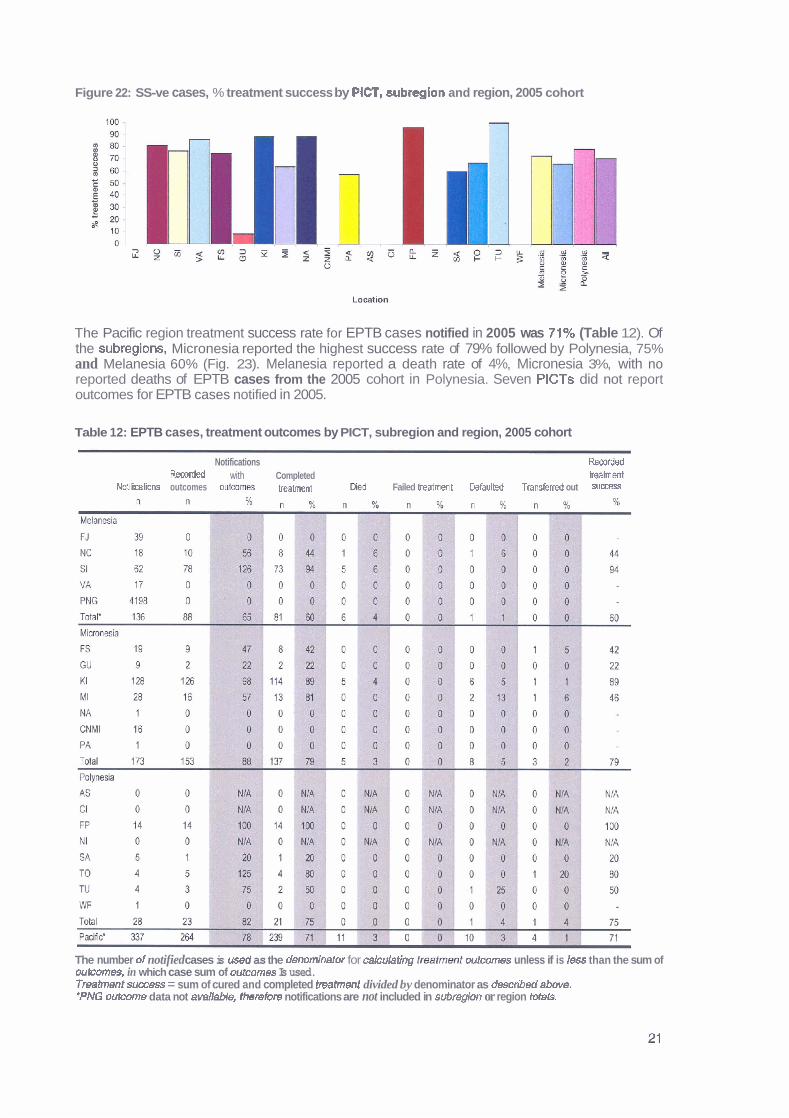
Figure 22: SS-ve cases, % treatment success by PlCT, subreglon and region, 2005 cohort
The Pacific region treatment success rate for EPTB cases notified in 2005 was 71% (Table 12). Of the subregions, Micronesia reported the highest success rate of 79% followed by Polynesia, 75% and Melanesia 60% (Fig. 23). Melanesia reported a death rate of 4%, Micronesia 3%, with no reported deaths of EPTB cases from the 2005 cohort in Polynesia. Seven PlCTs did not report outcomes for EPTB cases notified in 2005.
Table 12: EPTB cases, treatment outcomes by PICT, subregion and region, 2005 cohort
Notifications Rsootdd Recorded with Completed mbnmt
NotikaCons outcomes outwme~ beahent Fed Failed lreatrnent bfaulted T r a n s f e d out sumss
The number d notified cases is used as the denominator for cakulating tmfmmt outcomes unless if is less than the sum of outcomes, in which case sum of outcomes Is used. Tmtrnent s m s s = sum of cured and completed treatment divided by denominator as described abwe. *PNG outcome data not avaIIaMe, thetherefwe notifications are not included in subregIon or region Mals.
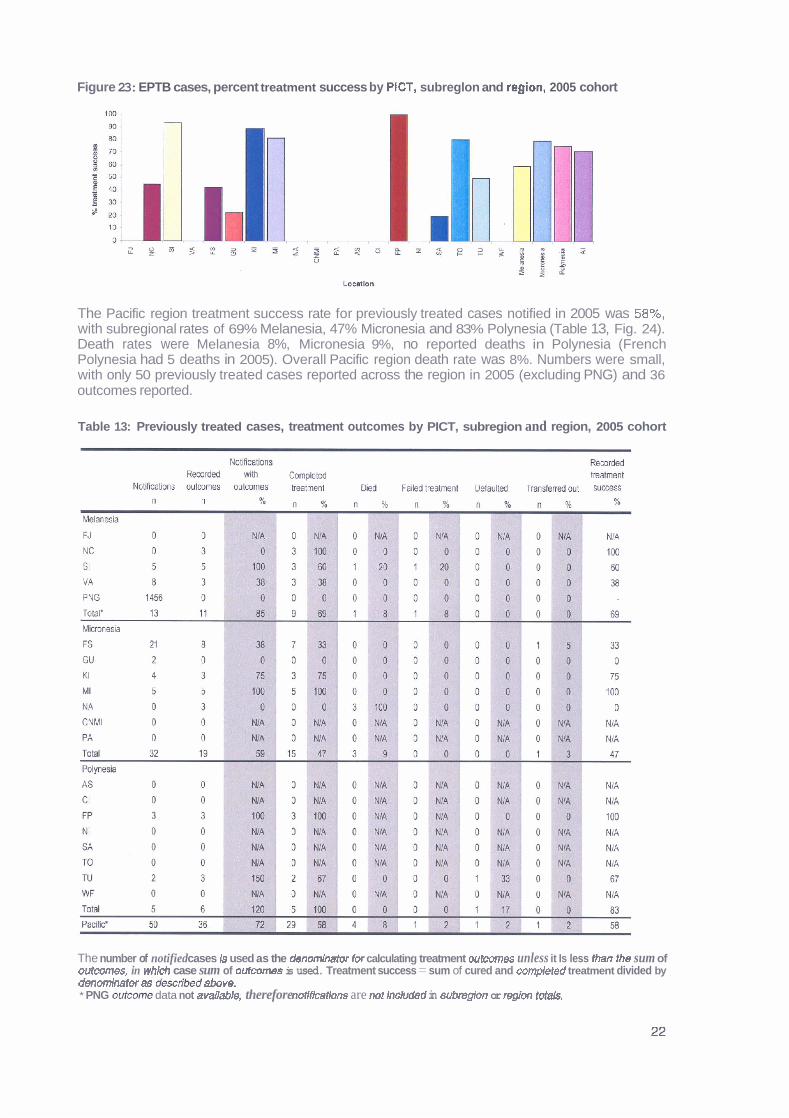
Figure 23: EPTB cases, percent treatment success by PtCT, subreglon and rqion, 2005 cohort
The Pacific region treatment success rate for previously treated cases notified in 2005 was 58%, with subregional rates of 69% Melanesia, 47% Micronesia and 83% Polynesia (Table 13, Fig. 24). Death rates were Melanesia 8%, Micronesia 9%, no reported deaths in Polynesia (French Polynesia had 5 deaths in 2005). Overall Pacific region death rate was 8%. Numbers were small, with only 50 previously treated cases reported across the region in 2005 (excluding PNG) and 36 outcomes reported.
Table 13: Previously treated cases, treatment outcomes by PICT, subregion and region, 2005 cohort
The number of notified cases Is used as the dendmriratw for calculating treatment outcomes unless it Is less Ihan the sum of outcomes, in which case sum of oufcornes is used. Treatment success = sum of cured and coweted treatment divided by denominator as descrJbed above. * PNG outcome data not available, therefore mrtifEcations are nor included in subregion or region fotals.
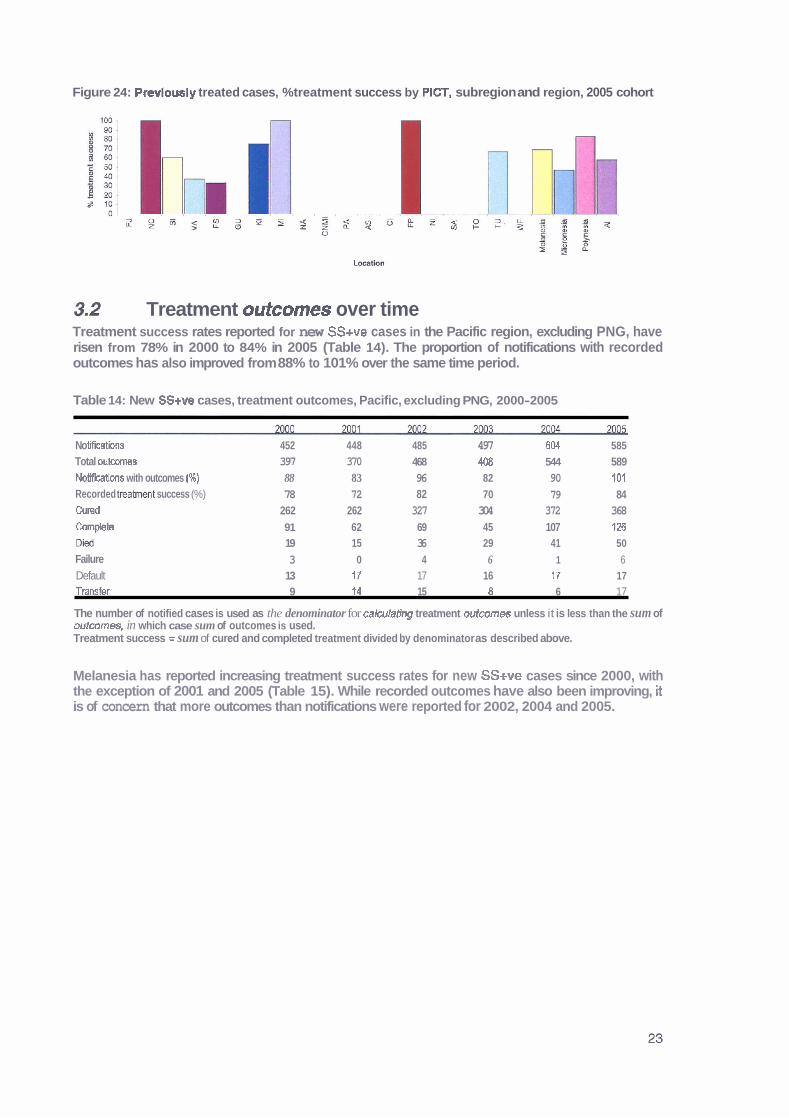
Figure 24: Previously treated cases, %treatment success by PICT, subregion and region, 2005 cohort
Treatment outcomes over time Treatment success rates reported for new SS+ve cases in the Pacific region, excluding PNG, have risen from 78% in 2000 to 84% in 2005 (Table 14). The proportion of notifications with recorded outcomes has also improved from 88% to 101% over the same time period.
Table 14: New SS+ve cases, treatment outcomes, Pacific, excluding PNG, 2000-2005
No Wicat'ms 452 448 485 497 604 585 Total outwmes 397 370 468 408 544 589 Notifcations with outcomes (Z) 88 83 96 82 90 701 Recorded treahent success (%) 78 72 82 70 79 84 Cumd 262 262 327 304 372 368 Cornpbte 91 62 69 45 107 126 Died 19 15 36 29 41 50 Failure 3 0 4 6 1 6 Default 13 l 7 17 16 17 17 Transfer 9 74 15 8 6 17
The number of notified cases is used as the denominator for orkulating treatment outcomes unless it is less than the sum of outcomes, in which case sum of outcomes is used. Treatment success = sum of cured and completed treatment divided by denominator as described above.
Melanesia has reported increasing treatment success rates for new SS+ve cases since 2000, with the exception of 2001 and 2005 (Table 15). While recorded outcomes have also been improving, It is of concern that more outcomes than notifications were reported for 2002, 2004 and 2005.
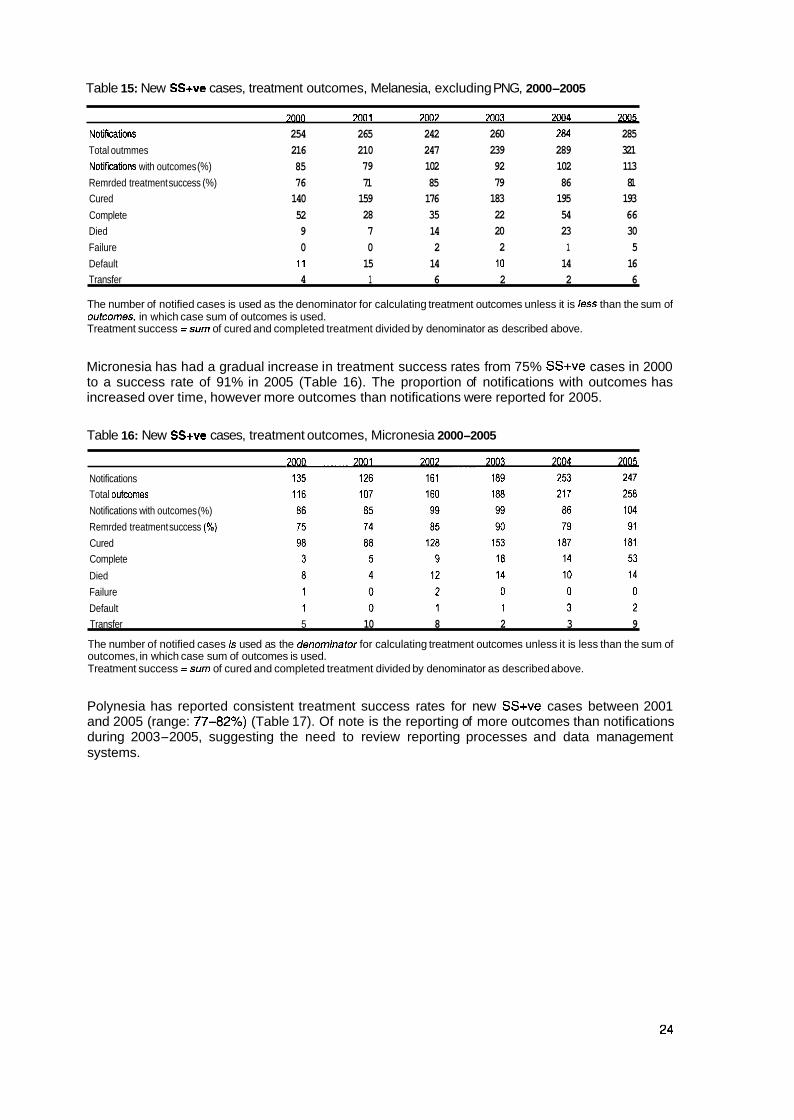
Table 15: New SS+ve cases, treatment outcomes, Melanesia, excluding PNG, 2000-2005
7oon 7001 7007 7002 zw4 2 m
NoGfications 254 265 242 260 284 285
Total outmmes 216 210 247 239 289 321
Notitications with outcomes (%) 85 79 102 92 102 113
Remrded treatment success (%) 76 71 85 79 86 81 Cured 140 159 176 183 195 193
Complete 52 28 35 22 54 66 Died 9 7 14 20 23 30
Failure 0 0 2 2 1 5
Default 1 1 15 14 10 14 16 Transfer 4 1 6 2 2 6
The number of notified cases is used as the denominator for calculating treatment outcomes unless it is less than the sum of outcomes, in which case sum of outcomes is used. Treatment success =sum of cured and completed treatment divided by denominator as described above.
Micronesia has had a gradual increase in treatment success rates from 75% SS+ve cases in 2000 to a success rate of 91% in 2005 (Table 16). The proportion of notifications with outcomes has increased over time, however more outcomes than notifications were reported for 2005.
Table 16: New SS+ve cases, treatment outcomes, Micronesia 2000-2005
Notifications Total outcomes
Notifications with outcomes (%)
Remrded treatment success (%)
Cured Complete
Died
Failure
Default Transfer 5 10 8 2 3 9
The number of notified cases is used as the denominator for calculating treatment outcomes unless it is less than the sum of outcomes, in which case sum of outcomes is used. Treatment success =sum of cured and completed treatment divided by denominator as described above.
Polynesia has reported consistent treatment success rates for new SS+ve cases between 2001 and 2005 (range: 7742%) (Table 17). Of note is the reporting of more outcomes than notifications during 2003-2005, suggesting the need to review reporting processes and data management systems.

Table 17: New SS+ve cases, treatmmt outcomes, Polynesia, 2000-2005
2MIO m1 Notif- 63 57 82 48 67 53 Outcomes recorded 65 53 ?7 85 71 58 Notif- with outmm (%) 103 93 94 l ;rl 106 109 Roorded ~ ~ s u c e e s s (%) 92 77 80 79 82 81 Cured 24 15 33 25 19 44 Complete 26 29 33 42 . 39 3 Oled 2 4 7 5 10 7 F aihre 2 0 0 4 0 1 Default 1 2 4 7 7 0
The number of notifid cases is used as the denominator for calculating treatment outcomes unless It is less than the sum of w t m e s , in whfch case sum of outcomes is used. Treatment success = sum of cured and completed treatment divided by denominator as described above.
Since 2001, treatment success rates for new SS+ve cases have remained relatively consistent across Melanesia and Polynesia. Micronesia has reported improving rates since 2003, with all subregions achieving r80% treatment success rates for the 2005 cohort. (Fig. 25).
Figure 25: New SS+ve cases, percent treatment success by subregion and region, excluding PNG, 200&2005
t 801
! 70; S I m 60 -1 W = 501 E 4 1 + Mcronesia
1 m - -m- p0iynssi.a + Melanesia
+Pacific - ---
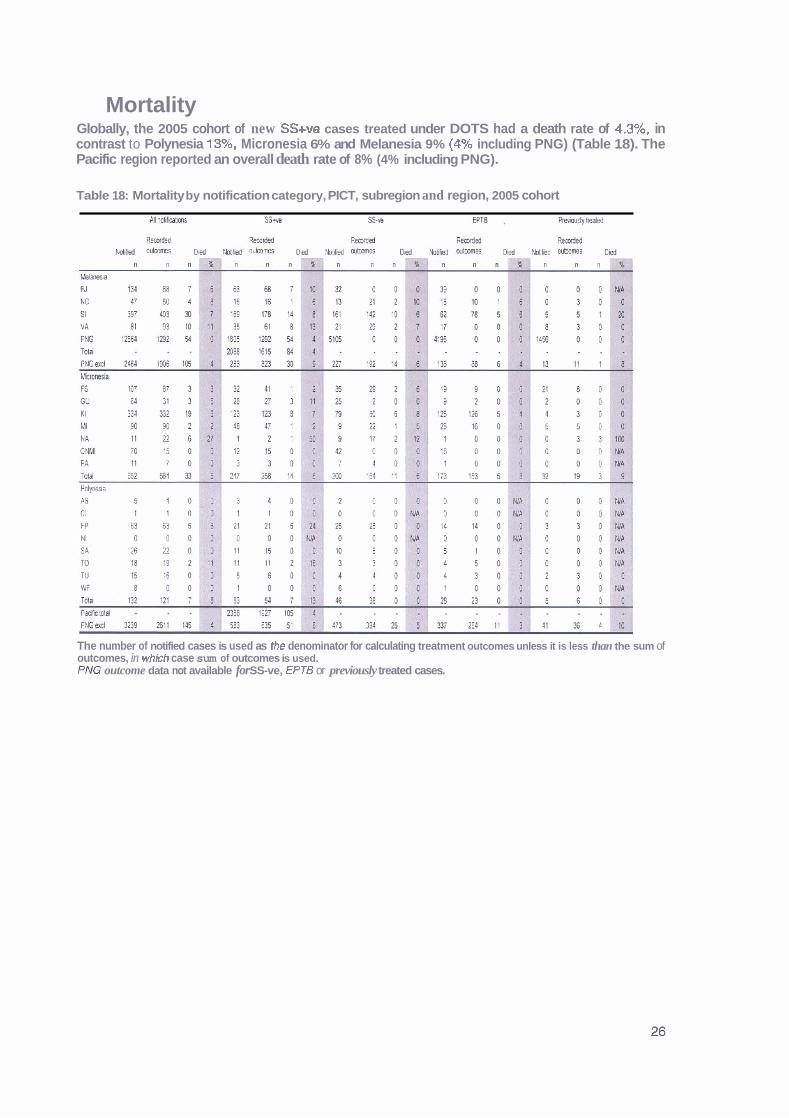
Mortality Globally, the 2005 cohort of new SS+ve cases treated under DOTS had a death rate of 4.3%, in contrast to Polynesia 13%, Micronesia 6% and Melanesia 9% (4% including PNG) (Table 18). The Pacific region reported an overall death rate of 8% (4% including PNG).
Table 18: Mortality by notification category, PICT, subregion and region, 2005 cohort
The number of notified cases is used as the denominator for calculating treatment outcomes unless it is less than the sum of outcomes, in which case sum of outcomes is used. PM3 outcome data not available for SS-ve, EPTB or previously treated cases.

Annually, the WHO estimate expected TB mortality from the product of incident cases and case fatality (the proportion of incident cases that ever die from TB, estimated country by country, for patients treated within or outside DOTS programmes and for patients who receive no recognised anti-TB treatment). The estimated number of deaths in 2005 from TB in Melanesia was 2897, Micronesia 102 and Polynesia 26, which is in contrast to the treatment outcome reported deaths of Melanesia 159, Micronesia 33 and Polynesia 7 (Table 19).
Table 19: Estimated TB mortality (number) by PlCT and subregion, 2005
Melanesia Micronesia Polynesia
Country No. ofdeaths Country No. of deaths Country No. ofdeaths
FJ 31 FSM 16 AS <=l
NC 8 GU 6 Cl <=l
SI 112 KI 49 FP 10
VA 21 MI 20 NI <=l
PNG 2725 NA 2 SA 6
NM 8 TO 3
P A 1 TU 6 WF 1
TOTAL 2897 102 26
c= less than or equal to


Country and Territory profiles

5 American Samoa
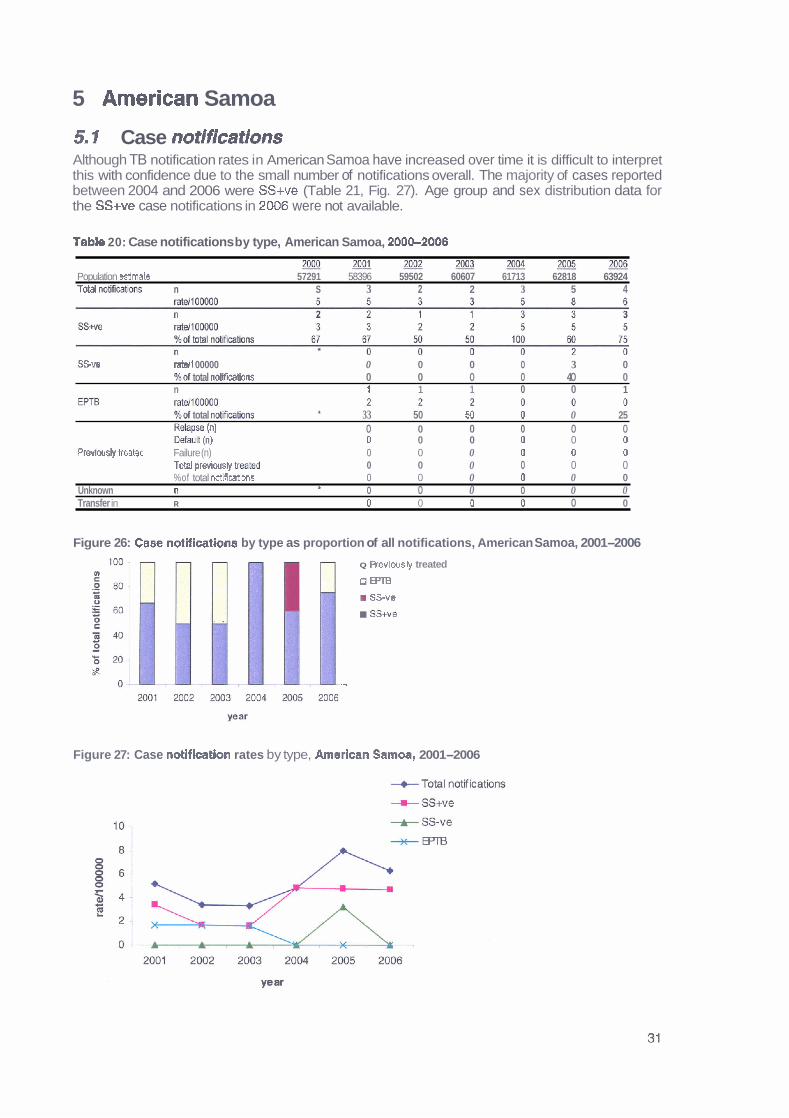
5.1 Case notifications Although TB notification rates in American Samoa have increased over time it is difficult to interpret this with confidence due to the small number of notifications overall. The majority of cases reported between 2004 and 2006 were SS+ve (Table 21, Fig. 27). Age group and sex distribution data for the SS+ve case notifications in 2006 were not available.
Table 20: Case notifications by type, American Samoa, 200Cb2006
2 J J g ~ 2 0 0 2 X J o J ~ Population estimate 57291 58396 59502 60607 61713 62818 63924 Total nMeatiww n S 3 2 2 3 5 4
SSve ratell 00000 0 0 0 0 3 0 %of total no t i fmns 0 0 0 0 40 0 n 1 1 1 0 0 1
%of total notificatims h 33 50 50 0 0 25 RdaPse (n) 0 0 0 0 0 0 Ikfzuh (n) 0 0 0 0 0 0
Previwsly treabd Failure (n) 0 0 0 0 0 0 To$l previously treated 0 0 0 0 0 0 %of total not~fications 0 0 0 0 0 0
Unknown n 0 0 0 0 0 0 t
Transfer in R 0 0 0 0 0 0
Figure 26: Case notifications by type as proportion of all notifications, American Samoa, 2001-2006
Q Revlousv treated
o m m ss-ve
, , SStve
--
Figure 27: Case notlflcation rates by type, Amerlcan Samoa, 2001-2006
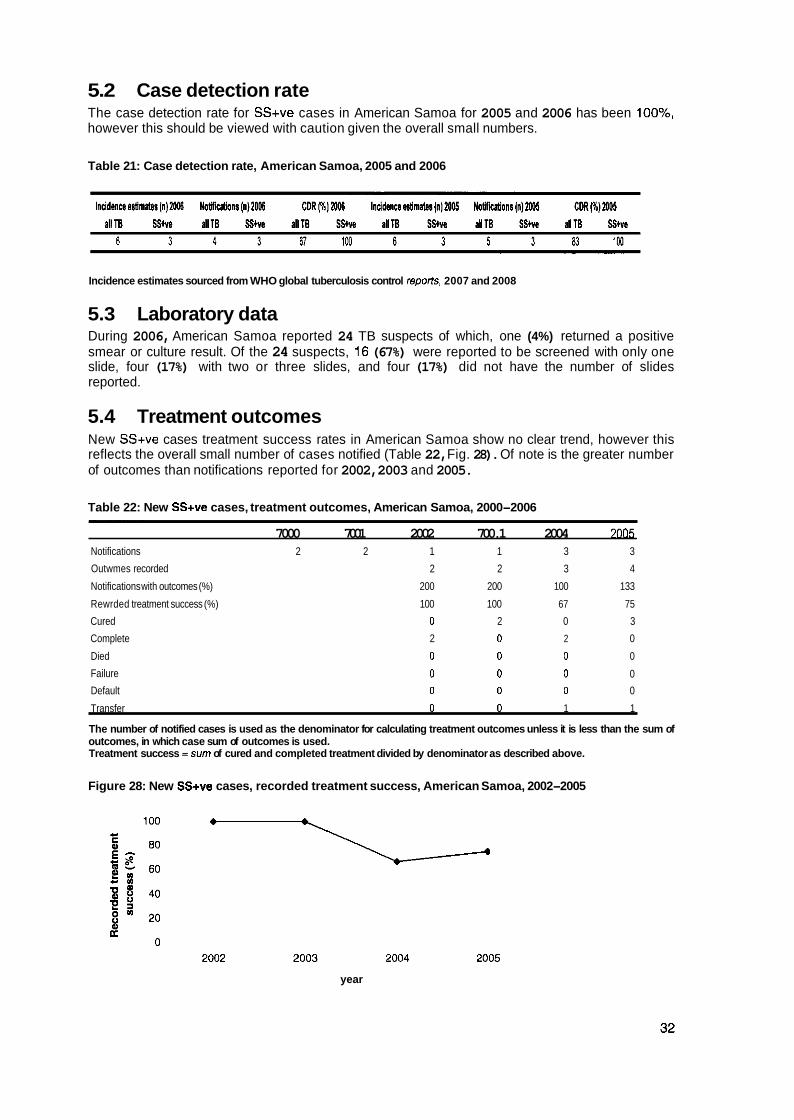
5.2 Case detection rate The case detection rate for SS+ve cases in American Samoa for 2005 and 2006 has been loo%, however this should be viewed with caution given the overall small numbers.
Table 21: Case detection rate, American Samoa, 2005 and 2006
Incidence estimates sourced from WHO global tuberculosis control repoas. 2007 and 2008
5.3 Laboratory data During 2006, American Samoa reported 24 TB suspects of which, one (4%) returned a positive smear or culture result. Of the 24 suspects, 16 (67%) were reported to be screened with only one slide, four (17%) with two or three slides, and four (17%) did not have the number of slides reported.
5.4 Treatment outcomes New SS+ve cases treatment success rates in American Samoa show no clear trend, however this reflects the overall small number of cases notified (Table 22, Fig. 28). Of note is the greater number of outcomes than notifications reported for 2002, 2003 and 2005.
Table 22: New SS+ve cases, treatment outcomes, American Samoa, 2000-2006
7000 7001 2002 700.1 2004 20M Notifications 2 2 1 1 3 3
Outwmes recorded 2 2 3 4
Notifications with outcomes (%) 200 200 100 133
Rewrded treatment success (%) 100 100 67 75
Cured 0 2 0 3
Complete 2 0 2 0
Died 0 0 0 0
Failure 0 0 0 0
Default 0 0 0 0
Transfer 0 0 1 1
The number of notified cases is used as the denominator for calculating treatment outcomes unless it is less than the sum of outcomes, in which case sum of outcomes is used. Treatment success =sum of cured and completed treatment divided by denominator as described above.
Figure 28: New SS+ve cases, recorded treatment success, American Samoa, 2002-2005
year
5.5 Issues identified More outcomes than notifications were reported for 2005 and in the two previous years. Only 17% of laboratory suspects were reported to have been screened with two or three slides although more complete laboratory data may have been reported to CDC. High treatment success rates with most patients cured or completing treatment. No previously treated patients recorded for the whole period.
High CDRs.
SS+ve PT0 cases as a proportion of all PTB cases approximates WHO recommended figure of 65%.1°
5.6 Suggested responses Data management should be examined to determine the reason why there is a discrepancy between notifications and outcomes, and the issue resolved.
Laboratory procedures should be examined to determine whether there is a recording issue or if suspects are truly not being screened using the recommended number of slides.
' O World Health Organization 2008.
6 Commonwealth of the Northern Mariana Islands
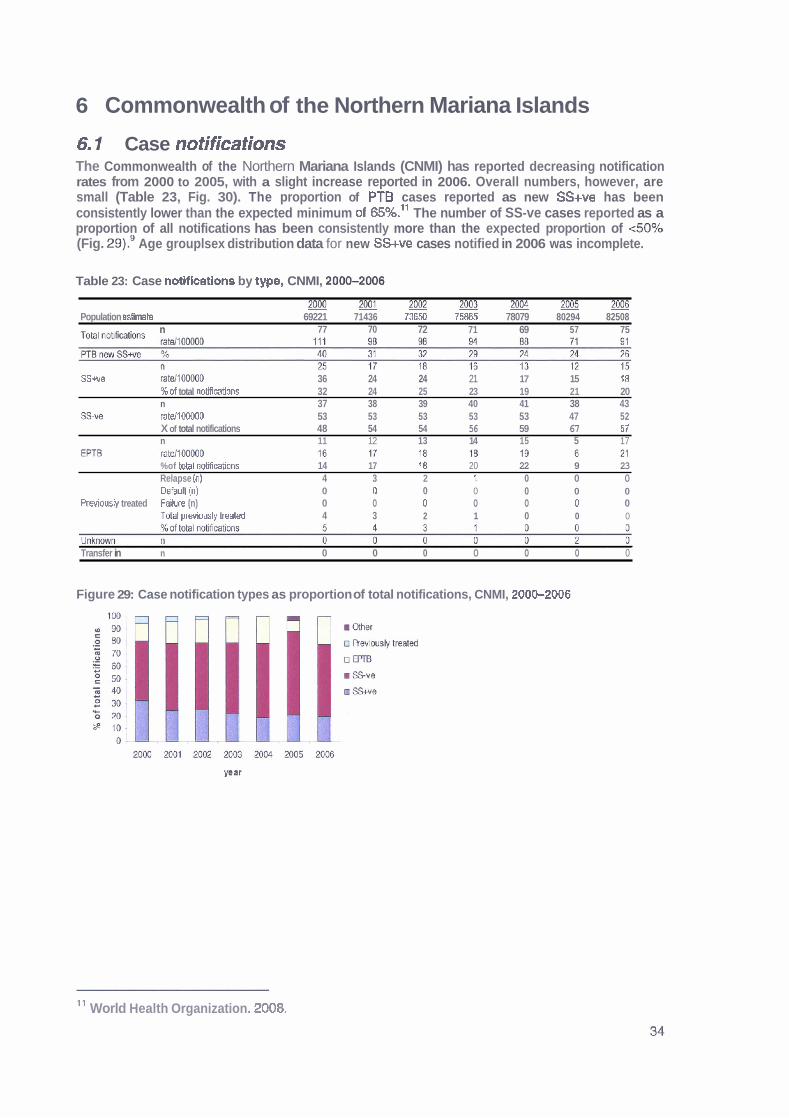
6 1 Case notifications The Commonwealth of the Northern Mariana Islands (CNMI) has reported decreasing notification rates from 2000 to 2005, with a slight increase reported in 2006. Overall numbers, however, are small (Table 23, Fig. 30). The proportion of PT6 cases reported as new SS+ve has been consistently lower than the expected minimum of 65%.11 The number of SS-ve cases reported as a proportion of all notifications has been consistently more than the expected proportion of <SO% (Fig. 29).' Age grouplsex distribution data for new SS+ve cases notified in 2006 was incomplete.
Table 23: Case notifications by type, CNMI, 20&2006
Population estimate 69221 71436 73650 75% 78079 80294 82508 , . . . . . . . n 77 70 72 71 69 57 75
SSwe ratdlOOO00 36 24 24 21 17 15 18 %of total notifirations 32 24 25 23 19 21 20 n 37 38 39 40 41 38 43
SW ratdlOOO00 53 53 53 53 53 47 52 X of total notifications 48 54 54 56 59 67 57 n 11 12 13 14 15 5 17
%of Wal notificd6ons 14 17 l 8 20 22 9 23 Relapse (n) 4 3 2 l 0 0 0 Defautl (n) 0 0 0 0 0 0 0
Previously treated Failure (n) 0 0 0 0 0 0 0 TOM arwbushf f eated 4 3 2 1 0 0 0
Transfer in n 0 0 0 0 0 0 0
Figure 29: Case notification types as proportion of total notifications, CNMI, 20062006
11 World Health Organization. 2008.
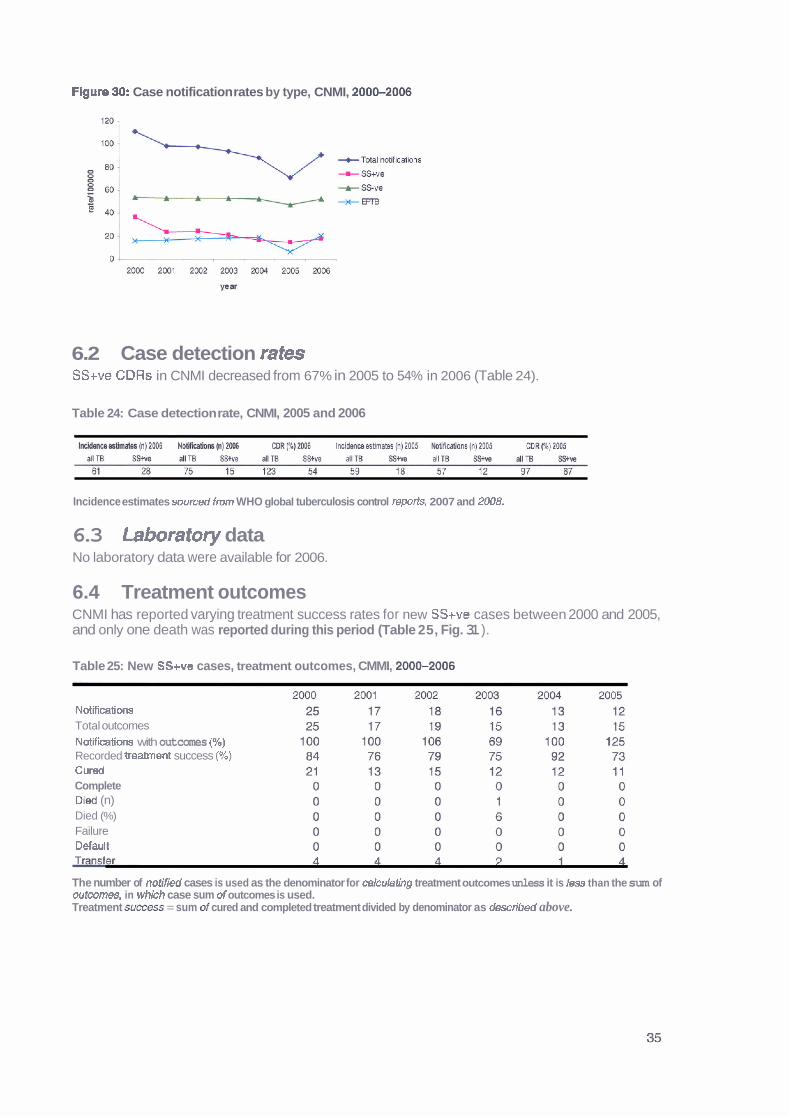
Flgure 90: Case notification rates by type, CNMI, 200S2006
6.2 Case detection rates SS+ve CDRs in CNMI decreased from 67% in 2005 to 54% in 2006 (Table 24).
Table 24: Case detection rate, CNMI, 2005 and 2006
Incidence estimates swrced from WHO global tuberculosis control reports, 2007 and 2UO8.
6.3 Laboratory data No laboratory data were available for 2006.
6.4 Treatment outcomes CNMI has reported varying treatment success rates for new SS+ve cases between 2000 and 2005, and only one death was reported during this period (Table 25, Fig. 31 ).
Table 25: New SS+ve cases, treatment outcomes, CMMI, 200&2006
Notificatiwrs Total outcomes Notikatiom with outcomes (96) Recorded treament success (90) Curd Complete Died (n) Died (%) Failure Defautl
The number of notified cases is used as the denominator for cakulating treatment outcomes unless it is less than the sum of outcomes, in whlch case sum of outcomes is used. Treatment succes = sum of cured and completed treatment divided by denominator as described above.

Figure 31: New SS+ve cases, treatment success, CNMI, 2000-2006
vear
6.5 Issues identified m Age grouplsex distribution data for 2006 were incomplete.
No laboratory data have been reported since 2003 to SPC, however laboratory data may have been reported to CDC.
m More outcomes than notifications were reported for the 2002 and 2005 cohorts. Decreasing case notification rates over time.
No previously treated cases recorded for the period 2004-2006. Low numbers of deaths reported overall.
6.6 Suggested responses Data management should be examined to determine the reasons for and provide solutions to issues relating to recording and reporting.

7 Cook lslands
Case notifications The Cook Islands have reported one TB case each year during 2004-2006, giving a notification rate of 71100,000 population (Table 26). Age grouplsex distribution is not reported as there were no SS+ve cases notified in 2006.
Table 26: Case notifications by type, Cook Islands, 2000-2006
%of total noMicabbns 0 50 100 0 100 100 0 n 1 0 0 0 0 0 0
S u e ratellMHM0 6 0 0 0 0 0 0 %of total notfbAons 100 0 0 0 0 0 0 n 0 0 0 0 0 0 1
EPTB ratd100000 0 0 0 0 0 0 7 %of total notifdims 0 0 0 0 0 0 100 R&pw (n) 0 1 0 0 0 0 0 Defautl (n) 0 0 0 0 0 0 0
Mously treated Failure (n) 0 0 0 0 0 0 0 Total previously Weat& 0 1 0 0 0 0 0 %id total notifications 0 50 0 0 0 0 0 . . . . . . . . . . . . . .
Unkmwn n o o o o 0 o o Transfer in n 0 0 0 0 0 0 0
Figure 32: Case notifications by type as proportion of all notifications, Cook Istands, 2000-2006
a Revbusly treated
0m
SS-ve
m SSwe
7.2 Case detection rates The CDR for SS+ve cases in the Cook Islands for 2005 and 2006 has been loo%, however this should be viewed with caution given the overall small numbers (Table 27).
Table 27: Case detection rates, Cook Islands, 2005 and 2006
Incidence estimafes soureed from WHO global hrbercuIosis control reports, 2200 and 2008
7.3 Laboratory data In 2006, the Cook lslands reported 59 TB suspects, of which, none were reported to be smear or culture positive. Of the 59 suspects, 48 (81%) were reported to be screened with one slide and l l (1 9%) with two or three slides.
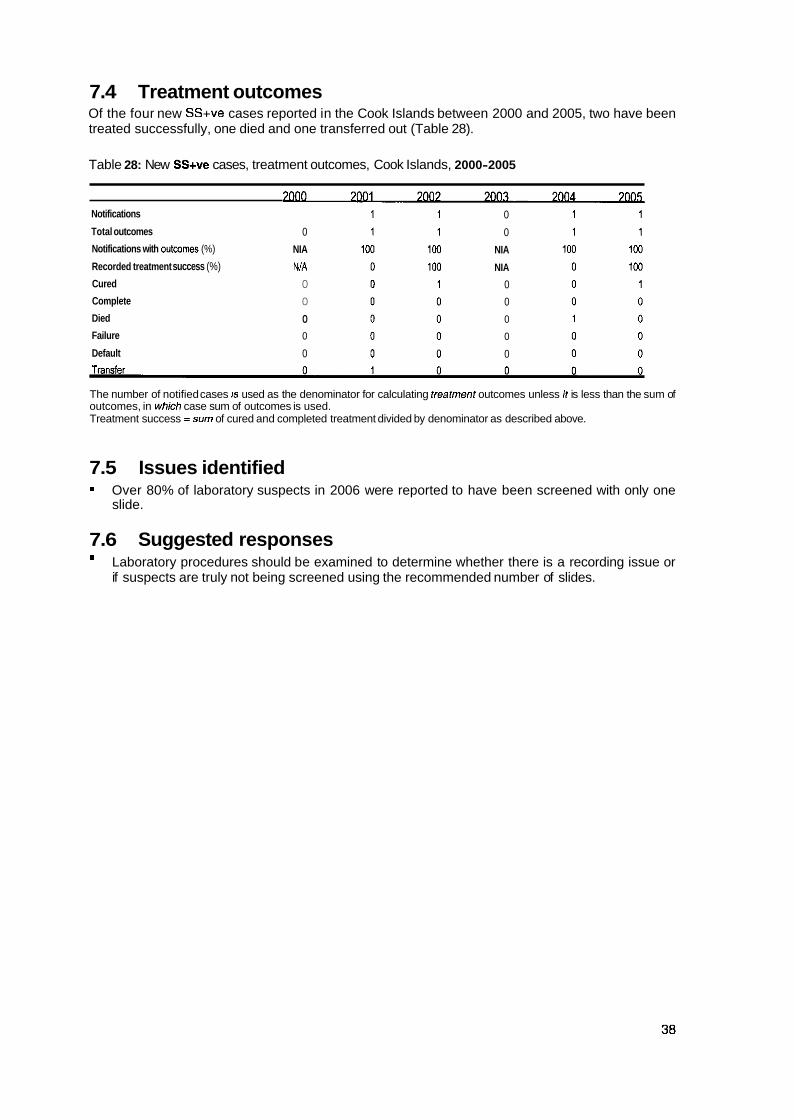
7.4 Treatment outcomes Of the four new SS+ve cases reported in the Cook Islands between 2000 and 2005, two have been treated successfully, one died and one transferred out (Table 28).
Table 28: New SS+ve cases, treatment outcomes, Cook Islands, 2000-2005
Notifications
Total outcomes
Notifications with outwmes (%)
Recorded treatment success (%)
Cured
Complete
Died
Failure
Default
0
NIA
NIA
0
0
0
0
0
0
0
NIA
NIA
0
0
0
0
0
The number of notified cases 1s used as the denominator for calculating treatment outcomes unless It is less than the sum of outcomes, in which case sum of outcomes is used. Treatment success =sum of cured and completed treatment divided by denominator as described above.
7.5 Issues identified Over 80% of laboratory suspects in 2006 were reported to have been screened with only one slide.
7.6 Suggested responses = Laboratory procedures should be examined to determine whether there is a recording issue or
if suspects are truly not being screened using the recommended number of slides.
8 Federated States of Micronesia
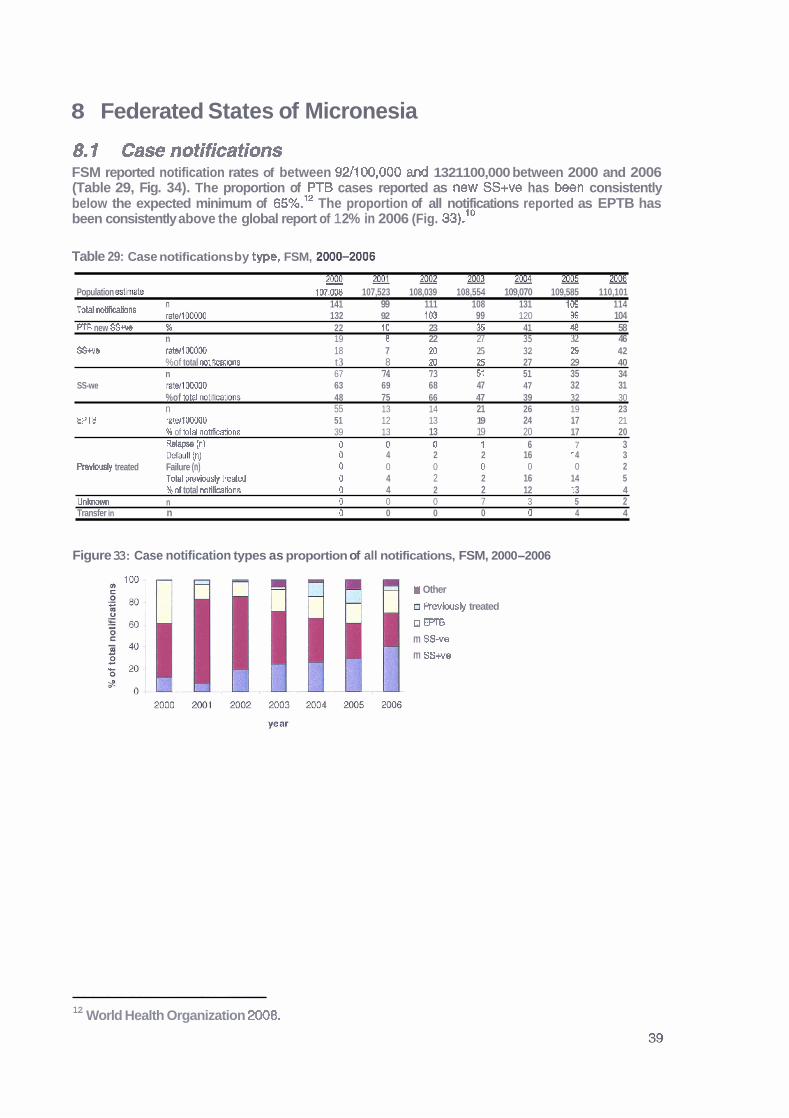
8.1 Case notifications FSM reported notification rates of between 921100,000 and 1321100,000 between 2000 and 2006 (Table 29, Fig. 34). The proportion of PT6 cases reported as new SS+ve has been consistently below the expected minimum of 65%.12 The proportion of all notifications reported as EPTB has been consistently above the global report of 1 2% in 2006 (Fig. 33) .1°
Table 29: Case notifications by type, FSM, 20Mb2006
r n o o m o l ~ ~ 2 p M 2 ! X E - Population estimh 107.0OB 107,523 108,039 108,554 109,070 109,585 110,101
141 99 111 108 131 109 114 Total notificalions klMw 132 92 10.3 99 120 W 104 PTB new S S w % 22 10 23 36 41 48 58
n 19 8 22 27 35 32 46 SSw 8 Wl WOaD 18 7 20 25 32 24 42
%of total rntlffcatbns t 3 8 20 25 27 29 40 n 67 74 73 5f 51 35 34
SS-we r a m DC400 63 69 68 47 47 32 31 %of totar noMlcations 48 75 66 47 39 32 30 n 55 13 14 21 26 19 23
EPTB ratellOWD 51 12 13 19 24 17 21 # of totd notifications 39 13 13 19 20 17 20 R e l a m tnl 0 0 0 I 6 7 3 ~efahlt (n) 0 4 2 2 16 t 4 3
Pmvbusly treated Failure (n) 0 0 0 0 0 0 2 Totel pmviwsly treded 0 4 2 2 16 14 5 %of total noClications 0 4 2 2 12 t 3 4
Unlrnown n 0 0 0 7 3 5 2 Transfer in n 0 0 0 0 0 4 4
Figure 33: Case notification types as proportion of all notifications, FSM, 2000-2006
I Other
a Revlousty treated
o m m ss-v0 m SSwe
12 World Health Organization 2008.
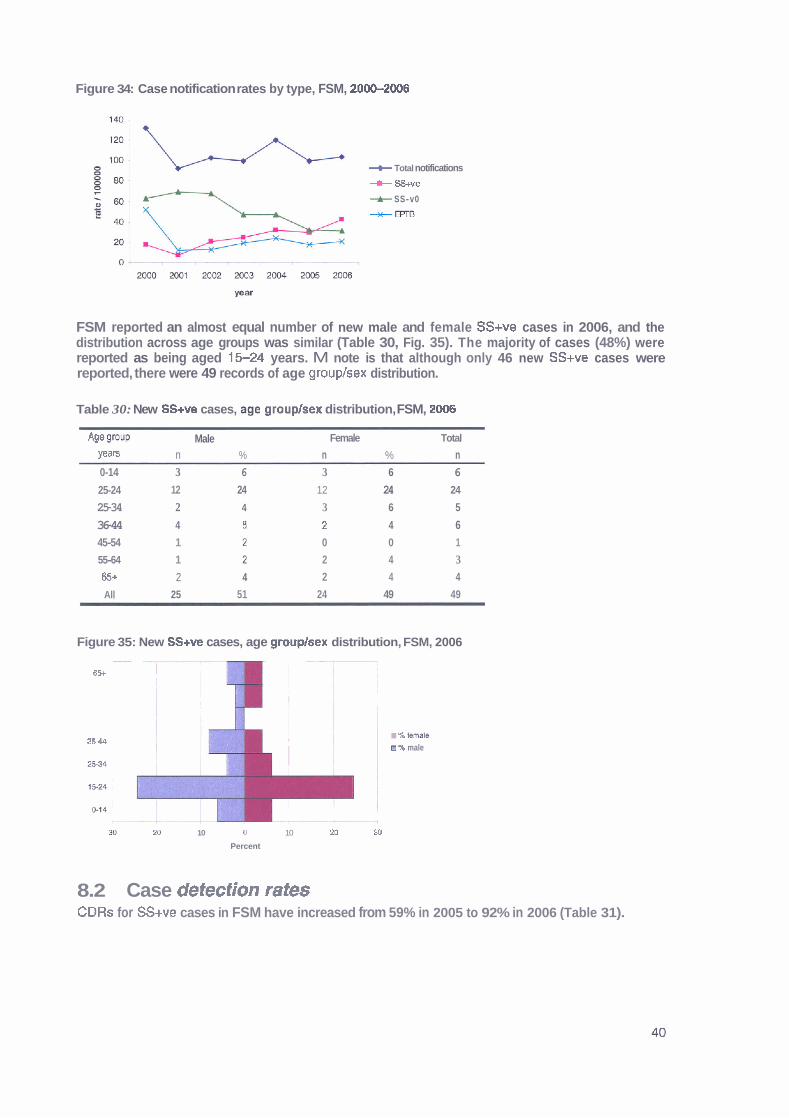
Figure 34: Case notification rates by type, FSM, 20W2006
+- Total notifications
-+ SS+ve
+ SS-v0
+m
FSM reported an almost equal number of new male and female SS+ve cases in 2006, and the distribution across age groups was similar (Table 30, Fig. 35). The majority of cases (48%) were reported as being aged 15-24 years. M note is that although only 46 new SS+ve cases were reported, there were 49 records of age grouplsex distribution.
Table 30: New SS+ve cases, ago grouplsex distribution, FSM, 2008
AIle group Male Female Total
Years n % n % n 0-14 3 6 3 6 6
25-24 12 24 12 24 24
25-34 2 4 3 6 5
36-44 4 f 2 4 6 45-54 1 0 0 1
55-64 1 2 4 3
65+ 2 4 2 4 4
All 25 51 24 49 49
Figure 35: New SS+ve cases, age grouphex distribution, FSM, 2006 - - , --
I 8%
! !
. % wale 3 - , i m % male
!
30 a 10 J 10 20 30
Percent
8.2 Case defection rates CDRs for SS+ve cases in FSM have increased from 59% in 2005 to 92% in 2006 (Table 31).
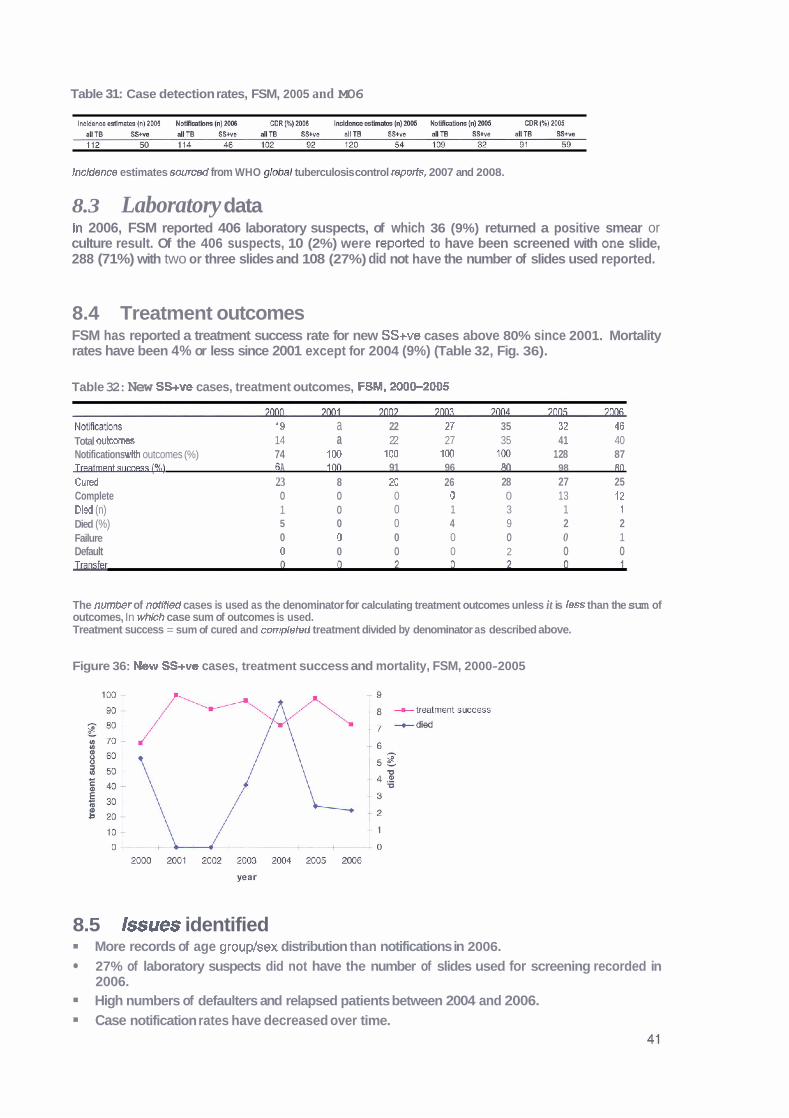
Table 31: Case detection rates, FSM, 2005 and M06
Incidence estimates sourced from WHO gbh1 tuberculosis control reporfs, 2007 and 2008.
8.3 Laboratory data In 2006, FSM reported 406 laboratory suspects, of which 36 (9%) returned a positive smear or culture result. Of the 406 suspects, 10 (2%) were raported to have been screened with one slide, 288 (71%) with two or three slides and 108 (27%) did not have the number of slides used reported.
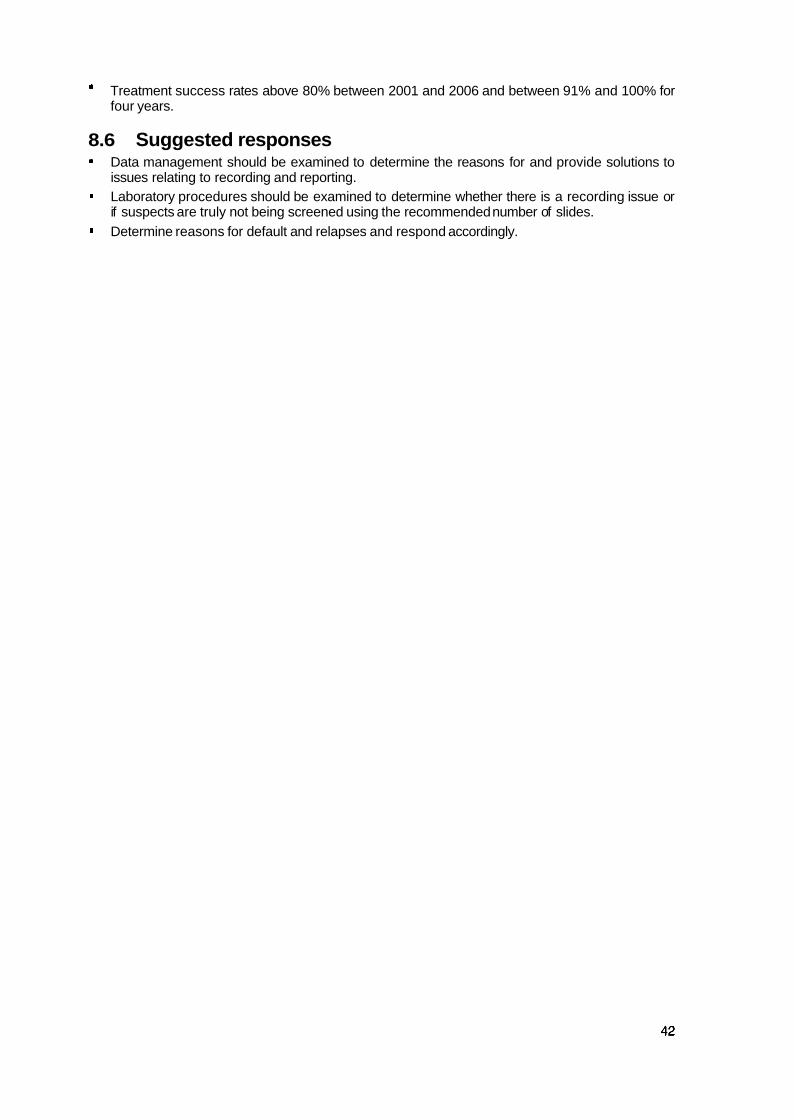
8.4 Treatment outcomes FSM has reported a treatment success rate for new SS+ve cases above 80% since 2001. Mortality rates have been 4% or less since 2001 except for 2004 (9%) (Table 32, Fig. 36).
Table 32: New SS+ve cases, treatment outcomes, FSM, 200tb2005
Notifmbas 19 a 22 27 35 32 46 Total outoomw 14 a 22 27 35 41 40 Notifications wlth outcomes (%) 74 100 100 100 to0 1 28 87
6 A i l l3 91 96 80 98 RO
Curad 23 8 20 26 28 27 25 Complete 0 0 0 0 0 13 22 D id (n) 1 0 0 1 3 1 1 Died (%) 5 0 0 4 9 2 2 Failure 0 0 0 0 0 0 1 Default 0 0 0 0 2 0 0
The numhr of notified cases is used as the denominator for calculating treatment outcomes unless it is less than the sum of outcomes, In whlch case sum of outcomes is used. Treatment success = sum of cured and mmpleted treatment divided by denominator as described above.
Figure 36: New SS+v@ cases, treatment success and mortality, FSM, 2000-2005
8.5 Issues identified More records of age grouplsex distribution than notifications in 2006.
27% of laboratory suspects did not have the number of slides used for screening recorded in 2006. High numbers of defaulters and relapsed patients between 2004 and 2006. Case notification rates have decreased over time.
* Treatment success rates above 80% between 2001 and 2006 and between 91% and 100% for four years.
8.6 Suggested responses Data management should be examined to determine the reasons for and provide solutions to issues relating to recording and reporting. Laboratory procedures should be examined to determine whether there is a recording issue or if suspects are truly not being screened using the recommended number of slides. Determine reasons for default and relapses and respond accordingly.

9 Fiji Islands
9.1 Case notifications Fiji Islands reported a slightly decreasing trend in total notification rates between 2000 and 2006 (Table 33, Fig. 38). More than 65% of PTB cases were repotted as SS+ve in 2005 and 2006, meeting the expected minimum proportion.13 Also of note is the proportion of cases reported as EPTB consistently being greater than 23% which is in contrast to the global report of 12% in 2006 (Fig. 37).11
Table 33: Case notifications by type, Fiji Islands, 2000-2006
2000 - - 2001 2002 2003 2004 2M)5 m Populatron estknate 795636 80775 895914 811054 816194 821333 826473 Total noMcations n 144 156 150 182 132 134 114
rate1100000 18 19 19 22 16 16 14 New PTB S S w % 61 65 69 59 61 66 81
n 62 73 75 70 60 63 71
SSve rate/100000 5 5 4 6 5 4 2 %of total nohications 28 25 23 26 29 24 15 n 42 44 39 58 32 39 26
EPTB ratellOOWO 5 5 5 7 4 5 3 %of total notlRcatlms 29 28 26 32 23 29 23 Waw in) o o 2 6 3 0 0 k b l t (n)
Pwiously treated Failure (n) Total previously ireated %of total notlflcatbns 0 0 1 3 2 0 0
Unknown n 0 0 0 0 0 0 0 Tranef~ in n 0 0 0 0 0 0 0
Figure 37: Case notiffcatlon types as proportion of all notifications, Fiji Islands, 200-2006
2 m 2001 XX)2 m3 2004 2c€6 2006
year
Figure 38: Case notification rates by type, Fiji Islands, 2000-2006
Total notif hations
+ SS+ve
-A- SS-ve
+m
l 3 World Health Organization 2008.

Fiji Islands reported an even number of male and female cases in 2006 (52 males, 54 females), however there was some variation in sex distribution across age groups (Table 34, Fig. 39). More female cases were notified in the 15-24, 45-54 and 65 plus age groups, and more males cases in the 25-34 and 5544 age groups. Of note is that although 71 new SScve cases were reported, there were age grouplsex distribution records for 106 cases (Table 33, Table 34).
Table 34: New SS+ve cases, age grouphex distribution, Fiji Islands, 2006
Age group Male Female Total
Yeam n % n % n
0-14 2 2 2 2 4
25-24 7 7 14 13 21
25-34 14 13 7 7 21
3544 7 7 7 7 14
45-54 7 7 10 9 17
55-64 10 9 5 5 15
65+ 5 5 9 8 14
All 52 49 54 51 106
Figure 39: New SS+ve cases, age grouplsex distribution, Fiji Islands, 2006
9.2 Case detection rates CDRs for SS+ve cases in Fiji Islands have increased from 73% in 2005, to 86% in 2006 (Table 35).
Table 35: Case detection rates, Fiji Islands, 2005 and 2006
Incidence estimates soumd from WHO global tuberculosis control reports, 2007 and 2008.
Fiji Islands reported 230 laboratory suspects in 2006, of which, 59 (26%) returned a positive smear or culture result. Of these 230 suspects, 94 (41 %) were reported to have been screened using one slide, and 1 36 (59%) with two or three slides.

9.4 Treatment outcomes Fiji Islands consistently reports treatment outcomes for all new SS+ve notifications (Table 36). Treatment success rates have been 85% or above since 2001, except for 2005 when a rate of 76% was reported (Fig. 40). The death rate in new SS+ve cases has increased from 5% in 2000 to 11% in 2005.
Table 36: New SS+ve cases, treatment outcomes, Fiji Islands, 200b2005
2000 2001 2002 2003 2004 2005 NotMcat[ons 62 73 75 70 60 63
Outcomes recorded 62 73 75 78 60 63
Notifications with wtwrnes (%) 1M1 100 100 111 100 100
Recorded lreatment s u w s (%) 81 85 85 96 85 76
Cured 50 62 63 67 51 48
Complete 0 0 1 0 0 0
Dled (n) 3 4 4 6 5 7
Died ($Q) 5 5 5 8 8 11
Failure 0 0 0 0 0 0
Default 8 6 5 5 3 7
Transfer 1 1 2 0 l 1
The number of notitied cases is used as the denominator for calculating treatment outcomes unless it is less than the sum of outcomes, in which case sum of outcomes is used. Treatment success = sum of curd and completed treatment divided by denominator as described above.
Figure 40: New SSwe cases, recorded treatment success and mortality, Fiji Islands, 20-2005
E -treatment sucess - 3 +died
W
9.5 Issues identified Overall good programme performance with increasing case detection over the years and satisfactory treatment outcomes, few issues identified are:
More records of age grouplsex distribution than notifications in 2006. Over 40% of laboratory suspects in 2006 were reported to have been screened using only one slide.
= Increased death and defaulter rate in 2005.
9.6 Suggested responses Data management should be examined to determine the reasons for the discrepancy in reporting and solutions implemented.
Laboratory procedures should be examined to determine whether there is a recording issue or if suspects are truly not being screened using the recommended number of slides. Increasing defaulter and death rates should be investigated, delays in diagnosis and treatment of TB minimised and DOTS strictly applied.
10 French Polynesia
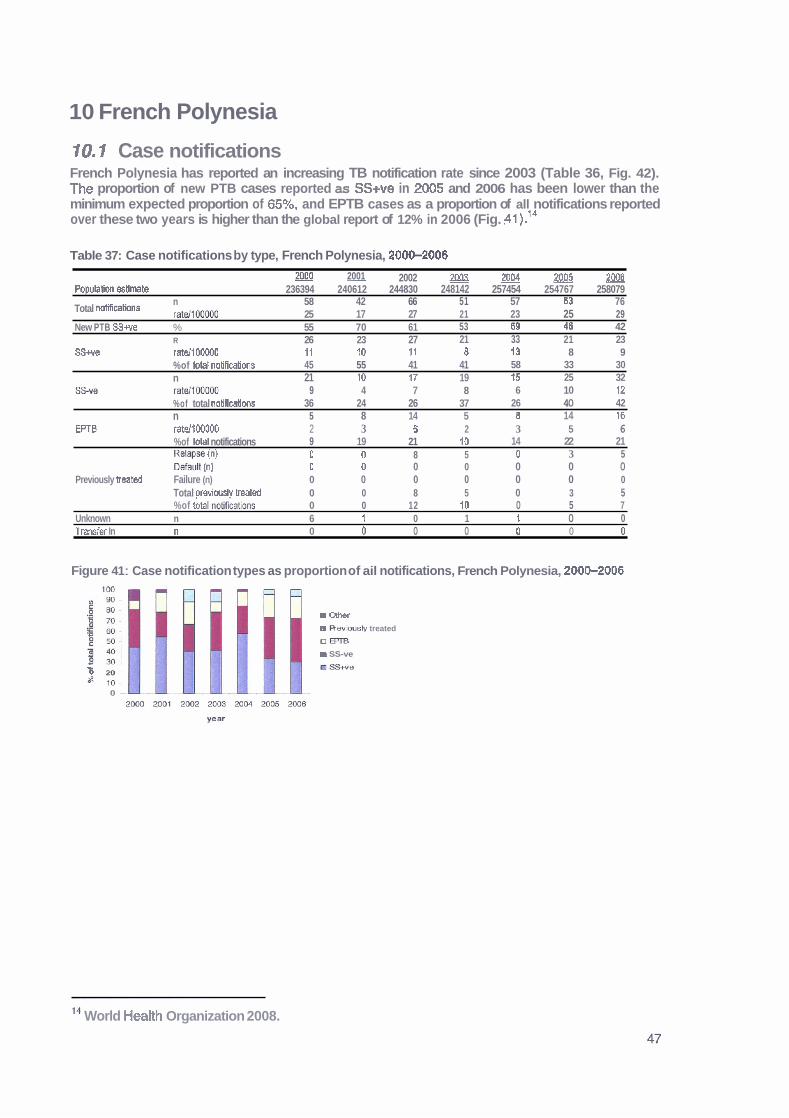
10.1 Case notifications French Polynesia has reported an increasing TB notification rate since 2003 (Table 36, Fig. 42). The proportion of new PTB cases reported as SS+ve in 2005 and 2006 has been lower than the minimum expected proportion of 65%, and EPTB cases as a proportion of all notifications reported over these two years is higher than the global report of 12% in 2006 (Fig. .41).14
Table 37: Case notifications by type, French Polynesia, 20W2006
2001 2000 2002 20032004m PopulaZon &Ornate 236394 240612 244830 248142 257454 254767 258079
n Total notifications raM1OOOOO
58 42 66 51 57 63 76 25 17 27 21 23 25 29
New PTB SS+ve % 55 70 61 53 69 46 42 R 26 23 27 21 33 21 23
S S w ratd100000 11 20 11 8 13 8 9 %of total nobfications 45 55 41 41 58 33 30 n 21 10 17 19 15 25 32
SS-* Wl0M)OO 9 4 7 8 6 10 12 %of total notiCcations 36 24 26 37 26 40 42 n 5 8 14 5 8 14 16
EPTB ratell00000 2 3 6 2 3 5 6 %of tohl notifications 9 19 21 10 14 22 21 RdWm (n) 0 0 8 5 0 3 5 Default (n) 0 0 0 0 0 0 0
Previously lreated Failure (n) 0 0 0 0 0 0 0 Total orevlwslv treat& 0 0 8 5 0 3 5 %of kl notfkations 0 0 12 10 0 5 7
Unknown n 6 1 0 1 1 0 0 Transfsr In n 0 0 0 0 0 0 0
Figure 41 : Case notification types as proportion of ail notifications, French Polynesia, 2000-2006
U Olher
a Rev~lrsb treated
u r n m SS-ve
'6 20 mSS+ue
0 7
l4 World Health Organization 2008.

Figure 42: Case notification rates by type, French Polyneeia, 200&2006
+ Total notiications
+ SS+ve
-A- SS-ve
+m
year
More female than male new SS+ve cases were notified in French Polynesia in 2006, with variation in distribution across all age groups (Table 38, Fig. 43).
Table 38: New SS+ve notifications, age grouplsex distrlbutlon, French Polynesia, 2006
*g9 group Male Female Total
0-1 4 1 4 1 4 2
t 5-24 2 9 4 17 6
25-34 1 4 2 9 3
35-44 3 13 1 4 4
4 5 4 2 E 0 0 2
5564 1 4 2 9 3
65+ 0 0 3 13 3
All 10 43 13 57 23
Figure 43: New SS+ve notificatlons, age grouplsex distribution, French Polynesia, 2006
10.2 Case detection rates CORs for SS+ve cases in French Polynesia have decreased from 88% in 2005 to 74% in 2006 (Table 39).
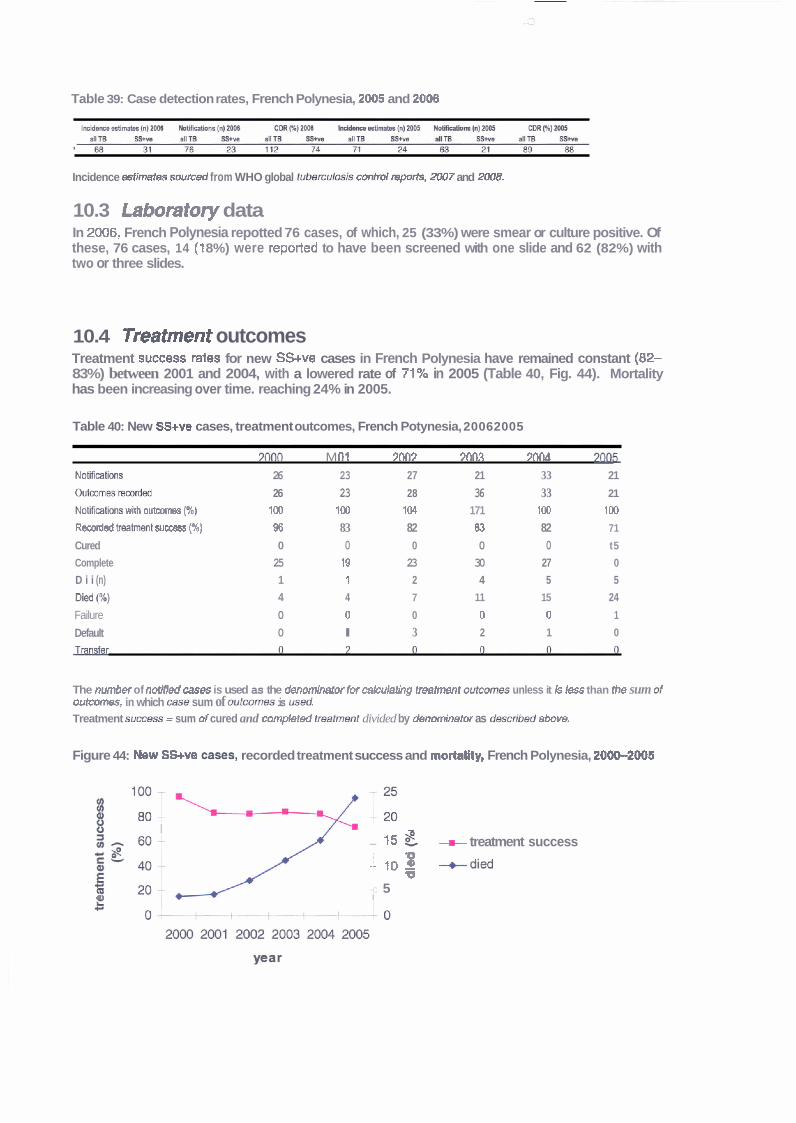
Table 39: Case detection rates, French Polynesia, 2005 and 2006
Incidence astimates swrced from WHO global t u b e m W control mports, 2007 and 2008.
10.3 Laboratory data In 2006, French Polynesia repotted 76 cases, of which, 25 (33%) were smear or culture positive. Of these, 76 cases, 14 ( l 8%) were reported to have been screened with one slide and 62 (82%) with two or three slides.
10.4 Treatment outcomes Treatment suNess rates for new SSwe cases in French Polynesia have remained constant (82- 83%) between 2001 and 2004, with a lowered rate of 71% in 2005 (Table 40, Fig. 44). Mortality has been increasing over time. reaching 24% in 2005.
Table 40: New SSwe cases, treatment outcomes, French Potynesia, 20062005
m0 M fl f 9003 Mn.? ?[K16 2m NoIWthns 26 23 27 21 33 21
O ~ m r d e d 26 23 28 36 33 21
NoUMtbm wHh o u t m m p) 100 100 104 171 100 100
RecMded irmhtmt success (%) 96 83 82 83 82 71
Cured 0 0 0 0 0 t5
Complete 25 19 23 30 27 0
D i i (n) 1 1 2 4 5 5
6) 4 4 7 11 15 24
Failure 0 0 0 0 0 1
Default 0 l 3 2 1 0
The number of notified mes is used as the denm'nafw Iw cahlaihg treatment wtmmes unless it Is k s than ih8 sum of outcdmss, in which case sum of outcomes is m&. Treatment SUCCBSS = sum d cured and completed treafmmt divided by denominetw as &s&l?ed abwe.
Figure 44: Mew SS+w =-S, recorded treatment success and mohllty, French Polynesia, 2000-2005
- -
a I n
3 - M - - 15 if. -m- treatment success
i 1 ,g +did
-c 5 U I
10.5 Issues identified Overall, the programme has been successful and performance is good, especially in the areas of case detection and case management, issues identified are:
Eighteen percent of laboratory suspects in 2006 were reported to have been screened with only one slide. - Extremely high death rate in 2005. Increasing number of relapses.
10.6 Suggested responses Laboratory procedures should be examined to determine whether there is a recording issue or if suspects are truly not being screened using the recommended number of slides. High death rates should be investigated and corrective action taken (e.g. minimise delays in diagnosis and treatment of TB). DOTS to be strictly applied.
I t Guam
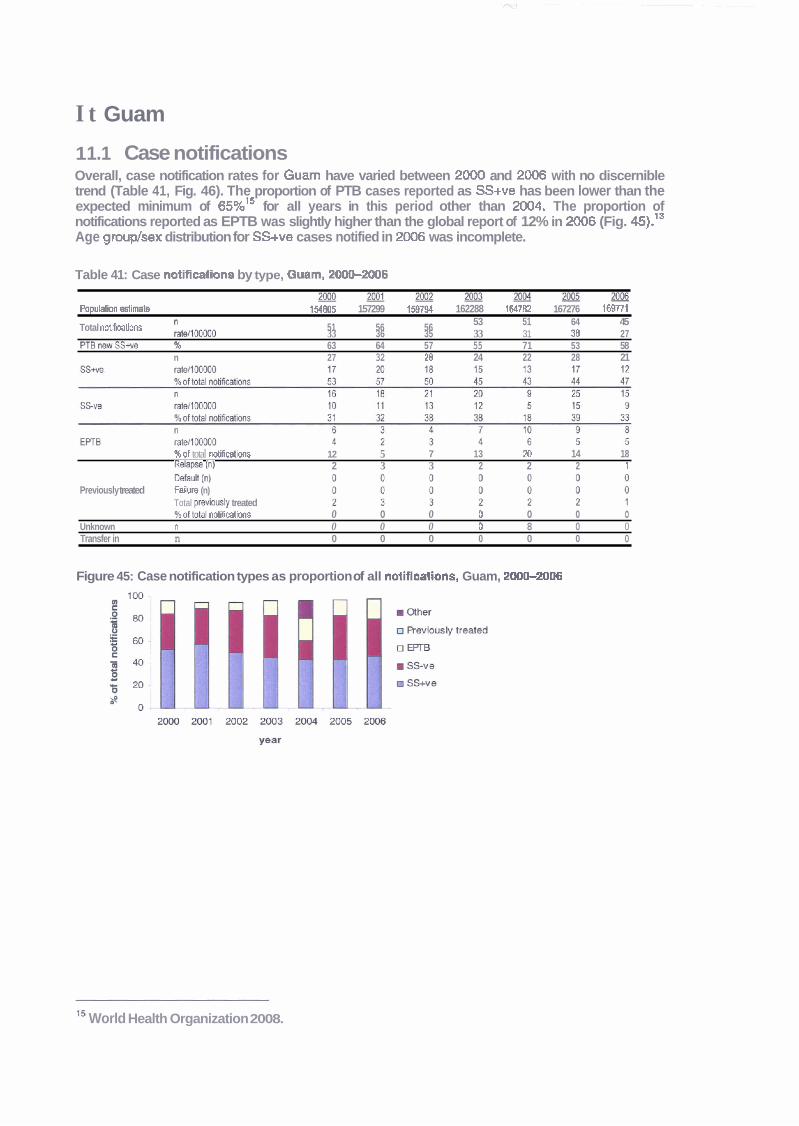
1 1.1 Case notifications Overall, case notification rates for Guam have varied between 2000 and 2006 with no discernible trend (Table 41, Fig. 46). The proportion of PTB cases reported as SS+ve has been lower than the expected minimum of 65%'' for all years in this period other than 2004. The proportion of notifications reported as EPTB was slightly higher than the global report of 12% in 2006 (Fig. 45).lS Age grouplsex distribution for SS+ve cases notified in 2006 was incomplete.
Table 41: Case notifications by type, Gmm, 20W2006
m m m m m m m P o p u r n &mate 154805 157299 158794 162288 164782 167276 169771
Total notlRwlions /twr,OOOOO 51 56 56 53 51 64 45 33 36 35 33 31 38 27
PTBnewSS+va % 63 64 57 55 71 53 58 n 27 32 28 24 22 28 21
%of total notifications 12 5 7 13 20 14 18 wapse (n) 2 3 3 2 2 2 t
(4 Previously treated Fadurn (n)
Total pr&oud~ treated %of total notiimtions o o o o o o o
Unknown n 0 0 0 0 8 0 0 Transfer in n 0 0 0 0 0 0 0
Figure 45: Case notification types as proportion of all notiflestions, Guam, 2000-2006
l 5 World Health Organization 2008.
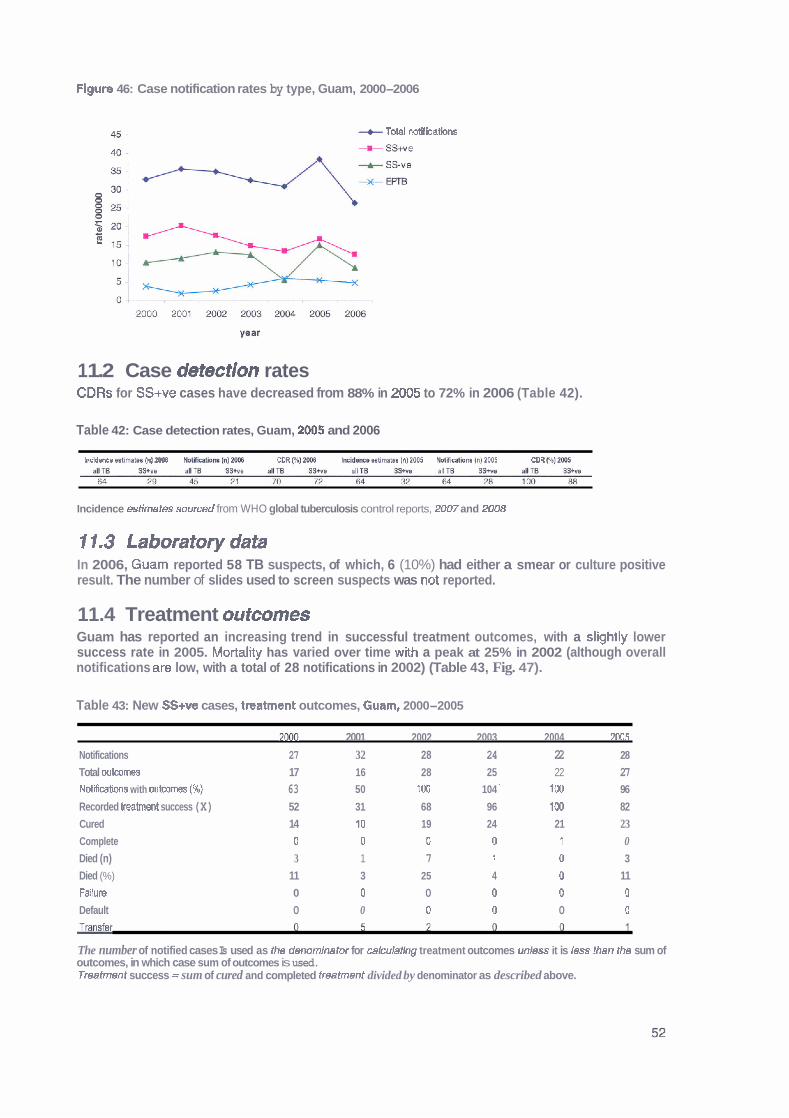
Figure 46: Case notification rates by type, Guam, 2000-2006
+ Total notif hations
1 1.2 Case detection rates CDRs for SS+ve cases have decreased from 88% in 2005 to 72% in 2006 (Table 42).
Table 42: Case detection rates, Guam, 2005 and 2006
kddarcs &imw InllMls Mihih~ h) ZM8 M A ) M I n ~ h d m w lnl M IklIAcdooo lnl2M1S COR Nl2W
Incidence estimates sourced from WHO global tuberculosis control reports, 21307 and 2008
11.3 Laboratorydata In 2006, Guam reported 58 TB suspects, of which, 6 (10%) had either a smear or culture positive result. The number of slides used to screen suspects was not reported.
11.4 Treatment outcomes Guam has reported an increasing trend in successful treatment outcomes, with a slightly lower success rate in 2005. Mortality has varied over time with a peak at 25% in 2002 (although overall notifications are low, with a total of 28 notifications in 2002) (Table 43, Fig. 47).
Table 43: New SS+ve cases, treatment outcomes, Guam, 2000-2005
2OD3 2001 2002 2003 2004 2M15
Notifications 27 32 28 24 22 28
Total outcomes 17 16 28 25 22 27 Motifiwtions with outcomes (%) 63 50 100 104 ' 100 96
Recorded treatment success (X) 52 31 68 96 100 82 Cured 14 10 19 24 21 23 Complete 0 0 D 0 1 0 Died (n) 3 1 7 i 0 3
Died (%) 11 3 25 4 0 11 Fallure 0 0 0 0 0 0
Default 0 0 0 0 0 0
The number of notified cases Is used as the denominator for calculaflng treatment outcomes unless it is less than the sum of outcomes, in which case sum of outcomes is used. Treatment success = sum of cured and completed treatment divided by denominator as described above.
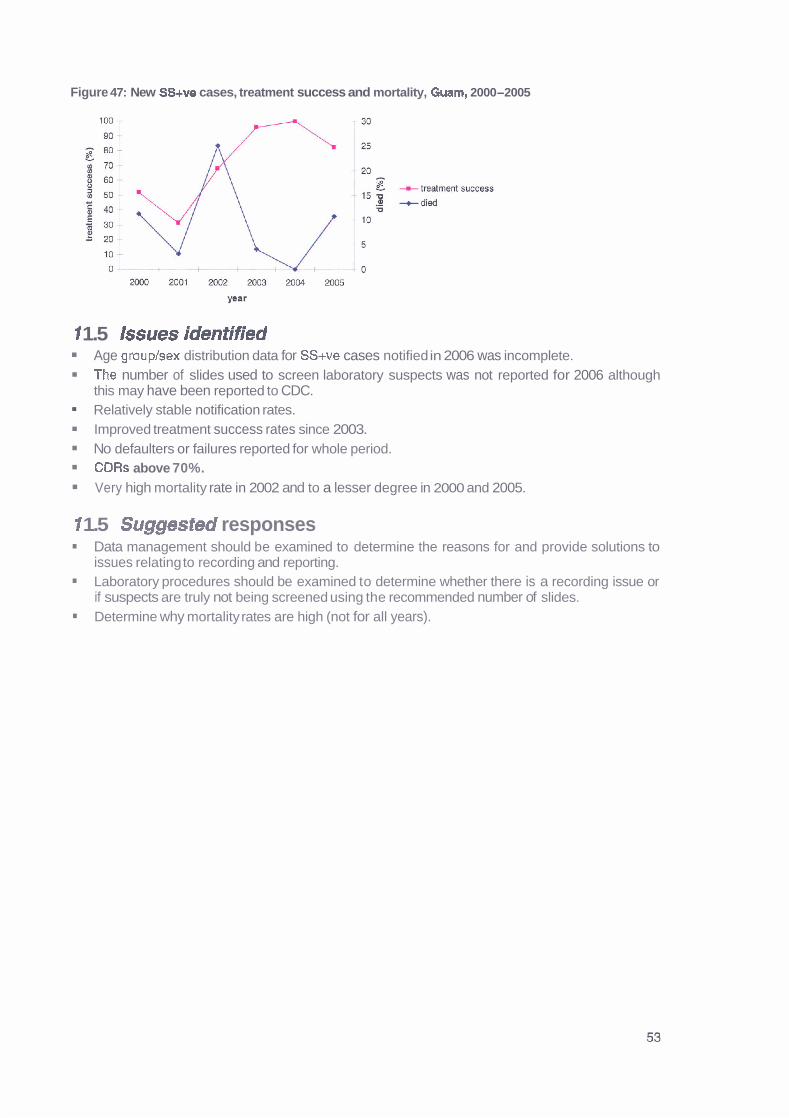
Figure 47: New SS+ve cases, treatment success and mortality, Guarn, 2000-2005
1 1.5 Issues identified Age group/sex distribution data for SS+ve cases notified in 2006 was incomplete. The number of slides used to screen laboratory suspects was not reported for 2006 although this may have been reported to CDC. Relatively stable notification rates. Improved treatment success rates since 2003. No defaulters or failures reported for whole period. CDRs above 70%. Very high mortality rate in 2002 and to a lesser degree in 2000 and 2005.
1 1.5 Suggested responses Data management should be examined to determine the reasons for and provide solutions to issues relating to recording and reporting. Laboratory procedures should be examined to determine whether there is a recording issue or if suspects are truly not being screened using the recommended number of slides. Determine why mortality rates are high (not for all years).
12 Kiribati
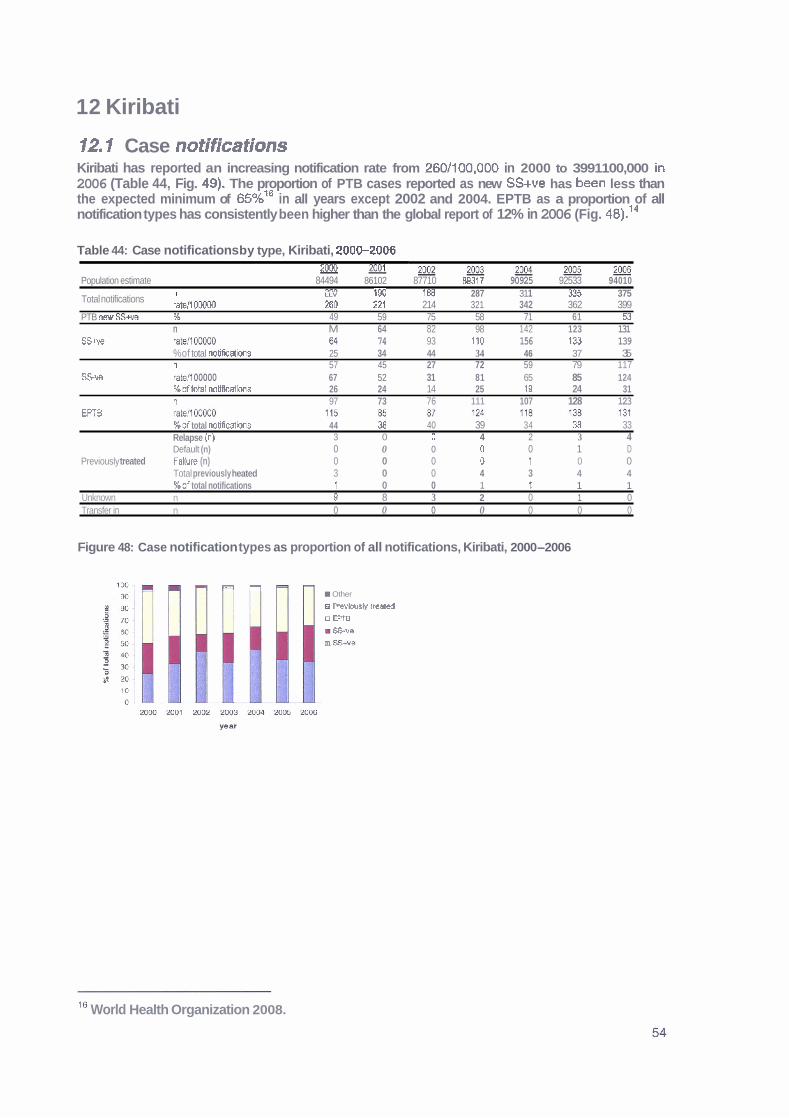
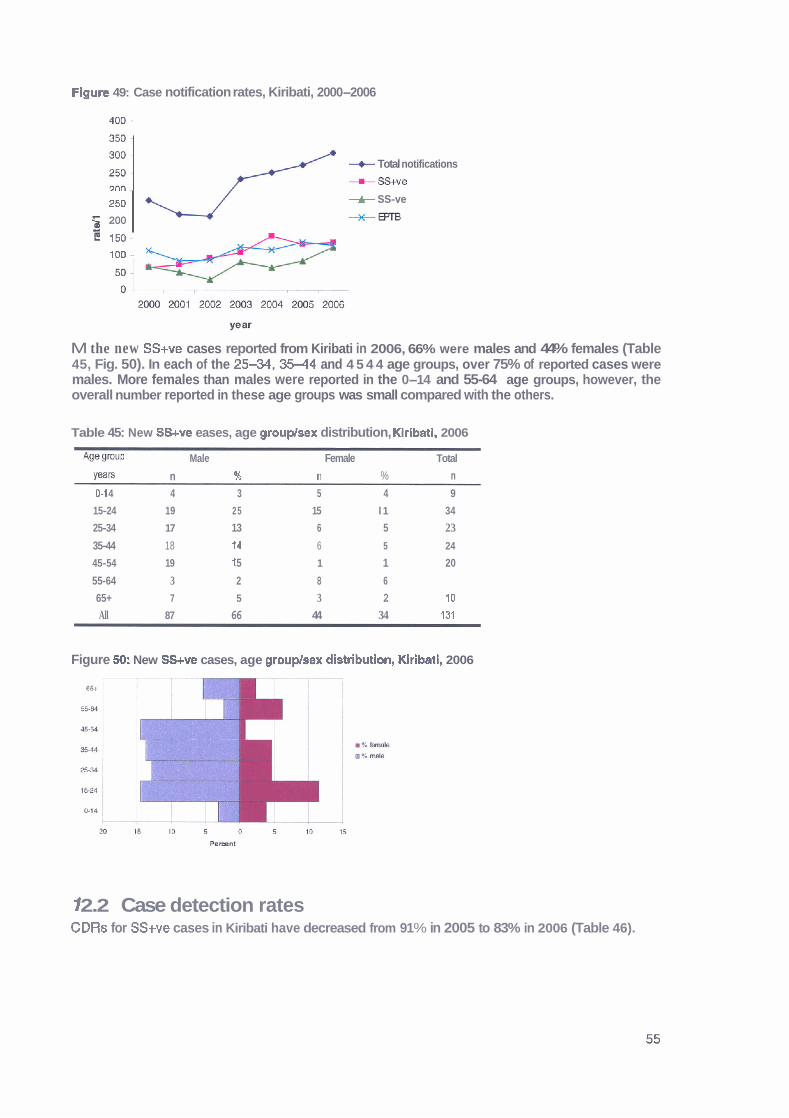
12.1 Case notifications Kiribati has reported an increasing notification rate from 260/100,000 in 2000 to 3991100,000 in 2006 (Table 44, Fig. 49), The proportion of PTB cases reported as new SS+ve has been less than the expected minimum of ~ 5 % ' ~ in all years except 2002 and 2004. EPTB as a proportion of all notification types has consistently been higher than the global report of 12% in 2006 (Fig. 48).14
Table 44: Case notifications by type, Kiribati, 200&2006 20M) 2001 - 2 0 0 2 ~ 2 0 0 4 m m
Population estimate 84494 86102 87710 B9317 90925 92533 94010 I- *fin 1BB 287 31 1 335 375 Total notifications " . LLV ***
IBU **,
rate11 u w z tltl ZZI 214 321 342 362 399 PTB new SS- % 49 59 75 58 71 61 53
n M 64 82 98 142 123 131 SS+ve rate/l00000 M 74 93 It0 156 133 139
%of total notifications 25 34 44 34 46 37 35 n 57 45 27 72 59 79 117
SSve rat4 00000 67 52 31 81 65 85 124 %oftotal notifications 26 24 14 25 19 24 31 n 97 73 76 111 107 128 123
EPTB %of total notificatbns 44 38 40 39 34 38 33 Relapse (n) 3 0 0 4 2 3 4 Default (n) 0 0 0 0 0 1 D
Previously treated Fallure (n) 0 0 0 D 1 0 0 Total previously heated 3 0 0 4 3 4 4 %of total notifications 1 0 0 1 f 1 1
Unknown n 9 8 3 2 0 1 0 Transfer in n 0 0 0 0 0 0 0
Figure 48: Case notification types as proportion of all notifications, Kiribati, 2000-2006
1 W Y - Other
o Rwbusly treated
o m
m S u e
m W e
Is World Health Organization 2008.
Flgure 49: Case notification rates, Kiribati, 2000-2006
M the new SS+ve cases reported from Kiribati in 2006, 66% were males and 44% females (Table 45, Fig. 50). In each of the 2 5 4 4 , 3 5 4 4 and 4 5 4 4 age groups, over 75% of reported cases were males. More females than males were reported in the 0-14 and 55-64 age groups, however, the overall number reported in these age groups was small compared with the others.
450
:::: 250
5 200
Table 45: New SS+ve eases, age grouplsex distribution, Klrlbatl, 2006
*W group Male Female Total
Yeam n ?4 n % n 01 4 4 3 5 4 9
/ + Total notifications
- = - - W e
+ SS-ve
*m
15-24 19 25 15 l 1 34
25-34 17 13 6 5 23
35-44 18 14 6 5 24
45-54 19 f 5 1 1 20
55-64 3 2 8 6
65+ 7 5 3 2 10
All 87 66 44 34 131
5 150-
100 -
Figure SO: New SS+ve cases, age grouplsex distributlon, Klribati, 2006
f 2.2 Case detection rates CDRs for SS+ve cases in Kiribati have decreased from 91 % in 2005 to 83% in 2006 (Table 46).
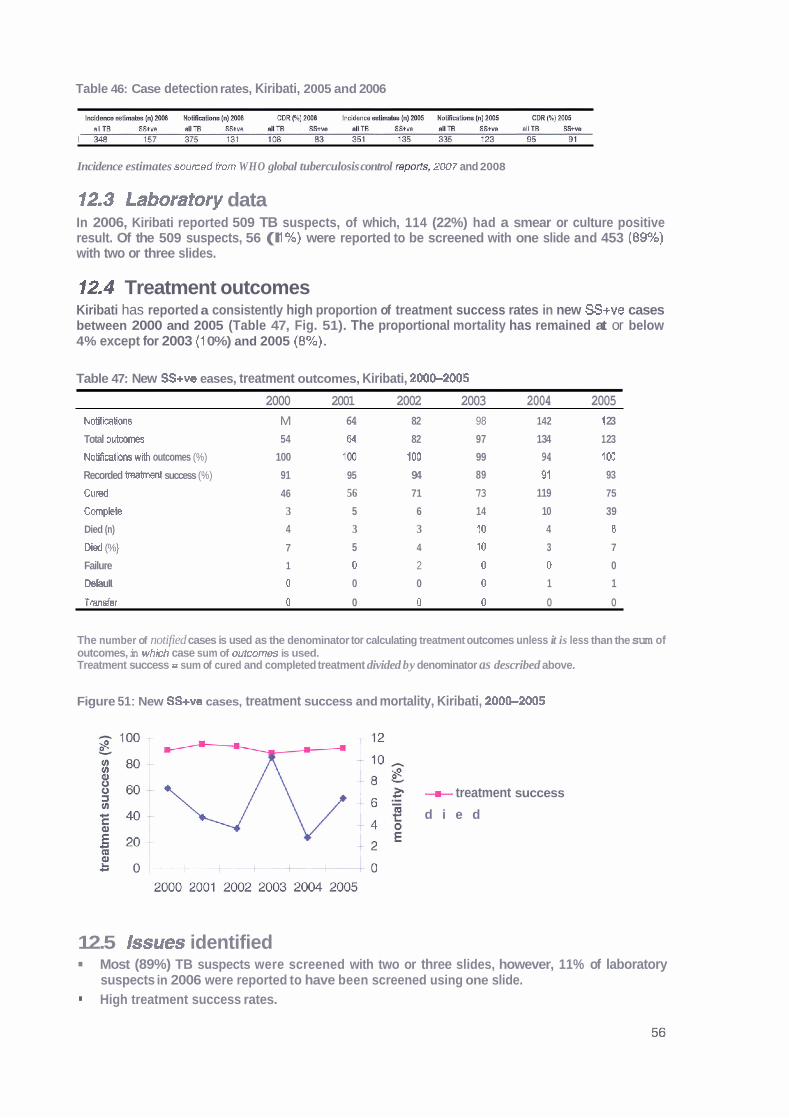
Table 46: Case detection rates, Kiribati, 2005 and 2006
Incidence estimates sourced h m WHO global tuberculosis control rep&, 2#7 and 2008
12*3 Laboratory data In 2006, Kiribati reported 509 TB suspects, of which, 114 (22%) had a smear or culture positive result. Of the 509 suspects, 56 (I 1%) were reported to be screened with one slide and 453 (89%) with two or three slides.
12.4 Treatment outcomes Kiribati has reported a consistently high proportion of treatment success rates in new SS+ve cases between 2000 and 2005 (Table 47, Fig. 51). The proportional mortality has remained at or below 4% except for 2003 (1 0%) and 2005 (8%.
Table 47: New SS+ve eases, treatment outcomes, Kiribati, 200+2005
2000 2001 2002 2003 2004 2005 Notifications M 64 82 98 142 1 23
Total outwmes 54 64 82 97 1 34 1 23
Notificatim wlh outcomes (%) 100 ID2 100 99 94 100
Recorded treatinert success (%) 91 95 94 89 97 93
C u d 46 56 71 73 119 75
Complete 3 5 6 14 10 39
Died (n) 4 3 3 10 4 8
D id (%} 7 5 4 10 3 7
Failure 1 0 2 0 0 0
Defsult 0 0 0 0 1 1
Transfer 0 0 0 0 0 0
The number of notified cases is used as the denominator tor calculating treatment outcomes unless it is less than the sum of outcomes, in whkh case sum of outcomes is used. Treatment success = sum of cured and completed treatment divided by denominator as described above.
Figure 51 : New SS+ve cases, treatment success and mortality, Kiribati, 200G2005
+ treatment success
d i e d
12.5 Issues identified Most (89%) TB suspects were screened with two or three slides, however, 11% of laboratory suspects in 2006 were reported to have been screened using one slide. High treatment success rates.
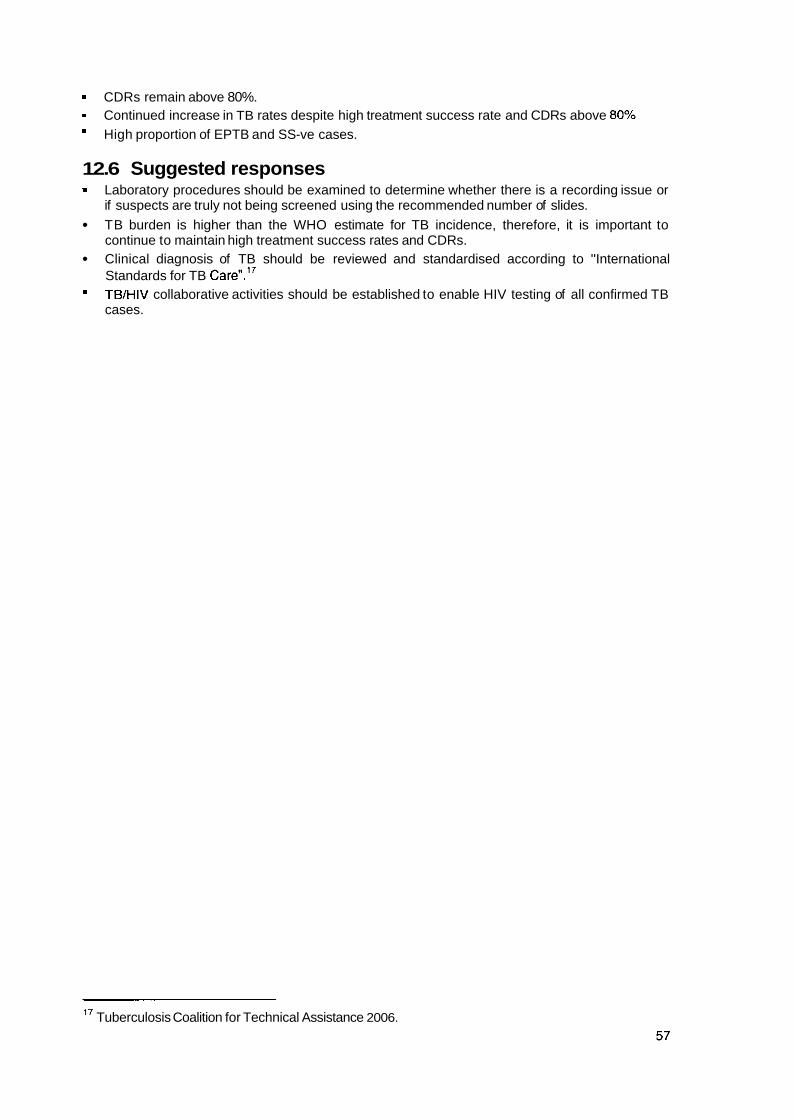
CDRs remain above 80%. Continued increase in TB rates despite high treatment success rate and CDRs above 80%,
m High proportion of EPTB and SS-ve cases.
12.6 Suggested responses Laboratory procedures should be examined to determine whether there is a recording issue or if suspects are truly not being screened using the recommended number of slides.
TB burden is higher than the WHO estimate for TB incidence, therefore, it is important to continue to maintain high treatment success rates and CDRs. Clinical diagnosis of TB should be reviewed and standardised according to "International Standards for TB care"."
m TBlHlV collaborative activities should be established to enable HIV testing of all confirmed TB cases.
17 Tuberculosis Coalition for Technical Assistance 2006.
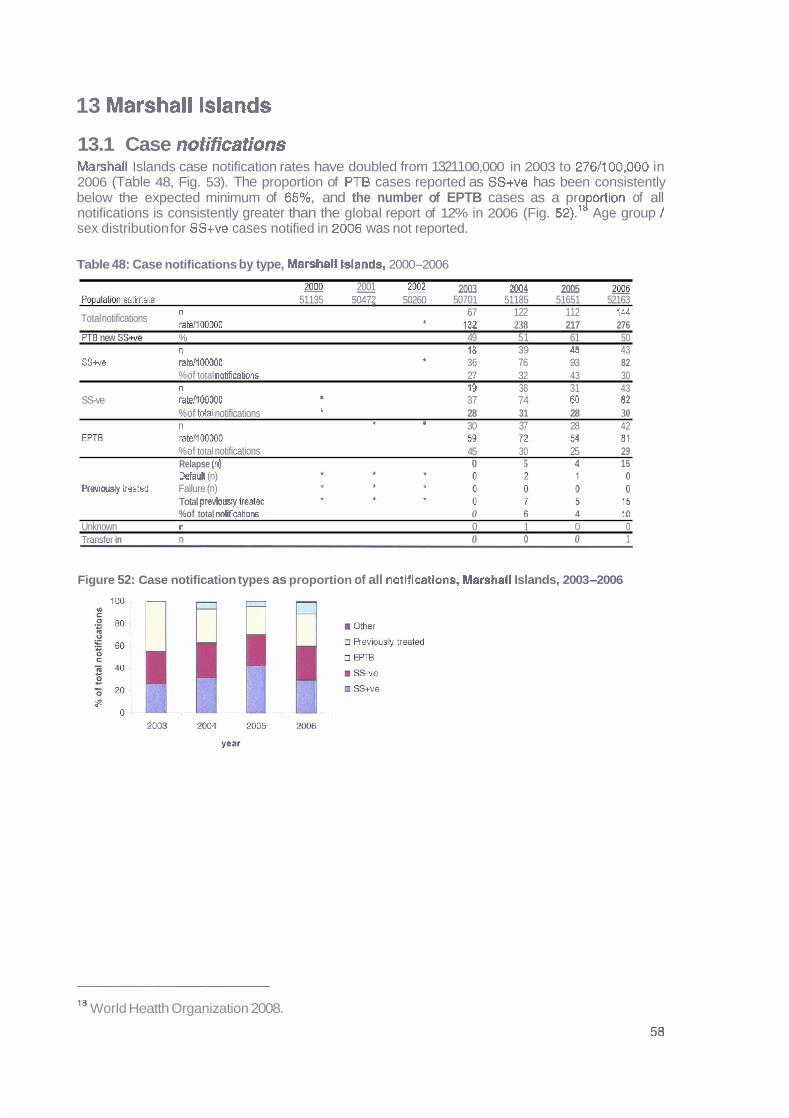
13 Marshall Islands
13.1 Case notifications Marshall Islands case notification rates have doubled from 13211 00,000 in 2003 to 2761100,000 in 2006 (Table 48, Fig. 53). The proportion of PT6 cases reported as SS+ve has been consistently below the expected minimum of 65%, and the number of EPTB cases as a pro ortion of all J' notifications is consistently greater than the global report of 12% in 2006 (Fig. 521.' Age group / sex distribution for SS+ve cases notified in 2006 was not reported.
Table 48: Case notifications by type, Marshall Islands, 2000-2006
2001 m - 2092 2003 2004 2005 2006 P o p ~ l m Mmate 51135 50472 50260 50701 51185 51651 52163
n * Total notifications ratdlOOOOO
67 122 112 144 * 132 238 217 276
PT0 new SS* % 49 51 61 50 n 18 39 48 43
SS+w ratellMO00 36 76 93 82 * %of total nMcations 27 32 43 30 n 19 38 31 43
SS-ve ratdlMlOOO 37 74 80 82 %of Wal notifications t 28 31 28 30 n t 30 37 28 42
%of total notifications 45 30 25 29 Relapse (n) 0 5 4 15 Defaull (n)
Pravimsly treated Failure (n) Total previousty beat& %of total notifcations 0 6 4 10
Unknown n 0 1 0 0 Transfer in n 0 0 0 1
Figure 52: Case notification types as proportion of all notifleatlons, Marshall Islands, 2003-2006
'' World Heatth Organization 2008.
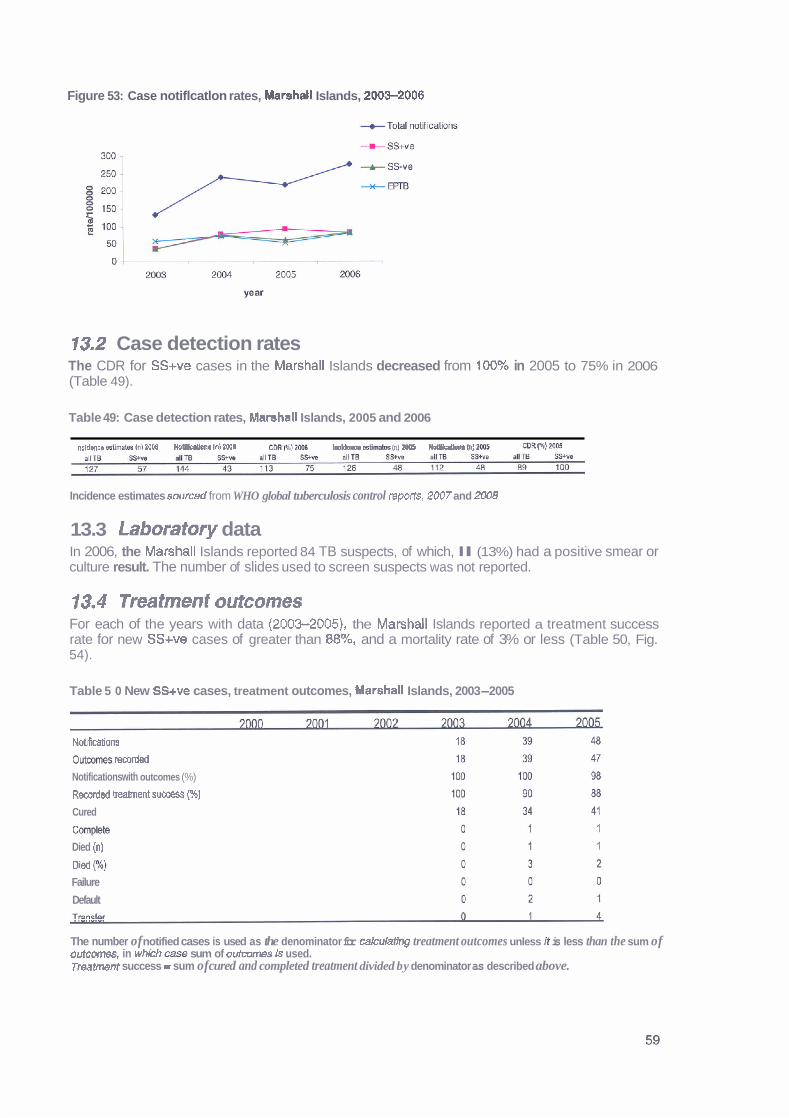
Figure 53: Case notiflcatlon rates, Marshall Islands, 2003-2006
13.2 Case detection rates The CDR for SS+ve cases in the Marshall Islands decreased from 100% in 2005 to 75% in 2006 (Table 49).
Table 49: Case detection rates, Marshall Islands, 2005 and 2006
lnoldsnw &kdam h1 nl Z W B o n r In) PMll C M WJIMIB Ineldeme s s t l m (n) aM5 NolPIFptbm In) MC6 Cm (96)
Incidence estimates sourced from WHO global tuberculosis control reports, 2007 and 2008
13.3 Laboratory data In 2006, the Marshall Islands reported 84 TB suspects, of which, l l (13%) had a positive smear or culture result. The number of slides used to screen suspects was not reported.
13.4 Treatment outcomes For each of the years with data (2003-2005), the Marshall Islands reported a treatment success rate for new SS+ve cases of greater than 88%, and a mortality rate of 3% or less (Table 50, Fig. 54).
Table 5 0 New SS+ve cases, treatment outcomes, Marshall Islands, 2003-2005
Notifications
0utm-t~ rscorded
Notifications with outcomes (%)
Recordad beahent success (%)
Cured
Cornp!8b
Died (n)
Dled p) Failure
Default
The number of notified cases is used as the denominator for cakulatlng treatment outcomes unless it is less than the sum of outcomes, in which c- sum of outromes Is used. Treatmnt success = sum of cured and completed treatment divided by denominator as described above.
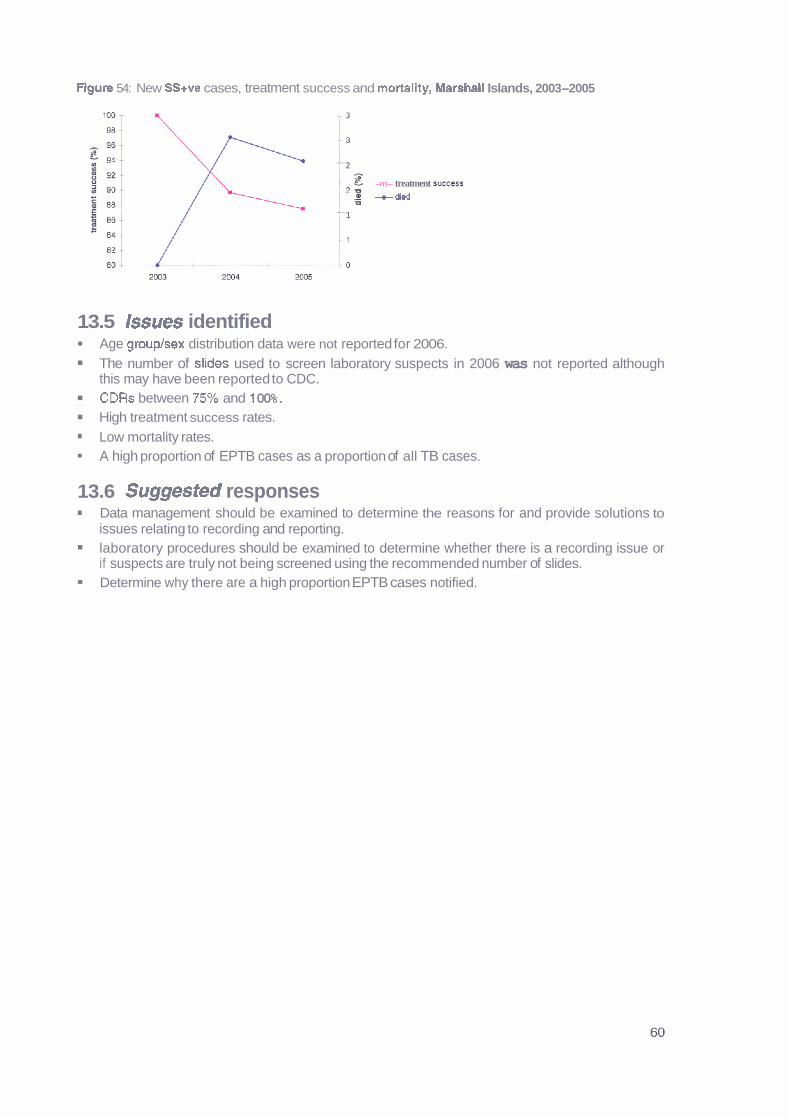
Figure 54: New SS+ve cases, treatment success and mortality, Marshall Islands, 2003-2005
- 3
1 3
-- 2
g -m- treatment succ=s -' % -died
-- 1
- 1
13.5 lssues identified Age grouplsex distribution data were not reported for 2006.
The number of slides used to screen laboratory suspects in 2006 was not reported although this may have been reported to CDC. CDRs between 95% and 1 00%. High treatment success rates. Low mortality rates. A high proportion of EPTB cases as a proportion of all TB cases.
13.6 Suggested responses Data management should be examined to determine the reasons for and provide solutions to issues relating to recording and reporting. laboratory procedures should be examined to determine whether there is a recording issue or if suspects are truly not being screened using the recommended number of slides. Determine why there are a high proportion EPTB cases notified.
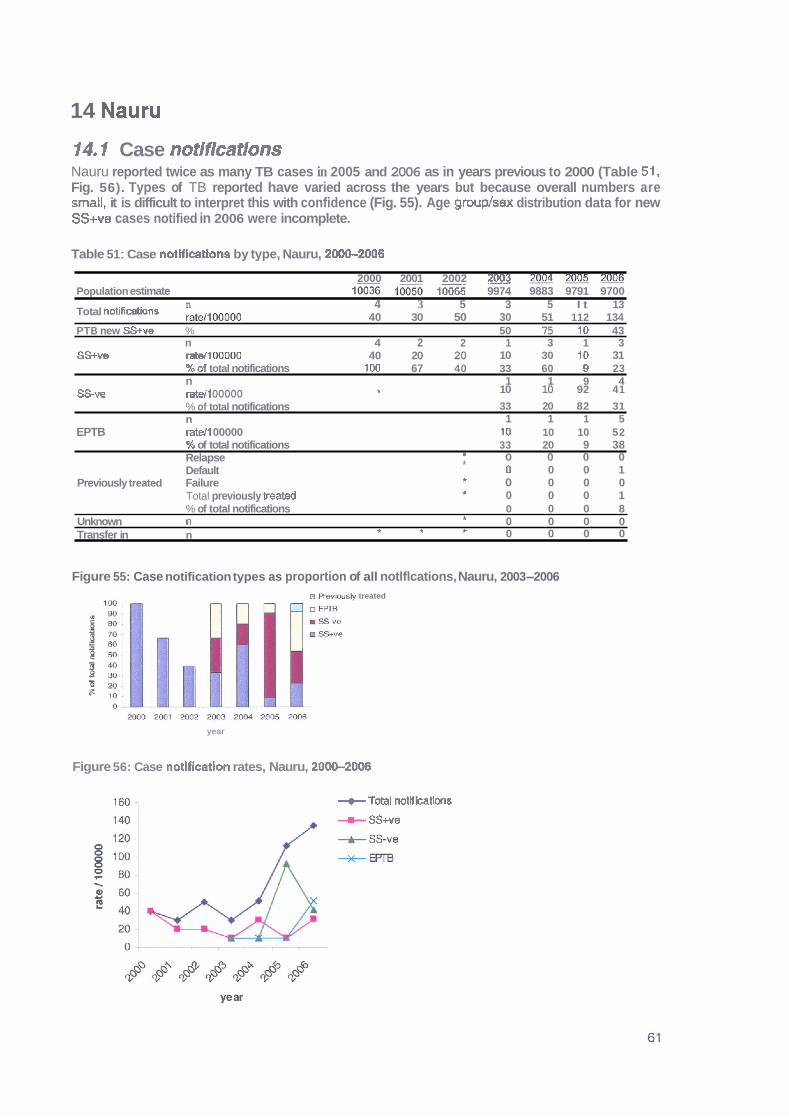
14 Nauru
14.1 Case notifications Nauru reported twice as many TB cases in 2005 and 2006 as in years previous to 2000 (Table 51. Fig. 56). Types of TB reported have varied across the years but because overall numbers are small, it is difficult to interpret this with confidence (Fig. 55). Age grouplsex distribution data for new SS+ve cases notified in 2006 were incomplete.
Table 51 : Case notlficatlons by type, Nauru, 2000-2008
2000 2001 2002 2003 m m m Population estimate l= 10065 9974 9883 9791 9700
n Total notifidions rate,l 00000
4 3 5 3 5 I t 13 40 30 50 30 51 112 134
PT B new SS+ve % 50 75 10 43 n 4 2 2 1 3 1 3
SS+ve ratell (#1000 40 20 20 10 30 10 31 %of total notifications 100 67 40 33 60 Q 23 n 1 1 9 4
SS-ve ratell 00000 II 10 10 92 41
% of total notifications 33 20 82 31 n 1 1 1 5
EPTB ratelt 00000 10 10 10 52 % of total notifications 33 20 9 38 Relapse 0 0 0 0 Default * D 0 0 1
Previously treated Failure * 0 0 0 0 Total previously mated * 0 0 0 1 % of total notifications 0 0 0 8
Unknown n 0 0 0 0 *
Transfer in n * * * 0 0 0 0
Figure 55: Case notification types as proportion of all notlflcations, Nauru, 2003-2006 n R%viushr treated
year
Figure 56: Case notlflcation rates, Nauru, 2000-2008
--t Total notrications
+ SS+ve
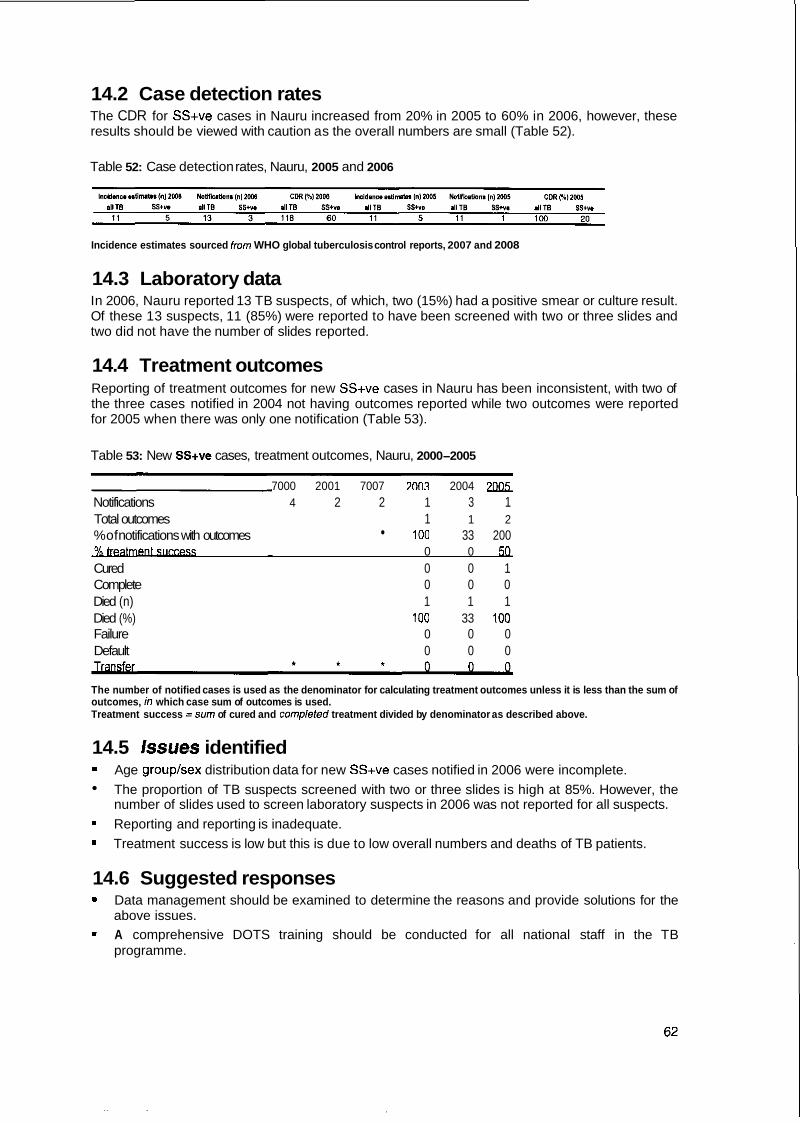
14.2 Case detection rates The CDR for SS+ve cases in Nauru increased from 20% in 2005 to 60% in 2006, however, these results should be viewed with caution as the overall numbers are small (Table 52).
Table 52: Case detection rates, Nauru, 2005 and 2006
Incidence estimates sourced from WHO global tuberculosis control reports, 2007 and 2008
14.3 Laboratory data In 2006, Nauru reported 13 TB suspects, of which, two (15%) had a positive smear or culture result. Of these 13 suspects, 11 (85%) were reported to have been screened with two or three slides and two did not have the number of slides reported.
14.4 Treatment outcomes Reporting of treatment outcomes for new SS+ve cases in Nauru has been inconsistent, with two of the three cases notified in 2004 not having outcomes reported while two outcomes were reported for 2005 when there was only one notification (Table 53).
Table 53: New SS+ve cases, treatment outcomes, Nauru, 2000-2005
7000 2001 7007 7003 2004 70Q5 Notifications 4 2 2 1 3 1 Total outcomes 1 1 2 %of notifications with outcomes 100 33 200
0 0 5Q Cured 0 0 1 Complete 0 0 0 Died (n) 1 1 1 Died (%) 100 33 100 Failure 0 0 0 Default 0 0 0
The number of notified cases is used as the denominator for calculating treatment outcomes unless it is less than the sum of outcomes, h? which case sum of outcomes is used. Treatment success =sum of cured and completed treatment divided by denominator as described above.
14.5 Issues identified Age grouplsex distribution data for new SS+ve cases notified in 2006 were incomplete.
The proportion of TB suspects screened with two or three slides is high at 85%. However, the number of slides used to screen laboratory suspects in 2006 was not reported for all suspects.
Reporting and reporting is inadequate.
Treatment success is low but this is due to low overall numbers and deaths of TB patients.
14.6 Suggested responses Data management should be examined to determine the reasons and provide solutions for the above issues. A comprehensive DOTS training should be conducted for all national staff in the TB programme.

15 New Caledonia
f 5.1 Case notifications Case notification rates in New Caledonia have varied between 2000 and 2006 but overall numbers are small (Table 54, Fig. 58). The proportion of PTB cases reported as new SS+ve has been consistently lower than the expected minimum of 65%.19 EPTB as a proportion of all notifications has consistently been higher than the global report of 12% in 2006 (Fig. 57).16
Table 54: Case notifications by type, New Caledonia, 20-2006
2 m Q l ~ ~ 2 a o 4 2 0 0 5 ~ Population &mate 213813 218057 222301 226545 230789 234418 238047
67 49 65 32 58 51 55 ~otdnotit-rs :a$llm 31 22 29 14 25 22 23 PTB new W e % 59 58 46 52 58 58 32
n 20 19 21 12 15 18 13
SS-ve ratellMX1M) 7 6 11 5 5 6 12 %of totd not W n s 21 29 38 34 29 25 51 n 29 14 18 7 30 18 9 -.
EPTB ratdlOD000 14 6 8 3 13 8 4 %oftotal no@ratinns 43 29 28 22 52 35 16 Rebpse In) 4 2 1 2 2 0 5 m t (n) 0 0 0 0 0 0 0
Pfeulously teated Failure (n) 0 0 0 0 0 0 0 TOM previwly treated 4 2 1 2 2 0 5 %of totA notifications 6 4 2 6 3 0 9
Unknorm n 0 0 0 0 0 2 0 Transfer m n 0 0 0 0 0 0 0
Figure 57: Case notification types as a proportion of all notifications, New Caledonia, 200+2006
%er
a R e v h s l y treated
UEPFB
U ssve
S W e
0
year
Figure 58: Case notification rates by type, New Caledonia, 2000-2006
I Q World Health Organization 2008.

M the new SS+ve cases notified by New Caledonia in 2006, two did not have age or sex reported, however, of those with data recorded, eight (73%) were males and three (27%) were females (Table 55, Fig. 59).
Table 55: New SS+ve cases, age grouphex distribution, New Caledonia, 2006
Age grmP Male Female Total
WIS n % n 9Q n
0-1 4
15-24
25-34 35-44
45-54
55-64
65+ All
Flgure 59: New SS+ve cases, age plrouplsex distribution, New Caledonia, 2006
I 4554 1
I
35-44 1 m % female
W % male
25-34
I 15-24 ,
&l4 1 1 h! I . I I l
i 30 20 10 0 10 m
1 $0
15.2 Case detection rates CDRs for SS+ve cases in New Caledonia have decreased from 67% in 2005 to 46% in 2006 (Table 56).
Table 56: Case detection rates, New Caledonia, 2005 and 2006
Incidence estimtes sourced from WHO global tubemIosis control reports, 2007 and 2008
15.3 Laboratory data No laboratory data were reported from New Caledonia in 2006.
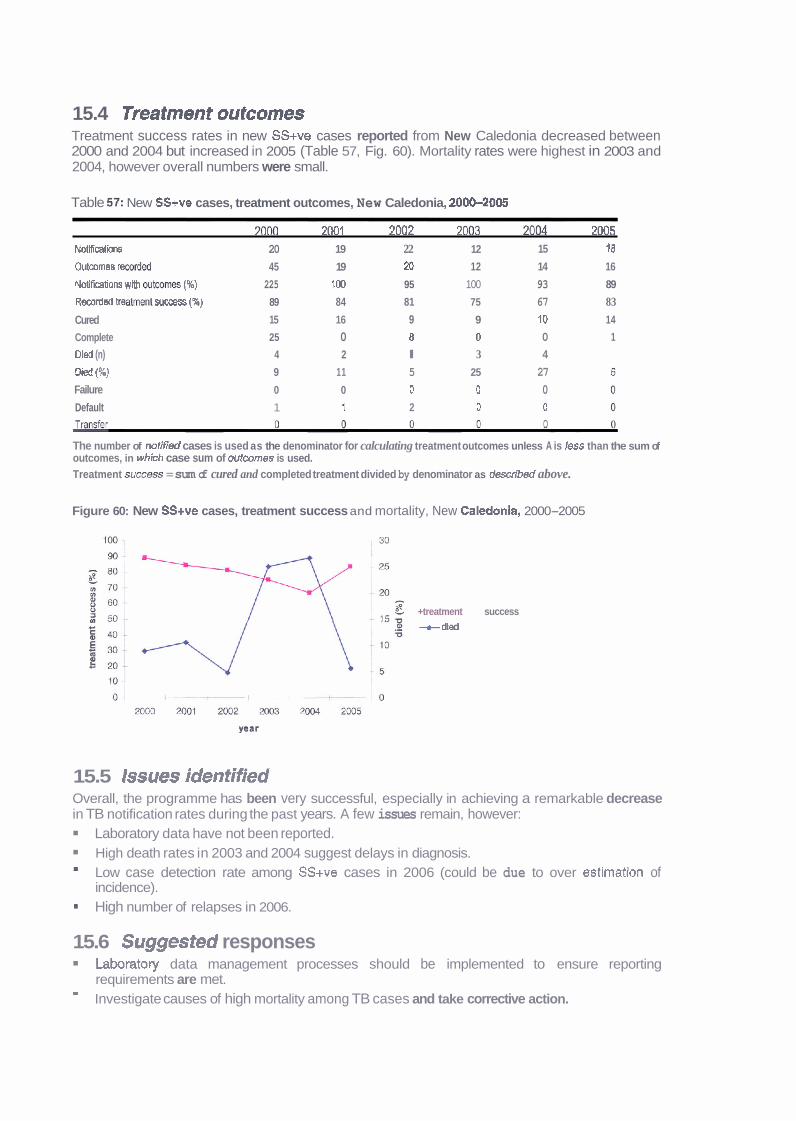
15.4 Treatment outcomes Treatment success rates in new SS+ve cases reported from New Caledonia decreased between 2000 and 2004 but increased in 2005 (Table 57, Fig. 60). Mortality rates were highest in 2003 and 2004, however overall numbers were small.
Table 5 2 New SS+ve cases, treatment outcomes, New Caledonia, 2000-2005
7 n ~ 70131 7nn7 70112 7 ~ l ~ 7 ~ 5 Notfficatii 20 19 22 12 15 18
Outwmes rmrdd 45 19 20 12 14 16
Notifimlions wm mtr,omes (%) 225 100 95 100 93 89
Rmrded b e a m suocess (X) 89 84 81 75 67 83
Cured 15 16 9 9 10 14
Complete 25 0 8 0 0 1
Dled (n) 4 2 l 3 4
Died { X ) 9 11 5 25 27
Failure 0 0 0 0 0 Default 1 1 2 0 0
P-
The number of notif;& cases is used as the denominator for calculating treatment outcomes unless A is less than the sum of outcomes, in which case sum of outcomes is used. Treatment S- = sum of cured and completed treatment divided by denominator as described above.
Figure 60: New SS+ve cases, treatment success and mortality, New Caledonia, 2000-2005
+treatment success --t dted
15.5 Issues identified Overall, the programme has been very successful, especially in achieving a remarkable decrease in TB notification rates during the past years. A few issues remain, however:
Laboratory data have not been reported. High death rates in 2003 and 2004 suggest delays in diagnosis.
m Low case detection rate among SS+ve cases in 2006 (could be due to over estimation of incidence). High number of relapses in 2006.
15.6 Suggested responses Laboratory data management processes should be implemented to ensure reporting requirements are met. - Investigate causes of high mortality among TB cases and take corrective action.
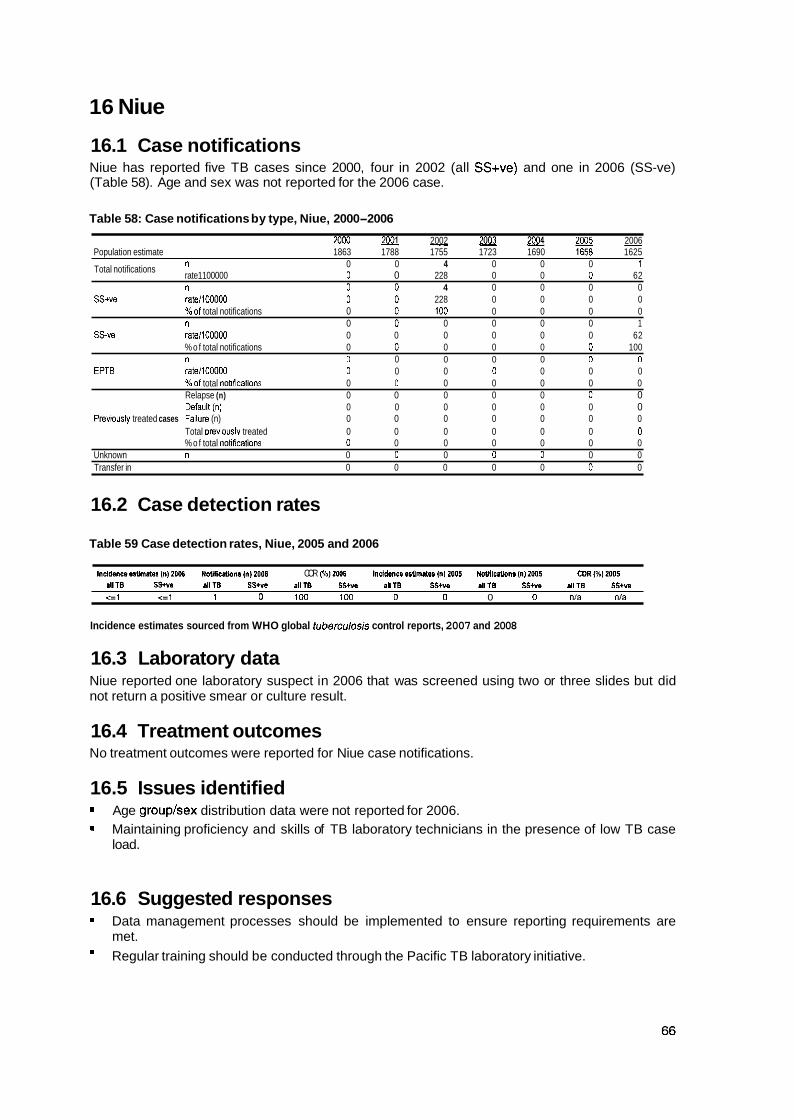
16 Niue
16.1 Case notifications Niue has reported five TB cases since 2000, four in 2002 (all SS+ve) and one in 2006 (SS-ve) (Table 58). Age and sex was not reported for the 2006 case.
Table 58: Case notifications by type, Niue, 2000-2006
20W 2001 2002 m 2005 2006 Population estimate 1863 1788 1755 1723 1690 1668 1625
Total notifications " 0 0 4 0 0 0 1 rate1100000 0 0 228 0 0 0 62 n 0 0 4 0 0 0 0
SSwe rateItOOOO0 0 0 228 0 0 0 0 % o f total notifications 0 0 100 0 0 0 0 n 0 0 0 0 0 0 1
SSw rateit00000 0 0 0 0 0 0 62 % o f total notifications 0 0 0 0 0 0 100 n 0 0 0 0 0 0 0
EPTB rate1100000 0 0 0 0 0 0 0 % o f total notlficatlons 0 0 0 0 0 0 0 Relapse (n) 0 0 0 0 0 0 0 Defaull (D) 0 0 0 0 0 0 0
Previously treated cases Falure (n) 0 0 0 0 0 0 0 Total ~rev~ouslv treated 0 0 0 0 0 0 0 % o f total notifications 0 0 0 0 0 0 0
Unknown n 0 0 0 0 0 0 0 Transfer in 0 0 0 0 0 0 0
16.2 Case detection rates
Table 59 Case detection rates, Niue, 2005 and 2006
Incldsnce.sUmlsl (nI20W NoWicalo~on8 (n)2006 COR [%l2006 In t ldmo l~~ t ima le~ In) ZOOS Ndficaons (nI2WS CDR(%12005 allTB S y v a allTB SSIve r l l m S S n d1lB SS+ve allTB SS+". a1118 SS+- <.l <=l 1 0 1 W 100 0 0 0 0 nla nla
Incidence estimates sourced from WHO global luberculosis control reports, 2007 and 2008
16.3 Laboratory data Niue reported one laboratory suspect in 2006 that was screened using two or three slides but did not return a positive smear or culture result.
16.4 Treatment outcomes No treatment outcomes were reported for Niue case notifications.
16.5 Issues identified Age grouplsex distribution data were not reported for 2006. Maintaining proficiency and skills of TB laboratory technicians in the presence of low TB case load.
16.6 Suggested responses Data management processes should be implemented to ensure reporting requirements are met.
m Regular training should be conducted through the Pacific TB laboratory initiative.
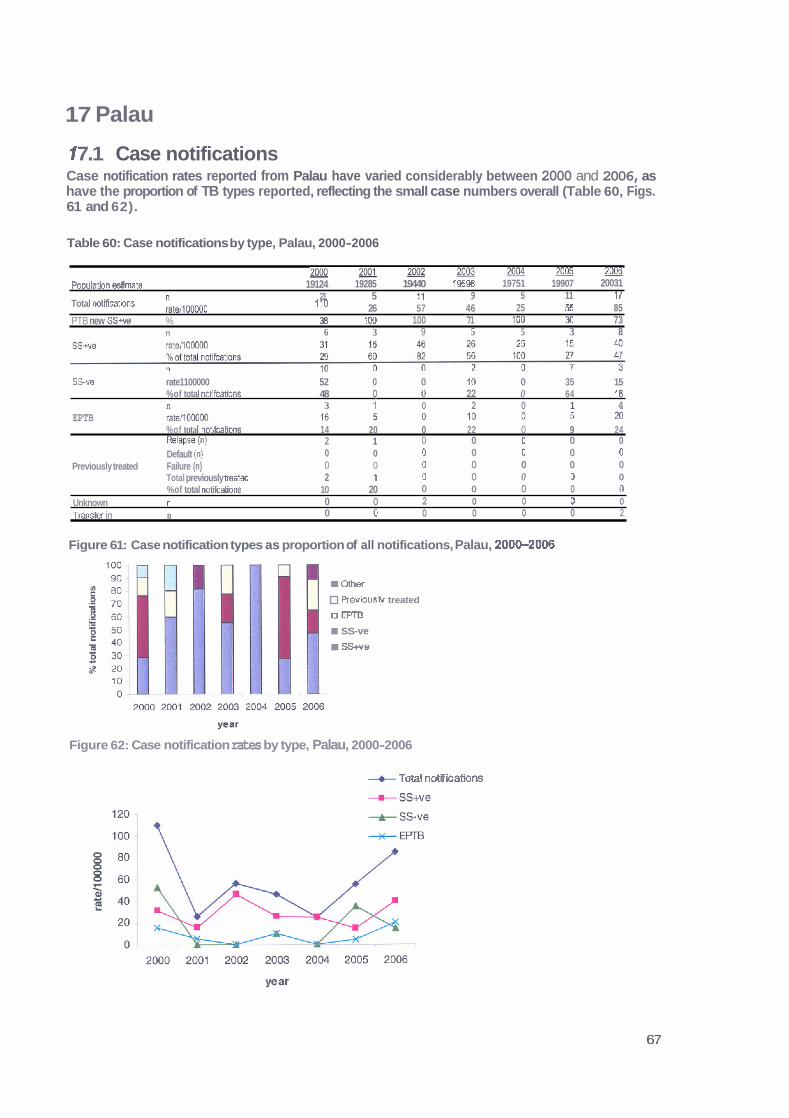
17 Palau
1 7.1 Case notifications Case notification rates reported from Palau have varied considerably between 2000 and 2006, as have the proportion of TB types reported, reflecting the small case numbers overall (Table 60, Figs. 61 and 62).
Table 60: Case notifications by type, Palau, 2000-2006
2006 m M ~ 2 e e 2 2 0 0 3 m 2 o O s - Populahn &mate 19124 19285 19440 795% 19751 19907 20031
21 5 11 9 5 11 17 Total rmtificatbns ~ , 1 0 0 0 0 0 110 26 57 46 25 55 85 PTB new SS+ve % 38 IDO 100 71 100 30 73
n 6 3 9 5 5 3 8
. .
SSve rate1100000 52 0 0 10 0 35 15 %of total notifcations 48 Q 0 22 0 64 18 n 3 1 0 2 0 1 4
EPTB %of total notifcations 14 20 0 22 0 9 24 Relapse (n) 2 1 0 0 0 0 0 Default (n) 0 0 0 0 0 0 0
Previously treated Failure (n) 0 0 0 0 0 0 0 Total previously hated 2 1 0 0 0 0 0 %of total notifcations 10 20 0 0 0 0 0
Unknown n 0 0 2 0 0 0 0
Tran* in n 0 0 0 0 0 0 2
Figure 61: Case notification types as proportion of all notifications, Palau, 200&2006
r Gthef
Previously treated
a m SS-ve SS+ve
Figure 62: Case notification rates by type, Palau, 2000-2006
+ Total notif ieations

Age group and sex data were available for seven of the eight reported .new SS+ve cases from Palau in 2006 (Table 61, Fig. 63). The majority of cases (86%) were male aged between 35 and 54 years.
Table 61: New SS+ve cases, age grouplsex dlstributlon, Palau, 2006
Age group Male Ferna b Toial
years n % n % n
0-14
15-24
25-34
35-44
45-54
55-64
6 5 4
All
Figure 63: New SS+ve cases, age grouplsex distribution, Palau, 2006
17.2 Case defection rates CDRs for SS+ve cases in Palau increased from 60% in 2005 to 160% in 2006, however, these results should be viewed with caution as the overall numbers are small (Table 62).
Table 62 Case detection rates, Palau, 2005 and 2006
Incidence estimates sourced from WHO global tube~culosis control reports, 2007 and 2008
1 7.3 Laboratory data In 2006 Palau reported 38 TB suspects, of which, 3 (8%) had a positive smear or culture result. Of these 38 suspects, 3 (8%) were reported to have been screened using one slide and 35 (92%) with two or three slides.
17.4 Treatment outcomes The treatment success rate of new SS+ve cases reported in Palau increased from 2000 to 2005 (Table 63, Fig. 64). Of note is the reporting of more outcomes than notifications in 2004.
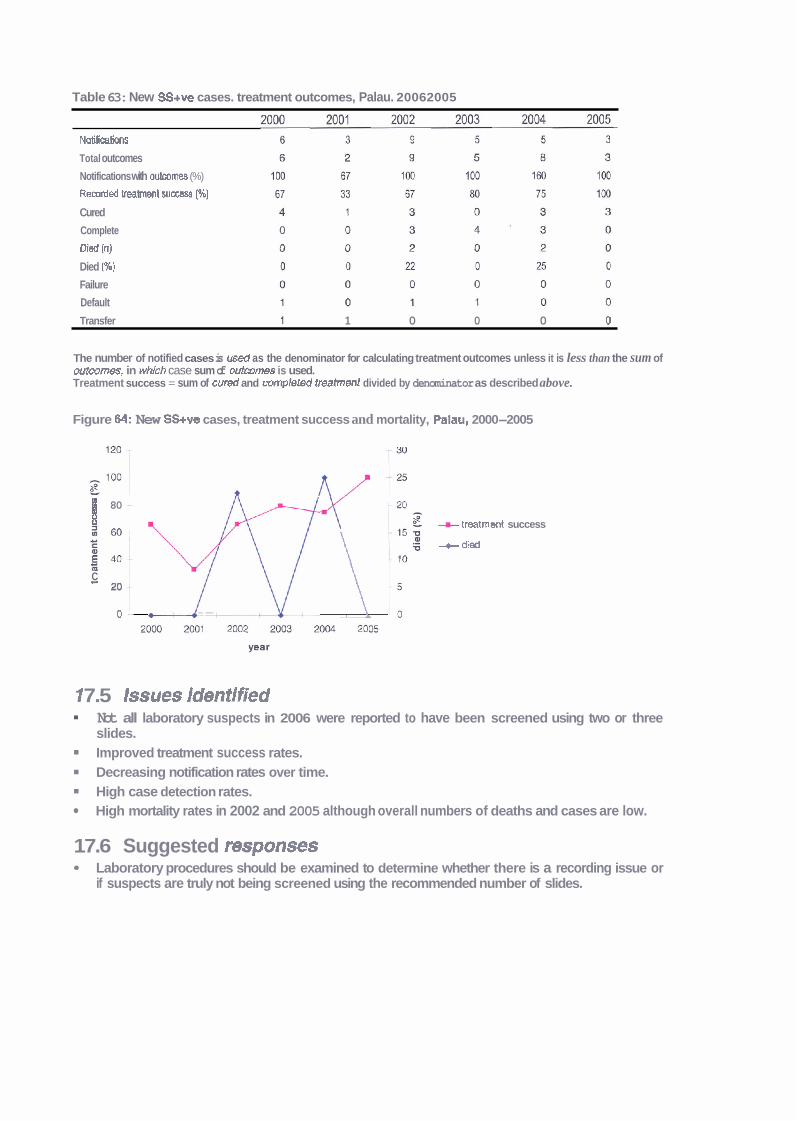
Table 63: New SS+ve cases. treatment outcomes, Palau. 20062005
Notifications
Total outcomes
Notifications with outwmes (%)
Recorded treatment success (96)
Cured
Complete
Died (n)
Died (%)
Failure
Default
Transfer 1 1 0 0 0 0
The number of notified cases is u s d as the denominator for calculating treatment outcomes unless it is less than the sum of outmrnes, in whkh case sum of outcomes is used. Treatment success = sum of cured and completed treatment divided by denominator as described above.
Figure M: New SS+ve cases, treatment success and mortality, Palau, 2000-2005
B 80 + treatrnsnt success m i hl'yd \ +died
E M C - 20
0 - --
1 7.5 Issues identified Not all laboratory suspects in 2006 were reported to have been screened using two or three slides. Improved treatment success rates. Decreasing notification rates over time. High case detection rates. High mortality rates in 2002 and 2005 although overall numbers of deaths and cases are low.
17.6 Suggested responses Laboratory procedures should be examined to determine whether there is a recording issue or if suspects are truly not being screened using the recommended number of slides.

18 Papua New Guinea
18.1 Case notifications PNG case notification rates have remained constant between 2000 and 2006 except for 2003, which had an almost 60% increase in notifications (Table 64, Fig. 66). The low proportion of PTB cases reported as SS+ve is likely to reflect the incomplete implementation of the DOTS programme. EPTB cases as a proportion of all notifications has been consistently higher than that reported globally (Fig. 65).20 No age grouplsex distribution data were available for new SS+ve cases reported in 2006.
Table 64: Case notifications by type, PEIG, 2000-2006
2001 2000 2003 2004 xm 2006 Populamn &m& 5190786 5525884 5655348 5;r86895 5920464 6 0 m 1 6193435
TotalrmUWow 10520 12658 11197 19729 12743 12564 13532 203 229 198 341 215 207 21 8
PTB new SS- % 31 27 26 25 n 1933 1351 1345 3231 1896 1805 1948
S S w ratell woo0 37 24 24 56 32 M 31 %of totd noCfications 18 11 12 16 15 14 14 n * 7038 5234 5105 5969
%of totd nollkatjons 36 41 41 44 n * 6769 4176 4198 4575
EPT8 ratd100M)O 117 71 69 74 %of totd nolifrcations 34 33 33 34 Relapse (n) 1967 1437 1456 1 28 Dafwlt Inl 0 0 0 0
Prevau* Failure (n) 0th~ (n) Total prsviously treat& 1967 1437 1456 1040
Figure 65: Case notification types as proportion of all notifications, PNG, 2000-2006 100
U Wevwuely treated
a m 60 - I s s v e
I sa+ve
0 .
20 World Health Organization 2008.
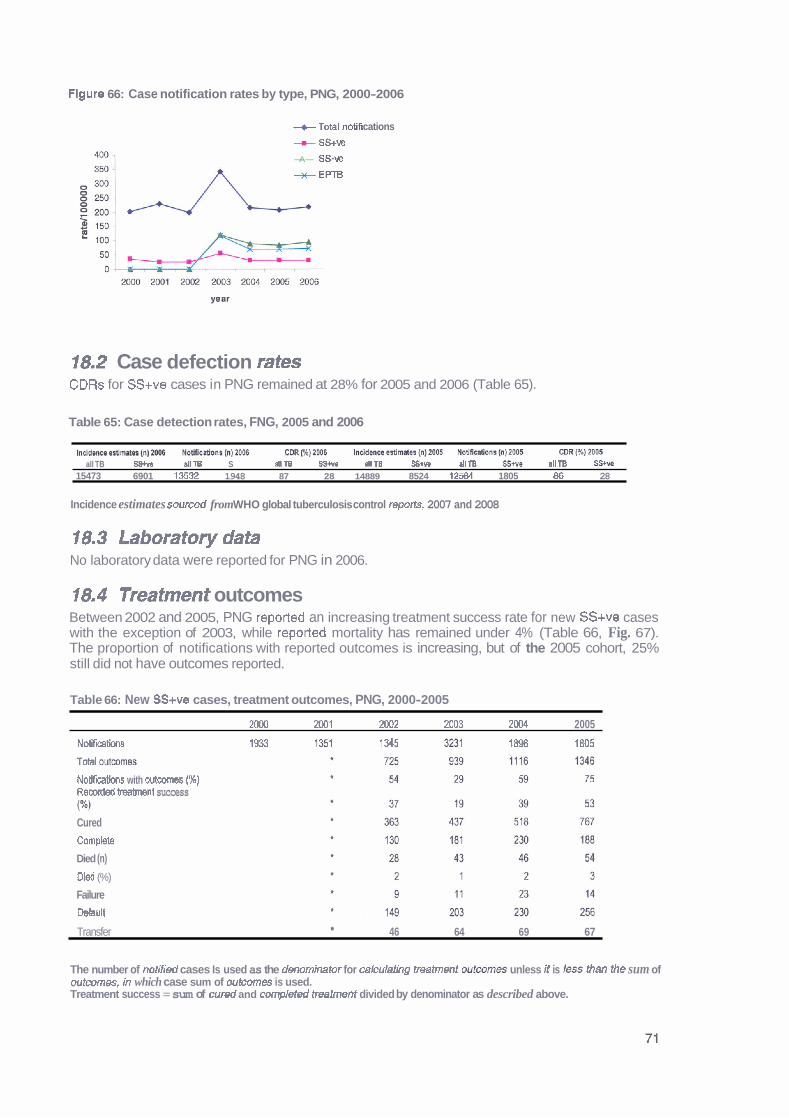
Flgure 66: Case notification rates by type, PNG, 2000-2006
--e Totel notif cations - ss+w -A- SS-v2
+ EPTB
18.2 Case defection rates CDRs for SS+ve cases in PNG remained at 28% for 2005 and 2006 (Table 65).
Table 65: Case detection rates, FNG, 2005 and 2006
. . . . . . . . . .
all TB SS+w allTB S allTB SSWo dl TB QBIlPD allTB SSIm allTB 15473 6901 13532 1948 87 28 14889 8524 12584 1805 86 28
Incidence estimates sourced from WHO global tuberculosis control reports, 2007 and 2008
18.3 Laboratory data No laboratory data were reported for PNG in 2006.
18.4 Treatment outcomes Between 2002 and 2005, PNG reported an increasing treatment success rate for new SS+ve cases with the exception of 2003, while reported mortality has remained under 4% (Table 66, Fig. 67). The proportion of notifications with reported outcomes is increasing, but of the 2005 cohort, 25% still did not have outcomes reported.
Table 66: New SS+ve cases, treatment outcomes, PNG, 2000-2005
2000 2001 20M 2003 2M14 2005
N- 193 1361 I 345 3231 18% 1805
Total wtcMnes
Notificatiwrs with wtcwnes ( X ) Recorded treatment success (W) Cured
Complete
Died (n)
o i (%)
Failure
Default
Transfer 46 64 69 67
The number of notified cases Is used as the denominator for cakulating treatment outcom~s unless it is less Man the sum of outcomes, in which case sum of outcomes is used. Treatment success = sum of cured and completed treatment divided by denominator as described above.
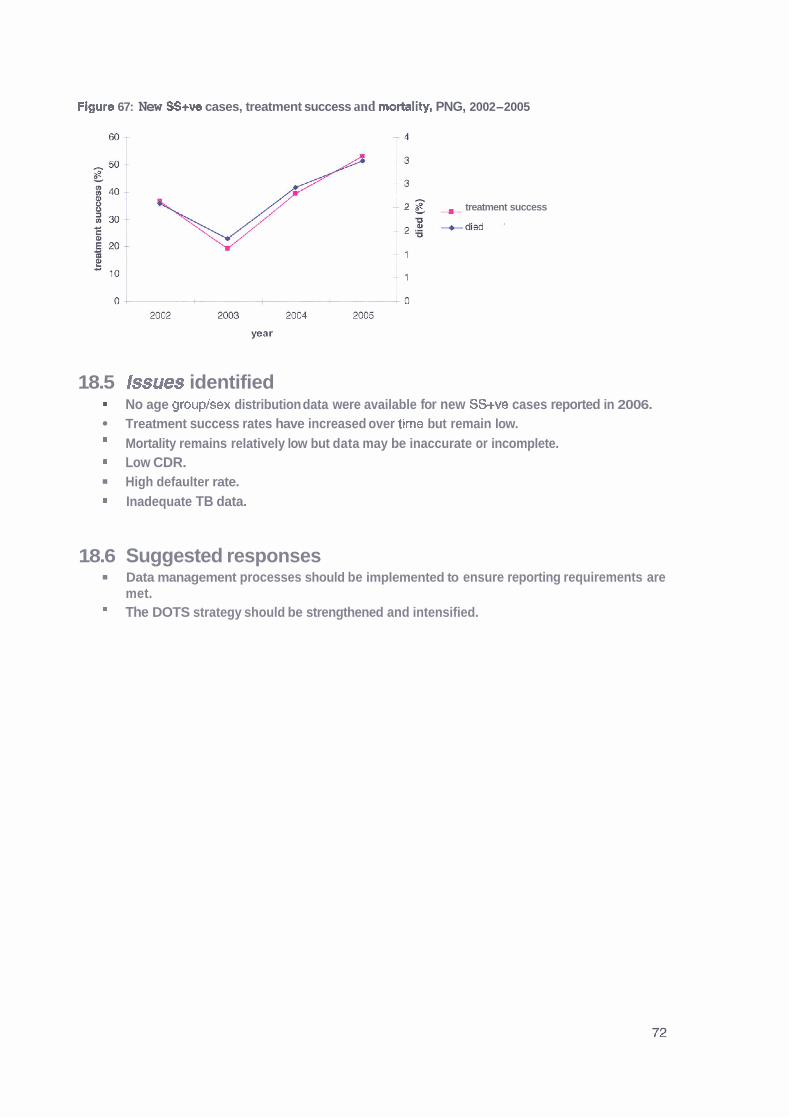
Figure 67: New SS+ve cases, treatment success and mortality, PNG, 2002-2005
-1 2 8 treatment success
18.5 Issues identified No age grouplsex distribution data were available for new SS+ve cases reported in 2006. Treatment success rates have increased over time but remain low. Mortality remains relatively low but data may be inaccurate or incomplete. Low CDR. High defaulter rate. Inadequate TB data.
18.6 Suggested responses Data management processes should be implemented to ensure reporting requirements are met. The DOTS strategy should be strengthened and intensified.
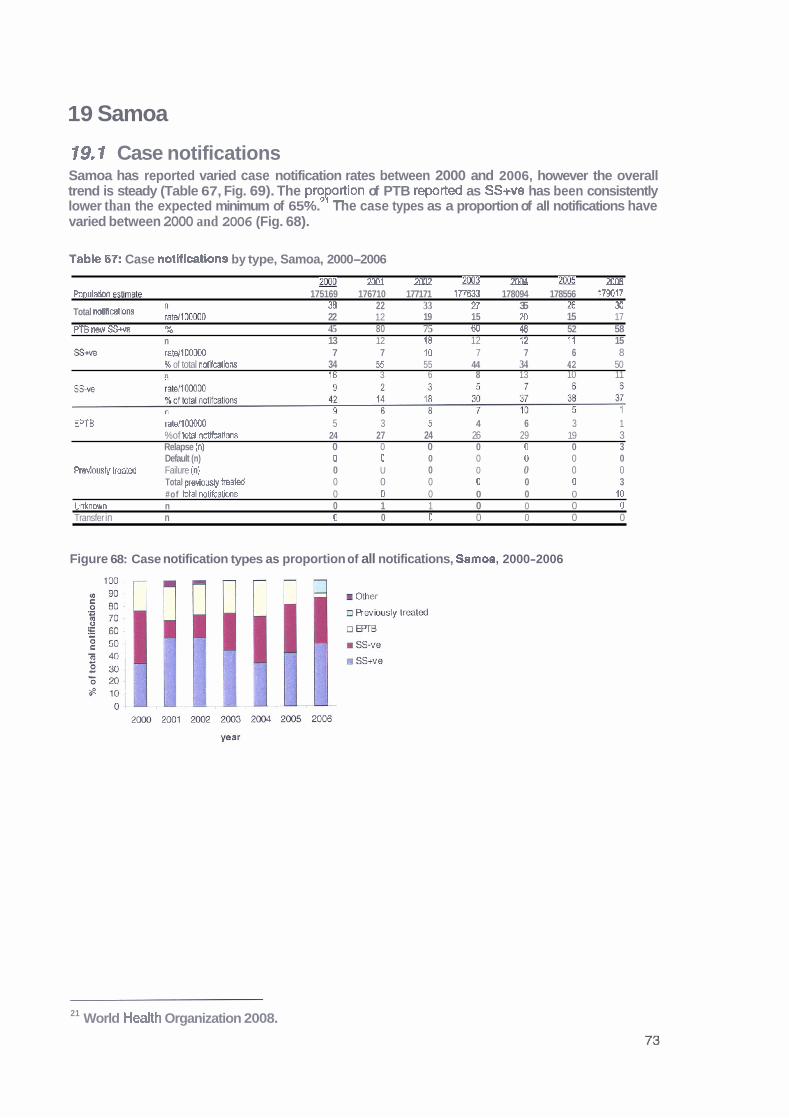
19 Samoa
19.1 Case notifications Samoa has reported varied case notification rates between 2000 and 2006, however the overall trend is steady (Table 67, Fig. 69). The pmportion of PTB reported as SScve has been consistently lower than the expected minimum of 65%. The case types as a proportion of all notifications have varied between 2000 and 2006 (Fig. 68).
Table 17: Case notifications by type, Samoa, 2000-2006
g@ - 2M11 - 2002 m - 20W m3 2006 - P o p u l m &lmate 175169 176710 177171 IT7633 178094 178556 179017
38 22 33 n 35 B 30 Total noliiimtions Llmo0 22 12 19 15 20 15 17 PTB new SS+w % 45 80 75 60 45 52 58
n 13 12 18 12 f 2 11 15 S W rats1100MX1 7 7 10 7 7 6 8
k of total notlbtiorts 34 B 55 44 34 42 50 n 16 3 6 8 13 10 11
EPTB ratdlOW00 5 3 5 4 6 3 1 %of totd notifcalions 24 27 24 26 29 19 3 Relapse (n} 0 0 0 0 0 0 3 Default (n) 0 0 0 0 0 0 0
Rsviously treat& Failure (n} 0 U 0 0 0 0 0 Total previoudy l r e a k 0 0 0 0 0 0 3 #of total notifcations 0 0 0 0 0 0 10
Unknwrn n 0 1 1 0 0 0 0 Transfer in n 0 0 0 0 0 0 0
Figure 68: Case notification types as proportion of all notifications, Samoa, 2000-2006
21 World Health Organization 2008.
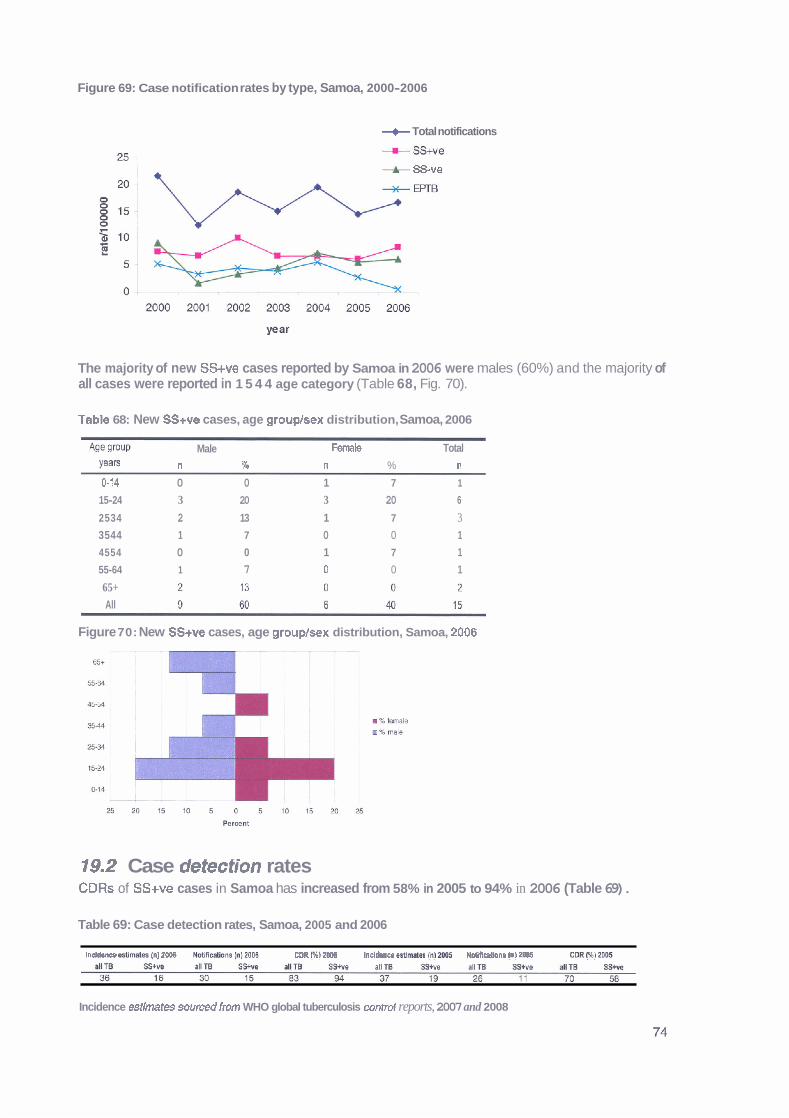
Figure 69: Case notification rates by type, Samoa, 2000-2006
+ Total notifications
* ss-ve
The majority of new SS+ve cases reported by Samoa in 2006 were males (60%) and the majority of all cases were reported in 1 5 4 4 age category (Table 68, Fig. 70).
Tabk 68: New SS+ve cases, age grouplsex distribution, Samoa, 2006
Age group Male Female Total Yea'= n % n % n 0-14 0 0 1 7 1
15-24 3 20 3 20 6
2534 2 13 1 7 3 3544 1 7 0 0 1
4554 0 0 1 7 1
55-64 1 7 0 0 1
65+ All
Figure 70: New SS+ve cases, age groupbx distribution, Samoa, 2006
19.2 Case detection rates CDRs of SS+ve cases in Samoa has increased from 58% in 2005 to 94% in 2006 (Table 69).
Table 69: Case detection rates, Samoa, 2005 and 2006
Incl- sstlmtm lnl tOOB Nctiicatlolw InlMDS CDR FA) 2WB Indhes pltlmPtsl in= NOWIEstsons lnl2WS CDR(4BlaDW
Incidence estimates sourced from WHO global tuberculosis control reports, 2007 and 2008

19.3 Laboratory data In 2006, Samoa reported 320 laboratory suspects, of which, 17 (5%) were smear or culture positive. Of these 320 suspects, 113 (35%) were reported to have been screened using one slide, I40 (44%) with two or three slides and 67 (21%) did not have the number of slides reported.
19.4 Treatment outcomes Samoa has reported treatment success in more than 90% of new SS+ve cases in all years between 2000 and 2005 except for 2003 (83%) (Table 70, Fig. 71). No deaths have been reported between 2003 and 2005. Of note is the reporting of more outcomes than notifications in 2004 and 2005.
Table 70: New SS+ve cases, treatment outcomes, Samoa, 200b2005
7MO 7001 717133 7M3 70n4 7M5
Notificatrons 13 12 18 12 12 11 Outmms reoorded 13 12 13 12 f 4 15 Notifcatlons with outcomes (%) 100 100 94 10D 117 1 36 R m r d d treahmnt sumss (%) 92 92 83 92 100 93
Cured 10 8 14 'It f 2 11 Complete 2 3 1 0 2 3 Died {n) 1 1 2 0 0 0 Oied {%) 8 8 11 0 0 0
Failure 0 0 0 0 0 D Default 0 0 0 0 0 0
r 0 0 0 1 0 1
The number of notified cases is used as the denominator for calculating treatment outcomes unless it is less than the sum of outcomes, in which case sum of outcomes is used Treatment success = sum of cured and completed treatment divided by denominator as described above.
Figure 71: New SS+ve cases, treatment success and mortality, Samoa, 2000-2005
75 --J 0 2 0 0 0 2 0 0 1 2 0 0 2 m 2 0 W 2 0 0 5
war
19.5 Issues identified Overall, very successful programme with good performance, especially important achievements in case detection and case management, the few issues identified are:
Over 50% of laboratory suspects either did not have the number of slides used for screening reported or were reported to have used only one slide. More outcomes than notifications were reported for the 2005 cohort. Increased number of relapses in 2006.

19.6 Suggested responses Laboratory procedures should be examined to determine whether there is a recording issue or if suspects are truly not being screened using the recommended number of slides.
Data management should be examined to determine the reasons for the discrepancy in reporting and solutions implemented.
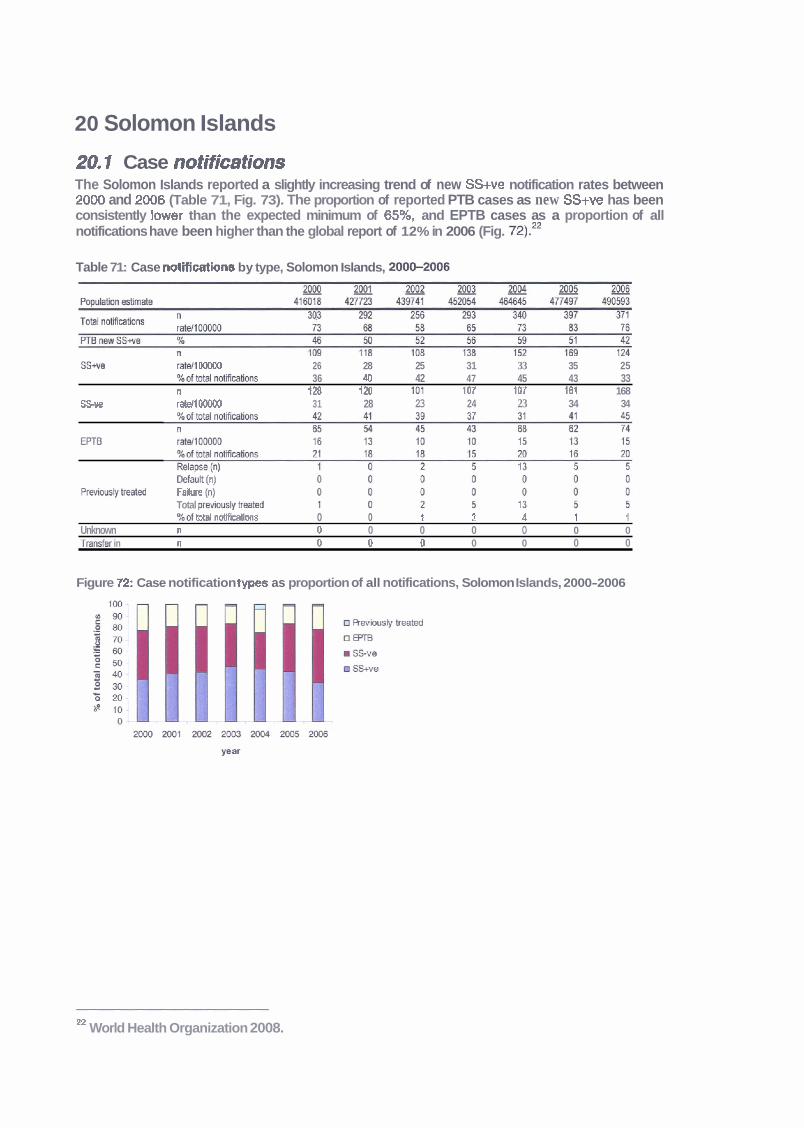
20 Solomon Islands
20.1 Case notifications The Solomon Islands reported a slightly increasing trend of new SS+ve notification rates between 2000 and 2006 (Table 71, Fig. 73). The proportion of reported PTB cases as new SS+ve has been consistently jower than the expected minimum of 65%, and EPTB cases as a proportion of all notifications have been higher than the global report of 12% in 2006 (Fig. 72).=
Table 71: Case notifications by type, Solomon Islands, 2OOS2006
SS* W1 00000 26 28 25 31 33 35 25 X o f t o t a l ~ s 36 40 42 47 45 43 33 n t28 120 tot 1W 107 161 168
SSve M100000 31 28 23 24 23 34 34
Defa;lt (") ' Pmmdyb~&~I Fahre In)
Total u m i w h W e d %of $till n&ms o o t 2 4 I I
Unknown n 0 0 0 0 0 0 0 Tm&r in n 0 0 0 0 0 0 0
Figure f2: Case notification types as proportion of all notifications, Solomon Islands, 2000-2006
n World Health Organization 2008.
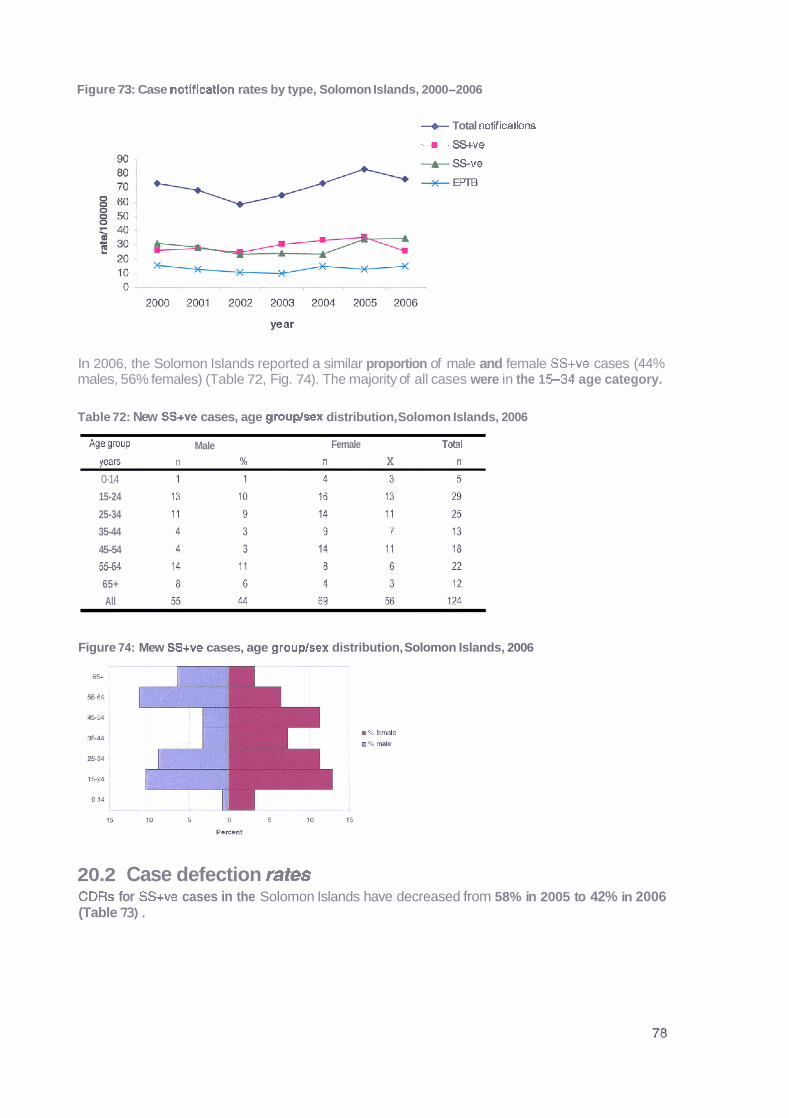
Figure 73: Case notlficatlon rates by type, Solomon Islands, 2000-2006
+ Total notH lcatlons
-+- SS+ve
In 2006, the Solomon Islands reported a similar proportion of male and female SS+ve cases (44% males, 56% females) (Table 72, Fig. 74). The majority of all cases were in the 1 5 3 4 age category.
Table 72: New SS+ve cases, age group/sex distribution, Solomon Islands, 2006
Age group Male Female T&l
WE n 9Q n X n
0-14
15-24
25-34
35-44
45-54
55-64
65+
All
Figure 74: Mew SS+ve cases, age grouplsex distribution, Solomon Islands, 2006
20.2 Case defection rates CDRs for SS+ve cases in the Solomon Islands have decreased from 58% in 2005 to 42% in 2006 (Table 73).
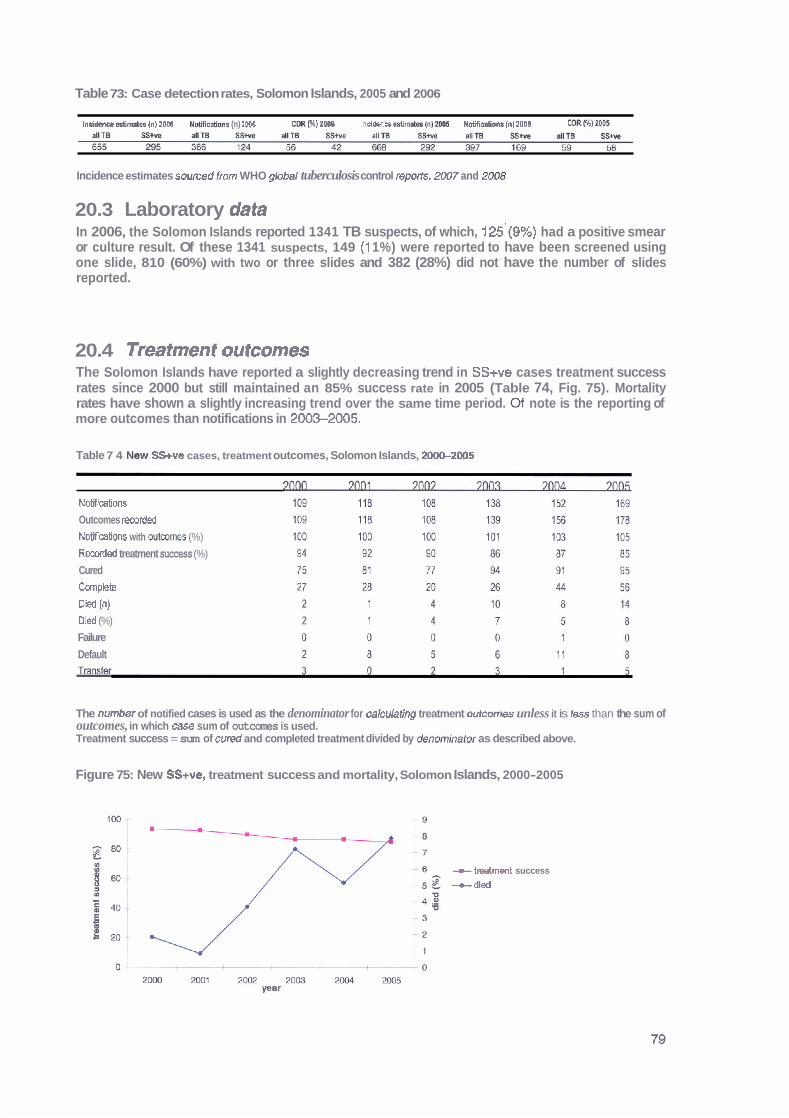
Table 73: Case detection rates, Solomon Islands, 2005 and 2006
I n e i h &m* (n) 2006 N&@na {n) 1WB CUR (9L) 2WB Incl0sncs eslm- ( n ) W Notificaims (n) ZOOS mRMm5
Incidence estimates soumd fmm WHO global tuberculosis control reports, 2007 and
20.3 Laboratory data In 2006, the Solomon Islands reported 1341 TB suspects, of which, 125'(9%) had a positive smear or culture result. Of these 1341 suspects, 149 (1 1%) were reported to have been screened using one slide, 810 (60%) with two or three slides and 382 (28%) did not have the number of slides reported.
20.4 Treatment outcomes The Solomon Islands have reported a slightly decreasing trend in SS+ve cases treatment success rates since 2000 but still maintained an 85% success rate in 2005 (Table 74, Fig. 75). Mortality rates have shown a slightly increasing trend over the same time period. Of note is the reporting of more outcomes than notifications in 2003-2005.
Table 7 4 Mew SS+ve cases, treatment outcomes, Solomon Islands, 2-2005
Notifmtions Outcomes rmrded Notifitions with w h m (%)
Rewrded treatment success (%)
Cured
Complete
Dkd (0)
Dled (%)
Failure
Default
The numhr of notified cases is used as the denominator for calculattng treatment outcomes unless it is less than the sum of outcomes, in which case sum of outcomes is used. Treatment success = sum of cured and completed treatment divided by &nomInator as described above.
Figure 75: New SS+ve, treatment success and mortality, Solomon Islands, 2000-2005
-treatment success
-died

20.5 Issues identified Treatment success rates have decreased slightly over time but have remained at 85% and above. Notification rates have remained stable over time.
Almost 40% of laboratory suspects in 2006 either did not have the number of slides used for screening reported, or had only one slide reported as being used.
* Mortality rates have been increasing over time.
More outcomes than notifications were reported for the 2003-2005 cohorts.
Inadequate TB data.
20.6 Suggested responses Laboratory procedures should be examined to determine whether there is a recording issue or if suspects are truly not being screened using the recommended number of slides.
Data management should be examined to determine the reasons for the discrepancy in reporting and solutions implemented. The reasons behind increasing mortality rates should be investigated if possible.

21 Tonga
2 1.1 Case notifications Tonga has reported varied notification rates between 2000 and 2006, however overall case numbers are small (Table 75, Fig. 77). The proportion of PTB reported as SS+ve has consistently met the expected minimum of 65%.23 The proportion of notifications that are SS+ve has consistently been >SO% (Fig. 76).
Table 75: case notifications by type, Tonga, 2000-2006
TOM notifications L,,-,, I IBf I W U U L* 14 L3 10 IL 10 10
PTR n~nv SS- 41, 75 91 RR 711 7.1 7Q R7
%of Wal notikabns 63 71 76 69 D 61 78 n 5 1 3 3 3 3 3
SSue ratsllOOOOO 5 1 3 3 3 3 3 K of total notificaSors 21 7 10 19 25- 17 17 n 3 1 2 2 1 4 1
EPTB ratenOOOO0 3 1 2 2 1 4 1 %oftotal notifications 13 7 7 13 8 22 6 Relapse (n) 0 0 0 0 0 0 0 Default (n) 0 0 0 0 0 0 0
Previously mated Failurn In) 0 0 0 0 0 0 0 Total previously treated 0 0 0 0 0 0 0 %of total notificabbns 0 0 0 0 0 0 0
Unknouvn n 1 2 2 0 0 0 0 Transfer In n 0 0 0 0 0 0 0
Figure 7 6 Case notification types as proportion of all notifications, Tonga, 200S2006
23 World Health Organization 2008.

Figure 77: Case notification rates by type, Tonga, 200G2006
+Total notifications
There were 15 records of age and sex for new SS+ve cases reported from Tonga in 2006, however only 14 new SS+ve notifications were recorded (Table 76, Fig. 78). The overall male to female ratio was similar (53% males, 47% females) with more males notified in those aged over 45 years, and more female cases aged less than 44 years were reported.
Table 76: New SS+ve cases, age grouplsex distribution, Tonga, 2006
Age OmuP Male Female Total
Yeam n % n % n 0-14 0 0 0 0 0
15-24 'I 7 1 7 2
25-38, 0 0 2 13 2
35-44 0 0 2 13 2
45-54 1 7 0 0 1
55-64 2 13 0 0 2
65+ 4 27 2 13 6
All 8 53 7 47 15
Figure 78: New SS+ve cases, age grouphex distribution, Tonga, 2006
21.2 Case defection rates CDRs for SS+ve cases in Tonga were 100% in 2005 and 127% in 2006. These results, however, should be viewed with caution as the overall numbers are small (Table 77).
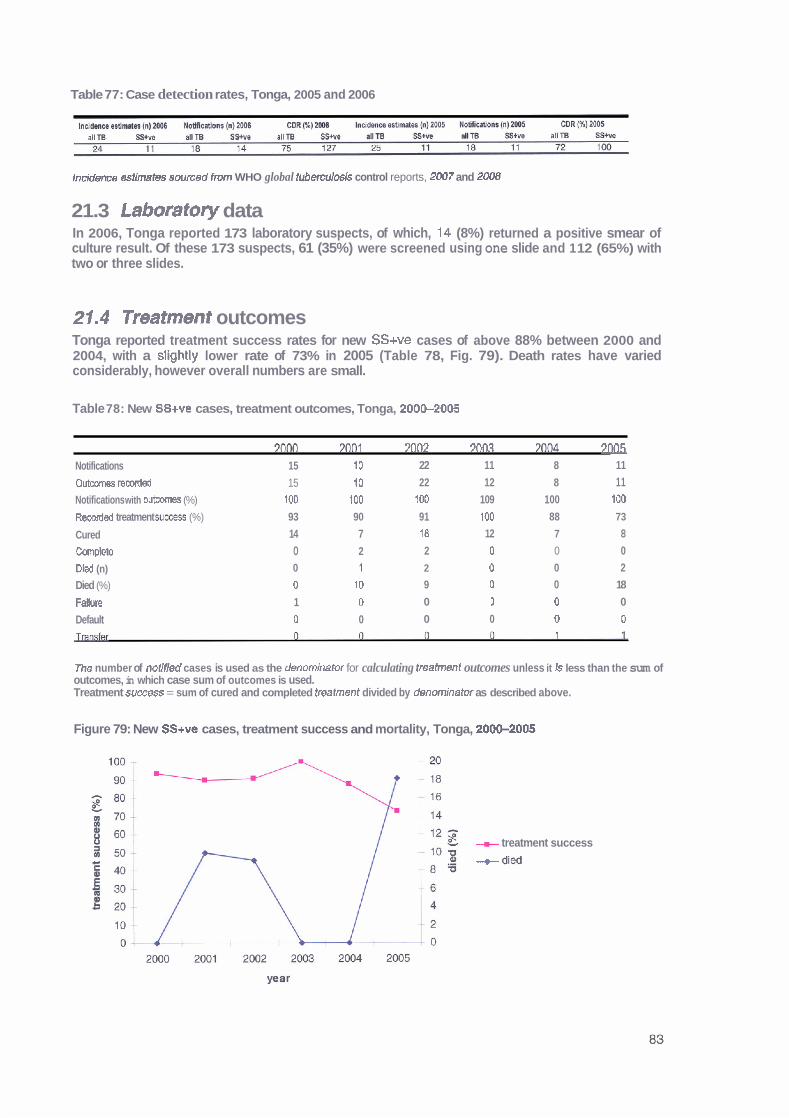
Table 77: Case detection rates, Tonga, 2005 and 2006
lncidem estimates swrced fm WHO global tubemuosis control reports, 2007 and 2008
21.3 Laboratory data In 2006, Tonga reported 173 laboratory suspects, of which, 14 (8%) returned a positive smear of culture result. Of these 173 suspects, 61 (35%) were screened using one slide and 1 12 (65%) with two or three slides.
21.4 Treatment outcomes Tonga reported treatment success rates for new SS+ve cases of above 88% between 2000 and 2004, with a slightly lower rate of 73% in 2005 (Table 78, Fig. 79). Death rates have varied considerably, however overall numbers are small.
Table 78: New SS+ve cases, treatment outcomes, Tonga, 200&2005
7nno 3nn1 7nn7 7m.7 3nflrl 7 ~ ~ 5 Notifications 15 10 22 11 8 11
Outcwnes reoorded 15 10 22 12 8 11 Notifications with outcomes (%) 100 100 100 109 100 100
Reowded treatment s u m s (%) 93 90 91 100 88 73
Cured 14 7 18 12 7 8
Complete 0 2 2 0 0 0
D id (n) 0 7 2 0 0 2
Died (%) 0 10 9 0 0 18
Fallure 1 0 0 1 0 0
Default 0 0 0 0 0 0
The number of notlfled cases is used as the denominator for calculating treafment outcomes unless it 13 less than the sum of outcomes, in which case sum of outcomes is used. Treatment success = sum of cured and completed treatment divided by denominator as described above.
Figure 79: New SS+ve cases, treatment success and mortality, Tonga, 20OG2005
~t treatment success
--t died
21.5 Issues identified Overall, a very good programme with satisfactory performance, especially excellent CDRs over the years and a high proportion of smear positive PTB cases among the newly diagnosed cases. A few issues are:
Thirty-five percent of laboratory suspects in 2006 were reported to have been screened using only one slide. - Decreasing treatment success rates and increasing mortality in 2005.
21.6 Suggested responses Laboratory procedures should be examined to determine whether there is a recording issue or if suspects are truly not being screened using the recommended number of slides.

22 Tuvalu
22.1 Case notifications Reported case notification rates and notification types as a proportion of all notifications have varied between 2000 and 2006 in Tuvalu, however, overall case numbers are low (Table 79, Figs. 80 & 81).
Table 79: Case notlflcatlons by type, Tuvalu, 2000-2006
m m 2ao2 - 2003 2004 m - m Populalion &mate 9467 9514 9561 9562 9563 9584 W5
Total notifications 16 16 21 32 17 15 12
169 166 220 3x5 178 in I 25 PT0 new SS+ve % 1 0 100 100 0 100 58 44
n 7 9 8 0 to 5 4 W e ratell OaOOO 74 95 B4 0 105 52 42
%of total notlflcatims 44 56 36 0 59 33 33 n 0 0 0 17 0 4 5
SSw ratdZOMXX) 0 0 0 178 0 42 52 %of Wal notifmt'ms 0 0 0 53 0 27 42 n 7 3 4 8 6 4 2
EPTB rafellOOWD 74 32 42 84 63 42 21 %of total notlkations 44 19 19 25 35 27 t 7 Relapse (n) 1 1 3 4 0 2 0 Default (n) 0 1 0 0 0 0 0
Previously trsated Failure (n) 1 2 3 3 0 0 0 Tdal weviouslv trestml 2 4 6 7 0 2 0 %of total notific&ns 73 25 29 22 0 13 0
I l n k n m n 0 0 0 0 0 0 0 - -
Transfer ~n n 0 0 3 0 1 0 1
Figure 80: Case notification types as proportion of all notifications, Tuvalu, 2000-2006
Figure 81: Case notification rates by type, Tuvalu, 200W2006
+ Total nolifications
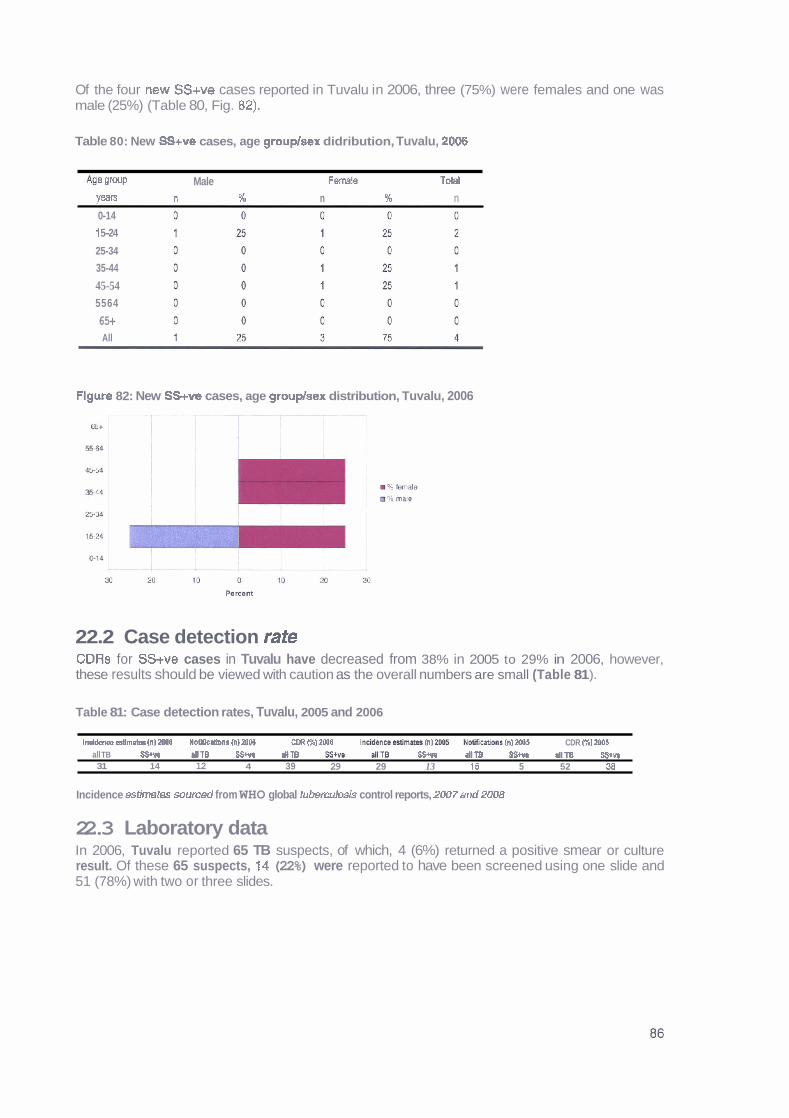
Of the four new SS+ve cases reported in Tuvalu in 2006, three (75%) were females and one was male (25%) (Table 80, Fig. 82).
Table 80: New SS+v@ cases, age grouplsex didribution, Tuvalu, 2006
Age IlmP Male Femle Total
VeaB n % n % n 0-1 4
1 5-24
25-34
35-44
45-54 5564
65+ All
Flgure 82: New SS+v@ cases, age grouplsex distribution, Tuvalu, 2006
22.2 Case detection rate CDRs for SS+ve cases in Tuvalu have decreased from 38% in 2005 to 29% in 2006, however, these results should be viewed with caution as the overall numbers are small (Table 81 ).
Table 81: Case detection rates, Tuvalu, 2005 and 2006
lnddenee estlmpter (n) ZWB N m n r ClMW CPR Wb) 2006 In&hw ssflrdw CI 2Ob5 M l t & n t h) Z006 CDR 61 2DW all TB SSIw M T B SStva dtT6 SS* AT0 SStvs allT3 55m allTB S$+w 31 14 12 4 39 29 29 13 15 5 52 38
Incidence estimates sourced from WHO global tu&ercuI#Is control reports, 2W7 and 2008
22.3 Laboratory data In 2006, Tuvalu reported 65 TB suspects, of which, 4 (6%) returned a positive smear or culture result. Of these 65 suspects, I 4 (22%) were reported to have been screened using one slide and 51 (78%) with two or three slides.
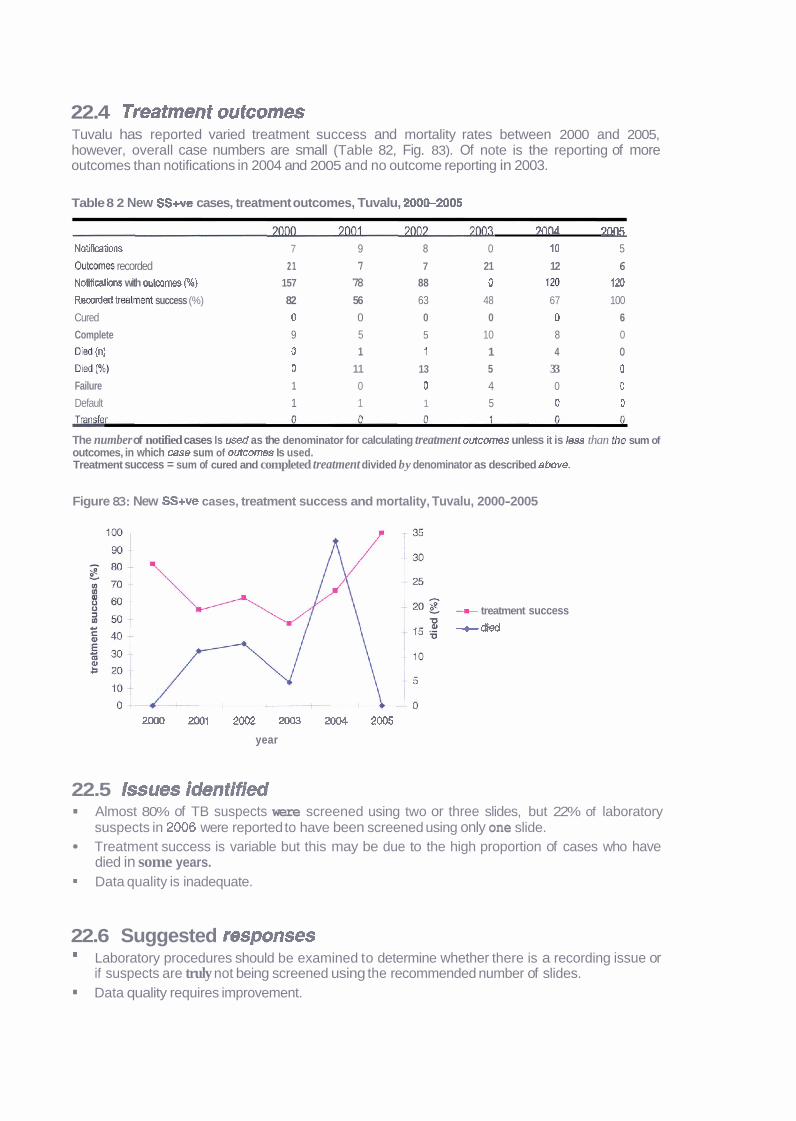
22.4 Treatment outcomes Tuvalu has reported varied treatment success and mortality rates between 2000 and 2005, however, overall case numbers are small (Table 82, Fig. 83). Of note is the reporting of more outcomes than notifications in 2004 and 2005 and no outcome reporting in 2003.
Table 8 2 New SS+ve cases, treatment outcomes, Tuvalu, 200S2005
MM 7w
Notiflmtlons 7 9 8 0 10 5
Oukmw recorded 2 1 7 7 21 12 6 Notifications with outwmes (%) 157 78 88 0 720 120
Rmrded Imlrnent success (%) 82 56 63 48 67 100
Cured 0 0 0 0 0 6
Complete 9 5 5 10 8 0
(n) 0 1 ? 1 4 0
Died (%) 0 11 13 5 33 0
Failure 1 0 0 4 0 0
Default 1 1 1 5 0 0
The number of notified cases Is used as the denominator for calculating treatment wtcomes unless it is less than the sum of outcomes, in which case sum of outcomes Is used. Treatment success = sum of cured and completed treatment divided by denominator as described above.
Figure 83: New SS+ve cases, treatment success and mortality, Tuvalu, 2000-2005
-U- treatment success --t died
2000 2001 2m 2 m 20W 2005
year
22.5 Issues identified Almost 80% of TB suspects were screened using two or three slides, but 22% of laboratory suspects in 2006 were reported to have been screened using only one slide. Treatment success is variable but this may be due to the high proportion of cases who have died in some years. Data quality is inadequate.
22.6 Suggested responses Laboratory procedures should be examined to determine whether there is a recording issue or if suspects are truly not being screened using the recommended number of slides. Data quality requires improvement.
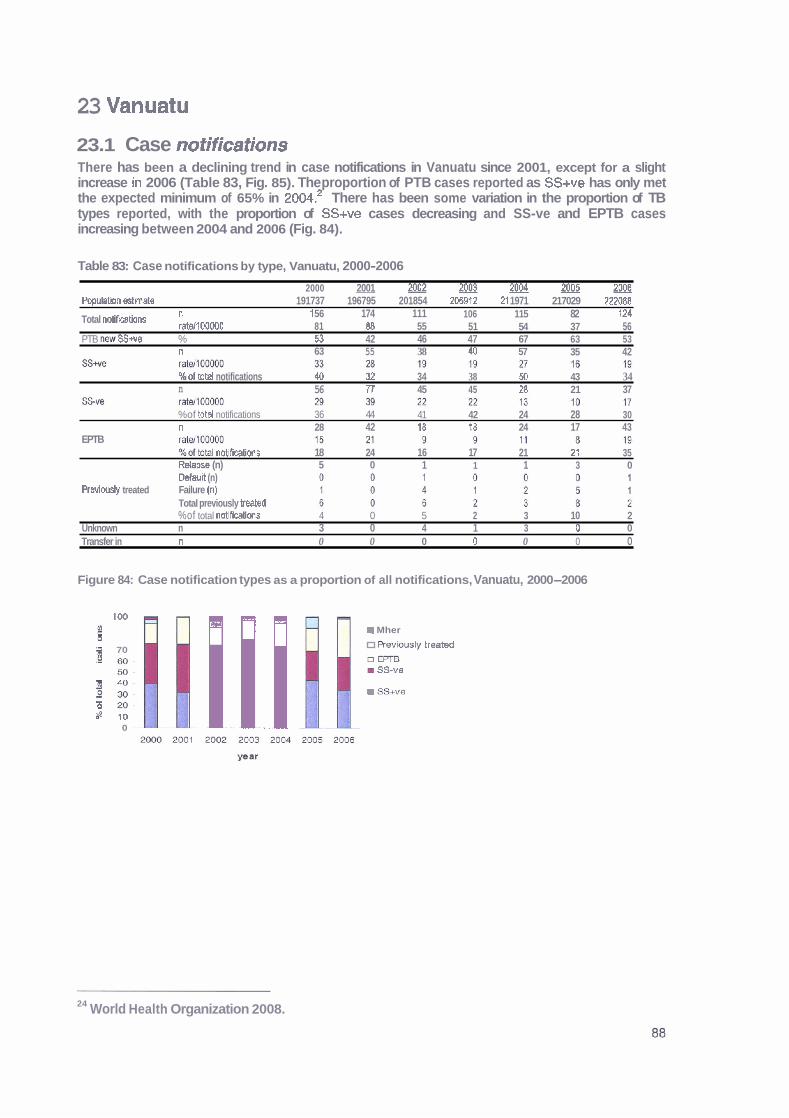
23 Vanuatu
23.1 Case notifications There has been a declining trend in case notifications in Vanuatu since 2001, except for a slight increase ~n 2006 (Table 83, Fig. 85). The proportion of PTB cases reported as SS+ve has only met the expected minimum of 65% in 2004.~ There has been some variation in the proportion of TB types reported, with the proportion of SS+ve cases decreasing and SS-ve and EPTB cases increasing between 2004 and 2006 (Fig. 84).
Table 83: Case notifications by type, Vanuatu, 2000-2006
2000 2001 2002~003~~ population &mate 191737 196795 201854 206912 21 1971 217029 222088
Total notirmtions " 'l 56 174 111 106 115 82 124 ratd100000 81 8B 55 51 54 37 56
PTB t?aw SSwe % 53 42 46 47 67 63 53 n 63 55 38 40 57 35 42
%of bk4 notifications 44 32 34 38 50 43 34 n 56 TT 45 45 28 21 37
%of total notifications 36 44 41 42 24 28 30 n 28 42 18 28 24 17 43
EPTB %ofhtal nnotifimtions 18 24 16 17 21 21 35 Relapse (n) 5 0 1 1 1 3 0 Default (n)
Previously treated Failure (n) Total previously h a t e d %of total no t i f i t am 4 0 5 2 3 10 2
Unknown n 3 0 4 1 3 0 0 Transfer in n 0 0 0 0 0 0 0
Figure 84: Case notification types as a proportion of all notifications, Vanuatu, 2000-2006
100
g CCi m Mher
1 70 R ~ V K I U S ~ ~ treatad
a m g. I SS-ve
1 z: m SS+ve
B m ! bp 10 A
0 l
24 World Health Organization 2008.
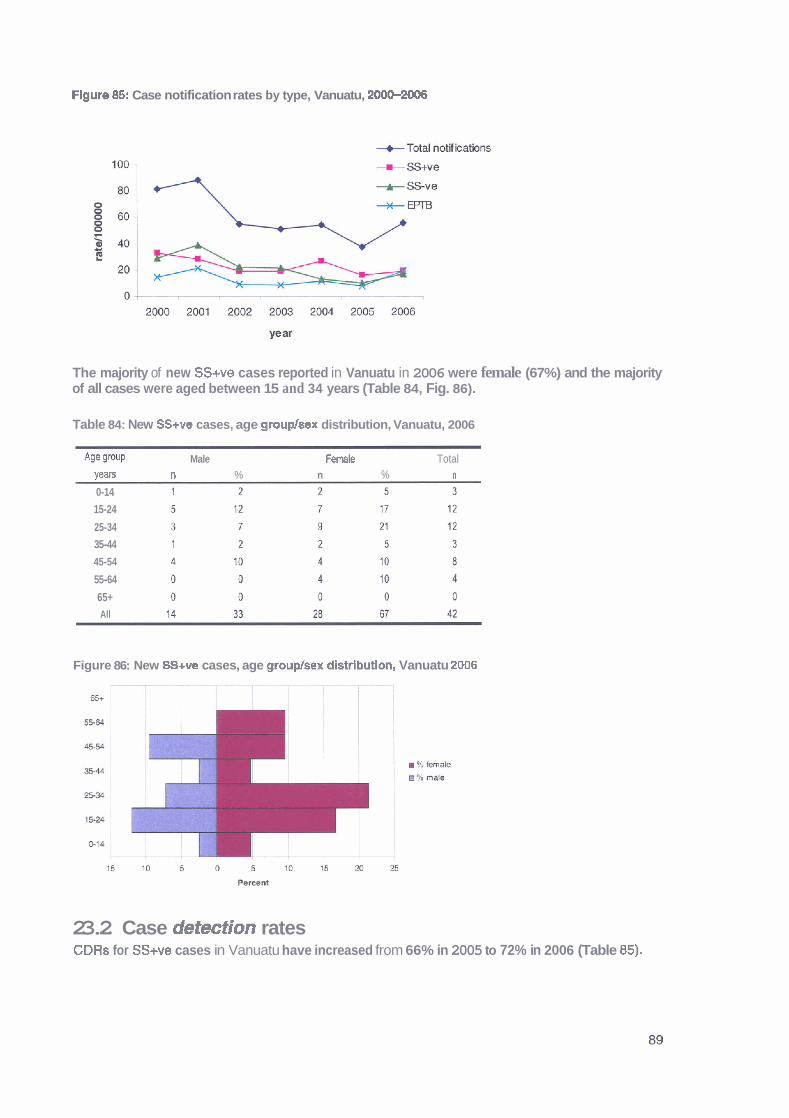
Flgure 85: Case notification rates by type, Vanuatu, 200G2006
The majority of new SSwe cases reported in Vanuatu in 2006 were female (67%) and the majority of all cases were aged between 15 and 34 years (Table 84, Fig. 86).
Table 84: New SS+ve cases, age grouphex distribution, Vanuatu, 2006
Age group Male F m l e Total wars n % n % n 0-14
15-24
25-34
35-44
45-54
55-64
65+ All
Figure 86: New SS+ve cases, age gtoup/sex distrlbutlon, Vanuatu 2006
23.2 Case detection rates CDRs for SS+ve cases in Vanuatu have increased from 66% in 2005 to 72% in 2006 (Table 85).
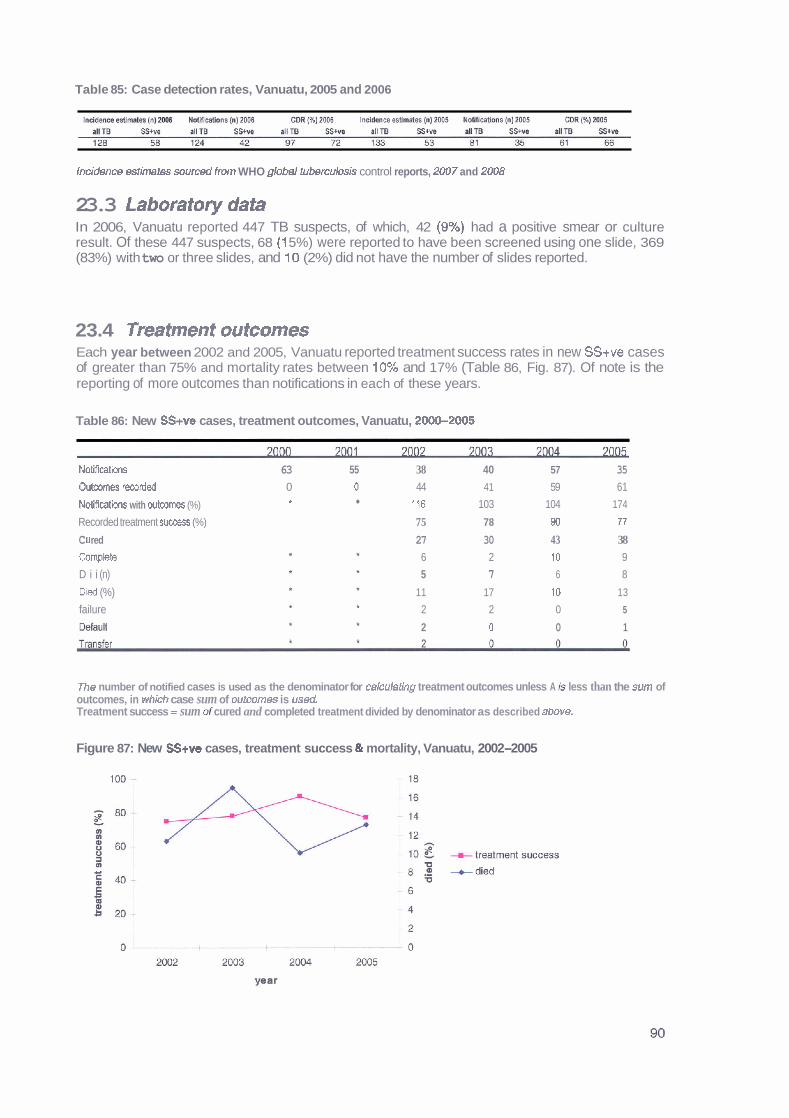
Table 85: Case detection rates, Vanuatu, 2005 and 2006
Incidem estimetes sourced from WHO glob~l tubercuIosis control reports, 2UU7 and 2008
23.3 Laboratory data In 2006, Vanuatu reported 447 TB suspects, of which, 42 (9%) had a positive smear or culture result. Of these 447 suspects, 68 (1 5%) were reported to have been screened using one slide, 369 (83%) with two or three slides, and 10 (2%) did not have the number of slides reported.
23.4 Treatment outcomes Each year between 2002 and 2005, Vanuatu reported treatment success rates in new SS+ve cases of greater than 75% and mortality rates between 10% and 17% (Table 86, Fig. 87). Of note is the reporting of more outcomes than notifications in each of these years.
Table 86: New SS+ve cases, treatment outcomes, Vanuatu, 2000-2005
Not i f icath 63 55 38 40 57 35
Outcomes rworded 0 0 44 41 59 61
Notlfiwtions with wtcornes (%) * 116 103 104 174
Recorded treatment success (%) 75 78 40 77
C U red 27 30 43 38 Complete 6 2 10 9
D i i (n) 5 7 6 8
D i i (%) 11 17 10 13
failure 2 2 0 5
&fad 2 0 0 1
The number of notified cases is used as the denominator for cakulatlng treatment outcomes unless A is less than the sum of outcomes, in which case sum of outcomes is u s d . Treatment success = sum of cured and completed treatment divided by denominator as described above.
Figure 87: New SS+ve cases, treatment success & mortality, Vanuatu, 2002-2005
23.5 Issues identified Good programme performance indicated by:
Increasing CDRs.
Declining trend in case notification over time (with slight increase noted in 2006).
Treatment success rates remain stable and are approaching 80%. A high proportion (83%) of TB suspects were screened with two or three slides, however,
17% of laboratory suspects in 2006 either did not have the number of slides used for screening reported or reported using only one slide. More outcomes than notifications were recorded for the 2005 SS+ve cohort.
23.6 Suggested responses Laboratory procedures should be examined to determine whether there is a recording issue or if suspects are truly not being screened using the recommended number of slides. Data management should be examined to determine the reasons for the discrepancy in reporting and solutions implemented.
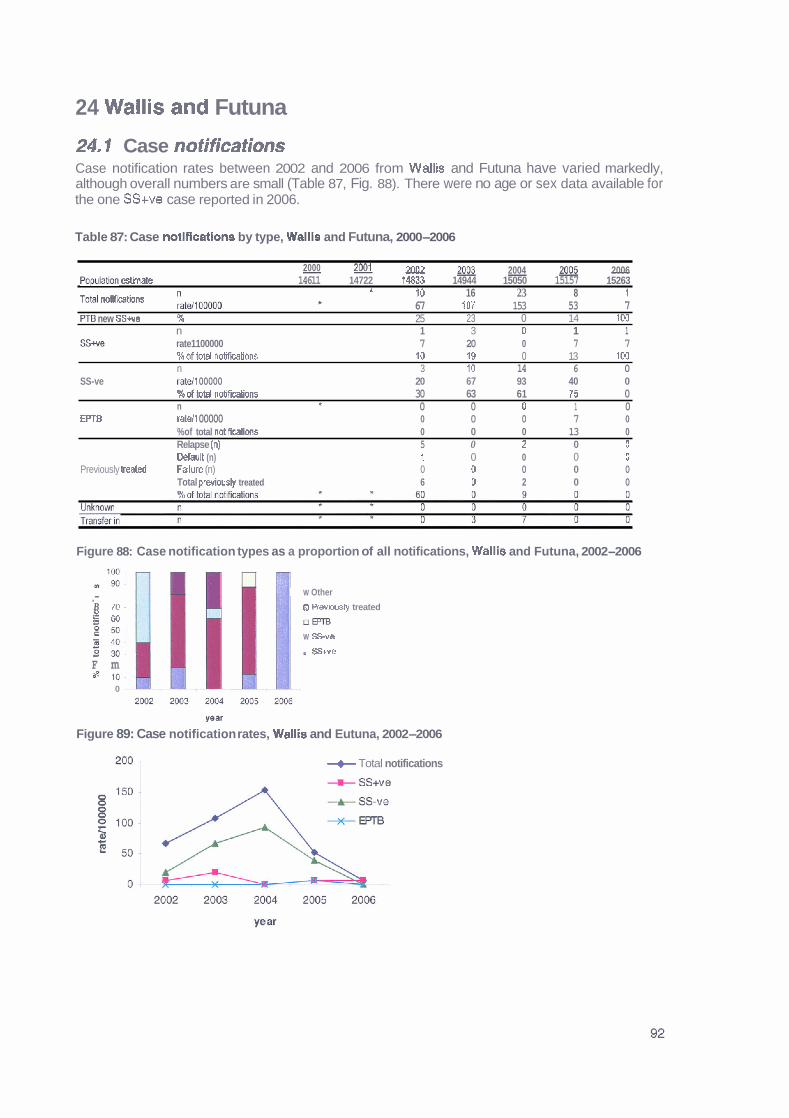
24 Wallis and Futuna
24. f Case notifications Case notification rates between 2002 and 2006 from Wallis and Futuna have varied markedly, although overall numbers are small (Table 87, Fig. 88). There were no age or sex data available for the one SS+ve case reported in 2006.
Table 87: Case notifications by type, Wallls and Futuna, 2000-2006
2000 - - 2002 2003 - 2004 g& 2006 Pcpulatbn ~t imate 14611 14722 74833 14944 15050 15157 15263
TOM notifmtions LlmOW * 10 16 23 8 1 f 67 107 153 53 7
PT0 new SSwe % 25 23 0 14 103 n 1 3 0 1 1
SS* rate1100000 7 20 0 7 7 %of total notifmtions 10 18 0 13 100 n 3 10 14 6 0
SS-ve M1 00000 20 67 93 40 0 % d total notifcations 30 63 61 95 0 n t 0 0 0 1 0
EPTB ratell 00000 0 0 0 7 0 %of total notifications 0 0 0 13 0 Relapse (n) 5 0 2 0 0 Default (n) l 0 0 0 0
Previously teated FAlure (n) 0 0 0 0 0 Total oreuiouslv treated 6 D 2 0 0
Figure 88: Case notification types as a proportion of all notifications, Wallis and Futuna, 2002-2006
W Other .- B 70. n Revmly treated 2 so I u r n
W S v e
Sstve F m
0
p a r
Figure 89: Case notification rates, Wallis and Eutuna, 2002-2006
+ Total notifications
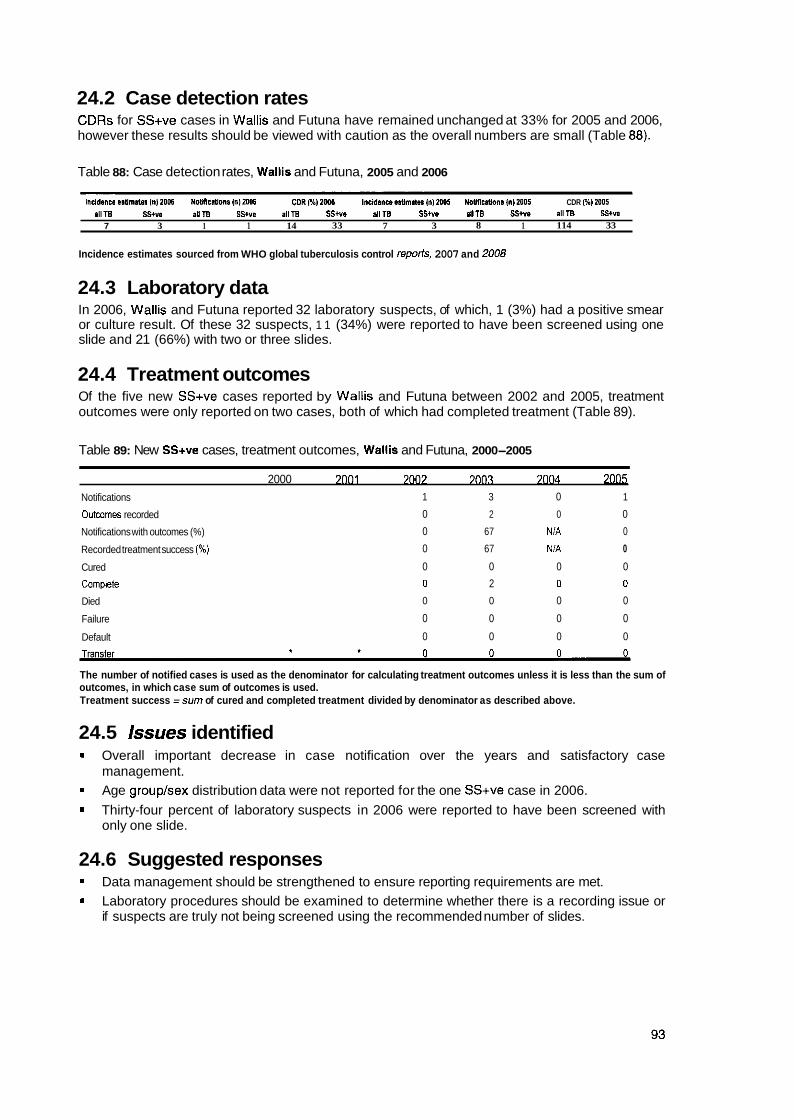
24.2 Case detection rates CDRs for SS+ve cases in Wallis and Futuna have remained unchanged at 33% for 2005 and 2006, however these results should be viewed with caution as the overall numbers are small (Table 88).
Table 88: Case detection rates, Wallis and Futuna, 2005 and 2006
l n d d i i m @.mm (nl2Ol. N 0 ~ c ~ o n s ( n ) 2 0 0 6 C D R W ) ~ ~ ~ lncidsnoees4mnn(n)mo5 NoaRcnions(n)mos CDR (W) MO5 allTB SStw allTB SStv l allTB SS*ue allTB S S M allTB SS*@ 111TB SS+w
7 3 1 1 14 33 7 3 8 1 114 33
Incidence estimates sourced from WHO global tuberculosis control reporis, 2007 and 2008
24.3 Laboratory data In 2006, Wallis and Futuna reported 32 laboratory suspects, of which, 1 (3%) had a positive smear or culture result. Of these 32 suspects, 1 1 (34%) were reported to have been screened using one slide and 21 (66%) with two or three slides.
24.4 Treatment outcomes Of the five new SS+ve cases reported by Wallis and Futuna between 2002 and 2005, treatment outcomes were only reported on two cases, both of which had completed treatment (Table 89).
Table 89: New SS+ve cases, treatment outcomes, Wallis and Futuna, 2000-2005
2000 7001 7007 7003 7004 2 0 ~ 5
Notifications 1 3 0 1
Outmmes recorded 0 2 0 0
Notifications with outcomes (%) 0 67 NiA 0
Recorded treatment success (%) 0 67 NiA 0
Cured 0 0 0 0
Campkte 0 2 0 0
Died 0 0 0 0
Failure 0 0 0 0
Default 0 0 0 0
The number of notified cases is used as the denominator for calculating treatment outcomes unless it is less than the sum of outcomes, in which case sum of outcomes is used. Treatment success =sum of cured and completed treatment divided by denominator as described above.
24.5 Issues identified * Overall important decrease in case notification over the years and satisfactory case
management. Age grouplsex distribution data were not reported for the one SS+ve case in 2006.
Thirty-four percent of laboratory suspects in 2006 were reported to have been screened with only one slide.
24.6 Suggested responses Data management should be strengthened to ensure reporting requirements are met. Laboratory procedures should be examined to determine whether there is a recording issue or if suspects are truly not being screened using the recommended number of slides.
25 References
Dawson D. 2007. Anti-TB drug resistance in Pacific Island nations. Unpublished report. Reichmann L.B. and Hershfield E.S. (eds) 2000. Tuberculosis: A comprehensive international approach. 2nd edition. New York: Marcel Dekker Inc, Secretariat of the Pacific Community. 2008. Annual report 2007. Noumea: SPC. Secretariat of the Pacific Community. 2008. Population and demographic indicators 2000-2006. http:llwww.spclintlsdp Tuberculosis Coalition for Technical Assistance. 2006. International Standards for Tuberculosis Care (ISTC). The Hague: Tuberculosis Coalition for Technical Assistance. World Health Organization. 2008. Global tuberculosis control 2008: Surveillance, planning, finance. Geneva: WHO. World Health Organization. 2007. Global tuberculosis control 2007: Surveillance, planning, finance. Geneva: WHO. World Health Organization. 2006. Global tuberculosis control 2006: Surveillance, planning, finance. Geneva: WHO. World Health Organization 2006. Strategic plan to stop TB in the western Pacific 20062010. WHO Western Pacific Region. World Health Organization. 2005. Global tuberculosis control 2005: Surveillance, planning, finance. Geneva: WHO. World Health Organization. 2004. Global tuberculosis control 2004: Surveillance, planning, finance. Geneva: WHO. World Health Organization. 2003. Global tuberculosis control 2003: Surveillance, planning, finance. Geneva: WHO.
World Health Organization. 2008. Reduction of number of smears for the diagnosis of pulmonary TB. http:l/www.who.int~tb/dots/laboratory/policy/en/index2.html World Health Organization. 2003. Treatment of tuberculosis: Guidelines for national programmes. 3rd ed. Geneva: WHO.