Embed Size (px)
Citation preview
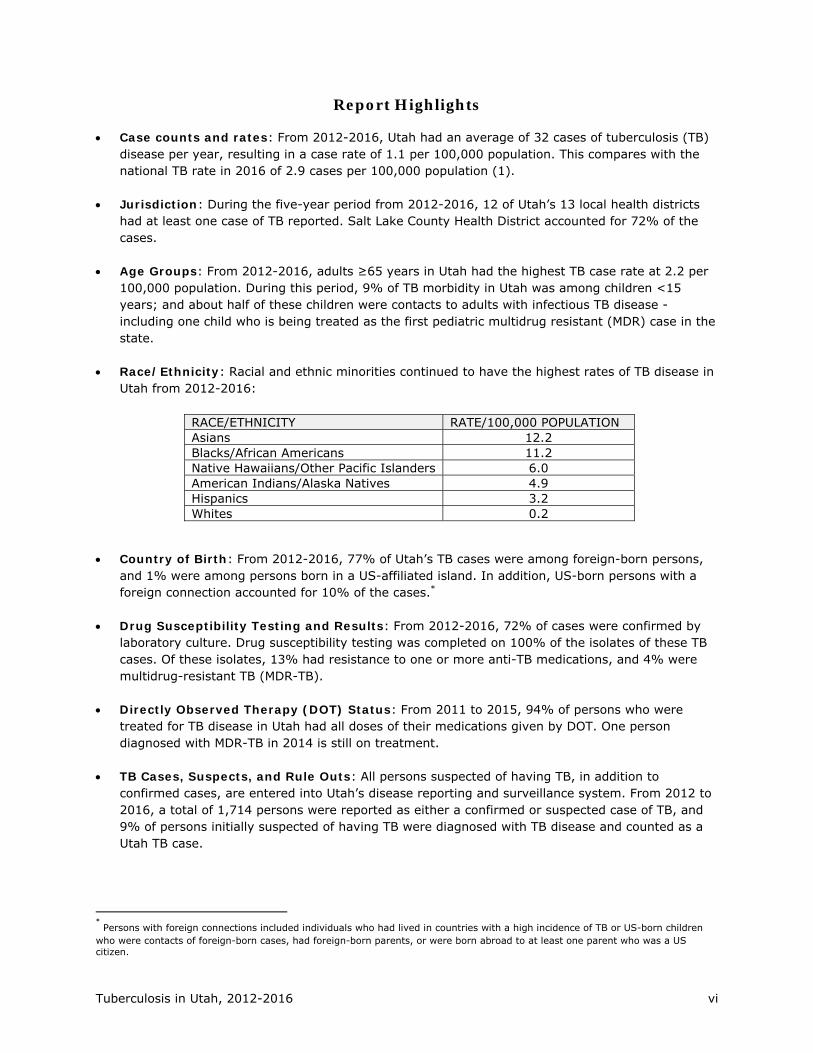
TUBERCULOSIS IN
UTAH
2012-2016
October 2017

Tuberculosis in Utah, 2012-2016 i
Acknowledgments
The Utah Department of Health (UDOH) would like to recognize the efforts of local health department personnel throughout the state of Utah who play a critical role in the case management and contact investigation of tuberculosis cases in Utah. Tuberculosis data for Utah are published by the UDOH Bureau of Epidemiology. Please direct questions or comments to: Bureau of Epidemiology Utah Department of Health Box 142104 Salt Lake City, Utah 84114-2104 Phone: (801) 538-6191

Tuberculosis in Utah, 2012-2016 ii
Guide to Acronyms
AFB Acid-fast Bacillus
ARPE Aggregate Report of Program Evaluation
CDC Centers for Disease Control and Prevention
CXR Chest X-ray
DOT Directly Observed Therapy
DST Drug Susceptibility Testing
DTBE Division of Tuberculosis Elimination
EDN Electronic Disease Notification
HIV Human Immunodeficiency Virus
IBIS-PH Indicator-based Information System for Public Health
INH Isoniazid
LTBI Latent Tuberculosis Infection
LHD Local Health Department
MDR Multidrug Resistant
MDR-TB Multidrug-resistant Tuberculosis
MOTT Mycobacteria Other Than Tuberculosis
NAAT Nucleic Acid Amplification Test
NCHS National Center for Health Statistics
RIF Rifampin
RVCT Report of Verified Case of Tuberculosis
TB Tuberculosis
TNF Tumor Necrosis Factor
UAI United States-affiliated Islands
UDOH Utah Department of Health
US United States
USB US-born
UT-NEDSS Utah National Electronic Disease Surveillance System
Tuberculosis in Utah, 2012-2016 iii
Table of Contents
Acknowledgments .................................................................................................................. i
Guide to Acronyms .................................................................................................................. ii
Table of Contents .................................................................................................................. iii
List of Figures ...................................................................................................................... iv
List of Tables ......................................................................................................................... v
Report Highlights .................................................................................................................. vi
Introduction ......................................................................................................................... 1
Technical Notes .................................................................................................................... 1
1. Tuberculosis (TB) by Jurisdiction Cases in Utah ................................................................................................................... 2 Rates in Utah and the United States (US) ............................................................................. 2 Local Health Districts ......................................................................................................... 2 2. TB by Demographic Characteristics Sex ................................................................................................................................. 5 Age ................................................................................................................................. 5 Children ........................................................................................................................... 5 Race/Ethnicity .................................................................................................................. 5 Country of Origin .............................................................................................................. 6 Immigration Status at First Entry among Foreign-born Persons ................................................ 6 Country of Birth ................................................................................................................ 6 3. TB by Risk Factor Human Immunodeficiency Virus (HIV) Testing and Coinfection ............................................... 11 Additional Risk Factors ...................................................................................................... 11 Residence at Diagnosis ..................................................................................................... 11 Adult Homelessness and Substance Abuse ........................................................................... 11 4. TB by Clinical Information Primary Reason for TB Evaluation ....................................................................................... 14 Case Verification .............................................................................................................. 14 Site of Disease ................................................................................................................ 14 Drug Susceptibility Testing and Results ............................................................................... 14 Directly Observed Therapy ................................................................................................ 14 Completion of Treatment ................................................................................................... 15 TB Cases, Suspects, and Rule Outs ..................................................................................... 15 5. TB Program Evaluation TB Case Rates ................................................................................................................. 18 TB Case Management/Lab Reporting ................................................................................... 18 Contact Investigations ...................................................................................................... 18 Evaluation of Immigrants and Refugees ............................................................................... 19 Data Reporting ................................................................................................................ 19
6. Tables ......................................................................................................................... 21
References ........................................................................................................................... 33

Tuberculosis in Utah, 2012-2016 iv
List of Figures
1. Tuberculosis (TB) by Jurisdiction
Figure 1. Reported TB Cases, Utah, 1993-2016 ......................................................................... 3
Figure 2. TB Rates per 100,000 Population, Utah and United States, 1993-2016 ............................ 3
Figure 3. Percent of TB Cases by Local Health District, Utah, 2012-2016 ....................................... 4
Figure 4. TB Rates per 100,000 Population by Local Health District, Utah, 2012-2016 ..................... 4
2. TB by Demographic Data
Figure 5. TB Cases by Sex and Origin, Utah, 2012-2016 .............................................................. 7
Figure 6. Percent of TB Cases by Age Group and Characteristics of Pediatric Cases, Utah, 2012-2016 ............................................................................................................................ 7
Figure 7. TB Rates per 100,000 Population by Race/Ethnicity, Utah, 2012-2016 .............................. 8
Figure 8. Percent of TB Cases by Race/Ethnicity and Origin, Utah, 2012-2016 ................................. 8
Figure 9. Percent of TB Cases by Foreign/US-affiliated Islands (UAIs)/US-born (USB) Status, Utah, 2012-2016 ............................................................................................................................ 9
Figure 10. Percent of Foreign-born TB Cases by Immigration Status at First Entry, Utah, 2012-2016 ............................................................................................................................ 9
Figure 11. Percent of Foreign-born TB Cases by Country of Birth, Utah, 2012-2016 ........................ 10
3. TB by Risk Factor
Figure 12. TB Cases by HIV Test Results, Utah, 2012-2016 ......................................................... 12 Figure 13. Percent of TB Cases by Additional TB Risk Factors, Utah, 2012-2016 ............................. 12
Figure 14. Percent of Homelessness and Substance Abuse in TB Cases Aged ≥15 Years, Utah, 2012-2016 ........................................................................................................................... 13
4. TB by Clinical Information
Figure 15. Percent of TB Cases by Primary Reason for TB Evaluation, Utah, 2012-2016 ................... 16 Figure 16. Percent of TB Cases by Case Verification, Utah, 2012-2016 .......................................... 16
Figure 17. TB Cases by Site of Disease, Utah, 2012-2016 ........................................................... 17
Figure 18. TB Cases and Suspects by Final Classification, Utah, 2012-2016 ................................... 17
Tuberculosis in Utah, 2012-2016 v
List of Tables
Table 1. TB Cases and Rates per 100,000 Population, Utah and United States, 1993-2016 .............. 22
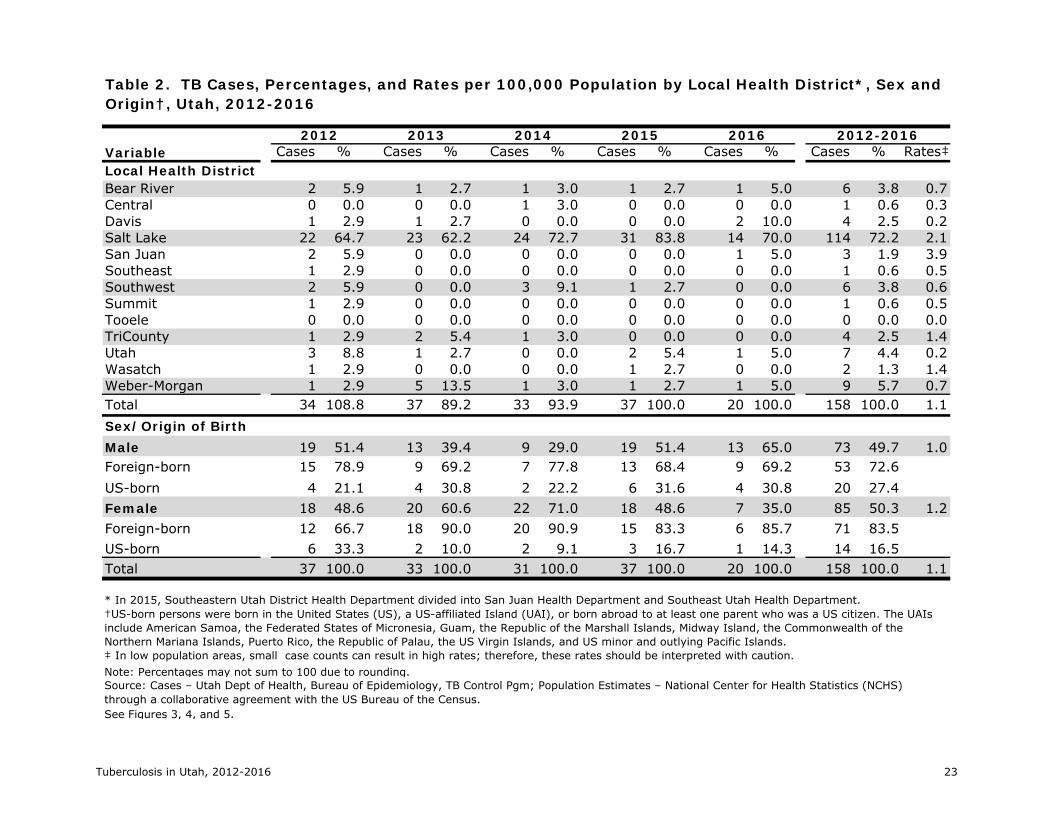
Table 2. TB Cases, Percentages, and Rates per 100,000 Population by Local Health District, Sex and Origin, Utah, 2012-2016 ....................................................................................................... 23
Table 3. TB Cases, Percentages, and Rates per 100,000 Population by Age Group, Race/Ethnicity and Origin, Utah, 2012-2016 ....................................................................................................... 24
Table 4. TB Cases and Percentages by Foreign/US-affiliated Islands (UAIs)/US-born (USB) Status, Immigration Status at First Entry in Foreign-born Persons, Utah, 2012-2016 ................................ 25
Table 5. Foreign-born TB Cases and Percentages by Country of Birth, Utah, 2012-2016 ................. 26
Table 6. TB Cases and Percentages by HIV Test Results, Additional Risk Factors, and Residence at Time of Diagnosis, Utah, 2012-2016 ....................................................................................... 27
Table 7. TB Cases and Percentages by Adult Homelessness and Substance Abuse, Primary Reason for TB Evaluation, and Case Verification, Utah, 2012-2016 .............................................................. 28
Table 8. TB Cases and Percentages by Site of Disease and Extrapulmonary Sites of Disease, Utah, 2012-2016 .......................................................................................................................... 29
Table 9. Culture-positive TB Cases and Percentages by Drug Susceptibility Testing (DST) and Results, Utah, 2012-2016 ................................................................................................................. 30
Table 10. TB Cases and Percentages by Directly Observed Therapy (DOT) and Completion of Treatment Status, Utah, 2011-2015 ....................................................................................... 31
Table 11. TB Cases, Suspects, and Rule Outs by Final Classification, Utah, 2012-2016 ................... 32
Tuberculosis in Utah, 2012-2016 vi
Report Highlights
Case counts and rates: From 2012-2016, Utah had an average of 32 cases of tuberculosis (TB) disease per year, resulting in a case rate of 1.1 per 100,000 population. This compares with the national TB rate in 2016 of 2.9 cases per 100,000 population (1).
Jurisdiction: During the five-year period from 2012-2016, 12 of Utah’s 13 local health districts had at least one case of TB reported. Salt Lake County Health District accounted for 72% of the cases.
Age Groups: From 2012-2016, adults ≥65 years in Utah had the highest TB case rate at 2.2 per
100,000 population. During this period, 9% of TB morbidity in Utah was among children <15 years; and about half of these children were contacts to adults with infectious TB disease - including one child who is being treated as the first pediatric multidrug resistant (MDR) case in the state.
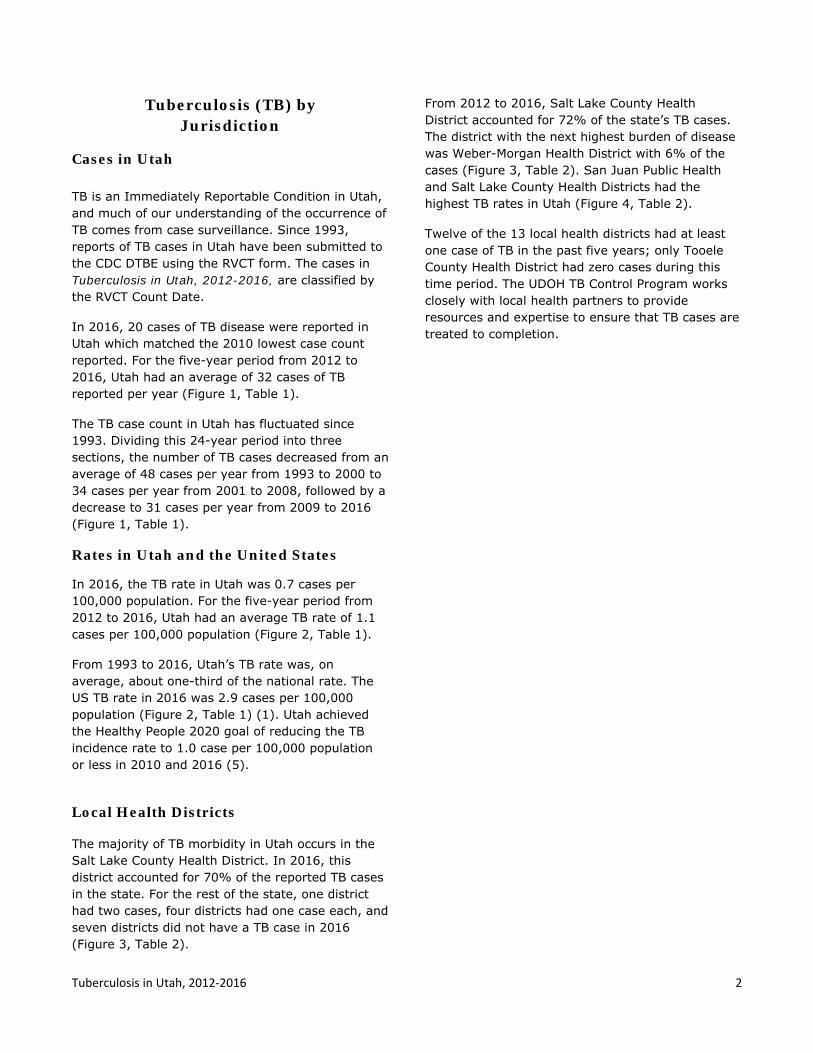
Race/Ethnicity: Racial and ethnic minorities continued to have the highest rates of TB disease in Utah from 2012-2016:
RACE/ETHNICITY RATE/100,000 POPULATION Asians 12.2 Blacks/African Americans 11.2 Native Hawaiians/Other Pacific Islanders 6.0 American Indians/Alaska Natives 4.9 Hispanics 3.2 Whites 0.2
Country of Birth: From 2012-2016, 77% of Utah’s TB cases were among foreign-born persons,
and 1% were among persons born in a US-affiliated island. In addition, US-born persons with a foreign connection accounted for 10% of the cases.*
Drug Susceptibility Testing and Results: From 2012-2016, 72% of cases were confirmed by
laboratory culture. Drug susceptibility testing was completed on 100% of the isolates of these TB cases. Of these isolates, 13% had resistance to one or more anti-TB medications, and 4% were multidrug-resistant TB (MDR-TB).
Directly Observed Therapy (DOT) Status: From 2011 to 2015, 94% of persons who were
treated for TB disease in Utah had all doses of their medications given by DOT. One person diagnosed with MDR-TB in 2014 is still on treatment.
TB Cases, Suspects, and Rule Outs: All persons suspected of having TB, in addition to
confirmed cases, are entered into Utah’s disease reporting and surveillance system. From 2012 to 2016, a total of 1,714 persons were reported as either a confirmed or suspected case of TB, and 9% of persons initially suspected of having TB were diagnosed with TB disease and counted as a Utah TB case.
* Persons with foreign connections included individuals who had lived in countries with a high incidence of TB or US-born children who were contacts of foreign-born cases, had foreign-born parents, or were born abroad to at least one parent who was a US citizen.
Tuberculosis in Utah, 2012‐2016 1
Introduction
Like many other infectious diseases, it is a challenge to control the spread of tuberculosis (TB). Some of the obstacles include its airborne mode of transmission, failure of providers to “think TB” as TB morbidity declines, elevated rates in certain racial/ethnic groups and foreign-born persons, and its prolonged treatment regimen of six months or more.
TB is an Immediately Reportable Condition under the Utah Communicable Disease Rule, and all suspected and confirmed cases of TB must be reported to a local health department (LHD) or the Utah Department of Health (UDOH), Bureau of Epidemiology within 24 hours (2). Because early detection and appropriate treatment of TB are essential to control the spread of the disease and prevent outbreaks, public health programs throughout the state ensure that persons suspected of having TB are thoroughly evaluated and started on TB treatment, if indicated. Since treatment adherence is not only important for effective therapy in patients but also to prevent an increase in drug-resistant TB cases, the Special Measures for the Control of TB Rule requires that treatment for patients with TB disease be administered using directly observed therapy (DOT). The TB Rule also requires that contact investigations be conducted for all confirmed TB patients and for persons suspected of having TB who may be infectious (3).
Tuberculosis in Utah, 2012-2016, is a five-year statistical review of TB in Utah from 2012 to 2016. Although some aspects of TB epidemiology in Utah mirror national trends, there are aspects of the local epidemiology that differ and must be considered in disease control efforts. The report consists of six sections. Four sections describe TB epidemiology by jurisdiction, demographic factors, risk factors, and clinical information. The fifth section on Program Evaluation compares the performance of the Utah TB Control Program to the 2020 national TB Program objectives and targets. Finally, the Tables section includes the data upon which the charts in the main section are based.
Technical Notes
Since 1993, reports of Utah’s confirmed TB cases have been submitted to the Centers for Disease
Control and Prevention (CDC), Division of TB Elimination (DTBE) using the Report of Verified Case of Tuberculosis (RVCT) form (4). The cases in this report are classified by the RVCT Count Date.
Both countable and noncountable TB cases, along with data regarding persons suspected of having TB, are entered into the Utah National Electronic Disease Surveillance System (UT-NEDSS), a secure statewide disease surveillance system; this database is the source for much of the data provided in this report. Noncountable cases include cases where TB patients from other jurisdictions move into the state, where TB is recurrent (diagnosed within a year of completion of previous TB treatment), or when the TB diagnosis is reversed. All sections with the exception of the section on TB Cases, Suspects, and Rule Outs refer to Utah’s countable cases.
Tuberculosis in Utah, 2012-2016 includes rates calculated using population estimates published in the UDOH Indicator-based Information System for Public Health (IBIS-PH) for the years 2012 through 2015 and unpublished estimates for 2016. Many rates are based on a small number of events, which have wide confidence intervals; therefore, caution should be exercised when interpreting these results. When comparing Utah to national statistics, the most recently available data were used.
TB treatment typically lasts at least six months but can be as long as 18-24 months or more. Due to the prolonged nature of treatment, TB cases are counted in the jurisdiction where the patient first resided for at least 90 days.
In March 2015, a 13th local health department was formed in Utah. Southeastern Utah District Health Department, which had served Carbon, Emery, Grand, and San Juan counties, was divided into San Juan Public Health and Southeast Utah Health Department. Data in this report divides morbidity using this new public health structure in the state.
Tuberculosis in Utah, 2012‐2016 2
Tuberculosis (TB) by Jurisdiction
Cases in Utah
TB is an Immediately Reportable Condition in Utah, and much of our understanding of the occurrence of TB comes from case surveillance. Since 1993, reports of TB cases in Utah have been submitted to the CDC DTBE using the RVCT form. The cases in Tuberculosis in Utah, 2012-2016, are classified by the RVCT Count Date.
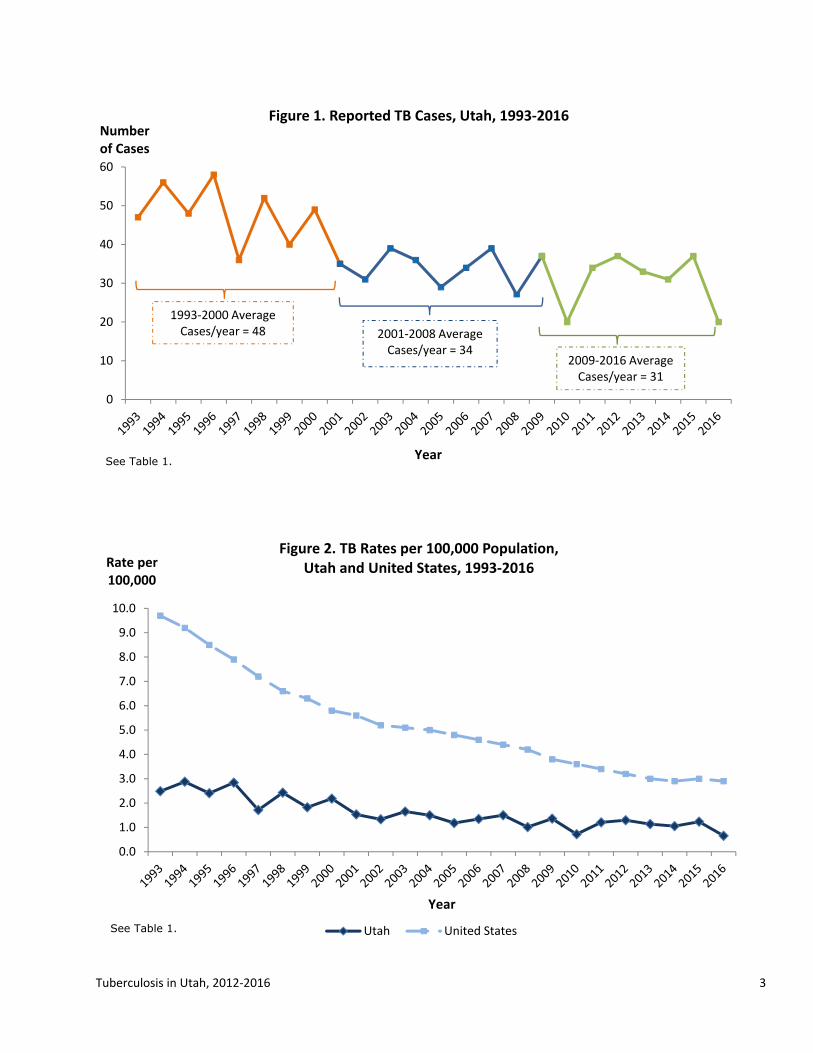
In 2016, 20 cases of TB disease were reported in Utah which matched the 2010 lowest case count reported. For the five-year period from 2012 to 2016, Utah had an average of 32 cases of TB reported per year (Figure 1, Table 1).
The TB case count in Utah has fluctuated since 1993. Dividing this 24-year period into three sections, the number of TB cases decreased from an average of 48 cases per year from 1993 to 2000 to 34 cases per year from 2001 to 2008, followed by a decrease to 31 cases per year from 2009 to 2016 (Figure 1, Table 1).
Rates in Utah and the United States
In 2016, the TB rate in Utah was 0.7 cases per 100,000 population. For the five-year period from 2012 to 2016, Utah had an average TB rate of 1.1 cases per 100,000 population (Figure 2, Table 1).
From 1993 to 2016, Utah’s TB rate was, on average, about one-third of the national rate. The US TB rate in 2016 was 2.9 cases per 100,000 population (Figure 2, Table 1) (1). Utah achieved the Healthy People 2020 goal of reducing the TB incidence rate to 1.0 case per 100,000 population or less in 2010 and 2016 (5).
Local Health Districts
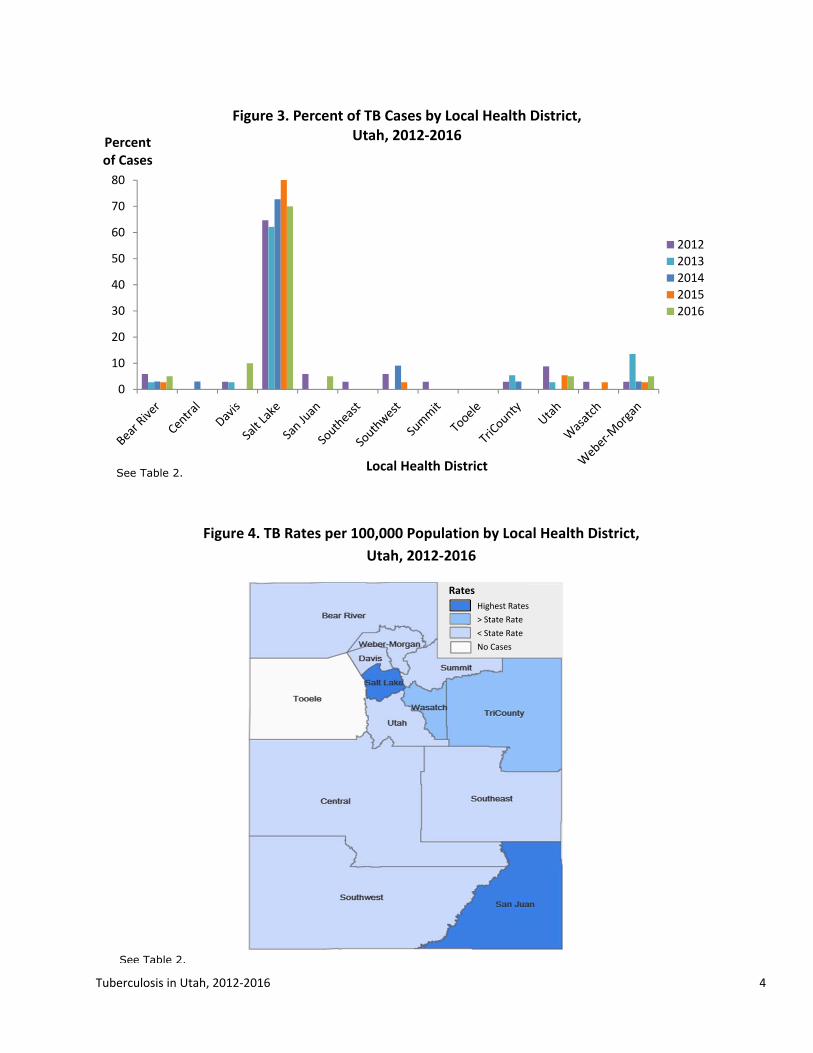
The majority of TB morbidity in Utah occurs in the Salt Lake County Health District. In 2016, this district accounted for 70% of the reported TB cases in the state. For the rest of the state, one district had two cases, four districts had one case each, and seven districts did not have a TB case in 2016 (Figure 3, Table 2).
From 2012 to 2016, Salt Lake County Health District accounted for 72% of the state’s TB cases. The district with the next highest burden of disease was Weber-Morgan Health District with 6% of the cases (Figure 3, Table 2). San Juan Public Health and Salt Lake County Health Districts had the highest TB rates in Utah (Figure 4, Table 2).
Twelve of the 13 local health districts had at least one case of TB in the past five years; only Tooele County Health District had zero cases during this time period. The UDOH TB Control Program works closely with local health partners to provide resources and expertise to ensure that TB cases are treated to completion.
Tuberculosis in Utah, 2012‐2016 3
0
10
20
30
40
50
60
Numberof Cases
Year
Figure 1. Reported TB Cases, Utah, 1993‐2016
1993‐2000 Average Cases/year = 48 2001‐2008 Average
Cases/year = 342009‐2016 Average Cases/year = 31
0.0
1.0
2.0
3.0
4.0
5.0
6.0
7.0
8.0
9.0
10.0
Rate per 100,000
Year
Figure 2. TB Rates per 100,000 Population, Utah and United States, 1993‐2016
Utah United States
See Table 1.
See Table 1.
Tuberculosis in Utah, 2012‐2016 4
0
10
20
30
40
50
60
70
80
Percent of Cases
Local Health District
Figure 3. Percent of TB Cases by Local Health District, Utah, 2012‐2016
2012
2013
2014
2015
2016
See Table 2.
Figure 4. TB Rates per 100,000 Population by Local Health District,
Utah, 2012‐2016
See Table 2.
Highest Rates
> State Rate
< State Rate
No Cases
Rates
Tuberculosis in Utah, 2012‐2016 5
Tuberculosis (TB) by Demographic Characteristics
Sex
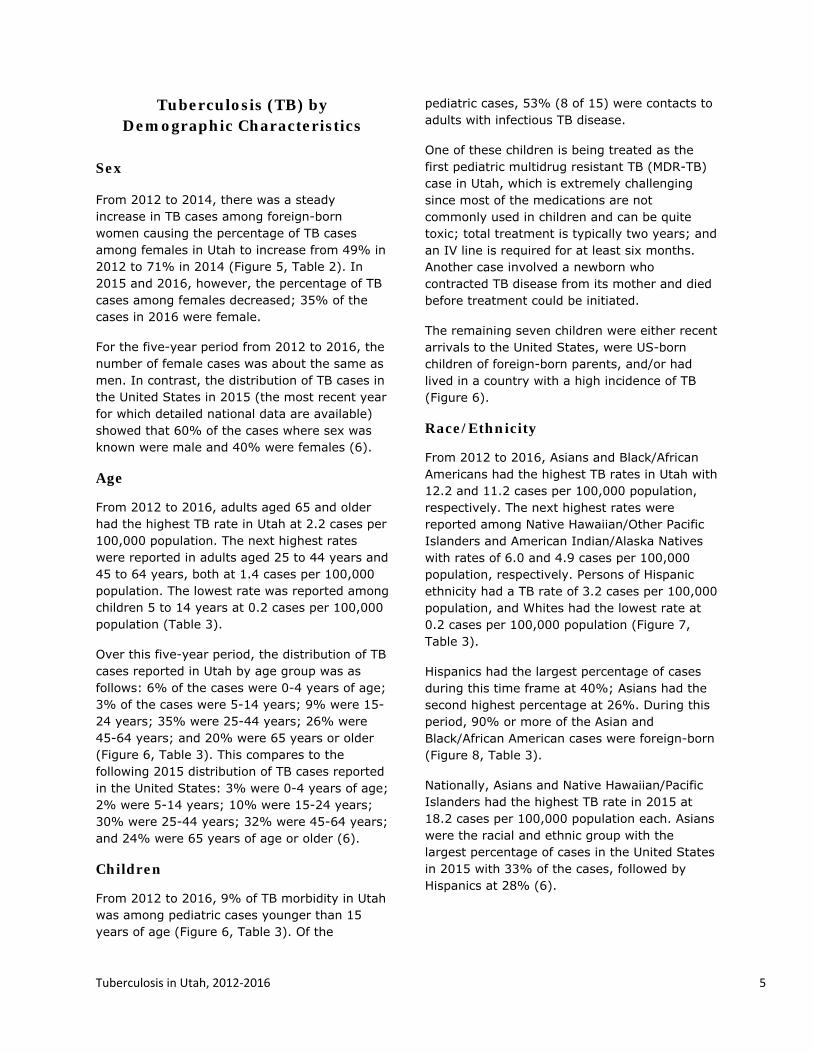
From 2012 to 2014, there was a steady increase in TB cases among foreign-born women causing the percentage of TB cases among females in Utah to increase from 49% in 2012 to 71% in 2014 (Figure 5, Table 2). In 2015 and 2016, however, the percentage of TB cases among females decreased; 35% of the cases in 2016 were female.
For the five-year period from 2012 to 2016, the number of female cases was about the same as men. In contrast, the distribution of TB cases in the United States in 2015 (the most recent year for which detailed national data are available) showed that 60% of the cases where sex was known were male and 40% were females (6).
Age
From 2012 to 2016, adults aged 65 and older had the highest TB rate in Utah at 2.2 cases per 100,000 population. The next highest rates were reported in adults aged 25 to 44 years and 45 to 64 years, both at 1.4 cases per 100,000 population. The lowest rate was reported among children 5 to 14 years at 0.2 cases per 100,000 population (Table 3).
Over this five-year period, the distribution of TB cases reported in Utah by age group was as follows: 6% of the cases were 0-4 years of age; 3% of the cases were 5-14 years; 9% were 15-24 years; 35% were 25-44 years; 26% were 45-64 years; and 20% were 65 years or older (Figure 6, Table 3). This compares to the following 2015 distribution of TB cases reported in the United States: 3% were 0-4 years of age; 2% were 5-14 years; 10% were 15-24 years; 30% were 25-44 years; 32% were 45-64 years; and 24% were 65 years of age or older (6).
Children
From 2012 to 2016, 9% of TB morbidity in Utah was among pediatric cases younger than 15 years of age (Figure 6, Table 3). Of the
pediatric cases, 53% (8 of 15) were contacts to adults with infectious TB disease.
One of these children is being treated as the first pediatric multidrug resistant TB (MDR-TB) case in Utah, which is extremely challenging since most of the medications are not commonly used in children and can be quite toxic; total treatment is typically two years; and an IV line is required for at least six months. Another case involved a newborn who contracted TB disease from its mother and died before treatment could be initiated.
The remaining seven children were either recent arrivals to the United States, were US-born children of foreign-born parents, and/or had lived in a country with a high incidence of TB (Figure 6).
Race/Ethnicity
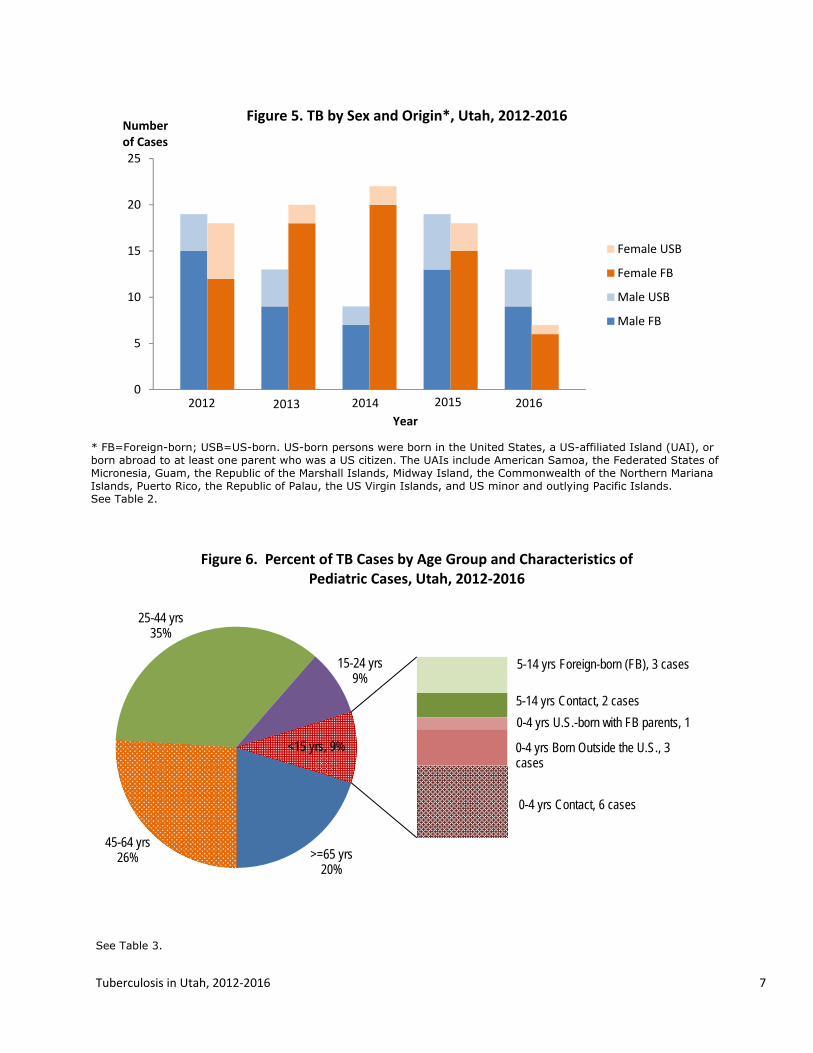
From 2012 to 2016, Asians and Black/African Americans had the highest TB rates in Utah with 12.2 and 11.2 cases per 100,000 population, respectively. The next highest rates were reported among Native Hawaiian/Other Pacific Islanders and American Indian/Alaska Natives with rates of 6.0 and 4.9 cases per 100,000 population, respectively. Persons of Hispanic ethnicity had a TB rate of 3.2 cases per 100,000 population, and Whites had the lowest rate at 0.2 cases per 100,000 population (Figure 7, Table 3).
Hispanics had the largest percentage of cases during this time frame at 40%; Asians had the second highest percentage at 26%. During this period, 90% or more of the Asian and Black/African American cases were foreign-born (Figure 8, Table 3).
Nationally, Asians and Native Hawaiian/Pacific Islanders had the highest TB rate in 2015 at 18.2 cases per 100,000 population each. Asians were the racial and ethnic group with the largest percentage of cases in the United States in 2015 with 33% of the cases, followed by Hispanics at 28% (6).

Tuberculosis in Utah, 2012‐2016 6
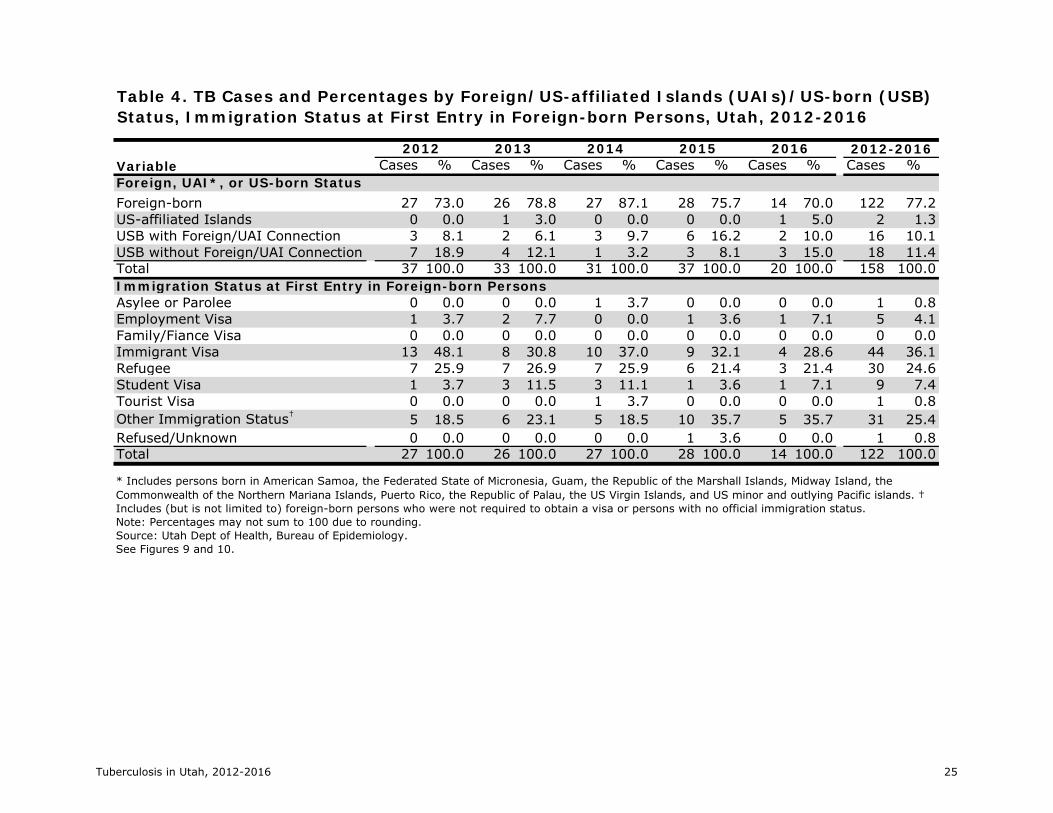
Country of Origin From 2012 to 2016, foreign-born persons accounted for 77% of the TB cases, and persons born in a US-affiliated island (UAI)† accounted for 1% of the cases. US-born persons with a foreign connection accounted for 10% of the cases (Figure 9, Table 4). Persons with foreign connections included individuals who had lived in countries with a high incidence of TB, US-born children who were contacts of foreign-born cases, or US-born cases with foreign-born parents. In the United States in 2015, 66% of all TB cases occurred in foreign-born persons. Utah ranked 18 out of 50 states for its percentage of TB cases among foreign-born persons (6). These numbers show the importance of effectively screening and treating individuals from high TB prevalence areas. Immigration Status at First Entry among Foreign-born Persons Among foreign-born TB cases in Utah from 2012 to 2016, 36% had immigration visas upon first entry into the United States; 25% were refugees; 7% had student visas; 4% had employment visas; 1% each were asylees/parolees, had tourist visas, or refused to answer the question; and 25% had other immigration status‡ (Figure 10, Table 4). This compares to the following 2015 distribution of immigration status among foreign-born TB cases reported in the United States: 26% had immigrant visas; 6% were refugees; 3% each had student or family/fiancé visas; 2% each had employment or tourist visas; less than 1% were asylee/parolees; 22% had other immigration status; and 35% had an unknown or missing immigration status (6).
† The UAIs include American Samoa, the Federated States of Micronesia, Guam, the Republic of the Marshall Islands, Midway Island, the Commonwealth of the Northern Mariana Islands, Puerto Rico, the Republic of Palau, the US Virgin Islands, and US minor and outlying Pacific Islands. ‡ Other immigration status includes (but is not limited to) foreign-born persons who were not required to obtain a visa or persons with no official immigration status.
Country of Birth The distribution of the countries of birth among foreign-born persons reported with TB in Utah from 2012 to 2016 illustrates the truly global nature of the disease. The top five countries - Mexico, India, the Philippines, Peru, and Somalia – span four continents and accounted for 57% of the total number of foreign-born cases. The top 11 countries accounted for 73% of the total number of foreign-born cases. Persons from 29 different countries each accounted for less than two percent of the total but together accounted for 27% of foreign-born persons reported with TB in Utah (Figure 11, Table 5).
Tuberculosis in Utah, 2012‐2016 7
0
5
10
15
20
25
Numberof Cases
Year
Figure 5. TB by Sex and Origin*, Utah, 2012‐2016
Female USB
Female FB
Male USB
Male FB
2012 2013 2014 2015 2016
>=65 yrs20%
45-64 yrs26%
25-44 yrs35%
15-24 yrs9%
Figure 6. Percent of TB Cases by Age Group and Characteristics of Pediatric Cases, Utah, 2012‐2016
<15 yrs, 9%
0-4 yrs U.S.-born with FB parents, 1
5-14 yrs Foreign-born (FB), 3 cases
0-4 yrs Contact, 6 cases
0-4 yrs Born Outside the U.S., 3 cases
5-14 yrs Contact, 2 cases
* FB=Foreign-born; USB=US-born. US-born persons were born in the United States, a US-affiliated Island (UAI), or born abroad to at least one parent who was a US citizen. The UAIs include American Samoa, the Federated States of Micronesia, Guam, the Republic of the Marshall Islands, Midway Island, the Commonwealth of the Northern Mariana Islands, Puerto Rico, the Republic of Palau, the US Virgin Islands, and US minor and outlying Pacific Islands. See Table 2.
See Table 3.
Tuberculosis in Utah, 2012‐2016 8
*AI/AN=American Indian/Alaska Native; Black/AA=Black/African American; NH/PI=Native Hawaiian/Other Pacific Islander; persons of Hispanic ethnicity can be of any race(s). †FB=Foreign-born; USB=US-born. US-born persons were born in the United States, a US-affiliated Island (UAI), or born abroad to at least one parent who was a US citizen. The UAIs include American Samoa, the Federated States of Micronesia, Guam, the Republic of the Marshall Islands, Midway Island, the Commonwealth of the Northern Mariana Islands, Puerto Rico, the Republic of Palau, the US Virgin Islands, and US minor and outlying Pacific Islands. See Table 3.
0 2 4 6 8 10 12 14
White
Hispanic*
American Indian/Alaska Native
Native Hawaiian/Other Pacific Islander
Black/African American
Asian
Rate per 100,000
Race/Ethnicity
Figure 7. TB Rates per 100,000 Population by Race/Ethnicity, Utah, 2012‐2016
AI/AN, USB4.4%
Asian, FB25.3%
Asian, USB0.6%
Black/AA, FB10.1%
Black/AA, USB0.6%
Hispanic‡, FB33.5%
Hispanic‡, USB6.3%
NH/PI, FB3.8%
NH/PI, USB1.3%
White, FB4.4%
White, USB9.5%
Figure 8. Percent of TB Cases by Race/Ethnicity* and Origin†, Utah, 2012‐2016
*Persons of Hispanic ethnicity can be of any race(s). See Table 3.

Tuberculosis in Utah, 2012‐2016 9
*Includes (but is not limited to) foreign-born persons who were not required to obtain a visa or persons with no official immigration status. See Table 4.
0%
20%
40%
60%
80%
100%
2012 2013 2014 2015 2016
Percent of Cases
Year
Figure 9. Percent of TB Cases by Foreign/U.S.‐affiliated Islands (UAIs)/U.S.‐born (USB) Status,* Utah, 2012‐2016
Foreign‐born US‐affiliated Isles
US‐born w/Foreign Connection US‐born w/No Foreign Connection
Immigrant Visa36%
Student Visa7%
Other Immigration Status*25%
Employment Visa4%
Tourist Visa1%
Asylee/Parolee1%
Refused/Unknown
1%
Refugee25%
Figure 10. Percent of Foreign‐born TB Cases by Immigration Status at First Entry, Utah, 2012‐2016
*US-born persons were born in the United States or born abroad to at least one parent who was a US citizen. The UAIs include American Samoa, the Federated States of Micronesia, Guam, the Republic of the Marshall Islands, Midway Island, the Commonwealth of the Northern Mariana Islands, Puerto Rico, the Republic of Palau, the US Virgin Islands, and US minor and outlying Pacific Islands. See Table 4.

Tuberculosis in Utah, 2012‐2016 10
Mexico30.3%
India7.4%
Philippines7.4%
Peru6.6%
Somalia4.9%
Indonesia3.3%
Sudan3.3%
Burma2.5%
Nepal2.5%
Bosnia and Herzegovina
2.3%
Vietnam2.5%
Other†27.0%
Figure 11. Percent of Foreign‐born* TB Cases by Country of Birth , Utah, 2012‐2016
* Foreign-born persons were born outside the United States or US-affiliated islands (UAI) and did not have at least one parent who was a US citizen. The UAIs include American Samoa, the Federated States of Micronesia, Guam, the Republic of the Marshall Islands, Midway Island, the Commonwealth of the Northern Mariana Islands, Puerto Rico, the Republic of Palau, the US Virgin Islands, and US minor and outlying Pacific Islands. † Other countries include: Afghanistan, Argentina, Bhutan, Bolivia, Bosnia and Herzegovina, Cambodia, China, Congo, Cuba, Dominican Republic, Egypt, El Salvador, Ethiopia, Guatemala, Honduras, Iraq, Kenya, Republic of Korea, Laos, Pakistan, Papua New Guinea, Taiwan, Tanzania, Thailand, Uganda, Uzbekistan, Vanuatu, Western Samoa, and Yugoslavia. See Table 5.
Tuberculosis in Utah, 2012‐2016 11
Tuberculosis (TB) by Risk Factor
HIV Testing and Coinfection
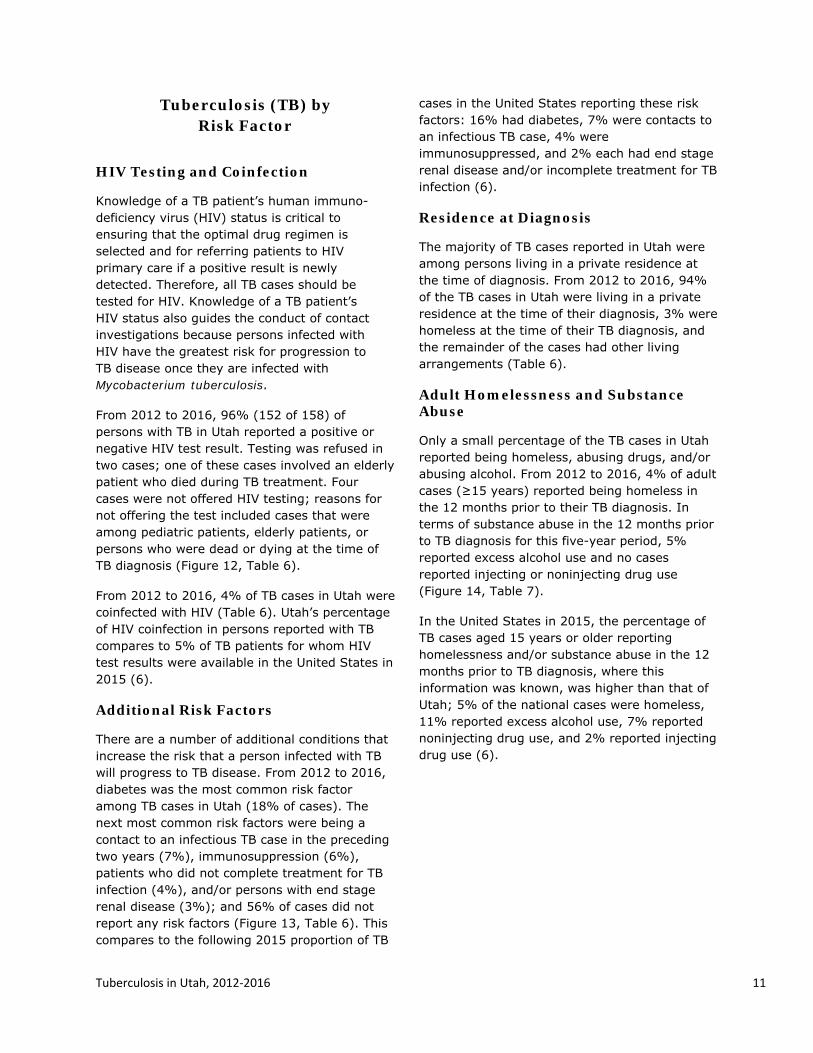
Knowledge of a TB patient’s human immuno-deficiency virus (HIV) status is critical to ensuring that the optimal drug regimen is selected and for referring patients to HIV primary care if a positive result is newly detected. Therefore, all TB cases should be tested for HIV. Knowledge of a TB patient’s HIV status also guides the conduct of contact investigations because persons infected with HIV have the greatest risk for progression to TB disease once they are infected with Mycobacterium tuberculosis.
From 2012 to 2016, 96% (152 of 158) of persons with TB in Utah reported a positive or negative HIV test result. Testing was refused in two cases; one of these cases involved an elderly patient who died during TB treatment. Four cases were not offered HIV testing; reasons for not offering the test included cases that were among pediatric patients, elderly patients, or persons who were dead or dying at the time of TB diagnosis (Figure 12, Table 6).
From 2012 to 2016, 4% of TB cases in Utah were coinfected with HIV (Table 6). Utah’s percentage of HIV coinfection in persons reported with TB compares to 5% of TB patients for whom HIV test results were available in the United States in 2015 (6).
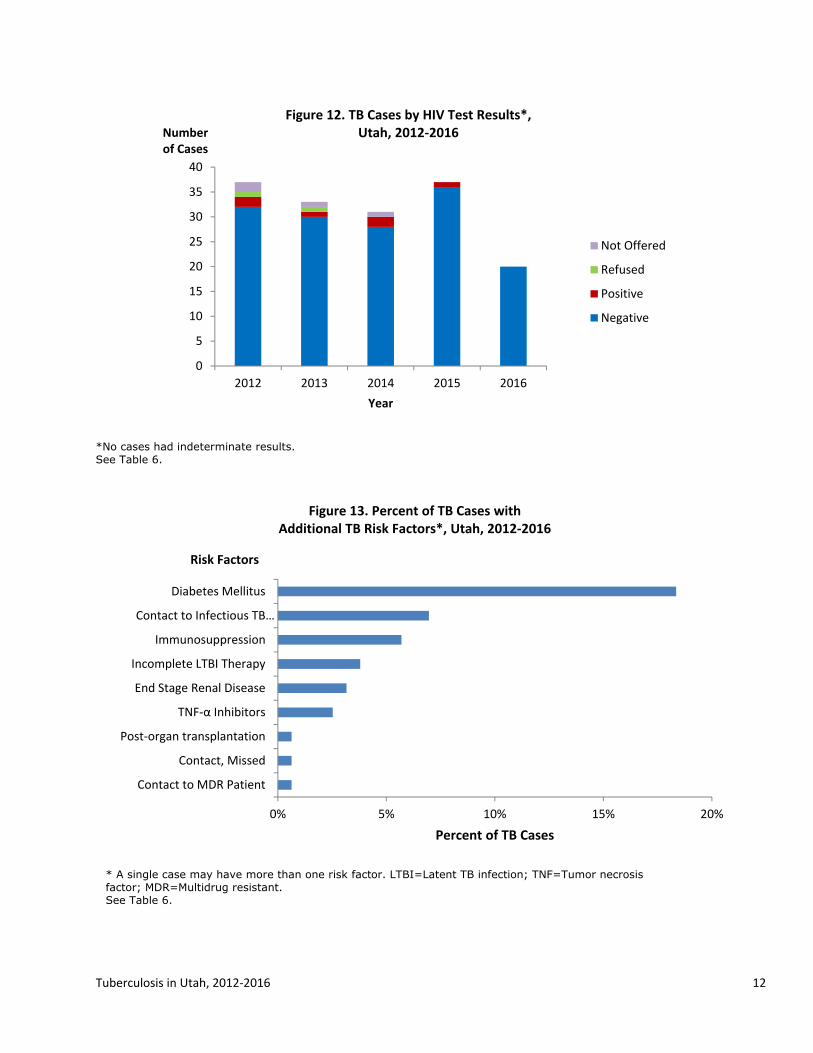
Additional Risk Factors
There are a number of additional conditions that increase the risk that a person infected with TB will progress to TB disease. From 2012 to 2016, diabetes was the most common risk factor among TB cases in Utah (18% of cases). The next most common risk factors were being a contact to an infectious TB case in the preceding two years (7%), immunosuppression (6%), patients who did not complete treatment for TB infection (4%), and/or persons with end stage renal disease (3%); and 56% of cases did not report any risk factors (Figure 13, Table 6). This compares to the following 2015 proportion of TB
cases in the United States reporting these risk factors: 16% had diabetes, 7% were contacts to an infectious TB case, 4% were immunosuppressed, and 2% each had end stage renal disease and/or incomplete treatment for TB infection (6).
Residence at Diagnosis
The majority of TB cases reported in Utah were among persons living in a private residence at the time of diagnosis. From 2012 to 2016, 94% of the TB cases in Utah were living in a private residence at the time of their diagnosis, 3% were homeless at the time of their TB diagnosis, and the remainder of the cases had other living arrangements (Table 6).
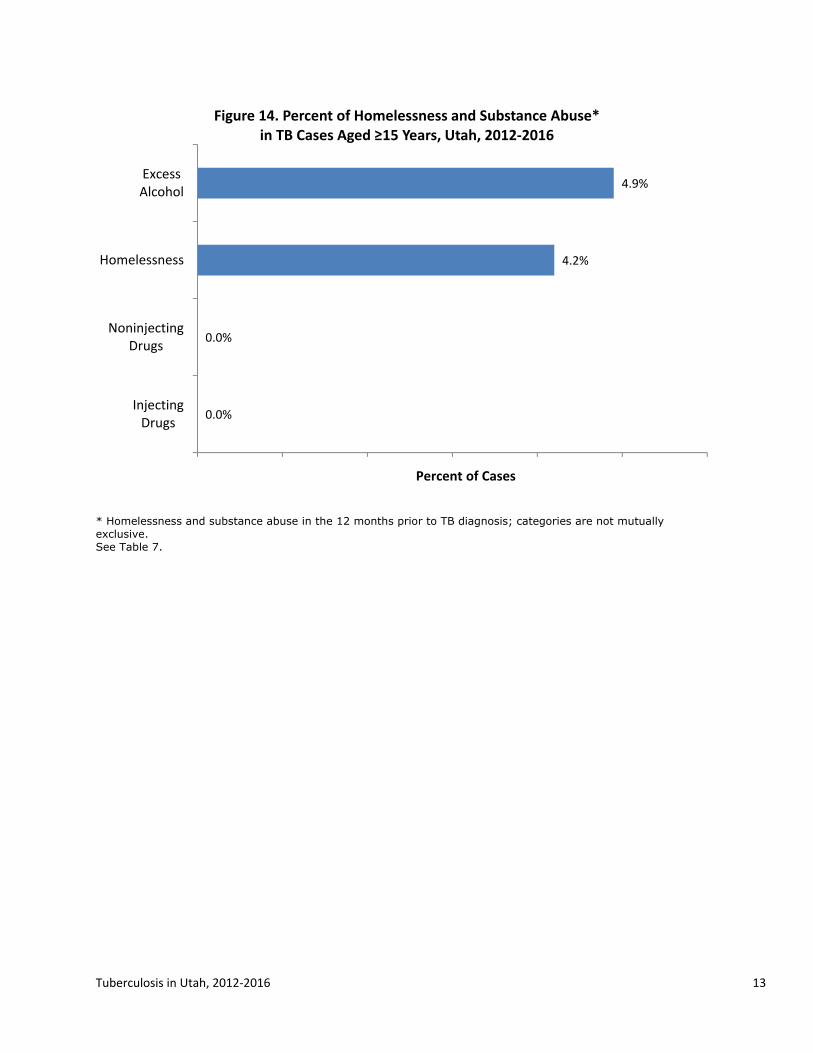
Adult Homelessness and Substance Abuse
Only a small percentage of the TB cases in Utah reported being homeless, abusing drugs, and/or abusing alcohol. From 2012 to 2016, 4% of adult cases (≥15 years) reported being homeless in the 12 months prior to their TB diagnosis. In terms of substance abuse in the 12 months prior to TB diagnosis for this five-year period, 5% reported excess alcohol use and no cases reported injecting or noninjecting drug use (Figure 14, Table 7).
In the United States in 2015, the percentage of TB cases aged 15 years or older reporting homelessness and/or substance abuse in the 12 months prior to TB diagnosis, where this information was known, was higher than that of Utah; 5% of the national cases were homeless, 11% reported excess alcohol use, 7% reported noninjecting drug use, and 2% reported injecting drug use (6).
Tuberculosis in Utah, 2012‐2016 12
0
5
10
15
20
25
30
35
40
2012 2013 2014 2015 2016
Number of Cases
Year
Figure 12. TB Cases by HIV Test Results*, Utah, 2012‐2016
Not Offered
Refused
Positive
Negative
0% 5% 10% 15% 20%
Contact to MDR Patient
Contact, Missed
Post‐organ transplantation
TNF‐α Inhibitors
End Stage Renal Disease
Incomplete LTBI Therapy
Immunosuppression
Contact to Infectious TB…
Diabetes Mellitus
Percent of TB Cases
Risk Factors
Figure 13. Percent of TB Cases with Additional TB Risk Factors*, Utah, 2012‐2016
* A single case may have more than one risk factor. LTBI=Latent TB infection; TNF=Tumor necrosis factor; MDR=Multidrug resistant. See Table 6.
*No cases had indeterminate results. See Table 6.
Tuberculosis in Utah, 2012‐2016 13
* Homelessness and substance abuse in the 12 months prior to TB diagnosis; categories are not mutually exclusive. See Table 7.
0.0%
0.0%
4.2%
4.9%
InjectingDrugs
NoninjectingDrugs
Homelessness
ExcessAlcohol
Percent of Cases
Figure 14. Percent of Homelessness and Substance Abuse* in TB Cases Aged ≥15 Years, Utah, 2012‐2016
Tuberculosis in Utah, 2012‐2016 14
Tuberculosis (TB) by Clinical Information
Primary Reason for TB Evaluation
There are a variety of reasons that bring patients into the health care system that result in their eventual TB diagnosis. From 2012 to 2016, 65% of the TB cases in Utah had TB symptoms as the primary reason for being evaluated for TB. Having abnormal chest x-rays (13% of cases) and incidental lab results (8%) were the next highest reasons for TB evaluation (Figure 15, Table 7). Nationally, these three reasons were also the most common primary reasons for TB evaluation, with 56% of cases having TB symptoms, 21% with abnormal chest x-rays, and 11% with incidental lab results (6).
Case Verification
From 2012 to 2016, 72% of TB cases reported in Utah were confirmed by isolation of M. tuberculosis from a laboratory culture. During this time frame, 25% of the cases met the clinical case definition of TB and 3% were verified by provider diagnosis.§ Of the remaining cases, 1% was verified by a positive sputum or tissue smear (Figure 16, Table 7).
The case verification in Utah compares with the following case verification in the United States in 2015: 77% of the cases were confirmed by laboratory culture, 2% by positive NAAT, less than 1% by positive smear/tissue, 15% by clinical case definition, and 5% by provider diagnosis (6).
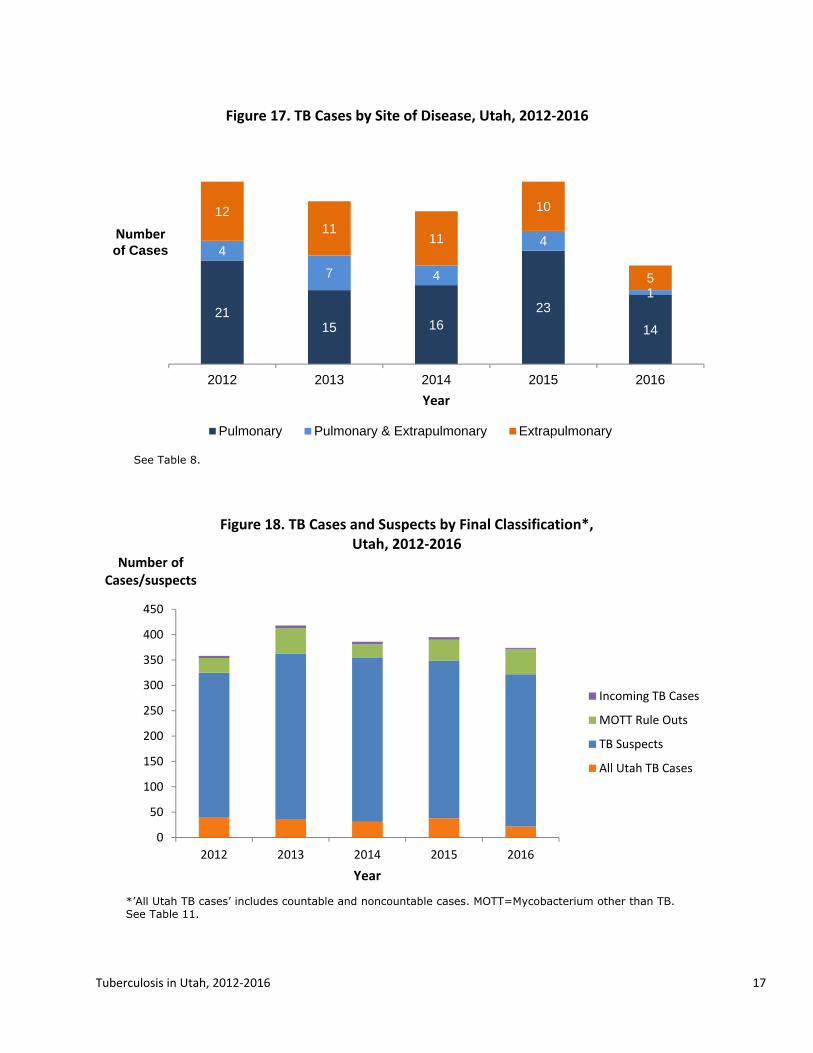
Site of Disease
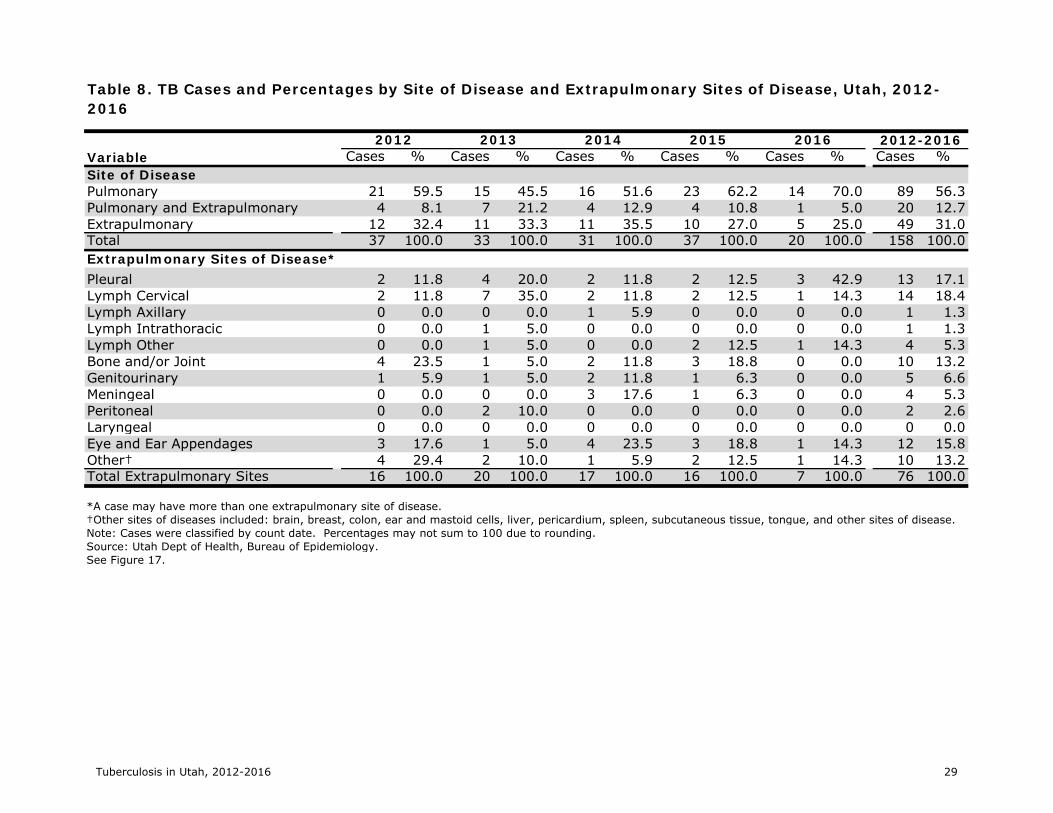
Although it is widely known as a pulmonary disease, TB can affect other parts of the body, including the lymphatic system, bones and/or joints, the meninges, and the genitourinary system. From 2012 to 2016, 56% of the reported
§ Clinical cases are defined as cases that have a positive TB skin test or interferon gamma release assay (IGRA) for Mycobacterium tuberculosis, have other signs and symptoms compatible with TB, are treated with two or more anti-TB medications, and have completed a diagnostic evaluation. When patients meet neither the laboratory nor clinical case definition, they may be verified TB cases based on provider diagnosis.
TB cases in Utah were pulmonary, 13% were pulmonary and extrapulmonary, and 31% were extrapulmonary alone (Figure 17, Table 8). As a comparison, 70% of the TB cases reported in the United States in 2015 were pulmonary, 10% were pulmonary and extrapulmonary, and 20% were extrapulmonary alone (6).
Of the extrapulmonary sites of disease that were reported in Utah during this five-year period, the most common site was cervical lymph nodes (18%), followed by pleura (17%), eye and/or ear appendages (16%), and bones and/or joints (13%) (Table 8). A TB case may have more than one extrapulmonary site of disease.
Drug Susceptibility Testing and Results
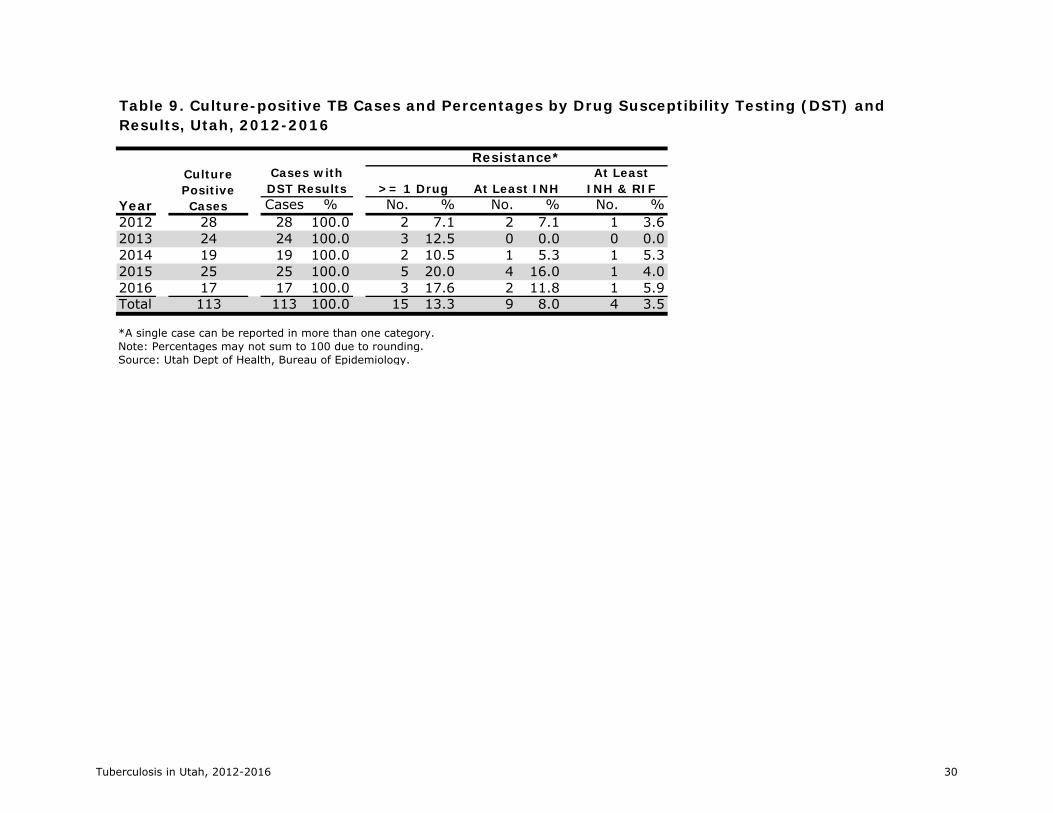
In order to ensure that patients are given the correct treatment, a specimen from each culture-confirmed TB case must be tested for drug resistance, and the regimen adjusted accordingly. From 2012 to 2016, drug susceptibility testing was completed on 100% of the isolates of TB cases confirmed by laboratory culture. Of these isolates, 13% had resistance to one or more anti-TB medications, 8% had resistance to at least isoniazid (INH), and 4% were resistant to at least INH and rifampin (RIF), i.e., MDR-TB (Table 9). As a comparison, 9% of the reported cases in the United States in 2015 with reported drug susceptibility results were resistant to at least INH and 1% was confirmed with MDR-TB (6).
Directly Observed Therapy
Directly observed therapy (DOT) involves the direct visual observation by a health care provider or other reliable person of a patient’s ingestion of medication. Because TB treatment is typically administered for a minimum of six months, DOT is necessary not only to ensure effective therapy and monitor for side effects but also to prevent acquired drug resistance. In Utah, DOT is usually administered by local health department staff.
DOT figures are reported for the five-year period from 2011 to 2015 as many 2016 patients are still on treatment. During this time frame, 94% of patients treated for TB in Utah had all doses of their medications given by DOT, and 5%

Tuberculosis in Utah, 2012‐2016 15
completed their treatment utilizing a combination of directly observed and self-administered therapy (Table 10). Reasons for the combination of directly observed and self-administered therapy included patients being permitted to travel out of state for employment but who did not follow through with instructions to contact out-of-state health departments, partner agencies not starting DOT, and patients moving out of state. One case had all doses administered by a family member, which is considered self-administered treatment.
The percentage of cases utilizing DOT in Utah is higher than the national average. The most recent national statistics available regarding the percentage of cases given treatment by DOT are from 2013. In that year, 63% of the cases completed treatment using only DOT and 29% utilized both directly observed and self-administered therapy (6).
Completion of Treatment
Of the 172 TB cases reported in Utah between 2011 and 2015, 168 cases started TB treatment. Three cases were reported at death, and one patient did not start treatment as the patient entered hospice shortly after their TB diagnosis. Of the patients who started treatment, 93% completed therapy, 5% died, one patient was uncooperative or refused treatment, and one MDR-TB patient is still on therapy (Table 10). Of the nine patients who died, four died of causes unrelated to TB disease. This compares with the following 2013 national distribution of completion of treatment reasons: 88% completed treatment, 6% died, 1% lost, 1% refused, less than 1% had adverse events, and 4% unknown (6).
TB Cases, Suspects, and Rule Outs
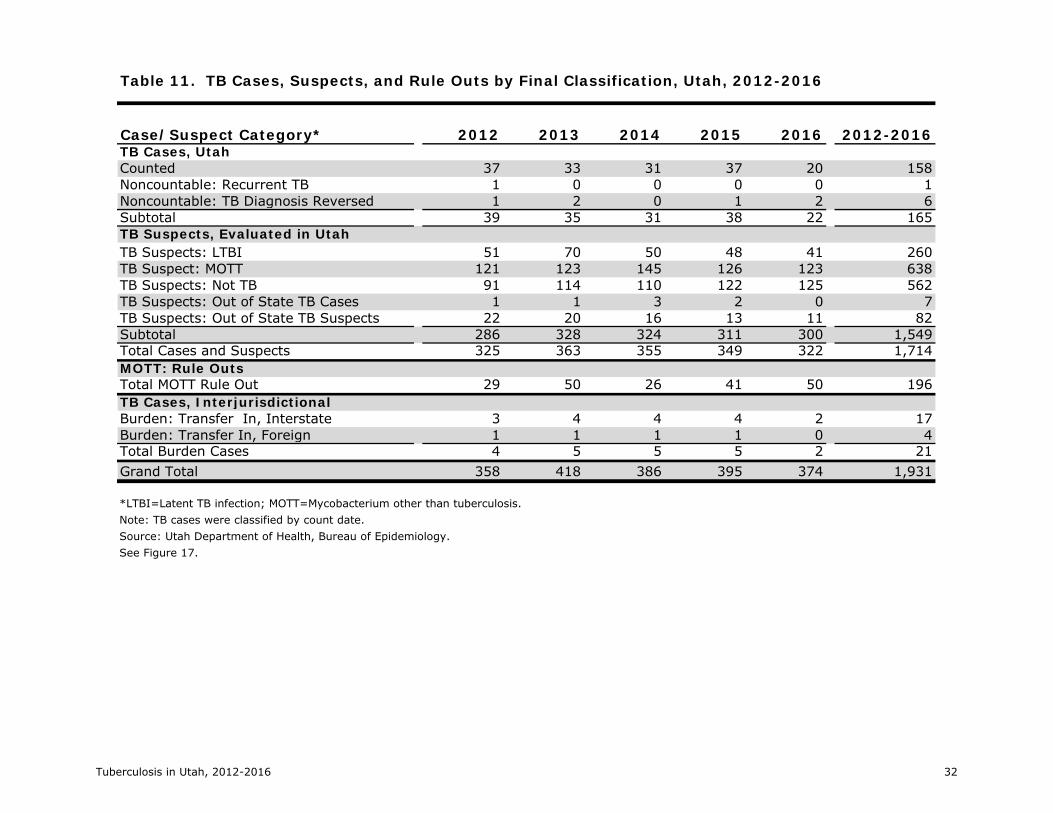
In addition to managing counted TB cases, the TB Control Program managed noncountable cases, including cases where TB was recurrent (diagnosed within a year of completion of treatment), where the TB diagnosis was reversed, and cases moving to Utah – whether from other states or countries. These interjurisdictional cases were provided TB medications using DOT during their residence in Utah.
Starting in 2011, all persons suspected of having TB, including those with a positive acid-fast bacillus (AFB) smear and/or culture laboratory result, were entered into UT-NEDSS. Mycobacterium other than tuberculosis (MOTT) laboratory results were also entered into UT-NEDSS, whether the results were a follow-up to a positive AFB culture or a direct rule-out of TB. Additionally, all immigrant and refugee arrivals with an abnormal chest x-ray abroad were also considered to be suspect for TB disease. Each person suspected of having TB was monitored by a public health agency to ensure the completion of a diagnostic evaluation for TB or to ensure that an interjurisdictional referral was made for out-of-state suspect or confirmed cases of TB.
From 2012 to 2016, a total of 1,714 people were reported as either confirmed or suspected of having TB in Utah. During this time frame, 9% (172 of 1,714) of persons suspected of having TB were diagnosed with TB disease and counted as a case in Utah. In addition, the Utah TB Control Program processed laboratory results of an additional 196 persons where TB was directly ruled out and provided case management for 21 incoming interjurisdictional transfer cases (Figure 18, Table 11).
It is important for health care providers to consider TB as a possible diagnosis, even if an increase in suspect TB cases also means increased public health resources will be necessary to evaluate suspect cases. Due to its airborne mode of transmission, early detection and treatment of TB is essential to control the spread of the disease and to prevent outbreaks.

Tuberculosis in Utah, 2012‐2016 16
0%
20%
40%
60%
80%
100%
2012 2013 2014 2015 2016
Percent of Cases
Year
Figure 15. Percent of TB Cases by Primary Reason for TB Evaluation, Utah, 2012‐2016
Administrative Testing
Contact Investigation
Immigrant Medical Exam
Incidental Lab Result
Abnormal Chest X‐ray
TB Symptoms
0%
20%
40%
60%
80%
100%
2012 2013 2014 2015 2016
Percent of Cases
Year
Figure 16. Percent of TB Cases by Case Verification, Utah, 2012‐2016
Provider
Clinical
Positive Smear/Tissue
Positive NAAT
Positive Culture
**NAAT=Nucleic acid amplification test. See Table 7.
See Table 7.
Tuberculosis in Utah, 2012‐2016 17
2115 16
23
14
4
7 4
4
1
1211
11
10
5
2012 2013 2014 2015 2016
Numberof Cases
Year
Figure 17. TB Cases by Site of Disease, Utah, 2012‐2016
Pulmonary Pulmonary & Extrapulmonary Extrapulmonary
0
50
100
150
200
250
300
350
400
450
2012 2013 2014 2015 2016
Number ofCases/suspects
Year
Figure 18. TB Cases and Suspects by Final Classification*, Utah, 2012‐2016
Incoming TB Cases
MOTT Rule Outs
TB Suspects
All Utah TB Cases
*’All Utah TB cases’ includes countable and noncountable cases. MOTT=Mycobacterium other than TB. See Table 11.
See Table 8.

Tuberculosis in Utah, 2012‐2016 18
Tuberculosis (TB) Program Evaluation
The CDC sets national TB program objectives and targets to assist TB control programs in evaluating their performance. This section compares the performance of the Utah TB Programs from 2012 to 2016 to the 2020 National TB Program Objectives (7). The table on page 20 summarizes the national objectives and Utah’s performance.
TB Case Rates
Utah is a low-incidence TB state, and case rates among the populations identified in the national objectives are generally below target rates. From 2012 to 2016, Utah met the 2020 national target rates for the statewide rate and the rate for US-born persons. Among foreign-born persons, Utah had rates of 11.4 per 100,000 population, which were slightly over the target rate of 11.1, in two of the five years. Among US-born non-Hispanic Black/African Americans, Utah had one case in 2013, which resulted in exceeding the target rate due to the low population numbers. Among children <5 years, Utah exceeded the target rate in all five years but only had one or two cases each year except in 2015, when four children <5 years were diagnosed with TB as part of a contact investigation of an infectious family member.
TB Case Management/Lab Reporting
The most important strategy for TB control is to rapidly diagnose and treat to completion cases of TB disease. The eight national TB objectives related to case management and lab reporting ensure that TB patients are started on an appropriate treatment regimen as soon as possible, are monitored to ensure that the regimen is effective, and complete treatment in a timely manner.
The Utah TB Control Program generally met or exceeded the 2015 National TB Program Objective targets, but the targets have all been raised for 2020. The program performed at 100% from 2012 to 2016 for the Drug-susceptibility Testing and was under the target for one out of five years for the following
objectives: Treatment Initiation; Completion of Treatment; and Universal Genotyping.
The program did not meet the target for two of the five years for Known HIV Status and Sputum Culture Conversion. For Known HIV Status, two elderly persons who died during TB treatment either refused or were not offered HIV testing in 2012; and in 2013, one patient refused HIV testing and another patient was diagnosed with TB in hospice. However, from 2014-2016, the program surpassed the national target for this objective. For Sputum Culture Conversion, one case each in 2012 and 2014 was diagnosed with MDR-TB, and one patient reported in 2012 was diabetic. These conditions tend to delay culture conversion, and additional drug susceptibility and/or drug absorption testing is often necessary.
Recommended Initial Therapy was one of the two objectives where the program did not consistently meet the national target. The objective measures whether patients initiated the 4-drug regimen of isoniazid, rifampin or rifabutin, pyrazinamide, and ethambutol. Cases not meeting this objective had legitimate reasons for not starting the 4-drug regimen, e.g. where drug resistance was already known or suspected, contacts of cases where the drug susceptibility results of the index case were known, or having medical reasons for not starting with the 4-drug regimen.
Sputum-culture Reported, which measures the percentage of TB patients 12 years or older with pleural or respiratory site of disease who had sputum culture results reported, was the other objective that was not consistently met. Utah cases not meeting the objective were either unable to produce sputum, did not have sputum collected, or expired before sputum specimens could be collected. In the instances where sputum was not collected, one-on-one training was conducted with providers.
Contact Investigations
Conducting contact investigations is the second most important strategy for controlling TB in the United States, and the Utah TB Rule requires that contact investigations be conducted by the
Tuberculosis in Utah, 2012‐2016 19
patient’s local health department for all confirmed TB patients and for persons suspected of having TB who may be infectious (3). Patients are interviewed about who they have been in contact with, and these contacts are evaluated for TB infection and disease. Contacts are at a high risk for being infected with TB; and if recently infected, a contact is at a high risk of progressing from TB infection to TB disease. Therefore, it is critical to identify, evaluate, and treat TB contacts.
The national objectives evaluate program performance on contact investigations of sputum AFB smear-positive TB cases – the most infectious cases. The Utah TB Control Program has consistently met the objective related to the elicitation of contacts, which it did for 100% of cases during the five years. It has not consistently met the national targets for the examination, treatment initiation, and treatment completion. In an effort to achieve national targets, the Utah TB Control Program selected the treatment initiation and completion of contacts newly diagnosed with TB infection as a focus area for improvement and has encouraged case managers to utilize short-course LTBI treatment regimens for contacts newly-diagnosed with LTBI.
Evaluation of Immigrants and Refugees
All refugees and US immigrant visa applicants living outside the United States are required to undergo an overseas medical examination that includes evaluation for TB. Departure to the United States is postponed for persons found to have infectious TB. For persons with overseas abnormal chest x-rays suggestive of TB, follow-up is conducted upon arrival in the United States. The national TB objectives in this section measure whether the evaluation of the newly-arriving refugee or immigrant was initiated and completed within specified time frames, and if found to have latent TB infection, whether treatment was initiated and completed.
National targets were newly set for 2020 for the examination of immigrants and refugees. During the past year, the program conducted data quality assurance and entered missing data into CDC’s Electronic Disease Notification (EDN)
database. Utah’s performance in the National TB Indicators Project database indicates that the state is consistently above the national average for the objectives in this section except for Treatment Initiation. The program will continue to strive to achieve the national targets by 2020.
Data Reporting
The CDC collects data on each case of TB from state and local health departments throughout the United States using the RVCT form. Aggregate data regarding TB contact investigations are reported using the Aggregate Report of Program Evaluation (ARPE) form. Lastly, data regarding the evaluation and treatment of newly-arriving refugees and immigrants with abnormal overseas chest x-rays suggestive of TB is reported using EDN.
Accurate and complete data is needed to determine local as well as national TB trends. Therefore, the national TB objectives include a section on data reporting, and the 2020 national TB objectives newly include a target for EDN data.
The Utah TB Control Program has consistently exceeded the national targets for data reporting. The program collaborates with Utah’s local health departments that provide TB case management to collect the necessary information. Data quality assurance is conducted at least monthly.

2012 2013 2014 2015 2016TB CASE RATES (rate per 100,000 population): Decrease the TB case rate in the following populations to below target rates.TB Incidence Rate 1.4 1.3 1.1 1.1 1.2 0.7US-born persons 0.4 0.4 0.3 0.1 0.3 0.2Foreign-born persons 11.1 11.4 10.8 10.7 11.4 6.1US-born non-Hispanic Black/African Americans 1.5 0.0 4.7 0.0 0.0 0.0Children <5 years of age 0.3 0.4 0.8 0.8 1.6 0.4TB CASE MANAGEMENT AND TREATMENT (%):Known HIV Status: Increase the proportion of TB cases with positive or negative HIV test results reported.
98 94.4 93.9 100.0 100.0 100.0
Treatment Initiation: Increase the proportion of TB patients with positive acid-fast bacillus (AFB) sputum-smear results who initiate treatment within 7 days of specimen collection.
97 100.0 85.7 100.0 100.0 100.0
Recommended Initial Therapy: Increase the proportion of patients who are started on the recommended initial 4-drug regimen when suspected of having TB disease.
97 91.7 96.9 93.1 91.9 90.0
Sputum Culture Result Reported: Increase the proportion of TB cases with a pleural or respiratory site of disease in patients ages 12 years or older that have positive or negative sputum-culture result reported.
98 91.7 90.5 94.4 95.2 100.0
Sputum Culture Conversion: Increase the proportion of TB patients with positive sputum culture results who have documented conversion to sputum culture-negative within 60 days of treatment initiation.
73 68.8 92.9 66.7 86.7 92.3
Completion of Treatment: For patients with newly-diagnosed TB for whom 12 months or less of treatment is indicated, increase the proportion of patients who complete treatment within 12 months.
95 96.6 100.0 100.0 93.5 —
LAB REPORTING (%):Drug-susceptibility Result: Increase the proportion of culture-positive TB cases with initial drug-susceptibility result reported.
100 100.0 100.0 100.0 100.0 100.0
Universal Genotyping: Increase the proportion of culture-confirmed TB cases with a genotyping result reported.
100 100.0 100.0 100.0 96.0 100.0
CONTACT INVESTIGATIONS (%):Contact Elicitation: Increase the proportion of TB patients with positive AFB sputum-smear results who have contacts elicited.
100 100.0 100.0 100.0 100.0 100.0
Examination: Increase the proportion of contacts to sputum AFB smear-positive TB patients who are examined for infection and disease.
93 80.0 85.7 87.6 91.8 89.9
Treatment Initiation: Increase the proportion of contacts to sputum AFB smear-positive TB patients with newly diagnosed latent TB infection (LTBI) who start treatment.
88 79.3 95.0 73.0 96.8 81.3
Treatment Completion: For contacts to sputum AFB smear-positive TB patients who have started treatment for their newly diagnosed LTBI, increase the proportion who complete treatment.
79 67.4 89.5 80.4 75.4 —
EVALUATION OF IMMIGRANTS AND REFUGEES (%)*:Examination Initiation: For immigrants and refugees with abnormal chest x-rays (CXRs) read overseas as consistent with TB, increase the proportion who initiate medical examination within 30 days of notification
84 92.5 84.0 78.1 72.3 80.6
Examination Completion: For immigrants and refugees with abnormal CXRs read overseas as consistent with TB, increase the proportion who complete medical examination within 90 days of notification
76 83.9 87.0 78.1 82.1 76.7
Treatment Initiation: For immigrants and refugees with abnormal CXRs read overseas as consistent with TB and who are diagnosed with LTBI or have radiographic findings consistent with prior pulmonary TB during their examination in the US, increase the proportion who start treatment.
93 84.8 75.7 36.4 67.6 65.0
Treatment Completion: For immigrants and refugees with abnormal CXRs read overseas as consistent with TB, who are diagnosed with LTBI or have radiographic findings consistent with prior pulmonary TB during their examination in the US, and who start treatment, increase the proportion who complete LTBI treatment.
83 74.4 78.6 83.3 65.2 —
DATA REPORTING (%):RVCT: Increase the completeness of each core Report of Verified Case of Tuberculosis (RVCT) data item reported.
100 100.0 99.7 99.7 100.0 —
ARPEs: Increase the completeness of each core Aggregated Reports of Program Evaluation (ARPEs) data items reported.
100 100.0 100.0 100.0 100.0 —
EDN: Increase the completeness of each core Electronic Disease Notification (EDN) system data item reported.
93 96.7 95.8 96.1 93.5 —
2020 National TB Program Objective Status, Utah, 2012-2016
National Objective 2020Nt'l
Target
Utah Performance
Note: '—' =Data not yet available.Source: CDC National TB Indicators Project.
Tuberculosis in Utah, 2012-2016 20
Tuberculosis in Utah, 2012-2016 21
TABLES

TABLE 1. TB Cases and Rates per 100,000 Population, Utah and United States, 1993-2016
USCases Rate Rate
1993 47 2.5 9.71994 56 2.9 9.21995 48 2.4 8.51996 58 2.8 7.91997 36 1.7 7.21998 52 2.4 6.61999 40 1.8 6.32000 49 2.2 5.82001 35 1.5 5.62002 31 1.3 5.22003 39 1.7 5.12004 36 1.5 5.02005 29 1.2 4.82006 34 1.3 4.62007 39 1.5 4.42008 27 1.0 4.22009 37 1.4 3.82010 20 0.7 3.62011 34 1.2 3.42012 37 1.3 3.22013 33 1.1 3.02014 31 1.1 2.92015 37 1.2 3.02016 20 0.7 2.9
See: Figures 1 and 2.
Year Utah
Sources: Utah Cases - Utah Department of Health, Bureau of Epidemiology; US Case Rates - Centers for Disease Control and Prevention (CDC); Population Estimates - National Center for Health Statistics (NCHS) through a collaborative agreement with the US Bureau of the Census.
Tuberculosis in Utah, 2012-2016 22
Cases % Cases % Cases % Cases % Cases % Cases % Rates‡
Bear River 2 5.9 1 2.7 1 3.0 1 2.7 1 5.0 6 3.8 0.7Central 0 0.0 0 0.0 1 3.0 0 0.0 0 0.0 1 0.6 0.3Davis 1 2.9 1 2.7 0 0.0 0 0.0 2 10.0 4 2.5 0.2Salt Lake 22 64.7 23 62.2 24 72.7 31 83.8 14 70.0 114 72.2 2.1San Juan 2 5.9 0 0.0 0 0.0 0 0.0 1 5.0 3 1.9 3.9Southeast 1 2.9 0 0.0 0 0.0 0 0.0 0 0.0 1 0.6 0.5Southwest 2 5.9 0 0.0 3 9.1 1 2.7 0 0.0 6 3.8 0.6Summit 1 2.9 0 0.0 0 0.0 0 0.0 0 0.0 1 0.6 0.5Tooele 0 0.0 0 0.0 0 0.0 0 0.0 0 0.0 0 0.0 0.0TriCounty 1 2.9 2 5.4 1 3.0 0 0.0 0 0.0 4 2.5 1.4Utah 3 8.8 1 2.7 0 0.0 2 5.4 1 5.0 7 4.4 0.2Wasatch 1 2.9 0 0.0 0 0.0 1 2.7 0 0.0 2 1.3 1.4Weber-Morgan 1 2.9 5 13.5 1 3.0 1 2.7 1 5.0 9 5.7 0.7Total 34 108.8 37 89.2 33 93.9 37 100.0 20 100.0 158 100.0 1.1Sex/Origin of BirthMale 19 51.4 13 39.4 9 29.0 19 51.4 13 65.0 73 49.7 1.0Foreign-born 15 78.9 9 69.2 7 77.8 13 68.4 9 69.2 53 72.6US-born 4 21.1 4 30.8 2 22.2 6 31.6 4 30.8 20 27.4Female 18 48.6 20 60.6 22 71.0 18 48.6 7 35.0 85 50.3 1.2Foreign-born 12 66.7 18 90.0 20 90.9 15 83.3 6 85.7 71 83.5US-born 6 33.3 2 10.0 2 9.1 3 16.7 1 14.3 14 16.5Total 37 100.0 33 100.0 31 100.0 37 100.0 20 100.0 158 100.0 1.1
* In 2015, Southeastern Utah District Health Department divided into San Juan Health Department and Southeast Utah Health Department.
Note: Percentages may not sum to 100 due to rounding.
See Figures 3, 4, and 5.
Table 2. TB Cases, Percentages, and Rates per 100,000 Population by Local Health District*, Sex and Origin†, Utah, 2012-2016
2012-2016
Source: Cases – Utah Dept of Health, Bureau of Epidemiology, TB Control Pgm; Population Estimates – National Center for Health Statistics (NCHS) through a collaborative agreement with the US Bureau of the Census.
Variable2012 2013 2014 2015 2016
Local Health District
†US-born persons were born in the United States (US), a US-affiliated Island (UAI), or born abroad to at least one parent who was a US citizen. The UAIs include American Samoa, the Federated States of Micronesia, Guam, the Republic of the Marshall Islands, Midway Island, the Commonwealth of the Northern Mariana Islands, Puerto Rico, the Republic of Palau, the US Virgin Islands, and US minor and outlying Pacific Islands.‡ In low population areas, small case counts can result in high rates; therefore, these rates should be interpreted with caution.
Tuberculosis in Utah, 2012-2016 23

Cases % Cases % Cases % Cases % Cases % Cases % RateAge Group (in years)0-4 1 2.7 2 6.1 2 6.5 4 10.8 1 5.0 10 6.3 0.85-14 0 0.0 1 3.0 0 0.0 3 8.1 1 5.0 5 3.2 0.215-24 2 5.4 3 9.1 2 6.5 5 13.5 2 10.0 14 8.9 0.625-44 15 40.5 15 45.5 11 35.5 11 29.7 4 20.0 56 35.4 1.445-64 11 29.7 7 21.2 9 29.0 11 29.7 3 15.0 41 25.9 1.4>=65 8 21.6 5 15.2 7 22.6 3 8.1 9 45.0 32 20.3 2.2Total 37 100.0 33 100.0 31 100.0 37 100.0 20 100.0 158 100.0 1.1Race and Ethnicity‡/Origin of BirthAI/AK Native 4 10.8 0 0.0 1 3.2 0 0.0 2 10.0 7 4.4 4.9Foreign-born 0 0.0 0 0.0 0 0.0 0 0.0 0 0.0 0 0.0US-born 4 100.0 0 0.0 1 0.0 0 0.0 2 0.0 7 100.0Asian 11 29.7 8 24.2 8 25.8 10 27.0 4 20.0 41 25.9 12.2Foreign-born 11 100.0 8 100.0 8 100.0 9 90.0 4 100.0 40 97.6US-born 0 0.0 0 0.0 0 0.0 1 10.0 0 0.0 1 2.4
3 8.1 5 15.2 4 12.9 4 10.8 1 5.0 17 10.8 11.2Foreign-born 3 100.0 4 80.0 4 100.0 4 100.0 1 100.0 16 94.1US-born 0 0.0 1 20.0 0 0.0 0 0.0 0 0.0 1 5.9Hispanic 11 29.7 13 39.4 13 41.9 18 48.6 8 40.0 63 39.9 3.2Foreign-born 10 90.9 12 92.3 12 92.3 12 66.7 7 87.5 53 84.1US-born 1 9.1 1 7.7 1 7.7 6 33.3 1 12.5 10 15.9NH/PI 2 5.4 2 6.1 0 0.0 1 2.7 3 15.0 8 5.1 6.0Foreign-born 2 100.0 1 50.0 0 0.0 1 0.0 2 66.7 6 75.0US-born 0 0.0 1 50.0 0 0.0 0 0.0 1 50.0 2 25.0White 6 16.2 5 15.2 5 16.1 4 10.8 2 10.0 22 13.9 0.2Foreign-born 1 16.7 1 20.0 3 60.0 2 50.0 0 0.0 7 31.8US-born 5 83.3 4 80.0 2 40.0 2 50.0 2 100.0 15 68.2Total 37 100.0 33 100.0 31 100.0 37 100.0 20 100.0 158 100.0 1.1*Age groups were based on age at report.†US-born persons were born in the United States (US), a US-affiliated Island (UAI), or born abroad to at least one parent who was a US citizen. The UAIs include American Samoa, the Federated States of Micronesia, Guam, the Republic of the Marshall Islands, Midway Island, the Commonwealth of the Northern Mariana Islands, Puerto Rico, the Republic of Palau, the US Virgin Islands, and US minor and outlying Pacific Islands.‡AI/AK Native=American Indian/Alaska Native; NH/PI=Native Hawaiian/Other Pacific Islander; persons of Hispanic ethnicity can be of any race category. Note: Percentages may not sum to 100 due to rounding.Source: Cases – Utah Dept of Health, Bureau of Epidemiology, TB Control Pgm; Population Estimates – National Center for Health Statistics (NCHS) through a collaborative agreement with the U.S. Bureau of the Census.See Figures 6, 7, and 8.
Table 3. TB Cases, Percentages, and Rates per 100,000 Population by Age Group*, Race/Ethnicity and Origin†, Utah, 2012-2016
Variable2012 2013 2014 2015 2016 2012-2016
Black/African American
Tuberculosis in Utah, 2012-2016 24
Cases % Cases % Cases % Cases % Cases % Cases %
Foreign-born 27 73.0 26 78.8 27 87.1 28 75.7 14 70.0 122 77.2US-affiliated Islands 0 0.0 1 3.0 0 0.0 0 0.0 1 5.0 2 1.3USB with Foreign/UAI Connection 3 8.1 2 6.1 3 9.7 6 16.2 2 10.0 16 10.1USB without Foreign/UAI Connection 7 18.9 4 12.1 1 3.2 3 8.1 3 15.0 18 11.4Total 37 100.0 33 100.0 31 100.0 37 100.0 20 100.0 158 100.0
Asylee or Parolee 0 0.0 0 0.0 1 3.7 0 0.0 0 0.0 1 0.8Employment Visa 1 3.7 2 7.7 0 0.0 1 3.6 1 7.1 5 4.1Family/Fiance Visa 0 0.0 0 0.0 0 0.0 0 0.0 0 0.0 0 0.0Immigrant Visa 13 48.1 8 30.8 10 37.0 9 32.1 4 28.6 44 36.1Refugee 7 25.9 7 26.9 7 25.9 6 21.4 3 21.4 30 24.6Student Visa 1 3.7 3 11.5 3 11.1 1 3.6 1 7.1 9 7.4Tourist Visa 0 0.0 0 0.0 1 3.7 0 0.0 0 0.0 1 0.8Other Immigration Status† 5 18.5 6 23.1 5 18.5 10 35.7 5 35.7 31 25.4Refused/Unknown 0 0.0 0 0.0 0 0.0 1 3.6 0 0.0 1 0.8Total 27 100.0 26 100.0 27 100.0 28 100.0 14 100.0 122 100.0
Commonwealth of the Northern Mariana Islands, Puerto Rico, the Republic of Palau, the US Virgin Islands, and US minor and outlying Pacific islands. † Includes (but is not limited to) foreign-born persons who were not required to obtain a visa or persons with no official immigration status.Note: Percentages may not sum to 100 due to rounding.Source: Utah Dept of Health, Bureau of Epidemiology. See Figures 9 and 10.
Foreign, UAI*, or US-born Status
* Includes persons born in American Samoa, the Federated State of Micronesia, Guam, the Republic of the Marshall Islands, Midway Island, the
Table 4. TB Cases and Percentages by Foreign/US-affiliated Islands (UAIs)/US-born (USB) Status, Immigration Status at First Entry in Foreign-born Persons, Utah, 2012-2016
Variable2012 2013 2014 2015 2016 2012-2016
Immigration Status at First Entry in Foreign-born Persons
Tuberculosis in Utah, 2012-2016 25

Table 5. Foreign-born* TB Cases and Percentages by Country of Birth, Utah, 2012-2016
Country of Origin Cases %Mexico 37 30.3India 9 7.4Philippines 9 7.4Peru 8 6.6Somalia 6 4.9Indonesia 4 3.3Sudan 4 3.3Burma 3 2.5Nepal 3 2.5Tonga 3 2.5Vietnam 3 2.5Other† 33 27.0Total 122 100.0
Note: Percentages may not sum to 100 due to rounding.Source: Utah Dept of Health, Bureau of Epidemiology. See Figure 11.
*Foreign-born persons were born outside the United States or US-affiliated islands (UAI) and did not have at least one parent who was a US citizen.The UAIs include American Samoa, the Federated States of Micronesia, Guam, the Republic of the Marshall Islands, Midway Island, the Commonwealth of the Northern Mariana Islands, Puerto Rico, the Republic of Palau, the US Virgin Islands, and US minor and outlying Pacific Islands.†Other countries include: Afghanistan, Argentina, Bhutan, Bolivia, Bosnia and Herzegovina, Cambodia, China, Congo, Cuba, Dominican Republic, Egypt, El Salvador, Ethiopia, Guatemala, Honduras, Iraq, Kenya, Republic of Korea, Laos, Pakistan, Papua New Guinea, Taiwan, Tanzania, Thailand, Uganda, Uzbekistan, Vanuatu, Western Samoa, and Yugoslavia.
Tuberculosis in Utah, 2012-2016 26

Cases % Cases % Cases % Cases % Cases % Cases %
Negative 32 86.5 30 90.9 28 90.3 36 97.3 20 100.0 146 92.4Positive 2 5.4 1 3.0 2 6.5 1 2.7 0 0.0 6 3.8Indeterminate 0 0.0 0 0.0 0 0.0 0 0.0 0 0.0 0 0.0Refused 1 2.7 1 3.0 0 0.0 0 0.0 0 0.0 2 1.3Not Offered 2 5.4 1 3.0 1 3.2 0 0.0 0 0.0 4 2.5Total 37 100.0 33 100.0 31 100.0 37 100.0 20 100.0 158 100.0
Contact to Infectious TB Patient 0 0.0 3 9.7 2 5.4 5 13.5 1 5.0 11 7.0Contact to MDR Patient 0 0.0 0 0.0 0 0.0 1 2.7 0 0.0 1 0.6Contact, Missed 0 0.0 0 0.0 0 0.0 0 0.0 1 5.0 1 0.6Diabetes Mellitus 7 21.2 4 12.9 3 8.1 8 21.6 7 35.0 29 18.4End Stage Renal Disease 1 3.0 2 6.5 1 2.7 0 0.0 1 5.0 5 3.2Immunosuppression 3 9.1 3 9.7 2 5.4 1 2.7 0 0.0 9 5.7Incomplete LTBI Therapy 1 3.0 1 3.2 3 8.1 0 0.0 1 5.0 6 3.8Post-organ transplantation 0 0.0 1 3.2 0 0.0 0 0.0 0 0.0 1 0.6TNF-α Inhibitors 1 3.0 0 0.0 1 2.7 1 2.7 1 5.0 4 2.5Other 3 9.1 2 6.5 4 10.8 2 5.4 1 5.0 12 7.6None 22 66.7 21 67.7 17 45.9 19 51.4 10 50.0 89 56.3
Private Residence 36 97.3 32 97.0 29 96.8 33 89.2 19 95.0 149 94.3Homeless 1 2.7 1 3.0 0 0.0 2 5.4 0 0.0 4 2.5Corrections 0 0.0 0 0.0 0 0.0 0 0.0 1 5.0 1 0.6Long Term Care 0 0.0 0 0.0 1 3.2 0 0.0 0 0.0 1 0.6Other 0 0.0 0 0.0 1 0.0 2 5.4 0 0.0 3 1.9Total 37 100.0 33 100.0 31 100.0 37 100.0 20 100.0 158 100.0
Note: Percentages may not sum to 100 due to rounding.Source: Utah Dept of Health, Bureau of Epidemiology. See Figures 12 and 13.
*A single case may have more than one risk factor. MDR=Multidrug resistant; LTBI=Latent TB infection; TNF=Tumor necrosis factor.
HIV Test Results
Residence At Time of Diagnosis
Table 6. TB Cases and Percentages by HIV Test Results, Additional Risk Factors, and Residence at Time of Diagnosis, Utah, 2012-2016
Variable2012 2013 2014 2015 2016 2012-2016
Additional Risk Factors*
Tuberculosis in Utah, 2012-2016 27

Cases % Cases % Cases % Cases % Cases % Cases %
Homelessness 1 2.8 1 3.4 1 3.4 2 6.7 1 5.6 6 4.2Injecting Drugs 0 0.0 0 0.0 0 0.0 0 0.0 0 0.0 0 0.0Noninjecting Drugs 0 0.0 0 0.0 0 0.0 0 0.0 0 0.0 0 0.0Excess Alcohol 1 2.8 1 3.4 0 0.0 4 13.3 1 5.6 7 4.9Total Number of Cases ≥15 years 36 N/A 30 N/A 29 N/A 30 N/A 18 N/A 143 N/APrimary Reason for TB EvaluationTB Symptoms 27 73.0 17 51.5 21 67.7 25 67.6 13 65.0 103 65.2Abnormal Chest X-ray 4 10.8 9 27.3 3 9.7 1 2.7 4 20.0 21 13.3Incidental Lab Result 4 10.8 4 12.1 3 9.7 0 0.0 2 10.0 13 8.2Immigrant Medical Exam 2 5.4 2 6.1 1 3.2 3 8.1 1 5.0 9 5.7Contact Investigation 0 0.0 1 3.0 2 6.5 6 16.2 0 0.0 9 5.7Administrative Testing 0 0.0 0 0.0 1 3.2 2 5.4 0 0.0 3 1.9Health Care Worker 0 0.0 0 0.0 0 0.0 0 0.0 0 0.0 0 0.0Targeted Testing 0 0.0 0 0.0 0 0.0 0 0.0 0 0.0 0 0.0Total 37 100.0 33 100.0 31 100.0 37 100.0 20 100.0 158 100.0
Positive Culture 28 75.7 24 72.7 19 61.3 25 67.6 17 85.0 113 71.5Positive NAAT† 0 0.0 0 0.0 0 0.0 0 0.0 0 0.0 0 0.0Positive Smear/Tissue 0 0.0 1 3.0 1 3.2 0 0.0 0 0.0 2 1.3Clinical 8 21.6 7 21.2 10 32.3 12 32.4 2 10.0 39 24.7Provider Diagnosis 1 2.7 1 3.0 1 3.2 0 0.0 1 5.0 4 2.5Total 37 100.0 33 100.0 31 100.0 37 100.0 20 100.0 158 100.0
*Homelessness and substance abuse in the 12 months prior to TB diagnosis; categories are not mutually exclusive.†NAAT=Nucleic acid amplification test.Note: Percentages may not sum to 100 due to rounding.Source: Utah Dept of Health, Bureau of Epidemiology. See Figures 14, 15, and 16.
Case Verification
Table 7. TB Cases and Percentages by Adult Homelessness and Substance Abuse, Primary Reason for TB Evaluation, and Case Verification, Utah, 2012-2016
Variable2012 2013 2014 2015 2016 2012-2016
Adult Homelessness and Substance Abuse*
Tuberculosis in Utah, 2012-2016 28
Cases % Cases % Cases % Cases % Cases % Cases %
Pulmonary 21 59.5 15 45.5 16 51.6 23 62.2 14 70.0 89 56.3Pulmonary and Extrapulmonary 4 8.1 7 21.2 4 12.9 4 10.8 1 5.0 20 12.7Extrapulmonary 12 32.4 11 33.3 11 35.5 10 27.0 5 25.0 49 31.0Total 37 100.0 33 100.0 31 100.0 37 100.0 20 100.0 158 100.0
Pleural 2 11.8 4 20.0 2 11.8 2 12.5 3 42.9 13 17.1Lymph Cervical 2 11.8 7 35.0 2 11.8 2 12.5 1 14.3 14 18.4Lymph Axillary 0 0.0 0 0.0 1 5.9 0 0.0 0 0.0 1 1.3Lymph Intrathoracic 0 0.0 1 5.0 0 0.0 0 0.0 0 0.0 1 1.3Lymph Other 0 0.0 1 5.0 0 0.0 2 12.5 1 14.3 4 5.3Bone and/or Joint 4 23.5 1 5.0 2 11.8 3 18.8 0 0.0 10 13.2Genitourinary 1 5.9 1 5.0 2 11.8 1 6.3 0 0.0 5 6.6Meningeal 0 0.0 0 0.0 3 17.6 1 6.3 0 0.0 4 5.3Peritoneal 0 0.0 2 10.0 0 0.0 0 0.0 0 0.0 2 2.6Laryngeal 0 0.0 0 0.0 0 0.0 0 0.0 0 0.0 0 0.0Eye and Ear Appendages 3 17.6 1 5.0 4 23.5 3 18.8 1 14.3 12 15.8Other† 4 29.4 2 10.0 1 5.9 2 12.5 1 14.3 10 13.2Total Extrapulmonary Sites 16 100.0 20 100.0 17 100.0 16 100.0 7 100.0 76 100.0
*A case may have more than one extrapulmonary site of disease.†Other sites of diseases included: brain, breast, colon, ear and mastoid cells, liver, pericardium, spleen, subcutaneous tissue, tongue, and other sites of disease.Note: Cases were classified by count date. Percentages may not sum to 100 due to rounding.Source: Utah Dept of Health, Bureau of Epidemiology. See Figure 17.
Site of Disease
Extrapulmonary Sites of Disease*
Table 8. TB Cases and Percentages by Site of Disease and Extrapulmonary Sites of Disease, Utah, 2012-2016
Variable2012 2013 2014 2015 2016 2012-2016
Tuberculosis in Utah, 2012-2016 29
Cases % No. % No. % No. %2012 28 28 100.0 2 7.1 2 7.1 1 3.62013 24 24 100.0 3 12.5 0 0.0 0 0.02014 19 19 100.0 2 10.5 1 5.3 1 5.32015 25 25 100.0 5 20.0 4 16.0 1 4.02016 17 17 100.0 3 17.6 2 11.8 1 5.9Total 113 113 100.0 15 13.3 9 8.0 4 3.5
*A single case can be reported in more than one category. Note: Percentages may not sum to 100 due to rounding.Source: Utah Dept of Health, Bureau of Epidemiology.
Table 9. Culture-positive TB Cases and Percentages by Drug Susceptibility Testing (DST) and Results, Utah, 2012-2016
Year
Culture Positive Cases
Cases with DST Results
Resistance*
>= 1 Drug At Least INHAt Least
INH & RIF
Tuberculosis in Utah, 2012-2016 30

Cases % Cases % Cases % Cases % Cases % Cases %
Reported Cases 34 37 33 31 37 172Cases Starting Treatment 34 36 32 29 37 168
DOT 27 79.4 35 97.2 30 93.8 29 100.0 37 100.0 158 94.0DOT & Self-administered 7 20.6 1 2.8 1 3.1 0 0.0 0 0.0 9 5.4Self-administered 0 0.0 0 0.0 1 3.1 0 0.0 0 0.0 1 0.6Total Number of Cases ≥15 years 34 100.0 36 100.0 32 100.0 29 100.0 37 100.0 168 100.0Completion of TreatmentCompleted 32 94.1 33 91.7 31 96.9 26 89.7 35 94.6 157 93.5Died 2 5.9 3 8.3 1 3.1 2 6.9 1 2.7 9 5.4Uncooperative or Refused 0 0.0 0 0.0 0 0.0 0 0.0 1 2.7 1 0.6Adverse Event 0 0.0 0 0.0 0 0.0 0 0.0 0 0.0 0 0.0Lost 0 0.0 0 0.0 0 0.0 0 0.0 0 0.0 0 0.0Refused 0 0.0 0 0.0 0 0.0 0 0.0 0 0.0 0 0.0Other 0 0.0 0 0.0 0 0.0 0 0.0 0 0.0 0 0.0
Still on Treatment 0 0.0 0 0.0 0 0.0 1 3.4 0 0.0 1 0.6Total 34 100.0 36 100.0 32 100.0 29 100.0 37 100.0 168 100.0
Note: Percentages may not sum to 100 due to rounding.Source: Utah Dept of Health, Bureau of Epidemiology.
Directly Observed Therapy (DOT)
Table 10. TB Cases and Percentages by Directly Observed Therapy (DOT) and Completion of Treatment Status, Utah, 2011-2015
Variable2011 2012 2013 2014 2015 2011-2015
Tuberculosis in Utah, 2012-2016 31
Case/Suspect Category* 2012 2013 2014 2015 2016 2012-2016TB Cases, UtahCounted 37 33 31 37 20 158Noncountable: Recurrent TB 1 0 0 0 0 1Noncountable: TB Diagnosis Reversed 1 2 0 1 2 6Subtotal 39 35 31 38 22 165TB Suspects, Evaluated in UtahTB Suspects: LTBI 51 70 50 48 41 260TB Suspect: MOTT 121 123 145 126 123 638TB Suspects: Not TB 91 114 110 122 125 562TB Suspects: Out of State TB Cases 1 1 3 2 0 7TB Suspects: Out of State TB Suspects 22 20 16 13 11 82Subtotal 286 328 324 311 300 1,549Total Cases and Suspects 325 363 355 349 322 1,714MOTT: Rule OutsTotal MOTT Rule Out 29 50 26 41 50 196TB Cases, InterjurisdictionalBurden: Transfer In, Interstate 3 4 4 4 2 17Burden: Transfer In, Foreign 1 1 1 1 0 4Total Burden Cases 4 5 5 5 2 21Grand Total 358 418 386 395 374 1,931
Note: TB cases were classified by count date.Source: Utah Department of Health, Bureau of Epidemiology.See Figure 17.
Table 11. TB Cases, Suspects, and Rule Outs by Final Classification, Utah, 2012-2016
*LTBI=Latent TB infection; MOTT=Mycobacterium other than tuberculosis.
Tuberculosis in Utah, 2012-2016 32
Tuberculosis in Utah, 2012-2016 33
References
1. Schmit KM, Wansaula Z, Pratt R, Price SF, Langer AJ. Tuberculosis — United States, 2016. MMWR 2017;66:289–294. DOI: http://dx.doi.org/10.15585/mmwr.mm6611a2
2. Utah Administrative Code. R386-702 Communicable Disease Rule. https://rules.utah.gov/publicat/code/r386/r386-702.htm. 3. Utah Administrative Code. R388-804 Special Measures for the Control of Tuberculosis. https://rules.utah.gov/publicat/code/r388/r388-804.htm. 4. CDC. Report of Verified Case of Tuberculosis (RVCT) form. https://www.cdc.gov/tb/programs/rvct/RVCT-form.pdf. 5. US Department of Health and Human Services, Office of Disease Prevention and Health Promotion. Healthy People 2020 Immunization and Infectious Disease Objectives. https://www.healthypeople.gov/2020/topics-objectives/topic/immunization-and-infectious-diseases/objectives. 6. CDC. Reported Tuberculosis in the United States, 2015. http://www.cdc.gov/tb/statistics/reports/2015 7. CDC. National TB Program Objectives and Performance Targets for 2020. https://www.cdc.gov/tb/programs/evaluation/indicators/default.htm.