Embed Size (px)
Citation preview

Tu F L D 1 CUS Army CorpsREPORT 88-21 -OEof Engineers
FEB 2 1989Cold Regions Research &
AD-A05 00 C~Q D Engineering Laboratory
Measurement of frost heave forces onH-piles and pipe piles
THERMAL SIPHONRADIATORS
GRAVEL ICE COLLARS GROUND
0000"aft ft% 00 -oJAN 25
H-PILE ~~PIPE PILE16 I**:'
ANTI HEAVE ANCHORPLATES RINGS
DISTRIBUTON STRTEMENT AAprvdfrpublic releQMa....,
CRREL Report 88-21December 1988
Measurement of frost heave forces onH-piles and pipe piles
Jerome B. Johnson and James S. Buska
Prepared forSTATE OF ALASKA DEPARTMENT OF TRANSPORTATIONAND PUBLIC FACILITIES
Approved for public release; distribution is unlimited.
UNCLASSIFIEDSECURITY CLASSIFICATION OF THIS PAGE
Forrn ApprovedREPORT DOCUMENTATION PAGE OMB NO. 0704-0188
SExp. Date: Jun 30, 1986la. REPORT SECURITY CLASSIFICATION 1B. RESTRICTIVE MARKINGS
Unclassified2a. SECURITY CLASSIFICATION AUTHORITY 3. DISTRIBUTION/AVALABLITY OF REPORT
2b. DECLASSIFICATION/DOWNGRADING SCHEDULE Approved for public release; distribution is unlimited.
4. PERFORMING ORGANIZATION REPORT NUMBER(S) 5. MONITORING ORGANIZATION REPORT NUMBER(S)
CRREL Report 88-2160. NAME OF PERFORMING ORGANIZATION 16b. OFFICE SYMBOL 7a. NAME OF MONITORING ORGANIZATION
U.S. Army Cold Regions Research (if applcable) State of Alaska Department of Transportationand Engineering Laboratory CECRL and Public Facilities
6c. ADDRESS (City. State, and ZIP Code) 7b. ADDRESS (City, State, and ZIP Code)72 Lyme Road Divison of Planning and ProgrammingHanover, New Hampshire 03755-1290 Research Section
Fairbanks, Alaska 997018. NAME OF FUNDING/SPONSORING 8b. OFFICE SYMBOL 9. PROCUREMENT INSTRUMENT IDENTIFICATION NUMBER
ORGANIZATION (if applicable) HPR- 4-HR 12
8c. ADDRESS (City, State, and ziP Code) 10. SOURCE OF FUNDING NUMBERSPROGRAM PROJECT TASK WORK UNITELEMENT NO. NO. NO. ACCESSION NO.
1 I. TITLE (Include Securit Classificatlon)
Measurement of Frost Heave Forces on H-Piles and Pipe Piles
12. PERSONAL AUTHOR(S)Johnson, Jerome B. and Buska, James S.
13o. TYPE OF REPORT 13b. TIME COVERED 14. DATE OF REPORT (Year, Month, Day) 15. PAGE COUNTFROM _ TO _ December 1988 58
16. SUPPLEMENTARY NOTATION
Additional funding by Federal Highway Administration17. COSATI CODES 18. SUBJECT TERMS (Connnue on revere if necessary and Identif by block numbe'r)
FIELD GROUP SUB-GROUP
It.1ABSTRACT (Continue on revetse f neesry aid Identfiy by block number)
The magnitude and variation of forces and shear stresses, caused by frost heaving in Fairbanks silt and the adfreeze
effects of a surface ice layer and a gravel layer, were determined as a function of depth by using electric strain gaugesalong the upper 2.75 m of a pipe pile, 30.5-cm I.D. x 0.95-cm wall, and an H-pile, 25.4-cm web x 85 kg/lineal m. Thepeak frost heaving forces on the H-pile for three consecutive winter seasons (1982-1985) were 752, 790 and 802 kN,respectively. Peak frost heaving forces on the pipe pile of 1118 and 1115 kN were determined only for the second andthird winter seasons. Maximum average shear stresses acting on the U-pile were 256, 348 and 308 kPa during thethree winter seasons. Maximum average shear stresses acting on the pipe pile were 627 and 972 kPa for the secondand third winter seasons. Ice collars were placed around the tops of both piles during the first and third winter seasonsto measure the adfreeze effects of a surface ice layer. The ice layer may have contributed 15 to 20% of the peak forcesmeasured on the piles. A 0.6-m-thick gravel layer replaced the soil around the tops of both piles for the second andthird winter seasons to measure the adfreeze effects of a gravel backfill. The gravel layer on the H-pile may havecontributed about 35% of the peak forces measured. Maximum heaving forces and shear stresses occurred duringperiods of maximum cold and soil surface heave magnitude. These were not related to the depth of frost penetrationfor most of the winter since frost was present at all depths extending to the permafrost table. Soil surface dis-
20. DISTIBUTION/AVA!LABILITY OF ABSTRACT 21. ABSTRACT SECURITY CLASSIFICATIONM UNCLASSIFIED/UNUMITED C3 SAME AS RPT. 0 DTIC USERS Unclassified
22o. NAME OF RESPONSIBLE INDIVIDUAL 22b. TELEPHONE (Include Area Code) 22c. OFFIC SYMBOLJames S. Buska 603-646-4100 1 CECRI4EC
DD FORM 1473, 84 MAR 83 APR edition may be used untl exhausted. SECURITY CLASSIFICATION O0 THIS PAGEAll other editions are obsolete. -- N
UNCLASSIIID
UNCLASSIFIED
19. Abstract (cont'd).
placements of 2 to 7 cm were measured at the experiment site during the study. The important mechanisms thatdetermine the magnitude of uplift heave forces are 1) soil heaving as the driving force, and 2) soil temperature, whichcontrols the unfrozen water content, mechanical properties of the soil and the area of influence of heaving pressure.
UNCLASSIFIED
PREFACE
This report was prepared by Dr. Jerome B. Johnson, Geophysicist, of the Applied Re-search Branch, and James S. Buska, Research Civil Engineer, of the Civil and GeotechnicalEngineering Research Branch, Experimental Engineering Division, U.S. Army Cold RegionsResearch and Engineering Laboratory. Funding for this research was provided by the AlaskaDepartment of Transportation and Public Facilities and by the Federal Highway Adminis-tration.
David Esch, Alaska Department of Transportation and Public Facilities, G.H. Johnstonof the National Research Council of Canada, and Allen Tice of CRREL technicali reviewedthe manuscript.
This project could not have been successfully completed without the help of many individ-uals. The authors acknowledge the efforts of C. Rohwer, C. Olmstead, S. Perkins, B. Young,R. Briggs, D. Solie, D. Dinwoodie, M. Sturm, W. Zito, L. Kozycki and D. Haynes. Theauthors also thank Dave Esch for his contributions to the completion of the project.
The contents of this report are not to be used for advertising or promotional purposes. Ci-tation of brand names does not constitute an official endorsement or approval of the use ofsuch commercial products.
Aczcesionf ForNTIS CRA&MDTIC TAB
Uliannrinwnced
By
iii

CONTENTSPage
A bstract ................................................................ iP reface ................................................................. iiiC onversion factors ........................................................ viIntroduction ............................................................. ISummary of previous research .............................................. IM ethods and m aterials .................................................... 4
Soil conditions ......................................................... 4Site preparation and plan ................................................ 4Instrumentation and installation of piles ................................... 6Temperature measurements .............................................. 10Soil surface heave measurements .......................................... 10Force and shear stress calculations ......................................... 11Data acquisition periods ................................................. 13
Experim ental results ...................................................... 13Air, ground, pile and ice collar temperatures ................................ 13Pile stability and soil surface heave ........................................ 18Forces and shear stresses ................................................. 19Spatial and temporal location of peak forces ................................ 26
C onclusions ............................................................. 32Recom m endations ........................................................ 33Literature cited ........................................................... 33Appendix A: Instrumentation and data reduction .............................. 35Appendix B: Calibration test results for the H- and pipe piles .................... 43
ILLUSTRATIONS
Figure1. Distribution of relative frost-heaving forces, in kilograms-force per lineal centi-
meter of column perimeter, over the lateral surface of the pile ........... 22. Shear stress as a function of temperature for the H-pile from October 1983
through M arch 1984 .............................................. 43. Experiment site location map ........................................... 54. Development of frost penetration at the experiment site .................... 55. Plan view of the experimental site ....................................... 66. Strain and thermocouple installation layout for the pipe pile and the H-pile .... 77. Closeup of axial and transverse strain gauge and thermocouple installations on
the H -pile ....................................................... 88. Instrumented H-pile after installairn of protective angles, guide tube and re-
tention bars ..................................................... 89. End view of 0.91-m-long pipe pile section instrumented with strain gauge and
therm ocouples ................................................... 810. Instrumented pipe pile after welding of the three instrumented sections to the
uninstrumented section and installation of the polyurethane foam ........ 911. Temperature profiles in the vicinity of the pipe pile and in undisturbed soil .... 1012. Soil temperature profile near the H-pile .................................. 10
iv
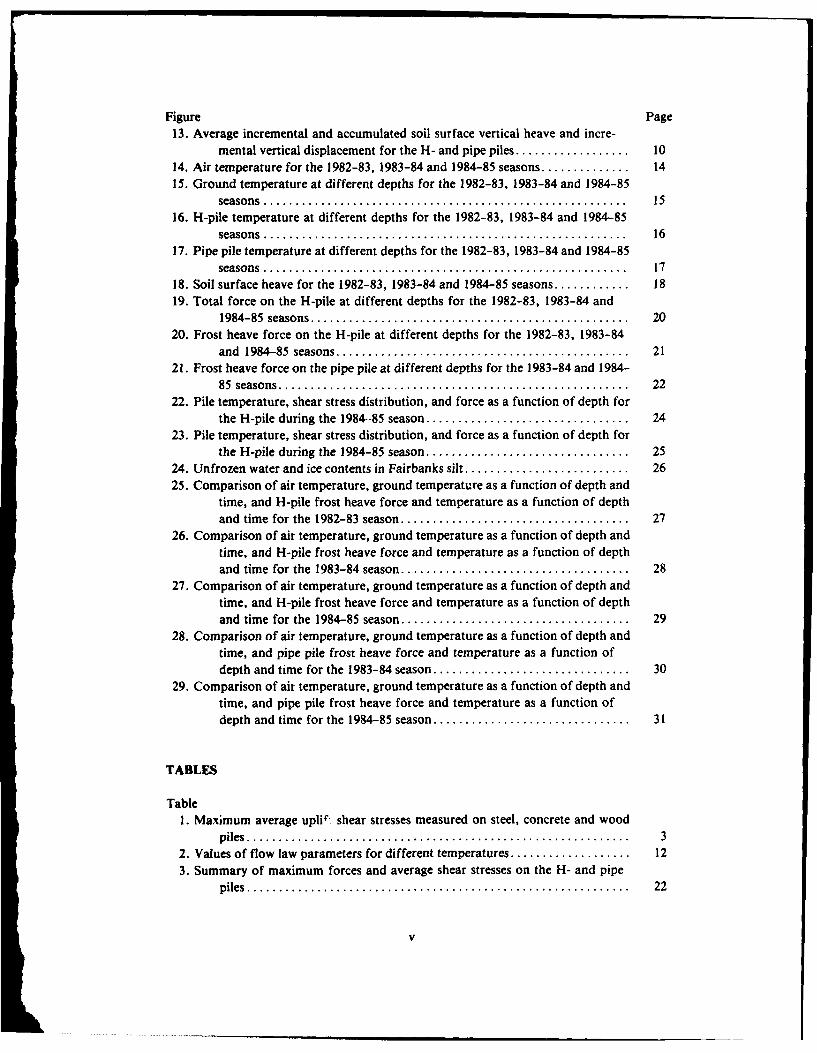
Figure Page13. Average incremental and accumulated soil surface vertical heave and incre-
mental vertical displacement for the H- and pipe piles .................. 1014. Air temperature for the 1982-83, 1983-84 and 1984-85 seasons .............. 1415. Ground temperature at different depths for the 1982-83, 1983-84 and 1984-85
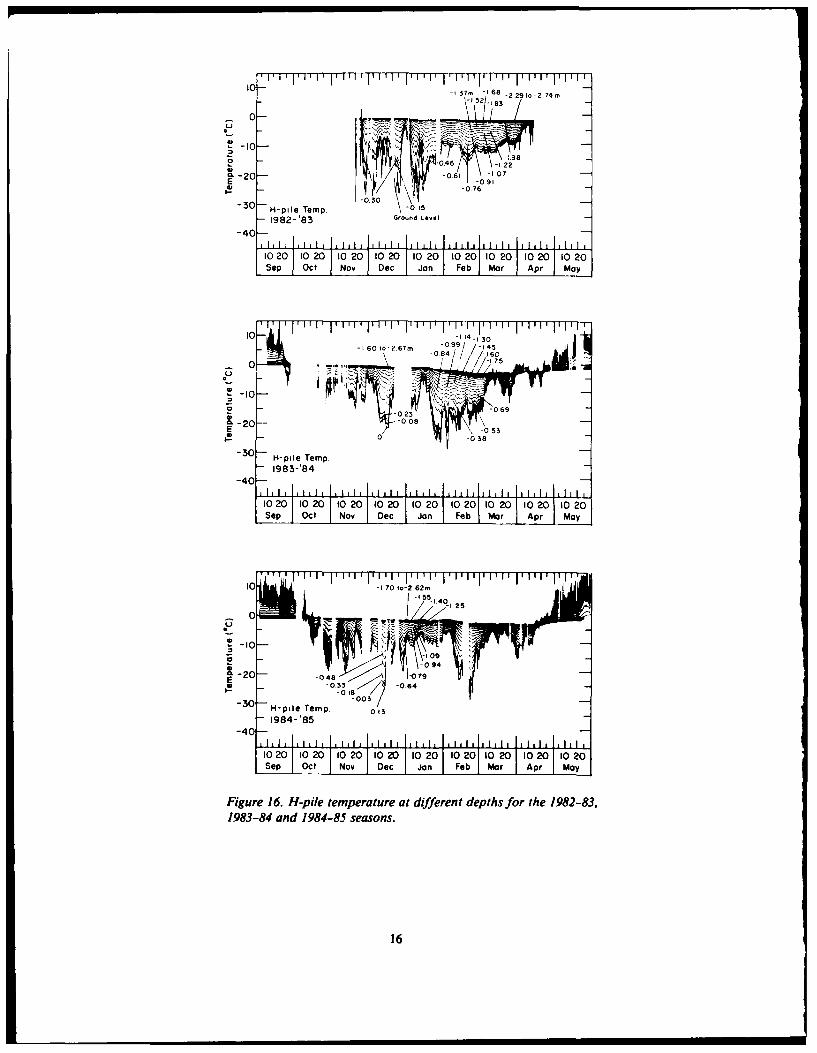
seasons ......................................................... 1516. H-pile temperature at different depths for the 1982-83, 1983-84 and 1984-85
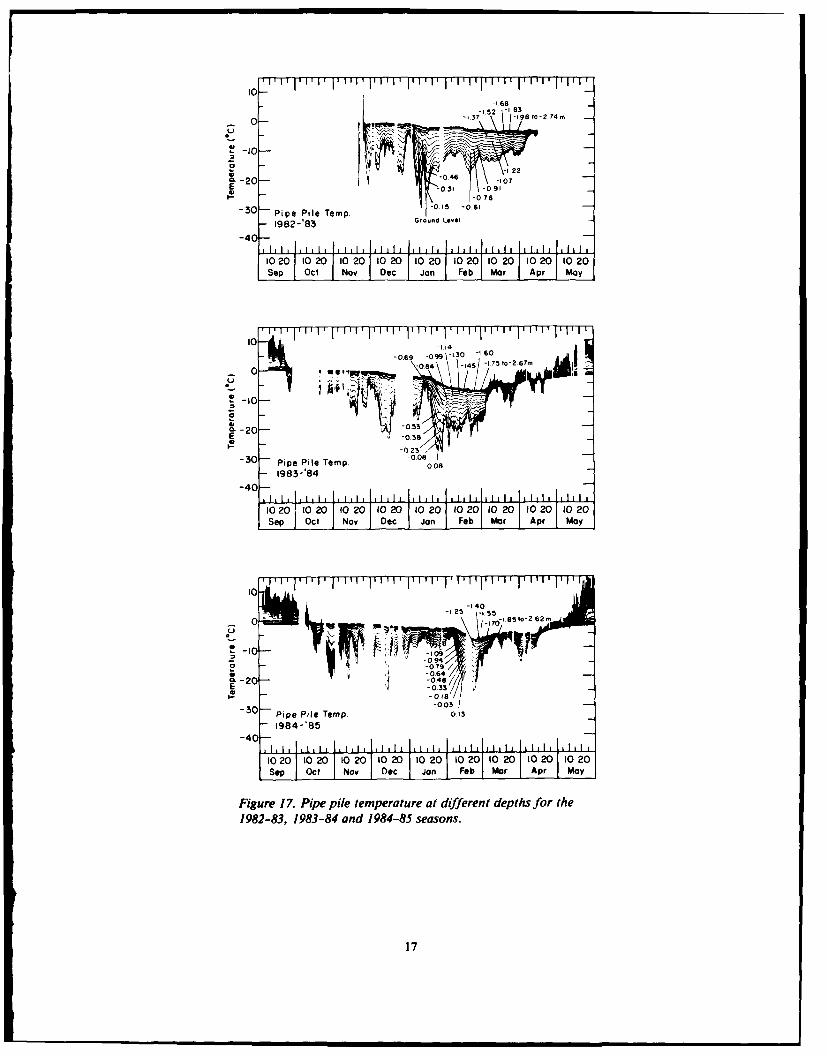
seasons ......................................................... 1617. Pipe pile temperature at different depths for the 1982-83, 1983-84 and 1984-85
seasons ......................................................... 1718. Soil surface heave for the 1982-83, 1983-84 and 1984-85 seasons ............ 1819. Total force on the H-pile at different depths for the 1982-83, 1983-84 and
1984-85 seasons .................................................. 2020. Frost heave force on the H-pile at different depths for the 1982-83, 1983-84
and 1984-85 seasons .............................................. 2121. Frost heave force on the pipe pile at different depths for the 1983-84 and 1984-
85 seasons ....................................................... 2222. Pile temperature, shear stress distribution, and force as a function of depth for
the H-pile during the 1984--85 season ................................ 2423. Pile temperature, shear stress distribution, and force as a function of depth for
the H-pile during the 1984-85 season ................................ 2524. Unfrozen water and ice contents in Fairbanks silt .......................... 2625. Comparison of air temperature, ground temperature as a function of depth and
time, and H-pile frost heave force and temperature as a function of depthand time for the 1982-83 season .................................... 27
26. Comparison of air temperature, ground temperature as a function of depth andtime, and H-pile frost heave force and temperature as a function of depthand time for the 1983-84 season .................................... 28
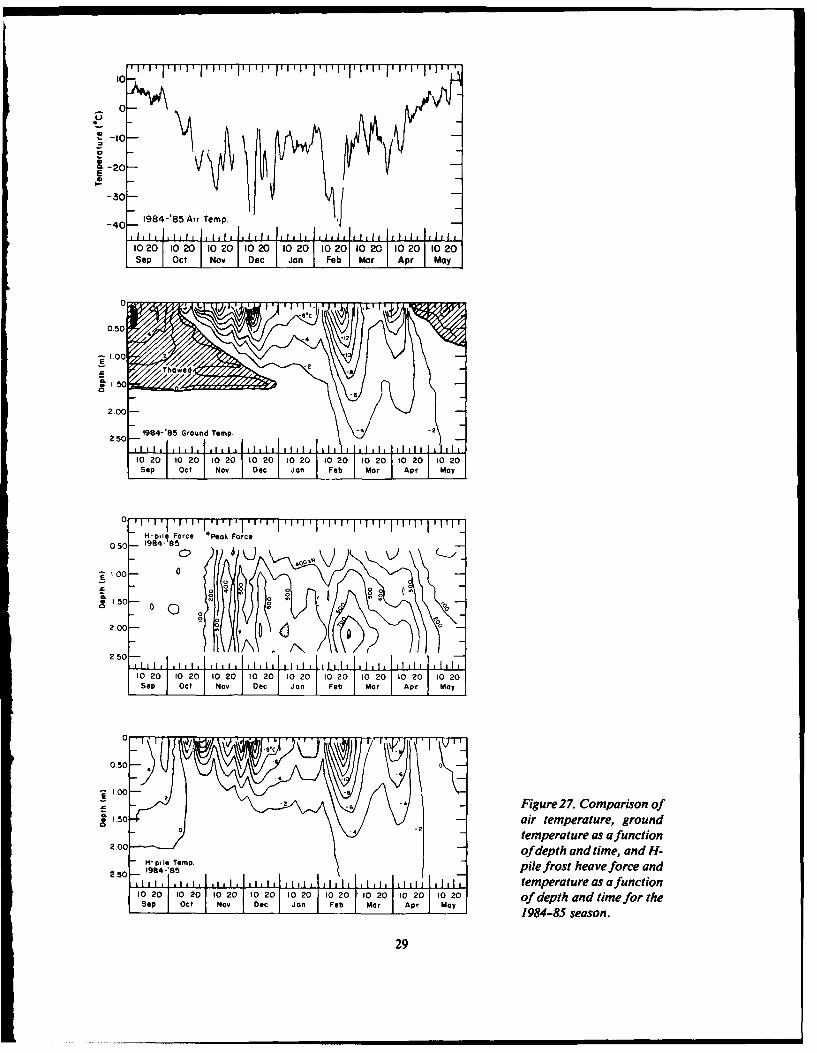
27. Comparison of air temperature, ground temperature as a function of depth andtime, and H-pile frost heave force and temperature as a function of depthand time for the 1984-85 season ................ ................... 29
28. Comparison of air temperature, ground temperature as a function of depth andtime, and pipe pile frost heave force and temperature as a function ofdepth and time for the 1983-84 season ............................... 30
29. Comparison of air temperature, ground temperature as a function of depth andtime, and pipe pile frost heave force and temperature as a function ofdepth and time for the 1984-85 season ............................... 31
TABLES
Table1. Maximum average uplif shear stresses measured on steel, concrete and wood
p iles ............................................................ 32. Values of flow law parameters for different temperatures ................... 123. Summary of maximum forces and average shear stresses on the H- and pipe
p iles ............................................................ 22
v
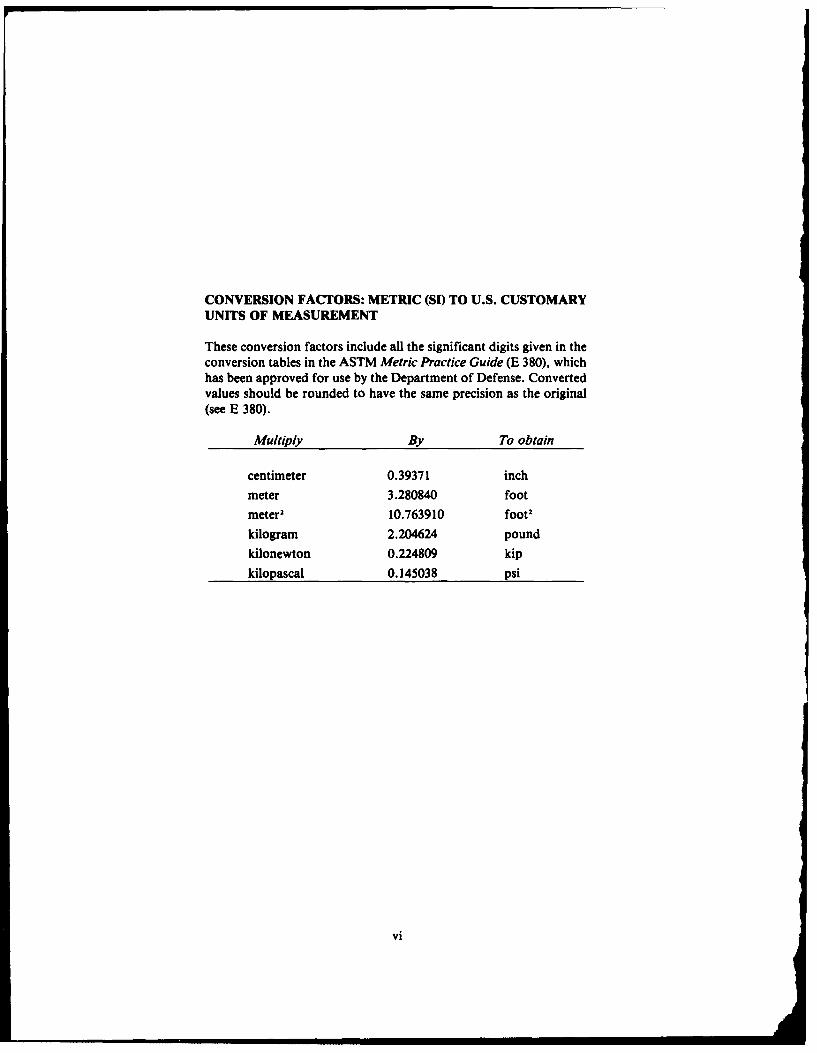
CONVERSION FACTORS: METRIC (SI) TO U.S. CUSTOMARYUNITS OF MEASUREMENT
These conversion factors include all the significant digits given in theconversion tables in the ASTM Metric Practice Guide (E 380), whichhas been approved for use by the Department of Defense. Convertedvalues should be rounded to have the same precision as the original(see E 380).
Multiply By To obtain
centimeter 0.39371 inch
meter 3.280840 foot
meter2 10.763910 foot
kilogram 2.204624 pound
kilonewton 0.224809 kip
kilopascal 0.145038 psi
vi

Measurement of Frost Heave Forces on H-piles and Pipe Piles
JEROME B. JOHNSON AND JAMES S. BUSKA
INTRODUCTION Direct measurements of frost heave forces weremade in the U.S.S.R. from 1958-1963. Three
Foundations embedded in frost-susceptible soils types of instrumentation were used to measurecan be subjected to large uplift forces resulting frost heave forces: 1) reaction beam and load cell,from frost heaving of the soils. These forces can 2) force balance apparatus, and 3) electric strain
cause an upward vertical displacement of founda- gauges. The reaction beam device consisted of ations that are not embedded below the frost depth beam held in place with rods anchored into the soilor do not have sufficient resistance to counteract at depth. The test pile was restrained from movingheaving forces. In Alaska, H- and pipe piles are by the reaction beam, and the uplift forces actingoften used to support buildings, bridges and dock on the pipe were measured with a load cell placedstructures. It is important that design engineers between the beam and pile. In the force balanceknow the magnitude of frost heaving forces that scheme, an additional load compensated for anycan act on foundation piles and how these forces vertical displacement of the test pile. The load thatare distributed along the piles. This information is just completely stopped the heaving of the pileused to determine the depth to which a pile needs during the freezing of the soil was taken as theto be embedded, how it must be loaded to resist maximum total heave force.heaving forces, and the tensile strength require- Additional frost heave measurements were madements of the pile. using electric strain gauges mounted on the inner
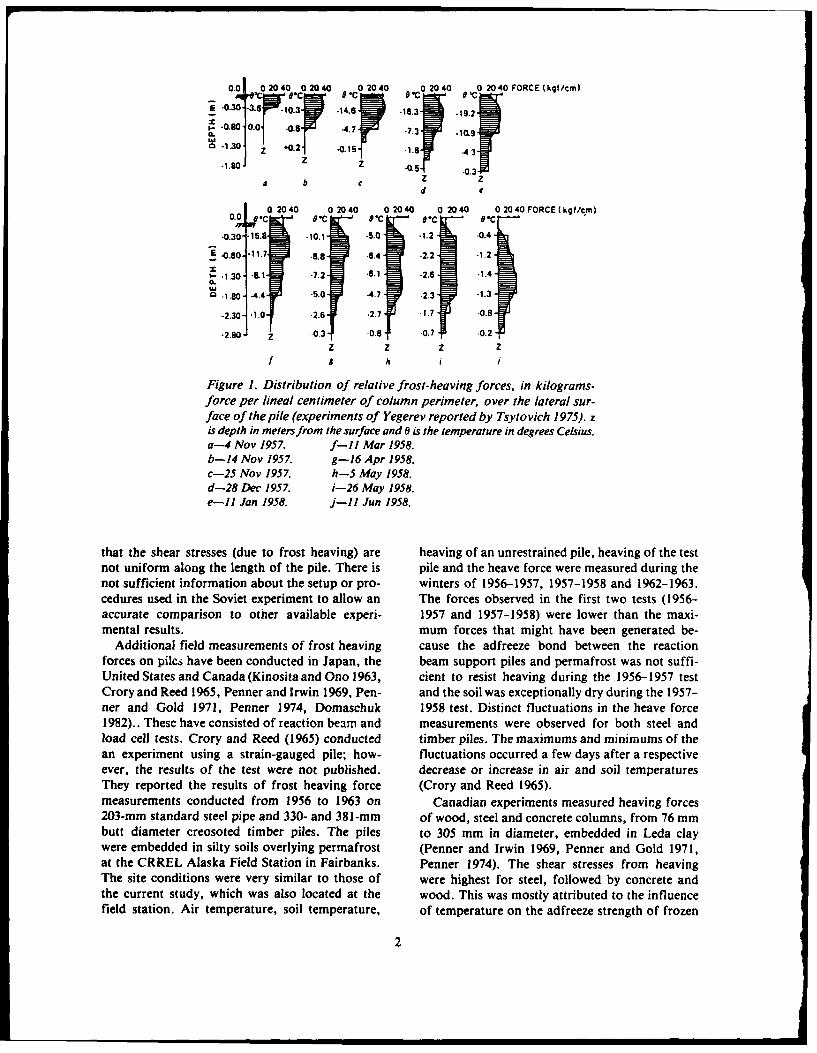
This report presents the results of a three-year surface of a tubular pile. The results of the experi-study designed to measure and record the magni- ment, reported by Tsytovich (1975), were present-tude and distribution of axial strains, as a function ed in terms of kilograms-force per lineal centi-of depth, time and temperature, for an H-pile and meter of column perimeter. This is equivalent toa pipe pile pene¢iating surficial layers of ice and the shear stress (kgf/cm) times a unit depth of 1.0gravel and embedded in Fairbanks silt with an ac- cm. Since the pile diameter was not given, the ac-tive layer overlying permafrost. We used the meas- tual shear stress values cannot be determined. Theured strains to calculate the uplift forces acting on results can, however, be used to examine how thethe piles and the shear stresses at the soil/pile in- shear stress varies along the depth of the pile. Fig-terface. Soil temperatures and surface heave were ure I shows the force per lineal centimeter of col-also measured. These results provided complete umn perimeter (shear stress times a unit depth offorce and stress information on the piles as they 1.0 cm) acting on the pile with respect to depth.were subjected to annual cycles of frost heaving Shear stresses acting on the pile were zero at theand thaw consolidation. In general, previous soil surface, then reached a maximum at somestudies have provided data on only the total frost depth between the soil surface and the 0°C iso-heaving load acting on pipe piles (Crory and Reed therm, and finally decreased to zero near the 0°C1965, Penner and Irwin 1969, Penner 1974). isotherm. The maximum of the shear stresses
shifted downward toward the freezing boundaryas the frost depth increased. Shear stresses acting
SUMMARY OF PREVIOUS RESEARCH along the soil/pile interface increased along thepile length with time and decreasing soil tempera-
Studies of the uplift forces induced by frost ture (Tsytovich 1975). The results for the strain-heaving of foundations date back to early Soviet gauged pipe are of interest because of the similar-work in the 1930s reported by Tsytovich (1975). ity to the test setup in this study. They indicate
0.0 02040 02040 C02040 0204 0 2040 FORCE (kgficm)D.C BC* ST a-
E -0301-3.6 -10.3 14.6 -16,3 -192
4zII. 0.80 0.0 0 -4.7 -7.3 10.9
1.80 Z -0.5 -0,3d e
0 2040 81C0 2040 0 2040 0 2040 0 0 20 40 FOR
CE(kqf/cm)
-0.30- .15.8 -10.1 -5.0 -1.2 -0.4
.-0.80. -11.7 -8.8 -6.4 -2.2 .1.2
-1.30 -A1 -7.2 -6.1 -2.6 .1.4
4 -1.80 -4.4 -5.0 .4.7 2.3 -1.3
-2.30- 1.0 -2.6 -2.7 -1.7 -0.8
-2.80 - -0.3 -0.8 -0.7 -0.2
z z z z
f 9 h i
Figure 1. Distribution of relative frost-heaving forces, in kilograms-force per lineal centimeter of column perimeter, over the lateral sur-face of the pile (experiments of Yegerev reported by Tsytovich 1975). zis depth in meters from the surface and 0 is the temperature in degrees Celsius.a-4 Nov 1957. f-l1 Mar 1958.b-14 Nov 1957. g-16 Apr 1958.c-25 Nov 1957. h-5 May 1958.d-28 Dec 1957. i-26 May 1958.e-11 Jan 1958. j-11 Jun 1958.
that the shear stresses (due to frost heaving) are heaving of an unrestrained pile, heaving of the testnot uniform along the length of the pile. There is pile and the heave force were measured during thenot sufficient information about the setup or pro- winters of 1956-1957, 1957-1958 and 1962-1963.cedures used in the Soviet experiment to allow an The forces observed in the first two tests (1956-accurate comparison to other available experi- 1957 and 1957-1958) were lower than the maxi-mental results. mum forces that might have been generated be-
Additional field measurements of frost heaving cause the adfreeze bond between the reactionforces on piles have been conducted in Japan, the beam support piles and permafrost was not suffi-United States and Canada (Kinosita and Ono 1963, cient to resist heaving during the 1956-1957 testCrory and Reed 1965, Penner and Irwin 1969, Pen- and the soil was exceptionally dry during the 1957-ner and Gold 1971, Penner 1974, Domaschuk 1958 test. Distinct fluctuations in the heave force1982).. These have consisted of reaction beam and measurements were observed for both steel andload cell tests. Crory and Reed (1965) conducted timber piles. The maximums and minimums of thean experiment using a strain-gauged pile; how- fluctuations occurred a few days after a respectiveever, the results of the test were not published, decrease or increase in air and soil temperaturesThey reported the results of frost heaving force (Crory and Reed 1965).measurements conducted from 1956 to 1963 on Canadian experiments measured heaving forces203-mm standard steel pipe and 330- and 381-mm of wood, steel and concrete columns, from 76 mmbutt diameter creosoted timber piles. The piles to 305 mm in diameter, embedded in Leda claywere embedded in silty soils overlying permafrost (Penner and Irwin 1969, Penner and Gold 1971,at the CRREL Alaska Field Station in Fairbanks. Penner 1974). The shear stresses from heavingThe site conditions were very similar to those of were highest for steel, followed by concrete andthe current study, which was also located at the wood. This was mostly attributed to the influencefield station. Air temperature, soil temperature, of temperature on the adfreeze strength of frozen
2

Table 1. Maximum average uplift shear stresses measured on steel, concrete and wood piles.
PileSoil Year of diameter Shear stress (kPa).ype test (mM) Steel Vinyl Concrete Wood Investigators
Silty clay 1961-62 72 207 Kinosita and Ono (1983)76 162 114 (uncoated)
1061-62 94 51 (resin coated)
Silt 1956-57 203 152 Crory and Reed (1965)1957-58 203 1591958-59 356 551962-63 356 831962-63 203 283
? 1958-63 ? 97-165 Soviet data reported byTsytovich (1975)
Clay 1966-67 89 83 Penner and Irwin (1969)1967-68 89 83
Clay 1970 89 114 134 90 Penner and Gold 1971)
Clay 1970-71 76 114 116 Penner (1974)1970-71 156 150 1771970-71 305 119 1391971-72 76 255 192 1311971-72 152 203 249 2261971-72 305 172 141 243
Silt 76x76 345 Domaschuk (1982)angle
Clay with 1972-73 169 379 (loads exceeded Penner and Goodrich (1983)frozen gravel 323 179 cell capacity)surface layer, 458 124Thompson, 1973-74 169 117Manitoba 323 76
458 691974-75 169 69
323 55458 48
Clay, Ottawa, 1971-72 169 93Ontario 323 70
soil acting on the columns. The steel columns were force associated with changes in the air tempera-normally colder than the concrete or wood col- ture that had been observed by Crory and Reedumns. Domaschuk (1982) conducted controlled (1965). These were attributed to changes in groundtests on embedded vertical steel members and steel temperature and ground temperature gradientsmembers inclined to the soil surface. The test re- caused by air temperature fluctuations. Table Isuits indicated a decrease in vertical stress as the summarizes the measurements of maximum aver-angle of inclination of the member with respect to aged uplift shear stress acting along the soil/pilethe frost plane increased. Kinosita and Ono (1963) interface. The uplift shear stress is induced byconducted frost heave force measurement tests on frost heaving and computed on the basis of the up-steel, concrete, resin-coated concrete and vinyl lift force divided by the surface area of the pilecolumns. These tests indicated that adfreeze from the soil surface to the depth of the 0°C iso-strength was the greatest for steel and was lower therm.for vinyl and wood. The Canadian and Japanese An inherent problem with the reaction beamexperiments both showed the fluctuations in heave and force-balance methods is that they may under-
3

estimate the uplift shear stresses by not taking into soil surface heave, 3) changes in soil temperature,account the resistive shear stresses on piles. The 4) soil temperature gradients and 5) the availabili-heaving forces . casured in these tests are used to ty of moisture in the soil. Maximum shear stressesestimate an average uplift shear stress which acts generally occurred during the early freezing periodon the pile from the soil surface to the depth of the when heaving rates were high. Maximum uplift0 C isotherm. No allowance is made for resistive forces often occurred near the time of maximumshear stresses developed on the pile in the soil be- frost penetration.low the 0*C isotherm. Therefore, the reactionbeam and force-balance methods actually measurea net uplift force, which is the total uplift load less METHODS AND MATERIALSthe total restraining load acting on the pile.
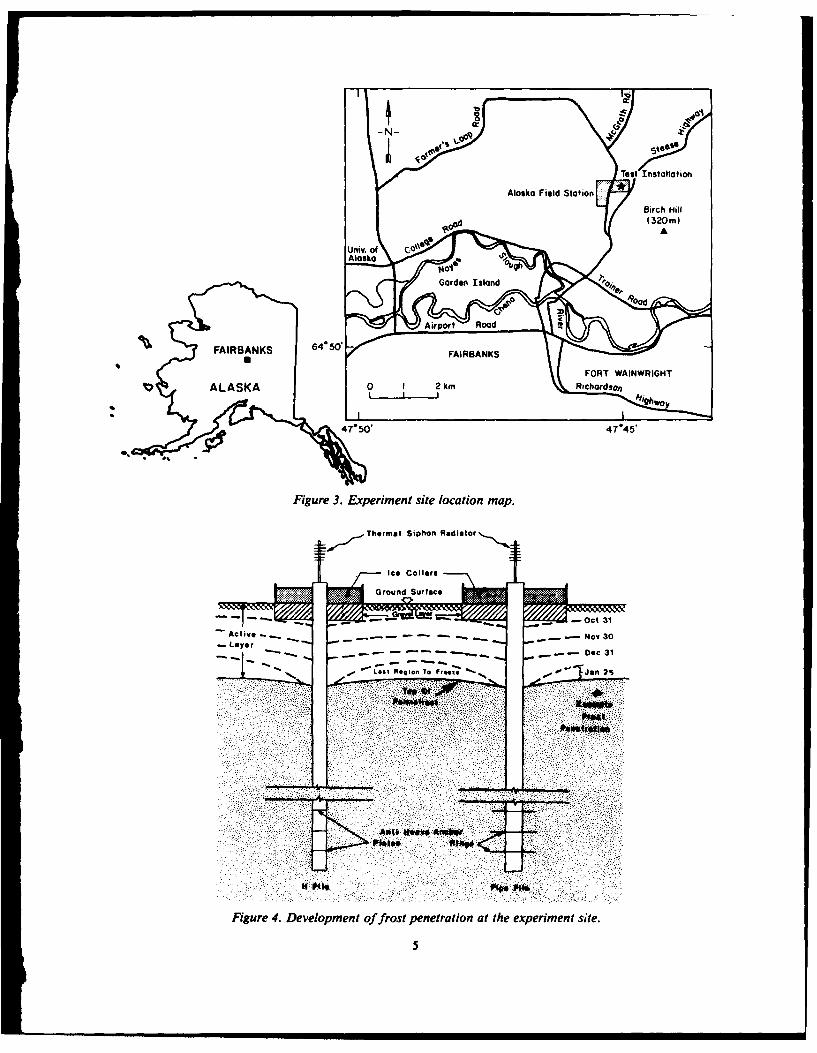
Johnson and Esch (1985) reported on the 1982- Soil conditions83 and 1983-84 winter seasons from this study us- The test site was located at the CRREL Fielding the initial calibration results. The magnitude Station in Fairbanks (Fig. 3). The soils (Fairbanksand distribution of strains, forces and stresses dif- silt) are primarily deep colluvial deposits of slight-fer slightly from the results of this report because ly organic silts with occasional wood fragmentsof differences in the calibration results used for and peat layers (Crory and Reed 1965, Linel] 1973,the reports. Figu.,: 2 shows the maximum meas- Esch 1982). Moisture content was not measured inured adfreeze shear stresses for the H-pile as a the fall preceding the 1982-83 measurement pro-function of temperature from October 1983 gram; however, observation of the borehole cut-through March 1984 (Johnson and Esch 1985). tings and other evidence indicated that the soil de-Their results indicated that the apparent relation- posits were saturated below a depth of about 0.5ship between adfreeze stress and temperature also m. A soil log taken prior to the 1983-84 winter in-depended on the rate and magnitude of soil heave dicated the moisture content of the soil was 40%and that it was not possible to completely separate near the surface and varied from 25% to 29% be-the effects of soil heave and temperature on shear tween the surface and a depth of about 2.4 m. Priorstresses. to the beginning of the 1982-83 winter season, the
The above investigators suggested a number of soil was unfrozen to a depth of about 2.5 m withcontrolling influences for frost heaving forces act- permafrost below. Measurements of the depth toing on foundation piles. These included 1) soil permafrost in September 1984 indicated that thetype and temperature, 2) rate and magnitude of depth of unfrozen ground was approximately 2.5
m where the ground was snow-covered during thewinter, 1.6 m between the piles, and 2 m im-
-- I--T-T TFV F-950 mediately adjacent t:) the piles. These measure-550- As 0 - ments indicated that the top of the permafrost500 - - 850 table had moved toward the surface of the experi-
ment site as a result of maintaining a snow-free450 - surface to intensify frost heaving. The thickness of
°, -40 the seasonally thawed or active layer between theo-6o piles at the beginning of the winter season was 2.3
-t m in 1982, 1.6 m in 1983 and 1.6 m in 1984. The350- ,-0o soil in the active layer froze to the depth of the
0_J300 0 Oct E permafrost each winter during the study as illus-
0 . a . No, 450 E trated in Figure 4. During a typical winter, frost250 -, oc 0 heaving at the site ranges from 2 to 7 cm.
200-° 0 &Fb 350an0 Mar Site preparation and plan0
5o I I I i-;so The experiment site had been cleared of vegeta-0 -2 -4 -6 .- a -10 -12 tion and covered with a 30-cm layer of gravel dur-
Te ,,oto C ) ing an earlier study designed to investigate meth-
Figure 2. Shear stress as a function of tern- ods for pre-thawing permafrost. The location ofperature for the H-pile from October 1983 the pile study site was previously designated asthrough March 1984 (from Johnson andEsch "plot D," and the average thaw depth was meas-1985). ured at 2.5 m in the fall of 1982 (Esch 1983). Most
4
Is a
5z.S1-
Test Installation
Alaska Field Station
FAIRBANKS HillUodMM
ThermoSrdo n Islantor
-. ~L~t R ip o rt. RoadJa 2
64- 5d
Fiuri4gDueopen of fxproset pieetration ahepermnie
SihnRda rN_ _

Temp Logging TubeNo.4
0
~Air Temp. Sensor
n trument Bldg.
Thermistor String
1 Area Covered
See LVDT(I-4 from Lto R) by Roof StructureEnlargement ------- Pipe Pile
SSuppor Be Pipe Pile Thermal SiphonLVOT Support Beam __I_
Survey Markers(I- II from R to L)
Enlargement Temp. Logging Tubes
I No's. I and 2Temp. Logging Tube
No.3
"H" PileThermal Siphon 0 BM OIm
Figure 5. Plan view of the experimental site.
of the 30-cm layer of gravel was removed during ing the 1983-84 season. A 0.6-m-thick x 1.8-m-site preparation, leaving a thin layer of gravel, diameter gravel layer was placed around the topsTwo instrumented piles, a pipe pile and an H-pile, of the piles on 17-23 August 1983 prior to the 1983-were installed at the test site for this study. A ref- 84 winter season and left in place throughout theerence benchmark, temperature probes, and an in- 1984-85 season. The gravel layer was placed by ex-strumentation hut were also installed (Fig. 5). cavating the soil from around the tops of the piles
The ground around the piles was kept free of and backfilling with gravel to the original groundsnow throughout the measurement program. A surface.roof structure was installed over the piles for the1983-84 and 1984-85 seasons to keep thL snow off Instrumentation and Installation of pilesthe site and thereby increase the frost penetration An H-pile, 25.4-cm web x 85 kg/lineal meterand intensify frost heave. (HP 10 x57), and a pipe pile 30.5-cm I.D. x 0.95-
Two commonly encountered situations for pile cm wall thickness, were each instrumented withinstallations in Alaska are aufeis buildup around hermetically sealed weldable strain gauges (HITECpiles near river crossings and the use of gravel Corp., 350-ohm strain gauges) and copper-con-backfill around the top of piles. The experimental stantan thermocouples. These were placed everyconfiguration was designed to allow for surficial 15.2 cm along the upper 3 m of the 9.45-m lengthice buildup and the use of gravel backfill. Ice col- of both piles as shown in Figure 6. The gaugeslars 1.8 m in diameter were installed around the were mounted along the centerline on both sidesupper sections of the piles during the 1982-83 and of the web for the H-pile and on diametrically op-1984-85 seasons in an effort to measure the ad- posite sides of the pipe pile. Strain gauges orientedfreeze effects of surface ice deposits in pilejacking. at 90" to the axial direction were interspersed be-The ice collars for the 1982-83 season were placed tween the axially oriented gauges along the lengthbetween 5 and 13 January 1983 to a thickness of of the instrumented sections. These were used to25 cm. The ice collars for the 1984-85 season were measure transverse strains in the piles and to esti-placed between 16 and 20 November 1984 to a mate the magnitude of horizontal compressivethickness of 45 cm. Ice collars were not used dur- stresses in the soil acting on the piles. Temperature-
6

(a) b)Pipe Pile H" Pile
Side I Side 2 Side I Side 2
8cm 4 5 Ground Surface 38cm 6 5I-- --- _3 _982 83 -i+" -38--
I4 5T3 98485 - 1 4 •---
1 .1 685 , 14. -685
4183.6 ii.838
I - 9 9 1 - 9 9
If -114.3 -1I143
I+ 1$. 129.5 + I 4. -,29.5
o [1448 8 -144.8
I . -160 -1t ~. 60 '
I4 I .- ,75.3 .- 175.3
I ,! I .- 1905 I -190.5
f . -205.7 4 - i205 t
1. -220,9 I -.o
220.9
4 -. 236 2 J. -236.2
•Thermocouple
0 4 " 266.7 Active Gouge j 5 *126674Dummy Gouge
l I4- -297.2
Is ,1 4-3124
945 0 Botom 9450
Figure 6. Strain and thermocouple installation layout for the pipe pile (a) and the H-pile (b).
induced apparent strains were measured using housing for a thermal siphon. Polyurethane foamstrain gauges mounted on thin metal plates with was used to fill the cavity inside the angle sectionsthe same thermal expansion properties as the piles, for the length of the instrumented pile section.with one end fixed to the pile to ensure that the Frost heave resistance was obtained through steelgauge-shim system was unstressed (shown as plates welded between the flanges of the H-pile atdummy gauges in Fig. 6). Dummy gauges were 0.3-m intervals over the bottom 3.0 m of the pilewired to active gauges to cancel temperature- (Fig. 8).induced apparent strain (shown as pairs of gauges The upper 2.74 m of the pipe pile was cut intoin Fig. 6). The gauges were coated with a water- three 0.91-rn sections to facilitate placement of in-proof coating atid polyurethane foam to provide strumentation on the pile (Fig. 9). After instru-corrosion protection and insulation. mentation placement, these pile sections were
Angle sections (L5 x5 x V, 12.7-cm legs, 0.95 welded together, calibrated and then welded to thecm thick) were welded over the gauges on each lower uninstrumented section of the pipe pile. Theside of the H-pile web to provide mechanical pro- gauges were kept cool during welding by blowing atection. Figure 7 shows the installation scheme for stream of air through the pile and running watertwo axially oriented and one transverse strain over the outer skin. Concentric rings with a 40.6-gauge with a thermocouple installed next to each cm outer diameter were welded to the lower 3.0-mof the axial gauges on the H-pile. A 3.35-m-long section of the pipe pile at 0.3-m intervals to helptube was placed inside the angle on one side of the prevent the pile ,,om heaving throughout the win-pile and connected to a watertight box section ter period.(4 x4 x , 10.2-cm sides, 0.64 cm thick), which Two tubes were placed in the interior of the pipeextended the remaining length of the H-pile. The pile. One tube was suspended in the center of thetube and box section were used as a guide and pile as a guide for a thermal siphon. The second
7

Figure 7. Closeup of axial and transverse strain gauge and thermocouple installations on the H-pile.
Figure 8. Instrumented H-pile after installation of pro- Figure 9. End view of 0.91-m-long pipe pile section in-tective angles, guide tube and retention bars. strumented with strain gauges and thermocouples.
8

Figure 10. Instrumented pipe pile after welding of the three instrumented sec-tions to the uninstrumented section and installation of the polyurethane foam.
tube was slightly offset from the center and was reduce air cooling of the piles and radial freezingused to pour a slurry of water and sand in the un- of the soil, which might have altered soil tempera-instrumented portion of the pipe pile after instal- tures and reduced heave stresses. Three tempera-lation to provide for better thermal conduction be- ture logging tubes, consisting of 2.54-in. PVC tub-tween the thermal siphon and the pipe walls. Once ing filled with diesel fuel, were installed at the lo-both tubes were in place, polyurethane foam was cations shown in Figure 5 to a depth of 9 m aroundused to fill the upper 2.75-m cavity of the pile (Fig. the piles to monitor the effectiveness of the ther-10). mal siphons. Temperature readings were taken in
Both the H- and pipe piles were calibrated in the logging tubes near the piles and at an adjacentcompression prior to installation and in tension at undisturbed soil site on two different occasions.the end of the experiment. A description of the ini- Tube I was located inside the pipe pile about 6.4tial (compression) and field (tension) calibration cm from the thermal siphon, and tube 2 was locat-procedures is given in Appendix B. ed 25.4 cm outside the pipe pile. Tube 3 was locat-
After the initial calibration the piles were in- ed about 29 cm from the H-pile thermal siphonstalled in holes augered to a depth of approximate- and tube 4 was located 3.1 m from the H-pile (Fig.ly 9 m. The holes around the piles were backfilled 5). Figure II shows that the soil at depth immedi-during the week of 31 October 1982 with a saturat- ately surrounding the pipe pile was about 20 toed sand slurry mixture for the lower 6 m and with 4°C cooler than the undisturbed soil on 7 Decem-native silt at 4001o water content by weight for the ber 1982 and continued to cool throughout theupper 3 m. Thermal siphon tubes with propane as winter. Figure 12 shows that the soil around thethe refrigerating fluid were installed in both piles H-pile at depth was about 0.50 to 3°C cooler thanto aid in freezing the backfill slurry and cooling the undisturbed soil. The effectiveness of the ther-the permafrost, thereby increasing the frost jack- mal siphon for the H-pile was less than that useding resistance of the piles in combination with the in the pipe pile, possibly because of differences inrings and plates welded on for the same purpose. thermal contact between the piles and their ther-The polyurethane foam surrounding the upper mal siphons.third of the thermal siphons in both piles helped
9
Temperature (*C) Temperature (°C)
-12 -10 -8 -6 -4 -2 0 2 -12 -10 -8 -6 -4 -2 0 20 0
2 -2
4- 4 -
o6- lubalTubelTubel 6-
No.1 N1o.21No.41I A 1 1. 7Dec'82
14 F ~eb 83
8 8 Tube TubeNo. 3 No. 41
o 0 7 Dec 821 14 Feb83
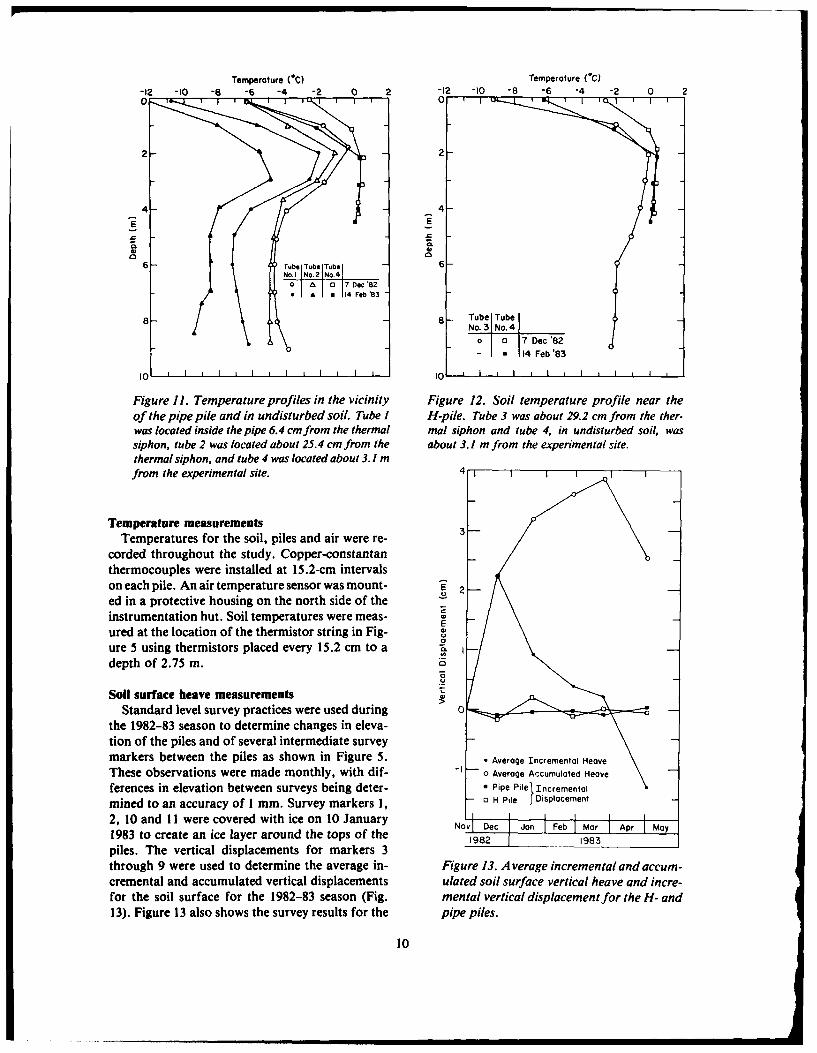
Figure 11. Temperature profiles in the vicinity Figure 12. Soil temperature profile near theof the pipe pile and in undisturbed soil. Tube I H-pile. Tube 3 was about 29.2 cm from the ther-was located inside the pipe 6.4 cm from the thermal mal siphon and tube 4, in undisturbed soil, wassiphon, tube 2 was located about 25.4 cm from the about 3.1 m from the experimental site.thermal siphon, and tube 4 was located about 3.1 mfrom the experimental site. 4 1
Temperature measurementsTemperatures for the soil, piles and air were re-
corded throughout the study. Copper-constantanthermocouples were installed at 15.2-cm intervalson each pile. An air temperature sensor was mount- 2ed in a protective housing on the north side of theinstrumentation hut. Soil temperatures were meas- E
ured at the location of the thermistor string in Fig-ure 5 using thermistors placed every 15.2 cm to a Idepth of 2.75 m.
Soil surface heave measurementsStandard level survey practices were used during 0
the 1982-83 season to determine changes in eleva-tion of the piles and of several intermediate surveymarkers between the piles as shown in Figure 5. * Average Incremental Heave
These observations were made monthly, with dif- 0 Average Accumulated Heave
ferences in elevation between surveys being deter- 0 Pipe Pile Incremental
mined to an accuracy of I mm. Survey markers 1, 0 H Pile Displacement
2, 10 and 11 were covered with ice on 10 January Nov Dec Jan e M Apr May
1983 to create an ice layer around the tops of the 1982 1983
piles. The vertical displacements for markers 3through 9 were used to determine the average in- Figure 13. A verage incremental and accum-cremental and accumulated vertical displacements ulated soil surface vertical heave and incre-for the soil surface for the 1982-83 season (Fig. mental vertical displacementfor the H- and13). Figure 13 also shows the survey results for the pipe piles.
10
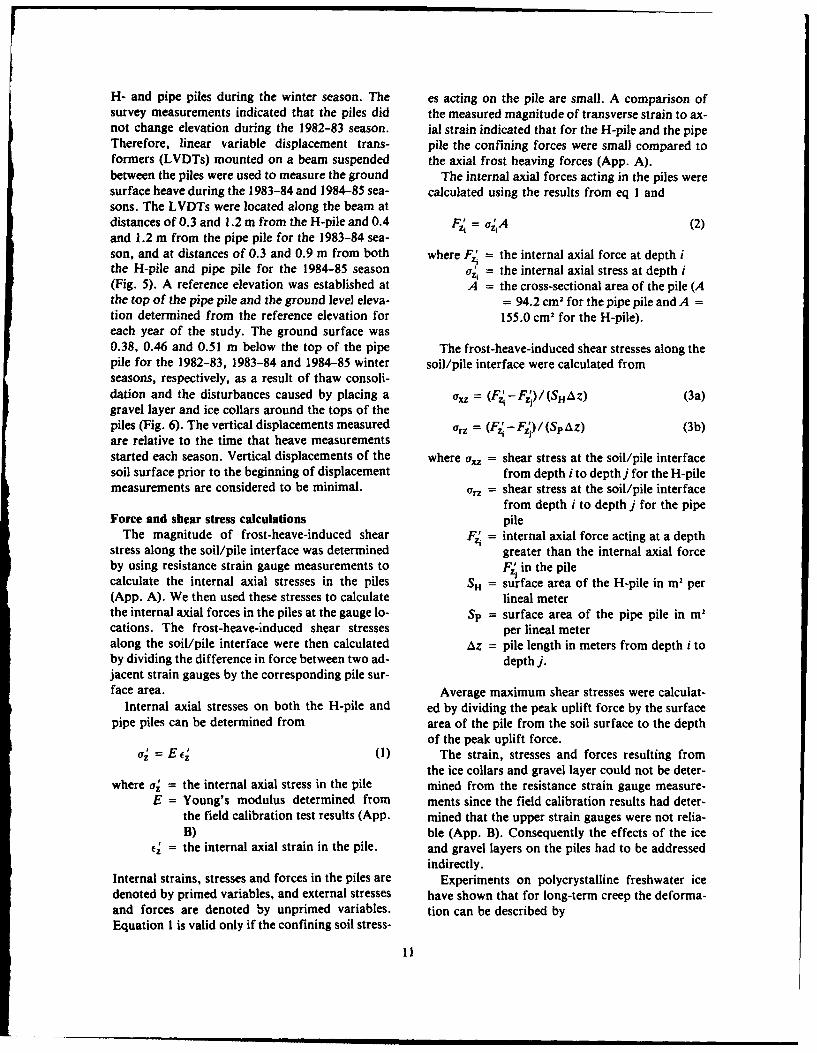
H- and pipe piles during the winter season. The es acting on the pile are small. A comparison ofsurvey measurements indicated that the piles did the measured magnitude of transverse strain to ax-not change elevation during the 1982-83 season. ial strain indicated that for the H-pile and the pipeTherefore, linear variable displacement trans- pile the confining forces were small compared toformers (LVDTs) mounted on a beam suspended the axial frost heaving forces (App. A).between the piles were used to measure the ground The internal axial forces acting in the piles weresurface heave during the 1983-84 and 1984-85 sea- calculated using the results from eq 1 andsons. The LVDTs were located along the beam atdistances of 0.3 and 1.2 m from the H-pile and 0.4 F4= a .A (2)and 1.2 m from the pipe pile for the 1983-84 sea-son, and at distances of 0.3 and 0.9 m from both where F4 = the internal axial force at depth ithe H-pile and pipe pile for the 1984-85 season a4 = the internal axial stress at depth i(Fig. 5). A reference elevation was established at A = the cross-sectional area of the pile (Athe top of the pipe pile and the ground level eleva- = 94.2 cm 2 for the pipe pile and A =tion determined from the reference elevation for 155.0 cm 2 for the H-pile).each year of the study. The ground surface was0.38, 0.46 and 0.51 m below the top of the pipe The frost-heave-induced shear stresses along thepile for the 1982-83, 1983-84 and 1984-85 winter soil/pile interface were calculated fromseasons, respectively, as a result of thaw consoli-dation and the disturbances caused by placing a U11 = (F4-F')/(SH AZ) (3a)gravel layer and ice collars around the tops of thepiles (Fig. 6). The vertical displacements measured a,, = (F4 - F,') / (Sp Az) (3b)are relative to the time that heave measurements
started each season. Vertical displacements of the where u = shear stress at the soil/pile interfacesoil surface prior to the beginning of displacement from depth i to depthj for the H-pilemeasurements are considered to be minimal. = shear stress at the soil/pile interface
from depth i to depth j for the pipeForce and shear stress calculations pile
The magnitude of frost-heave-induced shear F. = internal axial force acting at a depthstress along the soil/pile interface was determined greater than the internal axial forceby using resistance strain gauge measurements to F,, in the pilecalculate the internal axial stresses in the piles SH = surface area of the H-pile in m' per(App. A). We then used these stresses to calculate lineal meterthe internal axial forces in the piles at the gauge lo- Sp = surface area of the pipe pile in m2
cations. The frost-heave-induced shear stresses per lineal meteralong the soil/pile interface were then calculated Az = pile length in meters from depth i toby dividing the difference in force between two ad- depth j.jacent strain gauges by the corresponding pile sur-face area. Average maximum shear stresses were calculat-
Internal axial stresses on both the H-pile and ed by dividing the peak uplift force by the surfacepipe piles can be determined from area of the pile from the soil surface to the depth
of the peak uplift force.. = (1) The strain, stresses and forces resulting from
the ice collars and gravel layer could not be deter-where a, = the internal axial stress in the pile mined from the resistance strain gauge measure-
E = Young's modulus determined from ments since the field calibration results had deter-the field calibration test results (App. mined that the upper strain gauges were not relia-B) ble (App. B). Consequently the effects of the ice
= the internal axial strain in the pile. and gravel layers on the piles had to be addressedindirectly.
Internal strains, stresses and forces in the piles are Experiments on polycrystalline freshwater icedenoted by primed variables, and external stresses have shown that for long-term creep the deforma-and forces are denoted by unprimed variables. tion can be described byEquation I is valid only if the confining soil stress-
11

= B(r (4) = shear stress at the ice/pile interfaceover the thickness of the ice collar
where i = strain rate in the ice S, = surface area of the pile in m" perB = constant that depends on the ice tem- lineal meter
perature, ice crystal fabric and other tc = thickness of the ice collar (in).variations in ice properties
rc = shear stress over the thickness of the Shear stresses at the soil/pile interface from theice collar at the ice/pile interface ground surface to the depth of the first function-
n = constant determined from experiments ing strain gauge were determined from(Paterson 1981).
axzj = (F_-Fc)/(SH AZ) (8a)The magnitude of i can be estimated by using themeasured rates of soil surface heave near the piles arz, = (F4 - F,) / (Sp Az) (8b)and the assumption that soil displacement is con-strained only in a narrow region around the piles. where ax, = shear stress at the soil/pile interfaceExperimental results by Penner and Irwin (1969) for the H-pile from the ground sur-and Saltykov (1944) indicate that soil surface face to the depth of the first func-heave is constrained only within 1 cm of a pile. tioning strain gauge
The strain rate in the ice was calculated from ar, = shear stress at the soil/pile interfacefor the pipe pile from the ground sur-
= (AA/Ay) (5) face to the depth of the first func-tioning strain gauge
where i = strain rate in the ice F = = internal axial force on the pile at theAy = narrow region in which soil displace- depth of the first functioning strain
ment is constrained (1 cm) gaugeAAi = Ain - 10 F = uplift force on the pile at the groundj% = soil surface displacement rate as meas- surface due to an overlying ice collar
ured near the pile (F = 0) when there is no ice collar)= soil surface displacement rate at the Az = pile length in meters from the
pile. ground surface to the depth of thefirst functioning strain gauge.
The soil surface displacement rate at the pile wasassumed to be zero, a conservative assumption The depths to the first functioning strain gauge onthat will result in peak ice strain rates. The shear the H-pile are nearly the same as the thickness ofstress at the ice/pile interface over the thickness ofthe ice collar is found by combining eq 4 and 5 and Table 2. Values ofsolving for rc to obtain flow law parameters
(B) for different7C = (/B)" / . (6) temperatures and n
= 3 (from Patter-Table 2 gives values of B for n = 3 and several dif- son 1981).ferent temperatures from the experimental resultsreported by Paterson (1981). Representative T B
values of B were determined for the ice tempera- (CC (s' kPa-')
tures measured in the study at or near the soil sur-face. 0 5.3 x 10-"- 5 1.7 x10'
The uplift force on the piles at the ground sur- -10 S.2x 10-,4
face due to an overlying ice collar was calculated -15 3.1 x 10-"from -20 1.8 x 10-"
-25 i.0 x 10- '1-= rcSS (7) 30 5.4 x 10-"
-35 2.9x10-"-40 1.5 X 10 I1?
where F = uplift force on the pile at the ground -45 7.7 x 10"1surface due to an overlying ice collar -50 3.8 x 1o-,,
12

the gravel layer placed around the pile. Therefore, Air, ground, pile and ice collar temperaturesthe heaving force on the H-pile due to the gravel The air and ground temperatures for the 1982-layer for the last two winter seasons was calculated 83, 1983-84 and 1984-85 seasons are shown infrom Figures 14 and 15. There were five major low-tem-
perature periods during each season when the airF, = F4 - Fc (9) temperature dropped below -25°C for several
days or more. Ground temperatures throughoutwhere FG is the heaving force on the H-pile due to the active layer above the permafrost measured atthe gravel layer. The depths of the first function- the thermistor string location in Figure 5 were ating strain gauge on the pipe pile are greater than or below 0°C by early April for the first winterthe thickness of the gravel layer. Consequently, season and by early January for the last two win-the heaving force on the pipe pile due to the gravel ter seasons.layer was not determined. H- and pipe pile temperatures for the 1982-83,
1983-84 and 1984-85 seasons are shown in FiguresData acquisition periods 16 and 17. The soil around both piles was thawed
The H- and pipe piles were installed on 29 Octo- to a depth of 0.5 m on 23-24 November 1982 byber 1982, and routine data acquisition began on 19 covering and heating the tops of the piles in an un-November after the installation of the instrument successful effort to establish an unstrained (thawedhut, electical power, and connection of all strain soil) reference for the strain gauges. The effect ofand temperature sensors to an HP 3497A datalog- this heating shows up as a temperature spike in theger. Soil surface heave had already begun and 1982-83 pile temperatures (Fig. 16 and 17). Thefreezeback of the soil adjacent to the piles was temperatures along the H- and pipe piles werecomplete by the time the datalogging was started. slightly lower than in the adjacent undisturbedStrain and temperature measurements were auto- ground. The pipe pile temperature was generallymatically recorded at intervals varying between 2 lower than the H-pile temperature during the win-and 12 hr throughout the study. Data acquisition ter, due to better thermal contact with the thermalfor the 1982-83 season ended on 13 April 1983 be- siphon at depth.fore thaw consolidation occurred in the soil sur- Soil and pile temperatures were lower during therounding the piles. Data were obtained continu- second and third winter seasons as a result of theously (except for a few data gaps) for the 1983-84 roof structure sheltering the site (Fig. 15, 16 andand 1984-85 seasons, from 9 September 1983 to 6 17).May 1985. Unfortunately one of the data gaps (28 The ice collars were formed by periodicallySeptember to 20 October 1983) occurred at the be- pouring water into a 1.8-m-diam confining ringginning of the 1983-84 frost heave season, and so surrounding the tops of the piles and allowing it tothe onset of frost-heave-induced effects was freeze in layers. This resulted in the sudden tern-missed. Consequently, the initiation of soil sur- perature rises during the periods of 5 to 13 Janu-face heave and the associated forces were not ary 1983 and 16 to 20 November 1984 in Figuresmeasured until the beginning of the 1984-85 16 and 17. Ice collars were not used on the pilesseason. during the 1983-84 winter season.
The ground surface surrounding the piles andthermistor string was lower during the last two
EXPERIMENTAL RESULTS years of the study due to thaw consolidation of thesoil around the piles and the disturbances caused
A common period of interest was selected for by placing the gravel layer and ice collars (Fig. 6).graphic presentation of the results of this study As a result, the upper temperature sensor on bothfrom 1 September 1982, 1983 or 1984 to 1 June piles and the thermistor string were no longer be-1983, 1984 or 1985. The frost heave season gener- low ground. Consequently, the soil and pile tern-ally begins by mid-October and ends by late April perature records for the last two seasons show theor early May. This common period covers the ini- effect of the upper temperature sensor recordingtiation, occurrence and end of the frost heave sea- air or ice collar temperatures at or near the groundson and allows direct comparison between the surface (Fig. 15, 16 and 17). The temperature datathree winter seasons of data. from the upper sensor on both piles were used to
represent the ice temperature when computing theice/pile shear stresses over the thickness of the icecollar.
13

0-
-10-
-20-
I-I-30-
-1982-'83 Air Temp.-40
10201102011020 1020 1020 1020 10201102011020Sep Oct Nov Dec Jon Feb Mar Apr May
10-
0
oU-10
E-20-
IT-
-30-
-40 1983-'84 Air Temp.
10 20 1 0 20 102 10 20 ]10 20 1 0 201 10 20 10 20 110 20Sep Oc Nov Dec Jan Feb Ar p a
-10-/
-30-
-40- 1984-'85 Air Temp.
10 20 110 20 10 20 10 20 11020 1 0 201 10 20 10)20 12Sep Oct Nov Dec Jan Feb Mar Apr 1MayV!
Figure 14. Air temperature for the 1982-83, 1983-84 and 1984-85 seasons.
14

0-
20
1982-.83 Ground Temp. Go. ee
-40-
10 20 10 20 10 20 190 20 19020 1i0 20 i0 20 10 20 9020LSep Oct Nov Dec Jan Feb Mar Apr May
90 -I3I-.7~ -0.84 -. 84 -23
06 2-20-
-0.23A- -0.08 03
-40 983-'84 Ground Temp. 00 05
1020 9020 9020 9020 1 02 0 20 0 012Se Oct Nov IDec Jan Feb Apr Mar
90 -094to-262 i 109 -
-0.64-
E 033-0.79&-20- -048 201
1 0.03 OAS -140
-30 -0.03 -109
94- 984-'85 Ground Temp. 0.13m
90 20 9 0 20 9 0 20 1902?0 19020 90 20 902?0 90 20 90 20Sep Oct Nov Dec Jan Feb Mar Apr May
Figure 15. Ground temperature at different depths for the 1982-83,1 983-84 and 1984-85 seasons.
15
10 - ~-1 37... -1 68 -2 29 to-2 74 ni
;I 92 83
0-
-10 04- -0.46 -1.22
E -0
0) 06
0.30 \ I-30- H-pile Temp.01-1982-'83 Grounld Leve
-40 I ll10201 020 1 020 1 020 110 20 1 0201 10 20 10 20 10 20Sep Oct Nov Dec Jan Feb Mar Apr Ma
1 60 to2.67M 099/ -149
-10-
-202
-30- H-pl eTemp.-1983-'84
-40-
10201 1020 110 20 10 20 10 20 110 201 10 20 10o20 11020Sep Oct Nov Dec Jan Feb Mar Apr May1
10 -170 o- 262-.
0
E -20 094
003-30 H-pi16 Temp. 013
1984-'85
1020 1020 10 20 10 20 10 20 102 02 02 02Sep Oct Nov IDec IJan Feb j ar Ar May
Figure 16. H-pile temperature at different depths for the 1982-83,1983 -84 and 1 984-85 seasons.
16
to0I - 68
0- ~-1 3 -8 24
-0,0 -122
I-. 076
-30- pipe Pile Temp. 0.5 _061
- 1982-'83 Grond * I
-40-
10 20 1020 10 20 10 20 10 20 10201 1201020 10"20Sep Oct Nov Dec Jon IFeb Ma AprJJ M L
10 -114
-0 ,.6 -099 -130 -160
0-044 -145 -1 7510-2.67n,
-10-
0 -
-2 01t 0 1038 1 011 0 02 02 o2
0%
-o- -0239
0-
-tO0
-30 - Pipe PieTm ,03
-1984-'85-40 I-
10 20 110 20 10 20 10 20 10 20 110 2011020110 20110 20Sep Oct Nov Dec ion Feb Ma Apr IMay
Figure 17. Pipe pile temperature at different depths for the1982-83, 1983-84 and 1984-85 seasons.
17
ESoil Surface
a4-E
0
-2f 10 20 10 20 10 20 10 20 10 20 10020Dec'82 Jon'83 Feb Mar Apr Moy
8 " 1 ' 1 111' I'" 1'" 111 111,11'l 1' Ji l l J ll I[LVDT Displacement
6 1983-84 4 -
4
3 2c4- -.
E 2'1 3 2
121. 12.2- I, 0/ ~m/ 1 03. r.VJ1 4
HP~''0 0 0 ipI 2 3 4 P.I.
0- LVOT'S
1020 1020 1020 1020 10 20 10 20 10 20 10 20 020Sep Oct Nov Dec Jon Feb Mar Ipr May
'""II I " ' I' ""1, 1 I'Jil 111'1' 1' ''1 l 1 , 1 11 l l '1LVDT Displacement =Q9M 09m
6 1984-'85 0 3 , . -.F1 K71o 3 . -
".Pi-,'O 0 0 0 0 Ol,0I 2 3 4_
0LVOT'S2 4-
E. 4 ;S2 43 22- A
10 20 10 20 10 20 10 20 10 20 10 20 10 20 10 20 10 20Sep Oct Nov IDec Jan Feb 1Mar 1Apr May
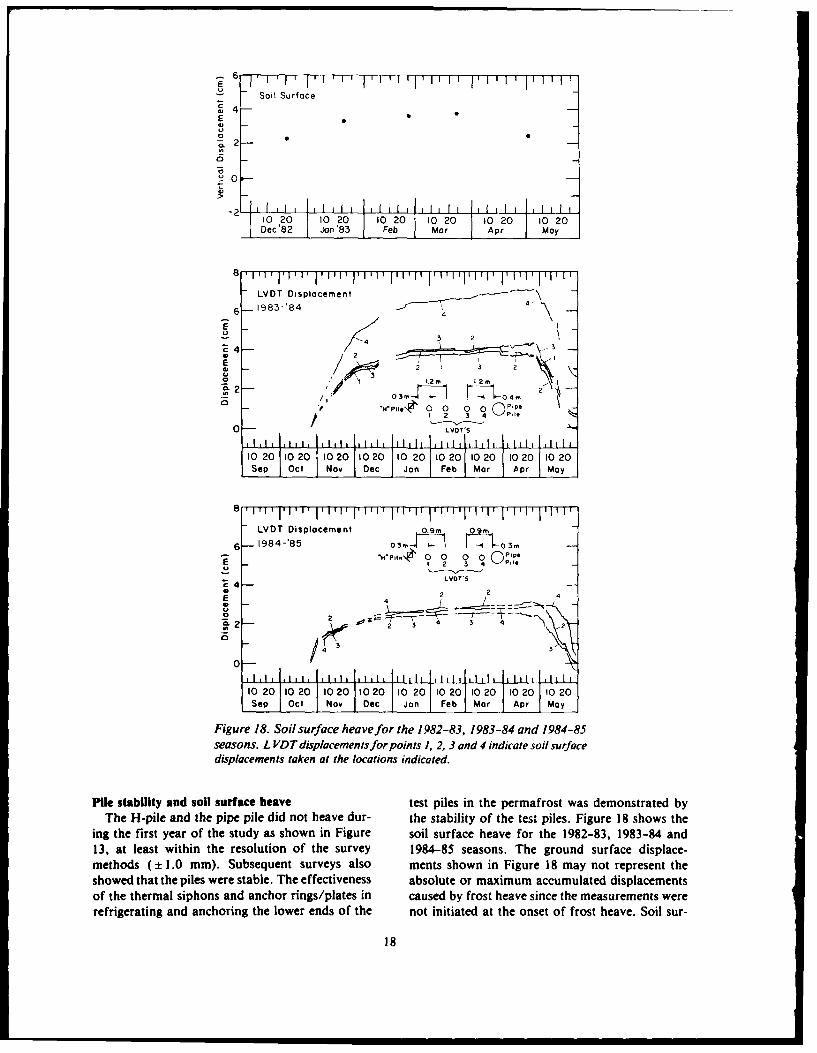
Figure 18. Soil surface heave for the 1.982-83, 1983-84 and 1984-85seasons. L VDT displacements for points 1, 2, 3 and 4 indicate soil surfacedisplacements taken at the locations indicated.
Pile stability and soil surface heave test piles in the permafrost was demonstrated byThe H-pile and the pipe pile did not heave dur- the stability of the test piles. Figure 18 shows the
ing the first year of the study as shown in Figure soil surface heave for the 1982-83, 1983-84 and13, at least within the resolution of the survey 1984-85 seasons. The ground surface displace-methods (± 1.0 mm). Subsequent surveys also ments shown in Figure 18 may not represent theshowed that the piles were stable. The effectiveness absolute or maximum accumulated displacementsof the thermal siphons and anchor rings/plates in caused by frost heave since the measurements wererefrigerating and anchoring the lower ends of the not initiated at the onset of frost heave. Soil sur-
18

face displacements prior to the onset of frost onset of the total force increase was missed forheave were considered to be minimal. The large both years (Fig. 19). The local references were se-displacement of the soil indicated by the LVDT lo- lected as near as possible to the onset of the totalcated 0.4 m from the pipe pile in 1983-84 relative force increase for the 1982-83 and 1983-84 sea-to the displacements indicated by the other three sons (24 November 1982 and 28 September 1983LVDTs is probably the result of more frost heave respectively). Consequently, the frost heave forcein the vicinity of the pipe pile. Unfortunately, the and shear stress values for the first two seasons doLVDTs were reset during a data gap on 2 to 5 not represent the absolute or maximum values.November 1984 (as shown by the obvious break in The local references selected for the pipe pile werethe 1984-85 soil displacements) and an ice collar taken at the same times as those for the H-pile.was used around the piles, making it impossible to Frost heave forces for the three seasons coveredverify whether larger soil surface displacements in the study are shown in Figure 20 for the H-pileagain occurred in the vicinity of the pipe pile dur- and Figure 21 for the pipe pile. Table 3 is a sum-ing the 1984-85 season. Soil surface displacements mary of the magnitude, times and depths of occur-of 2 to 7 cm are indicated on Figure 18. rence of the forces and shear stresses on both piles
during the study.
Forces and shear stresses Strains, stresses and forces could not be deter-A true unconstrained reference used to deter- mined for the 1982-83 data set on the pipe pile
mine strains was obtained for both piles during the since the field calibration results do not apply to
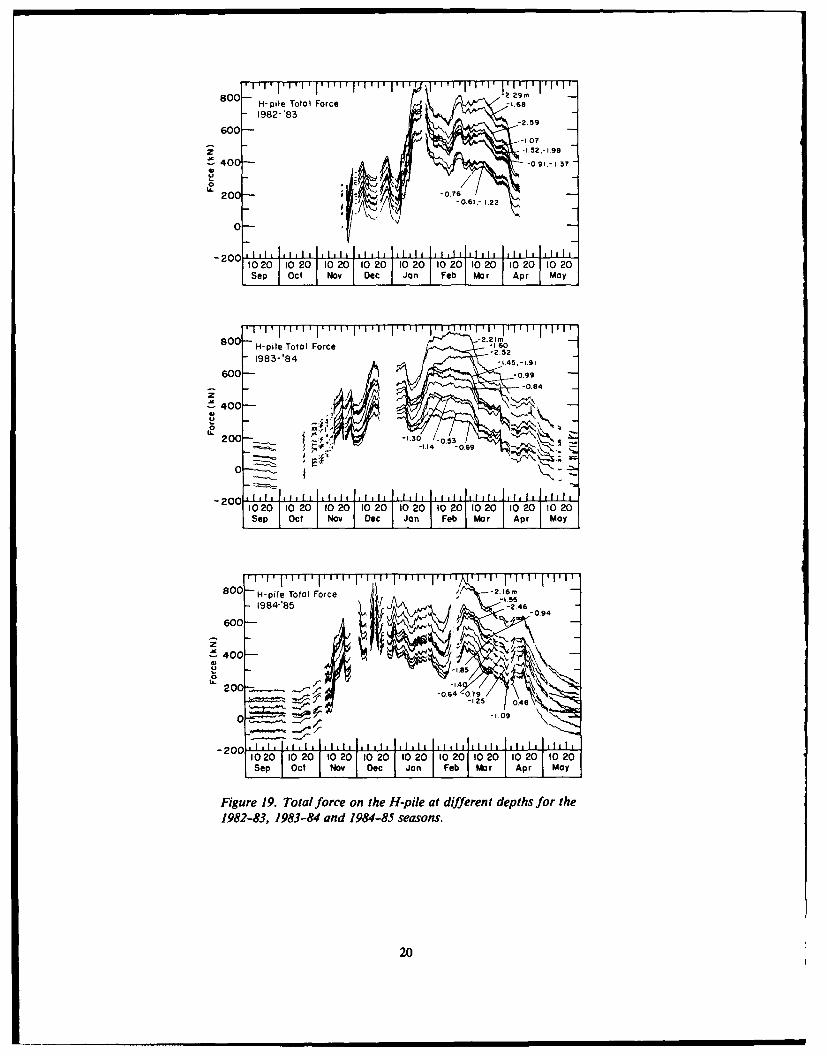
field calibration tests on 20-21 June 1985, when the full bridge completion circuits used on the pipethe piles were completely freed of the surrounding pile during the 1982-83 season (App. B). Duringsoil by excavation and truly unloaded (App. B). the study the pipe pile suffered the loss of 86% ofThese unstrained references were called common the strain gauges on the pile. The few remainingreferences since they were applied to all three sea- good gauges appear to have given reliable results,sons of data to determine the total strains, stress- which are given in Table 3 for the 1983-84 andes, and forces on the piles. Figure 19 shows the 1984-85 seasons. The peak frost heave forces ontotal forces on the H-pile for all three seasons of the pipe pile were 43°% higher and occurred earlierthe study. Both positive tensile (uplift) and nega- in the season and at a shallower depth than thosetive compressive (resistive) forces are shown on for the H-pile. The magnitudes of frost heavethe H-pile in Figure 19. The initial tensile load on forces and average soil/pile shear stresses for thethe H-pile after installation is believed to be the pipe pile appear too high in comparison with theloading on the pile caused by freezeback of the H-pile results and values reported by others. Thebackfill slurry. The remnant compressive and ten- pipe pile results should be considered suspect untilsile forces on the H-pile at the beginning and end verified by further research.of the 1983-84 and 1984-85 frost heave seasons The peak forces on the H-pile were essentiallyare considered to be the result of the redistribution the same for all three winter seasons, varying byof forces resulting from consolidation of the adja- only ± 29 kN from the average peak force. Thecent soils (Fig. 19). The total forces shown in Fig- peak forces on the H-pile occurred late in the sea-ure 19 give the complete loading history, including son and at an average depth of 2.2 m, which wasthe effects of soil thaw consolidation and frost- 0.6 m below the top of the permafrost table duringheave-induced uplift on the H-pile during the pe- the last two winter seasons of the study (Table 3).riod of interest. The calculated heaving force and ice/pile shear
Three local references (one for each data sea- stress due to the ice collars are given in Table 3.son) were used to take in-situ strains into account The ice collars may have contributed 15 to 20% of
and to determine frost heave strains, stresses and the peak forces. These results were obtained using
forces relative to the time of the local reference. the indirect methods described in the "methods
The total forces relative to the common reference and materials" section, since all of the upper
began to increase on the H-pile on 15 October strain gauge sensors were unreliable (App. B). The
1984, the beginning of the 1984-85 frost heave ice/pile shear stresses given in Table 3 can vary
season (Fig. 19). The first set of strain measure- considerably with changes in ice temperature
ments taken on 15 October 1984 was selected as and/or strain rate. Consequently, the calculated
the local reference for the 1984-85 season. The se- ice collar forces may be too high and should be
lection of the local references for the 1982-83 and used with caution. The average maximum soil/pile
1983-84 data sets was not as clear cut since the shear stresses given in Table 3 are computed on the
19
-lT-rrrfrTT71 1 1 II II9114
80 H-pile Total Force -1.68
-1982 83-2.59
600-
Z! 400- -0 9-1.37
0-
2010 20 10 20 1020 10 20 10 20 10Q201 10 20 11020 1020Sep Oc0 o Dec Jon Feb Mar Apr May
800 -pl To"j -22IH-ieTtlFarce 1.60
1983-84-2.521983-'84-1.45.-.91
600- -0.99-0.84
Z~400-
0 l ~-1.14 -0.69
20 -13 '05
200
10 20 10O20 110 201 10 20110 20 110201 10 20 110 20 1020Sep Oct NoIe Jon Feb IMar IApr May
I8001 , 1.I l, J l I -2'j .1 ill1 1 1 180H-pile Total Farce 22. 1.151
094
600
~400-
00
-064::.7
0 ~ ~-1I09
-200IIuIIiInuuIItIIt~10 0 020 10 20 to020 10 20 10 201 10 2011020110 20
Sep Oct No Dec Jan Feb Mar JApr May
Figure 19. Total force on the H-pile at different depths for the1982-83, 1983-84 and 1984-85 seasons.
20

800 H-pile Frost Heave Force -2 29-f-1982-'83 1Ie 6 22
600 - 592-I3.- . -1.6a.-2.59
-1.98z-0.91.-10 -1.52
400 -. 3
- -0.61.-0.76-12
200- 10
0 -061*0.76 '
I -0.91
-C10 20 10c2O0 t20 10"20 1020 1020 10201 10201 1020Sep Oct I Nov Dec Jan Feb Ma r Apr May
800--2.2180 H-pile Frost Heave Force 1.91 -2.25
- 983-'84 -2.529
- 5 A' 2 251.91600 - -1.45,-I.60-.4
5400
00
-20
12O'020 101201 10201 1020 110201 10201 1020 10 20 10 20Sep Oct Nov IDoc Jn Fb Ma r jApr May
800 - -1 m5-2.16 1H-pile Frost Heave Force -.52,46
-1964-'85 -12 1 140
600 -- 0 '7
/ -0.64
zf 400 -
0200- 04
0 9404
200
-2 0 20102 02 02 10 201 10 20 10 20 110 20 10 20SepI Ot ov ec Jan Feb Mar IApr Ma yO
Figure 20. Frost heave force on the H-pde at different depths forthe 1982-83, 1983-84 and 1984-85 seasons.
21
800 _-0.99.- L 30
-0.99,-1.3 0 -- -'
400
600-
oo
0 Pipe Pile Frost Heave Force -
1983-'8420 0 , i i ,, i l , , l t , ,i l, , , 1i11 , l1, ,i l
1021020 202 10020 10201 102010c0 Nov 10 2 0 20 10 20 110 211 0 20 00 I00
Sep Oct Dec Jan Feb Mor Apr May
800 h-~ 94 .25
600 400 ' ,0- -17. 4
P - .70
1200-
Pipe Pile Frost Heave Force1984-'85
-2 0 0 , , I,, , I, I 1, I I , ,1, , , ,. I ,1 .1 , ., I I I I1020 1020 1020 10 20 1020 1020 1020 10 20 10 20
Sep Oct Nov Dec Jon Feb Mar Apr May
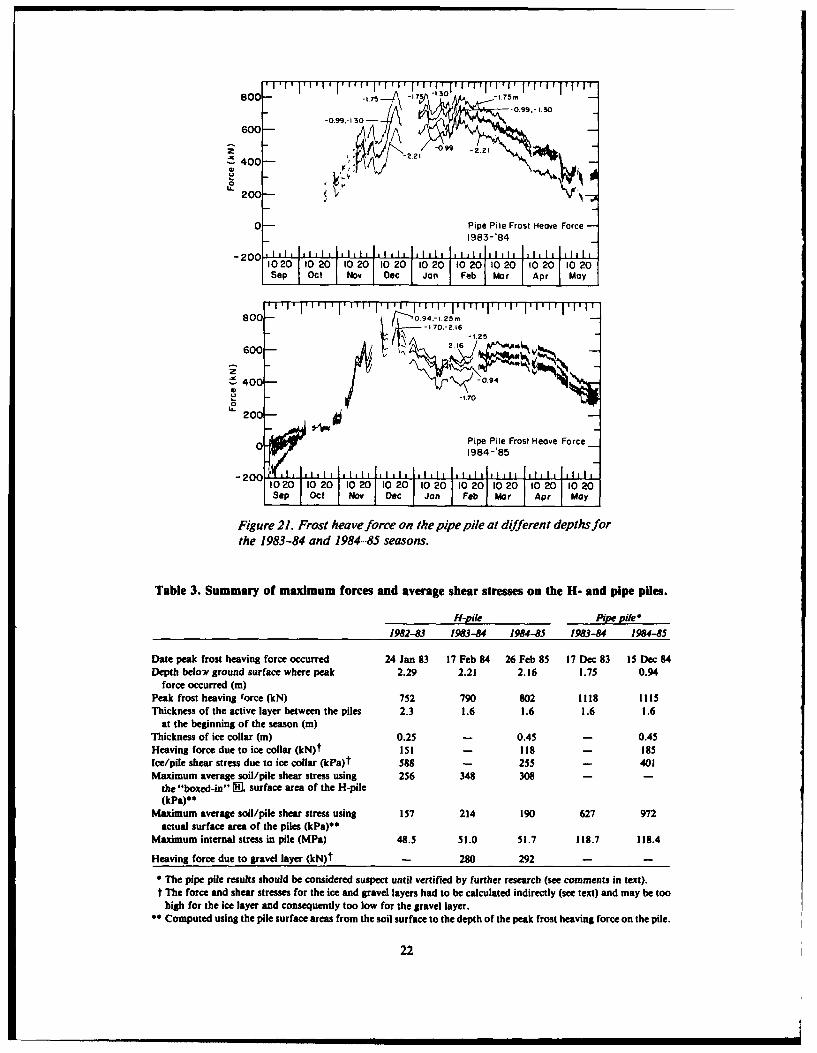
Figure 21. Frost heave force on the pipe pile at different depths forthe 1983-84 and 1984-85 seasons.
Table 3. Summary of maximum forces and average shear stresses on the H- and pipe piles.
H-pile Pipe pile"
1982-83 1983-84 1984-85 1983-84 1984-85
Date peak frost heaving force occurred 24 Jan 83 17 Feb 84 26 Feb 85 17 Dec 83 15 Dec 84Depth belo-N ground surface where peak 2.29 2.21 2.16 1.75 0.94
force occurred (m)Peak frost heaving force (kN) 752 790 802 1l18 1115Thickness of the active layer between the piles 2.3 1.6 1.6 1.6 1.6
at the beginning of the season (m)Thickness of ice collar (m) 0.25 - 0.45 - 0.45Heaving force due to ice collar (kN)t 151 - 118 - 185Ice/pile shear stress due to ice collar (kPa)t 588 - 255 - 401Maximum average soil/pile shear stress using 256 348 308 - -
the "boxed-in" R, surface area of the H-pile(kPa)**
Maximum average soil/pile shear stress using 157 214 190 627 972actual surface area of the piles (kPa)**
Maximum internal stress in pile (MPa) 48.5 51.0 51.7 118.7 118.4
Heaving force due to gravel layer (kN)t - 280 292 - -
The pipe pile results should be considered suspect until vertifled by further research (see comments in text)." The force and shear stresses for the ice and gravel layers had to be calculated indirectly (see text) and may be toohigh for the ice layer and consequently too low for the gravel layer.
* Computed using the pile surface areas from the soil surface to the depth of the peak frost heaving force on the pile.
22

basis of the "boxed in" (for the H -pile) and actual ducted on piles embedded in non-permafrost soil.surface areas of the H- and pipe pile from the soil In analyzing the results of those experiments it hassurface to the depth of the peak frost heave force been implicitly assumed that once the soil temper-on the piles. The 0.6-m-thick gravel backfill layer ature is lower than 0°C (i.e. when the soil is fro-around the H-pile may have contributed about zen) that soil heave and frost heaving forces are35/ of the peak forces measured on the pile dur- negligible. The results of our experiments anding the second and third winter seasons (Table 3). those of Crory and Reed (1965) indicate that soilThe gravel backfill replaced the native soil around heave and frost heave forces continue to be gener-the tops of both piles. The higher peak forces ated throughout the winter even in frozen groundmeasured on the pipe pile may be due to a larger (Fig. 18, 19 and 20). Ground temperatures through-contribution from the gravel layer; however, the out the active layer above the permafrost were atforce due to the gravel layer on the pipe pile could or below 0°C by early April for the first winternot be determined because of the lack of a reliable season and by early January for the last two win-strain gauge on the upper portion of the pile. ter seasons (Fig. 15). Peak frost heave forces oc-
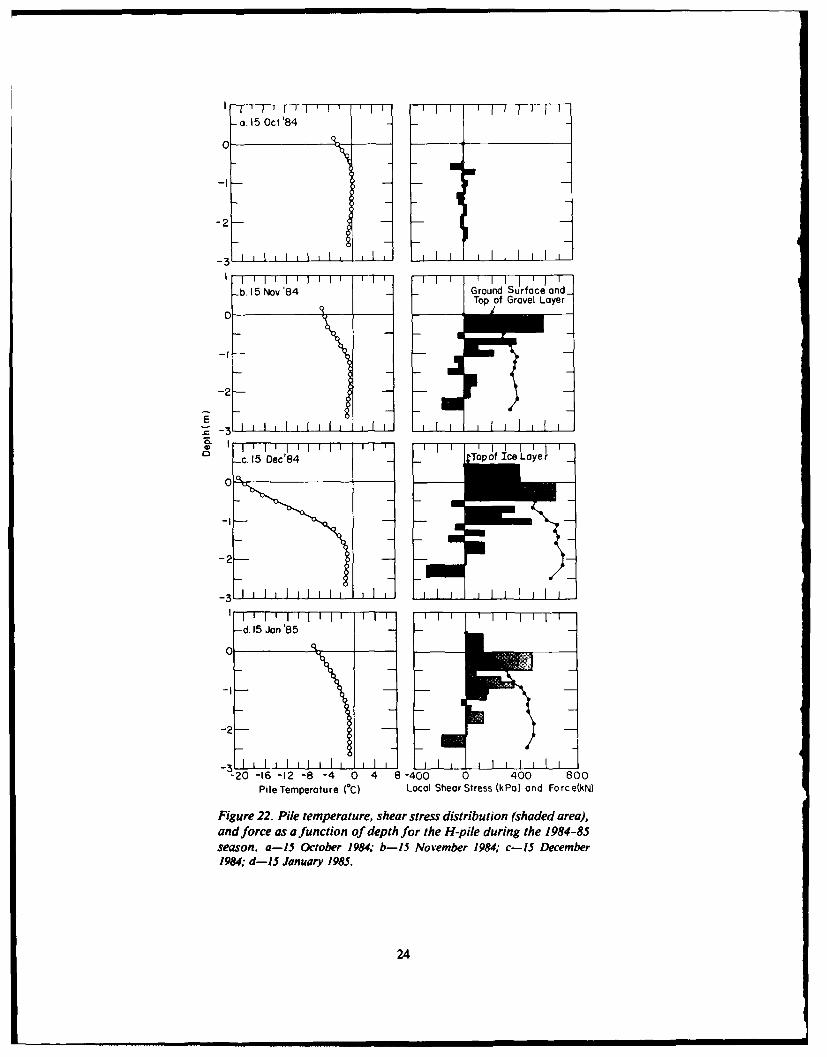
Figures 22 and 23 show the pile temperature, curred on the piles when the soil temperaturesshear stress distribution and frost heave force on were below 0°C at depths below the top of the per-the H-pile during the 1984-85 season on the 15th mafrost table. Significant soil heaving occurredof each month from October through May. The after all ground temperatures fell below 0°C (Fig.shaded area shows the shear stress distribution be- 18). A comparison of Figures 18-20 shows that thetween the levels at which strain gauges were func- soil heave rate is very small during the period oftioning properly for the H-pile. The ice/pile shear maximum uplift forces.stress and the uplift force due to the ice collar are That soil heave and increases in pile upliftshown above the ground surface or zero depth forces are occurring even when soil temperaturesvalue. Soil/pile shear stresses are not uniform are below 0°C leads us to hypothesize an explana-along the length of the pile, but vary considerably tion that incorporates the existence and migrationin sign and magnitude over time and depth. Gen- of unfrozen water within the frozen soil. Experi-erally the uplift shear stresses due to frost heaving ments have shown that a mixture of ice and unfro-act from the ground surface to the depth of the zen water is present in soils at temperatures belowmaximum force on the pile, and the restraining 00C. Experiments have also shown that a frozenshear stresses act from the depth of the maximum soil containing both ice and unfrozen water that isforce on the pile downward until the uplift force is subjected to a temperature gradient causes waterbalanced. However, there are zones of resistive to move toward the colder soil (Dirkson and Mil-soil/pile shear stresses which reduce the frost ler 1966, Oliphant et al. 1983). The resulting mi-heave force on the pile between the soil surface gration of water toward the colder soil tends to en-and the depth of the peak force. These resistive hance ice lens formation and consequently soilsoil/pile shear stresses and the corresponding re- heaving. The water migration continues until theduction in frost heave force are larger than values unfrozen water and ice content in the source zonethat could be attributed to the variability associat- is reduced to insignificant levels (Tice et al. 1982).ed with the estimate of Young's modulus for the Measurements of unfrozen water content as agauges. The zones of resistive soil/pile shear stress function of temperature for soils show that themay be due to bands of slightly different soil type percentage of unfrozen water decreases exponen-or moisture/ice content. A detailed investigation tially with decreasing temperature (Fig. 24). Ex-of soil type and moisture/ice content with depth periments on Fairbanks silt indicate that frostand time is needed to adequately investigate the heaving may be insignificant for soil temperatureszones of resistive shear stress between the soil sur- in Fairbanks silt below -20 C (Anderson and Mor-face and the depth of the peak force. The top of genstern 1973).the permafrost table was at a depth of 1.6 m at the The unfrozen water content-temperature rela-beginning of the 1984-85 winter season. The depth tionship may explain why the heave forces actingof the maximum force on the H-pile was 0.6 m be- on piles embedded in permafrost respond so rap-low the top of the permafrost table during the idly to temperature changes. On cooling, the un-1984-85 season. Uplift soil/pile shear stresses are frozen water will migrate toward the colder soil,present in the permafrost throughout the winter, causing an increase in ice lens growth, and the per-
The majority of experiments to measure frost centage of unfrozen water will decrease exponen-heaving forces acting on piles have been con- tially as a function of temperature. This may con-
23
a.l15 Oct'84
0
-I
-b. 15 Nov '84 Ground Surface'and-Top of Gravel Layer
-f
-2-
-0 c15 Dec'84 Topof ice Layer
-2-
-1
-20 -16 -12 -8 -4 0 4 8-400 0 400 800Pile Temperature (*C) Local Shear Stress (kPo) and Fo rc e(kN)
Figure 22. Pile temperature, shear stress distribution (shaded area),and force as a function of depth for the H-pile during the 1984-85season. a-15 October 1984; b-IS Nov ember 1984; c-IS December1984, d-15 January 1985.
24
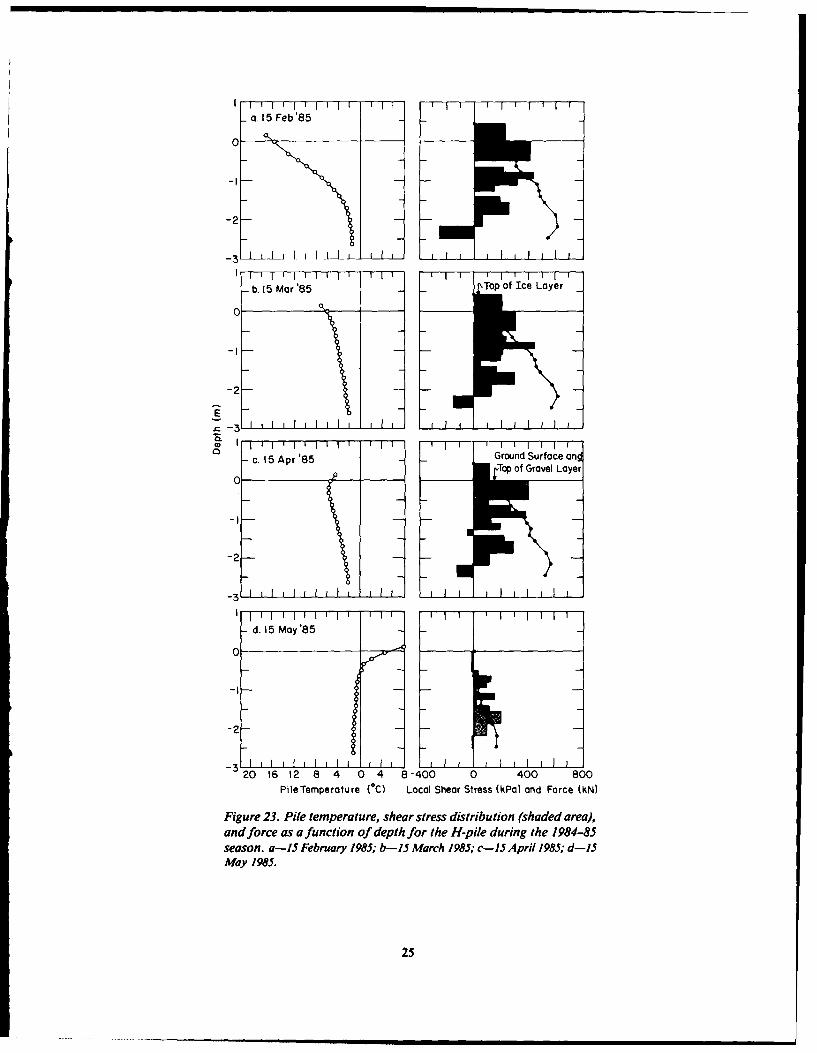
a.l1 Feb '85
0
b. 15 Mar'85 Tpof Ice Layer
-21
C) c. 1 111 ApI8 ura n0 ~ Apr 85Ground Sufc.Tap of Gravel Layer
-2-
d. 15 May'85
0
-3
20 1612 84 048-400 0 400 800Pile Tempe ratu re (*C) Local Shear Stress (kPa) and Force (NN)
Figure 23. Pile temperature, shear stress distribution (shaded area).and force as a function of depth for the H-pile during the 1984-85season. a-15 February 19&5;- b-15 March 1985; c-15 April 1985; d-15May 1985.
25
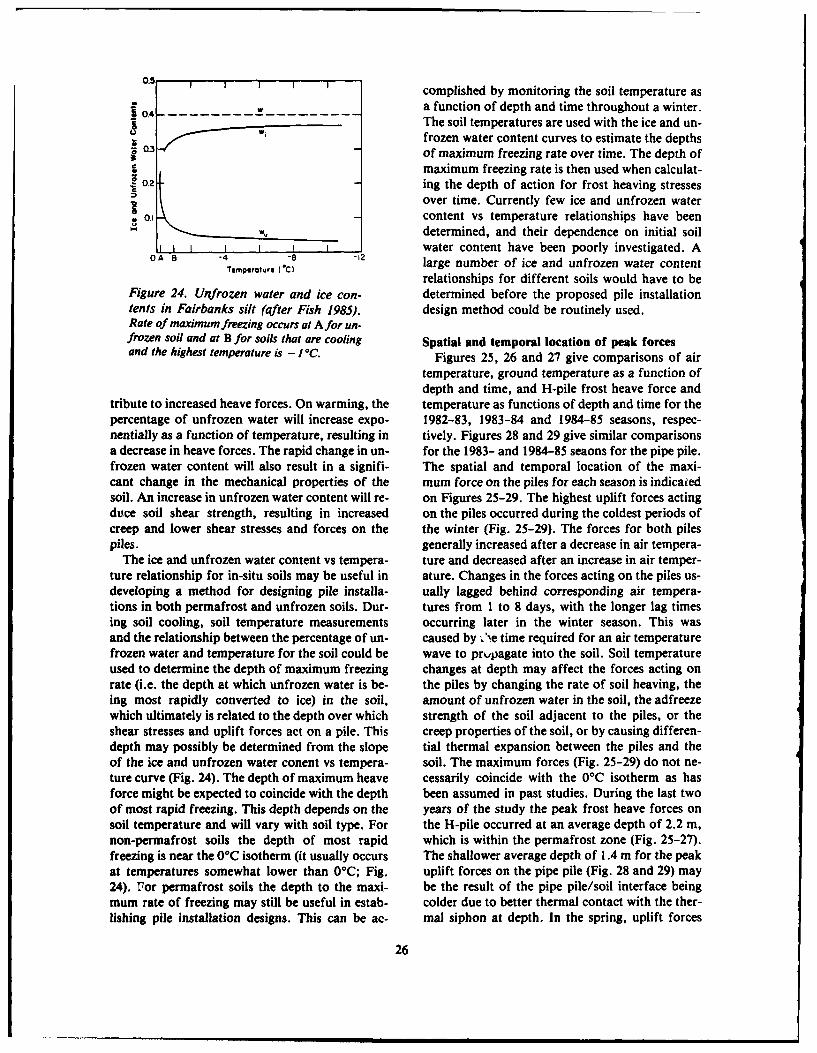
0. 1 1 '1 1 1complished by monitoring the soil temperature as2 Wa function of depth and time throughout a winter.
o4 ------------------- The soil temperatures are used with the ice and un-
frozen water content curves to estimate the depths3-" of maximum freezing rate over time. The depth of
maximum freezing rate is then used when calculat-0.2 ing the depth of action for frost heaving stresses
over time. Currently few ice and unfrozen waterV
o content vs temperature relationships have been, u determined, and their dependence on initial soil
water content have been poorly investigated. AOA B -4 -,,-12 large number of ice and unfrozen water content
relationships for different soils would have to beFigure 24. Unfrozen water and ice con- determined before the proposed pile installationtents in Fairbanks silt (after Fish 1985). design method could be routinely used.Rate of maximum freezing occurs at A for un-frozen soil and at B for soils that are cooling Spatial and temporal location of peak forcesand the highest temperature is - I°C. Figures 25, 26 and 27 give comparisons of air
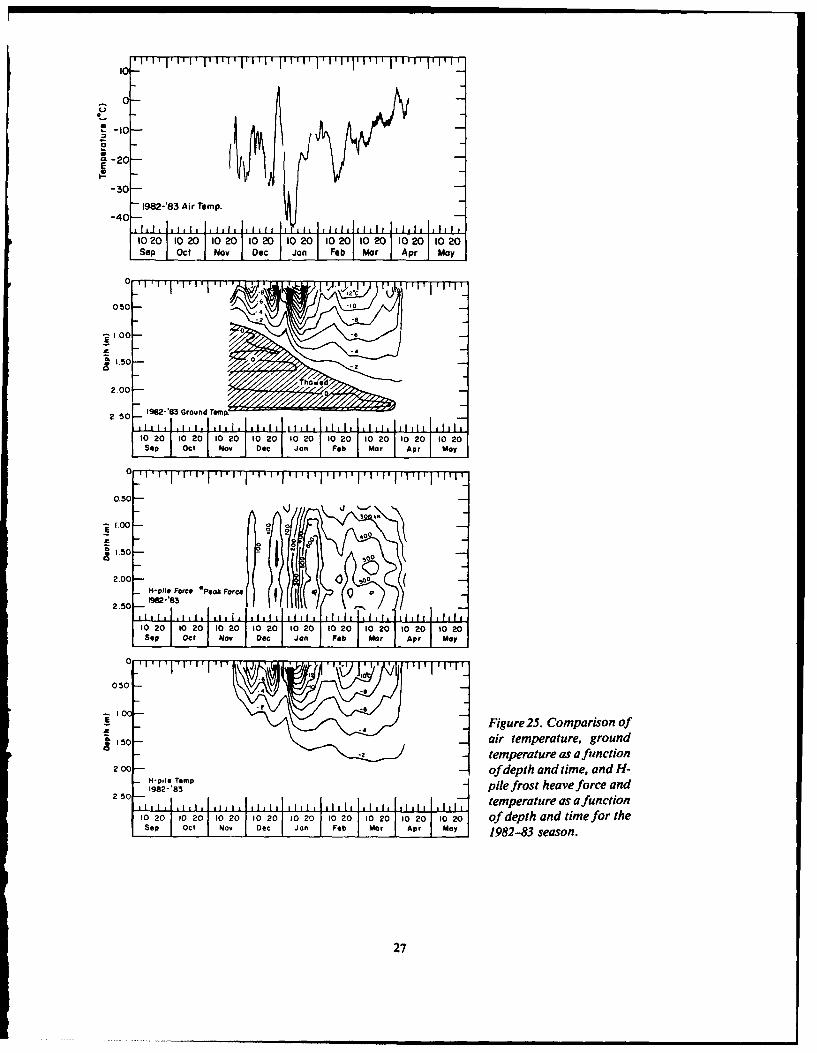
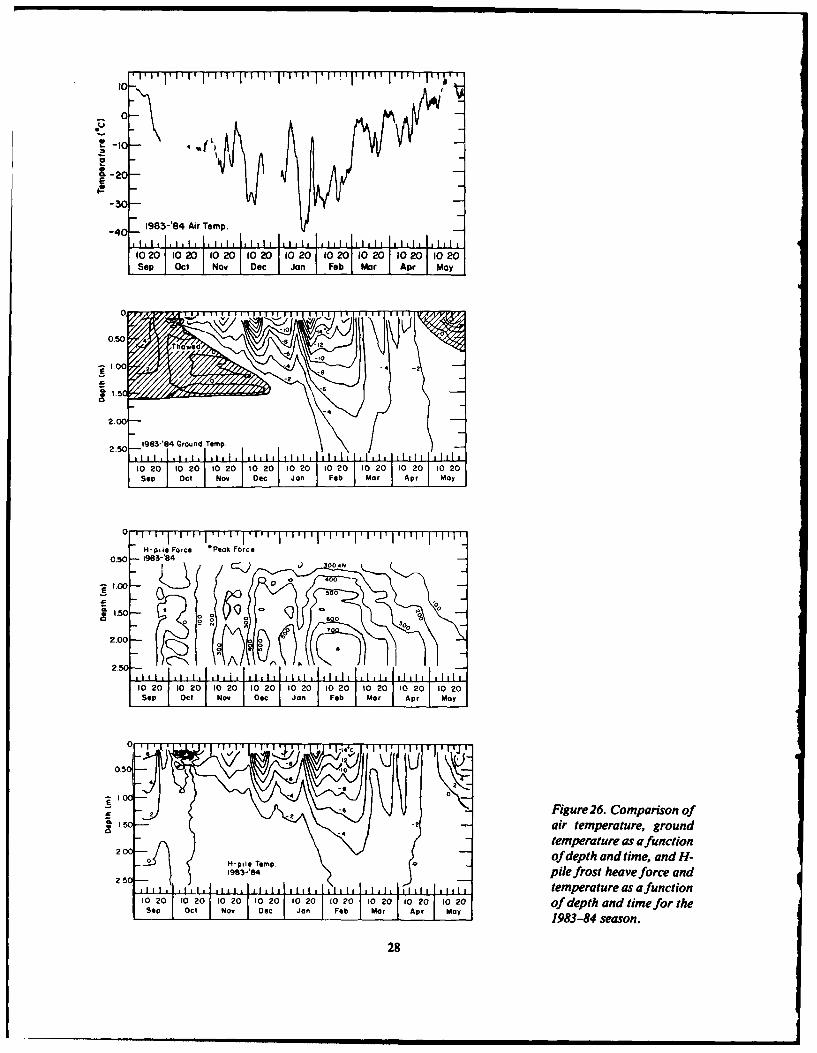
temperature, ground temperature as a function ofdepth and time, and H-pile frost heave force and
tribute to increased heave forces. On warming, the temperature as functions of depth and time for thepercentage of unfrozen water will increase expo- 1982-83, 1983-84 and 1984-85 seasons, respec-nentially as a function of temperature, resulting in tively. Figures 28 and 29 give similar comparisonsa decrease in heave forces. The rapid change in un- for the 1983- and 1984-85 seaons for the pipe pile.frozen water content will also result in a signifi- The spatial and temporal location of the maxi-cant change in the mechanical properties of the mum force on the piles for each season is indicatedsoil. An increase in unfrozen water content will re- on Figures 25-29. The highest uplift forces actingduce soil shear strength, resulting in increased on the piles occurred during the coldest periods ofcreep and lower shear stresses and forces on the the winter (Fig. 25-29). The forces for both pilespiles. generally increased after a decrease in air tempera-
The ice and unfrozen water content vs tempera- ture and decreased after an increase in air temper-ture relationship for in-situ soils may be useful in ature. Changes in the forces acting on the piles us-developing a method for designing pile installa- ually lagged behind corresponding air tempera-tions in both permafrost and unfrozen soils. Dur- tures from 1 to 8 days, with the longer lag timesing soil cooling, soil temperature measurements occurring later in the winter season. This wasand the relationship between the percentage of un- caused by -.,e time required for an air temperaturefrozen water and temperature for the soil could be wave to prupagate into the soil. Soil temperatureused to determine the depth of maximum freezing changes at depth may affect the forces acting onrate (i.e. the depth at which unfrozen water is be- the piles by changing the rate of soil heaving, theing most rapidly converted to ice) in the soil, amount of unfrozen water in the soil, the adfreezewhich ultimately is related to the depth over which strength of the soil adjacent to the piles, or theshear stresses and uplift forces act on a pile. This creep properties of the soil, or by causing differen-depth may possibly be determined from the slope tial thermal expansion between the piles and theof the ice and unfrozen water conent vs tempera- soil. The maximum forces (Fig. 25-29) do not ne-ture curve (Fig. 24). The depth of maximum heave cessarily coincide with the 0°C isotherm as hasforce might be expected to coincide with the depth been assumed in past studies. During the last twoof most rapid freezing. This depth depends on the years of the study the peak frost heave forces onsoil temperature and will vary with soil type. For the H-pile occurred at an average depth of 2.2 m,non-permafrost soils the depth of most rapid which is within the permafrost zone (Fig. 25-27).freezing is near the 0°C isotherm (it usually occurs The shallower average depth of 1.4 m for the peakat temperatures somewhat lower than 0°C; Fig. uplift forces on the pipe pile (Fig. 28 and 29) may24). For permafrost soils the depth to the maxi- be the result of the pipe pile/soil interface beingmum rate of freezing may still be useful in estab- colder due to better thermal contact with the ther-lishing pile installation designs. This can be ac- mal siphon at depth. In the spring, uplift forces
26
10
0-
-20-E
-30-
- 982-'83 Air Temp.-40
10 0 t 2010 20 10 20 10 20 10 20 10 20 10 20 10 20Sp Ot Nov Doc Jon Feb Mar Apr May
0I 1b 111fil00
050- ,
a, 1.50 0
2 00
10 20 10 20 10 20 10 20110 20 10 20 10 20 10 20 10 20
-P Oct Nov Dec Jan Feb Mar Apr May
04
050 .
-.00
-gleFre Pa oc
Sop Figur 25. Coprio offr~o pr 112
-2 temprae as. C fmparion
200- of depth and time, and H-198-Po 83p pile frost heave force and
250- 8 temperature as afunction01 00 20 2010 20 10020 1020 10 20110 20F10 20 of depth and time for the
Sep ct ov Dc Jn Fe Ma Apr May 1982-83 season.
27
10
JU
0 -I
-P
-30-
-40 - 983-'84 Ai Temp.
I020 .10210 1020 I'l0 1Q201 (00(21102121
10 20110 20 1 0 20 11020 11020 1 0 201 020 10 201 1020Sep Oct Nov Dee Jon Feb Mar IApr May
0.50 958
2.00-
2.50- 931 rudTrp
10 20 020 10 20 10e20 10 20 10 20 1020 10 20 10 2Sp Oct Nov Dec Jan Feb Mar Apr May
050
2.002
III I 0i
S Fiur 26. Comparisonofy
VI 'I ai tepraue grun
2f tempeurae as afmntison
_0 20il 102 0201 0102 O201 0102 02 of depth and time for tHe
Sop Oc Nv De Ja-e a p a 1983-84 season.
28
10 ' . 1 1 1 1 I I ] I I I I I I 1 1 1 1 1 1 1 1 1
0
-- 20-
-so0
-40- 984-'85 Air Temp.
P ~10 20 1020110 20 1020 11020 10 201 10 20 110 20 110 20Sep Oct JNov Dec Jon Feb Mar Apr May
hae
2.0 984-'85 Ground Temp. 4-
1020 10 20 10 20 10 20 10 0 020 10 20 10 20 10 20Sep Ot Nv 0c Jon Fe Mar Ap My
0 11 I '
11 '
'1 1 1 I
I III I ' I '- H-P.I1 Force 'Peaki Force
050- 1984- 85 ~ )
i~oO 0
0 0o000
2.00 -
10020 10 20 10020 10020 -10020 1-020 10020 10 20 1020Sep Oct Nov Dec Jon Feb Mar Apr May
0 -
0.50 -
100-2o -4 iue7 oprsno5-6Fiue27Coprsno
1 .50 air temperature, ground-2- temperature as afunction
2,00 of depth and time, and H-H-p. I* Temp. pl rs ev oc n
2.0 1984-'85 pl rs ev oc n
2.501,1 11.11.11111 I 1111 I Ii~iIii~temperature as afunction10 20 10 20 10020 10020 10020110020 10 20 10 20 020 of depth and time for theSepI Oct Nov Dec Jon Feb Mr Ar May 1984-85 season.
29

TIII I l1 t I II III Ili1 I i I ' I 1 11111 7-
-10-
c-20-
-30-
-40 - 983-'84 Air Temp.
10 20 10 20 10 20 10 20 10 20 10 20 10 20 10 20 10 20Sep Oct Nov Dec Jon Feb Mar Ar May
10 4 -
00
25 -198384 Ground Temnp.
1020 10O201 10 20 10 20 a2 10 20 10 20 1 0 020 T020Sep Oct Nov Dec Jon Feb Mar Apr Mon
Pipe Pile Force Peok Force050 1983-'84
too -o
150
20 0200
20 50
02120 0 0 020 1020 TO020 10A20 10 20Se c o Dc Jon Feb Ma Apr May
1 0 0 - Figure 28. Comparison of
50 Pe ~6 -2- air temperature, ground
200- / of depth anditime, andJ ~ _\ pi eefrost heave force2 50 1983-'84 and temperature as a
1, 1 . 1 1 1.1. , . I1 1 1 1,1, 11, .1)_function of depth and1 0 20 1 OC20 110 20 10 20 10 20 10 20 10020 10 20 10 20Sep Oct INov Dec "on Felb Mar Apr IMay time for the 1983-84 sea-
son.
30

10
c-20 ' \-j~I
-30 -
-40 1984-'85 Air Temp.
10 20T 020 4020 1020 10 20 10 201 10 20 110 20 14020Sep I Oct INov Dec ian Feb Mar Apr May
0
0 002 0220012 2 2
2. 1984-85GrudTm.-
.50 - 1984-'85'
600 700
2 50 ii iI02 2 00120 10020 10 20 10 20 10 20 10 20Sep Oc ov Dc Jn Feb Mar Apr May
0
050 \ 16
1-00 * Figure 29. Comparison of-2
10-2 temperature as afunction~I5 ~J-~6 of depth and time, and
200- ~ pipe pile frost heave force-pipe Pile romp adtmeauea
2 0 1984-'85 adtmeauea
1,1 110function of depth and102 O2 2 0 20 10.0 20 10.20 10 20 10020 time for the 1984-85 sea-sep Oct Nov Dec J n Feb Mo, Apr Moyp son.
31
are relieved from the surface down as the ground The forces and stresses resulting from the icewarms. A general reduction in force values also and gravel layers could not be determined directlyoccurs over the full length of the piles (Fig. 25-29). due to strain gauge malfunctions. The forces and
stresses were calculated indirectly and may be toohigh for the ice layer and consequently too low for
CONCLUSIONS the gravel layer.Maximum heaving forces and shear stresses oc-
Calculated forces, as determined from the in- curred during periods of maximum cold and soilstrumented piles, indicate that the magnitude of surface heave. These forces were not related to thefrost-heaving uplift forces acting on a pile increases depth of frost for most of the winter since the soilfrom the soil surface to a maximum value at adjacent to the piles was frozen to the permafrostdepth, then decreases due to the restraining action table. The forces for both piles generally increasedof the soil or permafrost on the pile (Fig. 22 and after a decrease in air temperature and decreased23). The depth of maximum forces does not neces- after an increase in air temperature. Changes insarily coincide with the 0°C isotherm, as has been forces acting on the piles usually lagged behindassumed in past studies. Therefore, average soil/ corresponding air temperature changes by severalpile shear stresses should be calculated on the basis days.of the pile surface area from the soil surface to the The highest rates of soil surface heave occurreddepth of the peak frost heave force when calculat- from the onset of heave in October to the end ofing shear stress from measured uplift forces. The December, and then the heave rates decreasedaverage depths of the maximum frost heave forces through the rest of the winter. Soil surface dis-were 2.2 m on the H-pile and 1.4 m on the pipe placements of 2 to 7 cm were measured at the ex-pile. The peak frost heave forces on the H-pile periment site.during the three winters of study were 752, 790 The important mechanisms that determine theand 802 kN. The peak frost heave forces on the magnitude of uplift heave forces are 1) soil heav-pipe pile during the second and third winter sea- ing as the driving force, and 2) soil temperature,sons of the study were 1118 and 1115 kN. Maxi- which controls the unfrozen water content, themum internal tensile stresses on the H-pile were mechanical properties of the soil and the area of48.5, 51.0 and 51.7 MPa during the three winters, influence of heaving pressures.Maximum internal tensile stresses on the pipe pile The higher forces and shear stresses on the pipewere 118.7 and 118.4 MPa for the second and pile in this study may be the result of the soil/pilethird winter seasons. The heave forces that may interface being colder than that of the H-pile be-have been contributed by the ice collars at the top cause of better thermal contact with the thermalof the piles during the 1982-83 and 1984-85 sea- siphon at depth. The pipe pile results are consid-sons were 151 and 118 kN, respectively, for the ered suspect until verified by further research.H-pile and 185 kN during the third winter season It is beyond the scope of this study to develop aon the pipe pile. The heave forces that may have method for designing pile installations in perma-been contributed by the gravel layer around the frost. However, an outline of how the results oftop of the H-pile during the 1983-84 and 1984-85 this study might be used to design pile installationsseasons were about 280 and 292 kN, respectively, is presented below.
Maximum average soil/pile shear stresses com- Past design methods for pile installations in soilputed on the basis of the "boxed in" surface area subjected to frost heaving have utilized the 0°Cof the H-pile from the soil surface to the depth of isotherm as the reference to determine average ex-peak frost heave force were 256, 348 and 308 kPa pected shear stresses and uplift forces. This meth-during the three winters. Maximum average soil/ od may not be useful when permafrost is presentpile shear stresses computed using the actual sur- and a unique 0°C isotherm does not exist. We sug-face areas of the piles from the soil surface to the gest an alternative method of designing pile instal-depth of the peak frost heave force were 157, 214 lations using the unfrozen water content-tempera-and 190 kPa during the three winters on the H-pile, ture relationship for the in-situ soil type. Duringand 627 and 972 kPa during the second and third soil cooling, soil temperature measurements andwinter seasons on the pipe pile. Calculated ice/pile the percent unfrozen water-temperature relation-shear stresses due to the ice collars aL the tops of ship for the soil could be used to determine thethe piles were 588 and 255 kPa for the H-pile and depth of maximum freezing rate (i.e. the depth at401 kPa for the pipe pile during the winters that which unfrozen water is being most rapidly con-ice collars were in place. verted to ice) in soil, which ultimately is related to
32
the depth over which shear stresses and uplift forc- erence to determine expected shear stresses andes act on a pile. This depth can be determined uplift forces. This method may not be useful infrom the slope of the ice and unfrozen water con- permafrost where a unique 0°C isotherm does nottent vs temperature curve (Fig. 24). The depth of exist.maximum heave force might be expected to coin- 4. The pipe pile results need verification and thecide with the depth of most rapid freezing. This effects of the thermal siphon should be studieddepth depends on the soil temperature and will further. A comparative approach is recommendedvary with soil type. For non-permafrost soils the that uses a pipe pile without a thermal siphon anddepth of most rapid freezing is near the 0°C iso- one with a thermal siphon. The adfreeze effects oftherm (it usually occurs at temperatures somewhat an ice layer and gravel backfill should also be in-lower than 0°C; Fig. 24). For permafrost soils the vestigated using a similar comparative approach.depth to the maximum rate of freezing may still be 5. The influence of ice collars and different filluseful in establishing pile installation designs. This materials should be further investigated. Straincan be accomplished by monitoring soil tempera- gauge malfunctions during this study prevented usture as a function of depth and time throughout a from determining the force contribution resultingwinter. The soil temperatures are used with the ice from the ice and gravel layers in a direct manner.and unfrozen water content curves to estimate thedepths of maximum freezing rate over time. Thedepth of maximum freezing rate is then used when LITERATURE CITEDcalculating the depth of action for frost heavingstresses. Anderson, D.M. and N.R. Morgenstern (1973)
Physics, chemistry and mechanics of frozenground. In Permafrost: North American Contri-
RECOMMENDATIONS bution to the Second International Conference,13-28July, Yakutsk, U.S.S.R. Washington, D.C.:
The following recommendations are offered at National Academy of Sciences, p. 257-288.the conclusion of this study: Crory, F.E. and R.E. Reed (1965) Measurement
1. The use of electric strain gauges as a method of frost heaving forces on piles. USA Cold Re-of measuring and determining frost heave forces gions Research and Engineering Laboratory,on piles is recommended, since they take uplift Technical Report 145. AD 484 955.and resistive shear stresses into account to deter- Dirksen, C. and P.J. Miller (1966) Closed-systemmine the magnitude of peak forces on a pile and freezing of unsaturated soils. Soil Science Societyprovide information concerning the spatial and of America Proceedings, 30: 168-173.temporal location of the forces. Soil/pile shear Domaschuk, L. (1982) Frost heave forces on em-stress distributions along the pile can be deter- bedded structural units. In Proceedings, Fourthmined from the results provided by this method. Canadian Permafrost Conference, p. 487-496.Quarter bridge gauge configurations and redun- Esch, D.C. (1982) Thawing of permafrost by pas-dant strain gauges are recommended to provide sive solar means. In Proceedings, Fourth Cana-better reliability, allow for easier data interpreta- dian Permafrost Conference, p. 560-569.tion and accommodate the relatively high failure Esch, D.C. (1983) Permafrost prethawing by sur-rate of strain gauges. Gauge calibration is required face modification. Alaska Department of Trans-at the beginning and end of the experiment to veri- portation Report AK-RD-83-23.fy the applicability of the initial calibration. Fish, A.M. (1985) Creep strength, strain rate, tem-
2. Further evaluation should be made of the perature and unfrozen water relationship in frozenH-pile data set, as this may lead to a method of es- soil. In Proceedings, Fourth International Sym-timating the depth and timing of the peak force posium on Ground Freezing, Sapporo, Japan,that would take into account the effect of unfro- vol. 2, p. 29-36.zen water on the frost heave forces. Johnson, J.B. and D.C. Esch (1985) Frostjacking
3. Continued research on the unfrozen water- forces on H- and pipe piles embedded in Fair-temperature relationship for frost-susceptible soils banks silt. In Proceedings, Fourth Internationalis recommended, as it may contribute to a better Symposium on Ground Freezing, Sapporo, Japan,method of designing pile installations in perma- vol. 2, p. 125-133.frost and non-permafrost regions. Present design Johnston, G.H. and B. Ladanyl (1972) Field stud-methods for pile installations in soils subjected to ies of grouted rod anchors in permafrost. Cana-frost heaving utilize the 0°C isotherm as the ref- dian Geotechnical Journal, 9(2): 176-194.
33
Kinosita, S. (1967) Heaving force of frozen soils. mafrost, 17-22 July, Fairbanks, Alaska. Wash-In Proceedings, International Conference on Low ington, D.C.: National Academy Press, p.Temperature Science, vol. 11, p. 1345-1360. 979-983.Kinosita, S. and T. Ono (1963) Heaving forces of Penner, E. and W.W. Irwin (1969) Adfreezing offrozen ground. Mainly on the results of field re- Leda clay to anchored footings columns. Cana-search. Low Temperature Science Laboratory dian Geotechnical Journal, 6(3): 327-337.Teron Kagaku, Ser. A-21, p. 117-139. (National Piwi, T.L. (1982) Geologic hazards in the Fair-Research Council Technical Translation 1246, banks area, Alaska. Alaska Geological and Geo-1966.) physical Surveys, Special Report 15.Kinosita, S., Y. Suzuki, K. Horiguchi and M. Fu- Saltykov, N.I. (1944) Calculating frost heavingkuda (1978) Observations of frost heaving action forces on foundations. Izvestiia Akademia Naukin the experimental site, Tomakamai, Japan. In SSSR, Oldelenie Tekhnickeskikh Nauk, No. 6:Proceedings of the Third International Confer- 305-412. (Library of Congress, SIPRE Bibliog-ence on Permafrost, July 10-13, 1978, Edmonton, raphy Project, Translation 46.)Alberta, Canada, vol. 1, p. 676-678. Sohlberg, E.T. (1965) Strain gage instrumentationLinell, K.A. (1973) Long-term effects of vegeta- of steel piles in snow. USA Cold Regions Researchtion cover on permafrost stability in an area of and Engineering Laboratory, Technical Reportdiscontinuous permafrost. In Permafrost: North 152. AD 615 996.American Contribution to the Second Interna- Sutherland, H.B. and P.N. Gaskin (1973) Pore-tional Conference, 13-28 July, Yakutsk, U.S.S.R. water and heaving pressures developed in partiallyWashington, D.C.: National Academy of Sci- frozen soils. In Permafrost: North American Con-ences, p. 688-693. tribution to the Second International Conference,Oliphant, J.L., A.R. Tice and Y. Nakano (1983) 13-28July, Yakutsk, U.S.S.R. Washington, D.C.:Water migration due to a temperature gradient in National Academy of Sciences, p. 409-419.frozen soil. In Proceedings, 4th International Con- Tice, A.R., J.L. Oliphant, Y. Nakano and T.F.ference on Permafrost, 17-22 July, Fairbanks, Jenkins (1982) Relationship between the ice andAlaska. Washington, D.C.: National Academy unfrozen water phases in frozen soil as determinedPress, p. 951-956. by phased nuclear magnetic resonance and physi-Paterson, W.S.B. (1981) The Physics of Glaciers. cal desorption data. USA Cold Regions ResearchNew York: Pergamon Press, p. 20-41. and Engineering Laboratory, CRREL Report 82-Penner, E. (1970) Frost heaving forces in Leda 15. ADA 118 486.clay. Canadian Geotechnical Journal, 7(1): 8-16. Trow, W.A. (1955) Frost action on small footings.Penner, E. (1972) Influence of freezing rate on Highway Research Board Bulletin No. 100, p. 22-frost heaving. Highway Research Board Record, 27.No. 393: 56-64. Tsytovich, N.A. (1975) The Mechanics of FrozenPenner, E. (1974) Uplift forces on foundations in Ground. New York: McGraw-Hill Book Co., p.frost heaving soils. Canadian Geotechnical Jour- 157-162.nal, 11(3): 323-338. Yong, R.N. (1967) On the relationship betweenPenner, E. and L.W. Gold (1971) Transfer of partial soil freezing and surface forces. In Pro-heaving forces by adfreezing to columns and foun- ceedings, International Conference on Low Tem-dation walls in frost-susceptible soils. Canadian perature Science, vol. 11, p. 1376-1385.Geotechnical Journal, 8(4): 514-526. Yong, R.N. and J.C. Osler (1971) Heaving andPenner, E. and L.E. Goodrich (1983) Adfreezing heaving pressures in frozen soils. Canadian Geo-stresses on steel piles, Thompson, Manitoba. In technical Journal, 8(2): 272-282.Proceedings, 4th International Conference on Per-
34
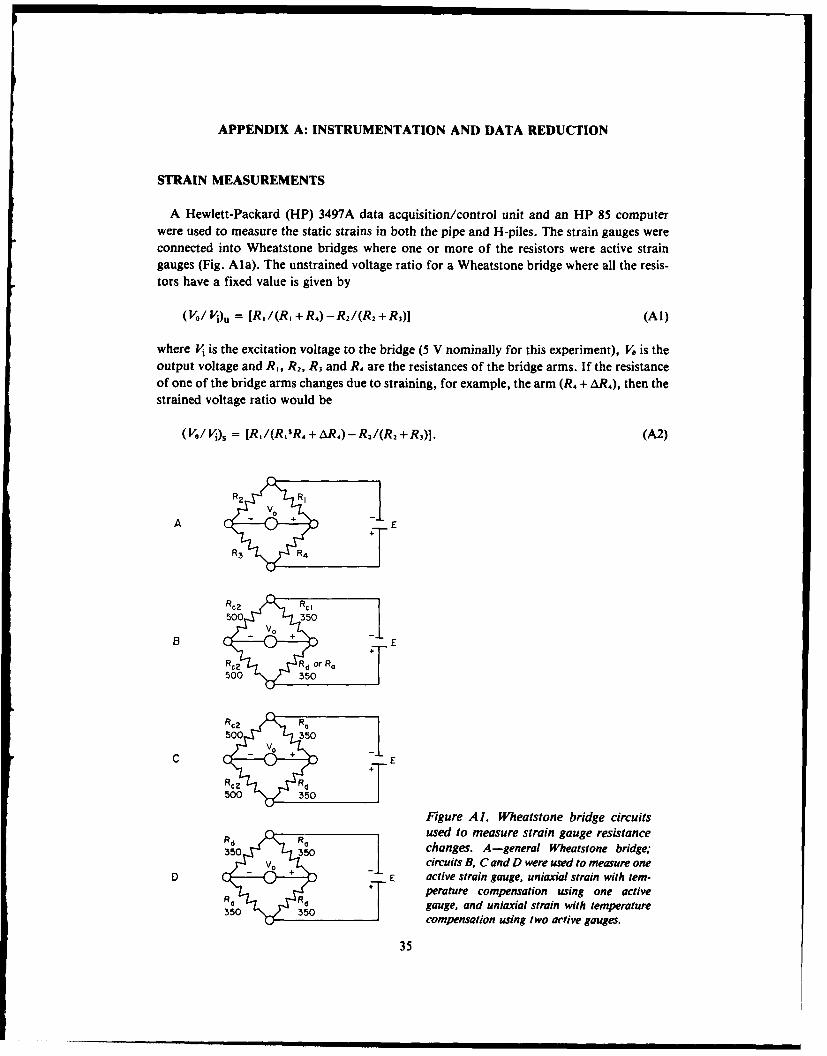
APPENDIX A: INSTRUMENTATION AND DATA REDUCTION
STRAIN MEASUREMENTS
A Hewlett-Packard (HP) 3497A data acquisition/control unit and an HP 85 computerwere used to measure the static strains in both the pipe and H-piles. The strain gauges wereconnected into Wheatstone bridges where one or more of the resistors were active straingauges (Fig. Ala). The unstrained voltage ratio for a Wheatstone bridge where all the resis-tors have a fixed value is given by
(V/ V)u = R,/(R, +R,)-R 2/(R 2 +R 3 )I (Al)
where Vi is the excitation voltage to the bridge (5 V nominally for this experiment), V is theoutput voltage and R,, R 2, R3 and R4 are the resistances of the bridge arms. If the resistanceof one of the bridge arms changes due to straining, for example, the arm (R. + AR,), then thestrained voltage ratio would be
(V/Vi), = [RI/(RIR 4+ AR 4)- R2/(R 2 + R3 )]. (A2)
B - +- ERc2 R,
500 '-350
V0
500 350
Figure AlI. Wheatstone bridge circuitsRd _R, ° i used to measure strain gauge resistance~changes. A-general Wheatstone bridge;
-I circuits B, C and D were used to measure oneD E active strain gauge, uniaxial strain with tem-
perature compensation using one activeRo -Lff . Rd gauge, and uniaxial strain with temperature350 350compensation using two active gauges.
35
... .... . . .C Rmmm mmum N IN I
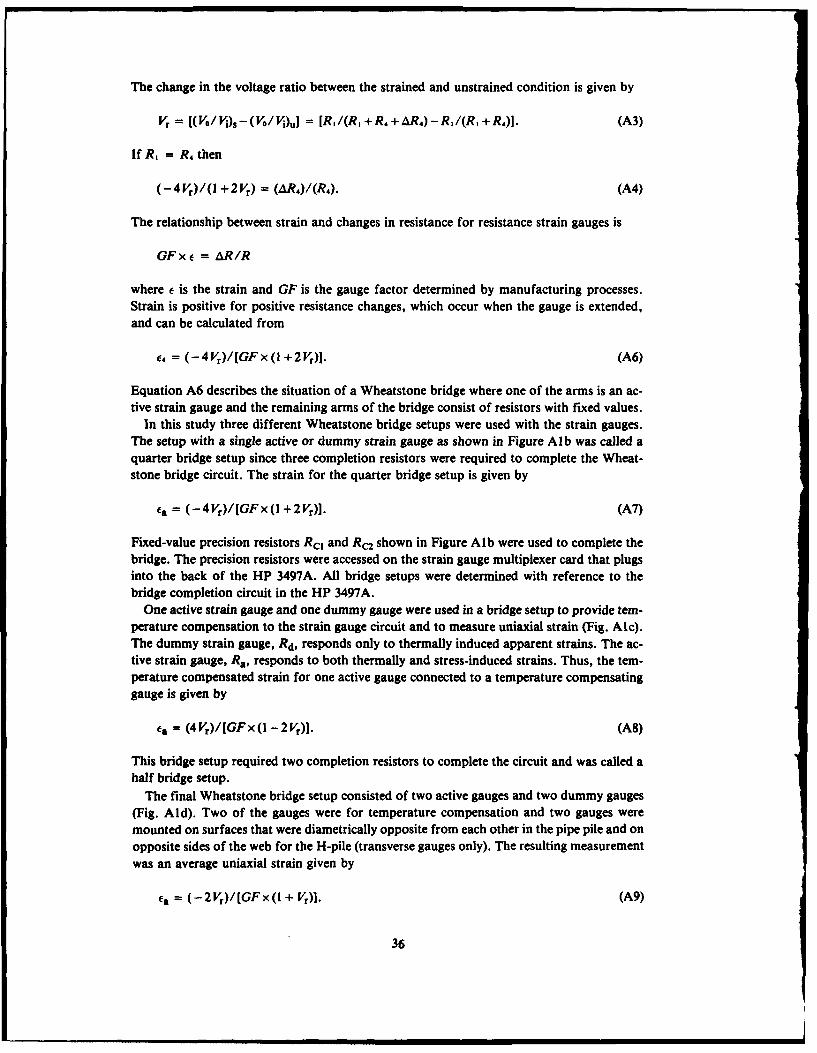
The change in the voltage ratio between the strained and unstrained condition is given by
Vr = [(Vo/Vi)s-(Vo/Vi)u] = [R/, (R, +R 4 R4)-R , (R, +R,)]. (A3)
If R, = R. then
(-4 Vr)l(l + 2 Vr) = (AR,)I(R,). (A4)
The relationship between strain and changes in resistance for resistance strain gauges is
GF x c = AR/R
where c is the strain and GF is the gauge factor determined by manufacturing processes.Strain is positive for positive resistance changes, which occur when the gauge is extended,and can be calculated from
e4 = (- 4 Vr)/[GF x (l + 2 Vr)]. (A6)
Equation A6 describes the situation of a Wheatstone bridge where one of the arms is an ac-tive strain gauge and the remaining arms of the bridge consist of resistors with fixed values.
In this study three different Wheatstone bridge setups were used with the strain gauges.The setup with a single active or dummy strain gauge as shown in Figure AIb was called aquarter bridge setup since three completion resistors were required to complete the Wheat-stone bridge circuit. The strain for the quarter bridge setup is given by
a = (-4V)/[GFx (I +2Vr)]. (A7)
Fixed-value precision resistors Rc, and Rc2 shown in Figure Alb were used to complete thebridge. The precision resistors were accessed on the strain gauge multiplexer card that plugsinto the back of the HP 3497A. All bridge setups were determined with reference to thebridge completion circuit in the HP 3497A.
One active strain gauge and one dummy gauge were used in a bridge setup to provide tem-perature compensation to the strain gauge circuit and to measure uniaxial strain (Fig. Akc).The dummy strain gauge, Rd, responds only to thermally induced apparent strains. The ac-tive strain gauge, Ra, responds to both thermally and stress-induced strains. Thus, the tem-perature compensated strain for one active gauge connected to a temperature compensatinggauge is given by
(4 V)/[GF x (I - 2 V)]. (AS)
This bridge setup required two completion resistors to complete the circuit and was called ahalf bridge setup.
The final Wheatstone bridge setup consisted of two active gauges and two dummy gauges(Fig. Aid). Two of the gauges were for temperature compensation and two gauges weremounted on surfaces that were diametrically opposite from each other in the pipe pile and onopposite sides of the web for the H-pile (transverse gauges only). The resulting measurementwas an average uniaxial strain given by
c (-2Vr)/[GFX(I + Vr)]. (A9)
36
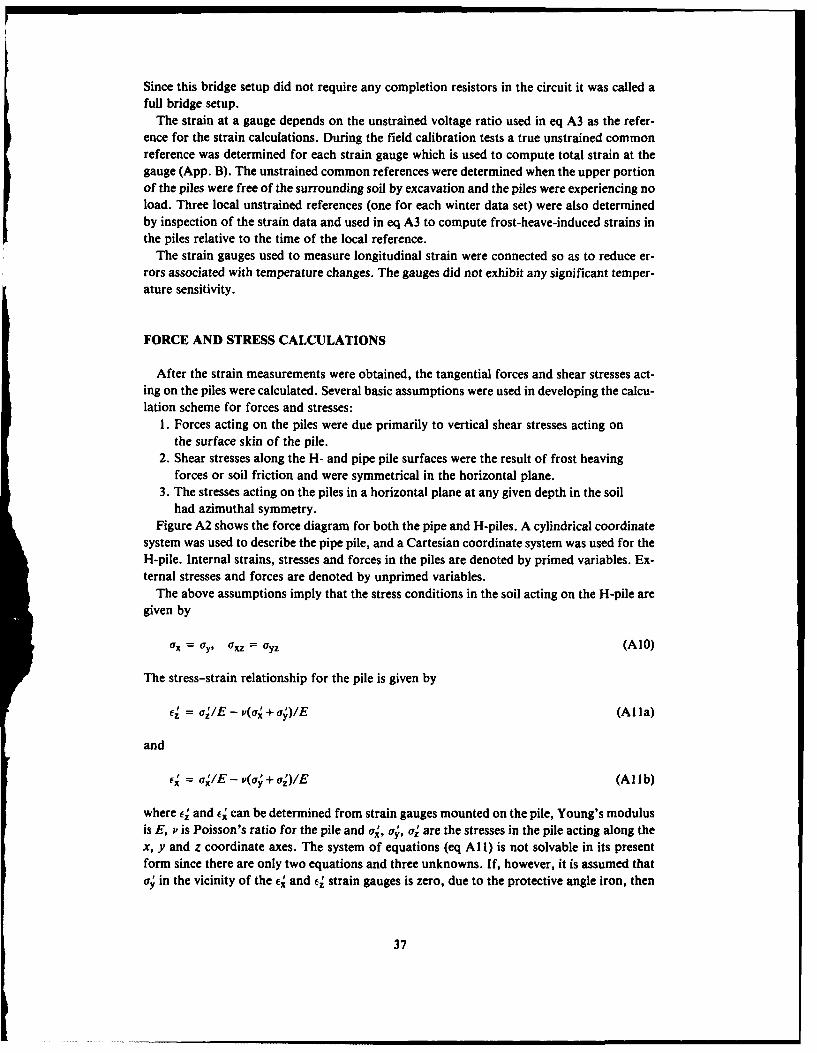
Since this bridge setup did not require any completion resistors in the circuit it was called afull bridge setup.
The strain at a gauge depends on the unstrained voltage ratio used in eq A3 as the refer-ence for the strain calculations. During the field calibration tests a true unstrained commonreference was determined for each strain gauge which is used to compute total strain at thegauge (App. B). The unstrained common references were determined when the upper portionof the piles were free of the surrounding soil by excavation and the piles were experiencing noload. Three local unstrained references (one for each winter data set) were also determinedby inspection of the strain data and used in eq A3 to compute frost-heave-induced strains inthe piles relative to the time of the local reference.
The strain gauges used to measure longitudinal strain were connected so as to reduce er-rors associated with temperature changes. The gauges did not exhibit any significant temper-ature sensitivity.
FORCE AND STRESS CALCULATIONS
After the strain measurements were obtained, the tangential forces and shear stresses act-ing on the piles were calculated. Several basic assumptions were used in developing the calcu-lation scheme for forces and stresses:
1. Forces acting on the piles were due primarily to vertical shear stresses acting onthe surface skin of the pile.
2. Shear stresses along the H- and pipe pile surfaces were the result of frost heavingforces or soil friction and were symmetrical in the horizontal plane.
3. The stresses acting on the piles in a horizontal plane at any given depth in the soilhad azimuthal symmetry.
Figure A2 shows the force diagram for both the pipe and H-piles. A cylindrical coordinatesystem was used to describe the pipe pile, and a Cartesian coordinate system was used for theH-pile. Internal strains, stresses and forces in the piles are denoted by primed variables. Ex-ternal stresses and forces are denoted by unprimed variables.
The above assumptions imply that the stress conditions in the soil acting on the H-pile aregiven by
0x = LY, oXZ= 6yz (AIO)
The stress-strain relationship for the pile is given by
e = a/E -v(x + a,)/E (Al la)
and
X = alE - v(a + az')/E (A1 lb)
where ez and Ex' can be determined from strain gauges mounted on the pile, Young's modulusis E, P is Poisson's ratio for the pile and o, ou, o are the stresses in the pile acting along thex, y and z coordinate axes. The system of equations (eq A 1l) is not solvable in its presentform since there are only two equations and three unknowns. If, however, it is assumed thatay' in the vicinity of the cx' and e strain gauges is zero, due to the protective angle iron, then
37
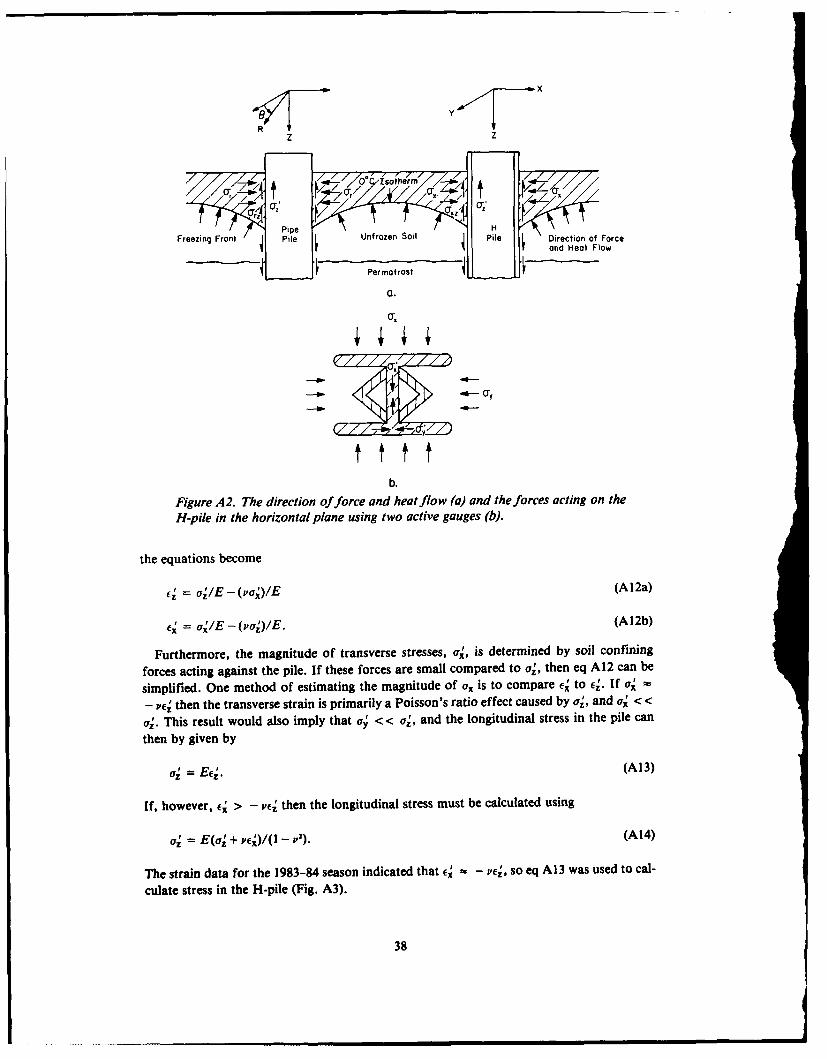
IV x
z z
PipeH
Freezing Front Pile Unfrozen Soil Pile Direction of Forceand Heat Flow
a.
b.
Figure A2. The direction of force and heat flow (a) and the forces acting on theH-pile in the horizontal plane using two active gauges (b).
the equations become
z = azlE - (va')lE (Al2a)
6,' = a,'lE - (Pa,')lE. (Al2b)
Furthermore, the magnitude of transverse stresses, a,, is determined by soil confining
forces acting against the pile. If these forces are small compared to a,, then eq A12 can be
simplified. One method of estimating the magnitude of a. is to compare e,' to E,. If a'
- ve, then the transverse strain is primarily a Poisson's ratio effect caused by a,, and ,' < <
a'. This result would also imply that uy < < a,, and the longitudinal stress in the pile can
then by given by
q, = Ee. (A13)
If, however, E > - v ' then the longitudinal stress must be calculated using
S= E(,+ v)/(- '). (Al4)
The strain data for the 1983-84 season indicated that c ft - P'e, so eq A13 was used to cal-
culate stress in the H-pile (Fig. A3).
38
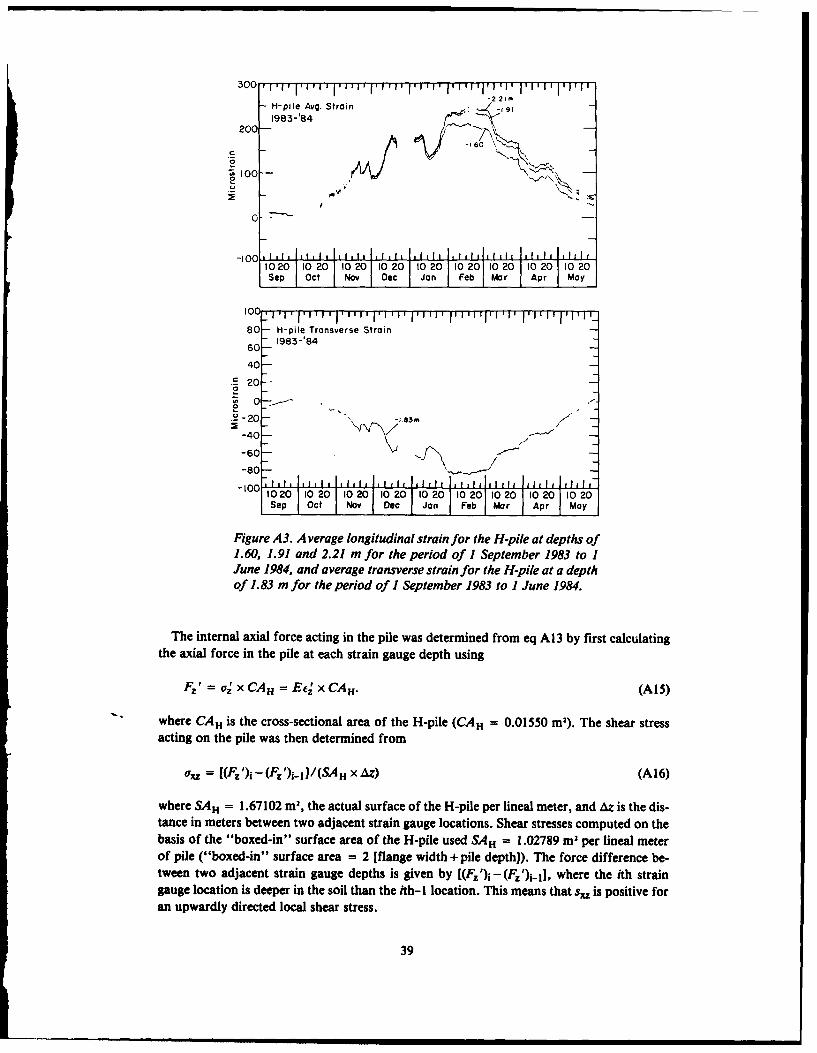
-22.20
-H-pile Avg. Strain 19sj
983-'84
0--
.5 20
-40"60.
-80--10 -1I'III' ' I L 1LI I I 1 1 1 l I t I -1020 1020 20 1020 1020 1020 1020 10 20 10 20
Soep Oct Nov Dec Jan Feb Mar Apr May
Figure A3. Average longitudinal strain for the H-pile at depths of1.60, 1.91 and 2.21 m for the period of I September 1983 to IJune 1984, and average transverse strain for the H-pile at a depthof 1.83 m for the period of I September 1983 to 1 June 1984.
The internal axial force acting in the pile was determined from eq Al 3 by first calculatingthe axial force in the pile at each strain gauge depth using
Fz' = uz x CA1 = Ee x CAH. (AI5)
where CA n is the cross-sectional area of the H-pile (CAH = 0.01550 M2). The shear stressacting on the pile was then determined from
OrXz = [(Fz) - (Fz')i-I I/(SA H X AZ) (A16)
where SA H = 1.67102 m2, the actual surface of the H-pile per lineal meter, and AZ is the dis-tance in meters between two adjacent strain gauge locations. Shear stresses computed on thebasis of the "boxed-in" surface area of the H-pile used SAH = 1.02789 M 2 per lineal meterof pile ("boxed-in" surface area = 2 [flange width + pile depth]). The force difference be-tween two adjacent strain gauge depths is given by [(F')i - (F%')i_1 , where the ith straingauge location is deeper in the soil than the ith- I location. This means that sxz is positive foran upwardly directed local shear stress.
39
Calculating the shear stresses for the pipe pile was done in a similar manner as for theH-pile. The stress conditions along the pipe/soil interface are given, due to the assumptionsof the problem, by
ar = vo, and q, = aze. (A17)
The strains for the pipe pile are given by
ej = (ae- vo)/E (AI 8a)
and
ez = (or= - veao)/E. (AI 8b)
The radial component of stress, a,, is zero since the strain gauges are mounted on a free sur-
face.Analysis of the 1982-83 winter's records indicated that, for large magnitude changes in E,
eg' - ez. Therefore a' < < az and the stress in the pipe pile was determined from
oz = Eel. (19)
The tangential force and shear stresses on the pile were then calculated from
Fx ' = x= x CAP (A20)
or, = [(F') - (F')i-l/(SApx AZ) (A21)
where CAP = 0.00942 m2 is the cross-sectional area of the pipe pile, SAP = 1.01740 m" is the
surface area per lineal meter of the pile and Az is the distance in meters between adjacentstrain gauges.
TEMPERATURE MEASUREMENTS
Both thermocouples and thermistors were used to measure temperatures. Thermocouple
voltages were referenced against a thermocouple compensation unit built into the HP 3497A
multiplexer card. The compensated voltages were converted to degrees Celsius using the HP
85 computer/controller and outputted to a storage tape. The resistance of the thermistors was
measured using a 10-,uA constant current source provided by the HP 3497A, which was acti-
vated only during the measurement period. The calibration of each thermistor was checked
at the freezing point prior to their installation. The 0°C thermistor resistance data were then
used to adjust the manufacturer's calibration curve for the thermistors. The temperature in
kelvins was calculated from
I/T = A +B(InR) + COnR)I (A22)
where T is the temperature in kelvins and R is the thermistor resistance. A, B and C are coef-
ficients that are calculated from the corrected calibration curve for each thermistor:
A = y, - Bx, - Cx? (A23)
40
B (XI -xI)(y -Y2) - (Y, -Y3)(XI - X3)(xI - x2)(x. - XI) - (x. - x3 )(x? - xi) (A24)
- (x - X,)(yI YO - (xI -x)(y, -y')(x, - x,)(xI - Xl) - (X3- )(X, - x,) (A25)
wherey, = I/T, y 2 = I/T 2, y3 = /T, x, = lnR, x 2 = lnR 2 and x3 = lnR 3 .For this study the corrected resistances R, R 2 and R3 for three temperatures 273.15K,
268.15K and 263.15K were used to calculate the A, B and C coefficients for each thermistor.Equation A22 was then used to calculate soil temperatures from the thermistor data.
41

APPENDIX B: CALIBRATION TEST RESULTS FOR THE H- AND PIPE PILES
Both the H-pile and pipe piles were initially cali- the piles was the ground support beneath thebrated in compression from 0 to 44.5 kN. The ini- crane. As the load increased, the crane's outrig-
tial calibration tests were conducted prior to in- gers and supports were forced deeper into the
stalling the piles at the test site in order to deter- ground. Both piles were incrementally loaded inmine an effective Young's modulus and Poisson'; tension from zero to the maximum load that couldratio for each strain gauge. A reaction beam load- be maintained and then incrementally unloaded.ing device consisting of a 44.5-kN hydraulic cylin- A 444.8-kN calibrated load cell was used to meas-der, 44.5-kN calibrated load cell and loading plat- ure the load applied by the crane. Each test load
ens constrained by four 1.9-cm-diam steel rodswas used to load both the pipe-and H-piles. Theinstrumented section of the pipe pile was continu-ously supported along its 2.7-m length and the9.0-m-long H-pile was supported every 0.3 m dur-ing the loading tests. Figure BI shows the loadingframe and data acquisition system used in the ini-tial calibration test on the pipe pile. The initial cal-ibration results were used until the field calibra-tion was done in order to analyze the data duringthe 1982-83 and 1983-84 data collection seasons.
A concern throughout the study was the contin-ued applicability of the initial calibration results tothe analysis of the data. Several gauges were knownto have been damaged during a lightning storm inthe summer of 1983, and the concern was that thismay have caused a calibration change in some ofthe undamaged gauges. Field calibration testswere conducted on 20-21 June 1985 to determineif there had been any change in the response char-acteristics of the gauges. The frozen ground sur-rounding the upper 3.7 m of the piles was thawedwith steam thaw points (Fig. B2) and excavatedaway from the piles. The piles at depth were stillfrozen and anchored into the permafrost but nowcompletely free of the surrounding soil throughoutthe upper instrumented section. During the soilthawing period and throughout the calibrationtests the ground and pile temperatures were care-fully monitored to maintain the frozen conditionof the piles at depth. A tensile load was applied tothe piles with a crane pulling vertically against therestraining forces holding the pile in the perma-frost at depth. Both piles were carefully monitoredto ensure that no vertical displacement occurredduring the test loading and that the loading wastruly vertical with no induced bending on the piles.The maximum tensile loads applied during thefield calibration were 113 and 81 kN, respectively, Figure BI. Load frame and data acquisition systemon the H- and pipe piles. The limiting factor af- used in the initial compression calibration tests (pipefecting the maximum load that could be applied to pile calibration).
43
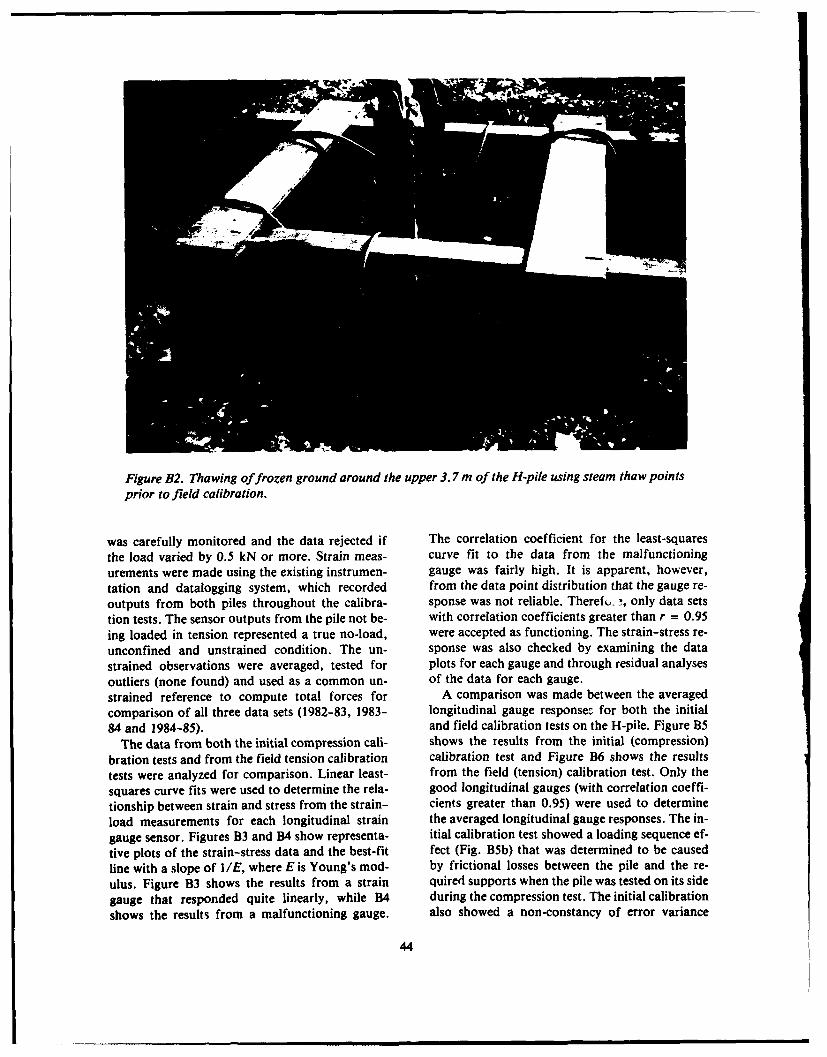
Figure B2. Thawing of frozen ground around the upper 3.7 m of the H-pile using steam thaw pointsprior to field calibration.
was carefully monitored and the data rejected if The correlation coefficient for the least-squaresthe load varied by 0.5 kN or more. Strain meas- curve fit to the data from the malfunctioning
urements were made using the existing instrumen- gauge was fairly high. It is apparent, however,tation and datalogging system, which recorded from the data point distribution that the gauge re-outputs from both piles throughout the calibra- sponse was not reliable. Therefu -, only data setstion tests. The sensor outputs from the pile not be- with correlation coefficients greater than r = 0.95ing loaded in tension represented a true no-load, were accepted as functioning. The strain-stress re-unconfined and unstrained condition. The un- sponse was also checked by examining the datastrained observations were averaged, tested for plots for each gauge and through residual analysesoutliers (none found) and used as a common un- of the data for each gauge.
strained reference to compute total forces for A comparison was made between the averagedcomparison of all three data sets (1982-83, 1983- longitudinal gauge responses for both the initial84 and 1984-85). and field calibration tests on the H-pile. Figure B5
The data from both the initial compression cali- shows the results from the initial (compression)
bration tests and from the field tension calibration calibration test and Figure B6 shows the results
tests were analyzed for comparison. Linear least- from the field (tension) calibration test. Only the
squares curve fits were used to determine the rela- good longitudinal gauges (with correlation coeffi-
tionship between strain and stress from the strain- cients greater than 0.95) were used to determine
load measurements for each longitudinal strain the averaged longitudinal gauge responses. The in-
gauge sensor. Figures B3 and B4 show representa- itial calibration test showed a loading sequence ef-
tive plots of the strain-stress data and the best-fit fect (Fig. BSb) that was determined to be causedline with a slope of I 1E, where E is Young's mod- by frictional losses between the pile and the re-
ulus. Figure B3 shows the results from a strain quired supports when the pile was tested on its sidegauge that responded quite linearly, while B4 during the compression test. The initial calibration
shows the results from a malfunctioning gauge. also showed a non-constancy of error variance
44
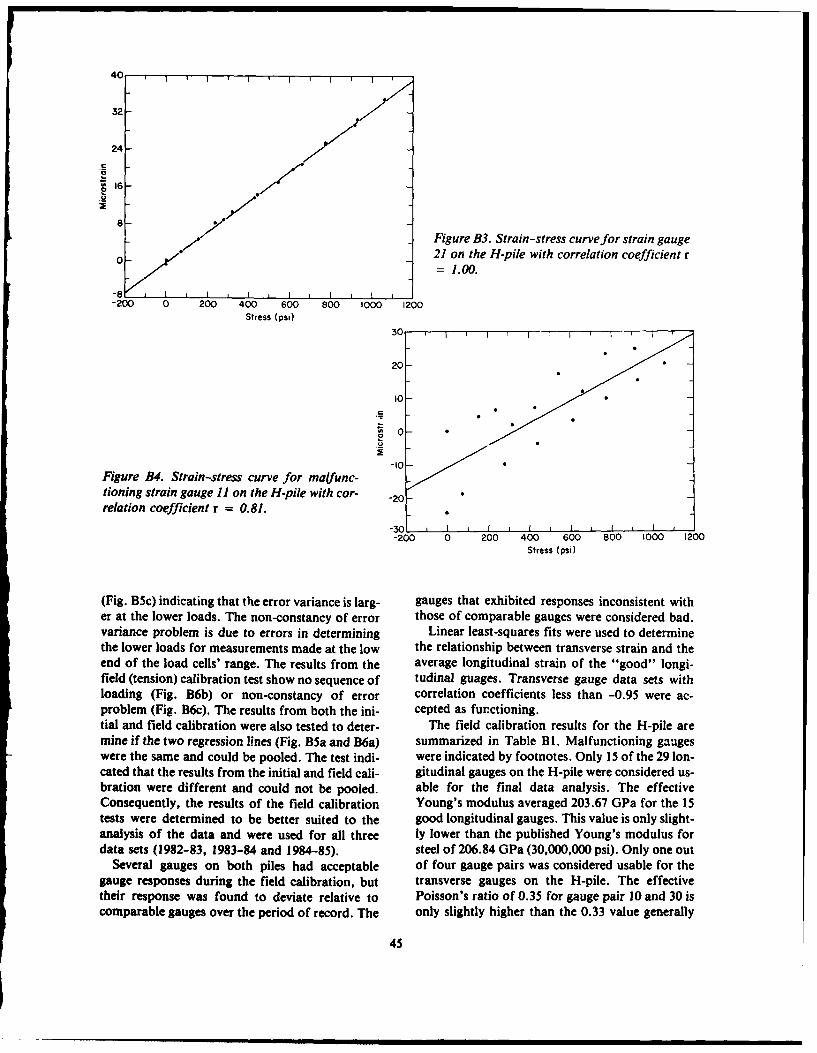
32-
24
S16-
87 Figure B3. Strain-stress curve for strain gauge
o 21 on the H-pile with correlation coefficient ri//" = 1.00.
-8 I I i I i i-200 0 200 400 600 800 1000 1200
Stress (psi)30 I I I
20"
I0-
0-
Figure B4. Strain-stress curve for malfunc-tioning strain gauge 1) on the H-pile with cor- -2orelation coefficient r = 0.81.
-301 I L I i I i-200 0 200 400 600 800 1000 1200
Stress (psi)
(Fig. B5c) indicating that the error variance is larg- gauges that exhibited responses inconsistent wither at the lower loads. The non-constancy of error those of comparable gauges were considered bad.variance problem is due to errors in determining Linear least-squares fits were used to determinethe lower loads for measurements made at the low the relationship between transverse strain and theend of the load cells' range. The results from the average longitudinal strain of the "good" longi-field (tension) calibration test show no sequence of tudinal guages. Transverse gauge data sets withloading (Fig. B6b) or non-constancy of error correlation coefficients less than -0.95 were ac-problem (Fig. B6c). The results from both the ini- cepted as functioning.tial and field calibration were also tested to deter- The field calibration results for the H-pile aremine if the two regression lines (Fig. B5a and B6a) summarized in Table BI. Malfunctioning gaugeswere the same and could be pooled. The test indi- were indicated by footnotes. Only 15 of the 29 Ion-cated that the results from the initial and field cali- gitudinal gauges on the H-pile were considered us-bration were different and could not be pooled. able for the final data analysis. The effectiveConsequently, the results of the field calibration Young's modulus averaged 203.67 GPa for the 15tests were determined to be better suited to the good longitudinal gauges. This value is only slight-analysis of the data and were used for all three ly lower than the published Young's modulus fordata sets (1982-83, 1983-84 and 1984-85). steel of 206.84 GPa (30,000,000 psi). Only one out
Several gauges on both piles had acceptable of four gauge pairs was considered usable for thegauge responses during the field calibration, but transverse gauges on the H-pile. The effectivetheir response was found to deviate relative to Poisson's ratio of 0.35 for gauge pair 10 and 30 iscomparable gauges over the period of record. The only slightly higher than the 0.33 value generally
45
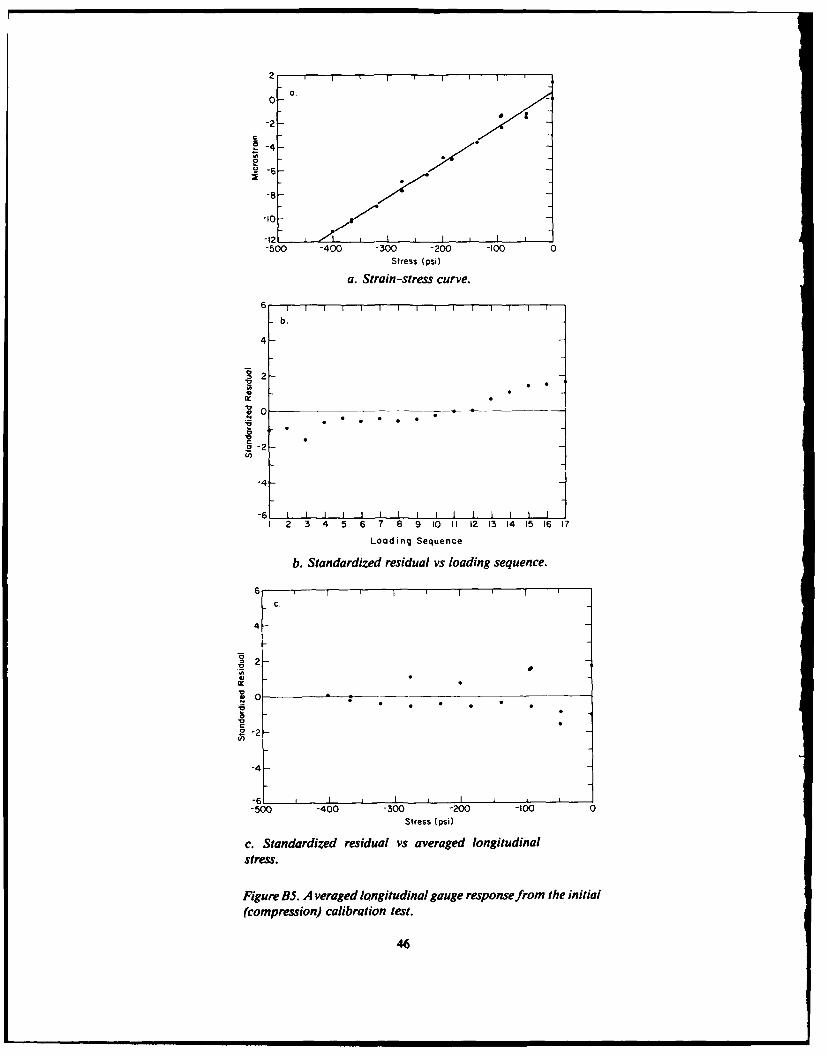
0.0-
-12
-50 -40400 -0 -0
4-0
2-
-4-
-41
1 2 3 4 5 6 7 8 9 10 11 12 13 14 15 16 17
Loading Sequence
b. Standardized residual vs loading sequence.
6IC.
4
0-
V
V)
-50
c. Standardized residual vs averaged longitudinalstress.
Figure BS. A veraged longitudinal gauge response from the initial
(compression) calibration test.
46

40 I I I i i i I i i
40.
32-
24- ,'
S16-
8-
0
-8 "-200 0 200 400 600 800 1000 1200
Stress (psi)
a. Strain-stress curve.
-0
U -2-
-4-
-6 I I I I I I I I I1
2 3 4 5 6 7 8 9 10 II 12 13 14 15 16 17
Loading Sequence
b. Standardized residual vs loading sequence.
6 I I
C.4-
2 -e0 -
Vo -2
-200 0 200 400 600 800 1000 1200
Stress (psi)
c. Standardized residual vs averaged longitudinal stress.
Figure B6. Averaged longitudinal gauge response from the field
(tension) calibrated test.47

Table B1. Field calibration results for the H-pihe.
Longitudinal gauges
Side one gauges Side two gaugesDistance Gauge number, Gauge number,from top completion Young's completion Young'sof pile circuit type modulus Correlation circuit type modulus Correlation
(M) and notes (GPo) coefficient and notes (GPa) coefficient
0.38 1 (HB)2 218.65 + 1.00 15 (HB) 200.77 +0.970.53 No gauge 16 (HB)l 221.40 +0.990.69 2 (HB) 2 221.79 + !.00 17 (HB)l 226.21 +0.970.84 No gauge 19 (HB)l 207.86 +0.990.99 4 (HB) 212.60 +0.99 20 (HB) 191.28 +1.001.14 No gauge 21 (HB) 209.95 + 1.001.30 5 (HB) 212.86 +0.99 22 (HB) 195.34 +1.001.45 No gauge 23 (HB) 219.10 +0.991.60 6 (HB) 211.61 +0.99 24 (HB) 208.88 +0.961.75 No gauge 26 (HB) 197.49 +1.001.91 8 (HB) 211.55 +1.00 27 (HB) 205.29 +1.002.06 No gauge 28 (HB) 88.43 +0.992.21 9 (HB) 2 219.83 + 1.00 29 (HB)2 201.64 + 1.002.36 No gauge 31 (HB) 200.41 + 1.002.52 11 (HB)' 208.04 +0.81 32 (HB)2 200.29 + 1.002.67 No gauge 33 (HB) 208.40 + 0.972.82 12 (HB)' 0.37 +0.64 34 (HB)l 196.48 +1.002.97 No gauge 35 (HB) 181.88 +0.963.12 14 (HB)' -12.89 -0.60 37 (HB)l 188.57 + 1.00
Transverse gauges
Side one gauges Side two gaugesDistance Gauge number, Gauge number,from top completion completion
of pile circuit type Poisson's Correlation circuit type Poisson's Correlation(M) and notes ratio coefficient and notes ratio coefficient
0.76 3 (FB)l -0.28 +0.96 18 (FB)'1.68 7 (FB)' 10.39 -0.73 25 (FB)l2.29 10 (FB) 0.35 -1.00 30 (FB)3.05 13 (FB)' -212.85 +0.39 36 (FB)'
Notes:I-Gauge considered bad if correlation coefficient of curve fit was less than +0.95 for Young's modulus
or greater than -0.95 for Poisson's ratio.2-Gauge is considered bad since output from this gauge drifts relative to the other gauges over the period
of record.Completion circuit types: FB-full bridge; HB-half bridge.
accepted as the Poisson's ratio of steel. Unfortu- published Young's modulus of 206.84 GPa fornately the upper four gauge levels on the H-pile steel. Only 1 out of 11 transverse gauges was con-were unusable as shown in Table BI. sidered usable for the final data analysis on the
The field calibration results for the pipe pile are pipe pile. The effective Poisson's ratio of 0.32 forsummarized in Table B2. Malfunctioning gauges gauge number 38 is only slightly lower than theare indicated by footnotes. Several full bridge 0.33 value generally accepted as the Poisson'scompletion circuits (gauge pairs) were damaged ratio for steel.and reconnected as half bridge circuits in July The importance of field calibration for the1982 (note 3). Only 5 of the 33 longitudinal gauges strain gauges used to determine frost heave forceson the pipe pile were considered usable for the is apparent from the results shown in Tables BIfinal data analysis. The effective Young's modu- and B2. The final analysis for this study used onlylus averaged 229.08 GPa for the five good longi- 45.9 and 13.6 percent of the total gauges installedtudinal gauges. This value is 11% higher than the on the H- and pipe piles, respectively.
48

Table B2. Field calibration results for the pipe pile.
Longitudinal gauges
Side one gauges Side two gaugesDistance Gauge number, Gauge number,from top completion Young's completion Young's
of pile circuit type modulus Correlation circuit type modulus Correlation(m) and notes (GPa) coefficient and notes (GPa) coefficient
0.38 1 (FB)l -1007.03 -0.94 21 (FB)'0.53 2 (FB)' 22 (HB)' 405.26 + 0.970.69 3 (HB)l 364.61 +0.55 24 (FB)'0.84 5 (FB)' 25 (HB)' 278.07 +0.990.84 26 (QB) 260.40 + 1.000.99 6 (FB)' 27 (HB)l 261.60 + 0.451.14 8 (FB)' 29 (HB)' 320.96 +0.801.30 9 (FB)' -338.02 -0.99 30 (FB)'1.45 10 (FB)' 31 (HB) 235.24 +0.991.60 II (FB)' -0.72 -0.53 32 (FB)'1.75 13 (FB)' 34 (HB) 211.08 +0.991.91 14 (FB)' -342.20 -1.00 35 (FB)'2.06 15 (FB)' 36 (HB)' 214.37 +0.832.21 16 (FB)' 37 (HB) 232.33 +0.992.36 18 (FB)' -377.98 -0.97 39 (FB)'2.52 19 (FB) 2 -318.87 -1.00 40 (FB)'2.67 20 (FB)' 41 (HB) 206.35 + 0.98
Transverse gauges
Side one gauges Side two gauges
Distance Gauge number, Gauge number,from top completion completion
of pile circuit type Poisson's Correlation circuit type Poisson's Correlation(M) and notes ratio coefficient and notes ratio coefficient
0.05 44 (QB)l -2403.56 +0.410.61 4 (FB)' -0.03 +0.95 23 (FB)l0.84 43 (QB)' 0.00 -0.061.07 7 (QB)' 0.09 -0.85 28 (QB)' -0.04 +0.861.68 12 (FB)' -0.18 +0.96 33 (FB)l1.75 42 (QB)l 0.02 0.322.29 17 (QB), 0.33 -0.95 38 (QB) 0.32 -0.96
Notes:I-Gauge considered bad if correlation coefficient of curve fit was less than +0.95 for Young's modulus
or greater than -0.95 for Poisson's ratio.2-Gauge is considered bad since output from this gauge drifts relative to the other gauges over the period
of record.3-This side of the original full bridge setup was damaged so gauge is bad. Other side reconnected as half
bridge setup in July 1982.Completion circuit types: FB-full bridge; HB-half bridge; QB-quarter bridge.
49
A facsimile catalog card in Library of Congress MARC format is reproducedbelow.
Johnson, Jerome B.Measurement of frost heave forces on H-piles and pipe piles / by Jerome B.
Johnson and James S. Buska. Hanover, N.H.: U.S. Army Cold Regions Researchand Engineering Laboratory; Springfield, Va.: available from National TechnicalInformation Service, 1988.
vi, 58 p., illus., 28 ca. (CRREL Report 88-21.)Bibliography: p. 33.1. Foundations. 2. Frost heave force. 3. Permafrost. 4. Piles. 5. Strain gauges.
I. Buska, James S. I. United States Army. II. Corps of Engineers. IV. Cold Re-gions Research and Engineering Laboratory. V. Series: CRREL Report 88-21.
U. S. GOVERNMENT PRINTING OFFICE: 1989--600-057--82069