Embed Size (px)
Citation preview

A R
2 0 0 2
N N U A L E P O R T

2002 ANNUAL REPORT
Toronto Transit Commission
Chair
Betty Disero
Norm Kelly Howard MoscoeBrian Ashton Joanne Flint
Vice-Chair
Sherene Shaw
Commissioners
Peter Li Preti David Miller David Shiner
As at December 31, 2002

Letter from the Chair
DATE: June, 2003
TO: MAYOR MEL LASTMAN AND COUNCILLORS OF THE CITY OFTORONTO
It is with pride that I submit the 2002 Annual Report for the TorontoTransit Commission (the “TTC”).
The year was filled with many unforgettable milestones. We openedthe new fully-accessible Sheppard Subway line. We welcomed our 24billionth rider. We delivered our services with the utmost pride during 2002World Youth Day festivities.
During the past year we also opened a new operating andmaintenance facility – the new Eglinton Division and Garage in Scarborough– and achieved our 1,500th bus rebuild at Hillcrest Complex.
By far, one of the most important achievements in 2002 wasbringing the provincial government back to the funding table, andintroducing the federal government to TTC funding - with its first majorinvestment in the renewal and modernization of the system. The TTC wasprovided with $63.6 million in capital funding from the provincialgovernment and $62.3 million for capital improvements from the federalgovernment.
In 2002, the TTC carried 416 million riders, or about 1.4 millionpassengers on a typical weekday, using an active fleet of 692 subway cars,28 light rapid transit cars, 248 streetcars and 1,603 conventional andWheel-Trans buses.
The TTC is the only public transit authority in Canada that carriesmore than 400 million revenue passengers annually. Ridership has nowtopped 400 million for three consecutive years. With one billion customersriding the TTC every 30 months, we’re looking forward to carrying our 25billionth passenger in 2005.
Carrying 90 per cent of local transit trips in the Greater Toronto Area(“GTA”), the TTC is clearly an integral part of what keeps the city on themove.
Never was that more evident than during the summer when hundredsof thousands of Catholic youth from more than 150 countries flocked toToronto for the 2002 World Youth Day celebrations. For one week in July,this sea of young people discovered that the TTC was the better way.
In fact, the TTC broke a record on July 26 with our highest-ever,single-day ridership: 1.99 million passengers.
I would like to express my appreciation to all employees for their hardwork and commitment during 2002 World Youth Day.

Many others exemplify dedication, professionalism and caringyear round, day in and day out. This was clearly shown in the success ofour 2002 United Way campaign, which achieved its goal of increasingemployee participation.
When up to 80 per cent of your 1.4 million daily users take a bus orstreetcar for all or part of their transit trip, rejuvenating the fleet with newpurchases is absolutely essential.
Despite a highly successful rebuild program that has brought the busfleet to a Class A condition – and which has overhauled 1,500 buses inseven years – the average age of our bus fleet is 14 years. Compared tothe U.S. average of eight years, the TTC is driving a fleet that has stretchedthe life of its equipment to the limit.
The good news is that Toronto City Council, in late 2001, approvedthe purchase of 220 Orion VII low-floor, clean-diesel buses for delivery in2003-2004.
These vehicles will significantly reduce nitrogen oxide emissions, tosupport the requirements of the Kyoto Protocol, and use the latesttechnology to accommodate disabled riders. They are the TTC’s first to bebuilt using stainless steel and are designed to meet the criteria of theCommon Bus Specification - developed by a number of major transitauthorities in North America and spearheaded by the TTC.
Most of these buses will be operating out of our new Eglintongarage. The closing of the old facility at Yonge and Eglinton, and busoperations at Danforth Division, ended a combined 167 years of surfaceoperations at these locations, which began with the Toronto Civic Railwaysin 1915.
Modern infrastructure is key to the prosperity of our cities and thehealth of our communities.
Looking ahead, over the next decade the TTC will need $3.8 billionfor state of good repair requirements, including vehicle replacements andinfrastructure. But we’re facing a $1.5-billion shortfall in capital funding.These required dollars don’t build any new track or add bus routes – theysimply maintain the condition of the system.
Toronto’s new Official Plan – the first for the amalgamated city –projects a population growth of up to one million over the next 30 years,and focuses prominently on expanded public transit as the basis foraccommodating this growth and protecting the environment.
If the City is truly going to move forward on the Official Plan, futureexpansion depends on all three levels of government coming to the tablewith additional money, after protecting the TTC’s State of Good Repairrequirements.
The key to capital funding continues to be provincial and federalcontributions, which still have not been fully secured. As stated in aFebruary 2003 letter to the Prime Minister from the Toronto City SummitAlliance “….access to adequate, stable and predictable funding for urbantransit and transportation in the GTA is essential.”

In 2002, the Government of Canada recognized that transit plays afundamental role in the quality of life in our communities. It wasencouraging to see a national transit and transportation program included inthe final report on Canada’s Urban Strategy prepared by the Prime Minister’sCaucus Task Force on Urban Issues. The report concluded that a nationaltransportation program would provide long-term, sustainable funding forpublic transportation systems.
Together with the province’s commitment to directly contribute $1.1-billion over the next decade (with matching funds from federal and municipallevels) it appears that all signs are pointing at new partnerships for newtimes. The Commission greatly appreciates the current announcementsfrom the senior levels of government, and looks forward to commitmentsand agreements that ensure the TTC can grow as the city grows.
I would like to thank my fellow Commissioners – the currentCommissioners and those who served prior to the mid-term change. LastJune, three new Councillors were appointed to the Commission. CouncillorsDavid Shiner, Peter Li Preti and Joanne Flint replaced Councillors JoeMihevc, Gerry Altobello and Mario Silva. Councillor Sherene Shaw assumedthe Vice-Chairmanship from Councillor Silva, while the Chair passed fromCouncillor Brian Ashton to Councillor Betty Disero. Continuing into the newterm were Councillors David Miller, Norm Kelly, and myself.
Howard MoscoeChair

Consolidated Financial Statements of
TORONTO TRANSIT COMMISSION
Year ended December 31, 2002


TORONTO TRANSIT COMMISSION
Consolidated Statements of Operations and Accumulated EquityYears ended December 31
2002 2001($000s) ($000s)
REVENUE
Passenger services 648,810 639,721 Property rental 21,718 17,619 Advertising 15,029 13,548 Miscellaneous 10,166 7,196 Total revenue 695,723 678,084
EXPENSES
Wages, salaries and benefits (note 12) 664,599 622,631 Depreciation 229,325 142,669 Amortization of capital contributions (note 11) (215,284) (127,956)Materials, services and supplies 118,506 114,114 Vehicle fuel 34,297 35,423 Electric traction power 29,840 26,570 Accident claims 16,924 11,590 Wheel-Trans contract services 11,882 10,391 Property taxes 8,849 8,503 Total expenses 898,938 843,935
Net operating costs (203,215) (165,851)
Operating subsidies from City of Toronto (note 4) 204,001 166,394
Net operating surplus 786 543
Accumulated equity, beginning of year 31,149 30,606 Accumulated equity, end of year 31,935 31,149 See accompanying notes to the financial statements

TORONTO TRANSIT COMMISSION
Consolidated Statements of Cash FlowsYears ended December 31
2002 2001($000s) ($000s)
CASH FLOWS FROM OPERATING ACTIVITIES
Cash received from passenger services 657,920 644,971 Other cash received 40,450 42,041 Cash paid to employees (652,386) (606,031)Cash paid to suppliers (187,875) (195,540)Cash paid for accident claims (15,624) (9,890)
Net cash used in operating activities (157,515) (124,449)
CASH FLOWS FROM INVESTING ACTIVITIES
Property and equipment acquisitions (227,967) (312,307)
CASH FLOWS FROM FINANCING ACTIVITIES
Operating subsidies received 186,669 137,021 Capital subsidies received 199,961 309,330
Cash provided by financing activities 386,630 446,351
Increase in cash and cash equivalents during theyear
1,148 9,595
Cash and cash equivalents, beginning of the year 26,271 16,676
Cash and cash equivalents, end of the year 27,419 26,271 See accompanying notes to the financial statements

TORONTO TRANSIT COMMISSIONNotes to the Consolidated Financial Statements
Year ended December 31, 2002
1. NATURE OF OPERATIONS
The Toronto Transit Commission (the "Commission") was established on January 1, 1954 toconsolidate and co-ordinate all forms of local transportation within the City of Toronto ("City"),except railways and taxis. As confirmed in the City of Toronto Act (1997), the Commissionshall plan for the future development of local passenger transportation so as to best serve itsinhabitants and the City and council are not entitled to exercise a power related to localtransportation, except as it relates to Toronto Islands. However, from a funding perspective,the Commission functions as one of the agencies, boards and commissions of the City and isdependent upon the City for both operating and capital subsidies. The Commission alsooperates Wheel-Trans, a transit service for people with disabilities, which is also subsidized bythe City (note 4). The Commission is not subject to income and capital taxes and receivesexemption from certain property taxes.
2. SIGNIFICANT ACCOUNTING POLICIES
(a) Basis of presentationThese consolidated financial statements are prepared in accordance with Canadiangenerally accepted accounting principles for profit oriented organizations, unlessotherwise directed to specific accounting recommendations of the Public SectorAccounting Board.
(b) ConsolidationThe consolidated financial statements include the operations of Wheel-Trans and thefinancial statements of the Commission's subsidiaries, Toronto Transit ConsultantsLimited ("TTCL") and Toronto Coach Terminal Inc. ("TCTI") and TCTI's subsidiary, TTCInsurance Company Limited (the "Insurance Co.").
(c) Measurement uncertaintyThe preparation of the consolidated financial statements in conformity with Canadiangenerally accepted accounting principles requires management to make estimates andassumptions that affect the reported amounts of assets and liabilities and disclosures ofcontingent assets and liabilities at the date of the financial statements and the reportedamounts of revenues and expenses during the reporting period. Actual results coulddiffer from those estimates.
(d) SubsidiesOperating subsidies approved by the City are recognized in the period, to the extent thatnet operating costs are incurred. Any excess or shortage of the approved subsidy relativeto net operating costs is recorded in the TTC Stabilization Reserve Fund, which appearsin the accounts of the City. Contributions provided for the purchase of property andequipment are amortized on the same basis as the related assets.
(e) Passenger revenueRevenue is recognized when cash, tickets and tokens are used by the passenger tosecure a ride. An estimate of tickets and tokens sold, which will be used after the year-end, is included in deferred passenger revenue.
Revenue from passes is recognized in the period in which the passes are valid. Anestimated value of passes sold, but only valid after year-end, is included in deferredpassenger revenue.
TORONTO TRANSIT COMMISSIONNotes to the Consolidated Financial Statements, page 2
Year ended December 31, 2002
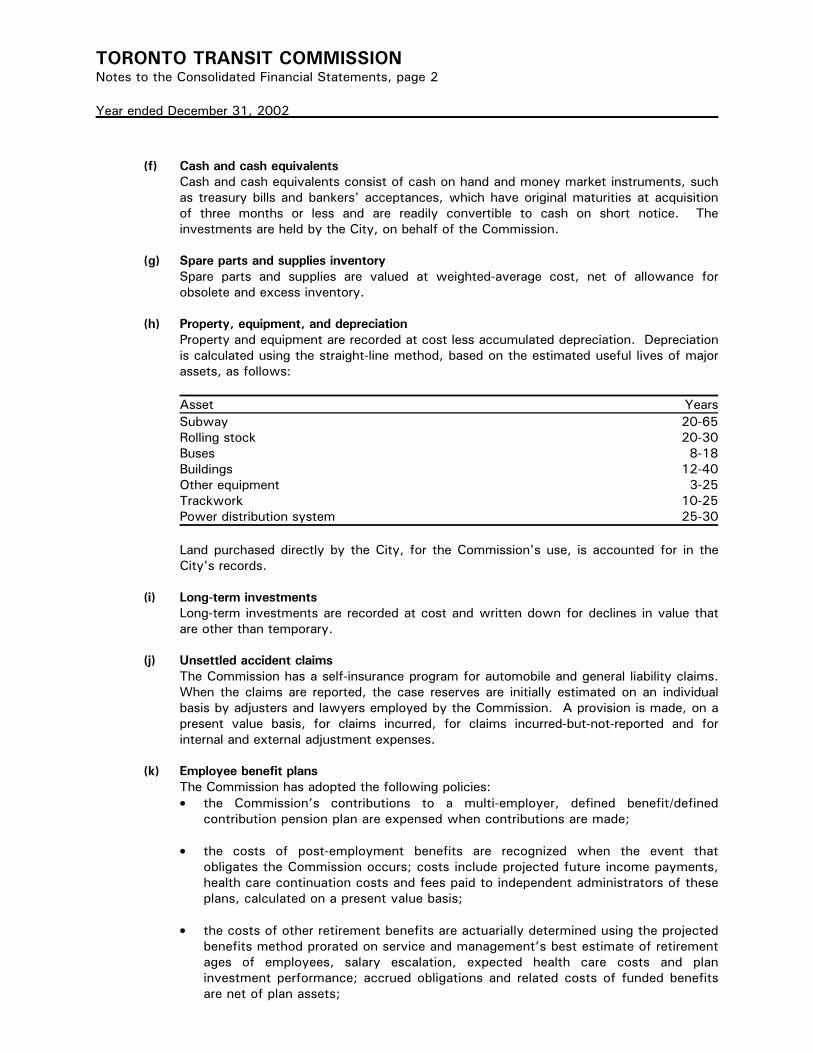
(f) Cash and cash equivalentsCash and cash equivalents consist of cash on hand and money market instruments, suchas treasury bills and bankers' acceptances, which have original maturities at acquisitionof three months or less and are readily convertible to cash on short notice. Theinvestments are held by the City, on behalf of the Commission.
(g) Spare parts and supplies inventorySpare parts and supplies are valued at weighted-average cost, net of allowance forobsolete and excess inventory.
(h) Property, equipment, and depreciationProperty and equipment are recorded at cost less accumulated depreciation. Depreciationis calculated using the straight-line method, based on the estimated useful lives of majorassets, as follows:
Asset YearsSubway 20-65Rolling stock 20-30Buses 8-18Buildings 12-40Other equipment 3-25Trackwork 10-25Power distribution system 25-30
Land purchased directly by the City, for the Commission's use, is accounted for in theCity's records.
(i) Long-term investmentsLong-term investments are recorded at cost and written down for declines in value thatare other than temporary.
(j) Unsettled accident claimsThe Commission has a self-insurance program for automobile and general liability claims.When the claims are reported, the case reserves are initially estimated on an individualbasis by adjusters and lawyers employed by the Commission. A provision is made, on apresent value basis, for claims incurred, for claims incurred-but-not-reported and forinternal and external adjustment expenses.
(k) Employee benefit plansThe Commission has adopted the following policies:• the Commission’s contributions to a multi-employer, defined benefit/defined
contribution pension plan are expensed when contributions are made;
• the costs of post-employment benefits are recognized when the event thatobligates the Commission occurs; costs include projected future income payments,health care continuation costs and fees paid to independent administrators of theseplans, calculated on a present value basis;
• the costs of other retirement benefits are actuarially determined using the projectedbenefits method prorated on service and management’s best estimate of retirementages of employees, salary escalation, expected health care costs and planinvestment performance; accrued obligations and related costs of funded benefitsare net of plan assets;

TORONTO TRANSIT COMMISSIONNotes to the Consolidated Financial Statements, page 3
Year ended December 31, 2002
• liabilities are determined using discount rates that are consistent with the marketrates of high quality debt instruments, with cash flows that match the expectedbenefits payments;
• transitional obligations arising from changes in accounting policies are beingamortized on a straight-line basis over the expected average remaining service lifeof the employee group covered by the benefit plan at the date of the change;
• past service costs from plan amendments are amortized on a straight-line basisover the expected average remaining service period of employees active at the dateof amendment;
• net actuarial gains and losses for post-employment benefits are amortized on astraight-line basis over the average remaining service period of active employees,10 years for workplace safety insurance benefits and seven years for long-termdisability benefits;
• for other retirement benefits, the excess of the net actuarial gain or loss over 10%of the greater of the benefit obligation and the fair value for plan assets, isamortized on a straight-line basis over the average remaining service period ofactive employees, with the average remaining service period of active employeesbeing 14 years for post-retirement medical benefits and 11 years for supplementalpension benefits; and
• for the purpose of calculating the expected return on plan assets related to thesupplemental pension plans, those assets are valued at fair value.
(l) Environmental provisionThe Commission includes in its liabilities a provision for the cost of compliance withenvironmental legislation. Those conditions that have been clearly identified as being innon-compliance with environmental legislation and with costs that can be reasonablydetermined have been accrued. The estimated amounts of future restoration costs arereviewed regularly, based on available information and governing legislation.
3. FINANCIAL INSTRUMENTS
The main categories of financial instruments held by the Commission are cash and cashequivalents, accounts receivable, long-term investments, accounts payable and accruedliabilities. The fair values of these items approximate their book values.

TORONTO TRANSIT COMMISSIONNotes to the Consolidated Financial Statements, page 4
Year ended December 31, 2002
4. OPERATING SUBSIDIES
The operating subsidies from the City of Toronto are:
($000s) 2002 2001Conventional Wheel-Trans Total Total
Operating costs 161,078 42,923 204,001 166,394Capital from current 12,727 1,632 14,359 21,097City special costs 2,920 - 2,920 2,884(Draw from)/contribution to Stabilization Reserve Fund (24,563) - (24,563) 9Total City operating subsidy(in accounts of the City of Toronto)
152,162 44,555 196,717 190,384
Between 1971 and 1980, the City and the Province covered the Commission’s operatingshortfalls, on a shared basis. From 1981 until 1993, a more formalized “Users’ Fair Share”formula was used, with the Commission establishing its fares each year to cover 68% of totalestimated operating expenses (as defined for provincial subsidy purposes). The City providedan operating subsidy equal to the remaining expenses. The City in turn obtained a subsidyfrom the Province equal to 16% of eligible expenses, plus additional subsidies for certainspecified costs. Between 1994 and 1997, modified “flat-line” subsidies were provided by theCity and the Province. However, as of January 1, 1998, the Province ceased providingoperating subsidies for public transit. Currently, the total City operating subsidy amount isestablished as part of the City’s annual budget process.
Capital from current represents operating subsidies used primarily for assets with limited lives,such as environmental programs and Information Technology projects. These costs arerecorded as property and equipment and the subsidies are recorded as net capital contributions(note 11).
City special costs represent subsidies reflected in the City’s budget that relate to theCommission, such as rents and taxes on commuter parking lots and costs associated withcertain subsidized passengers. These subsidies and related expenses are not reflected in theseconsolidated financial statements.
The TTC Stabilization Reserve Fund (the “Fund”) was established by the City to stabilizefunding over time. Any TTC operating surpluses are contributed to the Fund and any operatingdeficits, to the limit of the Fund’s balance and after approval by the City, are covered by adraw from the Fund. In accordance with a directive from the City, the Fund was fully depletedin 2002, in order to address the 2002 operating deficit. The Fund is not reflected in theCommission’s financial statements but is recorded in the accounts of the City. The continuityof this fund is estimated as follows:
($000s) 2002 2001Conventional Wheel-Trans Total Total
Balance, beginning of year 19,730 9 19,739 18,708 Operating surplus - - - 9 City adjustments 3,741 - 3,741 - Interest earned 1,083 - 1,083 1,022 Withdrawal (24,554) (9) (24,563) -Balance, end of year - - - 19,739

TORONTO TRANSIT COMMISSIONNotes to the Consolidated Financial Statements, page 5
Year ended December 31, 2002
5. CAPITAL SUBSIDIES
Capital subsidies, which are recorded as net capital contributions (note 11), are as follows:
($000s) 2002 2001Source of capital subsidy:- City of Toronto 79,594 277,742- Province of Ontario 63,589 -- Federal Government of Canada 62,300 -Total capital subsidy 205,483 277,742
(a) City of TorontoThe City is responsible for funding 100% of the Commission’s capital program. Inaccordance with the Municipal Act, any funding for the Commission’s capital programfrom other governments flows through the City.
(b) Province of OntarioUntil 1996, the Commission received a 100% subsidy from the City for subway, light-railadditions and improvements, and certain other capital works projects. The City thenrecovered 75% of the subsidy from the Province. The Commission also received a 75%subsidy from the City for most of its other capital asset additions and the City in turnrecovered the subsidy from the Province. This process was modified by the Province in1996. A tripartite Capital Subsidy Agreement (“CSA”) was signed in 1996 by theCommission, the City and the Province to cover capital subsidies over the period 1996 to2000. However, in 1998, the Province provided a lump sum payment in settlement oftheir commitments under the CSA and then terminated all capital subsidies.
On September 27, 2001, the Province of Ontario announced a ten-year fundingcommitment of $9 billion to “….provide ongoing funding for transit capital renewal bycost-sharing up to one third of eligible municipal requirements, to ensure thatmunicipalities have the ability to meet current and future transit needs”.
In October 2002, the Province paid $62.3 million under the Ontario Transit RenewalProgram (“OTRP”) towards funding for the Commission’s capital vehicle andinfrastructure costs. In addition, on August 15, 2002, the Province announced fundingof $13.3 million, through the SuperBuild program, on the basis of proceeding with aspecified list of projects, of which $1.3 million was received and applied towards 2002funding of project expenditures.
In January 2003, the Province announced a further $62.3 million, under the OTRP, forthe Commission for 2003.
(c) Federal Government of CanadaIn April 2002, the Federal Minister of Transport announced funding of $76 million for theCommission’s capital modernization and improvement program. The funding was to beprovided through the Canada-Ontario Infrastructure Program (“COIP”) in two installments. A tri-party funding agreement between the Province, the City and the Commission wasexecuted by the Ministry of Transportation on December 19, 2002 to allow Federal fundsto flow through the Province. The City received a cheque for $62.3 million in December2002. The identification of further projects to be funded by the remaining Federalcommitment of $13.7 million under COIP is currently underway, for payment in 2003.

TORONTO TRANSIT COMMISSIONNotes to the Consolidated Financial Statements, page 6
Year ended December 31, 2002
In the Federal budgets of December 2001 and February 2003, the Federal Governmentannounced the creation of the Canada Strategic Infrastructure Fund, with contributionstotalling $4 billion over ten years, as well as a further $1 billion for smaller municipalprojects. At this time, no details are available as to what portion of the funds may beavailable to the City of Toronto or the Commission.
6. RECEIVABLE FROM CITY OF TORONTO
The accounts receivable from the City primarily consist of subsidy billings. To simplify thereconciliation of the Commission's accounts to those of the City, the receivable also reflectsthe netting of certain accounts payable to the City, including a loan due on demand, withaccrued interest at prime.
2002 2001($000s)
Subsidies receivable 155,324 118,111 Other receivables 31,739 46,954 Other payables (39,755) (18,642) Loan payable (7,021) (6,738) Total receivable 140,287 139,685
7. LONG-TERM INVESTMENTS
The investments consist of a municipal and a provincial bond and shares in a publicly tradedcompany, as the result of the de-mutualization of one of the Commission’s insurance carriers. At December 31, 2002, the fair value of the bonds is $3.0 million (2001 - $3.1 million) and ofthe shares is $3.3 million (2001 - $4.3 million).
8. PROPERTY AND EQUIPMENT, NET
The Commission’s cost of property and equipment, net of accumulated depreciation, is asfollows:
2002 2001($000s)
Subway 2,045,225 1,134,124 Rolling stock 1,464,546 1,457,523 Buses 545,842 528,651 Construction in progress 475,878 1,298,239 Other equipment 363,180 341,973 Buildings 360,934 316,537 Trackwork 346,150 313,217 Power distribution system 133,044 125,507 Land 13,086 13,096
5,747,885 5,528,867 Less accumulated depreciation 2,141,466 1,919,202 Property and equipment, net 3,606,419 3,609,665
Land purchased directly by the City, for the Commission's use, is accounted for in the City'srecords. The insured value of all of the Commission’s assets, not including land, in 2002 was$8.5 billion (2001 - $7.9 billion).

TORONTO TRANSIT COMMISSIONNotes to the Consolidated Financial Statements, page 7
Year ended December 31, 2002
9. ENVIRONMENTAL LIABILITIES
As an operator of diesel buses that are refuelled on property and an enterprise that repairs andrebuilds buses and other rolling stock, the Commission and its subsidiaries are subject tovarious federal, provincial and municipal laws and regulations related to the environment. In1996, an exhaustive environmental audit was conducted for the Commission by an externalconsultant. Although some remedial work had been undertaken prior to that audit, morecomprehensive remedial and pro-active programs were then established and much work hasbeen completed. However, certain programs are still active and these include: garagesubsurface remediation, sewer usage compliance, waste management systems, liquid storageand handling compliance, storage tank and containment systems, underground storage removal,and PCB contaminated electrical equipment removal programs.
The Commission expects that expenditures of approximately $2.6 million will be incurred during2003 and therefore this amount is included in accounts payable and accrued liabilities (2001 -$9.5 million). In addition, the consolidated balance sheets include a long-term provision forenvironmental costs of $6.4 million (2001 - $1.1 million) to cover the estimated costs ofremediating sites with known contamination for which the Commission is responsible. Nevertheless, given that the estimate of environmental liabilities is based on a number ofassumptions, actual expenses may vary. The estimated amounts of future restoration costs arereviewed regularly, based on available information and governing legislation.
10. UNSETTLED ACCIDENT CLAIMS
The Insurance Co. was established in 1994 in order to provide insurance coverage forcompulsory automobile personal injury and accident benefit claims for the Commission. TheCommission has purchased insurance from third party insurers to cover claims in excess of $5million on any one accident.
At December 31, 2002, $30.9 million (2001 - $29.6 million) of the unsettled accident claimsliability is related to the Insurance Co.'s payable for all automobile claims incurred. Thispayable is guaranteed by the City.
11. NET CAPITAL CONTRIBUTIONS
The net capital contributions of the Commission are as follows:
2002 2001($000s)
Balance, beginning of year 3,496,454 3,325,571 Capital from current (note 4) 14,359 21,097 Capital subsidies (note 5) 205,483 277,742 Amortization (215,284) (127,956) Balance, end of year 3,501,012 3,496,454
Accumulated amortization recorded to date 1,943,077 1,727,815.

TORONTO TRANSIT COMMISSIONNotes to the Consolidated Financial Statements, page 8
Year ended December 31, 2002
12. EMPLOYEE BENEFITS
The employee benefits liabilities of the Commission are as follows:
2002 2001 ($000s)
Post-employment benefits 75,581 71,679 Other retirement benefits 29,308 16,607 Total employee benefits 104,889 88,286
(a) Pension plan benefitsThe Commission participates in a multi-employer, defined benefit/defined contributionhybrid pension plan that covers substantially all employees of the Commission. It isoperated by the Toronto Transit Commission Pension Fund Society (the "Society"), aseparate legal entity. The Society provides pensions to members based on the length ofservice and average base year (pensionable) earnings. The base years, as defined in theplan, are updated from time to time provided the financial position of the Society sopermits. The members and the Commission each made required contributions of $37.2million in 2002 (2001 - $34.8 million), which represented 6.25% of members’ coveredearnings up to the Canada Pension Plan yearly maximum pensionable earnings ($39,100for 2002) and 7.85% of covered earnings in excess of this amount. Total contributionsto the Society meet the minimum funding requirements in accordance with pensionlegislation and provide for the amortization of any unfunded liabilities over 15 years. Inaddition, the Commission contributed $2.2 million in 2002 (2001 - $2.2 million) for anearly retirement provision.
Based on the latest actuarial reports, which reflected the terms of the plan, as at January1, 2002 and January 1, 2001, the Society's records indicated the following:
Jan 1/2002 Jan 1/2001 ($000s)
Actuarial value of assets 2,594,637 2,496,793 Pension obligations 2,476,737 2,357,160 Funding excess 117,900 139,633
(b) Post-employment benefitsThe Commission provides self-insured long-term disability benefits, administered by anindependent insurance carrier. In addition, the Commission, as a Schedule 2 employerunder the Workplace Safety and Insurance Act, assumes responsibility for financing itsworkplace safety insurance costs.

TORONTO TRANSIT COMMISSIONNotes to the Consolidated Financial Statements, page 9
Year ended December 31, 2002
The benefit amounts and actuarial assumptions used are as follows:
2002 2001 ($000s)
Accrued benefit obligation 78,411 74,005 Unamortized transitional obligation (8,295) (9,480)Unamortized net actuarial gain 5,465 7,154 Accrued benefit liability 75,581 71,679
Benefit expense 16,287 16,368 Benefits paid 13,780 12,371
Discount rate 6.25% 6.50%
(c) Other retirement benefitsThe Commission provides limited medical and dental benefits to employees who retirewith at least ten years of service.
The Commission maintains supplemental pension plans designed to pay employees andexecutives the difference between their earned pension under the by-laws of the Societyand the maximum allowable pension under the Income Tax Act.
The benefit amounts and actuarial assumptions used are as follows:
2002 2001 ($000s)
Accrued benefit obligation Post-retirement medical and dental benefits 64,795 52,298 Supplemental pension benefits, net of plan assets of $4,090 (2001 - $2,901) 5,723 3,529
70,518 55,827
Unamortized transitional obligation (30,811) (33,636)Unamortized net actuarial loss and past service costs (10,398) (5,584)Accrued benefit liability 29,309 16,607
Benefit expense 15,026 7,624 Benefits paid 2,360 1,955 Employer contributions to supplemental pension plan 1,258 992 Employee contributions to supplemental pension plan 84 54
Discount rate 6.25% 6.50%Expected long-term rate of return on plan assets
2.50% 2.50%

TORONTO TRANSIT COMMISSIONNotes to the Consolidated Financial Statements, page 10
Year ended December 31, 2002
The following medical and dental cost increase assumptions have been used for long-termdisability health care continuation and post-retirement medical and dental benefits:
Prescription drug costs 9% per annum in 2000, grading down to 5% over 5years
Other medical and dental costs 5% per annum
13. COMMITMENTS AND CONTINGENCIES
(a) In the normal course of its operations, the Commission and its subsidiaries are subject tovarious litigations and claims. The ultimate outcome of these claims cannot bedetermined at this time. However, management believes that the ultimate disposition ofthese matters will not materially exceed the amounts recorded in the accounts.
(b) A class action claiming $500 million in damages, plus interest and costs was served onthe Commission on November 30, 2001. The claim is based on alleged exposure byworkers to asbestos during construction work at the Sheppard Subway Station. Theclaim also names the Ministry of Labour and an environmental consultant company asdefendants and alleges various violations of the Occupational Health and Safety Act andits regulations. The action has not proceeded to the stage involving the motion ofcertification. At this time, it is not possible to quantify the effect, if any, of this claim inthese consolidated financial statements.
(c) In 2001, the Commission entered into an agreement to purchase 220 low-floor Oriondiesel buses, at a total estimated contract cost of $113.4 million. At December 31,2002, 1 vehicle has been received, an amendment has reduced the contract to $113.1million and expenses of $0.5 million have been incurred (2001 - $0).
(d) The Commission has contracts for the construction and implementation of various capitalprojects. At December 31, 2002, these contractual commitments are approximately$42.8 million (2001 - $113.5 million).
(e) The Commission leases certain premises under operating lease agreements. Theapproximate future minimum annual lease commitments are as follows:
2003 4,400,0002004 4,500,0002005 4,600,0002006 2,000,000thereafter 0
14. COMPARATIVE CONSOLIDATED FINANCIAL STATEMENTS
The comparative consolidated financial statements have been reclassified from statementspreviously presented to conform to the presentation of the 2002 consolidated financialstatements.

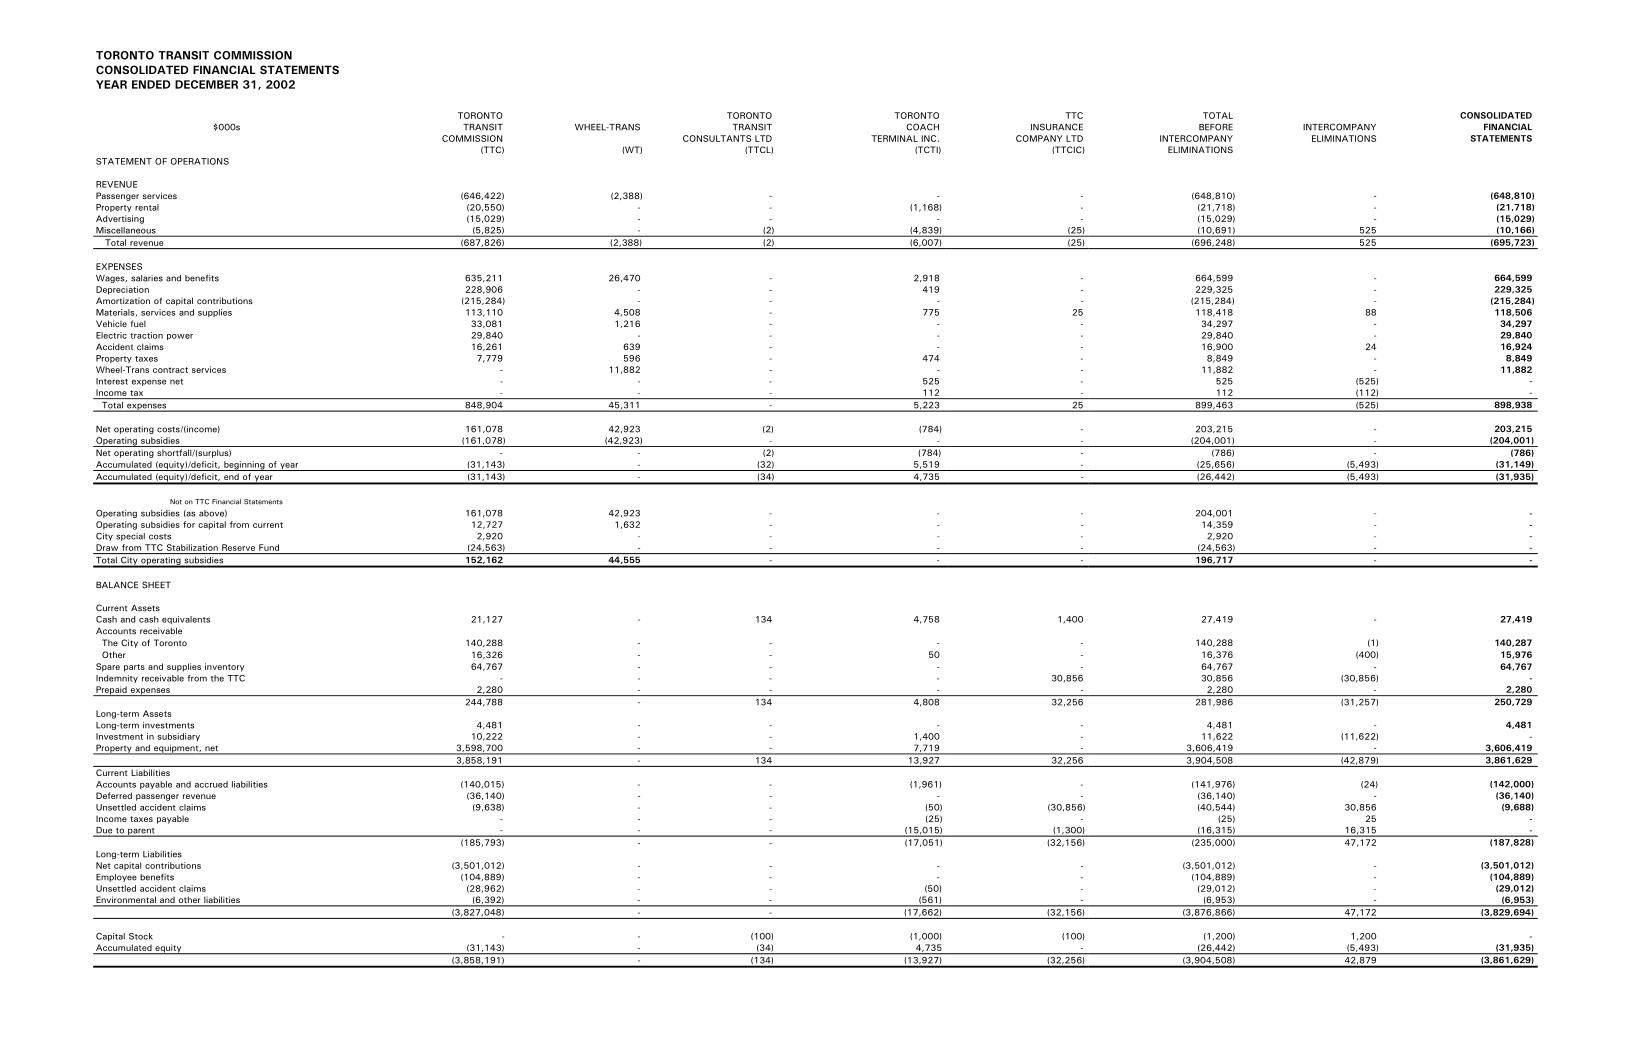
TORONTO TRANSIT COMMISSIONCONSOLIDATED FINANCIAL STATEMENTSYEAR ENDED DECEMBER 31, 2002
TORONTO TORONTO TORONTO TTC TOTAL CONSOLIDATED$000s TRANSIT WHEEL-TRANS TRANSIT COACH INSURANCE BEFORE INTERCOMPANY FINANCIAL
COMMISSION CONSULTANTS LTD TERMINAL INC. COMPANY LTD INTERCOMPANY ELIMINATIONS STATEMENTS(TTC) (WT) (TTCL) (TCTI) (TTCIC) ELIMINATIONS
STATEMENT OF OPERATIONS
REVENUEPassenger services (646,422) (2,388) - - - (648,810) - (648,810)Property rental (20,550) - - (1,168) - (21,718) - (21,718)Advertising (15,029) - - - - (15,029) - (15,029)Miscellaneous (5,825) - (2) (4,839) (25) (10,691) 525 (10,166) Total revenue (687,826) (2,388) (2) (6,007) (25) (696,248) 525 (695,723)
EXPENSESWages, salaries and benefits 635,211 26,470 - 2,918 - 664,599 - 664,599Depreciation 228,906 - - 419 - 229,325 - 229,325Amortization of capital contributions (215,284) - - - - (215,284) - (215,284)Materials, services and supplies 113,110 4,508 - 775 25 118,418 88 118,506Vehicle fuel 33,081 1,216 - - - 34,297 - 34,297Electric traction power 29,840 - - - - 29,840 - 29,840Accident claims 16,261 639 - - - 16,900 24 16,924Property taxes 7,779 596 - 474 - 8,849 - 8,849Wheel-Trans contract services - 11,882 - - - 11,882 - 11,882Interest expense net - - - 525 - 525 (525) -Income tax - - - 112 - 112 (112) - Total expenses 848,904 45,311 - 5,223 25 899,463 (525) 898,938
Net operating costs/(income) 161,078 42,923 (2) (784) - 203,215 - 203,215Operating subsidies (161,078) (42,923) - - - (204,001) - (204,001)Net operating shortfall/(surplus) - - (2) (784) - (786) - (786)Accumulated (equity)/deficit, beginning of year (31,143) - (32) 5,519 - (25,656) (5,493) (31,149)Accumulated (equity)/deficit, end of year (31,143) - (34) 4,735 - (26,442) (5,493) (31,935)
Not on TTC Financial Statements
Operating subsidies (as above) 161,078 42,923 - - - 204,001 - -Operating subsidies for capital from current 12,727 1,632 - - - 14,359 - -City special costs 2,920 - - - - 2,920 - -Draw from TTC Stabilization Reserve Fund (24,563) - - - - (24,563) - -Total City operating subsidies 152,162 44,555 - - - 196,717 - -
BALANCE SHEET
Current AssetsCash and cash equivalents 21,127 - 134 4,758 1,400 27,419 - 27,419Accounts receivable The City of Toronto 140,288 - - - - 140,288 (1) 140,287 Other 16,326 - - 50 - 16,376 (400) 15,976Spare parts and supplies inventory 64,767 - - - - 64,767 - 64,767Indemnity receivable from the TTC - - - - 30,856 30,856 (30,856) -Prepaid expenses 2,280 - - - - 2,280 - 2,280
244,788 - 134 4,808 32,256 281,986 (31,257) 250,729Long-term AssetsLong-term investments 4,481 - - - - 4,481 - 4,481Investment in subsidiary 10,222 - - 1,400 - 11,622 (11,622) -Property and equipment, net 3,598,700 - - 7,719 - 3,606,419 - 3,606,419
3,858,191 - 134 13,927 32,256 3,904,508 (42,879) 3,861,629Current LiabilitiesAccounts payable and accrued liabilities (140,015) - - (1,961) - (141,976) (24) (142,000)Deferred passenger revenue (36,140) - - - - (36,140) - (36,140)Unsettled accident claims (9,638) - - (50) (30,856) (40,544) 30,856 (9,688)Income taxes payable - - - (25) - (25) 25 -Due to parent - - - (15,015) (1,300) (16,315) 16,315 -
(185,793) - - (17,051) (32,156) (235,000) 47,172 (187,828)Long-term LiabilitiesNet capital contributions (3,501,012) - - - - (3,501,012) - (3,501,012)Employee benefits (104,889) - - - - (104,889) - (104,889)Unsettled accident claims (28,962) - - (50) - (29,012) - (29,012)Environmental and other liabilities (6,392) - - (561) - (6,953) - (6,953)
(3,827,048) - - (17,662) (32,156) (3,876,866) 47,172 (3,829,694)
Capital Stock - - (100) (1,000) (100) (1,200) 1,200 -Accumulated equity (31,143) - (34) 4,735 - (26,442) (5,493) (31,935)
(3,858,191) - (134) (13,927) (32,256) (3,904,508) 42,879 (3,861,629)

Salary Disclosure – 2002
The Public Sector Salary Disclosure Act, 1996 requires the disclosure in the annual report of the salary and benefitsof employees in the public sector who are paid a salary of $100,000 or more in a year. The following is a list ofthose employees for the year 2002.
NAME POSITIONSALARY PAID TAXABLE
BENEFITS
Warren H. Bartram General Supt. - Track & Structure 132,363 3,247
Richard G. Beecroft Chief Auditor 112,761 3,247
Andy G. Bertolo Chief Project Mgr. – Construction 132,363 3,247
Scott Blakey Manager – Human Resources 132,149 3,247
Robert A. Boutilier Deputy General Manager – Surface Ops 153,013 7,602
William D. Brown Manager – Vehicle Engineering 121,025 3,247
Paul F. Buttigieg Chief Accountant – Financial Services 117,887 69
John D. Cannell Manager – Pension Fund Society 121,025 3,247
John D. Cannon Chief Information Officer 116,388 3247
Allen J. Chocorlan Manager – Materials and Procurement 132,149 3,247
Rick Cornacchia Deputy General Manager – Subway Ops 150,138 7,602
Kathryn Dean Manager – Training 120,556 3,247
Dave Dixon General Supt. – Bus Maintenance 132,363 3,247
Richard C. Ducharme Chief General Manager 216,540 13,800
Andrew Duggan Supervisor – Construct. & Prev. Maintenance 103,243 38
John Ewing Senior Designer – Signals 113,081 69
Derick Finn General Supt. – Signals/Elect./Comms. 132,363 3,247
William G. Frost Manager - Support Services 119,259 3,247
Chris Heinz Deputy Chief Information Officer 112,761 3,247
Lynn I. Hilborn Deputy General Manager – Corporate 150,138 7,602
Robert Hughes Chief Marketing Officer 108,146 3,247
Anthony Iannucci Director – Technical Services 102,528 69
William Jennings Senior Construction Inspector 102,765 69
Ian Lane General Supt. – Streetcars 132,363 3,247
Brian M. Leck General Counsel 132,363 3,247
Don Leger General Supt. - Plant Maintenance 132,363 3,247
Paul Macintosh Construction Manager 102,530 3,247
Geoffrey Marinoff General Supt. – Rail Cars & Shops 121,154 3,247
Karen E. McGuire Associate General Counsel 118,464 3,247
Stuart McKay Senior Design Engineer – Signals 111,313 69
Thomas G. Middlebrook Chief Engineer 132,363 3,247
Paul Millett General Supt. – Subway Transportation 132,363 3,247
Giuseppe Monaco Foreperson – Pneumatic/Hydraulic Repair 104,768 69
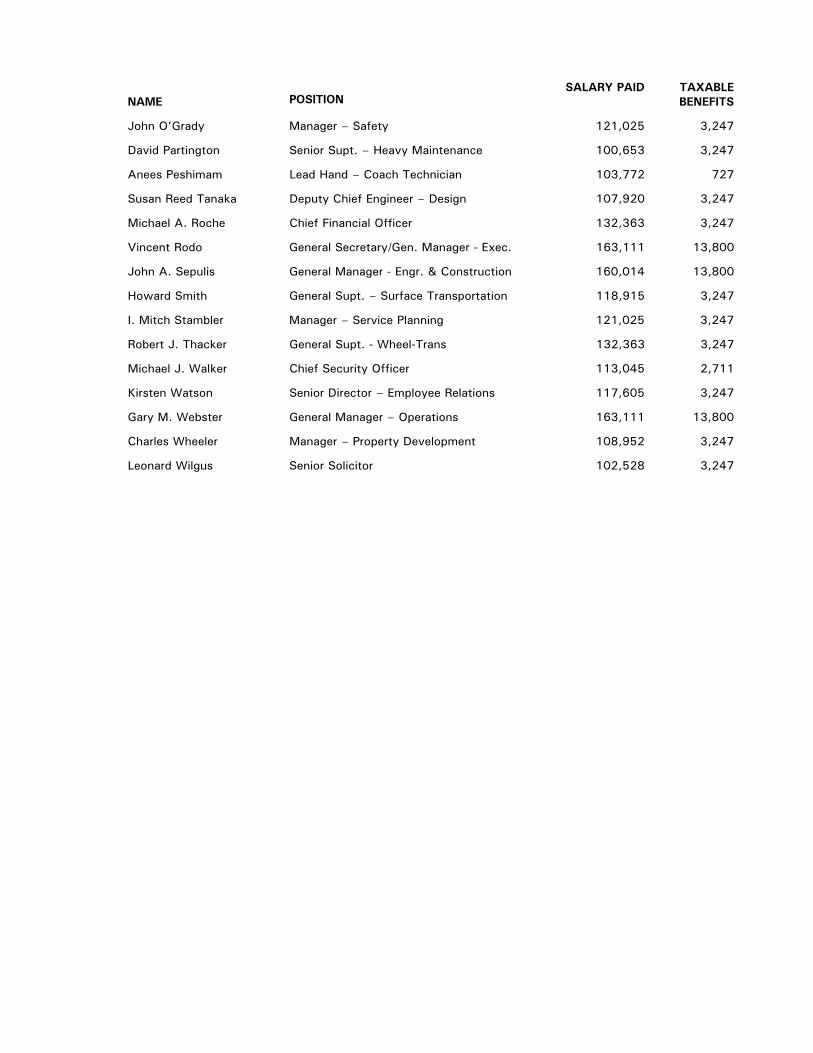
NAME POSITIONSALARY PAID TAXABLE
BENEFITS
John O’Grady Manager – Safety 121,025 3,247
David Partington Senior Supt. – Heavy Maintenance 100,653 3,247
Anees Peshimam Lead Hand – Coach Technician 103,772 727
Susan Reed Tanaka Deputy Chief Engineer – Design 107,920 3,247
Michael A. Roche Chief Financial Officer 132,363 3,247
Vincent Rodo General Secretary/Gen. Manager - Exec. 163,111 13,800
John A. Sepulis General Manager - Engr. & Construction 160,014 13,800
Howard Smith General Supt. – Surface Transportation 118,915 3,247
I. Mitch Stambler Manager – Service Planning 121,025 3,247
Robert J. Thacker General Supt. - Wheel-Trans 132,363 3,247
Michael J. Walker Chief Security Officer 113,045 2,711
Kirsten Watson Senior Director – Employee Relations 117,605 3,247
Gary M. Webster General Manager – Operations 163,111 13,800
Charles Wheeler Manager – Property Development 108,952 3,247
Leonard Wilgus Senior Solicitor 102,528 3,247

TORONTO TRANSIT COMMISSIONConventional System10-Year Non-consolidated Financial and Operating Statistics
2002 2001 2000 1999 1998 1997 1996 1995 1994 1993
OPERATING STATISTICS
(regular service inside City)
Passenger Trips (Millions) 415.5 420.0 410.6 392.6 388.7 379.9 372.4 388.2 388.3 393.5
Basic Adult Ticket Fare (at December 31) ($) 1.80 1.80 1.70 1.70 1.60 1.60 1.60 1.50 1.30 1.30
Average Number of Employees (including TCTI) 10,356 10,191 10,095 10,049 9,462 9,133 9,129 9,459 9,621 9,717
Average Hourly Wages & Benefits per Operator ($) 33.45 32.29 31.25 30.20 29.06 28.99 29.72 28.25 3 28.08 2 28.75
Kilometres Operated (Millions)
Bus 100.4 97.7 95.0 94.4 94.5 93.7 93.7 100.9 100.5 99.0
Subway Car 76.2 75.5 74.4 67.4 67.6 65.5 63.9 62.8 63.8 63.6
Streetcar 11.3 11.7 11.3 11.4 12.1 10.6 10.9 11.1 11.2 11.5
Trolley Coach 0.0 0.0 0.0 0.0 0.0 0.0 0.0 0.0 0.0 0.7
Scarborough RT 4.3 4.4 4.2 3.9 4.1 3.7 3.6 3.7 3.6 3.7
Total Kilometres Operated 192.2 189.3 184.9 177.2 178.3 173.5 172.1 178.5 179.1 178.5
OPERATING REVENUE STATISTICS
Operating Revenue – including property rental, etc. ($ Millions) 687.8 670.6 630.2 585.2 563.9 559.4 514.8 457.3 444.8 447.0 1
Operating Revenue per Passenger Trip ($) 1.66 1.60 1.53 1.49 1.45 1.47 1.38 1.18 1.15 1.14
Operating Revenue per Kilometre ($) 3.58 3.54 3.41 3.30 3.16 3.22 2.99 2.56 2.48 2.50
OPERATING EXPENSE STATISTICS
Operating Expenses ($ Millions) 848.9 797.2 745.1 706.8 702.8 703.5 684.0 671.8 671.9 681.1
Operating Expense per Passenger Trip ($) 2.04 1.90 1.81 1.80 1.81 1.85 1.84 1.73 1.73 1.73
Operating Expense per Kilometre ($) 4.42 4.21 4.03 3.99 3.94 4.05 3.97 3.76 3.75 3.82
OPERATING SUBSIDY STATISTICS
Operating Subsidy ($ Millions) 173.7 12 144.7 11 130.1 10 139.3 8 146.3 6 158.9 5 169.2 4 214.6 3 207.1 234.1
Operating Subsidy per Passenger Trip ($) 0.42 0.34 0.32 0.35 0.38 0.42 0.45 0.55 0.53 0.60
Operating Subsidy per Kilometre ($) 0.90 0.76 0.70 0.79 0.82 0.92 0.98 1.20 1.16 1.31
REVENUE/COST RATIO 81.0% 9 84.1% 9 84.6% 9 82.8% 9 80.2% 7 80.4% 75.7% 69.3% 69.4% 65.7%
CAPITAL ASSETS (Conventional & Wheel-Trans)
Investment in Capital Assets at December 31 ($ Millions)
Gross Investment (before contributions & depreciation) 5,740.5 5,514.5 5,230.3 4,849.2 4,258.4 3,721.2 3,353.6 3,042.4 2,830.6 2,605.5
City & Provincial Contributions (5,444.0) (5,224.3) (4,925.4) (4,547.2) (3,951.8) (3,420.8) (3,055.9) (2,738.8) (2,532.9) (2,317.0)
TTC Investment (before depreciation) 296.5 290.2 304.9 302.0 306.6 300.4 297.7 303.6 297.7 288.5
PASSENGER VEHICLE FLEET
(Conventional & Wheel-Trans, owned or leased and in service December 31)
Buses 1,468 1,480 1,468 1,483 1,498 1,468 1,525 1,542 1,564 1,564
Subway Cars 692 692 672 660 638 620 640 622 622 622
Streetcars 248 248 248 248 248 248 248 248 267 267
Trolley Coaches 0 0 0 0 0 0 0 0 0 0
Scarborough RT Cars 28 28 28 28 28 28 28 28 28 28
Wheel-Trans Buses 135 142 149 150 140 140 140 140 140 141
Total Vehicle Fleet 2,571 2,590 2,565 2,569 2,552 2,504 2,581 2,580 2,621 2,622
NOTES:
1. 1992 and 1993 revenue did not include draws from the Transit Improvement Reserve Fund.
2. The lower average hourly wages & benefits for Operators in 1994 and 1995 related to the Social Contract savings.
3. The 1995 Metro subsidy of $110.0 million included $10.2 million from the Transit Improvement Reserve Fund and $7.5 million from the Metro Contingency Account.
4. 1996 net operating costs were partially funded by $6.4 million from the Commission's accumulated equity, while the Metro subsidy of $79.2 million included $2.5 million from theMetro Contingency Account.
5. The 1997 annual report incorrectly stated that this amount was $150.5 million. The amounts for operating subsidy per passenger trip and operating subsidy per kilometre have beenadjusted accordingly.
6. On January 1, 1998, the City of Toronto assumed all assets & liabilities of Metro and all Provincial operating subsidies ceased. The total subsidy paid by the City was $149.3 million,consisting of $146.3 million for operating subsidy, $1.9 million for City special costs & a $1.1 million contribution to the Stabilization Reserve Fund.
7. In previous years, the revenue/cost ratio had been determined in accordance with Provincial operating subsidy rules on eligible revenues and expenses, which, if applied in 1998, would haveyielded a slightly higher revenue/cost ratio. The 1998 revenue/cost ratio was recalculated as operating revenue/operating expenses (excluding $7.4 million for capital from current).
8. The total subsidy paid by the City was $148.9 million, consisting of $139.3 million for the operating subsidy, $2.4 million for the City special costs and a $7.2 million contribution to theStablization Reserve Fund.
9. The 2002 revenue/cost ratio was calculated as operating revenue/operating expenses (excluding capital from current). The 1999, 2000 and 2001 ratios have been restated to conform to thepresentation adopted in 2002.
10. In 2000, the total subsidy paid by the City was $144.3 million, consisting of $112.5 million for the operating subsidy, $17.6 million for capital from current, $2.1 million for the City special costsand a $12.1 million contribution to the Stabilization Reserve Fund.
11. In 2001, the total subsidy paid by the City was $147.6 million, consisting of $126.6 million for the operating subsidy, $18.1 million for capital from current and $2.9 million for City special costs.
12. In 2002, the total subsidy paid by the City was $152.2 million, consisting of $161.1 million for the operating subsidy, $12.7 million for capital from current, $2.9 million for City special costs,less a $24.5 million draw from the Stabilization Reserve Fund.

Management Directory – 2002
OFFICERS AND SENIOROFFICIALS
Richard C. DucharmeChief General Manager
Robert A. BoutilierDeputy General ManagerSurface Operations
Rick CornacchiaDeputy General ManagerSubway Operations
Lynn I. HilbornDeputy General ManagerCorporate
Brian M. LeckGeneral Counsel
Vincent RodoGeneral Secretary/General ManagerExecutive
John A. SepulisGeneral ManagerEngineering & Construction
Gary M. WebsterGeneral ManagerOperations
DEPARTMENT HEADS
Terry A. AndrewsChief Security Officer(Acting)
Warren H. BartramGeneral SuperintendentTrack and Structure
Dick G. BeecroftChief Auditor
Andy G. BertoloChief Project ManagerConstruction
Scott BlakeyManagerHuman Resources
William D. BrownManagerVehicle Engineering
John D. CannellManagerPension Fund Society
John D. CannonChief Information Officer
Allen J. ChocorlanManagerMaterials and Procurement
Kathryn DeanManagerTraining
Dave DixonGeneral SuperintendentBus Maintenance
Derick FinnGeneral SuperintendentSignals/Electrical/Communications
William G. FrostManagerSupport Services
Bob HughesChief Marketing Officer
Orest Z. KobylanskyGeneral SuperintendentStreetcars
Don LegerGeneral SuperintendentPlant Maintenance
Geoff MarinoffGeneral SuperintendentRail Cars and Shops
Thomas G. MiddlebrookChief Engineer
Paul MillettGeneral SuperintendentSubway Transportation
John P. O'GradyManagerSafety
Michael A. RocheChief Financial Officer
Howard SmithGeneral SuperintendentSurface Transportation
I. Mitchell StamblerManagerService Planning
Robert J. ThackerGeneral SuperintendentWheel-Trans
Charles W. WheelerManagerProperty Development
SUBSIDIARY COMPANIES
Toronto Coach Terminal Inc.Richard C. DucharmePresident
Toronto Transit ConsultantsLimitedVincent RodoTreasurer
TTC Insurance CompanyLimitedVincent RodoPresident
For further information, pleasecontact:
Toronto Transit Commission1900 Yonge Street, Toronto,Ontario, M4S 1Z2Telephone: (416) 393-4000Fax: (416) 485-9394Website: www.ttc.ca