Embed Size (px)
Citation preview
Returns-Focused Sustainable Growth
Corporate Presentation
September 2021
TSX: NVA
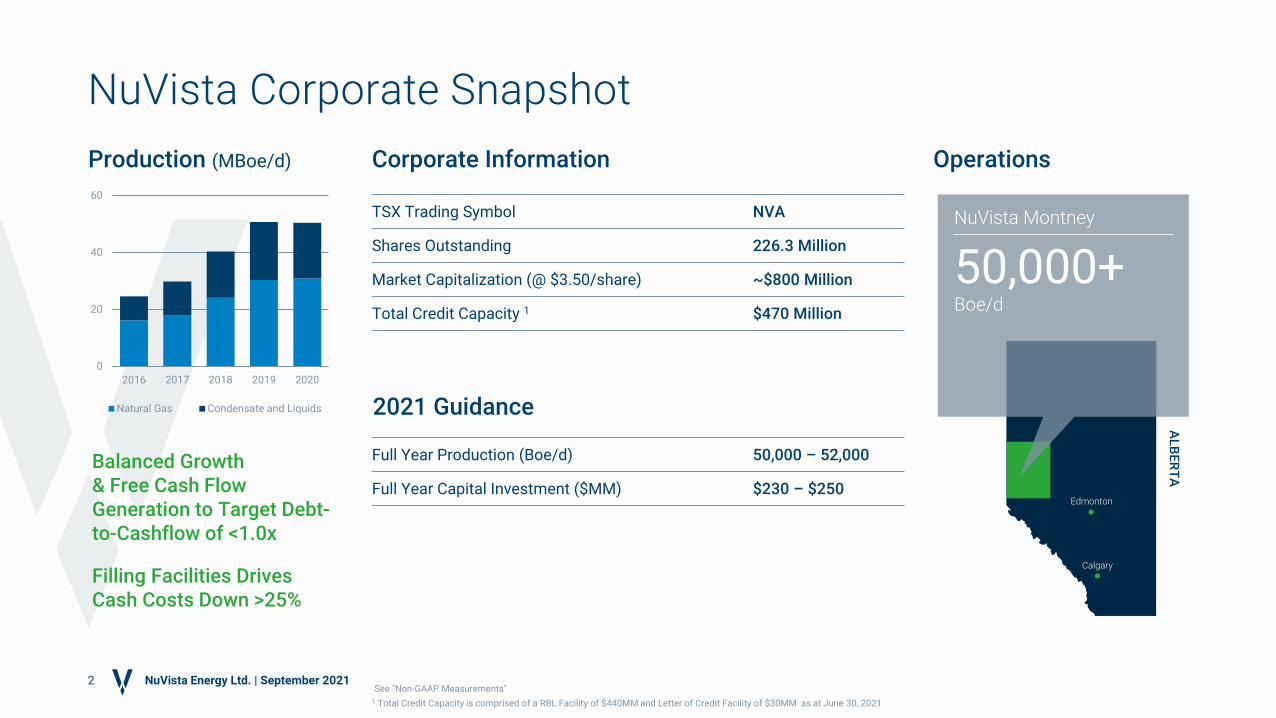
TSX Trading Symbol NVA
Shares Outstanding 226.3 Million
Market Capitalization (@ $3.50/share) ~$800 Million
Total Credit Capacity 1 $470 Million
Balanced Growth & Free Cash Flow Generation to Target Debt-to-Cashflow of <1.0x
Filling Facilities Drives Cash Costs Down >25%
2
NuVista Corporate Snapshot
Corporate Information Operations
Full Year Production (Boe/d) 50,000 – 52,000
Full Year Capital Investment ($MM) $230 – $250
2021 Guidance
NuVista Montney
50,000+Boe/d
Edmonton
Calgary
AL
BE
RT
A
Production (MBoe/d)
0
20
40
60
2016 2017 2018 2019 2020
Natural Gas Condensate and Liquids
NuVista Energy Ltd. | September 2021See "Non-GAAP Measurements"
1 Total Credit Capacity is comprised of a RBL Facility of $440MM and Letter of Credit Facility of $30MM as at June 30, 2021
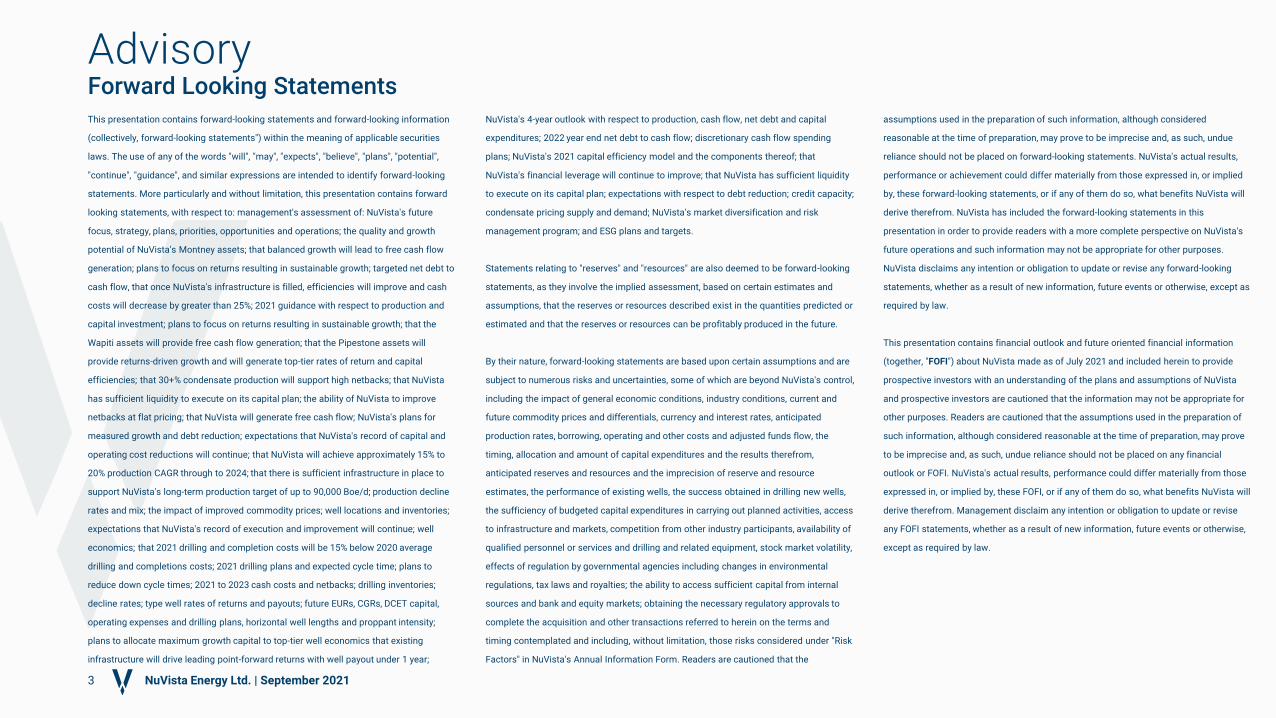
This presentation contains forward-looking statements and forward-looking information
(collectively, forward-looking statements") within the meaning of applicable securities
laws. The use of any of the words "will", "may", "expects", "believe", "plans", "potential",
"continue", "guidance", and similar expressions are intended to identify forward-looking
statements. More particularly and without limitation, this presentation contains forward
looking statements, with respect to: management's assessment of: NuVista's future
focus, strategy, plans, priorities, opportunities and operations; the quality and growth
potential of NuVista's Montney assets; that balanced growth will lead to free cash flow
generation; plans to focus on returns resulting in sustainable growth; targeted net debt to
cash flow, that once NuVista's infrastructure is filled, efficiencies will improve and cash
costs will decrease by greater than 25%; 2021 guidance with respect to production and
capital investment; plans to focus on returns resulting in sustainable growth; that the
Wapiti assets will provide free cash flow generation; that the Pipestone assets will
provide returns-driven growth and will generate top-tier rates of return and capital
efficiencies; that 30+% condensate production will support high netbacks; that NuVista
has sufficient liquidity to execute on its capital plan; the ability of NuVista to improve
netbacks at flat pricing; that NuVista will generate free cash flow; NuVista's plans for
measured growth and debt reduction; expectations that NuVista's record of capital and
operating cost reductions will continue; that NuVista will achieve approximately 15% to
20% production CAGR through to 2024; that there is sufficient infrastructure in place to
support NuVista's long-term production target of up to 90,000 Boe/d; production decline
rates and mix; the impact of improved commodity prices; well locations and inventories;
expectations that NuVista's record of execution and improvement will continue; well
economics; that 2021 drilling and completion costs will be 15% below 2020 average
drilling and completions costs; 2021 drilling plans and expected cycle time; plans to
reduce down cycle times; 2021 to 2023 cash costs and netbacks; drilling inventories;
decline rates; type well rates of returns and payouts; future EURs, CGRs, DCET capital,
operating expenses and drilling plans, horizontal well lengths and proppant intensity;
plans to allocate maximum growth capital to top-tier well economics that existing
infrastructure will drive leading point-forward returns with well payout under 1 year;
NuVista's 4-year outlook with respect to production, cash flow, net debt and capital
expenditures; 2022 year end net debt to cash flow; discretionary cash flow spending
plans; NuVista's 2021 capital efficiency model and the components thereof; that
NuVista's financial leverage will continue to improve; that NuVista has sufficient liquidity
to execute on its capital plan; expectations with respect to debt reduction; credit capacity;
condensate pricing supply and demand; NuVista's market diversification and risk
management program; and ESG plans and targets.
Statements relating to "reserves" and "resources" are also deemed to be forward-looking
statements, as they involve the implied assessment, based on certain estimates and
assumptions, that the reserves or resources described exist in the quantities predicted or
estimated and that the reserves or resources can be profitably produced in the future.
By their nature, forward-looking statements are based upon certain assumptions and are
subject to numerous risks and uncertainties, some of which are beyond NuVista's control,
including the impact of general economic conditions, industry conditions, current and
future commodity prices and differentials, currency and interest rates, anticipated
production rates, borrowing, operating and other costs and adjusted funds flow, the
timing, allocation and amount of capital expenditures and the results therefrom,
anticipated reserves and resources and the imprecision of reserve and resource
estimates, the performance of existing wells, the success obtained in drilling new wells,
the sufficiency of budgeted capital expenditures in carrying out planned activities, access
to infrastructure and markets, competition from other industry participants, availability of
qualified personnel or services and drilling and related equipment, stock market volatility,
effects of regulation by governmental agencies including changes in environmental
regulations, tax laws and royalties; the ability to access sufficient capital from internal
sources and bank and equity markets; obtaining the necessary regulatory approvals to
complete the acquisition and other transactions referred to herein on the terms and
timing contemplated and including, without limitation, those risks considered under "Risk
Factors" in NuVista's Annual Information Form. Readers are cautioned that the
assumptions used in the preparation of such information, although considered
reasonable at the time of preparation, may prove to be imprecise and, as such, undue
reliance should not be placed on forward-looking statements. NuVista's actual results,
performance or achievement could differ materially from those expressed in, or implied
by, these forward-looking statements, or if any of them do so, what benefits NuVista will
derive therefrom. NuVista has included the forward-looking statements in this
presentation in order to provide readers with a more complete perspective on NuVista's
future operations and such information may not be appropriate for other purposes.
NuVista disclaims any intention or obligation to update or revise any forward-looking
statements, whether as a result of new information, future events or otherwise, except as
required by law.
This presentation contains financial outlook and future oriented financial information
(together, "FOFI") about NuVista made as of July 2021 and included herein to provide
prospective investors with an understanding of the plans and assumptions of NuVista
and prospective investors are cautioned that the information may not be appropriate for
other purposes. Readers are cautioned that the assumptions used in the preparation of
such information, although considered reasonable at the time of preparation, may prove
to be imprecise and, as such, undue reliance should not be placed on any financial
outlook or FOFI. NuVista's actual results, performance could differ materially from those
expressed in, or implied by, these FOFI, or if any of them do so, what benefits NuVista will
derive therefrom. Management disclaim any intention or obligation to update or revise
any FOFI statements, whether as a result of new information, future events or otherwise,
except as required by law.
Advisory
3
Forward Looking Statements
NuVista Energy Ltd. | September 2021

Top Quality Assets & Execution• Wapiti: Free cash flow engine
Pipestone: Returns-driven growth
• 30% high-value condensate
• Proven track-record of capital and operating cost reductions
FinancialStrength
Returns-Focused Sustainable Growth
4
NuVista: Focused on ReturnsCORPORATE STRATEGY
Optimal Growth Profile
• Material free cash flow generation
with ~15+% production CAGR
• Target to fill existing infrastructure
with production up to 90k Boe/d
• Capture ~25% of improved
efficiencies upon filling existing
infrastructure
Commitment to Sustainability
• Environmental excellence
• Community-driven culture & values
• Highest governance standards
NuVista Energy Ltd. | September 2021
• Significant liquidity to execute our plan
• Free cash flow for measured growth & debt reduction
• Active risk management & market diversification
See "Non-GAAP Measurements"
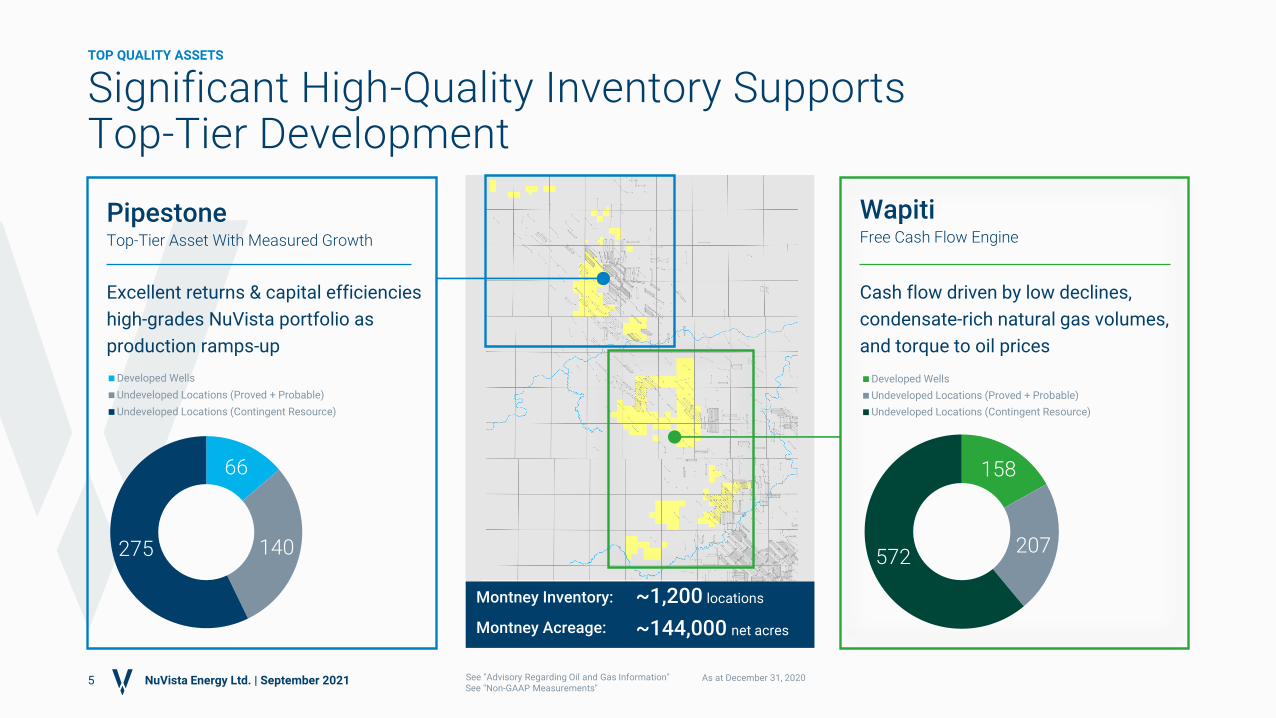
PipestoneTop-Tier Asset With Measured Growth
Excellent returns & capital efficiencies
high-grades NuVista portfolio as
production ramps-up
WapitiFree Cash Flow Engine
Cash flow driven by low declines,
condensate-rich natural gas volumes,
and torque to oil prices
Significant High-Quality Inventory Supports Top-Tier Development
5
66
140275
Developed Wells
Undeveloped Locations (Proved + Probable)
Undeveloped Locations (Contingent Resource)
158
207572
Developed Wells
Undeveloped Locations (Proved + Probable)
Undeveloped Locations (Contingent Resource)
See "Advisory Regarding Oil and Gas Information"
TOP QUALITY ASSETS
NuVista Energy Ltd. | September 2021
Montney Inventory:
Montney Acreage:
See "Non-GAAP Measurements"
~1,200 locations
~144,000 net acres
As at December 31, 2020
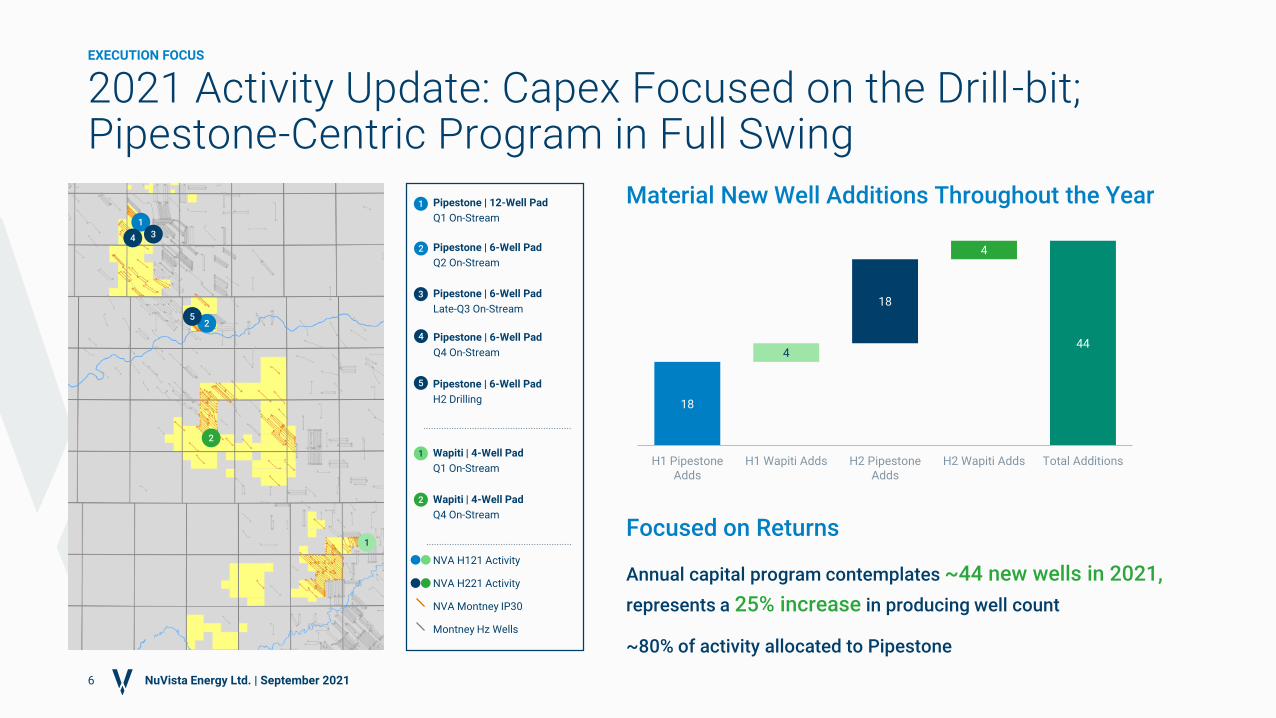
2021 Activity Update: Capex Focused on the Drill-bit; Pipestone-Centric Program in Full Swing
Focused on Returns
Annual capital program contemplates ~44 new wells in 2021,
represents a 25% increase in producing well count
~80% of activity allocated to Pipestone
6
Pipestone | 12-Well Pad
Q1 On-Stream
Pipestone | 6-Well Pad
Q2 On-Stream
Wapiti | 4-Well Pad
Q1 On-Stream
1
2
1
1
2
1
NVA H121 Activity
NVA H221 Activity
NVA Montney IP30
Montney Hz Wells
EXECUTION FOCUS
NuVista Energy Ltd. | September 2021
2
34
5
2
3
4
Wapiti | 4-Well Pad
Q4 On-Stream
Pipestone | 6-Well Pad
Late-Q3 On-Stream
Pipestone | 6-Well Pad
Q4 On-Stream
5 Pipestone | 6-Well Pad
H2 Drilling
Material New Well Additions Throughout the Year
18
444
18
4
H1 PipestoneAdds
H1 Wapiti Adds H2 PipestoneAdds
H2 Wapiti Adds Total Additions
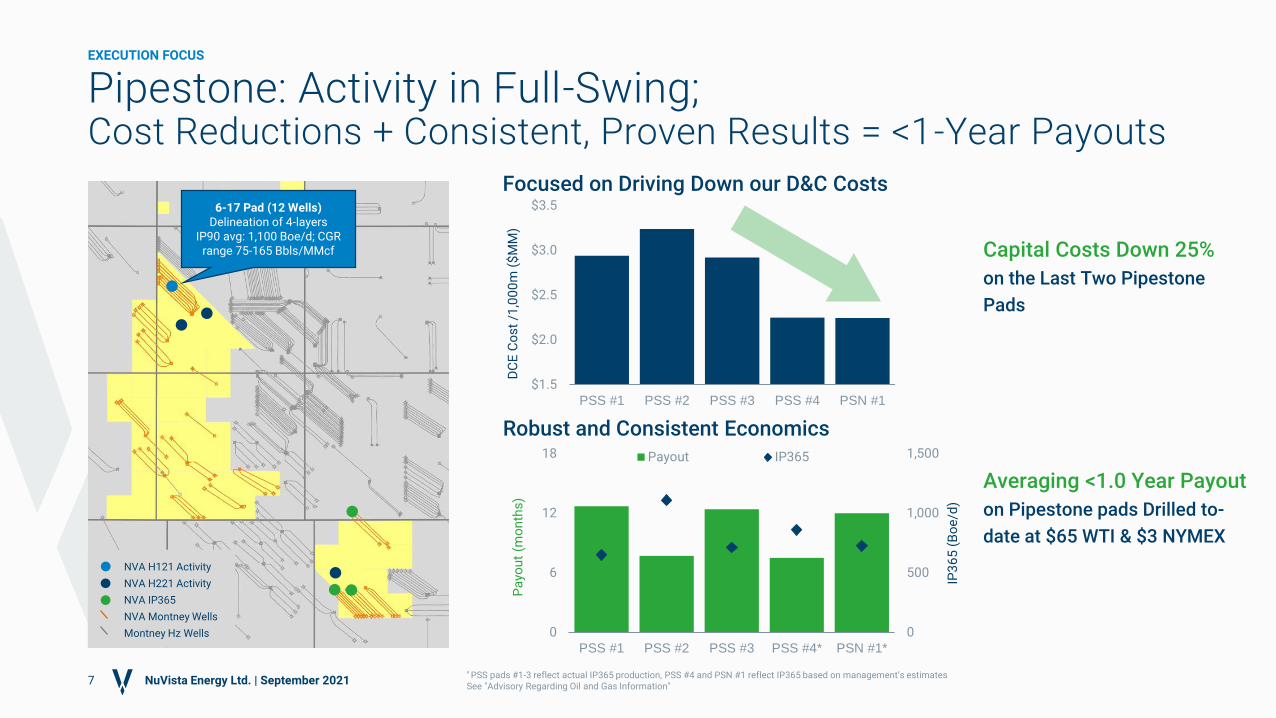
Focused on Driving Down our D&C Costs
Capital Costs Down 25%
on the Last Two Pipestone
Pads
Pipestone: Activity in Full-Swing; Cost Reductions + Consistent, Proven Results = <1-Year Payouts
Averaging <1.0 Year Payout
on Pipestone pads Drilled to-
date at $65 WTI & $3 NYMEX
Robust and Consistent Economics
7
EXECUTION FOCUS
NuVista Energy Ltd. | September 2021* PSS pads #1-3 reflect actual IP365 production, PSS #4 and PSN #1 reflect IP365 based on management’s estimatesSee "Advisory Regarding Oil and Gas Information"
NVA H121 Activity
NVA H221 Activity
NVA IP365
NVA Montney Wells
Montney Hz Wells
6-17 Pad (12 Wells)Delineation of 4-layers
IP90 avg: 1,100 Boe/d; CGR range 75-165 Bbls/MMcf
0
500
1,000
1,500
0
6
12
18
PSS #1 PSS #2 PSS #3 PSS #4* PSN #1*
IP3
65
(B
oe
/d)
Pa
you
t (m
on
ths
)
Payout IP365
$1.5
$2.0
$2.5
$3.0
$3.5
PSS #1 PSS #2 PSS #3 PSS #4 PSN #1
DC
E C
os
t /1
,00
0m
($
MM
)
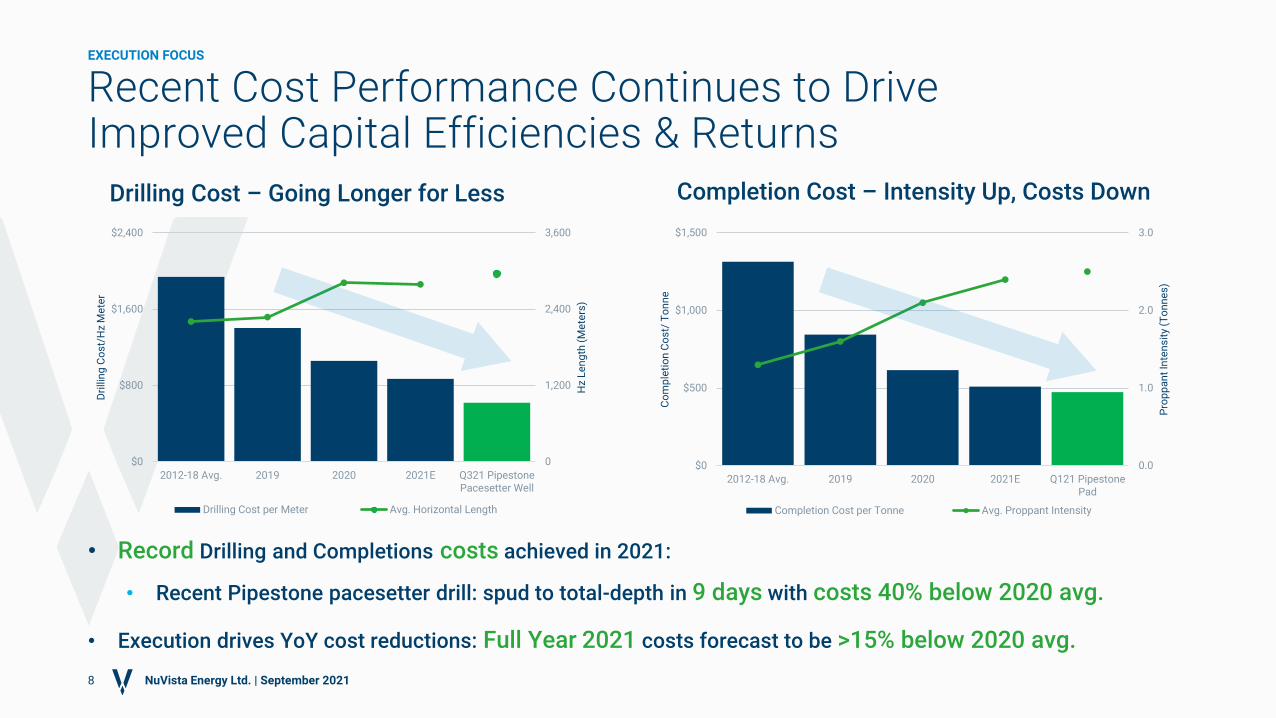
Drilling Cost – Going Longer for Less
Recent Cost Performance Continues to Drive Improved Capital Efficiencies & Returns
• Record Drilling and Completions costs achieved in 2021:
• Recent Pipestone pacesetter drill: spud to total-depth in 9 days with costs 40% below 2020 avg.
• Execution drives YoY cost reductions: Full Year 2021 costs forecast to be >15% below 2020 avg.
0
1,200
2,400
3,600
$0
$800
$1,600
$2,400
2012-18 Avg. 2019 2020 2021E Q321 PipestonePacesetter Well
Hz
Le
ng
th (
Me
ters
)
Dri
llin
g C
os
t/H
z M
ete
r
Drilling Cost per Meter Avg. Horizontal Length
Completion Cost – Intensity Up, Costs Down
0.0
1.0
2.0
3.0
$0
$500
$1,000
$1,500
2012-18 Avg. 2019 2020 2021E Q121 PipestonePad
Pro
pp
an
t In
ten
sit
y (T
on
ne
s)
Co
mp
leti
on
Co
st/
To
nn
e
Completion Cost per Tonne Avg. Proppant Intensity
8
EXECUTION FOCUS
NuVista Energy Ltd. | September 2021
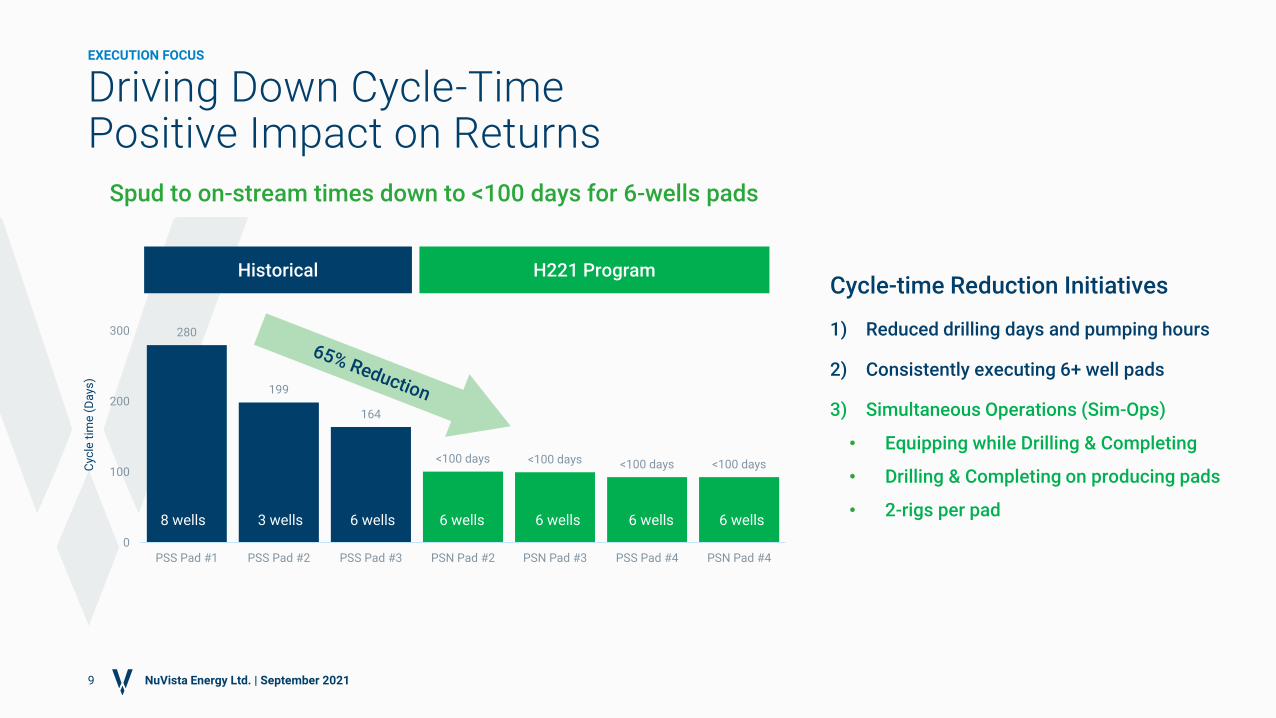
Spud to on-stream times down to <100 days for 6-wells pads
Driving Down Cycle-TimePositive Impact on Returns
Cycle-time Reduction Initiatives
1) Reduced drilling days and pumping hours
2) Consistently executing 6+ well pads
3) Simultaneous Operations (Sim-Ops)
• Equipping while Drilling & Completing
• Drilling & Completing on producing pads
• 2-rigs per pad
280
199
164
<100 days <100 days <100 days <100 days
0
100
200
300
PSS Pad #1 PSS Pad #2 PSS Pad #3 PSN Pad #2 PSN Pad #3 PSS Pad #4 PSN Pad #4
Cyc
le t
ime
(D
ays
)
8 wells 3 wells 6 wells 6 wells 6 wells 6 wells 6 wells
9
EXECUTION FOCUS
NuVista Energy Ltd. | September 2021
Historical H221 Program
$5
$10
$15
$20
Q121 2021 2022 2023+
($/B
oe
)
Cash Costs Netback
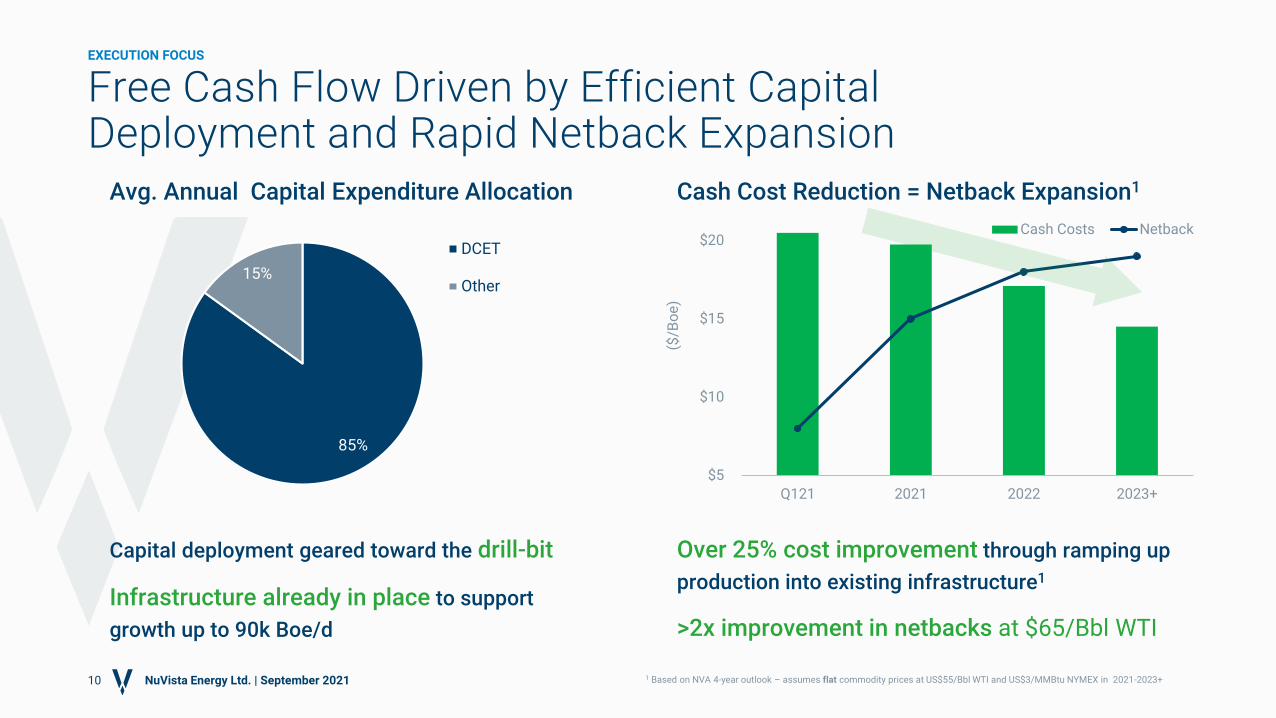
Avg. Annual Capital Expenditure Allocation
Free Cash Flow Driven by Efficient Capital Deployment and Rapid Netback Expansion
Capital deployment geared toward the drill-bit
Infrastructure already in place to support
growth up to 90k Boe/d
Cash Cost Reduction = Netback Expansion1
10
EXECUTION FOCUS
NuVista Energy Ltd. | September 2021
85%
15%
DCET
Other
1 Based on NVA 4-year outlook – assumes flat commodity prices at US$55/Bbl WTI and US$3/MMBtu NYMEX in 2021-2023+
Over 25% cost improvement through ramping up
production into existing infrastructure1
>2x improvement in netbacks at $65/Bbl WTI
Pricing Assumptions:$55/Bbl WTI: US$55/Bbl WTI; US$3.00/MMBtu NYMEX; 1.25 Fx$65/Bbl WTI: US$65/Bbl WTI; US$3.00/MMBtu NYMEX; 1.25 Fx
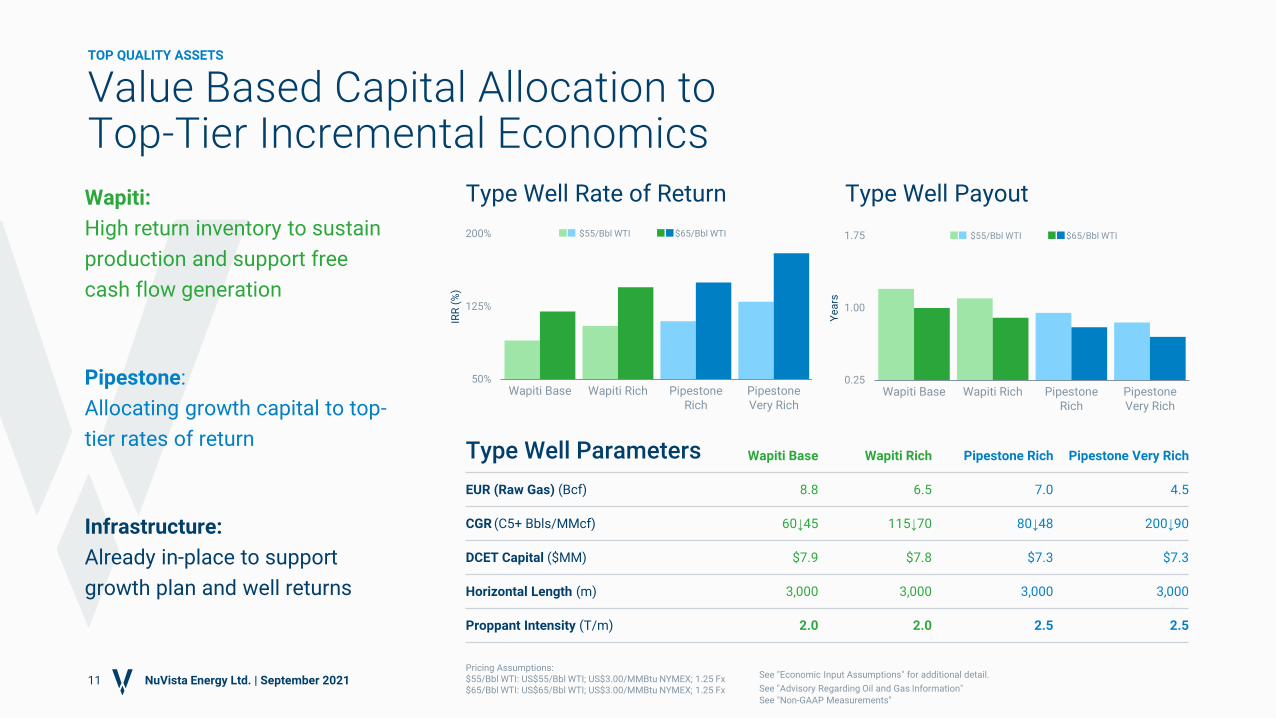
0.25
1.00
1.75
Wapiti Base Wapiti Rich PipestoneRich
PipestoneVery Rich
Ye
ars
Wapiti Base Wapiti Rich Pipestone Rich Pipestone Very Rich
EUR (Raw Gas) (Bcf) 8.8 6.5 7.0 4.5
CGR (C5+ Bbls/MMcf) 60↓45 115↓70 80↓48 200↓90
DCET Capital ($MM) $7.9 $7.8 $7.3 $7.3
Horizontal Length (m) 3,000 3,000 3,000 3,000
Proppant Intensity (T/m) 2.0 2.0 2.5 2.5
Type Well Parameters
11
Value Based Capital Allocation to Top-Tier Incremental Economics
50%
125%
200%
Wapiti Base Wapiti Rich PipestoneRich
PipestoneVery Rich
IRR
(%
)
Type Well Rate of Return Type Well Payout
TOP QUALITY ASSETS
NuVista Energy Ltd. | September 2021
Wapiti:
High return inventory to sustain
production and support free
cash flow generation
Pipestone:
Allocating growth capital to top-
tier rates of return
Infrastructure:
Already in-place to support
growth plan and well returns
$55/Bbl WTI $65/Bbl WTI
See "Advisory Regarding Oil and Gas Information"
See "Non-GAAP Measurements"
$55/Bbl WTI $65/Bbl WTI
See "Economic Input Assumptions" for additional detail.
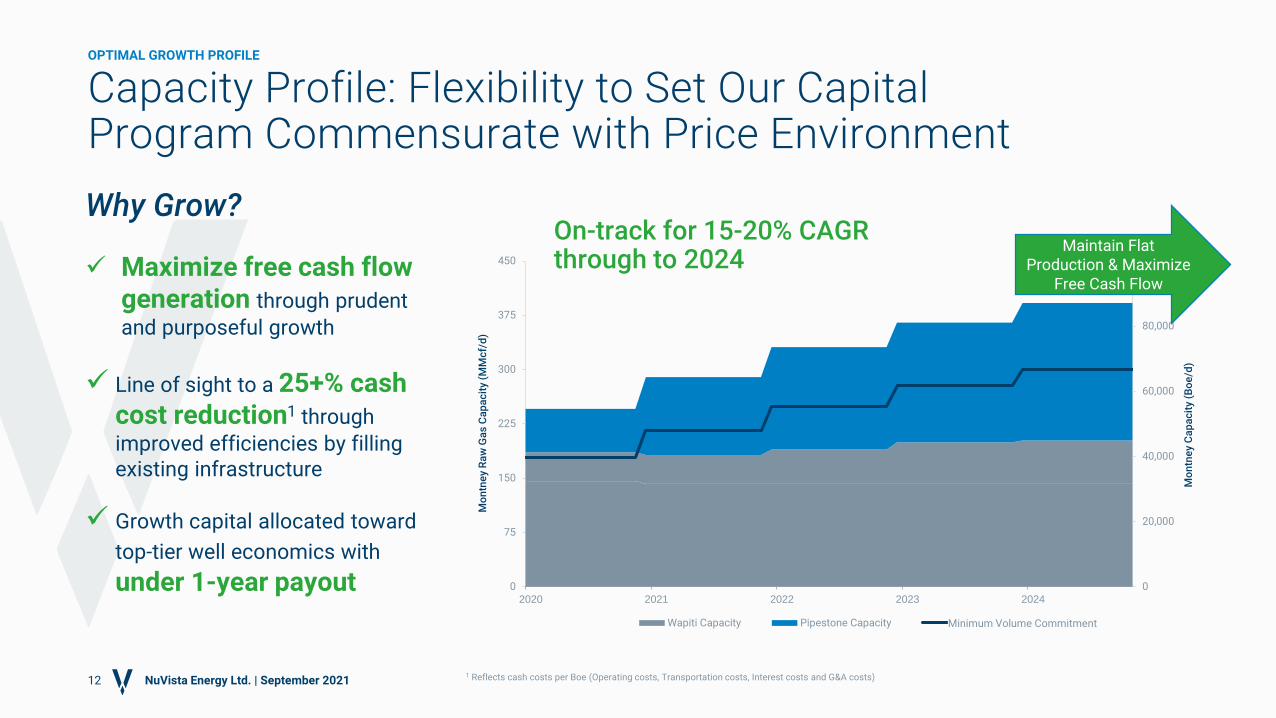
0
20,000
40,000
60,000
80,000
100,000
0
75
150
225
300
375
450
2020 2021 2022 2023 2024
Mo
ntn
ey
Ca
pa
cit
y (B
oe
/d)
Mo
ntn
ey
Ra
w G
as
Ca
pa
cit
y (M
Mc
f/d
)
Wapiti Capacity Pipestone Capacity Minimum Take-or-Pay
Why Grow?
✓ Maximize free cash flow generation through prudent
and purposeful growth
✓ Line of sight to a 25+% cash cost reduction1 through
improved efficiencies by filling existing infrastructure
✓ Growth capital allocated toward
top-tier well economics with
under 1-year payout
Capacity Profile: Flexibility to Set Our Capital Program Commensurate with Price Environment
12
On-track for 15-20% CAGR through to 2024
OPTIMAL GROWTH PROFILE
NuVista Energy Ltd. | September 2021
Minimum Volume Commitment
1 Reflects cash costs per Boe (Operating costs, Transportation costs, Interest costs and G&A costs)
Maintain Flat Production & Maximize
Free Cash Flow
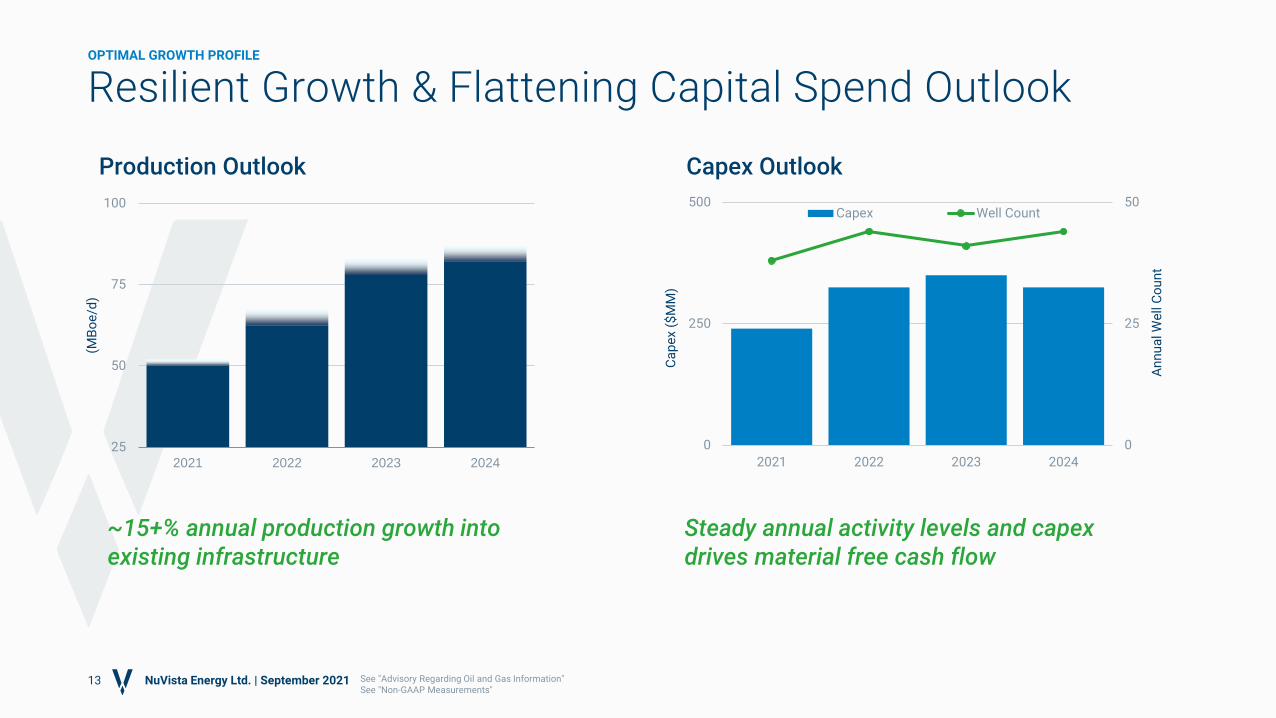
25
50
75
100
2021 2022 2023 2024
(MB
oe
/d)
13
Resilient Growth & Flattening Capital Spend Outlook
Production Outlook Capex Outlook
OPTIMAL GROWTH PROFILE
NuVista Energy Ltd. | September 2021 See "Advisory Regarding Oil and Gas Information"See "Non-GAAP Measurements"
0
25
50
0
250
500
2021 2022 2023 2024
An
nu
al W
ell
Co
un
t
Ca
pe
x ($
MM
)
Capex Well Count
~15+% annual production growth into existing infrastructure
Steady annual activity levels and capex drives material free cash flow
1Pricing Assumptions: Fx = 1.25 CAD/USDH221: US$70/Bbl WTI; US$3.80/MMBtu NYMEX2022-2024: US$65/Bbl WTI; US$3.00/MMBtu NYMEXSee "Economic Input Assumptions" for additional detail.
*Based on 2021 Production and Capital Investment Guidance midpoint.*Presentation of 2021 FCF includes $94MM of Disposition Proceeds.
14
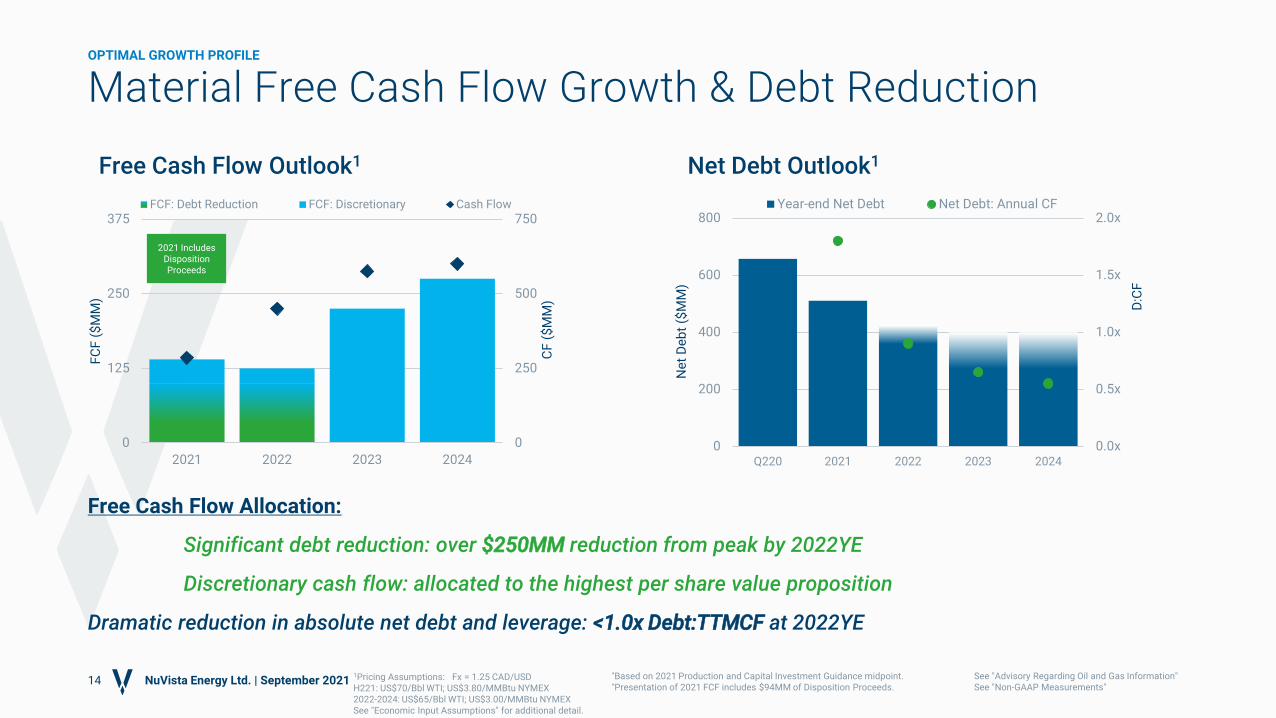
Material Free Cash Flow Growth & Debt Reduction
Free Cash Flow Outlook1
OPTIMAL GROWTH PROFILE
NuVista Energy Ltd. | September 2021 See "Advisory Regarding Oil and Gas Information"See "Non-GAAP Measurements"
Net Debt Outlook1
Free Cash Flow Allocation:
Significant debt reduction: over $250MM reduction from peak by 2022YE
Discretionary cash flow: allocated to the highest per share value proposition
Dramatic reduction in absolute net debt and leverage: <1.0x Debt:TTMCF at 2022YE
0
250
500
750
0
125
250
375
2021 2022 2023 2024
CF
($
MM
)
FC
F (
$M
M)
FCF: Debt Reduction FCF: Discretionary Cash Flow
0.0x
0.5x
1.0x
1.5x
2.0x
0
200
400
600
800
Q220 2021 2022 2023 2024
D:C
F
Ne
t D
eb
t ($
MM
)
Year-end Net Debt Net Debt: Annual CF
2021 Includes Disposition Proceeds
$310
$160
Drawn Undrawn
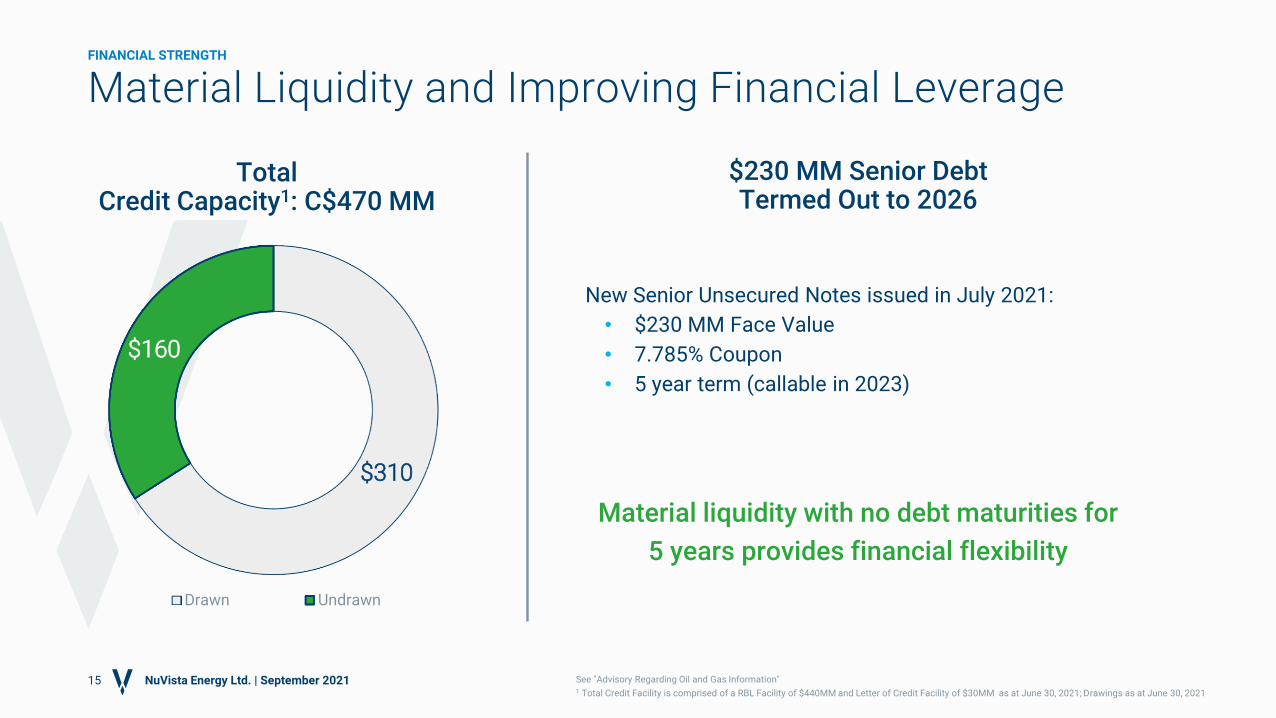
$230 MM Senior Debt Termed Out to 2026
Material Liquidity and Improving Financial Leverage
15
FINANCIAL STRENGTH
NuVista Energy Ltd. | September 2021 See "Advisory Regarding Oil and Gas Information"
Material liquidity with no debt maturities for
5 years provides financial flexibility
TotalCredit Capacity1: C$470 MM
New Senior Unsecured Notes issued in July 2021:
• $230 MM Face Value
• 7.785% Coupon
• 5 year term (callable in 2023)
1 Total Credit Facility is comprised of a RBL Facility of $440MM and Letter of Credit Facility of $30MM as at June 30, 2021; Drawings as at June 30, 2021
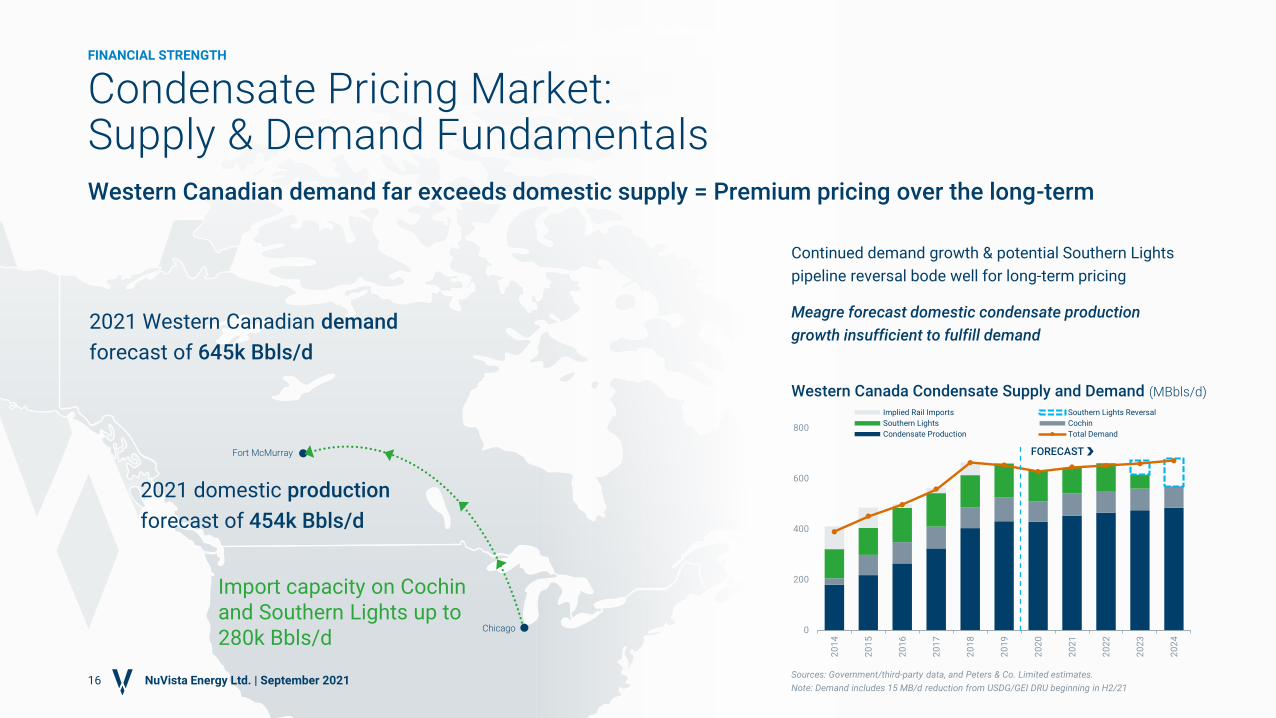
Import capacity on Cochin and Southern Lights up to 280k Bbls/d
Continued demand growth & potential Southern Lights
pipeline reversal bode well for long-term pricing
Meagre forecast domestic condensate production
growth insufficient to fulfill demand
Western Canadian demand far exceeds domestic supply = Premium pricing over the long-term
Condensate Pricing Market: Supply & Demand Fundamentals
2021 Western Canadian demand
forecast of 645k Bbls/d
2021 domestic production
forecast of 454k Bbls/d
Fort McMurray
Chicago
16Sources: Government/third-party data, and Peters & Co. Limited estimates.
Note: Demand includes 15 MB/d reduction from USDG/GEI DRU beginning in H2/21
0
200
400
600
800
20
14
20
15
20
16
20
17
20
18
20
19
20
20
20
21
20
22
20
23
20
24
Implied Rail Imports Southern Lights Reversal
Southern Lights Cochin
Condensate Production Total Demand
Western Canada Condensate Supply and Demand (MBbls/d)
FORECAST
FINANCIAL STRENGTH
NuVista Energy Ltd. | September 2021
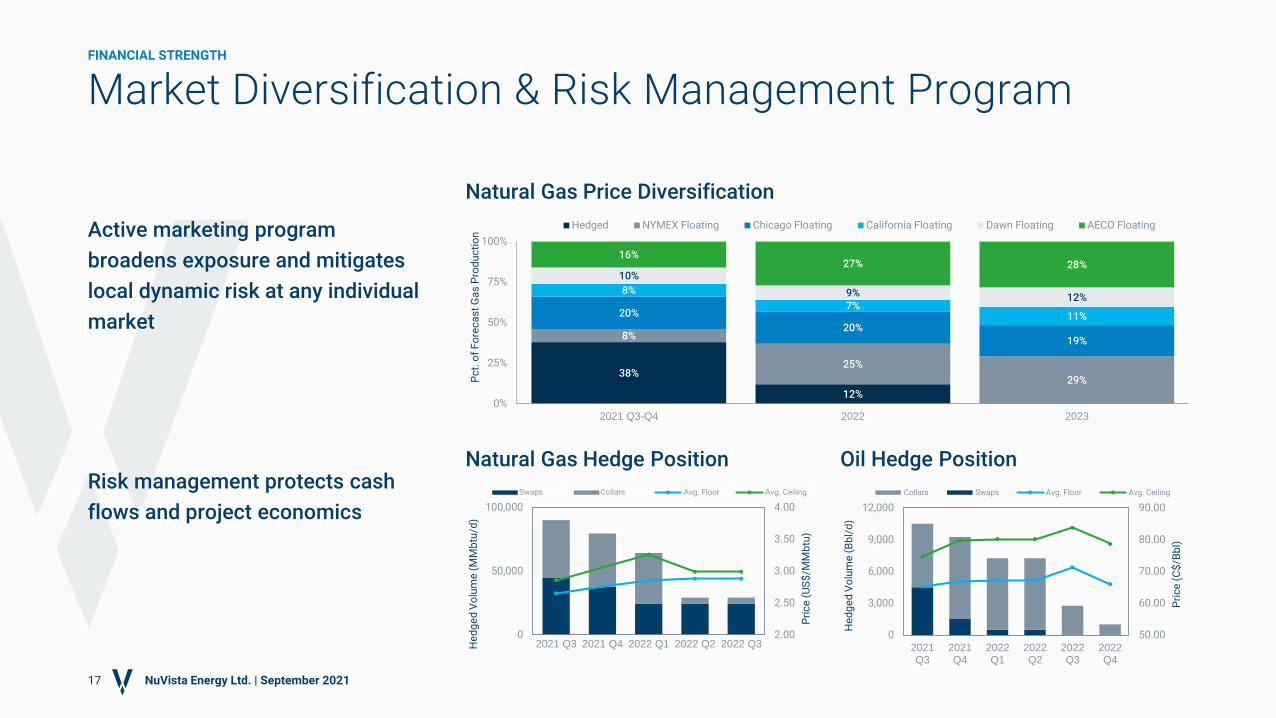
Natural Gas Price Diversification
Active marketing program
broadens exposure and mitigates
local dynamic risk at any individual
market
38%
12%
8%
25%
29%
20%
20%19%
8%
7%11%
10%
9% 12%
16%27% 28%
0%
25%
50%
75%
100%
2021 Q3-Q4 2022 2023
Pc
t. o
f F
ore
ca
st
Ga
s P
rod
uc
tio
n
Hedged NYMEX Floating Chicago Floating California Floating Dawn Floating AECO Floating
Natural Gas Hedge Position Oil Hedge PositionRisk management protects cash
flows and project economics
2.00
2.50
3.00
3.50
4.00
0
50,000
100,000
2021 Q3 2021 Q4 2022 Q1 2022 Q2 2022 Q3
Pri
ce
(U
S$
/MM
btu
)
He
dg
ed
Vo
lum
e (
MM
btu
/d)
Series4 Series1 Series2 Series3
50.00
60.00
70.00
80.00
90.00
0
3,000
6,000
9,000
12,000
2021Q3
2021Q4
2022Q1
2022Q2
2022Q3
2022Q4
Pri
ce
(C
$/B
bl)
He
dg
ed
Vo
lum
e (
Bb
l/d
)
Collars Swaps Avg. Floor Avg. Ceiling
17
Market Diversification & Risk Management ProgramFINANCIAL STRENGTH
NuVista Energy Ltd. | September 2021
Swaps Collars Avg. Floor Avg. Ceiling
0
0.01
0.02
0.03
0.04
0.05
2012 2013 2014 2015 2016 2017 2018 2019 2020
GH
G In
ten
sit
y (t
CO
2e
/ B
OE
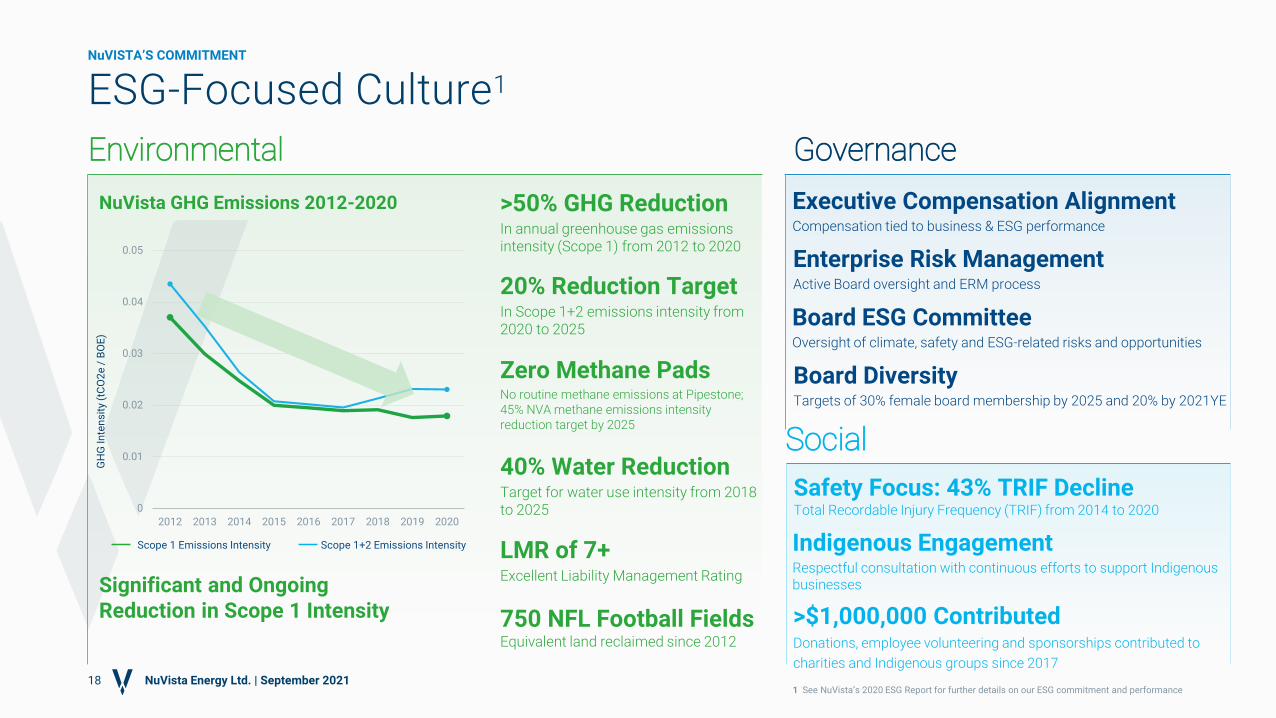
)ESG-Focused Culture1
>50% GHG ReductionIn annual greenhouse gas emissions intensity (Scope 1) from 2012 to 2020
181 See NuVista’s 2020 ESG Report for further details on our ESG commitment and performance
750 NFL Football FieldsEquivalent land reclaimed since 2012
LMR of 7+Excellent Liability Management Rating
40% Water ReductionTarget for water use intensity from 2018 to 2025
20% Reduction TargetIn Scope 1+2 emissions intensity from 2020 to 2025
NuVista GHG Emissions 2012-2020
Environmental
Board ESG CommitteeOversight of climate, safety and ESG-related risks and opportunities
Board DiversityTargets of 30% female board membership by 2025 and 20% by 2021YE
Governance
>$1,000,000 ContributedDonations, employee volunteering and sponsorships contributed to
charities and Indigenous groups since 2017
Social
Safety Focus: 43% TRIF DeclineTotal Recordable Injury Frequency (TRIF) from 2014 to 2020
NuVista Energy Ltd. | September 2021
NuVISTA’S COMMITMENT
Executive Compensation AlignmentCompensation tied to business & ESG performance
Indigenous EngagementRespectful consultation with continuous efforts to support Indigenous businesses
Enterprise Risk ManagementActive Board oversight and ERM process
Zero Methane PadsNo routine methane emissions at Pipestone; 45% NVA methane emissions intensity reduction target by 2025
Significant and Ongoing Reduction in Scope 1 Intensity
Scope 1 Emissions Intensity Scope 1+2 Emissions Intensity
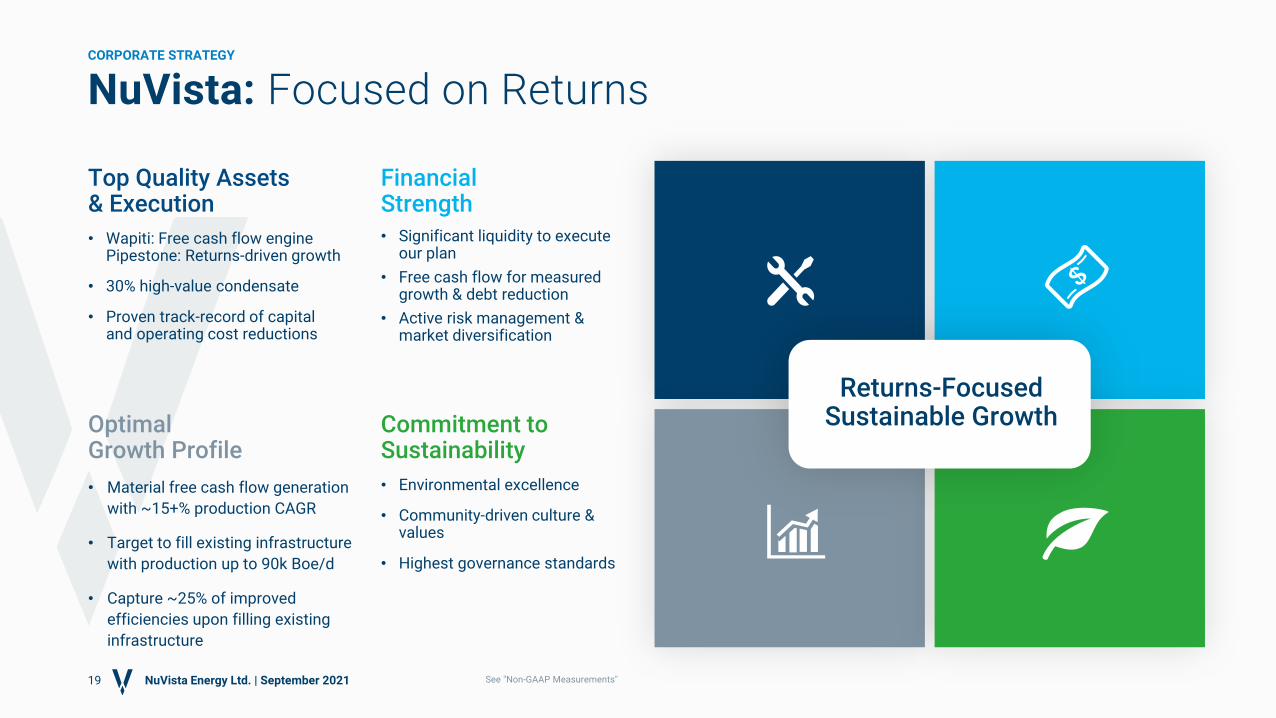
Top Quality Assets & Execution
• Wapiti: Free cash flow enginePipestone: Returns-driven growth
• 30% high-value condensate
• Proven track-record of capital and operating cost reductions
FinancialStrength
Returns-Focused Sustainable Growth
19
NuVista: Focused on ReturnsCORPORATE STRATEGY
Optimal Growth Profile
• Material free cash flow generation
with ~15+% production CAGR
• Target to fill existing infrastructure
with production up to 90k Boe/d
• Capture ~25% of improved
efficiencies upon filling existing
infrastructure
Commitment to Sustainability
• Environmental excellence
• Community-driven culture & values
• Highest governance standards
NuVista Energy Ltd. | September 2021 See "Non-GAAP Measurements"
• Significant liquidity to execute our plan
• Free cash flow for measured growth & debt reduction
• Active risk management & market diversification
Thank you
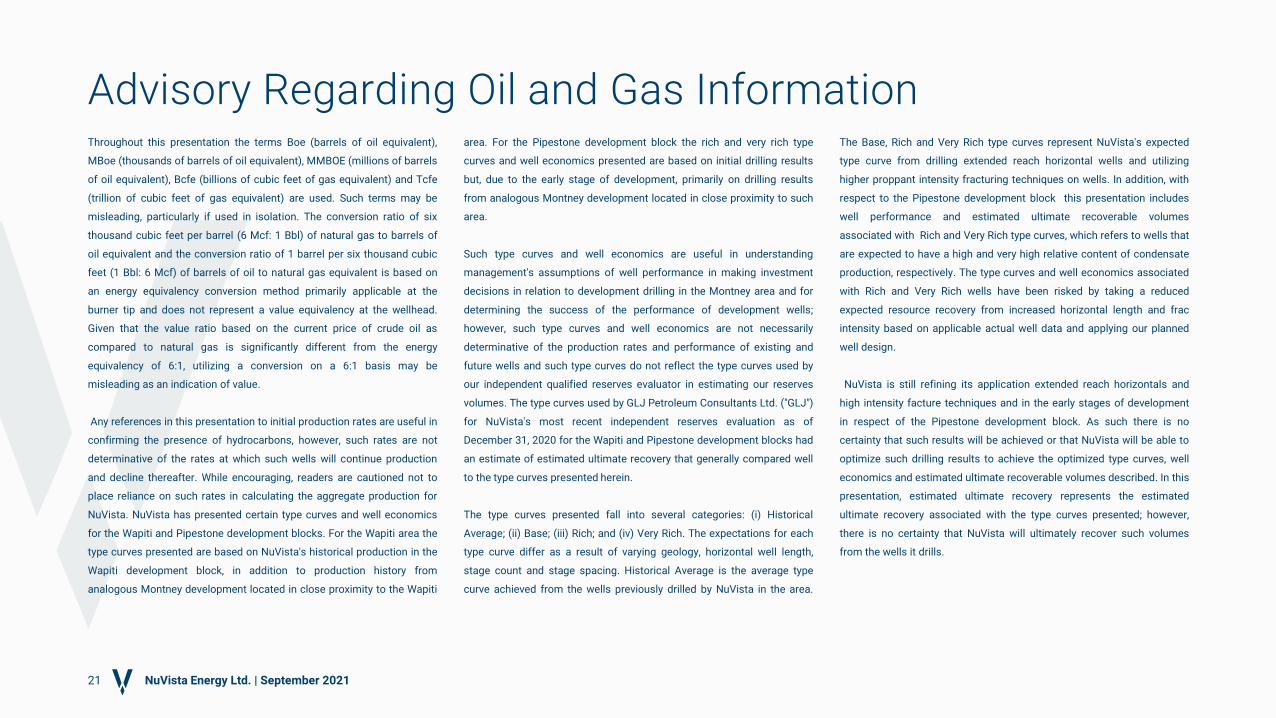
Throughout this presentation the terms Boe (barrels of oil equivalent),
MBoe (thousands of barrels of oil equivalent), MMBOE (millions of barrels
of oil equivalent), Bcfe (billions of cubic feet of gas equivalent) and Tcfe
(trillion of cubic feet of gas equivalent) are used. Such terms may be
misleading, particularly if used in isolation. The conversion ratio of six
thousand cubic feet per barrel (6 Mcf: 1 Bbl) of natural gas to barrels of
oil equivalent and the conversion ratio of 1 barrel per six thousand cubic
feet (1 Bbl: 6 Mcf) of barrels of oil to natural gas equivalent is based on
an energy equivalency conversion method primarily applicable at the
burner tip and does not represent a value equivalency at the wellhead.
Given that the value ratio based on the current price of crude oil as
compared to natural gas is significantly different from the energy
equivalency of 6:1, utilizing a conversion on a 6:1 basis may be
misleading as an indication of value.
Any references in this presentation to initial production rates are useful in
confirming the presence of hydrocarbons, however, such rates are not
determinative of the rates at which such wells will continue production
and decline thereafter. While encouraging, readers are cautioned not to
place reliance on such rates in calculating the aggregate production for
NuVista. NuVista has presented certain type curves and well economics
for the Wapiti and Pipestone development blocks. For the Wapiti area the
type curves presented are based on NuVista's historical production in the
Wapiti development block, in addition to production history from
analogous Montney development located in close proximity to the Wapiti
area. For the Pipestone development block the rich and very rich type
curves and well economics presented are based on initial drilling results
but, due to the early stage of development, primarily on drilling results
from analogous Montney development located in close proximity to such
area.
Such type curves and well economics are useful in understanding
management's assumptions of well performance in making investment
decisions in relation to development drilling in the Montney area and for
determining the success of the performance of development wells;
however, such type curves and well economics are not necessarily
determinative of the production rates and performance of existing and
future wells and such type curves do not reflect the type curves used by
our independent qualified reserves evaluator in estimating our reserves
volumes. The type curves used by GLJ Petroleum Consultants Ltd. ("GLJ")
for NuVista's most recent independent reserves evaluation as of
December 31, 2020 for the Wapiti and Pipestone development blocks had
an estimate of estimated ultimate recovery that generally compared well
to the type curves presented herein.
The type curves presented fall into several categories: (i) Historical
Average; (ii) Base; (iii) Rich; and (iv) Very Rich. The expectations for each
type curve differ as a result of varying geology, horizontal well length,
stage count and stage spacing. Historical Average is the average type
curve achieved from the wells previously drilled by NuVista in the area.
The Base, Rich and Very Rich type curves represent NuVista's expected
type curve from drilling extended reach horizontal wells and utilizing
higher proppant intensity fracturing techniques on wells. In addition, with
respect to the Pipestone development block this presentation includes
well performance and estimated ultimate recoverable volumes
associated with Rich and Very Rich type curves, which refers to wells that
are expected to have a high and very high relative content of condensate
production, respectively. The type curves and well economics associated
with Rich and Very Rich wells have been risked by taking a reduced
expected resource recovery from increased horizontal length and frac
intensity based on applicable actual well data and applying our planned
well design.
NuVista is still refining its application extended reach horizontals and
high intensity facture techniques and in the early stages of development
in respect of the Pipestone development block. As such there is no
certainty that such results will be achieved or that NuVista will be able to
optimize such drilling results to achieve the optimized type curves, well
economics and estimated ultimate recoverable volumes described. In this
presentation, estimated ultimate recovery represents the estimated
ultimate recovery associated with the type curves presented; however,
there is no certainty that NuVista will ultimately recover such volumes
from the wells it drills.
Advisory Regarding Oil and Gas Information
21 NuVista Energy Ltd. | September 2021
In presenting such type curves, inputs and economics information and in this
presentation generally, NuVista has used a number of oil and gas metrics
which do not have standardized meanings and therefore may be calculated
differently from the metrics presented by other oil and gas companies. Such
metrics include "DCET", "EUR", "CGR", "Horizontal Length", "Proppant Intensity",
"payout" and "IRR". DCET includes all capital spent to drill, complete, equip and
tie-in a well. EUR represents the estimated ultimate recovery of resources
associated with the type curves presented. CGR means the condensate to gas
ratio and provides the barrels of natural gas liquids recovered for each MMcf
of gas recovered. Horizontal length is the length of the horizontal leg of a well.
Proppant intensity is the tonnes of proppant used per metre in fraccing
operations for completing wells. Payout means the anticipated years of
production from a well required to fully pay for the DCET of such well. IRR
means the rate of return of a well or the discount rate required to arrive at a
net present value equal to zero.
This presentation discloses NuVista's drilling locations in two categories: (i)
undeveloped proved plus probable (2P) drilling locations; and (ii) undeveloped
contingent resources (2C) drilling locations. Undeveloped 2P drilling locations
are derived from a report prepared by GLJ, NuVista's independent qualified
reserves evaluator, evaluating NuVista's reserves as of December 31, 2020
(the "GLJ Report"), and account for undeveloped drilling locations that have
associated proved and/or probable reserves, as applicable. Undeveloped 2C
drilling locations are derived from a report prepared by GLJ evaluating
NuVista's contingent resources as of December 31, 2020 ("GLJ Contingent
Resource Report"), and account for undeveloped drilling locations that have
associated contingent resources based on a best estimate of such contingent
resources. There is no certainty that we will drill all drilling locations and if
drilled there is no certainty that such locations will result in additional oil and
gas production. The drilling locations on which we actually drill wells will
ultimately depend upon the availability of capital, regulatory approvals,
seasonal restrictions, oil and natural gas prices, costs, actual drilling results,
additional reservoir information that is obtained and other factors. Contingent
resources are those quantities of petroleum estimated, as of a given date, to
be potentially recoverable from known accumulations using established
technology or technology under development, but which are not currently
considered to be commercially recoverable due to one or more contingencies.
In the case of the contingent resources estimated in the GLJ Contingent
Resource Report, contingencies include: (i) further delineation of interest
lands; (ii) corporate commitment, and; (iii) final development plan. To further
delineate interest lands additional wells must be drilled and tested to
demonstrate commercial rates on the resource lands. Reserves are only
assigned in close proximity to demonstrated productivity. As continued
delineation drilling occurs, a portion of the contingent resources are expected
to be reclassified as reserves. Confirmation of corporate intent to proceed with
remaining capital expenditures within a reasonable timeframe is a
requirement for the assessment of reserves. Finalization of a development
plan includes timing, infrastructure spending and the commitment of capital.
Determination of productivity levels is generally required before the company
can prepare firm development plans and commit required capital for the
development of the contingent resources. There is uncertainty that it will be
commercially viable to produce any portion of the contingent resources.
Certain information in this presentation may constitute "analogous
information" as defined in National Instrument 51-101 - Standards of
Disclosure for Oil and Gas Activities with respect to the certain drilling results,
total production in the Montney, number of wells drilled, or offset well
production from other producers with operations that are in geographical
proximity to or believed to be on-trend with NuVista's Montney assets.
Management of NuVista believes the information may be relevant to help
determine the expected results that NuVista may achieve within NuVista's
lands and such information has been presented to help demonstrate the basis
for NuVista's business plans and strategies with respect to its Montney
assets. There is no certainty that the results of the analogous information or
inferred thereby will be achieved by NuVista and such information should not
be construed as an estimate of future production levels, reserves or the actual
characteristics and quality of NuVista's Montney assets.
Advisory Regarding Oil and Gas Information
22 NuVista Energy Ltd. | September 2021
Advisory Regarding Oil and Gas Information
23 NuVista Energy Ltd. | September 2021
ADVISORY REGARDING OIL AND GAS INFORMATION
The reserves estimates for 2020 presented herein have been evaluated by
independent qualified reserves evaluators in accordance with NI 51- 101
and the Canadian Oil and Gas Evaluation Handbook ("COGE Handbook"),
are effective December 31, 2020 and are based on an independent
evaluation by GLJ using January 1, 2020 forecast pricing. The contingent
resource drilling locations are derived from the GLJ Contingent Resource
Report. The reserves and resources presented herein have been
categorized in accordance with the reserves and resource definitions as
set out in the COGE Handbook. The reserves estimates for prior years
have also been evaluated on the same basis, are effective as of
December 31 of the applicable year and are based on an independent
evaluation of GLJ using January 1 forecast pricing of the applicable year.
The estimate of future net revenue of NuVista's reserves disclosed in this
presentation do not represent fair market value. The estimates of
reserves and future net revenue for individual properties may not reflect
the same confidence level as estimates of reserves and future net
revenue for all properties, due to the effects of aggregation.
ECONOMIC INPUT ASSUMPTIONS
• NuVista's type curve based on management's best estimates
• CGR yield represents the equivalent constant yield for the full life of
the well
• Pricing Assumptions:
• $55/Bbl WTI Scenario:
• US$55/Bbl WTI
• US$3.00/MMBtu NYMEX
• 1.25:1 Fx (CAD:USD)
• $65/Bbl WTI Scenario:
• US$65/Bbl WTI
• US$3.00/MMBtu NYMEX
• 1.25:1 Fx (CAD:USD)
• Price case flat on a real basis; costs inflated at 2% per annum
• NGL's as % of WTI: C3 = 30%; C4 = 65%; C5+ = WTI -US$1/Bbl
• Recovered liquids unit transportation cost: C3/C4 = C$6/Bbl;
C5+ = $7/Bbl
• Gas price offset reflects NuVista's aggregate egress pipeline tolls
and a $US0.75/MMBtu AECO to NYMEX basis
EMISSIONS BENCHMARK METHODOLOGY
North American Benchmark GHG Intensity (tCO2E/Boe): the weighted
average of a relevant gas benchmark and a relevant oil benchmark to
reflect NuVista's production (1/3 liquids, 2/3 natural gas). The two
benchmarks that contribute to our NVA benchmark are identified below.
1. Average "production and upgrading" emissions for oil in USA
refineries: ARC Energy Research Institute: Crude Oil Investing in a
Carbon Constrained World: 2017 Update. October 2017 = 0.059 x
1/3
2. Average upstream emissions for Canadian shale gas: Natural
Resources Canada, “Shale Gas Update for GHGenius”, August 2011,
Prepared by S&T2 Consultants = 0.059 x 2/3
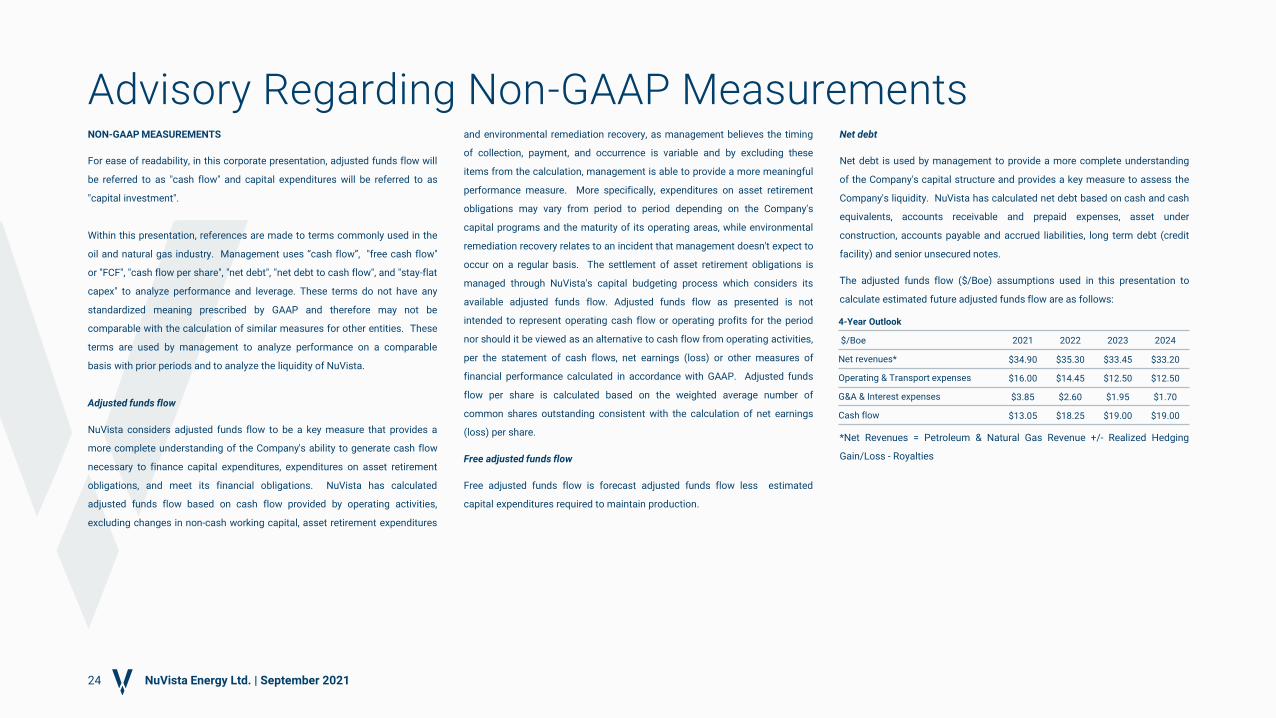
NON-GAAP MEASUREMENTS
For ease of readability, in this corporate presentation, adjusted funds flow will
be referred to as "cash flow" and capital expenditures will be referred to as
"capital investment".
Within this presentation, references are made to terms commonly used in the
oil and natural gas industry. Management uses “cash flow”, "free cash flow"
or "FCF", "cash flow per share", "net debt", "net debt to cash flow", and "stay-flat
capex" to analyze performance and leverage. These terms do not have any
standardized meaning prescribed by GAAP and therefore may not be
comparable with the calculation of similar measures for other entities. These
terms are used by management to analyze performance on a comparable
basis with prior periods and to analyze the liquidity of NuVista.
Adjusted funds flow
NuVista considers adjusted funds flow to be a key measure that provides a
more complete understanding of the Company's ability to generate cash flow
necessary to finance capital expenditures, expenditures on asset retirement
obligations, and meet its financial obligations. NuVista has calculated
adjusted funds flow based on cash flow provided by operating activities,
excluding changes in non-cash working capital, asset retirement expenditures
and environmental remediation recovery, as management believes the timing
of collection, payment, and occurrence is variable and by excluding these
items from the calculation, management is able to provide a more meaningful
performance measure. More specifically, expenditures on asset retirement
obligations may vary from period to period depending on the Company's
capital programs and the maturity of its operating areas, while environmental
remediation recovery relates to an incident that management doesn't expect to
occur on a regular basis. The settlement of asset retirement obligations is
managed through NuVista's capital budgeting process which considers its
available adjusted funds flow. Adjusted funds flow as presented is not
intended to represent operating cash flow or operating profits for the period
nor should it be viewed as an alternative to cash flow from operating activities,
per the statement of cash flows, net earnings (loss) or other measures of
financial performance calculated in accordance with GAAP. Adjusted funds
flow per share is calculated based on the weighted average number of
common shares outstanding consistent with the calculation of net earnings
(loss) per share.
Free adjusted funds flow
Free adjusted funds flow is forecast adjusted funds flow less estimated
capital expenditures required to maintain production.
Net debt
Net debt is used by management to provide a more complete understanding
of the Company's capital structure and provides a key measure to assess the
Company's liquidity. NuVista has calculated net debt based on cash and cash
equivalents, accounts receivable and prepaid expenses, asset under
construction, accounts payable and accrued liabilities, long term debt (credit
facility) and senior unsecured notes.
The adjusted funds flow ($/Boe) assumptions used in this presentation to
calculate estimated future adjusted funds flow are as follows:
*Net Revenues = Petroleum & Natural Gas Revenue +/- Realized Hedging
Gain/Loss - Royalties
Advisory Regarding Non-GAAP Measurements
24 NuVista Energy Ltd. | September 2021
4-Year Outlook
$/Boe 2021 2022 2023 2024
Net revenues* $34.90 $35.30 $33.45 $33.20
Operating & Transport expenses $16.00 $14.45 $12.50 $12.50
G&A & Interest expenses $3.85 $2.60 $1.95 $1.70
Cash flow $13.05 $18.25 $19.00 $19.00
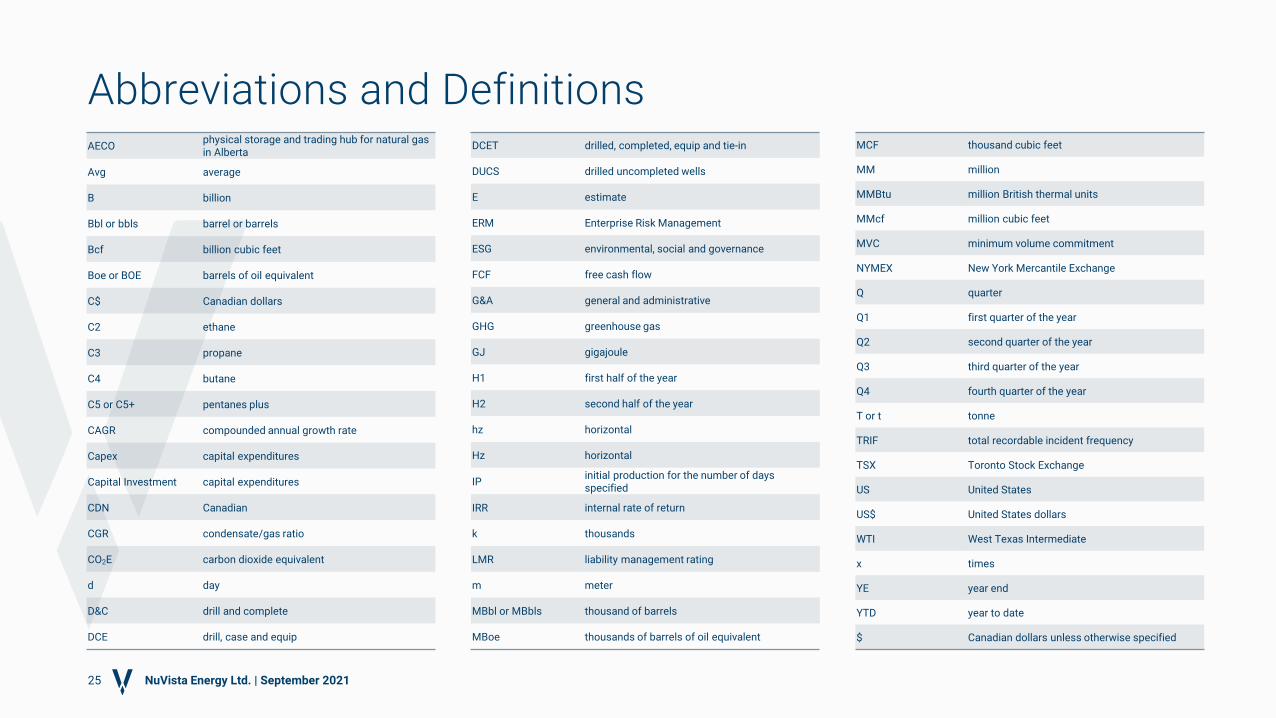
AECOphysical storage and trading hub for natural gas in Alberta
Avg average
B billion
Bbl or bbls barrel or barrels
Bcf billion cubic feet
Boe or BOE barrels of oil equivalent
C$ Canadian dollars
C2 ethane
C3 propane
C4 butane
C5 or C5+ pentanes plus
CAGR compounded annual growth rate
Capex capital expenditures
Capital Investment capital expenditures
CDN Canadian
CGR condensate/gas ratio
CO2E carbon dioxide equivalent
d day
D&C drill and complete
DCE drill, case and equip
DCET drilled, completed, equip and tie-in
DUCS drilled uncompleted wells
E estimate
ERM Enterprise Risk Management
ESG environmental, social and governance
FCF free cash flow
G&A general and administrative
GHG greenhouse gas
GJ gigajoule
H1 first half of the year
H2 second half of the year
hz horizontal
Hz horizontal
IPinitial production for the number of days specified
IRR internal rate of return
k thousands
LMR liability management rating
m meter
MBbl or MBbls thousand of barrels
MBoe thousands of barrels of oil equivalent
MCF thousand cubic feet
MM million
MMBtu million British thermal units
MMcf million cubic feet
MVC minimum volume commitment
NYMEX New York Mercantile Exchange
Q quarter
Q1 first quarter of the year
Q2 second quarter of the year
Q3 third quarter of the year
Q4 fourth quarter of the year
T or t tonne
TRIF total recordable incident frequency
TSX Toronto Stock Exchange
US United States
US$ United States dollars
WTI West Texas Intermediate
x times
YE year end
YTD year to date
$ Canadian dollars unless otherwise specified
Abbreviations and Definitions
NuVista Energy Ltd. | September 202125