Embed Size (px)
Citation preview
Page 1 Q3 2012 Financial Statements
TSX: CEN November 12, 2012 AIM: CEO
Coastal Energy Announces Third Quarter 2012 Financial Results & Operations Update
Coastal Energy Company (the “Company” or “Coastal Energy”) (TSX: CEN, AIM: CEO), an independent exploration and production company with assets in Thailand, announces the financial results for the three and nine months ended September 30, 2012. The functional and reporting currency of the Company is the United States dollar.
Third Quarter 2012 Highlights
Total Company production increased to 21,798 boe/d in the third quarter from 12,028 boe/d in the same period last year. The Company‟s offshore production was 19,626 bbl/d compared to 10,191 bbl/d in Q3 2011, with the increase due to the inclusion of production from both platforms at Bua Ban North. Offshore production was impacted by downtime at Bua Ban North and Songkhla during rig moves as well as the MOPU replacement at Bua Ban North. Onshore production of 2,172 boe/d increased from Q3 2011 levels of 1,837 boe/d as natural gas demand continued to recover following the flooding in Thailand in late 2011.
EBITDAX for Q3 2012 was $114.6 million, 157% higher than the $44.7 million recorded in Q3 2011. Revenue and EBITDAX were driven higher by increased oil liftings and commodity prices. Crude oil inventory was 577,863 barrels at September 30, 2012, the revenue from which will be recognized in the fourth quarter. The Company saw closing inventory increase by 121,445 barrels (approximately 27%) during Q3 2012.
The Company announced successful drilling results in the Songkhla A field. The A-10 well, drilled in the eastern most fault block of the field, encountered a record amount of net pay for the basin and exhibited very favorable reservoir characteristics in the Lower Oligocene interval. In late September 2012, the well was brought on production at approximately 4,000 bbl/d. Subsequently, the Company drilled the A-13 well in the previously untested northeast fault block and encountered 67 feet of net pay in the Lower Oligocene. Successful results from the A-13 provide the opportunity for an additional well (Songkhla A-19) higher up structure to add additional pay thickness.
The Company completed the conversion of the Richmond mobile offshore production unit (MOPU). Subsequently, in October 2012, the Richmond was installed at the Bua Ban North B field, increasing production capabilities to 55,000 bbl/d. The previous MOPU in the Bua Ban North B field was purchased by the Company and reinstalled at Bua Ban South.
The Company signed a contract with a subsidiary of Atwood Oceanics, Inc. for the Manta jackup drilling rig. The rig is scheduled to be delivered by late November and will conduct drilling operations for the Company in the Gulf of Thailand and offshore Malaysia.
The Company upsized and amended its senior secured revolving credit facility with BNP Paribas and Commonwealth Bank of Australia. The facility has been increased from $100 million to $200 million and includes two additional banks, Standard Bank and Standard Chartered Bank.
The Company is approximately 60% complete with the acquisition of new 3D seismic data being shot over the entire Songkhla basin. Current expectations are for delivery of the processed data in Q1 2013.
The following financial statements for the Company are abbreviated versions. The Company's complete financial statements for the three and nine months ended September 30, 2012 with the notes thereto and the related Management Discussion and Analysis can be found either on Coastal's website at www.CoastalEnergy.com or on SEDAR at www.sedar.com. All amounts are in US$ thousands, except share and per share amounts.
Page 2 Q3 2012 Financial Statements
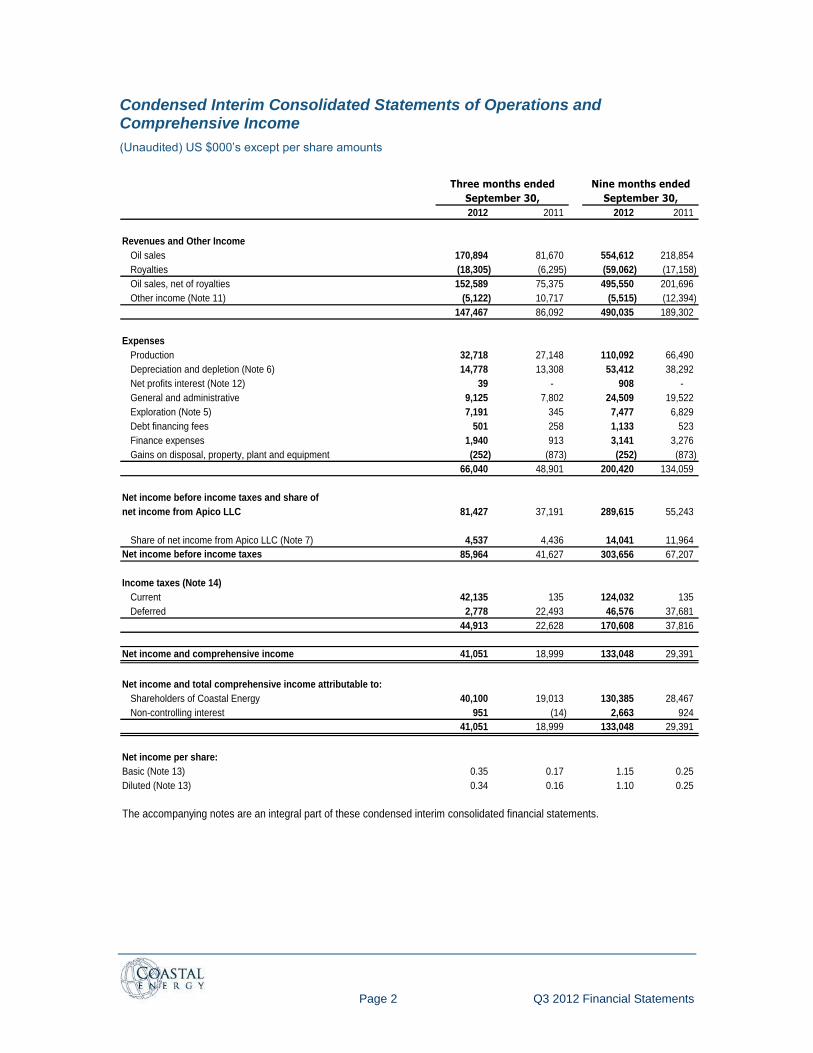
Condensed Interim Consolidated Statements of Operations and Comprehensive Income
(Unaudited) US $000‟s except per share amounts
2012 2011 2012 2011
Revenues and Other Income
Oil sales 170,894 81,670 554,612 218,854
Royalties (18,305) (6,295) (59,062) (17,158)
Oil sales, net of royalties 152,589 75,375 495,550 201,696
Other income (Note 11) (5,122) 10,717 (5,515) (12,394)
147,467 86,092 490,035 189,302
Expenses
Production 32,718 27,148 110,092 66,490
Depreciation and depletion (Note 6) 14,778 13,308 53,412 38,292
Net profits interest (Note 12) 39 - 908 -
General and administrative 9,125 7,802 24,509 19,522
Exploration (Note 5) 7,191 345 7,477 6,829
Debt financing fees 501 258 1,133 523
Finance expenses 1,940 913 3,141 3,276
Gains on disposal, property, plant and equipment (252) (873) (252) (873)
66,040 48,901 200,420 134,059
Net income before income taxes and share of
net income from Apico LLC 81,427 37,191 289,615 55,243
Share of net income from Apico LLC (Note 7) 4,537 4,436 14,041 11,964
Net income before income taxes 85,964 41,627 303,656 67,207
Income taxes (Note 14)
Current 42,135 135 124,032 135
Deferred 2,778 22,493 46,576 37,681
44,913 22,628 170,608 37,816
Net income and comprehensive income 41,051 18,999 133,048 29,391
Net income and total comprehensive income attributable to:
Shareholders of Coastal Energy 40,100 19,013 130,385 28,467
Non-controlling interest 951 (14) 2,663 924
41,051 18,999 133,048 29,391
Net income per share:
Basic (Note 13) 0.35 0.17 1.15 0.25
Diluted (Note 13) 0.34 0.16 1.10 0.25
The accompanying notes are an integral part of these condensed interim consolidated financial statements.
Three months ended Nine months ended
September 30, September 30,
Page 3 Q3 2012 Financial Statements
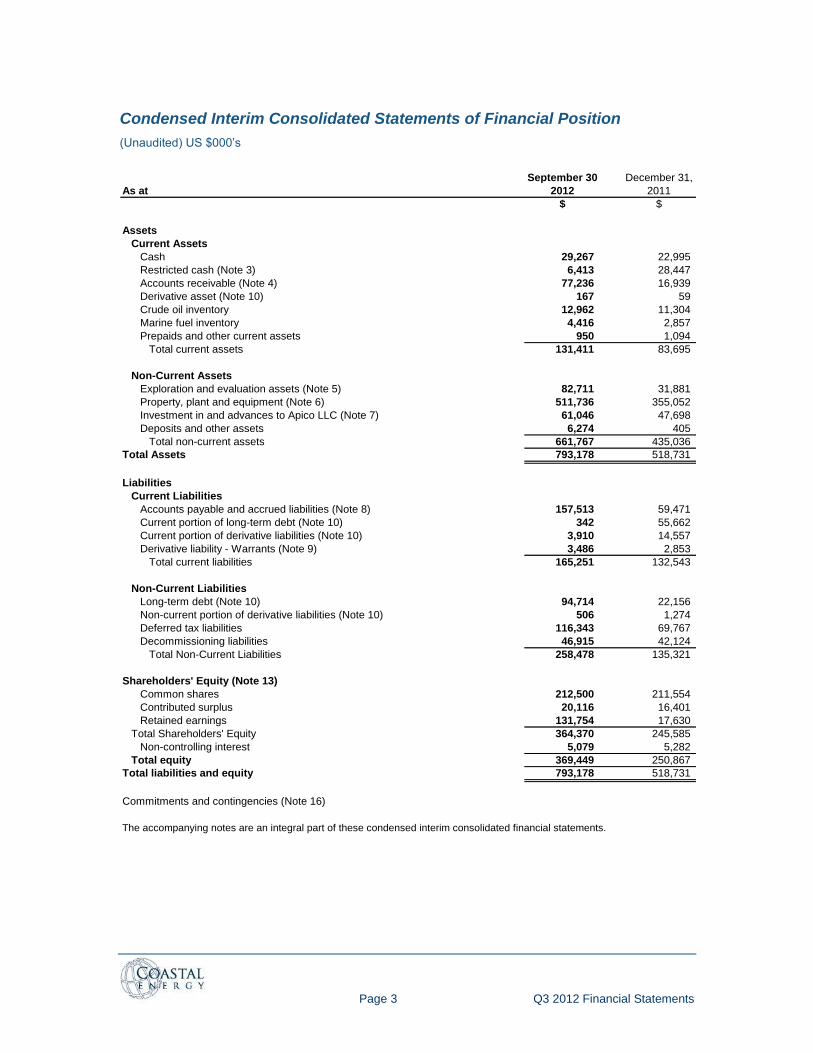
Condensed Interim Consolidated Statements of Financial Position
(Unaudited) US $000‟s
September 30 December 31,
As at 2012 2011
$ $
Assets
Current Assets
Cash 29,267 22,995
Restricted cash (Note 3) 6,413 28,447
Accounts receivable (Note 4) 77,236 16,939
Derivative asset (Note 10) 167 59
Crude oil inventory 12,962 11,304
Marine fuel inventory 4,416 2,857
Prepaids and other current assets 950 1,094
Total current assets 131,411 83,695
Non-Current Assets
Exploration and evaluation assets (Note 5) 82,711 31,881
Property, plant and equipment (Note 6) 511,736 355,052
Investment in and advances to Apico LLC (Note 7) 61,046 47,698
Deposits and other assets 6,274 405
Total non-current assets 661,767 435,036
Total Assets 793,178 518,731
Liabilities
Current Liabilities
Accounts payable and accrued liabilities (Note 8) 157,513 59,471
Current portion of long-term debt (Note 10) 342 55,662
Current portion of derivative liabilities (Note 10) 3,910 14,557
Derivative liability - Warrants (Note 9) 3,486 2,853
Total current liabilities 165,251 132,543
Non-Current Liabilities
Long-term debt (Note 10) 94,714 22,156
Non-current portion of derivative liabilities (Note 10) 506 1,274
Deferred tax liabilities 116,343 69,767
Decommissioning liabilities 46,915 42,124
Total Non-Current Liabilities 258,478 135,321
Shareholders' Equity (Note 13)
Common shares 212,500 211,554
Contributed surplus 20,116 16,401
Retained earnings 131,754 17,630
Total Shareholders' Equity 364,370 245,585
Non-controlling interest 5,079 5,282
Total equity 369,449 250,867
Total liabilities and equity 793,178 518,731
Commitments and contingencies (Note 16)
The accompanying notes are an integral part of these condensed interim consolidated financial statements.
Page 4 Q3 2012 Financial Statements
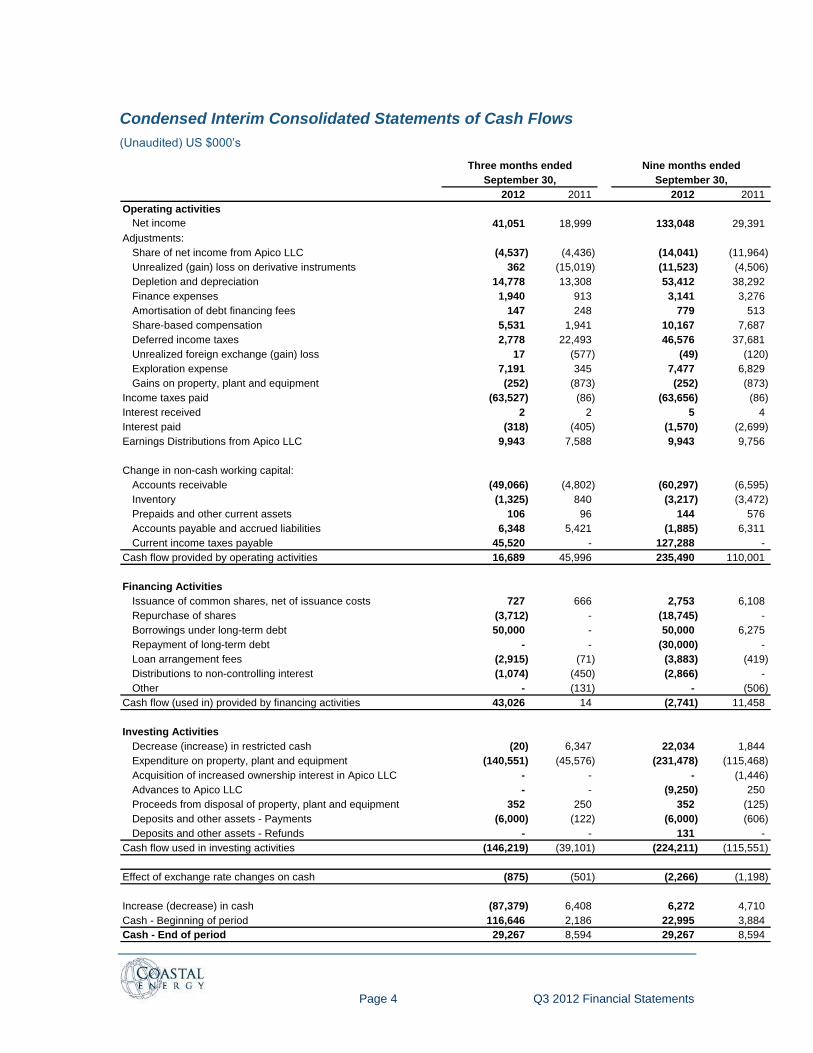
Condensed Interim Consolidated Statements of Cash Flows
(Unaudited) US $000‟s
2012 2011 2012 2011
Operating activities
Net income 41,051 18,999 133,048 29,391
Adjustments:
Share of net income from Apico LLC (4,537) (4,436) (14,041) (11,964)
Unrealized (gain) loss on derivative instruments 362 (15,019) (11,523) (4,506)
Depletion and depreciation 14,778 13,308 53,412 38,292
Finance expenses 1,940 913 3,141 3,276
Amortisation of debt financing fees 147 248 779 513
Share-based compensation 5,531 1,941 10,167 7,687
Deferred income taxes 2,778 22,493 46,576 37,681
Unrealized foreign exchange (gain) loss 17 (577) (49) (120)
Exploration expense 7,191 345 7,477 6,829
Gains on property, plant and equipment (252) (873) (252) (873)
Income taxes paid (63,527) (86) (63,656) (86)
Interest received 2 2 5 4
Interest paid (318) (405) (1,570) (2,699)
Earnings Distributions from Apico LLC 9,943 7,588 9,943 9,756
Change in non-cash working capital:
Accounts receivable (49,066) (4,802) (60,297) (6,595)
Inventory (1,325) 840 (3,217) (3,472)
Prepaids and other current assets 106 96 144 576
Accounts payable and accrued liabilities 6,348 5,421 (1,885) 6,311
Current income taxes payable 45,520 - 127,288 -
Cash flow provided by operating activities 16,689 45,996 235,490 110,001
Financing Activities
Issuance of common shares, net of issuance costs 727 666 2,753 6,108
Repurchase of shares (3,712) - (18,745) -
Borrowings under long-term debt 50,000 - 50,000 6,275
Repayment of long-term debt - - (30,000) -
Loan arrangement fees (2,915) (71) (3,883) (419)
Distributions to non-controlling interest (1,074) (450) (2,866) -
Other - (131) - (506)
Cash flow (used in) provided by financing activities 43,026 14 (2,741) 11,458
Investing Activities
Decrease (increase) in restricted cash (20) 6,347 22,034 1,844
Expenditure on property, plant and equipment (140,551) (45,576) (231,478) (115,468)
Acquisition of increased ownership interest in Apico LLC - - - (1,446)
Advances to Apico LLC - - (9,250) 250
Proceeds from disposal of property, plant and equipment 352 250 352 (125)
Deposits and other assets - Payments (6,000) (122) (6,000) (606)
Deposits and other assets - Refunds - - 131 -
Cash flow used in investing activities (146,219) (39,101) (224,211) (115,551)
Effect of exchange rate changes on cash (875) (501) (2,266) (1,198)
Increase (decrease) in cash (87,379) 6,408 6,272 4,710
Cash - Beginning of period 116,646 2,186 22,995 3,884
Cash - End of period 29,267 8,594 29,267 8,594
Three months ended Nine months ended
September 30, September 30,
Page 5 Q3 2012 Financial Statements
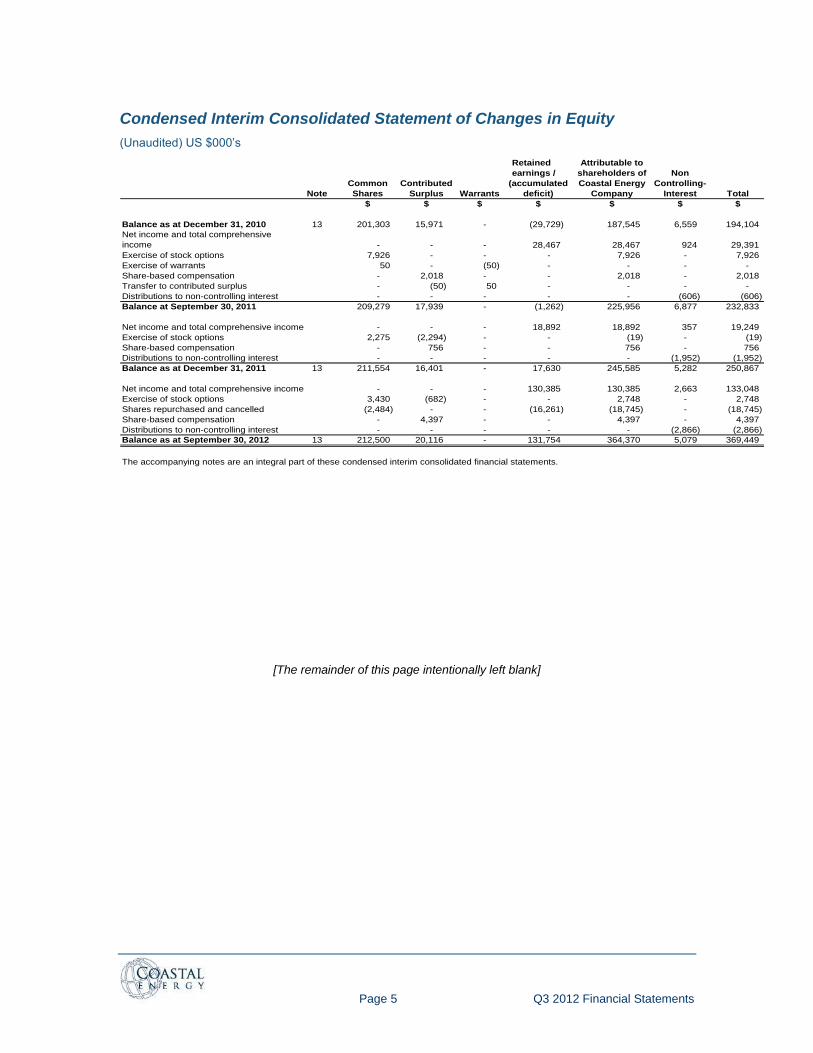
Condensed Interim Consolidated Statement of Changes in Equity
(Unaudited) US $000‟s
Retained Attributable to
earnings / shareholders of Non
Common Contributed (accumulated Coastal Energy Controlling-
Note Shares Surplus Warrants deficit) Company Interest Total
$ $ $ $ $ $ $
Balance as at December 31, 2010 13 201,303 15,971 - (29,729) 187,545 6,559 194,104
Net income and total comprehensive
income - - - 28,467 28,467 924 29,391
Exercise of stock options 7,926 - - - 7,926 - 7,926
Exercise of warrants 50 - (50) - - - -
Share-based compensation - 2,018 - - 2,018 - 2,018
Transfer to contributed surplus - (50) 50 - - - -
Distributions to non-controlling interest - - - - - (606) (606)
Balance at September 30, 2011 209,279 17,939 - (1,262) 225,956 6,877 232,833
Net income and total comprehensive income - - - 18,892 18,892 357 19,249
Exercise of stock options 2,275 (2,294) - - (19) - (19)
Share-based compensation - 756 - - 756 - 756
Distributions to non-controlling interest - - - - - (1,952) (1,952)
Balance as at December 31, 2011 13 211,554 16,401 - 17,630 245,585 5,282 250,867
Net income and total comprehensive income - - - 130,385 130,385 2,663 133,048
Exercise of stock options 3,430 (682) - - 2,748 - 2,748
Shares repurchased and cancelled (2,484) - - (16,261) (18,745) - (18,745)
Share-based compensation - 4,397 - - 4,397 - 4,397
Distributions to non-controlling interest - - - - - (2,866) (2,866)
Balance as at September 30, 2012 13 212,500 20,116 - 131,754 364,370 5,079 369,449
The accompanying notes are an integral part of these condensed interim consolidated financial statements.
[The remainder of this page intentionally left blank]
Page 6 Q3 2012 Financial Statements
Notes to the Condensed Interim Consolidated Financial Statements
As at September 30, 2012 and for the three and nine months ended September 30, 2012 and 2011 (All tabular amounts are expressed in US$000’s unless otherwise stated except share and per share amounts)
Note 1. Reporting entity
Coastal Energy Company (“Coastal” or the “Company” or “we”) is an international oil and gas exploration and development company with operations in offshore Thailand, and an interest in a joint venture which operates on the Thai mainland. The Company‟s shares are widely held and publicly traded on the Toronto Stock Exchange (TSX) and the London Alternative Investment Market (AIM). The Company‟s head office is at Walkers House, 87 Mary Street, George Town, Grand Cayman, KY1-9001, Cayman Islands.
Note 2. Basis of presentation
The condensed interim consolidated financial statements for Coastal Energy Company as at September 30, 2012 and for the three and nine months ended September 30, 2012 and 2011 should be read in conjunction with the audited consolidated financial statements as at December 31, 2011, December 31, 2010 and January 1, 2010 and for the years ended December 31, 2011 and December 31, 2010. The interim consolidated financial statements are prepared using the same accounting policies and methods of computation as disclosed in the annual consolidated financial statements. The condensed interim consolidated financial statements are stated in United States dollars and have been prepared in accordance with the International Financial Reporting Standards (“IFRS”) applicable to the preparation of interim financial statements, including IAS 34 Interim Financial Reporting. The condensed interim consolidated financial statements were approved by the Audit Committee of the Company‟s Board of Directors on November 8, 2012.
Note 3. Restricted cash
The Company has cash balances which are restricted by the Company‟s banking institutions. The following table summarizes the restricted cash balances:
September 30, December 31,
As at 2012 2011
Collateral in support of corporate letter
of credit (Note 16) $1,419 $1,400
Restricted in support of long-term debt 4,994 27,047
$6,413 $28,447
The terms of the debt facility with BNP Paribas require that cash proceeds from borrowing base assets be held in restricted accounts with the Lender. Cash may be disbursed from the restricted accounts for approved purposes as designated in the credit agreement.
[The remainder of this page intentionally left blank]
Page 7 Q3 2012 Financial Statements
Note 4. Accounts receivable
September 30, December 31,
As at 2012 2011
Oil sales $61,262 $-
Refundable taxes (VAT) 15,128 16,115
Other 846 824
$77,236 $16,939
Note 5. Exploration and evaluation assets
Exploration and
Evaluation
Cost and Net Book Value
As at December 31, 2010 $31,068
Additions 145,363
Transfers to Property, plant and equipment (136,176)
Exploration expense (8,374)
As at December 31, 2011 31,881
Additions 58,307
Exploration expense (7,477)
As at September 30, 2012 $82,711
Exploration and evaluation assets (“E&E assets”) mainly comprise property, geological survey and capitalized exploration drilling costs in respect of non-commercially assessed fields within our G5/43 concession. Management considers the E&E assets to be of an intangible nature. During the three and nine months ended September 30, 2012, the Company expensed $7.19 million and $7.48 million, respectively, of exploration costs, largely in relation to Songkhla J (2011: $0.35 million and $6.83 million respectively, expensed in relation to non-commercial results at Benjarong).
[The remainder of this page intentionally left blank]
Page 8 Q3 2012 Financial Statements
Note 6. Property, plant and equipment
Assets Under
Construction
Oil & Gas
Properties
Corporate
and Other
Total
Cost
As at December 31, 2010 $10,706 $276,488 $1,584 $288,778
Additions - 32,001 1,134 33,135
Disposals (10,706) (1,427) - (12,133)
Transfers from Exploration and
evaluation assets - 136,176 - 136,176
As at December 31, 2011 - 443,238 2,718 445,956
Additions 33,754 175,788 784 210,326
Disposals (300) - - (300)
As at September 30, 2012 $33,454 $619,026 $3,502 $655,982
Accumulated depletion, depreciation and impairment
As at December 31, 2010 10,706 30,911 913 42,530
Depletion and depreciation - 59,447 351 59,798
Disposals (10,706) (718) - (11,424)
As at December 31, 2011 - 89,640 1,264 90,904
Depletion and depreciation - 52,826 516 53,342
As at September 30, 2012 $- $142,466 $1,780 $144,246
Carrying amount
As at December 31, 2011 $- $353,598 $1,454 $355,052
As at September 30, 2012 $33,454 $476,560 $1,722 $511,736
During the nine months ended September 30, 2012, $4.21 million of costs associated with decommissioning liabilities are included within additions (year ended December 31, 2011: $24.96 million addition). Depletion and depreciation expense recognized in property, plant and equipment for the three and nine months ended September 30, 2012 was $15.50 million and $53.34 million respectively (2011: $11.95 million and $38.73 million respectively), whereas the charge for depletion and depreciation expense recognized in the consolidated statements of operations and comprehensive income was $14.78 million and $53.41 million respectively (2011: $13.31 million and $38.29 million respectively). The difference relates to an inventory adjustment for crude oil produced but not yet sold. Assets under construction
The Company purchased the „Richmond‟, a submersible drilling rig in March 2012. As of September 30, 2012, the Company had completed the conversion of the Richmond into a MOPU. In early 4Q 2012, the Richmond was installed at the Bua Ban North field.
[The remainder of this page intentionally left blank]
Page 9 Q3 2012 Financial Statements
Note 7. Investment in and advances to Associates
Investment in Apico LLC The Company has a 39.0% (2011: 36.1%) interest in Apico LLC (“Apico”), a limited liability company incorporated in the State of Delaware, USA. Apico‟s primary purpose is the acquisition, exploration and development of onshore petroleum interests in the Kingdom of Thailand.
Apico has the following working interests in petroleum concessions located in the Khorat Plateau area in northeastern Thailand in 2012 and 2011:
Apico’s interest Net to Coastal Petroleum Concession 2012 & 2011 2012 2011
Block EU-1 and E-5N in the Sinphuhorm gas field 35% 13.648% 12.635% Block L15/43 - surrounding the Sinphuhorm gas field 100% 38.994% 36.100% Block L27/43 – southeast of the Sinphuhorm gas field 100% 38.994% 36.100% The following table summarizes the Company‟s investments in and advances to Apico:
As at
September 30, 2012
December 31, 2011
Balance, beginning of period $47,698 $47,261 Acquisition of additional ownership interest 9,250 - Advances during the period - 1,446 Share of earnings, net of income taxes 14,508 15,583 Amortization of excess basis in Apico (467) (1,056) Earnings distributions (9,943) (15,536)
Balance, end of period $61,046 $47,698
The following table summarizes Apico LLC‟s assets and liabilities:
As at
September 30, 2012
December 31, 2011
Current assets $26,989 $19,419 Non-current assets 116,617 109,733 Current liabilities 33,414 30,694 Non-current liabilities 2,569 2,731 The following table summarizes Apico LLC‟s revenue and net income:
2012 2011 2012 2011
Revenue $23,766 $24,029 $73,078 $71,606
Expenses 3,837 2,232 11,046 13,559
Income taxes 8,432 8,075 24,812 21,789
Net income 11,497 13,722 37,220 36,258
Three months ended
September 30,
Nine months ended
September 30,
The Company‟s share of Apico‟s commitments relating to geological studies, seismic surveys and exploratory drilling for the next 1 year is $7.15 million. There is also a bank guarantee of $0.60 million to cover customs duties.
[The remainder of this page intentionally left blank]
Page 10 Q3 2012 Financial Statements
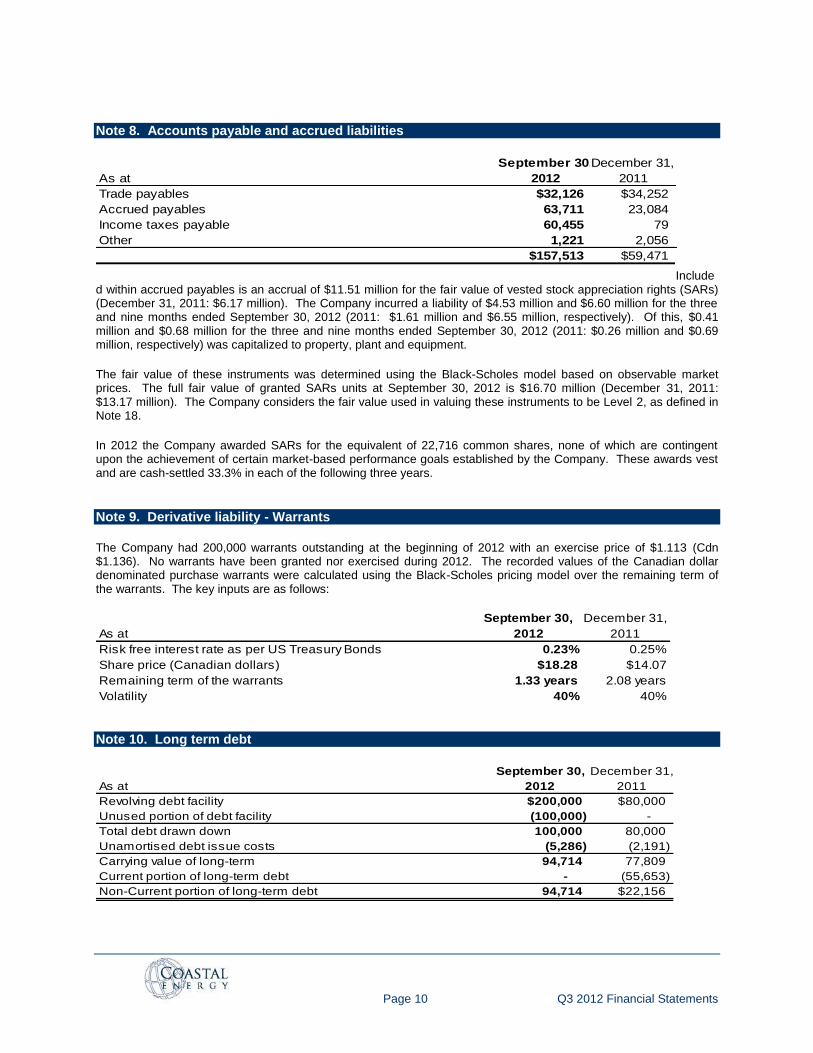
Note 8. Accounts payable and accrued liabilities
September 30,December 31,
As at 2012 2011
Trade payables $32,126 $34,252
Accrued payables 63,711 23,084
Income taxes payable 60,455 79
Other 1,221 2,056
$157,513 $59,471
Included within accrued payables is an accrual of $11.51 million for the fair value of vested stock appreciation rights (SARs) (December 31, 2011: $6.17 million). The Company incurred a liability of $4.53 million and $6.60 million for the three and nine months ended September 30, 2012 (2011: $1.61 million and $6.55 million, respectively). Of this, $0.41 million and $0.68 million for the three and nine months ended September 30, 2012 (2011: $0.26 million and $0.69 million, respectively) was capitalized to property, plant and equipment.
The fair value of these instruments was determined using the Black-Scholes model based on observable market prices. The full fair value of granted SARs units at September 30, 2012 is $16.70 million (December 31, 2011: $13.17 million). The Company considers the fair value used in valuing these instruments to be Level 2, as defined in Note 18.
In 2012 the Company awarded SARs for the equivalent of 22,716 common shares, none of which are contingent upon the achievement of certain market-based performance goals established by the Company. These awards vest and are cash-settled 33.3% in each of the following three years.
Note 9. Derivative liability - Warrants
The Company had 200,000 warrants outstanding at the beginning of 2012 with an exercise price of $1.113 (Cdn $1.136). No warrants have been granted nor exercised during 2012. The recorded values of the Canadian dollar denominated purchase warrants were calculated using the Black-Scholes pricing model over the remaining term of the warrants. The key inputs are as follows:
September 30, December 31,
As at 2012 2011
Risk free interest rate as per US Treasury Bonds 0.23% 0.25%
Share price (Canadian dollars) $18.28 $14.07
Remaining term of the warrants 1.33 years 2.08 years
Volatility 40% 40%
Note 10. Long term debt
September 30, December 31,
As at 2012 2011
Revolving debt facility $200,000 $80,000
Unused portion of debt facility (100,000) -
Total debt drawn down 100,000 80,000
Unamortised debt issue costs (5,286) (2,191)
Carrying value of long-term 94,714 77,809
Current portion of long-term debt - (55,653)
Non-Current portion of long-term debt 94,714 $22,156
Page 11 Q3 2012 Financial Statements
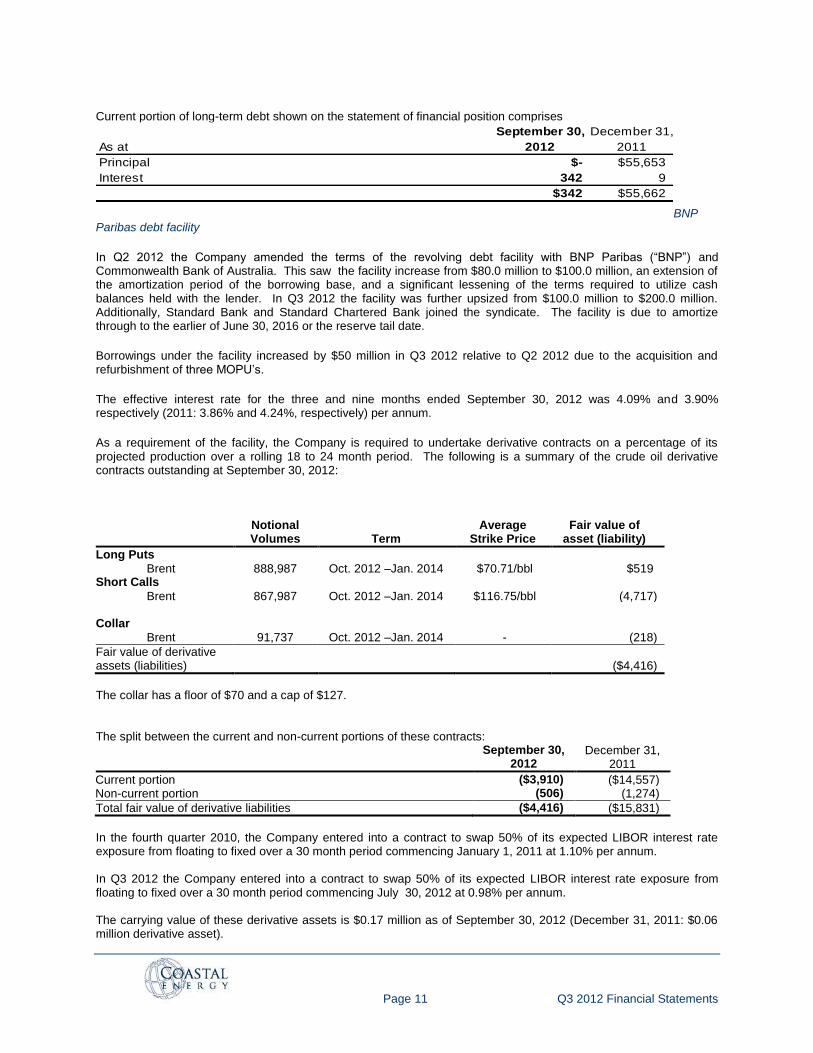
Current portion of long-term debt shown on the statement of financial position comprises
September 30, December 31,
As at 2012 2011
Principal $- $55,653
Interest 342 9
$342 $55,662
BNP Paribas debt facility
In Q2 2012 the Company amended the terms of the revolving debt facility with BNP Paribas (“BNP”) and Commonwealth Bank of Australia. This saw the facility increase from $80.0 million to $100.0 million, an extension of the amortization period of the borrowing base, and a significant lessening of the terms required to utilize cash balances held with the lender. In Q3 2012 the facility was further upsized from $100.0 million to $200.0 million. Additionally, Standard Bank and Standard Chartered Bank joined the syndicate. The facility is due to amortize through to the earlier of June 30, 2016 or the reserve tail date.
Borrowings under the facility increased by $50 million in Q3 2012 relative to Q2 2012 due to the acquisition and refurbishment of three MOPU‟s.
The effective interest rate for the three and nine months ended September 30, 2012 was 4.09% and 3.90% respectively (2011: 3.86% and 4.24%, respectively) per annum.
As a requirement of the facility, the Company is required to undertake derivative contracts on a percentage of its projected production over a rolling 18 to 24 month period. The following is a summary of the crude oil derivative contracts outstanding at September 30, 2012: Notional
Volumes Term Average
Strike Price Fair value of
asset (liability)
Long Puts
Brent 888,987 Oct. 2012 –Jan. 2014 $70.71/bbl $519 Short Calls
Brent 867,987 Oct. 2012 –Jan. 2014 $116.75/bbl (4,717) Collar
Brent 91,737 Oct. 2012 –Jan. 2014 - (218)
Fair value of derivative assets (liabilities)
($4,416)
The collar has a floor of $70 and a cap of $127. The split between the current and non-current portions of these contracts: September 30,
2012 December 31,
2011
Current portion ($3,910) ($14,557) Non-current portion (506) (1,274)
Total fair value of derivative liabilities ($4,416) ($15,831)
In the fourth quarter 2010, the Company entered into a contract to swap 50% of its expected LIBOR interest rate exposure from floating to fixed over a 30 month period commencing January 1, 2011 at 1.10% per annum. In Q3 2012 the Company entered into a contract to swap 50% of its expected LIBOR interest rate exposure from floating to fixed over a 30 month period commencing July 30, 2012 at 0.98% per annum. The carrying value of these derivative assets is $0.17 million as of September 30, 2012 (December 31, 2011: $0.06 million derivative asset).
Page 12 Q3 2012 Financial Statements
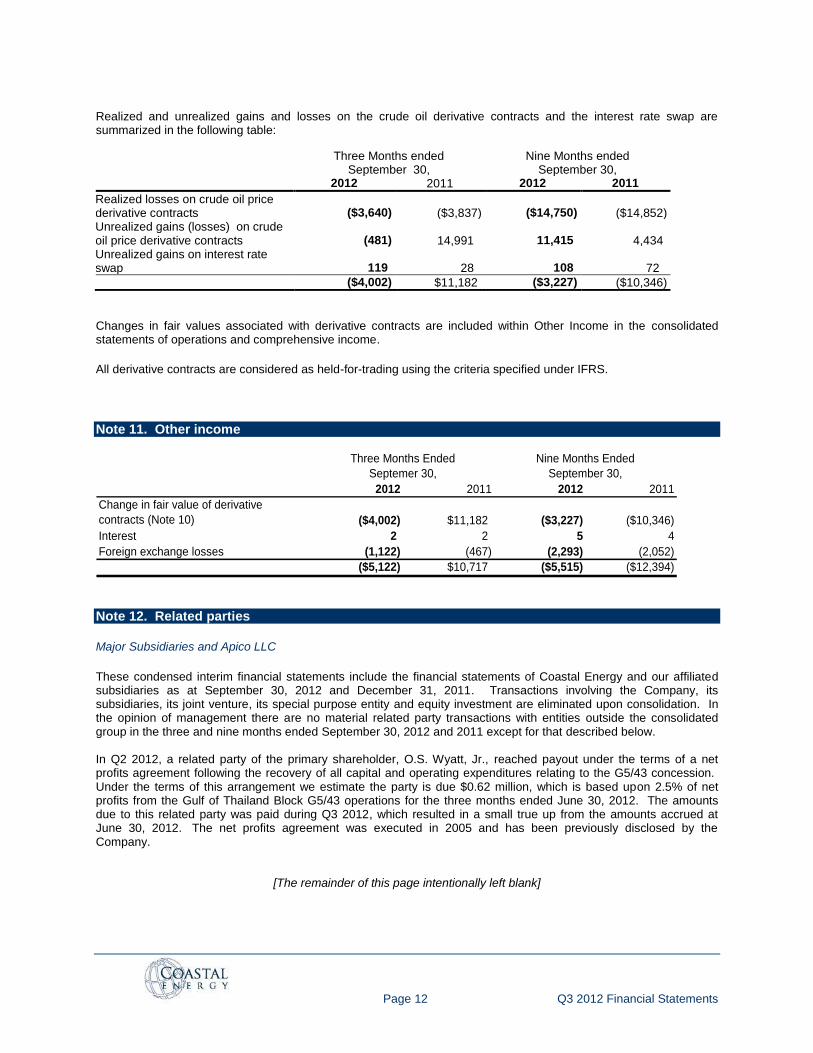
Realized and unrealized gains and losses on the crude oil derivative contracts and the interest rate swap are summarized in the following table:
Three Months ended September 30,
Nine Months ended September 30,
2012 2011 2012 2011
Realized losses on crude oil price derivative contracts ($3,640) ($3,837) ($14,750) ($14,852) Unrealized gains (losses) on crude oil price derivative contracts (481) 14,991 11,415 4,434 Unrealized gains on interest rate swap 119 28 108 72
($4,002) $11,182 ($3,227) ($10,346)
Changes in fair values associated with derivative contracts are included within Other Income in the consolidated statements of operations and comprehensive income.
All derivative contracts are considered as held-for-trading using the criteria specified under IFRS.
Note 11. Other income
2012 2011 2012 2011
Change in fair value of derivative
contracts (Note 10) ($4,002) $11,182 ($3,227) ($10,346)
Interest 2 2 5 4
Foreign exchange losses (1,122) (467) (2,293) (2,052)
($5,122) $10,717 ($5,515) ($12,394)
Three Months Ended
Septemer 30,
Nine Months Ended
September 30,
Note 12. Related parties
Major Subsidiaries and Apico LLC
These condensed interim financial statements include the financial statements of Coastal Energy and our affiliated subsidiaries as at September 30, 2012 and December 31, 2011. Transactions involving the Company, its subsidiaries, its joint venture, its special purpose entity and equity investment are eliminated upon consolidation. In the opinion of management there are no material related party transactions with entities outside the consolidated group in the three and nine months ended September 30, 2012 and 2011 except for that described below. In Q2 2012, a related party of the primary shareholder, O.S. Wyatt, Jr., reached payout under the terms of a net profits agreement following the recovery of all capital and operating expenditures relating to the G5/43 concession. Under the terms of this arrangement we estimate the party is due $0.62 million, which is based upon 2.5% of net profits from the Gulf of Thailand Block G5/43 operations for the three months ended June 30, 2012. The amounts due to this related party was paid during Q3 2012, which resulted in a small true up from the amounts accrued at June 30, 2012. The net profits agreement was executed in 2005 and has been previously disclosed by the Company.
[The remainder of this page intentionally left blank]
Page 13 Q3 2012 Financial Statements
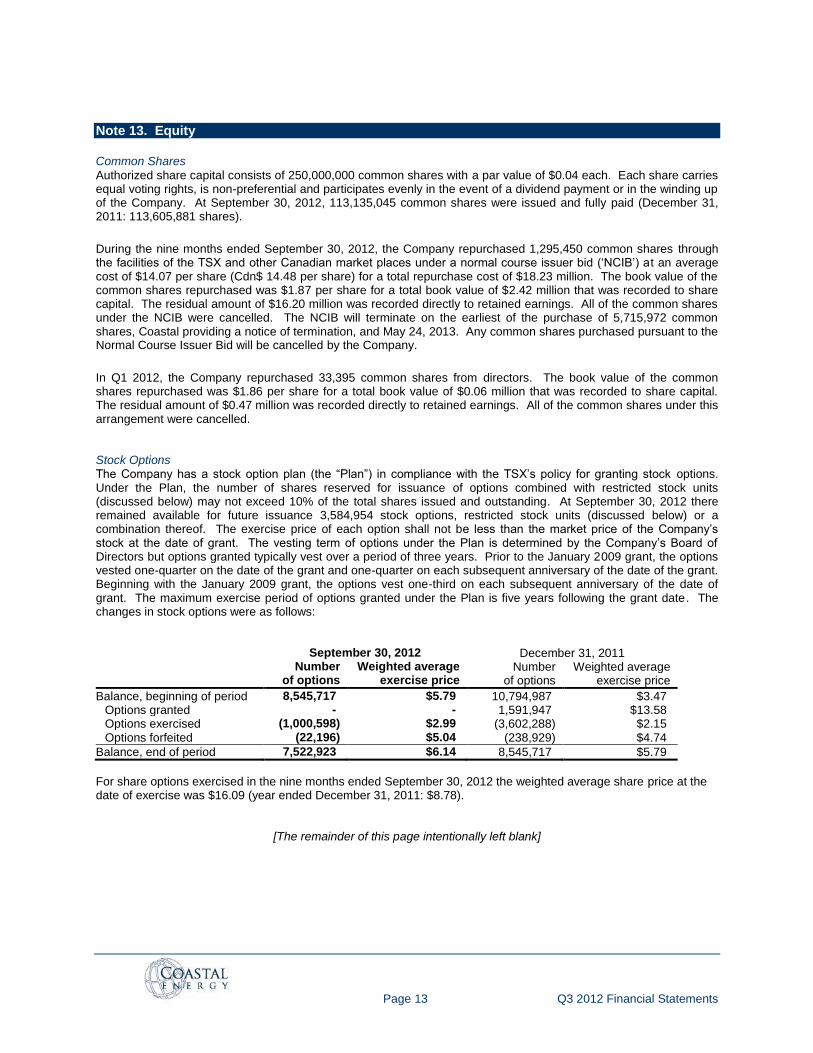
Note 13. Equity
Common Shares
Authorized share capital consists of 250,000,000 common shares with a par value of $0.04 each. Each share carries equal voting rights, is non-preferential and participates evenly in the event of a dividend payment or in the winding up of the Company. At September 30, 2012, 113,135,045 common shares were issued and fully paid (December 31, 2011: 113,605,881 shares).
During the nine months ended September 30, 2012, the Company repurchased 1,295,450 common shares through the facilities of the TSX and other Canadian market places under a normal course issuer bid („NCIB‟) at an average cost of $14.07 per share (Cdn$ 14.48 per share) for a total repurchase cost of $18.23 million. The book value of the common shares repurchased was $1.87 per share for a total book value of $2.42 million that was recorded to share capital. The residual amount of $16.20 million was recorded directly to retained earnings. All of the common shares under the NCIB were cancelled. The NCIB will terminate on the earliest of the purchase of 5,715,972 common shares, Coastal providing a notice of termination, and May 24, 2013. Any common shares purchased pursuant to the Normal Course Issuer Bid will be cancelled by the Company.
In Q1 2012, the Company repurchased 33,395 common shares from directors. The book value of the common shares repurchased was $1.86 per share for a total book value of $0.06 million that was recorded to share capital. The residual amount of $0.47 million was recorded directly to retained earnings. All of the common shares under this arrangement were cancelled. Stock Options The Company has a stock option plan (the “Plan”) in compliance with the TSX‟s policy for granting stock options. Under the Plan, the number of shares reserved for issuance of options combined with restricted stock units (discussed below) may not exceed 10% of the total shares issued and outstanding. At September 30, 2012 there remained available for future issuance 3,584,954 stock options, restricted stock units (discussed below) or a combination thereof. The exercise price of each option shall not be less than the market price of the Company‟s stock at the date of grant. The vesting term of options under the Plan is determined by the Company‟s Board of Directors but options granted typically vest over a period of three years. Prior to the January 2009 grant, the options vested one-quarter on the date of the grant and one-quarter on each subsequent anniversary of the date of the grant. Beginning with the January 2009 grant, the options vest one-third on each subsequent anniversary of the date of grant. The maximum exercise period of options granted under the Plan is five years following the grant date. The changes in stock options were as follows:
September 30, 2012 December 31, 2011 Number Weighted average Number Weighted average of options exercise price of options exercise price
Balance, beginning of period 8,545,717 $5.79 10,794,987 $3.47 Options granted - - 1,591,947 $13.58 Options exercised (1,000,598) $2.99 (3,602,288) $2.15 Options forfeited (22,196) $5.04 (238,929) $4.74
Balance, end of period 7,522,923 $6.14 8,545,717 $5.79
For share options exercised in the nine months ended September 30, 2012 the weighted average share price at the date of exercise was $16.09 (year ended December 31, 2011: $8.78).
[The remainder of this page intentionally left blank]
Page 14 Q3 2012 Financial Statements
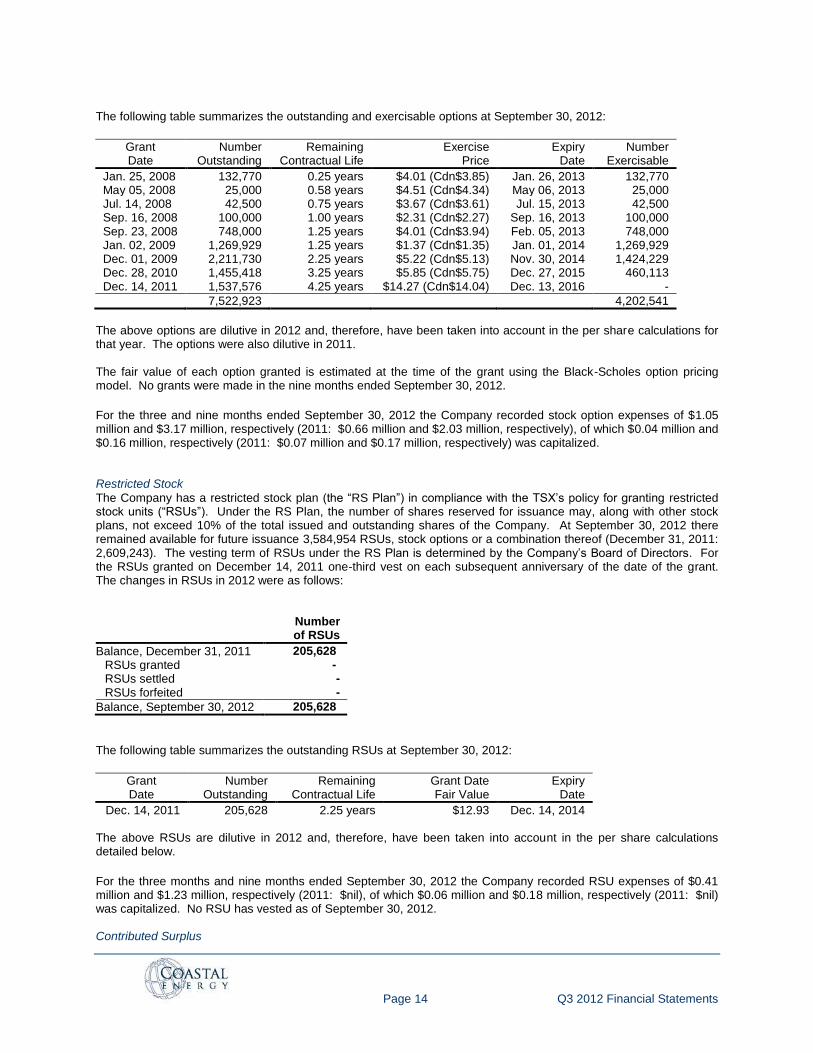
The following table summarizes the outstanding and exercisable options at September 30, 2012:
Grant Date
Number Outstanding
Remaining Contractual Life
Exercise Price
Expiry Date
Number Exercisable
Jan. 25, 2008 132,770 0.25 years $4.01 (Cdn$3.85) Jan. 26, 2013 132,770 May 05, 2008 25,000 0.58 years $4.51 (Cdn$4.34) May 06, 2013 25,000 Jul. 14, 2008 42,500 0.75 years $3.67 (Cdn$3.61) Jul. 15, 2013 42,500 Sep. 16, 2008 100,000 1.00 years $2.31 (Cdn$2.27) Sep. 16, 2013 100,000 Sep. 23, 2008 748,000 1.25 years $4.01 (Cdn$3.94) Feb. 05, 2013 748,000 Jan. 02, 2009 1,269,929 1.25 years $1.37 (Cdn$1.35) Jan. 01, 2014 1,269,929 Dec. 01, 2009 2,211,730 2.25 years $5.22 (Cdn$5.13) Nov. 30, 2014 1,424,229 Dec. 28, 2010 1,455,418 3.25 years $5.85 (Cdn$5.75) Dec. 27, 2015 460,113 Dec. 14, 2011 1,537,576 4.25 years $14.27 (Cdn$14.04) Dec. 13, 2016 -
7,522,923 4,202,541
The above options are dilutive in 2012 and, therefore, have been taken into account in the per share calculations for that year. The options were also dilutive in 2011. The fair value of each option granted is estimated at the time of the grant using the Black-Scholes option pricing model. No grants were made in the nine months ended September 30, 2012.
For the three and nine months ended September 30, 2012 the Company recorded stock option expenses of $1.05 million and $3.17 million, respectively (2011: $0.66 million and $2.03 million, respectively), of which $0.04 million and $0.16 million, respectively (2011: $0.07 million and $0.17 million, respectively) was capitalized. Restricted Stock
The Company has a restricted stock plan (the “RS Plan”) in compliance with the TSX‟s policy for granting restricted stock units (“RSUs”). Under the RS Plan, the number of shares reserved for issuance may, along with other stock plans, not exceed 10% of the total issued and outstanding shares of the Company. At September 30, 2012 there remained available for future issuance 3,584,954 RSUs, stock options or a combination thereof (December 31, 2011: 2,609,243). The vesting term of RSUs under the RS Plan is determined by the Company‟s Board of Directors. For the RSUs granted on December 14, 2011 one-third vest on each subsequent anniversary of the date of the grant. The changes in RSUs in 2012 were as follows:
Number
of RSUs
Balance, December 31, 2011 205,628
RSUs granted -
RSUs settled -
RSUs forfeited -
Balance, September 30, 2012 205,628
The following table summarizes the outstanding RSUs at September 30, 2012:
Grant Date
Number Outstanding
Remaining Contractual Life
Grant Date Fair Value
Expiry Date
Dec. 14, 2011 205,628 2.25 years $12.93 Dec. 14, 2014 The above RSUs are dilutive in 2012 and, therefore, have been taken into account in the per share calculations detailed below.
For the three months and nine months ended September 30, 2012 the Company recorded RSU expenses of $0.41 million and $1.23 million, respectively (2011: $nil), of which $0.06 million and $0.18 million, respectively (2011: $nil) was capitalized. No RSU has vested as of September 30, 2012.
Contributed Surplus
Page 15 Q3 2012 Financial Statements
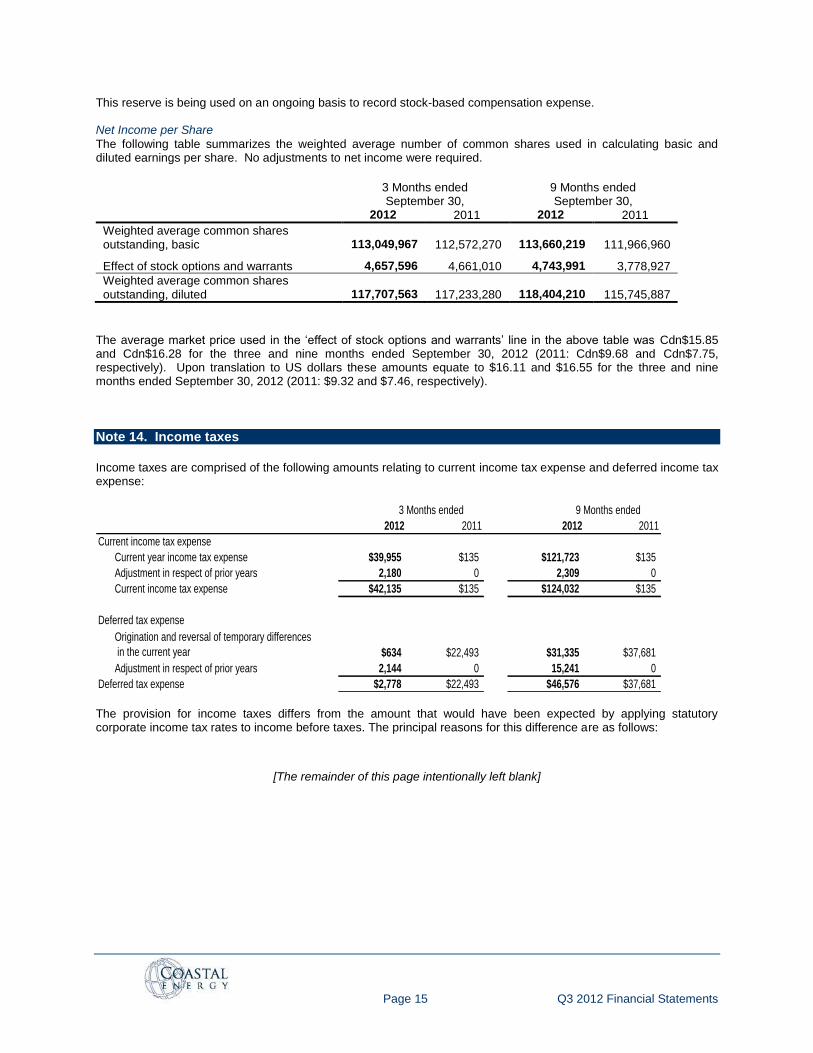
This reserve is being used on an ongoing basis to record stock-based compensation expense. Net Income per Share
The following table summarizes the weighted average number of common shares used in calculating basic and diluted earnings per share. No adjustments to net income were required.
3 Months ended September 30,
9 Months ended September 30,
2012 2011 2012 2011
Weighted average common shares outstanding, basic 113,049,967 112,572,270 113,660,219 111,966,960
Effect of stock options and warrants 4,657,596 4,661,010 4,743,991 3,778,927
Weighted average common shares outstanding, diluted 117,707,563 117,233,280 118,404,210 115,745,887
The average market price used in the „effect of stock options and warrants‟ line in the above table was Cdn$15.85 and Cdn$16.28 for the three and nine months ended September 30, 2012 (2011: Cdn$9.68 and Cdn$7.75, respectively). Upon translation to US dollars these amounts equate to $16.11 and $16.55 for the three and nine months ended September 30, 2012 (2011: $9.32 and $7.46, respectively).
Note 14. Income taxes
Income taxes are comprised of the following amounts relating to current income tax expense and deferred income tax expense:
2012 2011 2012 2011
Current income tax expense
Current year income tax expense $39,955 $135 $121,723 $135
Adjustment in respect of prior years 2,180 0 2,309 0
Current income tax expense $42,135 $135 $124,032 $135
Deferred tax expense
Origination and reversal of temporary differences
in the current year $634 $22,493 $31,335 $37,681
Adjustment in respect of prior years 2,144 0 15,241 0
Deferred tax expense $2,778 $22,493 $46,576 $37,681
3 Months ended 9 Months ended
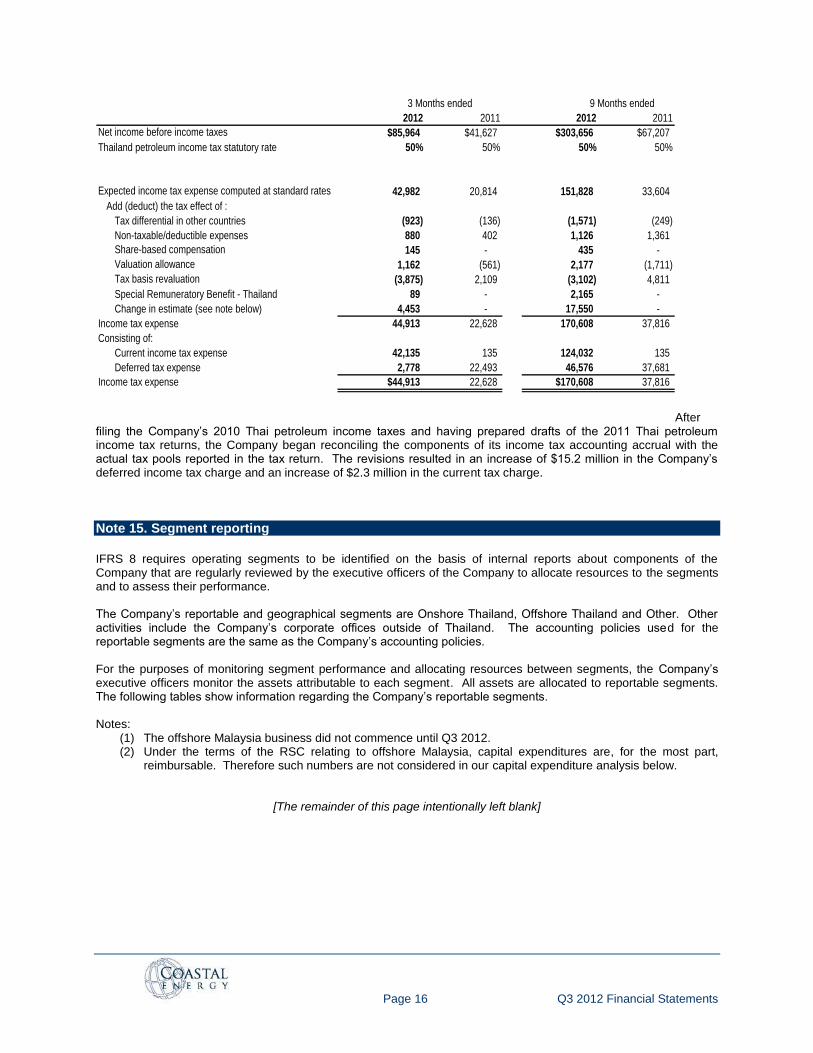
The provision for income taxes differs from the amount that would have been expected by applying statutory corporate income tax rates to income before taxes. The principal reasons for this difference are as follows:
[The remainder of this page intentionally left blank]
Page 16 Q3 2012 Financial Statements
2012 2011 2012 2011
Net income before income taxes $85,964 $41,627 $303,656 $67,207
Thailand petroleum income tax statutory rate 50% 50% 50% 50%
Expected income tax expense computed at standard rates 42,982 20,814 151,828 33,604
Add (deduct) the tax effect of :
Tax differential in other countries (923) (136) (1,571) (249)
Non-taxable/deductible expenses 880 402 1,126 1,361
Share-based compensation 145 - 435 -
Valuation allowance 1,162 (561) 2,177 (1,711)
Tax basis revaluation (3,875) 2,109 (3,102) 4,811
Special Remuneratory Benefit - Thailand 89 - 2,165 -
Change in estimate (see note below) 4,453 - 17,550 -
Income tax expense 44,913 22,628 170,608 37,816
Consisting of:
Current income tax expense 42,135 135 124,032 135
Deferred tax expense 2,778 22,493 46,576 37,681
Income tax expense $44,913 22,628 $170,608 37,816
3 Months ended 9 Months ended
After filing the Company‟s 2010 Thai petroleum income taxes and having prepared drafts of the 2011 Thai petroleum income tax returns, the Company began reconciling the components of its income tax accounting accrual with the actual tax pools reported in the tax return. The revisions resulted in an increase of $15.2 million in the Company‟s deferred income tax charge and an increase of $2.3 million in the current tax charge.
Note 15. Segment reporting
IFRS 8 requires operating segments to be identified on the basis of internal reports about components of the Company that are regularly reviewed by the executive officers of the Company to allocate resources to the segments and to assess their performance. The Company‟s reportable and geographical segments are Onshore Thailand, Offshore Thailand and Other. Other activities include the Company‟s corporate offices outside of Thailand. The accounting policies used for the reportable segments are the same as the Company‟s accounting policies. For the purposes of monitoring segment performance and allocating resources between segments, the Company‟s executive officers monitor the assets attributable to each segment. All assets are allocated to reportable segments. The following tables show information regarding the Company‟s reportable segments. Notes:
(1) The offshore Malaysia business did not commence until Q3 2012. (2) Under the terms of the RSC relating to offshore Malaysia, capital expenditures are, for the most part,
reimbursable. Therefore such numbers are not considered in our capital expenditure analysis below.
[The remainder of this page intentionally left blank]
Page 17 Q3 2012 Financial Statements
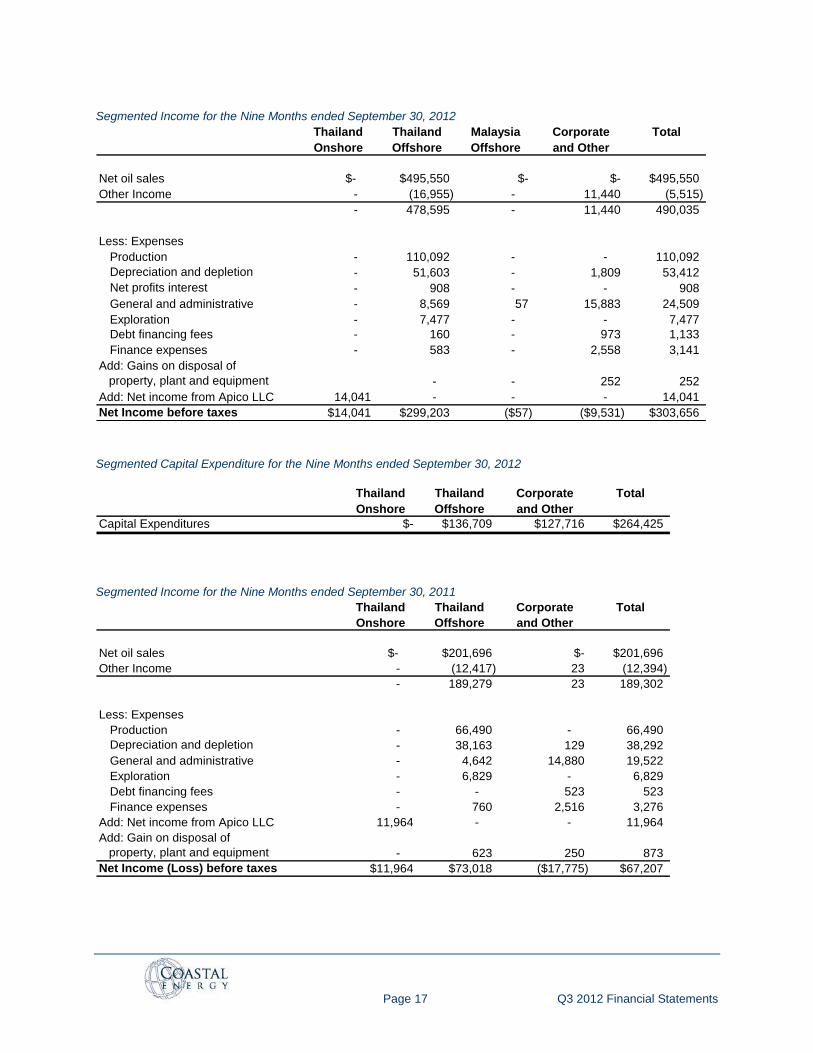
Segmented Income for the Nine Months ended September 30, 2012
Thailand
Onshore
Thailand
Offshore
Malaysia
Offshore
Corporate
and Other
Total
Net oil sales $- $495,550 $- $- $495,550
Other Income - (16,955) - 11,440 (5,515)
- 478,595 - 11,440 490,035
Less: Expenses
Production - 110,092 - - 110,092
Depreciation and depletion - 51,603 - 1,809 53,412
Net profits interest - 908 - - 908
General and administrative - 8,569 57 15,883 24,509
Exploration - 7,477 - - 7,477
Debt financing fees - 160 - 973 1,133
Finance expenses - 583 - 2,558 3,141
Add: Gains on disposal of
property, plant and equipment - - 252 252
Add: Net income from Apico LLC 14,041 - - - 14,041
Net Income before taxes $14,041 $299,203 ($57) ($9,531) $303,656
Segmented Capital Expenditure for the Nine Months ended September 30, 2012
Thailand
Onshore
Thailand
Offshore
Corporate
and Other
Total
Capital Expenditures $- $136,709 $127,716 $264,425
Segmented Income for the Nine Months ended September 30, 2011
Thailand
Onshore
Thailand
Offshore
Corporate
and Other
Total
Net oil sales $- $201,696 $- $201,696
Other Income - (12,417) 23 (12,394)
- 189,279 23 189,302
Less: Expenses
Production - 66,490 - 66,490
Depreciation and depletion - 38,163 129 38,292
General and administrative - 4,642 14,880 19,522
Exploration - 6,829 - 6,829
Debt financing fees - - 523 523
Finance expenses - 760 2,516 3,276
Add: Net income from Apico LLC 11,964 - - 11,964
Add: Gain on disposal of
property, plant and equipment - 623 250 873
Net Income (Loss) before taxes $11,964 $73,018 ($17,775) $67,207
Page 18 Q3 2012 Financial Statements
Segmented Capital Expenditure for the Nine Months ended September 30, 2011
Thailand
Onshore
Thailand
Offshore
Corporate
and Other
Total
Capital Expenditures $- $108,789 $132 $108,921
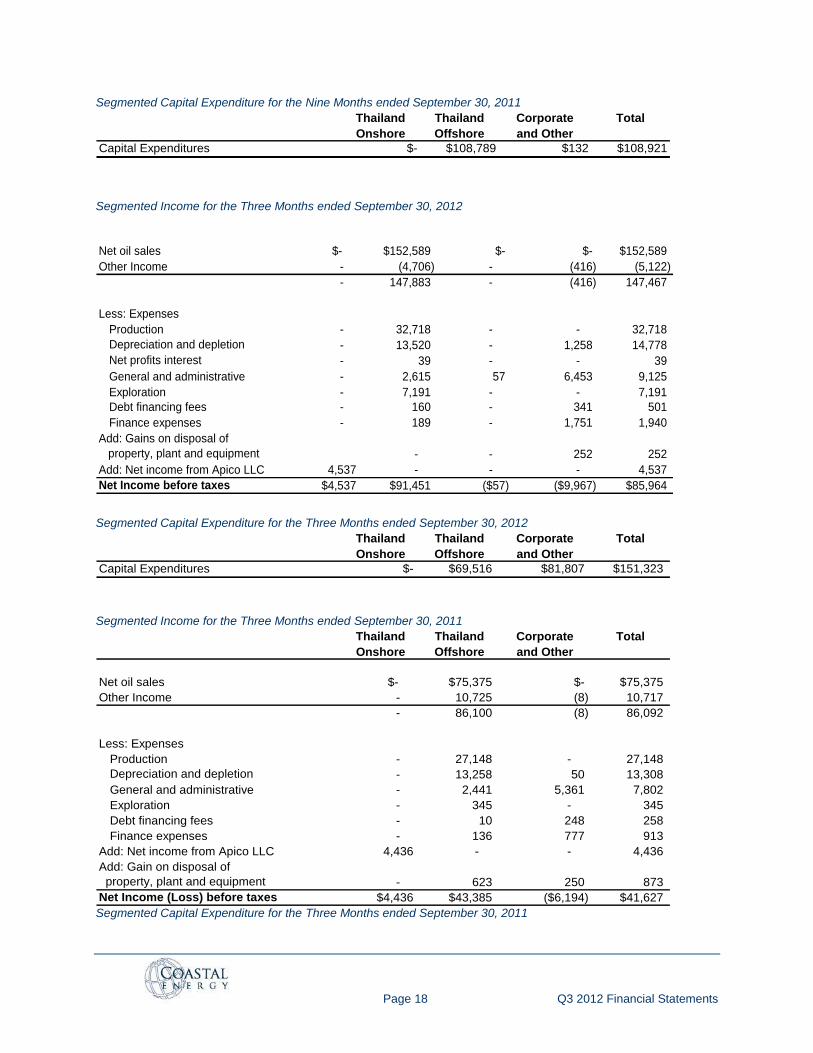
Segmented Income for the Three Months ended September 30, 2012
Net oil sales $- $152,589 $- $- $152,589
Other Income - (4,706) - (416) (5,122)
- 147,883 - (416) 147,467
Less: Expenses
Production - 32,718 - - 32,718
Depreciation and depletion - 13,520 - 1,258 14,778
Net profits interest - 39 - - 39
General and administrative - 2,615 57 6,453 9,125
Exploration - 7,191 - - 7,191
Debt financing fees - 160 - 341 501
Finance expenses - 189 - 1,751 1,940
Add: Gains on disposal of
property, plant and equipment - - 252 252
Add: Net income from Apico LLC 4,537 - - - 4,537
Net Income before taxes $4,537 $91,451 ($57) ($9,967) $85,964
Segmented Capital Expenditure for the Three Months ended September 30, 2012
Thailand
Onshore
Thailand
Offshore
Corporate
and Other
Total
Capital Expenditures $- $69,516 $81,807 $151,323
Segmented Income for the Three Months ended September 30, 2011
Thailand
Onshore
Thailand
Offshore
Corporate
and Other
Total
Net oil sales $- $75,375 $- $75,375
Other Income - 10,725 (8) 10,717
- 86,100 (8) 86,092
Less: Expenses
Production - 27,148 - 27,148
Depreciation and depletion - 13,258 50 13,308
General and administrative - 2,441 5,361 7,802
Exploration - 345 - 345
Debt financing fees - 10 248 258
Finance expenses - 136 777 913
Add: Net income from Apico LLC 4,436 - - 4,436
Add: Gain on disposal of
property, plant and equipment - 623 250 873
Net Income (Loss) before taxes $4,436 $43,385 ($6,194) $41,627 Segmented Capital Expenditure for the Three Months ended September 30, 2011
Page 19 Q3 2012 Financial Statements
Thailand
Onshore
Thailand
Offshore
Corporate
and Other
Total
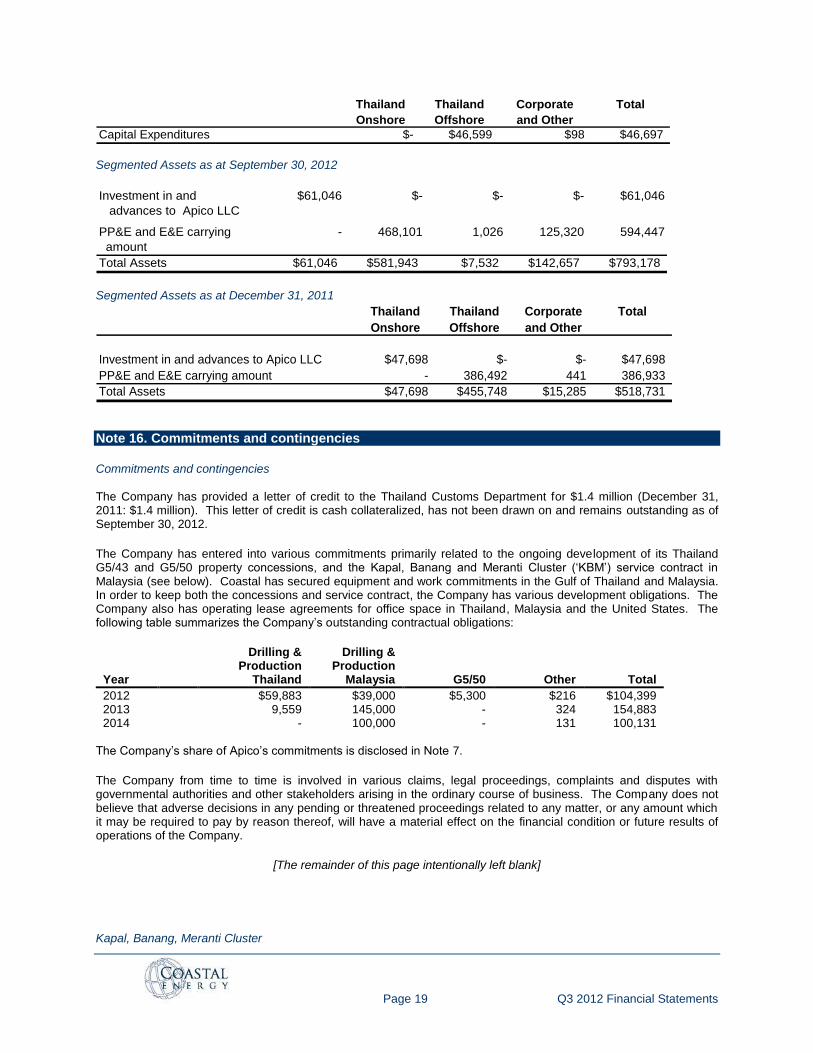
Capital Expenditures $- $46,599 $98 $46,697
Segmented Assets as at September 30, 2012
Investment in and
advances to Apico LLC
$61,046 $- $- $- $61,046
PP&E and E&E carrying
amount
- 468,101 1,026 125,320 594,447
Total Assets $61,046 $581,943 $7,532 $142,657 $793,178
Segmented Assets as at December 31, 2011
Thailand
Onshore
Thailand
Offshore
Corporate
and Other
Total
Investment in and advances to Apico LLC $47,698 $- $- $47,698
PP&E and E&E carrying amount - 386,492 441 386,933
Total Assets $47,698 $455,748 $15,285 $518,731
Note 16. Commitments and contingencies
Commitments and contingencies
The Company has provided a letter of credit to the Thailand Customs Department for $1.4 million (December 31, 2011: $1.4 million). This letter of credit is cash collateralized, has not been drawn on and remains outstanding as of September 30, 2012.
The Company has entered into various commitments primarily related to the ongoing development of its Thailand G5/43 and G5/50 property concessions, and the Kapal, Banang and Meranti Cluster („KBM‟) service contract in Malaysia (see below). Coastal has secured equipment and work commitments in the Gulf of Thailand and Malaysia. In order to keep both the concessions and service contract, the Company has various development obligations. The Company also has operating lease agreements for office space in Thailand, Malaysia and the United States. The following table summarizes the Company‟s outstanding contractual obligations:
Year
Drilling & Production
Thailand
Drilling & Production
Malaysia G5/50 Other Total
2012 $59,883 $39,000 $5,300 $216 $104,399 2013 9,559 145,000 - 324 154,883 2014 - 100,000 - 131 100,131
The Company‟s share of Apico‟s commitments is disclosed in Note 7.
The Company from time to time is involved in various claims, legal proceedings, complaints and disputes with governmental authorities and other stakeholders arising in the ordinary course of business. The Company does not believe that adverse decisions in any pending or threatened proceedings related to any matter, or any amount which it may be required to pay by reason thereof, will have a material effect on the financial condition or future results of operations of the Company.
[The remainder of this page intentionally left blank]
Kapal, Banang, Meranti Cluster
Page 20 Q3 2012 Financial Statements
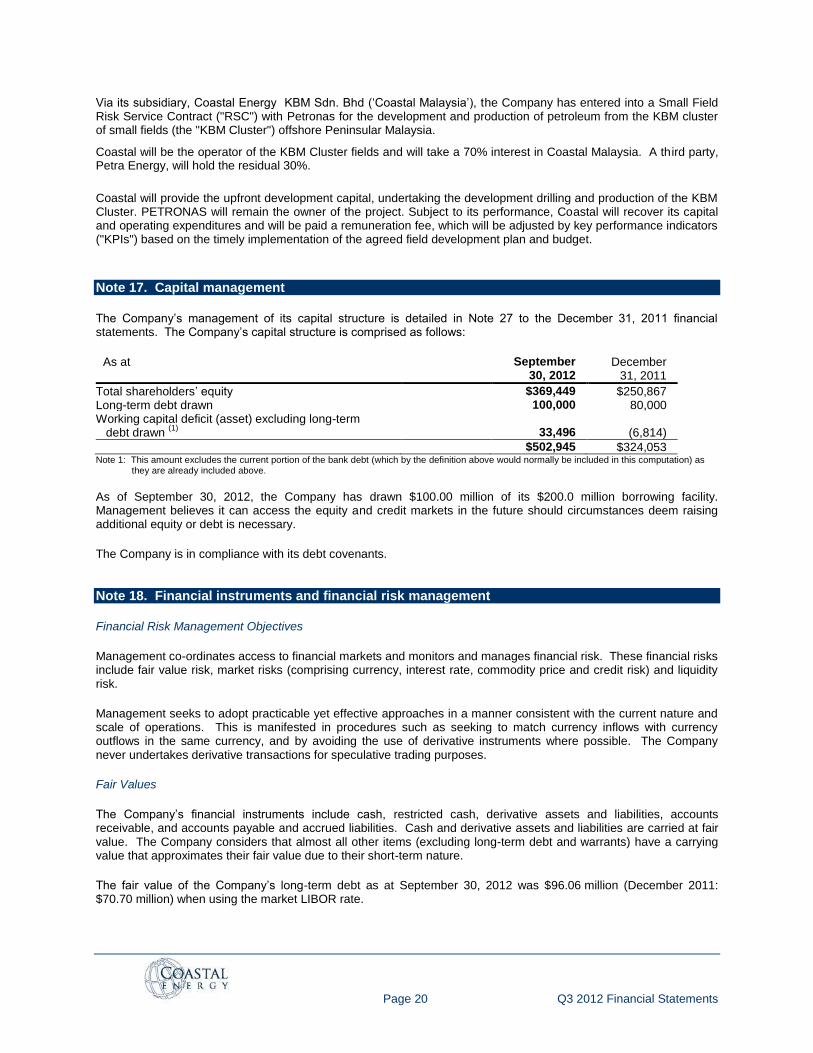
Via its subsidiary, Coastal Energy KBM Sdn. Bhd („Coastal Malaysia‟), the Company has entered into a Small Field Risk Service Contract ("RSC") with Petronas for the development and production of petroleum from the KBM cluster of small fields (the "KBM Cluster") offshore Peninsular Malaysia.
Coastal will be the operator of the KBM Cluster fields and will take a 70% interest in Coastal Malaysia. A third party, Petra Energy, will hold the residual 30%.
Coastal will provide the upfront development capital, undertaking the development drilling and production of the KBM Cluster. PETRONAS will remain the owner of the project. Subject to its performance, Coastal will recover its capital and operating expenditures and will be paid a remuneration fee, which will be adjusted by key performance indicators ("KPIs") based on the timely implementation of the agreed field development plan and budget.
Note 17. Capital management
The Company‟s management of its capital structure is detailed in Note 27 to the December 31, 2011 financial statements. The Company‟s capital structure is comprised as follows:
As at September 30, 2012
December 31, 2011
Total shareholders‟ equity $369,449 $250,867 Long-term debt drawn 100,000 80,000 Working capital deficit (asset) excluding long-term debt drawn
(1) 33,496 (6,814)
$502,945 $324,053 Note 1: This amount excludes the current portion of the bank debt (which by the definition above would normally be included in this computation) as
they are already included above.
As of September 30, 2012, the Company has drawn $100.00 million of its $200.0 million borrowing facility. Management believes it can access the equity and credit markets in the future should circumstances deem raising additional equity or debt is necessary.
The Company is in compliance with its debt covenants.
Note 18. Financial instruments and financial risk management
Financial Risk Management Objectives
Management co-ordinates access to financial markets and monitors and manages financial risk. These financial risks include fair value risk, market risks (comprising currency, interest rate, commodity price and credit risk) and liquidity risk.
Management seeks to adopt practicable yet effective approaches in a manner consistent with the current nature and scale of operations. This is manifested in procedures such as seeking to match currency inflows with currency outflows in the same currency, and by avoiding the use of derivative instruments where possible. The Company never undertakes derivative transactions for speculative trading purposes.
Fair Values
The Company‟s financial instruments include cash, restricted cash, derivative assets and liabilities, accounts receivable, and accounts payable and accrued liabilities. Cash and derivative assets and liabilities are carried at fair value. The Company considers that almost all other items (excluding long-term debt and warrants) have a carrying value that approximates their fair value due to their short-term nature.
The fair value of the Company‟s long-term debt as at September 30, 2012 was $96.06 million (December 2011: $70.70 million) when using the market LIBOR rate.
Page 21 Q3 2012 Financial Statements
The Company classifies the fair value of cash, restricted cash, derivative commodity contracts and the derivative liability for warrants according to the following hierarchy based on the amount of observable inputs used to value the instrument.
Level 1 – Quoted prices are available in active markets for identical assets or liabilities as of the reporting date. Active markets are those in which transactions occur in sufficient frequency and volume to provide pricing information on an ongoing basis.
Level 2 - Pricing inputs other than quoted prices in active markets included in Level 1. Prices in Level 2 are either directly or indirectly observables as of the reporting date. Level 2 valuations are based on inputs, including quoted forward prices for commodities, time value and volatility factors, which can be substantially observed or corroborated in the market place.
Level 3 – Valuations in this level are those with inputs for the asset or liability that are not based on observable market data.
The Company‟s cash, restricted cash and derivative commodity contracts have been assessed on the fair value hierarchy described above. Cash and restricted cash are classified as Level 1.
The Company‟s derivative commodity contracts, as with 2011, are considered fair value through profit and loss and their fair values are marked to market every quarter based on inputs from quoted market prices in the futures market on the statement of financial position date. As discussed in Note 10, these derivative instruments are solely required for debt facilities. These contracts as well as the derivative liabilities associated with warrants are classified as Level 2.
The Company considers its risks in relation to financial instruments in the following categories, of which management considers that no category has significantly worsened in 2012 relative to 2011.
Credit Risk
Credit risk is the risk that a counterparty to a financial instrument will not discharge its obligations, resulting in a financial loss to the Company. The Company has procedures in place to minimize the credit risk it will assume. Coastal personnel evaluate credit risk on an ongoing basis including an evaluation of counterparty credit rating and counterparty concentrations measured by amount and percentage.
The primary sources of credit risk for the Company arise from the following financial assets: (1) cash and restricted cash; (2) accounts receivable; (3) derivative assets. The Company has not had any credit losses in the past beyond that described below. At September 30, 2012 and 2011, the Company has no financial assets that are past due or impaired due to credit risk related defaults.
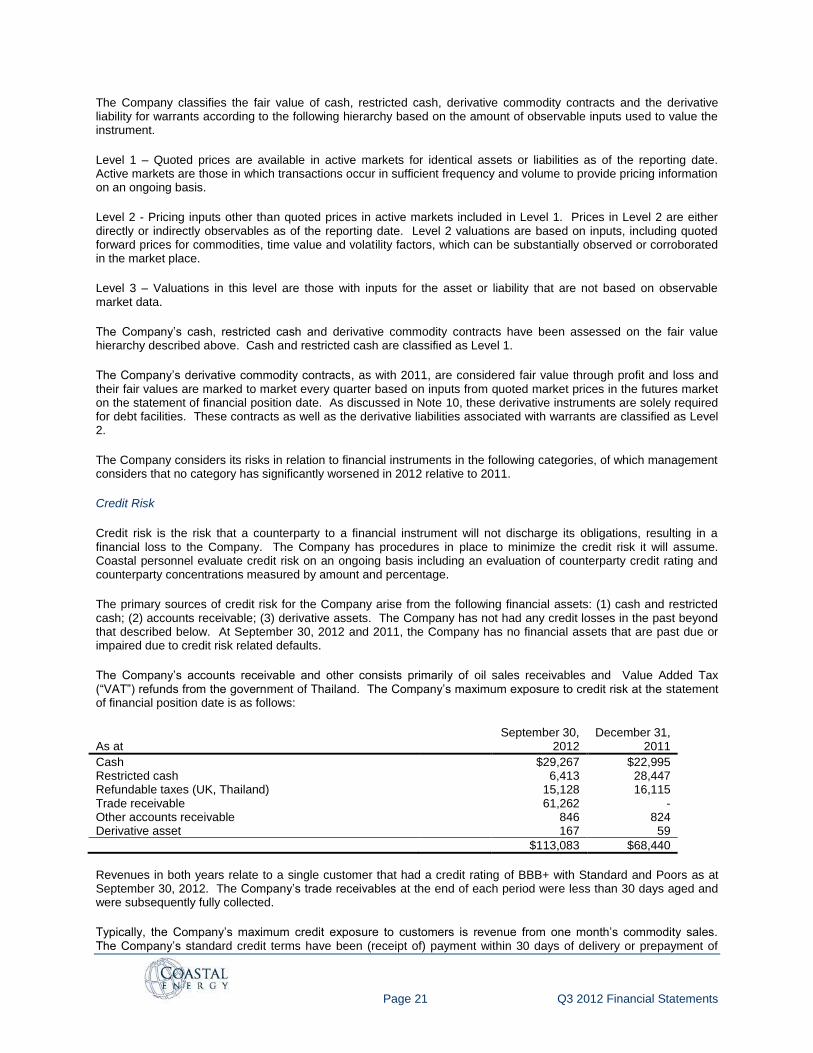
The Company‟s accounts receivable and other consists primarily of oil sales receivables and Value Added Tax (“VAT”) refunds from the government of Thailand. The Company‟s maximum exposure to credit risk at the statement of financial position date is as follows:
As at September 30,
2012 December 31,
2011
Cash $29,267 $22,995 Restricted cash 6,413 28,447 Refundable taxes (UK, Thailand) 15,128 16,115 Trade receivable 61,262 - Other accounts receivable 846 824 Derivative asset 167 59
$113,083 $68,440
Revenues in both years relate to a single customer that had a credit rating of BBB+ with Standard and Poors as at September 30, 2012. The Company‟s trade receivables at the end of each period were less than 30 days aged and were subsequently fully collected.
Typically, the Company‟s maximum credit exposure to customers is revenue from one month‟s commodity sales. The Company‟s standard credit terms have been (receipt of) payment within 30 days of delivery or prepayment of
Page 22 Q3 2012 Financial Statements
crude oil sales, although the latter is no longer permitted as part of the new debt facility. The Company‟s policy to mitigate credit risk associated with commodity sales is to establish relationships with credit worthy customers. The Company has not written off any amounts receivable in either 2012 or 2011.
No receivables are overdue (2011: $nil) and hence no allowance has been made for doubtful accounts receivable (2011: $nil).
Liquidity Risk
Liquidity risk is the risk that the Company will not be able to meet its obligations with respect to its financial liabilities. The Company‟s financial liabilities are comprised of accounts payable and accrued liabilities, derivative liabilities, long-term debt, obligations under operating leases and future contractual commitments. The Company frequently assesses its liquidity position and obligations under its financial liabilities by preparing financial forecasts. Coastal mitigates liquidity risks by maintaining a sufficient cash balance as well as maintaining a sufficient current and projected liquidity cushion to meet expected future payments.
The Company‟s financial liabilities arose primarily from the development of its Thailand properties. Payment terms on the Company‟s accounts payable and accrued liabilities are typically 30 to 60 days from receipt of invoice and generally do not bear interest. At September 30, 2012 the Company had recorded all of the obligations associated with its financial liabilities. In the normal course of business, the Company enters into contracts that give rise to commitments for future minimum payments. The following table summarizes the remaining contractual maturities of the Company‟s financial liabilities:
September 30, 2012 December 31, 2011
Within 1 year
1-2 Years
3-5 years
There after
Total Total
Accounts payable and accrued liabilities $157,513 $- $- $- $157,513 $59,471 Long-term debt principal and interest 342 - - 100,000 100,342 80,009 Derivative liabilities 3,910 506 - - 4,416 15,831 Derivative liability – warrants 3,486 - - - 3,486 2,853
$165,521 $506 $- $100,000 $265,757 $158,164
Market Risk
Market risk is the risk that the fair value (for assets or liabilities considered to be fair value through profit and loss and available-for-sale) or future cash flows (for assets or liabilities considered to be held-to-maturity, other financial liabilities, and loans or receivables) of a financial instrument will fluctuate because of changes in market prices. The Company evaluates market risk on an ongoing basis. Coastal assesses the impact of variability in identified market risk on its various assets and liabilities and has established policies and procedures to mitigate market risk on its foreign exchange, interest rates and derivative contract.
(a) Currency Risk
Coastal operates internationally and therefore is exposed to the effects of changes in currency exchange rates. Although the functional currency of the Company is United States Dollars, it also transacts business in Thai Baht, Malaysian Ringgit, Singapore Dollars, Australian Dollars, British Pounds, Canadian Dollars and Euros. The Company is subject to inflation in the countries in which it operates and fluctuations in the rate of currency exchange between the United States and these other countries. The Company does not currently use financial instruments or derivatives to hedge these currency risks.
Exchange rate fluctuations may affect the costs that the Company incurs in its operations. The Company‟s costs are incurred principally in Thai Baht, Malaysian Ringgit, Singapore Dollars, Australian Dollars, British Pounds and Canadian Dollars. The appreciation of non-US Dollar currencies against the US Dollar can increase the costs of operations and capital expenditures in US Dollar terms.
Page 23 Q3 2012 Financial Statements
Based on the Company‟s net foreign currency exposures at September 30, 2012, a 10% depreciation or appreciation of the foreign currencies against the US dollar would result in a $1.83 million (December 31, 2011: $0.90 million) increase or decrease in the Company‟s after-tax earnings with the same impact on comprehensive income. These exposures are attributable to year-end payables and receivables denominated in currencies other than the US dollar.
(b) Interest Rate Risk The Company is exposed to interest rate risk on its outstanding borrowings and short-term investments. Presently the Company‟s credit facility has an interest rate of LIBOR plus 350 bps. The Company monitors its exposure to interest rates and is comfortable with its exposures given the relatively short-term of the interest rates on long-term debt. The terms of the Company‟s long-term debt obligation is described in Note 10. The Company accounts for its borrowings under the long-term debt on an amortized cost basis. The Company had borrowings totaling $100.0 million at September 30, 2012 (December 31, 2011: $80.0 million). A 100 basis point change in interest rates at the statement of financial position date would result in a $1.00 million change in the Company‟s annual net income (2011: $0.80 million). The Company has entered into an interest rate swap to specifically manage interest rate risk. Further details can be found in Note 10.
The Company paid an average of 7.14% and 6.20%, respectively on its borrowings for the three and nine months ended September 30, 2012 (2011: 5.14% and 5.12% respectively).
The Company earned an average of 0.01% and 0.01%, respectively on its short-term investments for the three and nine months ended September 30, 2012 (2011: 0.05% and 0.05%, respectively).
(c) Commodity Price Risk
Profitability of the Company depends on market prices for petroleum and natural gas. Petroleum and natural gas prices are affected by numerous factors such as global consumption and demand for petroleum and natural gas, international economic and political trends, fluctuation in the US dollar and other currencies, interest rates, and inflation.
A 10% decline in the reference price projection would not reduce the availability under the borrowing base at September 30, 2012.
As a requirement of the debt facilities, the Company entered into a derivative hedging agreement described in Note 10. A 10% increase in prices of Brent as of September 30, 2012 would cause an increase in the derivative liability of $9.58 million (2011: increase in liability of $7.31 million) from what is recorded on the statement of financial position. A 10% decrease in prices as of September 30, 2012 would cause a decrease in the liability of $5.43 million (2011: decrease of $5.09 million).
(d) Other Price Risk
The Company is exposed to equity price risk in relation to stock appreciation rights granted to employees. For more detail, see Note 8.
Note 19. Subsequent events
On October 3, 2012, the Company signed a contract with a subsidiary of Atwood Oceanics, Inc. for the Manta jackup drilling rig. The rig is scheduled to be delivered by late November and will conduct drilling operations for the Company in the Gulf of Thailand and offshore Malaysia.
[The remainder of this page intentionally left blank]
Additional information, including the Company's complete competent person's report may be found on the Company's website at www.CoastalEnergy.com or may be found in documents filed on SEDAR at www.sedar.com.
This statement contains ‘forward-looking statements’ as defined by the applicable securities legislation. Statements relating to current and future drilling results, existence and recoverability of potential hydrocarbon reserves, production amounts or revenues, forward capital expenditures, operation costs, oil and gas price forecasts and similar matters are based on current data and information and should be
Page 24 Q3 2012 Financial Statements
viewed as forward-looking statements. Such statements are not guarantees of future results and are subject to risks and uncertainties beyond Coastal Energy’s control. Actual results may differ substantially from the forward-looking statements.
Enquiries:
Coastal Energy Company Email: [email protected] +1 (713) 877-6793 Strand Hanson Limited (Nominated Adviser) +44 (0) 20 7409 3494 Rory Murphy / Andrew Emmott Macquarie Capital (Europe) Limited (Broker) +44 (0) 20 3037 2000 Paul Connolly / Jeffrey Auld FirstEnergy Capital LLP (Broker) Hugh Sanderson / Travis Inlow +44 (0) 20 7448 0200
Buchanan Tim Thompson / Ben Romney +44 (0) 20 7466 5000