Embed Size (px)
Citation preview
Oceanography 101, Richard Strickland Lecture 7 © 2006 University of Washington
Tsunami
• Japanese term
– Tsu = harbor, Nami = wave
– Both singular & plural
• “Tidal Wave” a misnomer
– Nothing to do with tides
•Except both are waves on water
– “Seismic sea wave” better
• What causes tsunami?
– Usually major submarine quakes
– But also volcanoes, landslides, iceberg falls1
Oceanography 101, Richard Strickland Lecture 7 © 2006 University of Washington
Tsunami
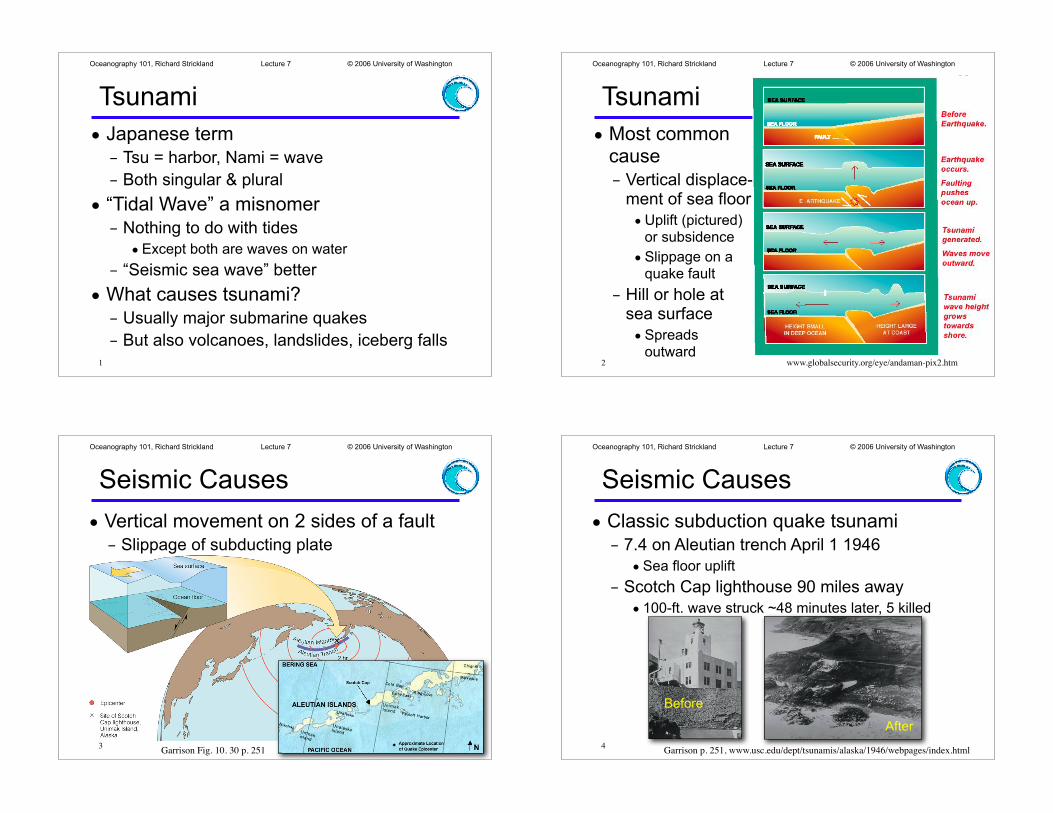
• Most common cause
– Vertical displace-ment of sea floor
•Uplift (pictured) or subsidence
•Slippage on a quake fault
– Hill or hole at sea surface
•Spreads outward
2 www.globalsecurity.org/eye/andaman-pix2.htm
Oceanography 101, Richard Strickland Lecture 7 © 2006 University of Washington
Seismic Causes
• Vertical movement on 2 sides of a fault
– Slippage of subducting plate
3Garrison Fig. 10. 30 p. 251
Oceanography 101, Richard Strickland Lecture 7 © 2006 University of Washington
Seismic Causes
• Classic subduction quake tsunami
– 7.4 on Aleutian trench April 1 1946
•Sea floor uplift
– Scotch Cap lighthouse 90 miles away
• 100-ft. wave struck ~48 minutes later, 5 killed
4Garrison p. 251, www.usc.edu/dept/tsunamis/alaska/1946/webpages/index.html
Before
After
Oceanography 101, Richard Strickland Lecture 7 © 2006 University of Washington
Northwest Seismic Causes
• Cascadia subduction zone
– Between quakes, sea floor sinks & continent rises
•Olympic coast rising ~3 mm/yr
– Rupture: sea floor lifts, continent subsides
• Falls ~ 1 meter
5http://www.pnsn.org/HAZARDS/CASCADIA/land_levels.html
Oceanography 101, Richard Strickland Lecture 7 © 2006 University of Washington
Northwest Seismic Causes
• Seattle Fault
– Crust blocks squeezed by plate collision
– Crust south of fault rose ~20 ft.
• ~7 m (20 ft.)
• 900 AD
•Crust north of fault fell
– Modeled scenario for future quake & tsunami
6
Figure 3. Freeze frames of animation of modeled tsunami at 30-second intervals (from left to right). The wave crest is colored pale blue. Note that because Harbor Island is uplifted by the earthquake, the Duwamish Waterway initially drains rapidly before the wavereflects off the north side of the bay and then inundates the Harbor Island area.
WASHINGTON DIVISION OF GEOLOGY AND EARTH RESOURCESOPEN FILE REPORT 2003-14
Figure 1. (left) Map showing Seattle fault and associated ground deformation model used in thisstudy. Numbered locations are localities mentioned in text. 1, Restoration Point; 2, Newcastle Hills;3, Alki Point; 4, West Point; 5, Cultus Bay; 6, Snohomish Delta.
LakeCushman
LakeWashington
Seattle
Tacoma
13
4
LakeSammamish
Snohomish
River
Everett
5
6
NewcastleHills2
–2–0
0–2
2–4
4–6
6–8
Uplift (meters)C
edar River
GreenRiver
White River
Puyallup
River
Nisqually
River
Olympia
U.S
. DE
PA
RTMENT O F CO
MM
ER
CE
NA
TIO
NA
L O
CE
A
NIC
AND ATMOSPHE
RIC
AD
MIN
I ST
RA
TIO
N
1
2Washington Division of Geology and Earth Resources, PO Box 47007, Olympia, WA 98504-7007,
National Oceanic and Atmospheric Administration, Pacific Marine Environmental Laboratory, 7600 Sand Point Way NE, Seattle, WA [email protected], [email protected]
[email protected], [email protected],
SCALE 1:50,000
MAP LOCATION
Tsunami Hazard Map of the Elliott Bay Area, Seattle, Washington:Modeled Tsunami Inundation from a Seattle Fault Earthquake
by
Timothy J. Walsh , Vasily V. Titov , Angie J. Venturato , Harold O. Mofjeld , and Frank I. Gonzalez
2003
1 2 2 2 2
The phenomenon we call “tsunami” (soo-NAH-mee) is a series of travelingocean waves of extremely long length generated by disturbances associatedprimarily with earthquakes occurring below or near the ocean floor.Underwater volcanic eruptions and landslides can also generate tsunamis. Inthe deep ocean, their length from wave crest to wave crest may be a hundredmiles or more but with a wave height of only a few feet or less. They cannot befelt aboard ships nor can they be seen from the air in the open ocean. In deepwater, the waves may reach speeds exceeding 500 miles per hour.
Tsunamis are a threat to life and property to anyone living near the ocean. Forexample, in 1992 and 1993 over 2,000 people were killed by tsunamisoccurring in Nicaragua, Indonesia and Japan. Property damage was nearly onebillion dollars. The 1960 Chile Earthquake generated a Pacific-wide tsunamithat caused widespread death and destruction in Chile, Hawaii, Japan and otherareas in the Pacific. Large tsunamis have been known to rise over 100 feet,while tsunamis 10 to 20 feet high can be very destructive and cause manydeaths and injuries.
Fromby the U.S. Department of Commerce,
National Oceanic and Atmospheric Administration,National Weather Service, Intergovernmental Oceanographic Commission,
and International Tsunami Information CenterAccessed at http://www.nws.noaa.gov/om/brochures/tsunami.htm on 8/27/02
Tsunamis—The Great Waves
Current velocity: none medium1.5 m/s<
high1.5 m/s>
Figure 2. Computed current velocity zones. Note that velocities are highest alongthe shoreline and in narrow channels. One meter/second is ~2.2 mph.
shoreline
15000 FEET10000500005000
11 0 2 3 MILES
11 0 2 3 4 5 KILOMETERS
INTRODUCTION
THE SEATTLE FAULT
MODELING
LIMITATIONS OF THE MAP
ACKNOWLEDGMENTS
REFERENCES CITED
I 1995, Congress directed the National Oceanic and Atmospheric Administration (NOAA)to develop a plan to prot ct the West Coast from tsunamis generated locally. A panel ofrepresentatives from NOAA, the Federal Emergency Management Agency (FEMA), theU.S. Geological Survey (USGS) and the five Pacific coast states wrote the plan andsubmitted it to Congress, which created the National Tsunami Hazard Mitigation Program(NTHMP) in October of 1996. The National Tsunami Hazard Mitigation Program isdesigned to reduce the impact of tsunamis through warning guidance, hazard assessment,and mitigation. A key component of the hazard assessment for tsunamis is delineation ofareas subject to tsunami inundation. This map is part of a series of tsunami inundation mapsproduced by the Washington Department of Natural Resources, Division of Geology andEarth Resources, in cooperation with the Washington Emergency Management Division, as acontribution of the National Tsunami Hazard Mitigation Program (Walsh and others,2003a,b; 2002a,b; 2000). These maps are produced using computer models of earthquake-generated tsunamis from nearby seismic sources. The modeling for this map was done by theCenter for the Tsunami Inundation Mapping Efforts (TIME) at NOAA's Pacific MarineEnvironmental Laboratory in Seattle for a scenario earthquake on the Seattle fault.
Geographic features now known to be associated with the Seattle fault have been noted formany years. Vancouver (1798) noted that the fault-uplifted bedrock wavecut platform atRestoration Point (Fig. 1, Location 1) on Bainbridge Island “did not possess that beautifulvariety of landscape, being an almost impenetrable wilderness of lofty trees” thatcharacterized the rest of his explorations in Puget Sound. Kimball (1897) described theNewcastle Hills (Fig. 1, Location 2), part of the hanging wall of the fault, as a “postglacialeruption”. Dane! and others (1965) interpreted the large gravity and magnetic anomaliesthrough central Puget Sound and the associated abrupt change in the sedimentary sectionthickness as an active fault with about 11 km of displacement. Rogers (1970) collectedadditional gravity and magnetic data across the structure and named it the Seattle–Bremertonfault. Gower (1978) demonstrated that the uplift at Restoration Point (Fig. 1, Location 1)was Holocene in age and Bucknam and others (1992) showed that there was an uplift of 7meters produced on the fault about 1,000 years ago.
In 1996, the first of a series of lidar (Light Detection And Ranging) surveys was flownover Bainbridge Island. This and subsequent lidar missions have enabled scientists to locatesplays of the fault in a number of places accurately enough to dig trenches (Bucknam andothers, 1999; Nelson and others, 2002). Lidar mapping and trenching have enabled scientiststo accurately map the amount of uplift on the fault in some places. Also in 1996, the U.S.Geological Survey began several large-scale geophysical studies. An aeromagnetic study ofthe Puget Sound (Blakely and others, 1999, 2002) enabled more accurate location of thefault along its entire length. Seismic reflection and tomographic studies, such as SHIPS(Seismic Hazards Investigations in Puget Sound) and other geophysical studies in PugetSound have greatly increased the understanding of the fault characteristics at depth (Prattand others, 1997; Johnson and others, 1999; Brocher and others, 2001; ten Brink and others,2002; Van Wagoner and others, 2002), although considerable uncertainties and controversyremain.
There also is substantial evidence that earthquakes on the Seattle fault can generatetsunamis. Atwater and Moore (1992) showed that tsunamis inundated part of WhidbeyIsland (Fig. 1, Location 5) and West Point (Fig. 1, Location 4) about 1000 years ago, andJacoby and others (1992) showed that a tree in the tsunami deposit at West Point died in thesame season of the same year as a drowned forest carried into Lake Washington by a hugelandslide from Mercer Island, strongly implicating the A.D. 900–930 event. A discontinuoussand layer along Snohomish delta distributaries—Ebey Slough, Steamboat Slough, UnionSlough, and Snohomish River (Fig. 1, Location 6)—also probably was deposited by thetsunami from the large A.D. 900–930 earthquake on the Seattle fault (Bourgeois andJohnson, 2001).
Tsunami inundation shown on the map is based on a computer model of waves generated bythe Seattle fault (Titov and others, in press). The model used is the finite difference model ofTitov and Synolakis (1998), also known as the Method of Splitting Tsunami (MOST) model(Titov and González, 1997). It uses a grid of topographic and bathymetric elevations andcalculates a wave elevation and velocity at each gridpoint at specified time intervals tosimulate the generation, propagation and inundation of tsunamis in the Elliot Bay area.
In this MOST model study, the tsunami is generated by a Seattle fault deformation modelthat simulates the A.D. 900–930 event as a credible worst-case scenario of magnitude 7.3.The magnitude was chosen to be consistent with the 2002 USGS update of the NationalSeismic Hazard Maps (Frankel and others, 2002). Parameter values are based on Brocherand others (2001), Calvert and Fisher (2001), and ten Brink and others (2002).
1 0.5 15.2 20 87.9 60 12 0.5 6.3 20 86.6 60 13 0.5 8.9 20 96.0 60 124 0.5 3.2 20 128.8 60 115 0.5 11.5 20 99.3 60 46 0.5 14.9 20 81.0 60 1
The slip distribution was constrained, through trial-and-error, to match available fieldestimates of vertical displacement at three sites—Alki Point (Fig. 1, Location 3; +4 m),Restoration Point (Fig. 1, Location 1; +7 m) and West Point (Fig. 1, Location 4; –1 ±0.5 m).
Titov and others (in press) also modeled a M7.6 event, and the tsunami inundation valuesand patterns were essentially the same as for the M7.3 event. No doubt this is due to the factthat the deformation patterns and values were very similar for both events, since they wereeach constrained by field estimates at the three sites. Also, the smaller ground displacementzone of the M7.3 event forms a more concentrated tsunami source that compensates for itssmaller overall displacement.
The computed tsunami inundation is shown on the map in three color-coded depthranges—0–0.5 m, 0.5–2 m, and greater than 2 m. These depth ranges were chosen becausethey are approximately knee-high or less, knee-high to head-high, and more than head-high.The limit of tsunami inundation is the landward edge of the green zone. In previous maps,we have shown only the edge of inundation, but for this map, much higher resolutionbathymetric and topographic data were available. Figure 2 also shows current velocities intwo zones—less than or greater than 1.5 meters/second (~3 miles/hour), which is the currentspeed at which it would be difficult to stand. Within this zone, computed velocities locallyexceed 20 meters/second (~40 miles/hour). Computed wave heights in Elliott Bay wereapproximately 6 meters. Figure 3 shows a time progression of the wave across Elliott Bay at30-second intervals. Note that because Harbor Island is uplifted by the earthquake, theDuwamish Waterway initially drains rapidly before the wave reflects off the north side of thebay and then inundates the Harbor Island area.
Because the nature of the tsunami depends on the initial deformation of the earthquake,which is poorly understood, the largest source of uncertainty is the input earthquake. Theearthquake scenario used in this modeling was selected to honor the paleoseismicconstraints, but the next Seattle fault earthquake may be substantially different from these.Sherrod and others (2000) show that an uplift event at Restoration Point predating the A.D.900–930 event was smaller. Trenching of subsidiary structures to the Seattle fault that arethought to be coseimic with the main fault trace (Nelson and others, 2002) indicate that therewere at least two earthquakes in the 1500 years before the A.D. 900–930 event. These,however, did not produce prominent uplifted wavecut platforms similar to the one made bythe A.D. 900–930 event, suggesting that significant earthquakes have occurred on the faultthat had different and smaller uplifts in central Puget Sound.
Another significant limitation is that the resolution of the modeling is no greater or moreaccurate than the bathymetric and topographic data used. This can be up to 50 metershorizontally, although high-resolution multibeam data (Gardner and others, 2001) isavailable for Elliott Bay and 2-foot contour topography is available for the city of Seattle.
The model run does not include the influences of changes in tides and is referred to meanhigh water. The tide stage and tidal currents can amplify or reduce the impact of a tsunamion a specific community. In Elliott Bay, the mean spring tide range is about 11 feet and canbe as much as about 16 feet (NOAA, accessed at http://co-ops.nos.noaa.gov/co-ops.html,June 25, 2003). This means that, while the modeling can be a useful tool to guide evacuationplanning, it is not of sufficient resolution to be useful for land-use planning.
This project was supported by the National Tsunami Hazards Mitigation Program (NTHMP)in cooperation with the city of Seattle and the Washington Emergency ManagementDivision. Information about NTHMP is available at http://www.pmel.noaa.gov/tsunami-hazard/. Discussions with Tom Pratt, Brian Sherrod, and Craig Weaver (all USGS, Seattle)were invaluable for calibrating the fault source model. Karl Wegmann and Steve Palmer,both Washington Division of Geology and Earth Resources, provided helpful reviews.
n
e
Table 1. Segment (west to east) parameters for magnitude 7.3 Seattle fault earthquake models. The
vertical deformation pattern is shown in Figure 1.
Segment Depth (km) Length (km) Width (km) Strike (°) Dip (°) Slip (m)
Atwater, B. F.; Moore, A. L., 1992, A tsunami about 1000 years ago in Puget Sound, Washington:
Science, v. 258, no. 5088, p. 1614-1617.
Blakely, R. J.; Wells, R. E.; Weaver, C. S., 1999, Puget Sound aeromagnetic maps and data: U.S.
Geological Survey Open-File Report 99-514, version 1.0. [Accessed Oct. 3, 2000, at
http://geopubs.wr.usgs.gov/open-file/of99-514/]
Blakely, R. J.; Wells, R. E.; Weaver, C. S.; Johnson, S. Y., 2002, Location, structure, and seismicity
of the Seattle fault zone, Washington—Evidence from aeromagnetic anomalies, geologic
mapping, and seismic-reflection data: Geological Society of America Bulletin, v. 114, no. 2,
p. 169-177.
Brocher, T. M.; Parsons, T. E.; Blakely, R. J.; Christensen, N. I.; Fisher, M. A.; Wells, R. E.; SHIPS
Working Group, 2001, Upper crustal structure in Puget Lowland, Washington—Results from the
1998 Seismic Hazards Investigations in Puget Sound: Journal of Geophysical Research, v. 106,
no. B7, p. 13,541-13,564.
Bourgeois, Joanne; Johnson, S. Y., 2001, Geologic evidence of earthquakes at the Snohomish delta,
Washington, in the past 1200 yr: Geological Society of America Bulletin, v. 113, no. 4, p. 482-
494.
Bucknam, R. C.; Hemphill-Haley, Eileen; Leopold, E. B., 1992, Abrupt uplift within the past 1700
years at southern Puget Sound, Washington: Science, v. 258, no. 5088, p. 1611-1614.
Bucknam, R. C.; Sherrod, B. L.; Elfendahl, G. W., 1999, A fault scarp of probable Holocene age in
the Seattle fault zone, Bainbridge Island, Washington [abstract]: Seismological Research Letters,
v. 70, no. 2, p. 233.
Calvert, A. J.; Fisher, M. A.; SHIPS Working Group, 2001, Imaging the Seattle fault zone with high-
resolution seismic tomography: Geophysical Research Letters, v. 28, no. 12, p. 2337-2340.
Dane!, Z. F.; Bonno, M.; Brau, J. E.; Gilham, W. D.; Hoffman, T. F.; Johansen, D.; Jones, M. H.;
Malfait, Bruce; Masten, J.; Teague, G. O., 1965, Geophysical investigation of the southern Puget
Sound area, Washington: Journal of Geophysical Research, v. 70, no. 22, p. 5573-5580.
Frankel, A. D.; Petersen, M. D.; Mueller, C. S.; Haller, K. M.; Wheeler, R. L.; Leyendecker, E. V.;
Wesson, R. L.; Harmsen, S. C.; Cramer, C. H.; Perkins, D. M.; Rukstales, K. S., 2002,
Documentation for the 2002 Update of the National Seismic Hazard Maps: U.S. Geological
Survey Open-File Report 02-420. [Accessed June 25, 2003, at http://pubs.usgs.gov/of/2002/ofr-
02-420/]
Gardner, J. V.; van den Ameele, E. J.; Dartnell, Peter, 2001, Multibeam mapping of the major deltas
of southern Puget Sound, Washington: U.S. Geological Survey Open-File Report 01-266, 1 v.
Gower, H. D., 1978, Tectonic map of the Puget Sound region, Washington, showing locations of
faults, principal folds, and large-scale Quaternary deformation: U.S. Geological Survey Open-File
Report 78-426, 22 p., 1 plate, scale 1:250,000.
Jacoby, G. C.; Williams, P. L.; Buckley, B. M., 1992, Tree ring correlation between prehistoric
landslides and abrupt tectonic events in Seattle, Washington: Science, v. 258, no. 5088, p. 1621-
1623.
Johnson, S. Y.; Dadisman, S. V.; Childs, J. R.; Stanley, W. D., 1999, Active tectonics of the Seattle
fault and central Puget Sound, Washington—Implications for earthquake hazards: Geological
Society of America Bulletin, v. 111, no. 7, p. 1042-1053, 1 plate.
Kimball, J. P., 1897, Physiographic geology of the Puget Sound basin [in 2 parts]: American
Geologist, v. 19, no. 4, p. 225-237 [part 1]; v. 19, no. 5, p. 304-322 [part 2].
Nelson, A. R.; Johnson, S. Y.; Wells, R. E.; Pezzopane, S. K.; Kelsey, H. M.; Sherrod, B. L.; Bradley,
L.-A.; Koehler, R. D., III; Bucknam, R. C.; Haugerud, R. A.; Laprade, W. T., 2002, Field and
laboratory data from an earthquake history study of the Toe Jam Hill fault, Bainbridge Island,
Washington: U.S. Geological Survey Open-File Report 02-60, 1 v., 2 plates.
Pratt, T. L.; Johnson, S. Y.; Potter, C. J.; Stephenson, W. J.; Finn, C. A., 1997, Seismic reflection
images beneath Puget Sound, western Washington State—The Puget Lowland thrust sheet
hypothesis: Journal of Geophysical Research, v. 102, no. B12, p. 27,469-27,489.
Rogers, W. P., 1970, A geological and geophysical study of the central Puget Sound lowland:
University of Washington Doctor of Philosophy thesis, 123 p., 9 plates.
Sherrod, B. L.; Bucknam, R. C.; Leopold, E. B., 2000, Holocene relative sea level changes along the
Seattle fault at Restoration Point, Washington: Quaternary Research, v. 54, no. 3, p. 384-393.
ten Brink, U. S.; Molzer, P. C.; Fisher, M. A.; Blakely, R. J.; Bucknam, R. C.; Parsons, T. E.;
Crosson, R. S.; Creager, K. C., 2002, Subsurface geometry and evolution of the Seattle fault zone
and the Seattle basin, Washington: Seismological Society of America Bulletin, v. 92, no. 5,
p. 1737-1753.
Titov, V. V.; Gonzalez, F. I., 1997, Implementation and testing of the Method of Splitting Tsunami
(MOST) model: NOAA Technical Memorandum ERL PMEL-112 (PB98-122773), 11 p.
Titov, V. V.; Gonzalez, F. I.; Mofjeld, H. O.; Venturato, A. J., (in press), NOAA TIME Seattle tsunami
mapping project—Procedures, data sources, and products: NOAA Technical Memorandum OAR
PMEL-124, 15 p.
Titov, V. V.; Synolakis, C. E., 1998, Numerical modeling of tidal wave runup: Journal of Waterway,
Port, Coastal and Ocean Engineering, v. 124, no. 4, p. 157-171.
Vancouver, George, 1798, repr. 1992, A voyage of discovery to the north Pacific Ocean, and round
the world; in which the coast of north-west American has been carefully examined and accurately
surveyed—Undertaken by His Majesty's command, principally with a view to ascertain the
existence of any navigable communication between the north Pacific and north Atlantic Oceans;
and performed in the years 1790, 1791, 1792, 1793, 1794, and 1795: G. G. and J. Robinson
[London], 3 v.
Van Wagoner, T. M.; Crosson, R. S.; Creager, K. C.; Medema, G. F.; Preston, L. A.; Symons, N. P.;
Brocher, T. M., 2002, Crustal structure and relocated earthquakes in the Puget Lowland,
Washington, from high-resolution seismic tomography: Journal of Geophysical Research, v. 107,
no. B12, 2381, DOI 10.1029/2001JB000710, p. ESE 22-1 - 22-23.
Walsh, T. J.; Caruthers, C. G.; Heinitz, A. C.; Myers, E. P., III; Baptista, A. M.; Erdakos, G. B.;
Kamphaus, R. A., 2000, Tsunami hazard map of the southern Washington coast—Modeled
tsunami inundation from a Cascadia subduction zone earthquake: Washington Division of
Geology and Earth Resources Geologic Map GM-49, 1 sheet, scale 1:100,000, with 12 p. text.
Walsh, T. J.; Myers, E. P., III; Baptista, A. M., 2002a, Tsunami inundation map of the Port Angeles,
Washington area: Washington Division of Geology and Earth Resources Open File Report 2002-
1, 1 sheet, scale 1:24,000.
Walsh, T. J.; Myers, E. P., III; Baptista, A. M., 2002b, Tsunami inundation map of the Port Townsend,
Washington area: Washington Division of Geology and Earth Resources Open File Report 2002-
2, 1 sheet, scale 1:24,000.
Walsh, T. J.; Myers, E. P., III; Baptista, A. M., 2003a, Tsunami inundation map of the Neah Bay,
Washington, area: Washington Division of Geology and Earth Resources Open File Report 2003-
2, 1 sheet, scale 1:24,000.
Walsh, T. J.; Myers, E. P., III; Baptista, A. M., 2003b, Tsunami inundation map of the Quileute,
Washington, area: Washington Division of Geology and Earth Resources Open File Report 2003-
1, 1 sheet, scale 1:24,000.
Depth of inundation: 0–.5 meters .5–2 meters 2–5 meters
NOAA TIME CenterPacific Marine Environmental LaboratorySeattle, Washington
www.dnr.wa.gov/geology/pdf/ofr03-14.pdf
Oceanography 101, Richard Strickland Lecture 7 © 2006 University of Washington
Seattle Fault
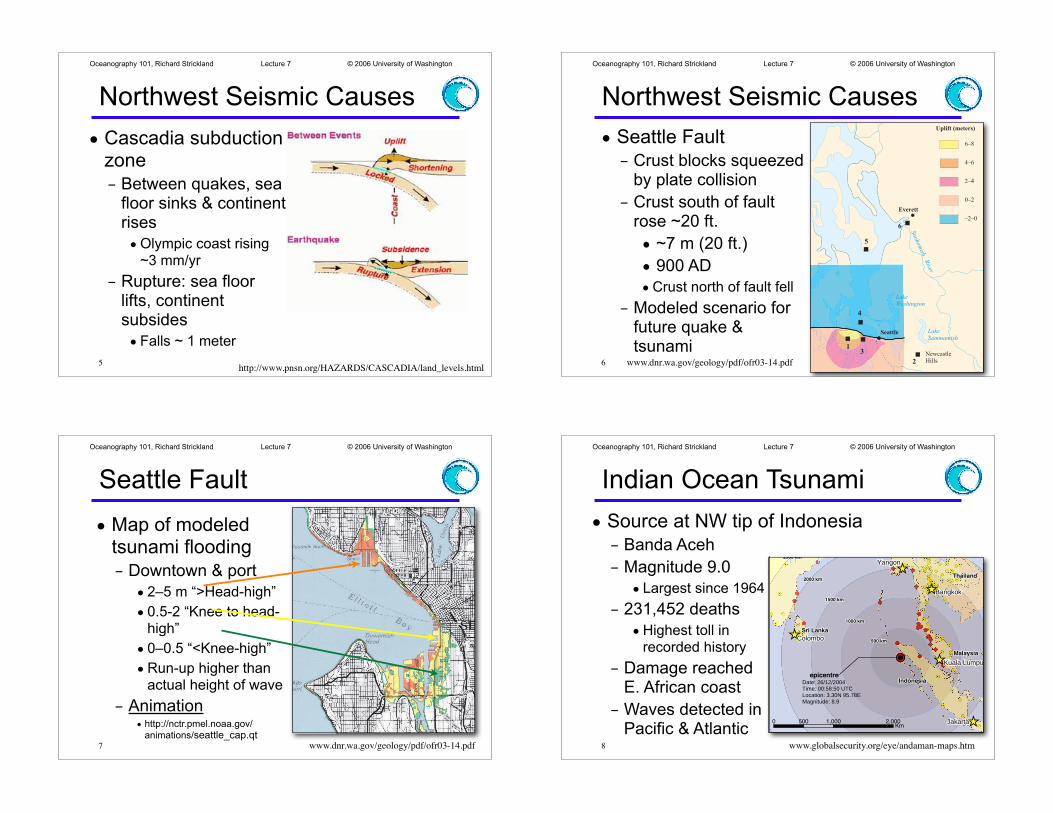
• Map of modeled tsunami flooding
– Downtown & port
• 2–5 m “>Head-high”
• 0.5-2 “Knee to head-high”
• 0–0.5 “<Knee-high”
•Run-up higher than actual height of wave
– Animation• http://nctr.pmel.noaa.gov/
animations/seattle_cap.qt7
Figure 3. Freeze frames of animation of modeled tsunami at 30-second intervals (from left to right). The wave crest is colored pale blue. Note that because Harbor Island is uplifted by the earthquake, the Duwamish Waterway initially drains rapidly before the wavereflects off the north side of the bay and then inundates the Harbor Island area.
WASHINGTON DIVISION OF GEOLOGY AND EARTH RESOURCESOPEN FILE REPORT 2003-14
Figure 1. (left) Map showing Seattle fault and associated ground deformation model used in thisstudy. Numbered locations are localities mentioned in text. 1, Restoration Point; 2, Newcastle Hills;3, Alki Point; 4, West Point; 5, Cultus Bay; 6, Snohomish Delta.
LakeCushman
LakeWashington
Seattle
Tacoma
13
4
LakeSammamish
Snohomish
River
Everett
5
6
NewcastleHills2
–2–0
0–2
2–4
4–6
6–8
Uplift (meters)
Cedar River
GreenRiver
White River
Puyallup
River
Nisqually
River
Olympia
U.S
. DE
PA
RTMENT O F CO
MM
ER
CE
NA
TIO
NA
L O
CE
A
NIC
AND ATMOSPHE
RIC
AD
MIN
I ST
RA
TIO
N
1
2Washington Division of Geology and Earth Resources, PO Box 47007, Olympia, WA 98504-7007,
National Oceanic and Atmospheric Administration, Pacific Marine Environmental Laboratory, 7600 Sand Point Way NE, Seattle, WA [email protected], [email protected]
[email protected], [email protected],
SCALE 1:50,000
MAP LOCATION
Tsunami Hazard Map of the Elliott Bay Area, Seattle, Washington:Modeled Tsunami Inundation from a Seattle Fault Earthquake
by
Timothy J. Walsh , Vasily V. Titov , Angie J. Venturato , Harold O. Mofjeld , and Frank I. Gonzalez
2003
1 2 2 2 2
The phenomenon we call “tsunami” (soo-NAH-mee) is a series of travelingocean waves of extremely long length generated by disturbances associatedprimarily with earthquakes occurring below or near the ocean floor.Underwater volcanic eruptions and landslides can also generate tsunamis. Inthe deep ocean, their length from wave crest to wave crest may be a hundredmiles or more but with a wave height of only a few feet or less. They cannot befelt aboard ships nor can they be seen from the air in the open ocean. In deepwater, the waves may reach speeds exceeding 500 miles per hour.
Tsunamis are a threat to life and property to anyone living near the ocean. Forexample, in 1992 and 1993 over 2,000 people were killed by tsunamisoccurring in Nicaragua, Indonesia and Japan. Property damage was nearly onebillion dollars. The 1960 Chile Earthquake generated a Pacific-wide tsunamithat caused widespread death and destruction in Chile, Hawaii, Japan and otherareas in the Pacific. Large tsunamis have been known to rise over 100 feet,while tsunamis 10 to 20 feet high can be very destructive and cause manydeaths and injuries.
Fromby the U.S. Department of Commerce,
National Oceanic and Atmospheric Administration,National Weather Service, Intergovernmental Oceanographic Commission,
and International Tsunami Information CenterAccessed at http://www.nws.noaa.gov/om/brochures/tsunami.htm on 8/27/02
Tsunamis—The Great Waves
Current velocity: none medium1.5 m/s<
high1.5 m/s>
Figure 2. Computed current velocity zones. Note that velocities are highest alongthe shoreline and in narrow channels. One meter/second is ~2.2 mph.
shoreline
15000 FEET10000500005000
11 0 2 3 MILES
11 0 2 3 4 5 KILOMETERS
INTRODUCTION
THE SEATTLE FAULT
MODELING
LIMITATIONS OF THE MAP
ACKNOWLEDGMENTS
REFERENCES CITED
I 1995, Congress directed the National Oceanic and Atmospheric Administration (NOAA)to develop a plan to prot ct the West Coast from tsunamis generated locally. A panel ofrepresentatives from NOAA, the Federal Emergency Management Agency (FEMA), theU.S. Geological Survey (USGS) and the five Pacific coast states wrote the plan andsubmitted it to Congress, which created the National Tsunami Hazard Mitigation Program(NTHMP) in October of 1996. The National Tsunami Hazard Mitigation Program isdesigned to reduce the impact of tsunamis through warning guidance, hazard assessment,and mitigation. A key component of the hazard assessment for tsunamis is delineation ofareas subject to tsunami inundation. This map is part of a series of tsunami inundation mapsproduced by the Washington Department of Natural Resources, Division of Geology andEarth Resources, in cooperation with the Washington Emergency Management Division, as acontribution of the National Tsunami Hazard Mitigation Program (Walsh and others,2003a,b; 2002a,b; 2000). These maps are produced using computer models of earthquake-generated tsunamis from nearby seismic sources. The modeling for this map was done by theCenter for the Tsunami Inundation Mapping Efforts (TIME) at NOAA's Pacific MarineEnvironmental Laboratory in Seattle for a scenario earthquake on the Seattle fault.
Geographic features now known to be associated with the Seattle fault have been noted formany years. Vancouver (1798) noted that the fault-uplifted bedrock wavecut platform atRestoration Point (Fig. 1, Location 1) on Bainbridge Island “did not possess that beautifulvariety of landscape, being an almost impenetrable wilderness of lofty trees” thatcharacterized the rest of his explorations in Puget Sound. Kimball (1897) described theNewcastle Hills (Fig. 1, Location 2), part of the hanging wall of the fault, as a “postglacialeruption”. Dane! and others (1965) interpreted the large gravity and magnetic anomaliesthrough central Puget Sound and the associated abrupt change in the sedimentary sectionthickness as an active fault with about 11 km of displacement. Rogers (1970) collectedadditional gravity and magnetic data across the structure and named it the Seattle–Bremertonfault. Gower (1978) demonstrated that the uplift at Restoration Point (Fig. 1, Location 1)was Holocene in age and Bucknam and others (1992) showed that there was an uplift of 7meters produced on the fault about 1,000 years ago.
In 1996, the first of a series of lidar (Light Detection And Ranging) surveys was flownover Bainbridge Island. This and subsequent lidar missions have enabled scientists to locatesplays of the fault in a number of places accurately enough to dig trenches (Bucknam andothers, 1999; Nelson and others, 2002). Lidar mapping and trenching have enabled scientiststo accurately map the amount of uplift on the fault in some places. Also in 1996, the U.S.Geological Survey began several large-scale geophysical studies. An aeromagnetic study ofthe Puget Sound (Blakely and others, 1999, 2002) enabled more accurate location of thefault along its entire length. Seismic reflection and tomographic studies, such as SHIPS(Seismic Hazards Investigations in Puget Sound) and other geophysical studies in PugetSound have greatly increased the understanding of the fault characteristics at depth (Prattand others, 1997; Johnson and others, 1999; Brocher and others, 2001; ten Brink and others,2002; Van Wagoner and others, 2002), although considerable uncertainties and controversyremain.
There also is substantial evidence that earthquakes on the Seattle fault can generatetsunamis. Atwater and Moore (1992) showed that tsunamis inundated part of WhidbeyIsland (Fig. 1, Location 5) and West Point (Fig. 1, Location 4) about 1000 years ago, andJacoby and others (1992) showed that a tree in the tsunami deposit at West Point died in thesame season of the same year as a drowned forest carried into Lake Washington by a hugelandslide from Mercer Island, strongly implicating the A.D. 900–930 event. A discontinuoussand layer along Snohomish delta distributaries—Ebey Slough, Steamboat Slough, UnionSlough, and Snohomish River (Fig. 1, Location 6)—also probably was deposited by thetsunami from the large A.D. 900–930 earthquake on the Seattle fault (Bourgeois andJohnson, 2001).
Tsunami inundation shown on the map is based on a computer model of waves generated bythe Seattle fault (Titov and others, in press). The model used is the finite difference model ofTitov and Synolakis (1998), also known as the Method of Splitting Tsunami (MOST) model(Titov and González, 1997). It uses a grid of topographic and bathymetric elevations andcalculates a wave elevation and velocity at each gridpoint at specified time intervals tosimulate the generation, propagation and inundation of tsunamis in the Elliot Bay area.
In this MOST model study, the tsunami is generated by a Seattle fault deformation modelthat simulates the A.D. 900–930 event as a credible worst-case scenario of magnitude 7.3.The magnitude was chosen to be consistent with the 2002 USGS update of the NationalSeismic Hazard Maps (Frankel and others, 2002). Parameter values are based on Brocherand others (2001), Calvert and Fisher (2001), and ten Brink and others (2002).
1 0.5 15.2 20 87.9 60 12 0.5 6.3 20 86.6 60 13 0.5 8.9 20 96.0 60 124 0.5 3.2 20 128.8 60 115 0.5 11.5 20 99.3 60 46 0.5 14.9 20 81.0 60 1
The slip distribution was constrained, through trial-and-error, to match available fieldestimates of vertical displacement at three sites—Alki Point (Fig. 1, Location 3; +4 m),Restoration Point (Fig. 1, Location 1; +7 m) and West Point (Fig. 1, Location 4; –1 ±0.5 m).
Titov and others (in press) also modeled a M7.6 event, and the tsunami inundation valuesand patterns were essentially the same as for the M7.3 event. No doubt this is due to the factthat the deformation patterns and values were very similar for both events, since they wereeach constrained by field estimates at the three sites. Also, the smaller ground displacementzone of the M7.3 event forms a more concentrated tsunami source that compensates for itssmaller overall displacement.
The computed tsunami inundation is shown on the map in three color-coded depthranges—0–0.5 m, 0.5–2 m, and greater than 2 m. These depth ranges were chosen becausethey are approximately knee-high or less, knee-high to head-high, and more than head-high.The limit of tsunami inundation is the landward edge of the green zone. In previous maps,we have shown only the edge of inundation, but for this map, much higher resolutionbathymetric and topographic data were available. Figure 2 also shows current velocities intwo zones—less than or greater than 1.5 meters/second (~3 miles/hour), which is the currentspeed at which it would be difficult to stand. Within this zone, computed velocities locallyexceed 20 meters/second (~40 miles/hour). Computed wave heights in Elliott Bay wereapproximately 6 meters. Figure 3 shows a time progression of the wave across Elliott Bay at30-second intervals. Note that because Harbor Island is uplifted by the earthquake, theDuwamish Waterway initially drains rapidly before the wave reflects off the north side of thebay and then inundates the Harbor Island area.
Because the nature of the tsunami depends on the initial deformation of the earthquake,which is poorly understood, the largest source of uncertainty is the input earthquake. Theearthquake scenario used in this modeling was selected to honor the paleoseismicconstraints, but the next Seattle fault earthquake may be substantially different from these.Sherrod and others (2000) show that an uplift event at Restoration Point predating the A.D.900–930 event was smaller. Trenching of subsidiary structures to the Seattle fault that arethought to be coseimic with the main fault trace (Nelson and others, 2002) indicate that therewere at least two earthquakes in the 1500 years before the A.D. 900–930 event. These,however, did not produce prominent uplifted wavecut platforms similar to the one made bythe A.D. 900–930 event, suggesting that significant earthquakes have occurred on the faultthat had different and smaller uplifts in central Puget Sound.
Another significant limitation is that the resolution of the modeling is no greater or moreaccurate than the bathymetric and topographic data used. This can be up to 50 metershorizontally, although high-resolution multibeam data (Gardner and others, 2001) isavailable for Elliott Bay and 2-foot contour topography is available for the city of Seattle.
The model run does not include the influences of changes in tides and is referred to meanhigh water. The tide stage and tidal currents can amplify or reduce the impact of a tsunamion a specific community. In Elliott Bay, the mean spring tide range is about 11 feet and canbe as much as about 16 feet (NOAA, accessed at http://co-ops.nos.noaa.gov/co-ops.html,June 25, 2003). This means that, while the modeling can be a useful tool to guide evacuationplanning, it is not of sufficient resolution to be useful for land-use planning.
This project was supported by the National Tsunami Hazards Mitigation Program (NTHMP)in cooperation with the city of Seattle and the Washington Emergency ManagementDivision. Information about NTHMP is available at http://www.pmel.noaa.gov/tsunami-hazard/. Discussions with Tom Pratt, Brian Sherrod, and Craig Weaver (all USGS, Seattle)were invaluable for calibrating the fault source model. Karl Wegmann and Steve Palmer,both Washington Division of Geology and Earth Resources, provided helpful reviews.
n
e
Table 1. Segment (west to east) parameters for magnitude 7.3 Seattle fault earthquake models. The
vertical deformation pattern is shown in Figure 1.
Segment Depth (km) Length (km) Width (km) Strike (°) Dip (°) Slip (m)
Atwater, B. F.; Moore, A. L., 1992, A tsunami about 1000 years ago in Puget Sound, Washington:
Science, v. 258, no. 5088, p. 1614-1617.
Blakely, R. J.; Wells, R. E.; Weaver, C. S., 1999, Puget Sound aeromagnetic maps and data: U.S.
Geological Survey Open-File Report 99-514, version 1.0. [Accessed Oct. 3, 2000, at
http://geopubs.wr.usgs.gov/open-file/of99-514/]
Blakely, R. J.; Wells, R. E.; Weaver, C. S.; Johnson, S. Y., 2002, Location, structure, and seismicity
of the Seattle fault zone, Washington—Evidence from aeromagnetic anomalies, geologic
mapping, and seismic-reflection data: Geological Society of America Bulletin, v. 114, no. 2,
p. 169-177.
Brocher, T. M.; Parsons, T. E.; Blakely, R. J.; Christensen, N. I.; Fisher, M. A.; Wells, R. E.; SHIPS
Working Group, 2001, Upper crustal structure in Puget Lowland, Washington—Results from the
1998 Seismic Hazards Investigations in Puget Sound: Journal of Geophysical Research, v. 106,
no. B7, p. 13,541-13,564.
Bourgeois, Joanne; Johnson, S. Y., 2001, Geologic evidence of earthquakes at the Snohomish delta,
Washington, in the past 1200 yr: Geological Society of America Bulletin, v. 113, no. 4, p. 482-
494.
Bucknam, R. C.; Hemphill-Haley, Eileen; Leopold, E. B., 1992, Abrupt uplift within the past 1700
years at southern Puget Sound, Washington: Science, v. 258, no. 5088, p. 1611-1614.
Bucknam, R. C.; Sherrod, B. L.; Elfendahl, G. W., 1999, A fault scarp of probable Holocene age in
the Seattle fault zone, Bainbridge Island, Washington [abstract]: Seismological Research Letters,
v. 70, no. 2, p. 233.
Calvert, A. J.; Fisher, M. A.; SHIPS Working Group, 2001, Imaging the Seattle fault zone with high-
resolution seismic tomography: Geophysical Research Letters, v. 28, no. 12, p. 2337-2340.
Dane!, Z. F.; Bonno, M.; Brau, J. E.; Gilham, W. D.; Hoffman, T. F.; Johansen, D.; Jones, M. H.;
Malfait, Bruce; Masten, J.; Teague, G. O., 1965, Geophysical investigation of the southern Puget
Sound area, Washington: Journal of Geophysical Research, v. 70, no. 22, p. 5573-5580.
Frankel, A. D.; Petersen, M. D.; Mueller, C. S.; Haller, K. M.; Wheeler, R. L.; Leyendecker, E. V.;
Wesson, R. L.; Harmsen, S. C.; Cramer, C. H.; Perkins, D. M.; Rukstales, K. S., 2002,
Documentation for the 2002 Update of the National Seismic Hazard Maps: U.S. Geological
Survey Open-File Report 02-420. [Accessed June 25, 2003, at http://pubs.usgs.gov/of/2002/ofr-
02-420/]
Gardner, J. V.; van den Ameele, E. J.; Dartnell, Peter, 2001, Multibeam mapping of the major deltas
of southern Puget Sound, Washington: U.S. Geological Survey Open-File Report 01-266, 1 v.
Gower, H. D., 1978, Tectonic map of the Puget Sound region, Washington, showing locations of
faults, principal folds, and large-scale Quaternary deformation: U.S. Geological Survey Open-File
Report 78-426, 22 p., 1 plate, scale 1:250,000.
Jacoby, G. C.; Williams, P. L.; Buckley, B. M., 1992, Tree ring correlation between prehistoric
landslides and abrupt tectonic events in Seattle, Washington: Science, v. 258, no. 5088, p. 1621-
1623.
Johnson, S. Y.; Dadisman, S. V.; Childs, J. R.; Stanley, W. D., 1999, Active tectonics of the Seattle
fault and central Puget Sound, Washington—Implications for earthquake hazards: Geological
Society of America Bulletin, v. 111, no. 7, p. 1042-1053, 1 plate.
Kimball, J. P., 1897, Physiographic geology of the Puget Sound basin [in 2 parts]: American
Geologist, v. 19, no. 4, p. 225-237 [part 1]; v. 19, no. 5, p. 304-322 [part 2].
Nelson, A. R.; Johnson, S. Y.; Wells, R. E.; Pezzopane, S. K.; Kelsey, H. M.; Sherrod, B. L.; Bradley,
L.-A.; Koehler, R. D., III; Bucknam, R. C.; Haugerud, R. A.; Laprade, W. T., 2002, Field and
laboratory data from an earthquake history study of the Toe Jam Hill fault, Bainbridge Island,
Washington: U.S. Geological Survey Open-File Report 02-60, 1 v., 2 plates.
Pratt, T. L.; Johnson, S. Y.; Potter, C. J.; Stephenson, W. J.; Finn, C. A., 1997, Seismic reflection
images beneath Puget Sound, western Washington State—The Puget Lowland thrust sheet
hypothesis: Journal of Geophysical Research, v. 102, no. B12, p. 27,469-27,489.
Rogers, W. P., 1970, A geological and geophysical study of the central Puget Sound lowland:
University of Washington Doctor of Philosophy thesis, 123 p., 9 plates.
Sherrod, B. L.; Bucknam, R. C.; Leopold, E. B., 2000, Holocene relative sea level changes along the
Seattle fault at Restoration Point, Washington: Quaternary Research, v. 54, no. 3, p. 384-393.
ten Brink, U. S.; Molzer, P. C.; Fisher, M. A.; Blakely, R. J.; Bucknam, R. C.; Parsons, T. E.;
Crosson, R. S.; Creager, K. C., 2002, Subsurface geometry and evolution of the Seattle fault zone
and the Seattle basin, Washington: Seismological Society of America Bulletin, v. 92, no. 5,
p. 1737-1753.
Titov, V. V.; Gonzalez, F. I., 1997, Implementation and testing of the Method of Splitting Tsunami
(MOST) model: NOAA Technical Memorandum ERL PMEL-112 (PB98-122773), 11 p.
Titov, V. V.; Gonzalez, F. I.; Mofjeld, H. O.; Venturato, A. J., (in press), NOAA TIME Seattle tsunami
mapping project—Procedures, data sources, and products: NOAA Technical Memorandum OAR
PMEL-124, 15 p.
Titov, V. V.; Synolakis, C. E., 1998, Numerical modeling of tidal wave runup: Journal of Waterway,
Port, Coastal and Ocean Engineering, v. 124, no. 4, p. 157-171.
Vancouver, George, 1798, repr. 1992, A voyage of discovery to the north Pacific Ocean, and round
the world; in which the coast of north-west American has been carefully examined and accurately
surveyed—Undertaken by His Majesty's command, principally with a view to ascertain the
existence of any navigable communication between the north Pacific and north Atlantic Oceans;
and performed in the years 1790, 1791, 1792, 1793, 1794, and 1795: G. G. and J. Robinson
[London], 3 v.
Van Wagoner, T. M.; Crosson, R. S.; Creager, K. C.; Medema, G. F.; Preston, L. A.; Symons, N. P.;
Brocher, T. M., 2002, Crustal structure and relocated earthquakes in the Puget Lowland,
Washington, from high-resolution seismic tomography: Journal of Geophysical Research, v. 107,
no. B12, 2381, DOI 10.1029/2001JB000710, p. ESE 22-1 - 22-23.
Walsh, T. J.; Caruthers, C. G.; Heinitz, A. C.; Myers, E. P., III; Baptista, A. M.; Erdakos, G. B.;
Kamphaus, R. A., 2000, Tsunami hazard map of the southern Washington coast—Modeled
tsunami inundation from a Cascadia subduction zone earthquake: Washington Division of
Geology and Earth Resources Geologic Map GM-49, 1 sheet, scale 1:100,000, with 12 p. text.
Walsh, T. J.; Myers, E. P., III; Baptista, A. M., 2002a, Tsunami inundation map of the Port Angeles,
Washington area: Washington Division of Geology and Earth Resources Open File Report 2002-
1, 1 sheet, scale 1:24,000.
Walsh, T. J.; Myers, E. P., III; Baptista, A. M., 2002b, Tsunami inundation map of the Port Townsend,
Washington area: Washington Division of Geology and Earth Resources Open File Report 2002-
2, 1 sheet, scale 1:24,000.
Walsh, T. J.; Myers, E. P., III; Baptista, A. M., 2003a, Tsunami inundation map of the Neah Bay,
Washington, area: Washington Division of Geology and Earth Resources Open File Report 2003-
2, 1 sheet, scale 1:24,000.
Walsh, T. J.; Myers, E. P., III; Baptista, A. M., 2003b, Tsunami inundation map of the Quileute,
Washington, area: Washington Division of Geology and Earth Resources Open File Report 2003-
1, 1 sheet, scale 1:24,000.
Depth of inundation: 0–.5 meters .5–2 meters 2–5 meters
NOAA TIME CenterPacific Marine Environmental LaboratorySeattle, Washington
www.dnr.wa.gov/geology/pdf/ofr03-14.pdf
Oceanography 101, Richard Strickland Lecture 7 © 2006 University of Washington
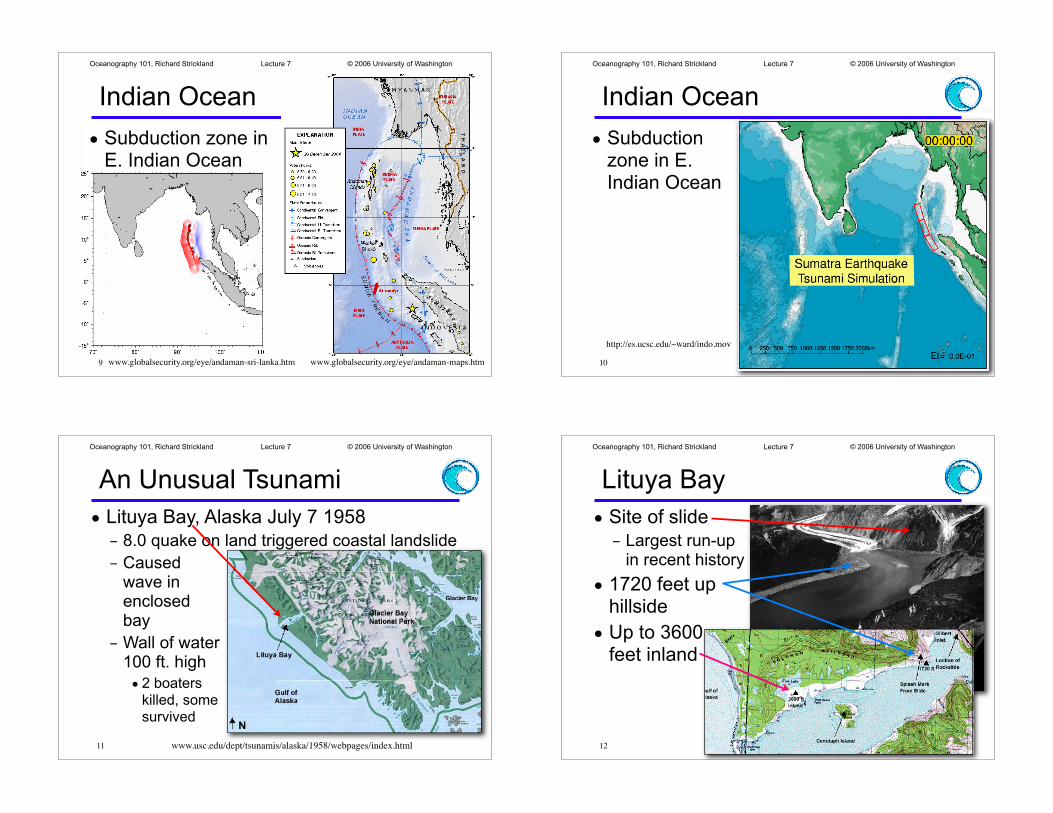
Indian Ocean Tsunami
• Source at NW tip of Indonesia
– Banda Aceh
– Magnitude 9.0
• Largest since 1964
– 231,452 deaths
•Highest toll inrecorded history
– Damage reachedE. African coast
– Waves detected inPacific & Atlantic
8 www.globalsecurity.org/eye/andaman-maps.htm
!"
!"
!"
!"
!"
!"
#$
epicentreIndonesia
Malaysia
India
Myanmar
Thailand
Sri Lanka
Date: 26/12/2004 Time: 00:58:50 UTCLocation: 3.30N 95.78EMagnitude: 8.9
1500 km
2500 km
2000 km
1000 km
500 km
Jakarta
Bangkok
Yangon
Colombo
New Delhi
Kuala Lumpur
Indonesia: South Asia Earthquake and TsunamiOCHA Situation Report No. 3Issued 26 December 2004GLIDE: TS-2004-000147-LKA
The names shown and the designations used on this map do not imply official endorsement or acceptance by the United Nations.
Produced by the ReliefWeb Map CentreOffice for the Coordination of Humanitarian Affairs
United Nations - 26 December 2004
"Some 11,460 people were killedand thousands more were missingafter a powerful earthquake...triggered giant tidal waves." (AFP)
0 1,000 2,000500Km
SITUATIONA massive earthquake struck the west coast of Indonesia's northern Sumatra island on 26 Dec 2005generating Tsunamis that killed thousands of peoplethroughout east and southeast Asia. AFP reports more than 11,000 deaths in the region: app. 4,200 inIndonesia, 7,000 in India and Sri Lanka, hundreds of deaths in Thailand, Maldives, Myanmar, and Malaysia. Death toll expected to rise as more information becomes available.
ACTIONUNDP administrator, UN Emergency ReliefCoordinator requesting all UN Country Teams in affected region to convene crisis meetings immediately. Indonesian Red Cross en route to Aceh.Sri Lanka declared state of disaster. IFRC haslaunched 6.6 million USD appeal for assistance for500,000 affected people for six months.
!" National Capitals
#% Major Coastal Cities
#& Major Cities in Region
Affected Countries
#$ epicentre
Oceanography 101, Richard Strickland Lecture 7 © 2006 University of Washington
• Subduction zone in E. Indian Ocean
9 www.globalsecurity.org/eye/andaman-sri-lanka.htm
Indian Ocean
www.globalsecurity.org/eye/andaman-maps.htm
Oceanography 101, Richard Strickland Lecture 7 © 2006 University of Washington
• Subduction zone in E. Indian Ocean
10
Indian Ocean
http://es.ucsc.edu/~ward/indo.mov
Oceanography 101, Richard Strickland Lecture 7 © 2006 University of Washington
An Unusual Tsunami
• Lituya Bay, Alaska July 7 1958
– 8.0 quake on land triggered coastal landslide
– Causedwave inenclosedbay
– Wall of water100 ft. high
• 2 boaterskilled, somesurvived
11 www.usc.edu/dept/tsunamis/alaska/1958/webpages/index.html
Oceanography 101, Richard Strickland Lecture 7 © 2006 University of Washington
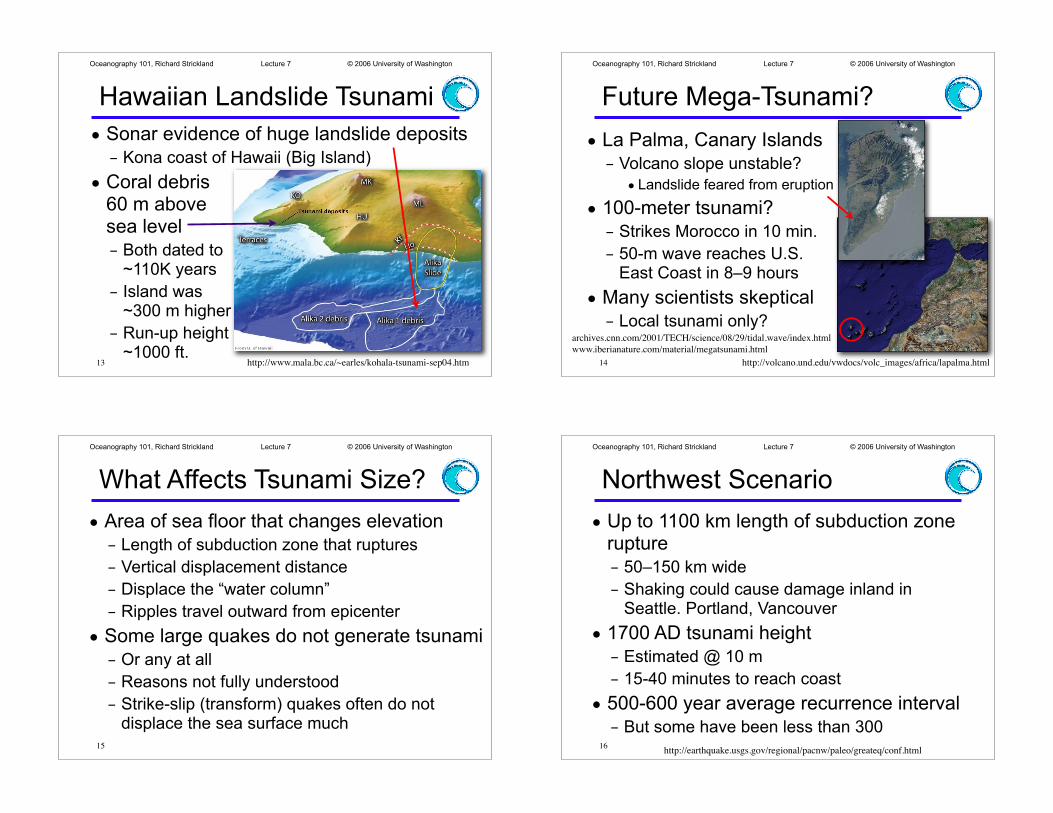
Lituya Bay
• Site of slide
– Largest run-upin recent history
• 1720 feet uphillside
• Up to 3600feet inland
12
Oceanography 101, Richard Strickland Lecture 7 © 2006 University of Washington
Hawaiian Landslide Tsunami
• Sonar evidence of huge landslide deposits
– Kona coast of Hawaii (Big Island)
• Coral debris60 m abovesea level
– Both dated to~110K years
– Island was~300 m higher
– Run-up height~1000 ft.
13 http://www.mala.bc.ca/~earles/kohala-tsunami-sep04.htm
Oceanography 101, Richard Strickland Lecture 7 © 2006 University of Washington
• La Palma, Canary Islands
– Volcano slope unstable?
• Landslide feared from eruption
• 100-meter tsunami?
– Strikes Morocco in 10 min.
– 50-m wave reaches U.S.East Coast in 8–9 hours
• Many scientists skeptical
– Local tsunami only?
Future Mega-Tsunami?
14 http://volcano.und.edu/vwdocs/volc_images/africa/lapalma.html
archives.cnn.com/2001/TECH/science/08/29/tidal.wave/index.html
www.iberianature.com/material/megatsunami.html
Oceanography 101, Richard Strickland Lecture 7 © 2006 University of Washington
What Affects Tsunami Size?
• Area of sea floor that changes elevation
– Length of subduction zone that ruptures
– Vertical displacement distance
– Displace the “water column”
– Ripples travel outward from epicenter
• Some large quakes do not generate tsunami
– Or any at all
– Reasons not fully understood
– Strike-slip (transform) quakes often do not displace the sea surface much
15
Oceanography 101, Richard Strickland Lecture 7 © 2006 University of Washington
Northwest Scenario
• Up to 1100 km length of subduction zone rupture
– 50–150 km wide
– Shaking could cause damage inland in Seattle. Portland, Vancouver
• 1700 AD tsunami height
– Estimated @ 10 m
– 15-40 minutes to reach coast
• 500-600 year average recurrence interval
– But some have been less than 30016
http://earthquake.usgs.gov/regional/pacnw/paleo/greateq/conf.html
Oceanography 101, Richard Strickland Lecture 7 © 2006 University of Washington
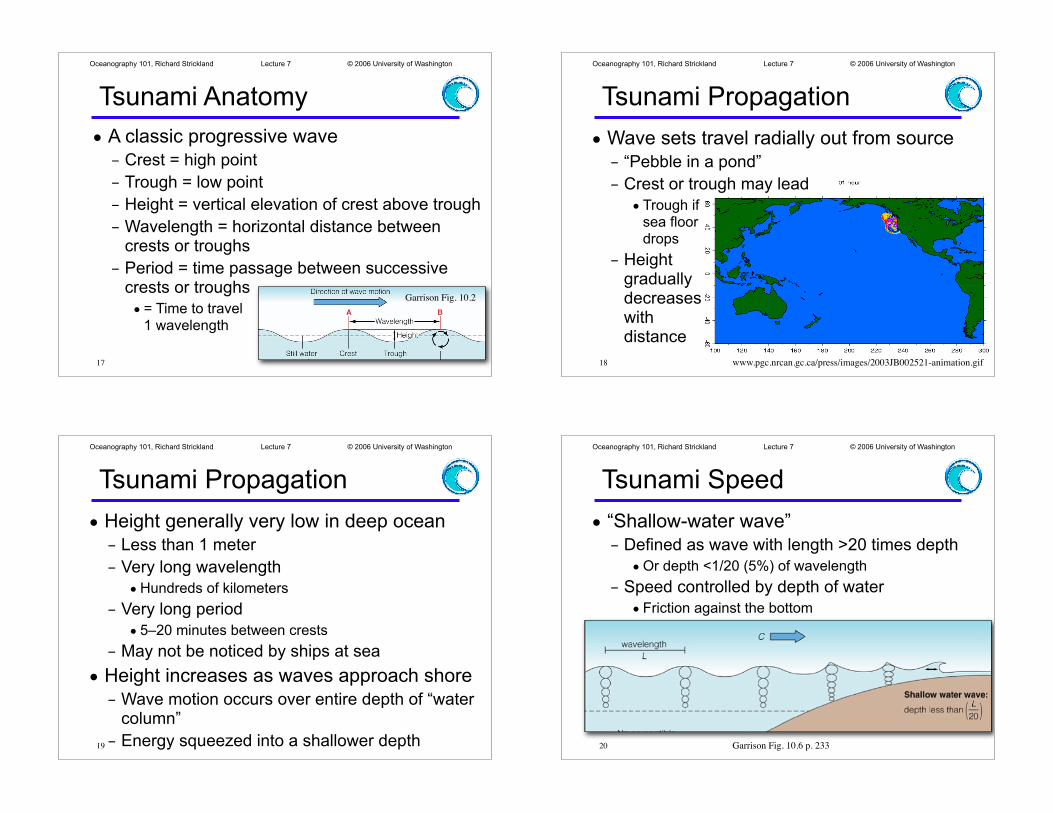
Tsunami Anatomy
• A classic progressive wave
– Crest = high point
– Trough = low point
– Height = vertical elevation of crest above trough
– Wavelength = horizontal distance between crests or troughs
– Period = time passage between successive crests or troughs
• = Time to travel1 wavelength
17
Garrison Fig. 10.2
Oceanography 101, Richard Strickland Lecture 7 © 2006 University of Washington
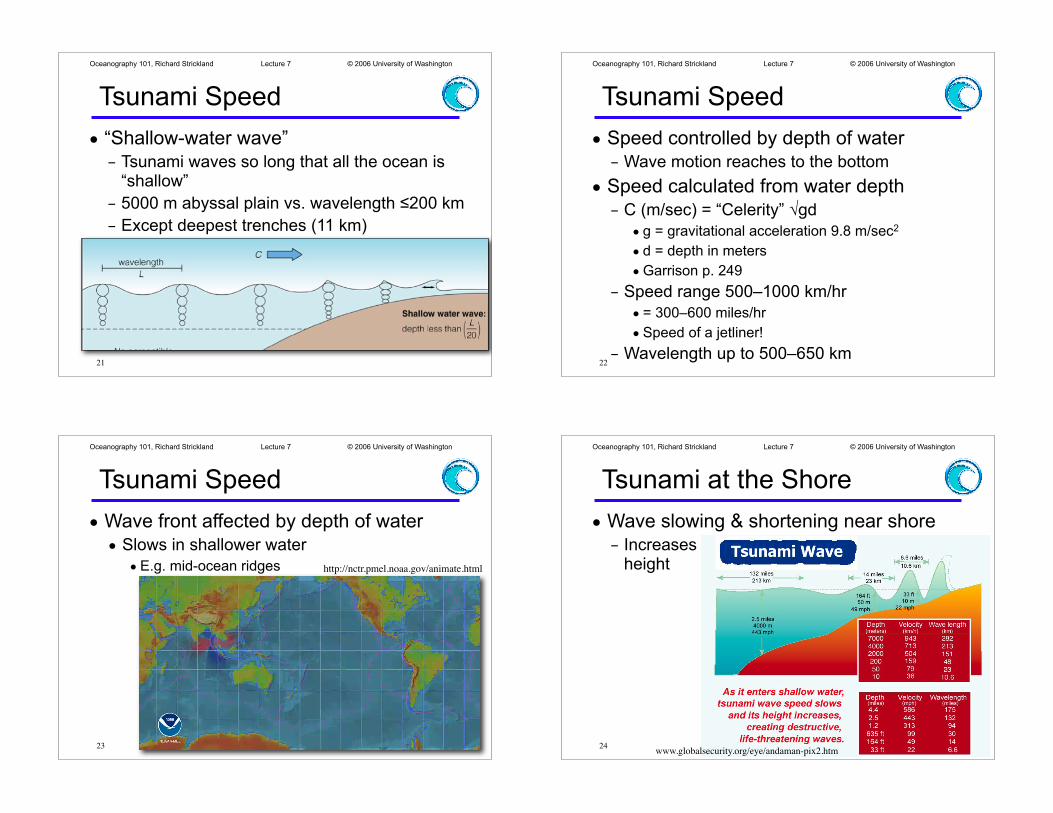
• Wave sets travel radially out from source
– “Pebble in a pond”
– Crest or trough may lead
• Trough ifsea floordrops
– Heightgraduallydecreaseswithdistance
Tsunami Propagation
18 www.pgc.nrcan.gc.ca/press/images/2003JB002521-animation.gif
Oceanography 101, Richard Strickland Lecture 7 © 2006 University of Washington
Tsunami Propagation
• Height generally very low in deep ocean
– Less than 1 meter
– Very long wavelength
•Hundreds of kilometers
– Very long period
• 5–20 minutes between crests
– May not be noticed by ships at sea
• Height increases as waves approach shore
– Wave motion occurs over entire depth of “water column”
– Energy squeezed into a shallower depth19
Oceanography 101, Richard Strickland Lecture 7 © 2006 University of Washington
• “Shallow-water wave”
– Defined as wave with length >20 times depth
•Or depth <1/20 (5%) of wavelength
– Speed controlled by depth of water
• Friction against the bottom
Tsunami Speed
20 Garrison Fig. 10.6 p. 233
Oceanography 101, Richard Strickland Lecture 7 © 2006 University of Washington
• “Shallow-water wave”
– Tsunami waves so long that all the ocean is “shallow”
– 5000 m abyssal plain vs. wavelength "200 km
– Except deepest trenches (11 km)
Tsunami Speed
21
Oceanography 101, Richard Strickland Lecture 7 © 2006 University of Washington
Tsunami Speed
• Speed controlled by depth of water
– Wave motion reaches to the bottom
• Speed calculated from water depth
– C (m/sec) = “Celerity” !gd
• g = gravitational acceleration 9.8 m/sec2
• d = depth in meters
•Garrison p. 249
– Speed range 500–1000 km/hr
• = 300–600 miles/hr
•Speed of a jetliner!
– Wavelength up to 500–650 km22
Oceanography 101, Richard Strickland Lecture 7 © 2006 University of Washington
• Wave front affected by depth of water
• Slows in shallower water
•E.g. mid-ocean ridges
Tsunami Speed
23
http://nctr.pmel.noaa.gov/animate.html
Oceanography 101, Richard Strickland Lecture 7 © 2006 University of Washington
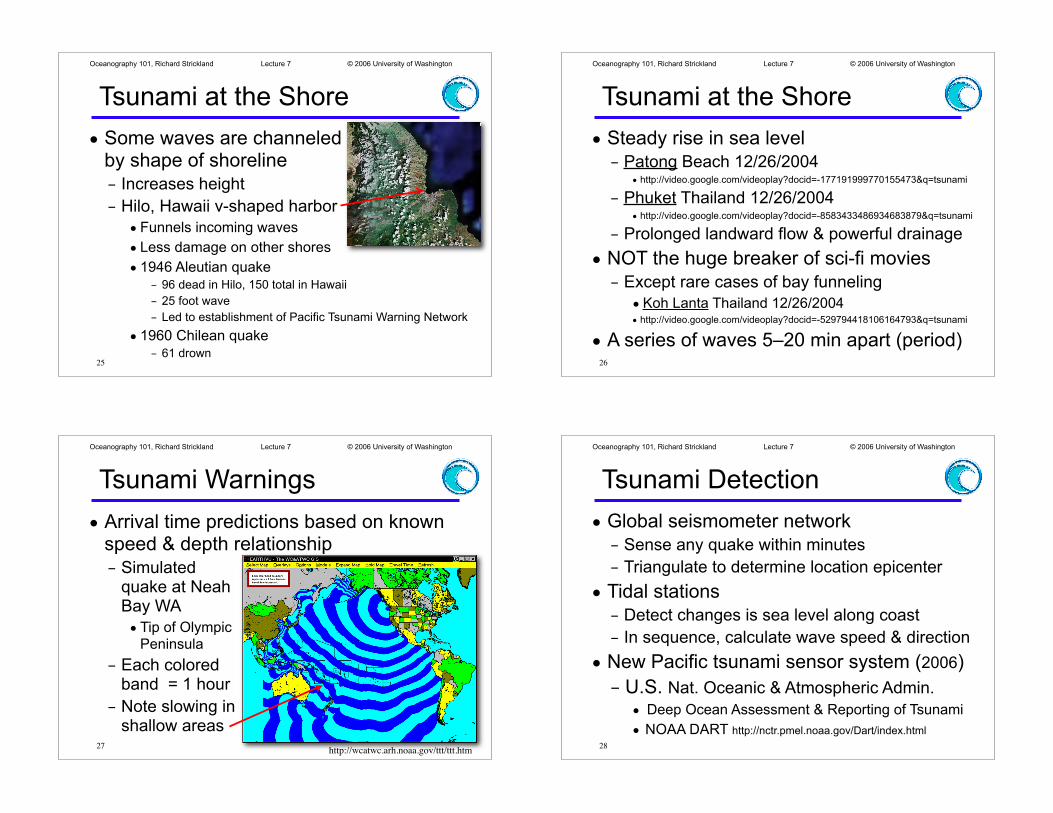
Tsunami at the Shore
• Wave slowing & shortening near shore
– Increasesheight
24www.globalsecurity.org/eye/andaman-pix2.htm
Oceanography 101, Richard Strickland Lecture 7 © 2006 University of Washington
Tsunami at the Shore
• Some waves are channeledby shape of shoreline
– Increases height
– Hilo, Hawaii v-shaped harbor
• Funnels incoming waves
• Less damage on other shores
• 1946 Aleutian quake
– 96 dead in Hilo, 150 total in Hawaii
– 25 foot wave
– Led to establishment of Pacific Tsunami Warning Network
• 1960 Chilean quake
– 61 drown25
Oceanography 101, Richard Strickland Lecture 7 © 2006 University of Washington
Tsunami at the Shore
• Steady rise in sea level
– Patong Beach 12/26/2004• http://video.google.com/videoplay?docid=-177191999770155473&q=tsunami
– Phuket Thailand 12/26/2004• http://video.google.com/videoplay?docid=-8583433486934683879&q=tsunami
– Prolonged landward flow & powerful drainage
• NOT the huge breaker of sci-fi movies
– Except rare cases of bay funneling
•Koh Lanta Thailand 12/26/2004• http://video.google.com/videoplay?docid=-529794418106164793&q=tsunami
• A series of waves 5–20 min apart (period)26
Oceanography 101, Richard Strickland Lecture 7 © 2006 University of Washington
Tsunami Warnings
• Arrival time predictions based on known speed & depth relationship
– Simulatedquake at NeahBay WA
• Tip of OlympicPeninsula
– Each coloredband = 1 hour
– Note slowing inshallow areas
27http://wcatwc.arh.noaa.gov/ttt/ttt.htm
Oceanography 101, Richard Strickland Lecture 7 © 2006 University of Washington
Tsunami Detection
• Global seismometer network
– Sense any quake within minutes
– Triangulate to determine location epicenter
• Tidal stations
– Detect changes is sea level along coast
– In sequence, calculate wave speed & direction
• New Pacific tsunami sensor system (2006)
– U.S. Nat. Oceanic & Atmospheric Admin.
• Deep Ocean Assessment & Reporting of Tsunami
• NOAA DART http://nctr.pmel.noaa.gov/Dart/index.html
28
Oceanography 101, Richard Strickland Lecture 7 © 2006 University of Washington
“Tsunameter”
• DART system
– Surface buoy detects vertical motion
•Computer filters out shorter waves
– Bottom instrument detects pressure waves
•Relays data to surface
•Buoy relays to land stations via satellite
•Animation http://
nctr.pmel.noaa.gov/Mov/
DART_04.swf29http://nctr.pmel.noaa.gov/Dart/dart_ms1.html
Oceanography 101, Richard Strickland Lecture 7 © 2006 University of Washington
Tsunami Detection
• “Nerve centers” in Hawaii & Alaska
– Set up starting 1948
•After 1946 Aleutian/Hawaiian disaster
– Collect data from all 3 sources
•Seismic, tide, now tsunameter
– Predict arrival time & send warning
– Pacific Tsunami Warning Center (Hawaii)• www.prh.noaa.gov/pr/ptwc/
– West Coast & Alaska Tsunami Warning Center• http://wcatwc.arh.noaa.gov/
30
Oceanography 101, Richard Strickland Lecture 7 © 2006 University of Washington
Pacific Tsunami Warning
31
www.globalsecurity.org/eye/andaman-pix2.htm
Oceanography 101, Richard Strickland Lecture 7 © 2006 University of Washington
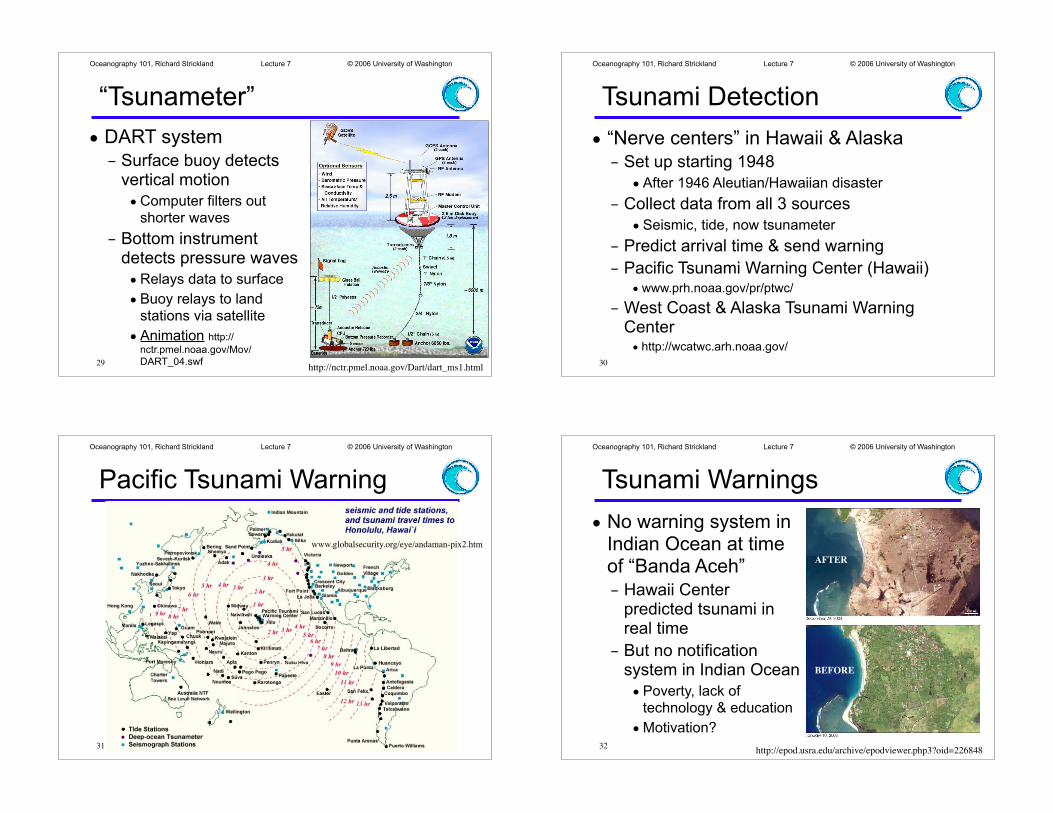
Tsunami Warnings
• No warning system in Indian Ocean at time of “Banda Aceh”
– Hawaii Center predicted tsunami in real time
– But no notification system in Indian Ocean
•Poverty, lack of technology & education
•Motivation?32
http://epod.usra.edu/archive/epodviewer.php3?oid=226848
BEFORE
AFTER