Embed Size (px)
Citation preview
TSUBAKI CORPORATE REPORT 2017
Celebrating Our Centennial Aiming Beyond Manufacturing
The Tsubaki Group’s New Corporate Philosophy
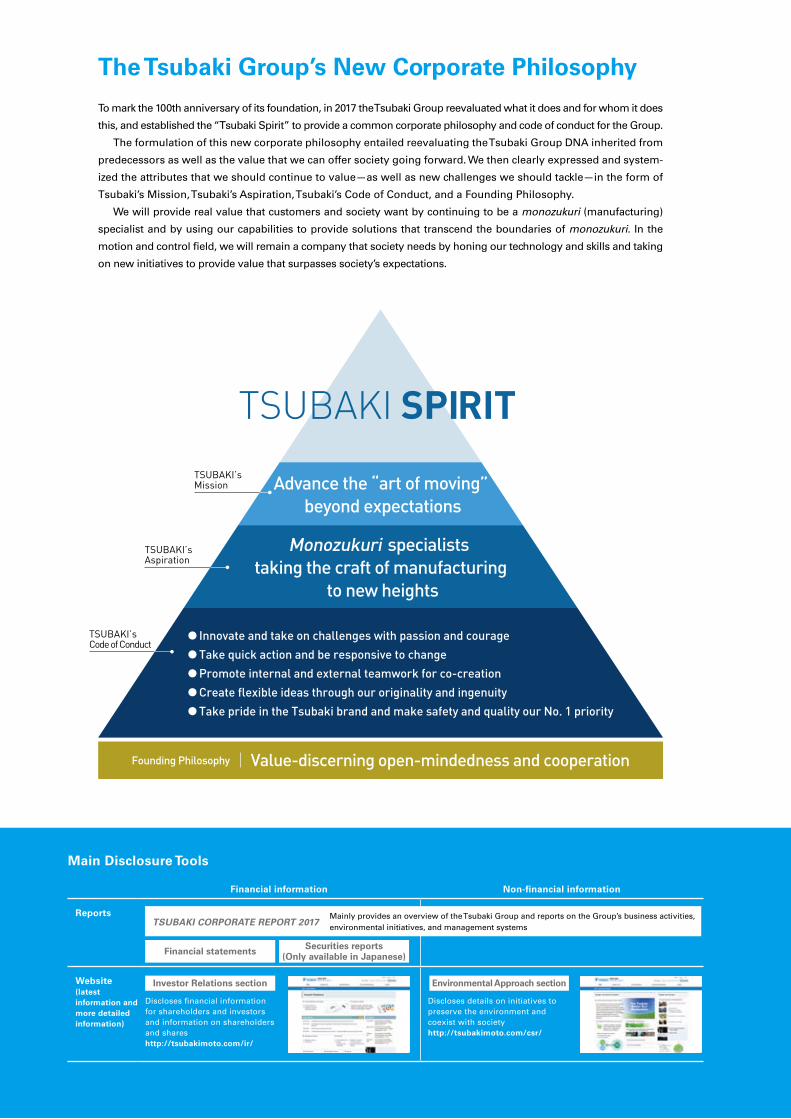
Financial information Non-financial information
Reports
Website(latest information and more detailed information)
Discloses financial information for shareholders and investors and information on shareholders and shareshttp://tsubakimoto.com/ir/
Discloses details on initiatives to preserve the environment and coexist with societyhttp://tsubakimoto.com/csr/
Main Disclosure Tools
TSUBAKI CORPORATE REPORT 2017 Mainly provides an overview of the Tsubaki Group and reports on the Group’s business activities, environmental initiatives, and management systems
Financial statements
Investor Relations section Environmental Approach section
Securities reports (Only available in Japanese)
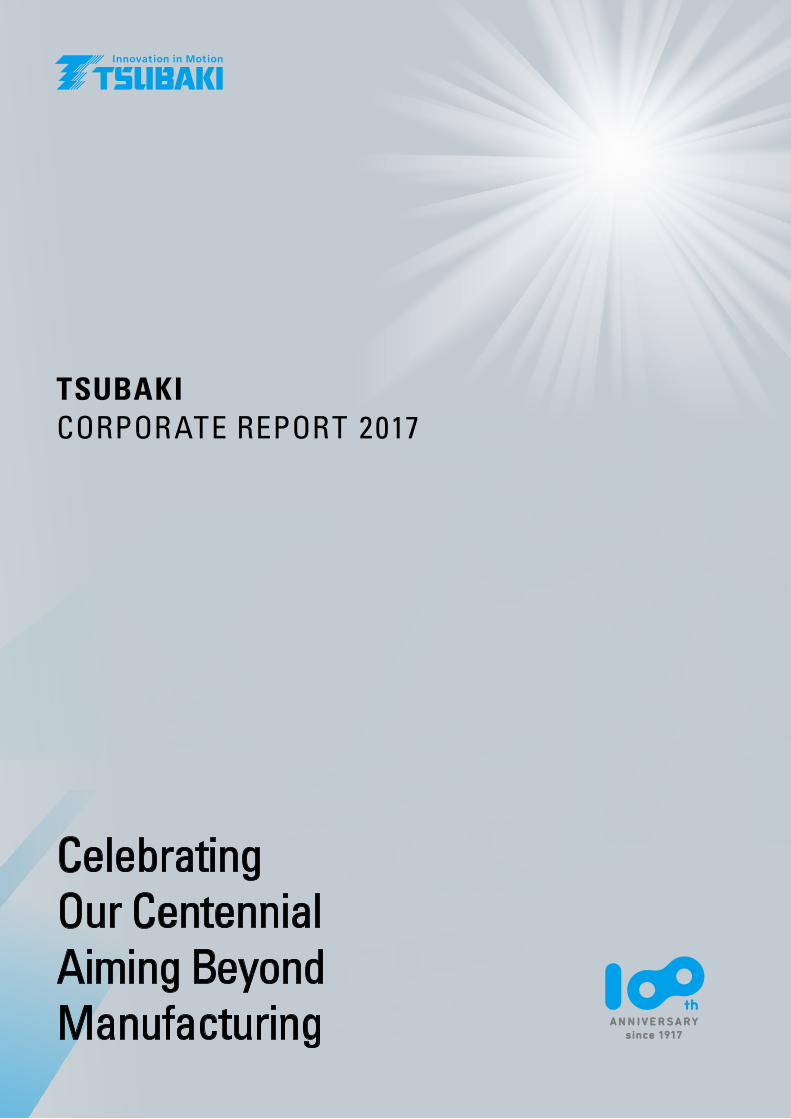
To mark the 100th anniversary of its foundation, in 2017 the Tsubaki Group reevaluated what it does and for whom it does
this, and established the “Tsubaki Spirit” to provide a common corporate philosophy and code of conduct for the Group.
The formulation of this new corporate philosophy entailed reevaluating the Tsubaki Group DNA inherited from
predecessors as well as the value that we can offer society going forward. We then clearly expressed and system-
ized the attributes that we should continue to value—as well as new challenges we should tackle—in the form of
Tsubaki’s Mission, Tsubaki’s Aspiration, Tsubaki’s Code of Conduct, and a Founding Philosophy.
We will provide real value that customers and society want by continuing to be a monozukuri (manufacturing)
specialist and by using our capabilities to provide solutions that transcend the boundaries of monozukuri. In the
motion and control field, we will remain a company that society needs by honing our technology and skills and taking
on new initiatives to provide value that surpasses society’s expectations.
Forward-Looking StatementsIn certain cases, the information in this report is based on estimates and forecasts made by the Tsubaki Group. The accuracy of data from external sources, including statistics, is not guaranteed. As a general rule, figures less than one unit have been rounded down to the nearest whole number. Also, unless otherwise specifically stated all numerical values relating to Company performance and its financial posi-tion have been calculated on a consolidated basis.
Data Regarding Environmental and Social InitiativesThis report was prepared with reference to the Ministry of the Environment of Japan’s “Environmental Reporting Guidelines 2012,” the Ministry of the Environment of Japan’s “Environmental Accounting Guidelines 2005,” and the Global Reporting Initiative (GRI)’s “Sustainability Reporting Guidelines, Third Edition (G4).”
Reporting Period: April 2016 to March 2017
(includes some activities after the reporting period)
Scope of Data CollectionTsubakimoto Chain Kyotanabe Plant, Nagaokakyo Plant, Okayama Plant, and Saitama Plant, and major Tsubakimoto Chain subsidiaries and affiliates
Tsubakimoto Custom Chain, Tsubakimoto Sprocket, Tsubakimoto Bulk Systems,
Tsubakimoto Mayfran, Tsubakimoto Iron Casting, and Tsubaki Yamakyu Chain
Notes on the Production of this ReportThe Company realizes that corporate value is based on a comprehensive evaluation of the operating results of a company and a variety of other factors, including its social responsibility. Based on this understanding, the Company compiled its various information transmission tools for stakeholders, including its annual report and environmental and CSR reports, into a single corporate report. This report contains explanations of Tsubaki’s corporate philosophy, strategies for strengthening founda-tions, performance, and policies for conducting environmental and social contribution activities as well as the results of these initiatives. We believe this form of corporate report will assist stakeholders in developing a more comprehensive understanding of the Company’s potential for ongoing growth.
Contents
2 To Our Stakeholders
4 Tsubaki at 100
The Tsubaki Group At a Glance
10 1. Business Overview
12 2. Product Lineup
14 3. Tsubaki Products in Society
18 4. Tsubaki’s Global Network
20 5. Activity Results (6-Year Financial and
Non-Financial Highlights)
The Tsubaki Group’s Growth Mechanism
22 1. Basic Policies for Sustainable Growth
24 2. Allocation of Capital and Benefits Over the Past Decade
26 3. Tsubaki’s Technologies (Tech-nology Capital) and Measures for Bolstering this Capital
28 4. Cultivation and Strengthening of Tsubaki’s Human Resources
30 5. Tsubaki’s Financial Capital and Measures for Bolstering It
31 6. Acceleration of CSR Activities
37 7. Corporate Governance System
The Tsubaki Group’s Challenges and Strategies
42 Striving to Become a Global Leader
44 An Interview with the COO
48 Review of Operations
56 Financial Data and Supplementary Information
56 Consolidated Financial and Non-Financial Summary
58 Report and Analysis of Financial Condition and Results of Operations for the Fiscal Year Ended March 31, 2017
62 Principal Tsubaki Group Companies
63 Corporate Data and Stock Information
10 22 42
1TSUBAKI CORPORATE REPORT 2017
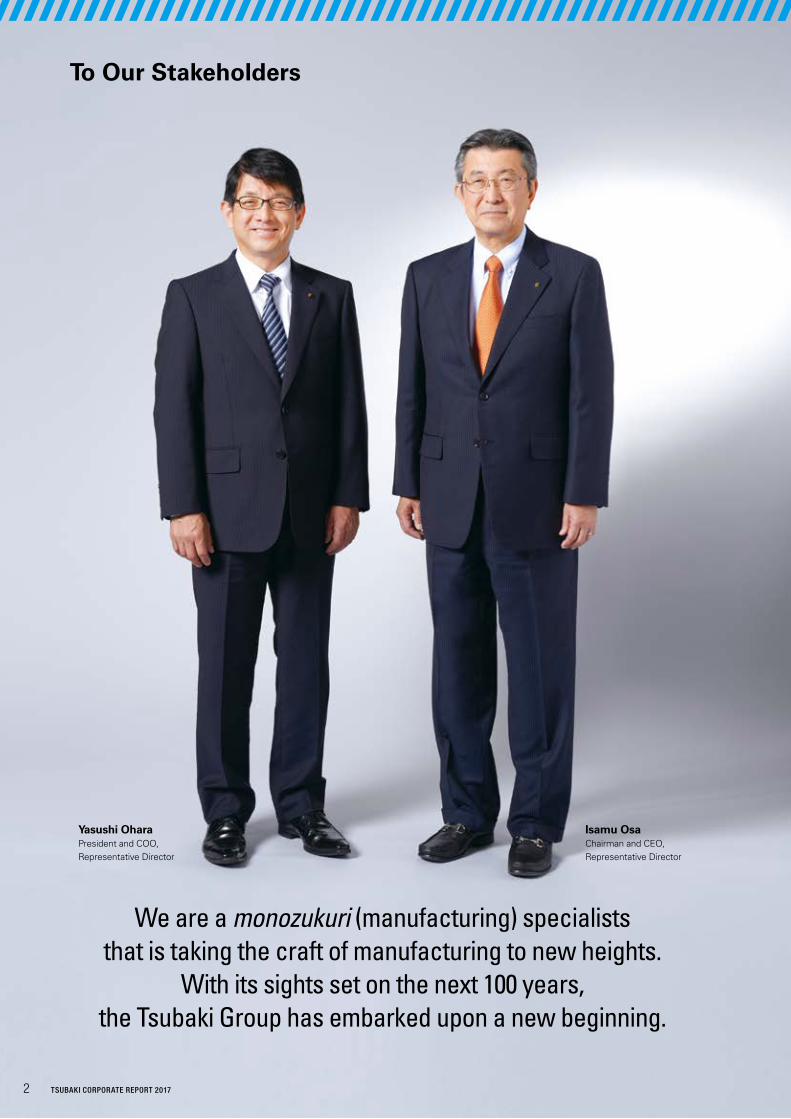
Isamu OsaChairman and CEO, Representative Director
Yasushi OharaPresident and COO, Representative Director
To Our Stakeholders
We are a monozukuri (manufacturing) specialists that is taking the craft of manufacturing to new heights.
With its sights set on the next 100 years, the Tsubaki Group has embarked upon a new beginning.
2 TSUBAKI CORPORATE REPORT 2017
Celebrating Our CentennialIn 2017, the Tsubaki Group celebrated the 100th anniversary of its foundation.
We would like express our sincere gratitude to our stakeholders, whose support has enabled us to reach
this milestone.
In 1917, the Group was founded as a bicycle chain manufacturer. Anticipating the growth of the machine
industry, we subsequently switched to the manufacture of industrial-use chains. Since then, by evolving chain
technology, we have expanded our operations to encompass materials handling systems, automotive parts,
and power transmission units and components. Consequently, we have grown into a comprehensive manu-
facturer in the fields of motion and control as well as conveyance and storage.
Moreover, we have been proactively developing operations overseas. As a result, we have taken large
strides toward becoming a global corporate group, with our percentage of overseas sales surpassing 50% in
the fiscal year ended March 31, 2014.
Realizing Our Target Corporate ProfileIn the fiscal year ended March 31, 2015, the Group established Long-Term Vision 2020, which sets out a target
corporate profile for the fiscal year ending March 31, 2021. As the second action plan aimed at realizing this
vision, we launched Mid-Term Management Plan 2020 (from the fiscal year ending March 31, 2018, through the
fiscal year ending March 31, 2021) in April 2017.
Following on from the first action plan, Mid-Term Management Plan 2016, the new plan calls on the Group to
transition to a market-oriented corporate culture and to utilize the collective strengths of the Group. In accor-
dance with these basic policies, we will step up the pace of new product development and marketing. Further,
we will mobilize our organization and personnel under the “One Tsubaki” slogan. These efforts will heighten our
ability to execute strategies and enable us to achieve the numerical targets of Mid-Term Management Plan 2020,
which are consolidated net sales of ¥300.0 billion, an operating income margin of 10%, and a percentage of
overseas sales of 70%.
In conjunction with such efforts, we will strengthen a multifaceted range of initiatives focused on the environ-
ment, society, and governance (ESG) to enhance our trustworthiness in the eyes of stakeholders and society.
Remaining a Company that Society NeedsFor the Tsubaki Group, the centennial also marks the beginning of a new phase focused on the coming century.
The Group has used this juncture to reevaluate what it does and for whom it does this and established the
“Tsubaki Spirit” as a new corporate philosophy.
Reflecting this corporate philosophy, over the next 100 years we will remain a company that society needs by
continuing our century-old evolution as a monozukuri specialists while incorporating outside expertise and tech-
nology to create and provide unprecedented value.
As we move forward, we would like to ask our stakeholders for their continued support and understanding.
Isamu OsaChairman and CEO,
Representative Director
Yasushi OharaPresident and COO,
Representative Director
3TSUBAKI CORPORATE REPORT 2017
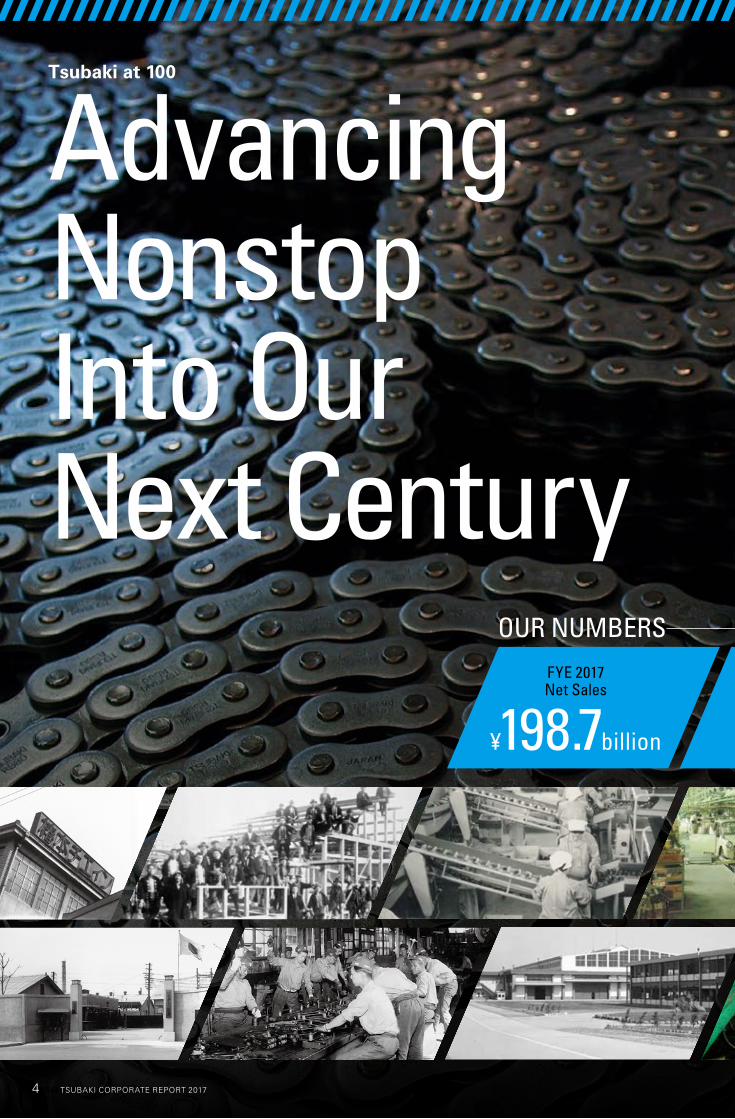
FYE 2017Net Sales
¥198.7 billion
FYE 2017ROE
9.9%
Advancing NonstopInto Our Next Century
OUR NUMBERS
Tsubaki at 100
4 TSUBAKI CORPORATE REPORT 2017TSUBAKI CORPORATE REPORT 20174
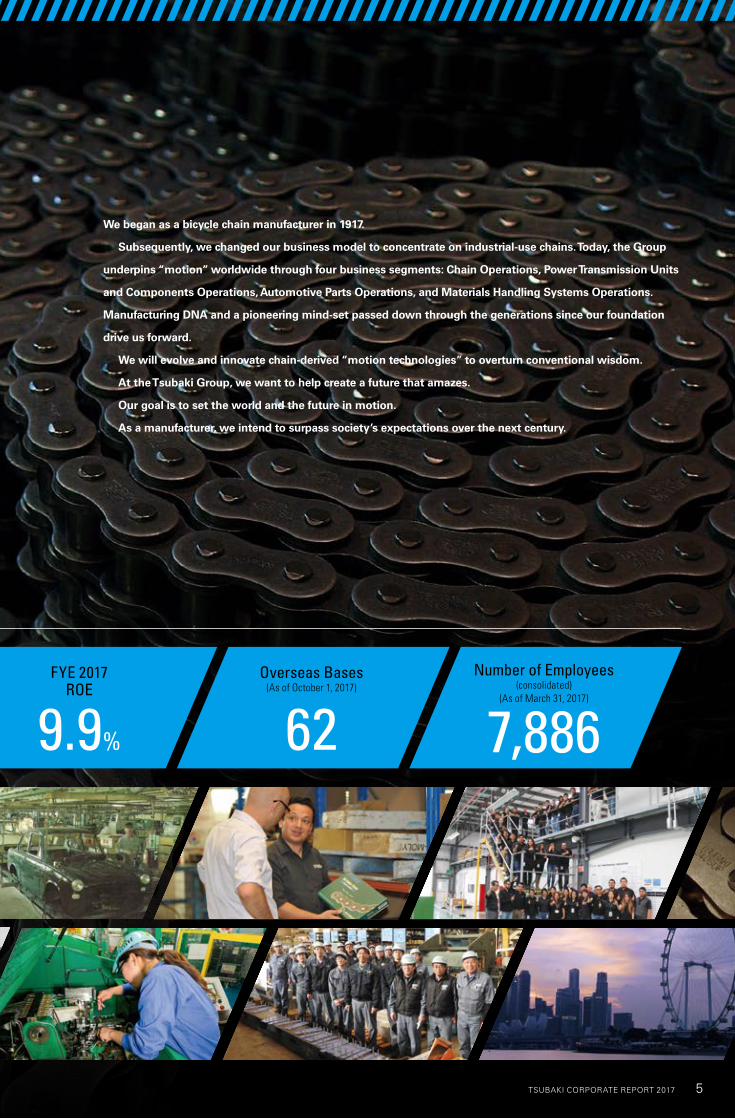
Overseas Bases(As of October 1, 2017)
62FYE 2017
ROE
9.9%
Number of Employees (consolidated)
(As of March 31, 2017)
7,886
Advancing NonstopInto Our Next Century
OUR NUMBERS
We began as a bicycle chain manufacturer in 1917.
Subsequently, we changed our business model to concentrate on industrial-use chains. Today, the Group
underpins “motion” worldwide through four business segments: Chain Operations, Power Transmission Units
and Components Operations, Automotive Parts Operations, and Materials Handling Systems Operations.
Manufacturing DNA and a pioneering mind-set passed down through the generations since our foundation
drive us forward.
We will evolve and innovate chain-derived “motion technologies” to overturn conventional wisdom.
At the Tsubaki Group, we want to help create a future that amazes.
Our goal is to set the world and the future in motion.
As a manufacturer, we intend to surpass society’s expectations over the next century.
5TSUBAKI CORPORATE REPORT 2017TSUBAKI CORPORATE REPORT 2017 5
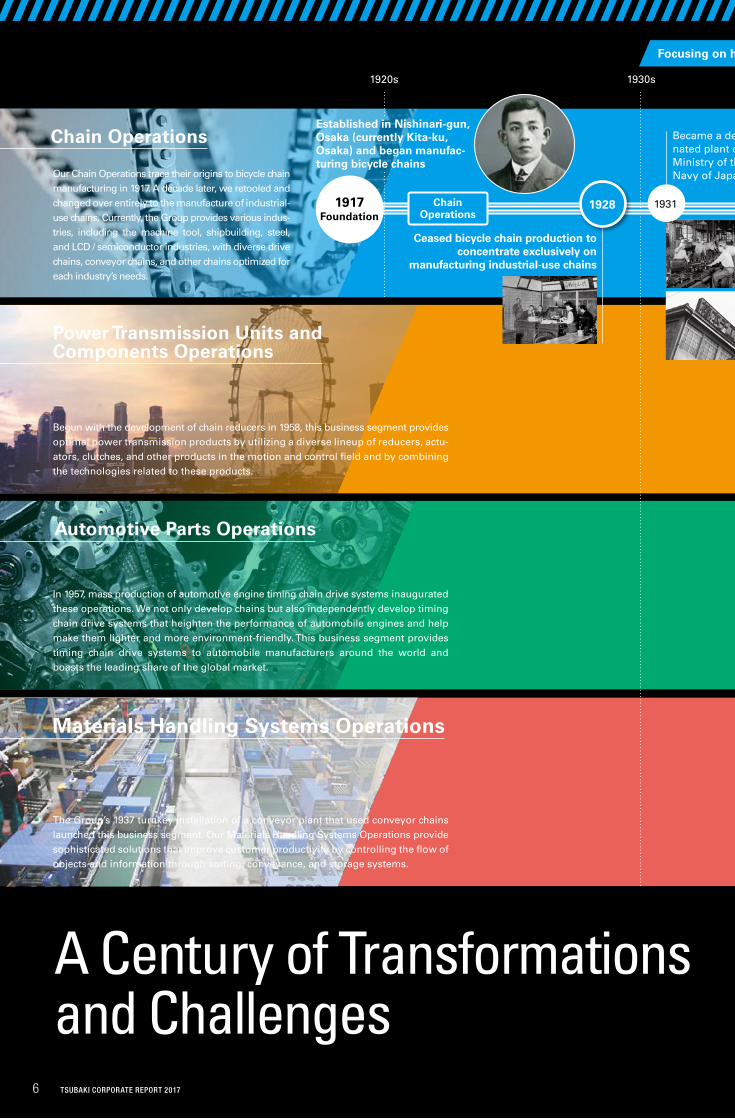
A Century of Transformations and Challenges
1917Foundation
Established in Nishinari-gun, Osaka (currently Kita-ku, Osaka) and began manufac-turing bicycle chains
1920s 1930s
Ceased bicycle chain production to concentrate exclusively on
manufacturing industrial-use chains
Became a desig-nated plant of Ministry of the Navy of Japan
Focusing on high-value-added industrial-use chains
Chain Operations
19311928
Our Chain Operations trace their origins to bicycle chain manufacturing in 1917. A decade later, we retooled and changed over entirely to the manufacture of industrial-use chains. Currently, the Group provides various indus-tries, including the machine tool, shipbuilding, steel, and LCD / semiconductor industries, with diverse drive chains, conveyor chains, and other chains optimized for each industry’s needs.
In 1957, mass production of automotive engine timing chain drive systems inaugurated these operations. We not only develop chains but also independently develop timing chain drive systems that heighten the performance of automobile engines and help make them lighter and more environment-friendly. This business segment provides timing chain drive systems to automobile manufacturers around the world and boasts the leading share of the global market.
Begun with the development of chain reducers in 1958, this business segment provides optimal power transmission products by utilizing a diverse lineup of reducers, actu-ators, clutches, and other products in the motion and control field and by combining the technologies related to these products.
The Group’s 1937 turnkey installation of a conveyor plant that used conveyor chains launched this business segment. Our Materials Handling Systems Operations provide sophisticated solutions that improve customer productivity by controlling the flow of objects and information through sorting, conveyance, and storage systems.
Chain Operations
Materials Handling Systems Operations
Power Transmission Units and Components Operations
Automotive Parts Operations
6 TSUBAKI CORPORATE REPORT 2017TSUBAKI CORPORATE REPORT 20176
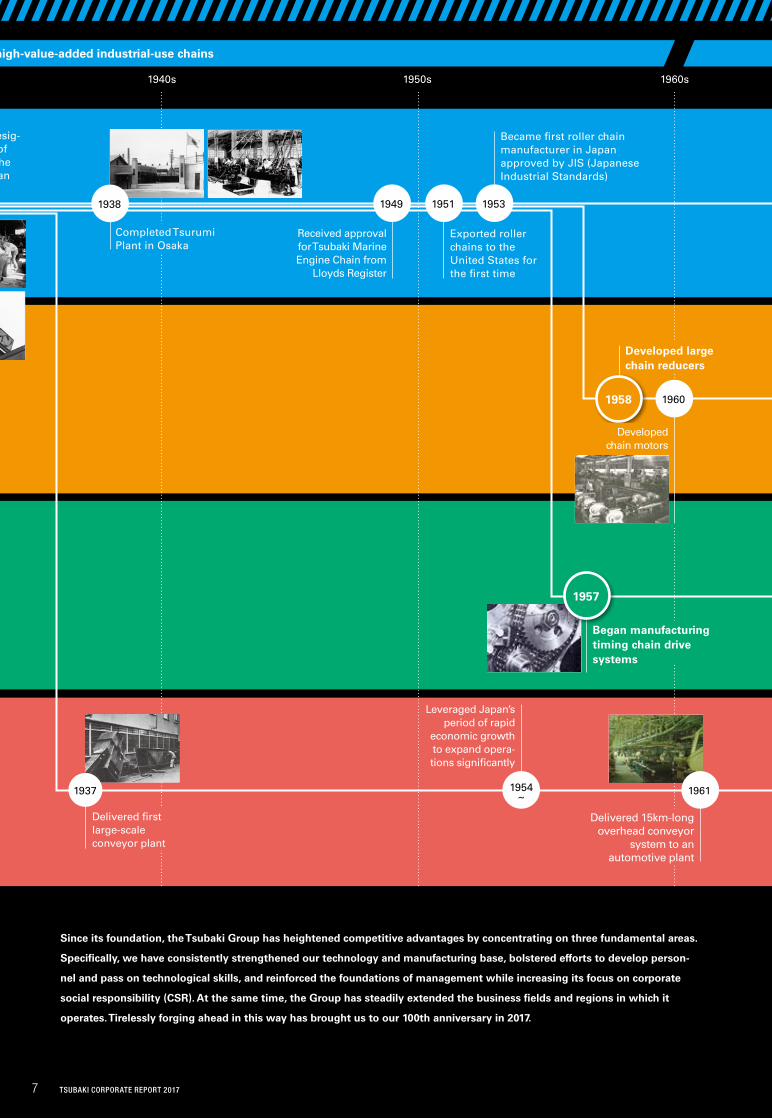
Since its foundation, the Tsubaki Group has heightened competitive advantages by concentrating on three fundamental areas.
Specifically, we have consistently strengthened our technology and manufacturing base, bolstered efforts to develop person-
nel and pass on technological skills, and reinforced the foundations of management while increasing its focus on corporate
social responsibility (CSR). At the same time, the Group has steadily extended the business fields and regions in which it
operates. Tirelessly forging ahead in this way has brought us to our 100th anniversary in 2017.
A Century of Transformations and Challenges
1940s 1950s 1960s
Received approval for Tsubaki Marine Engine Chain from
Lloyds Register
Exported roller chains to the United States for the first time
Became first roller chain manufacturer in Japan approved by JIS (Japanese Industrial Standards)
Developed large chain reducers
Began manufacturing timing chain drive systems
Delivered first large-scale conveyor plant
Leveraged Japan’s period of rapid
economic growth to expand opera-tions significantly
Delivered 15km-long overhead conveyor
system to an automotive plant
Completed Tsurumi Plant in Osaka
Became a desig-nated plant of Ministry of the Navy of Japan
Focusing on high-value-added industrial-use chains
1938
1937 19611954~
1949 1951 1953
1957
1958
Developed chain motors
1960
7 TSUBAKI CORPORATE REPORT 2017TSUBAKI CORPORATE REPORT 20177
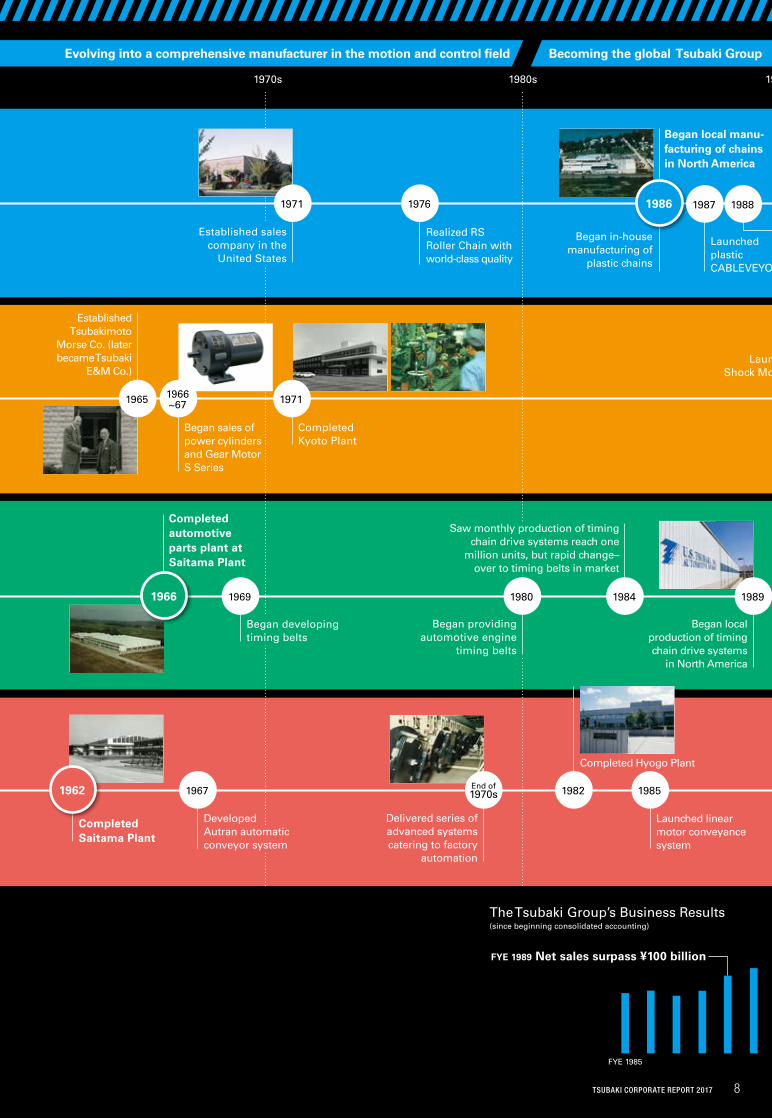
Developed Autran automatic conveyor system
1970s 1980s 1990s
Delivered series of advanced systems catering to factory
automation
Launched linear motor conveyance system
Completed Hyogo Plant
Completed Saitama Plant
Completed automotive parts plant at Saitama Plant
Began providing automotive engine
timing belts
Began developing timing belts
Saw monthly production of timing chain drive systems reach one
million units, but rapid change–over to timing belts in market
Began local production of timing chain drive systems
in North America
Established Tsubakimoto
Morse Co. (later became Tsubaki
E&M Co.)
Began sales of power cylinders and Gear Motor S Series
Completed Kyoto Plant
Launched Shock Monitor
Established sales company in the
United States
Realized RS Roller Chain with world-class quality
Launched plastic CABLEVEYOR®
Began in-house manufacturing of
plastic chains
Began local manu-facturing of chains in North America
Evolving into a comprehensive manufacturer in the motion and control field Becoming the global Tsubaki Group
1967 19851982
1965
1969 1980 19891984
End of 1970s
19711966~67
1971 1976
1962
1966
1986
FYE 1989 Net sales surpass ¥100 billion
The Tsubaki Group’s Business Results
(since beginning consolidated accounting)
FYE 1985
1987 1988
8TSUBAKI CORPORATE REPORT 2017TSUBAKI CORPORATE REPORT 2017 8
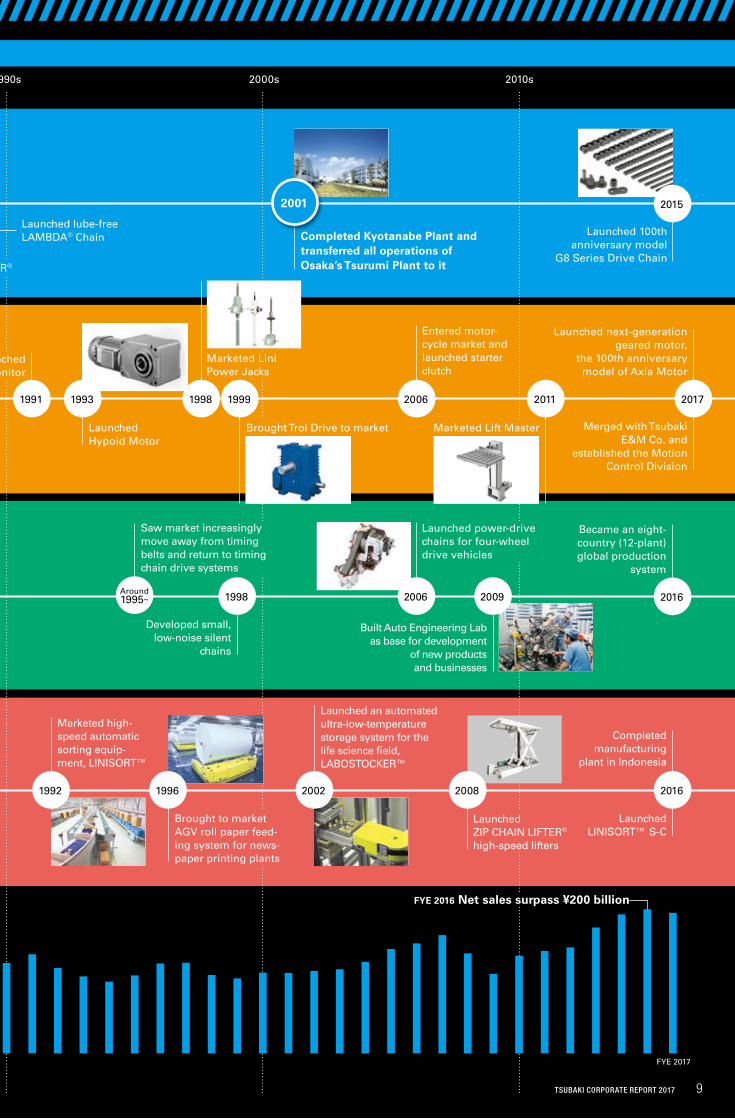
1990s 2000s 2010s
Brought to market AGV roll paper feed-ing system for news-paper printing plants
Marketed high-speed automatic sorting equip-ment, LINISORT™
Launched an automated ultra-low-temperature storage system for the life science field, LABOSTOCKER™
Launched ZIP CHAIN LIFTER® high-speed lifters
Completed manufacturing
plant in Indonesia
Launched Hypoid Motor
Marketed Lini Power Jacks
Launched Shock Monitor
Saw market increasingly move away from timing belts and return to timing chain drive systems
Developed small, low-noise silent
chains
Launched power-drive chains for four-wheel drive vehicles
Built Auto Engineering Lab as base for development
of new products and businesses
Became an eight-country (12-plant) global production
system
Brought Troi Drive to market
Entered motor-cycle market and launched starter clutch
Marketed Lift Master Merged with Tsubaki E&M Co. and
established the Motion Control Division
Launched next-generation geared motor,
the 100th anniversary model of Axia Motor
Launched plastic CABLEVEYOR®
Launched lube-free LAMBDA® Chain
Began local manu-facturing of chains in North America
Completed Kyotanabe Plant and transferred all operations of Osaka’s Tsurumi Plant to it
Launched 100th anniversary model
G8 Series Drive Chain
Becoming the global Tsubaki Group
19961992 2002 2008
1998 20092006Around 1995~
1998 20111993 1999 2006 2017
2015
2016
2016
2001
FYE 2016 Net sales surpass ¥200 billion
FYE 2017
Launched LINISORT™ S-C
1991
TSUBAKI CORPORATE REPORT 2017TSUBAKI CORPORATE REPORT 2017 9
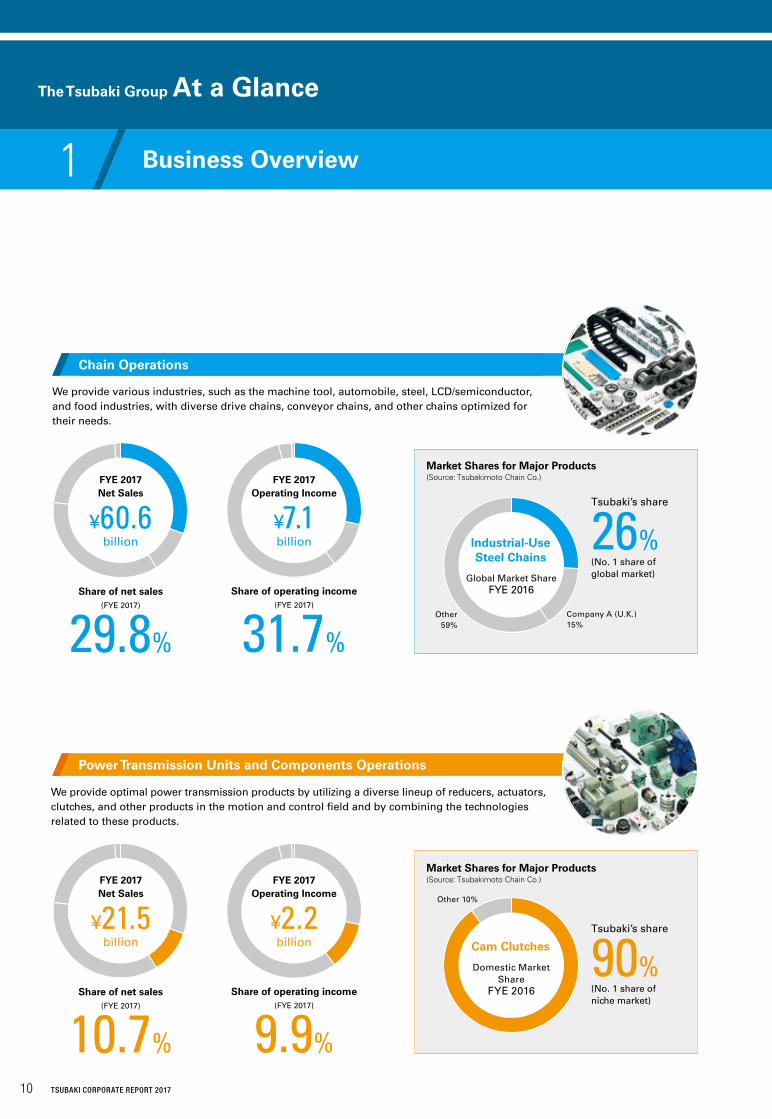
Power Transmission Units and Components Operations
Share of net sales(FYE 2017)
10.7%
Share of net sales(FYE 2017)
29.8%
Share of operating income(FYE 2017)
9.9%
Share of operating income(FYE 2017)
31.7%
Tsubaki’s share
26%(No. 1 share of global market)
Tsubaki’s share
90%(No. 1 share of niche market)
Other 10%
Other59%
We provide optimal power transmission products by utilizing a diverse lineup of reducers, actuators, clutches, and other products in the motion and control field and by combining the technologies related to these products.
We provide various industries, such as the machine tool, automobile, steel, LCD/semiconductor, and food industries, with diverse drive chains, conveyor chains, and other chains optimized for their needs.
FYE 2017 Net Sales
¥60.6billion
FYE 2017 Operating Income
¥7.1billion
Market Shares for Major Products (Source: Tsubakimoto Chain Co.)
Market Shares for Major Products (Source: Tsubakimoto Chain Co.)
Company A (U.K.)15%
Domestic Market Share
FYE 2016
Cam Clutches
Global Market Share FYE 2016
Industrial-Use Steel Chains
1 Business Overview
Chain Operations
FYE 2017 Net Sales
¥21.5billion
FYE 2017 Operating Income
¥2.2billion
10 TSUBAKI CORPORATE REPORT 2017
The Tsubaki Group At a Glance
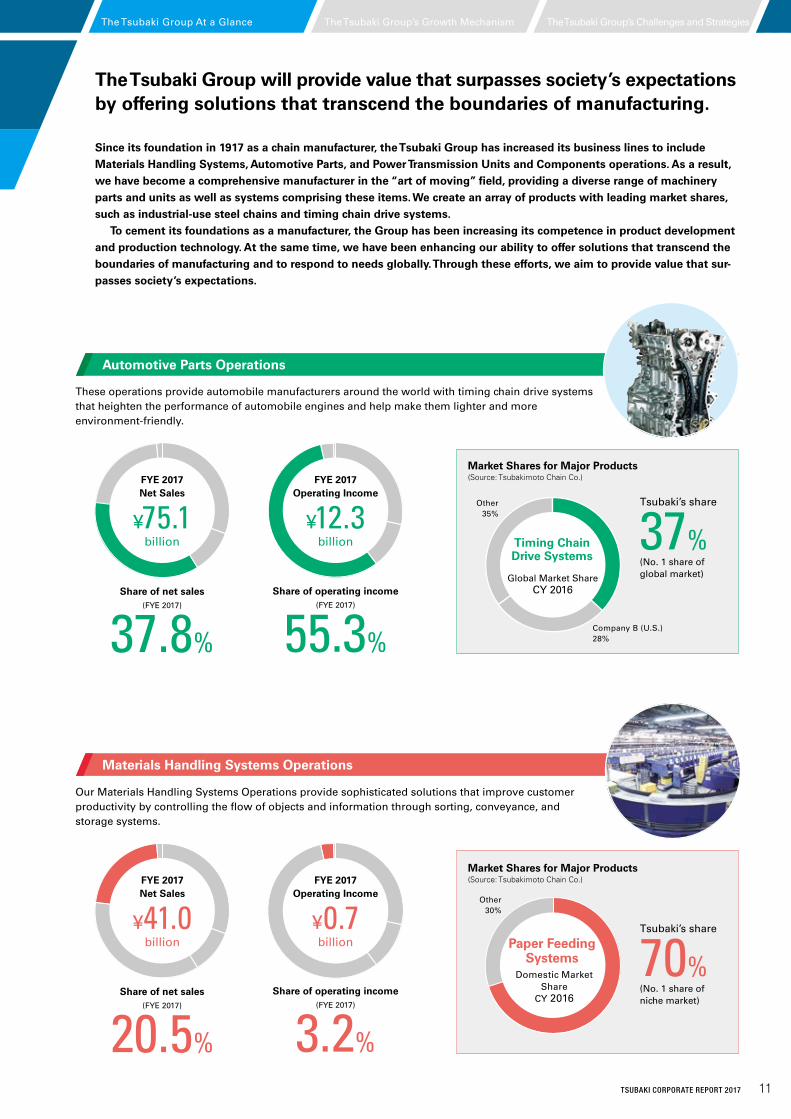
Share of net sales(FYE 2017)
20.5%
Share of net sales(FYE 2017)
37.8%
Share of operating income(FYE 2017)
3.2%
Share of operating income(FYE 2017)
55.3%
Tsubaki’s share
37%(No. 1 share of global market)
Tsubaki’s share
70%(No. 1 share of niche market)
Other30%
Other35%
Our Materials Handling Systems Operations provide sophisticated solutions that improve customer productivity by controlling the flow of objects and information through sorting, conveyance, and storage systems.
These operations provide automobile manufacturers around the world with timing chain drive systems that heighten the performance of automobile engines and help make them lighter and more environment-friendly.
FYE 2017 Net Sales
¥75.1billion
FYE 2017 Operating Income
¥12.3billion
The Tsubaki Group will provide value that surpasses society’s expectations by offering solutions that transcend the boundaries of manufacturing.
Paper Feeding Systems
Market Shares for Major Products (Source: Tsubakimoto Chain Co.)
Market Shares for Major Products (Source: Tsubakimoto Chain Co.)
Company B (U.S.)28%
Global Market Share CY 2016
Timing Chain Drive Systems
Domestic Market Share
CY 2016
Since its foundation in 1917 as a chain manufacturer, the Tsubaki Group has increased its business lines to include Materials Handling Systems, Automotive Parts, and Power Transmission Units and Components operations. As a result, we have become a comprehensive manufacturer in the “art of moving” field, providing a diverse range of machinery parts and units as well as systems comprising these items. We create an array of products with leading market shares, such as industrial-use steel chains and timing chain drive systems. To cement its foundations as a manufacturer, the Group has been increasing its competence in product development and production technology. At the same time, we have been enhancing our ability to offer solutions that transcend the boundaries of manufacturing and to respond to needs globally. Through these efforts, we aim to provide value that sur-passes society’s expectations.
Materials Handling Systems Operations
Automotive Parts Operations
FYE 2017 Net Sales
¥41.0billion
FYE 2017 Operating Income
¥0.7billion
The Tsubaki Group’s Growth Mechanism The Tsubaki Group’s Challenges and StrategiesThe Tsubaki Group At a Glance
11TSUBAKI CORPORATE REPORT 2017
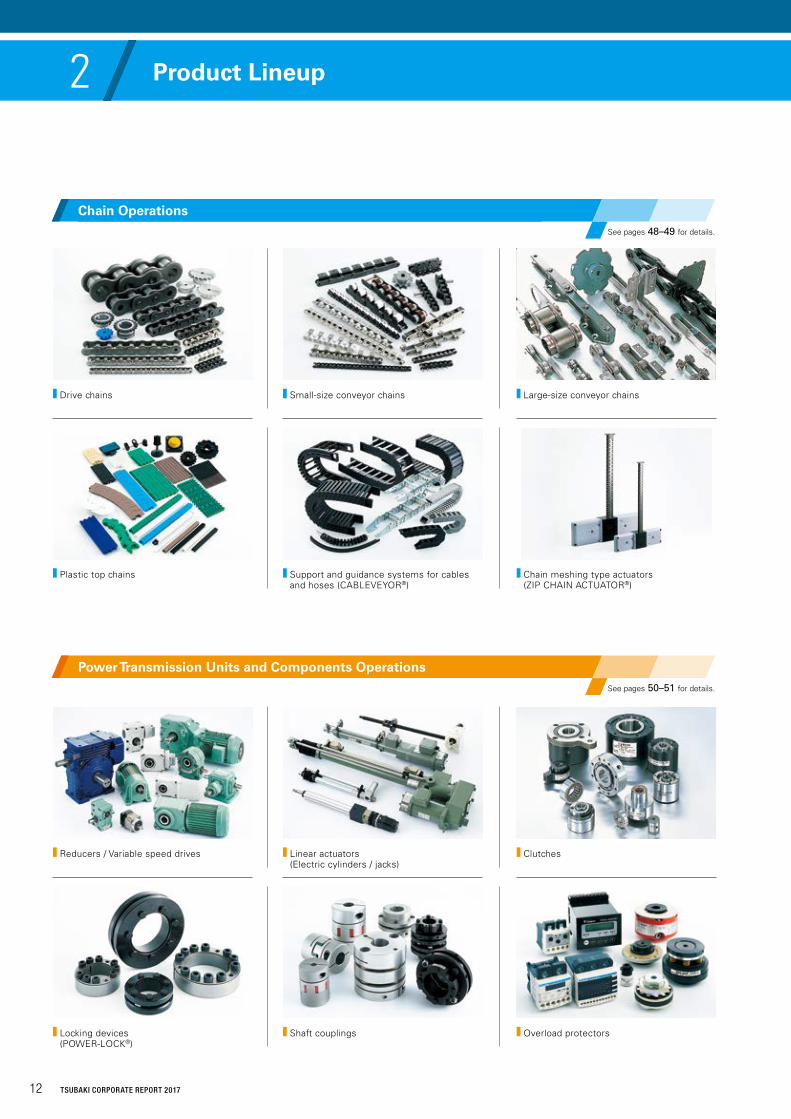
Drive chains
Reducers / Variable speed drives
Plastic top chains
Locking devices (POWER-LOCK®)
Small-size conveyor chains
Linear actuators (Electric cylinders / jacks)
Support and guidance systems for cables and hoses (CABLEVEYOR®)
Shaft couplings
Large-size conveyor chains
Clutches
Chain meshing type actuators (ZIP CHAIN ACTUATOR®)
Overload protectors
2 Product Lineup
Chain OperationsSee pages 48–49 for details.
Power Transmission Units and Components OperationsSee pages 50–51 for details.
12 TSUBAKI CORPORATE REPORT 2017
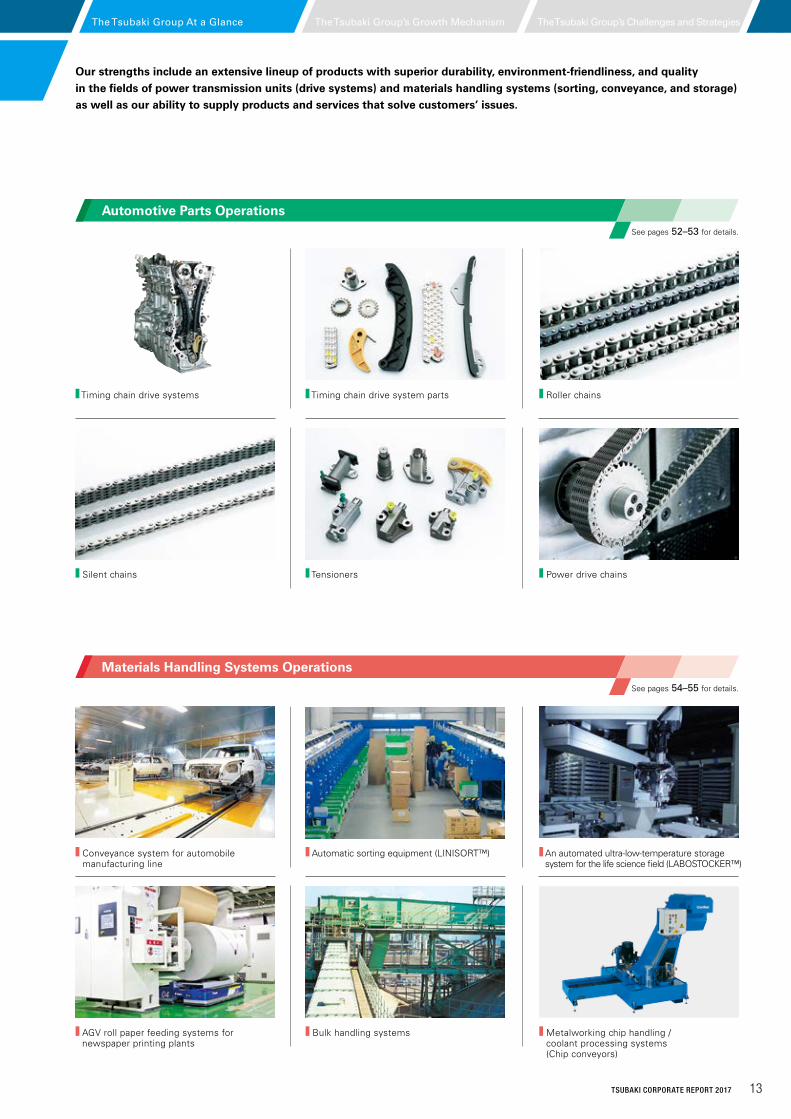
Timing chain drive systems
Conveyance system for automobile manufacturing line
Silent chains
AGV roll paper feeding systems for newspaper printing plants
Timing chain drive system parts
Automatic sorting equipment (LINISORT™)
Tensioners
Bulk handling systems
Roller chains
An automated ultra-low-temperature storage system for the life science field (LABOSTOCKER™)
Power drive chains
Metalworking chip handling / coolant processing systems (Chip conveyors)
Our strengths include an extensive lineup of products with superior durability, environment-friendliness, and quality in the fields of power transmission units (drive systems) and materials handling systems (sorting, conveyance, and storage) as well as our ability to supply products and services that solve customers’ issues.
Automotive Parts OperationsSee pages 52–53 for details.
Materials Handling Systems OperationsSee pages 54–55 for details.
13TSUBAKI CORPORATE REPORT 2017
The Tsubaki Group’s Growth Mechanism The Tsubaki Group’s Challenges and StrategiesThe Tsubaki Group At a Glance
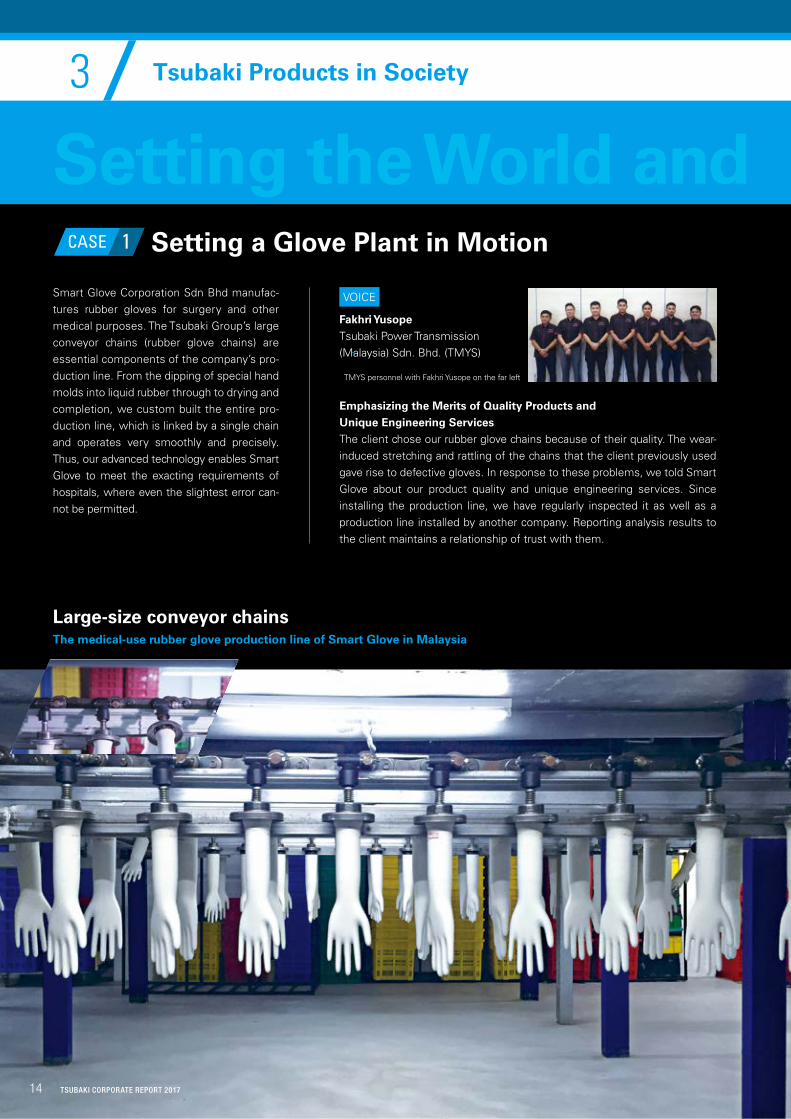
Smart Glove Corporation Sdn Bhd manufac-tures rubber gloves for surgery and other medical purposes. The Tsubaki Group’s large conveyor chains (rubber glove chains) are essential components of the company’s pro-duction line. From the dipping of special hand molds into liquid rubber through to drying and completion, we custom built the entire pro-duction line, which is linked by a single chain and operates very smoothly and precisely. Thus, our advanced technology enables Smart Glove to meet the exacting requirements of hospitals, where even the slightest error can-not be permitted.
Setting a Glove Plant in Motion
VOICE
Fakhri YusopeTsubaki Power Transmission (Malaysia) Sdn. Bhd. (TMYS)
Emphasizing the Merits of Quality Products and Unique Engineering ServicesThe client chose our rubber glove chains because of their quality. The wear-induced stretching and rattling of the chains that the client previously used gave rise to defective gloves. In response to these problems, we told Smart Glove about our product quality and unique engineering services. Since installing the production line, we have regularly inspected it as well as a production line installed by another company. Reporting analysis results to the client maintains a relationship of trust with them.
Setting the World and the Future in Motion
TMYS personnel with Fakhri Yusope on the far left
Large-size conveyor chains
The medical-use rubber glove production line of Smart Glove in Malaysia
1CASE
14 TSUBAKI CORPORATE REPORT 2017
Tsubaki Products in Society3
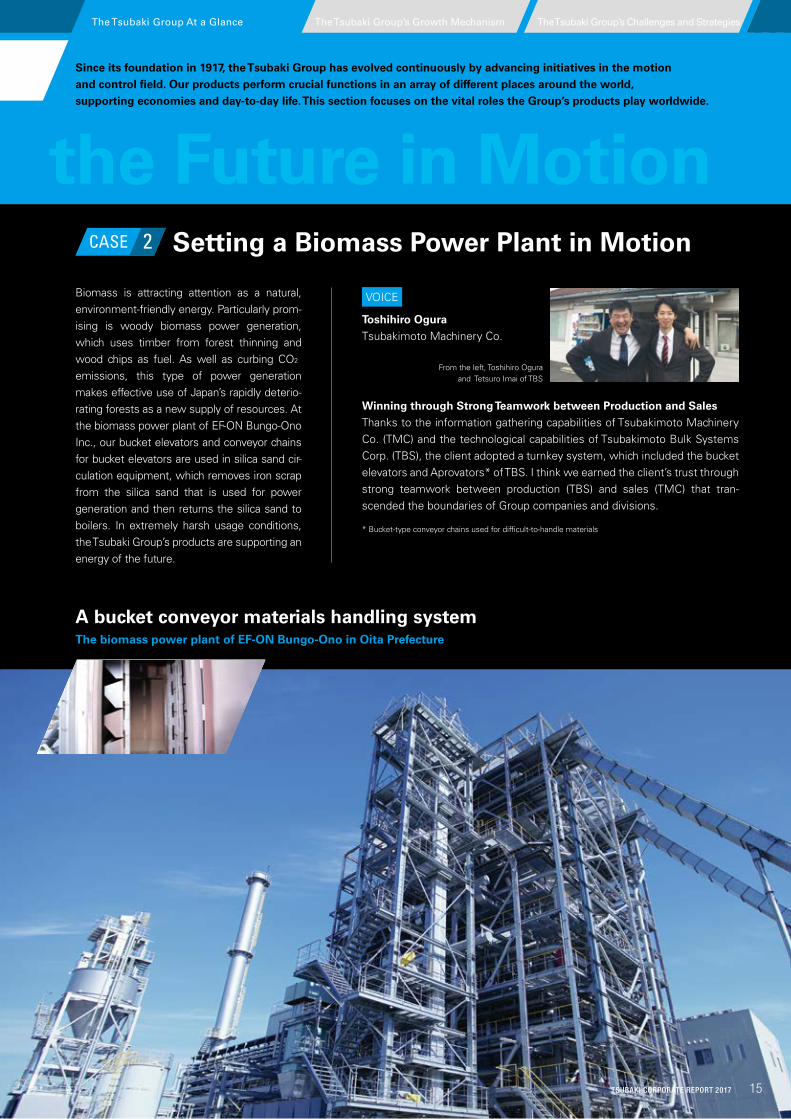
Setting a Biomass Power Plant in Motion
Biomass is attracting attention as a natural, environment-friendly energy. Particularly prom-ising is woody biomass power generation, which uses timber from forest thinning and wood chips as fuel. As well as curbing CO22 emissions, this type of power generation makes effective use of Japan’s rapidly deterio-rating forests as a new supply of resources. At the biomass power plant of EF-ON Bungo-Ono Inc., our bucket elevators and conveyor chains for bucket elevators are used in silica sand cir-culation equipment, which removes iron scrap from the silica sand that is used for power generation and then returns the silica sand to boilers. In extremely harsh usage conditions, the Tsubaki Group’s products are supporting an energy of the future.
VOICE
Toshihiro OguraTsubakimoto Machinery Co.
Winning through Strong Teamwork between Production and SalesThanks to the information gathering capabilities of Tsubakimoto Machinery Co. (TMC) and the technological capabilities of Tsubakimoto Bulk Systems Corp. (TBS), the client adopted a turnkey system, which included the bucket elevators and Aprovators* of TBS. I think we earned the client’s trust through strong teamwork between production (TBS) and sales (TMC) that tran-scended the boundaries of Group companies and divisions.
* Bucket-type conveyor chains used for difficult-to-handle materials
Setting the World and the Future in Motion
From the left, Toshihiro Ogura and Tetsuro Imai of TBS
A bucket conveyor materials handling system
The biomass power plant of EF-ON Bungo-Ono in Oita Prefecture
2CASE
Since its foundation in 1917, the Tsubaki Group has evolved continuously by advancing initiatives in the motion and control field. Our products perform crucial functions in an array of different places around the world, supporting economies and day-to-day life. This section focuses on the vital roles the Group’s products play worldwide.
The Tsubaki Group’s Growth Mechanism The Tsubaki Group’s Challenges and StrategiesThe Tsubaki Group At a Glance
15TSUBAKI CORPORATE REPORT 2017
VOICE
Shinji MurashimaNewspaper Business DepartmentMaterials Handling Division
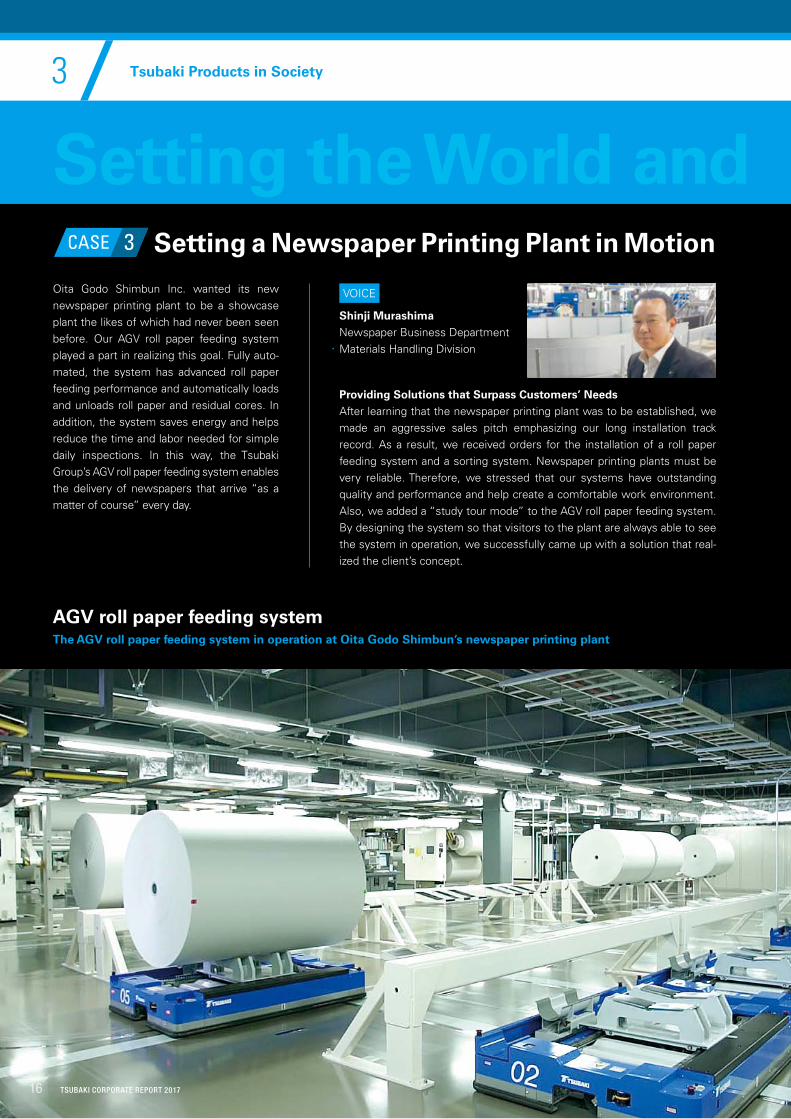
Oita Godo Shimbun Inc. wanted its new newspaper printing plant to be a showcase plant the likes of which had never been seen before. Our AGV roll paper feeding system played a part in realizing this goal. Fully auto-mated, the system has advanced roll paper feeding performance and automatically loads and unloads roll paper and residual cores. In addition, the system saves energy and helps reduce the time and labor needed for simple daily inspections. In this way, the Tsubaki Group’s AGV roll paper feeding system enables the delivery of newspapers that arrive “as a matter of course” every day.
Providing Solutions that Surpass Customers’ NeedsAfter learning that the newspaper printing plant was to be established, we made an aggressive sales pitch emphasizing our long installation track record. As a result, we received orders for the installation of a roll paper feeding system and a sorting system. Newspaper printing plants must be very reliable. Therefore, we stressed that our systems have outstanding quality and performance and help create a comfortable work environment. Also, we added a “study tour mode” to the AGV roll paper feeding system. By designing the system so that visitors to the plant are always able to see the system in operation, we successfully came up with a solution that real-ized the client’s concept.
AGV roll paper feeding system
The AGV roll paper feeding system in operation at Oita Godo Shimbun’s newspaper printing plant
Setting a Newspaper Printing Plant in Motion
Setting the World and the Future in Motion3CASE
TSUBAKI CORPORATE REPORT 201716
3 Tsubaki Products in Society
VOICE
Gary GriffithsTsubaki Australia Pty. Limited
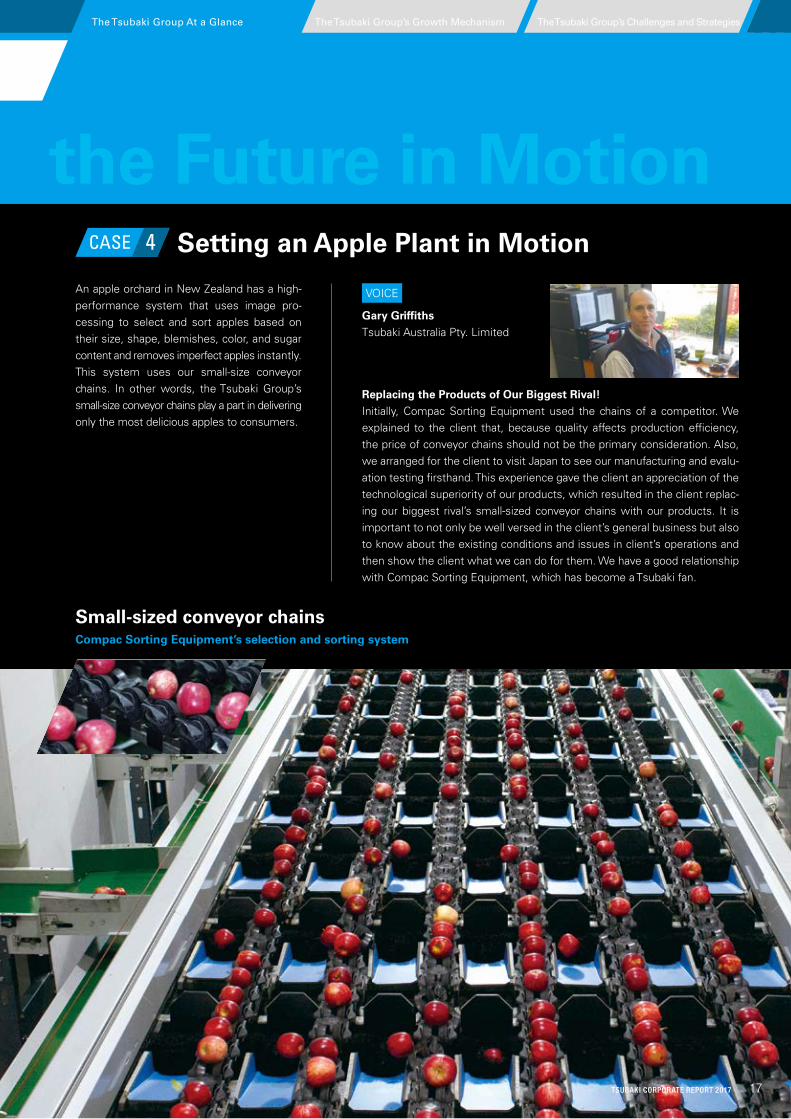
An apple orchard in New Zealand has a high-performance system that uses image pro-cessing to select and sort apples based on their size, shape, blemishes, color, and sugar content and removes imperfect apples instantly. This system uses our small-size conveyor chains. In other words, the Tsubaki Group’s small-size conveyor chains play a part in delivering only the most delicious apples to consumers.
Replacing the Products of Our Biggest Rival!Initially, Compac Sorting Equipment used the chains of a competitor. We explained to the client that, because quality affects production efficiency, the price of conveyor chains should not be the primary consideration. Also, we arranged for the client to visit Japan to see our manufacturing and evalu-ation testing firsthand. This experience gave the client an appreciation of the technological superiority of our products, which resulted in the client replac-ing our biggest rival’s small-sized conveyor chains with our products. It is important to not only be well versed in the client’s general business but also to know about the existing conditions and issues in client’s operations and then show the client what we can do for them. We have a good relationship with Compac Sorting Equipment, which has become a Tsubaki fan.
Small-sized conveyor chains
Compac Sorting Equipment’s selection and sorting system
Setting an Apple Plant in Motion
Setting the World and the Future in Motion4CASE
The Tsubaki Group’s Growth Mechanism The Tsubaki Group’s Challenges and StrategiesThe Tsubaki Group At a Glance
17TSUBAKI CORPORATE REPORT 2017
4 Tsubaki’s Global Network
Tsubakimoto Singapore Pte. Ltd.
Tsubakimoto Automotive (Thailand) Co., Ltd.
Tsubakimoto Europe B.V.
Tsubaki Kabelschlepp GmbH
Percentage ofTotal Net Sales
6.8%
Percentage ofTotal Net Sales
11.2%
Tsubakimoto Chain (Tianjin) Co., Ltd.
Tsubakimoto Automotive (Shanghai) Co., Ltd.
ChinaGroup companies*
14
FYE 2007
37.4%
FYE 2017
54.9%
Percentage ofTotal Net Sales
8.3%
Percentage of Overseas Sales
EuropeGroup companies*
20Indian
Ocean RimGroup companies*
14
18 TSUBAKI CORPORATE REPORT 2017
Kyotanabe Plant Saitama Plant
Mayfran International, Inc.
Nagaokakyo Plant Hyogo Plant Okayama Plant
Tsubaki of Canada Limited
U.S. Tsubaki Holdings, Inc. Percentage of
Total Net Sales
45.1%
Percentage of Total Net Sales
24.6%
* Number of Group companies by region are as of October 1, 2017.
Taiwan Tsubakimoto Co.
Tsubakimoto Automotive Korea Co., Ltd.
Percentage ofTotal Net Sales
4.0%
Manufacturing subsidiary
Other subsidiary
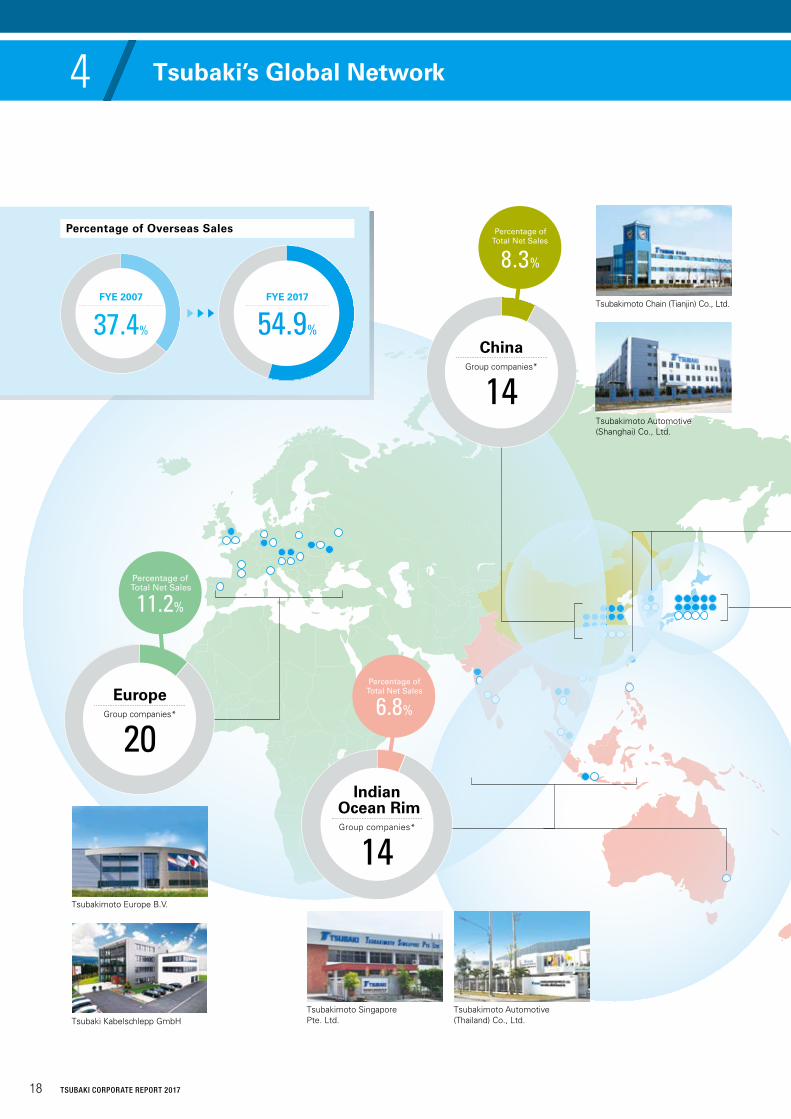
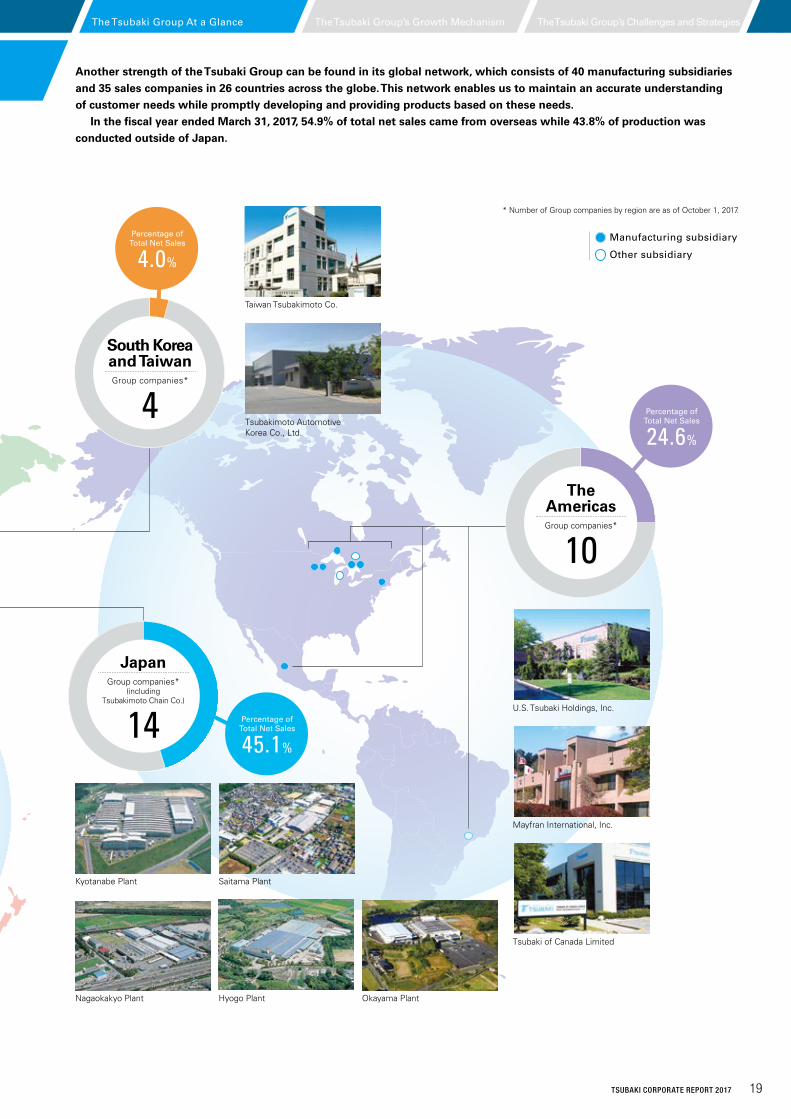
Another strength of the Tsubaki Group can be found in its global network, which consists of 40 manufacturing subsidiaries and 35 sales companies in 26 countries across the globe. This network enables us to maintain an accurate understanding of customer needs while promptly developing and providing products based on these needs. In the fiscal year ended March 31, 2017, 54.9% of total net sales came from overseas while 43.8% of production was conducted outside of Japan.
South Korea and TaiwanGroup companies*
4
The AmericasGroup companies*
10
JapanGroup companies*
(including Tsubakimoto Chain Co.)
14
19TSUBAKI CORPORATE REPORT 2017
The Tsubaki Group’s Growth Mechanism The Tsubaki Group’s Challenges and StrategiesThe Tsubaki Group At a Glance
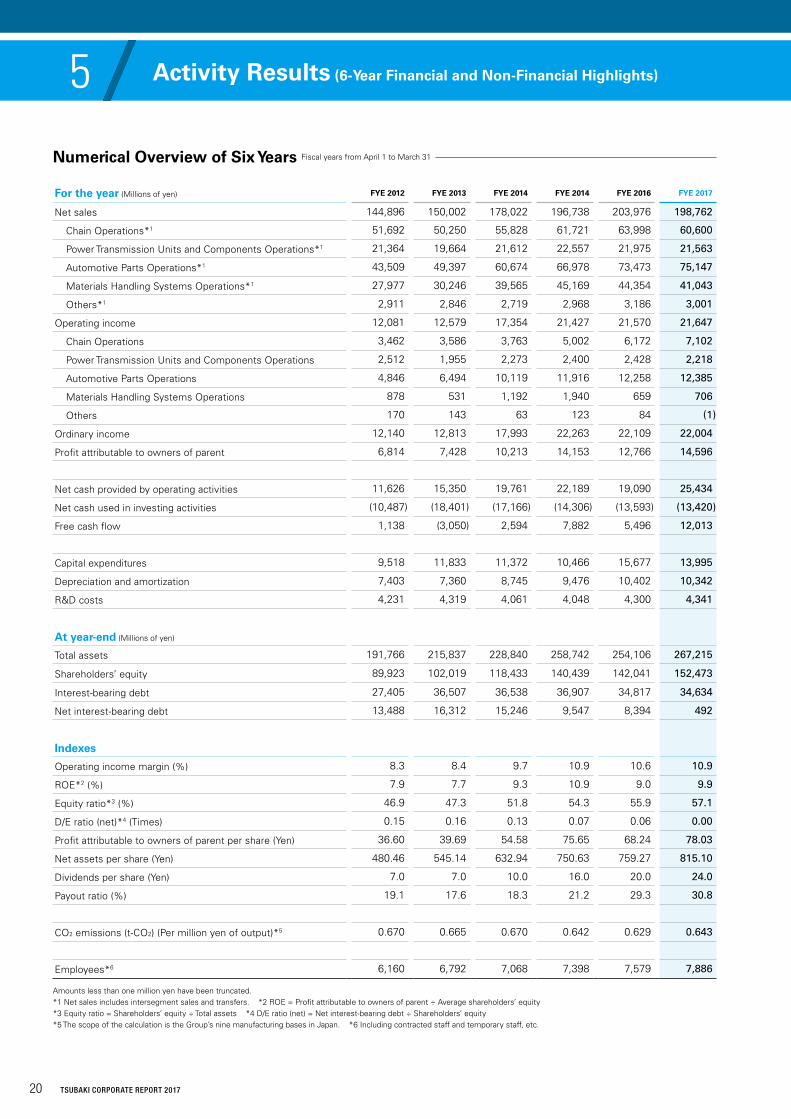
Numerical Overview of Six Years Fiscal years from April 1 to March 31
For the year (Millions of yen) FYE 2012 FYE 2013 FYE 2014 FYE 2014 FYE 2016 FYE 2017
Net sales 144,896 150,002 178,022 196,738 203,976 198,762
Chain Operations*1 51,692 50,250 55,828 61,721 63,998 60,600
P ower Transmission Units and Components Operations*1 21,364 19,664 21,612 22,557 21,975 21,563
Automotive Parts Operations*1 43,509 49,397 60,674 66,978 73,473 75,147
Materials Handling Systems Operations*1 27,977 30,246 39,565 45,169 44,354 41,043
Others*1 2,911 2,846 2,719 2,968 3,186 3,001
Operating income 12,081 12,579 17,354 21,427 21,570 21,647
Chain Operations 3,462 3,586 3,763 5,002 6,172 7,102
P ower Transmission Units and Components Operations 2,512 1,955 2,273 2,400 2,428 2,218
Automotive Parts Operations 4,846 6,494 10,119 11,916 12,258 12,385
Materials Handling Systems Operations 878 531 1,192 1,940 659 706
Others 170 143 63 123 84 (1)
Ordinary income 12,140 12,813 17,993 22,263 22,109 22,004
Profit attributable to owners of parent 6,814 7,428 10,213 14,153 12,766 14,596
Net cash provided by operating activities 11,626 15,350 19,761 22,189 19,090 25,434
Net cash used in investing activities (10,487) (18,401) (17,166) (14,306) (13,593) (13,420)
Free cash flow 1,138 (3,050) 2,594 7,882 5,496 12,013
Capital expenditures 9,518 11,833 11,372 10,466 15,677 13,995
Depreciation and amortization 7,403 7,360 8,745 9,476 10,402 10,342
R&D costs 4,231 4,319 4,061 4,048 4,300 4,341
At year-end (Millions of yen)
Total assets 191,766 215,837 228,840 258,742 254,106 267,215
Shareholders’ equity 89,923 102,019 118,433 140,439 142,041 152,473
Interest-bearing debt 27,405 36,507 36,538 36,907 34,817 34,634
Net interest-bearing debt 13,488 16,312 15,246 9,547 8,394 492
Indexes
Operating income margin (%) 8.3 8.4 9.7 10.9 10.6 10.9
ROE*2 (%) 7.9 7.7 9.3 10.9 9.0 9.9
Equity ratio*3 (%) 46.9 47.3 51.8 54.3 55.9 57.1
D/E ratio (net)*4 (Times) 0.15 0.16 0.13 0.07 0.06 0.00
Profit attributable to owners of parent per share (Yen) 36.60 39.69 54.58 75.65 68.24 78.03
Net assets per share (Yen) 480.46 545.14 632.94 750.63 759.27 815.10
Dividends per share (Yen) 7.0 7.0 10.0 16.0 20.0 24.0
Payout ratio (%) 19.1 17.6 18.3 21.2 29.3 30.8
CO2 emissions (t-CO2) (Per million yen of output)*5 0.670 0.665 0.670 0.642 0.629 0.643
Employees*6 6,160 6,792 7,068 7,398 7,579 7,886
Amounts less than one million yen have been truncated.*1 Net sales includes intersegment sales and transfers. *2 ROE = Profit attributable to owners of parent ÷ Average shareholders’ equity*3 Equity ratio = Shareholders’ equity ÷ Total assets *4 D/E ratio (net) = Net interest-bearing debt ÷ Shareholders’ equity*5 The scope of the calculation is the Group’s nine manufacturing bases in Japan. *6 Including contracted staff and temporary staff, etc.
20 TSUBAKI CORPORATE REPORT 2017
5 Activity Results (6-Year Financial and Non-Financial Highlights)
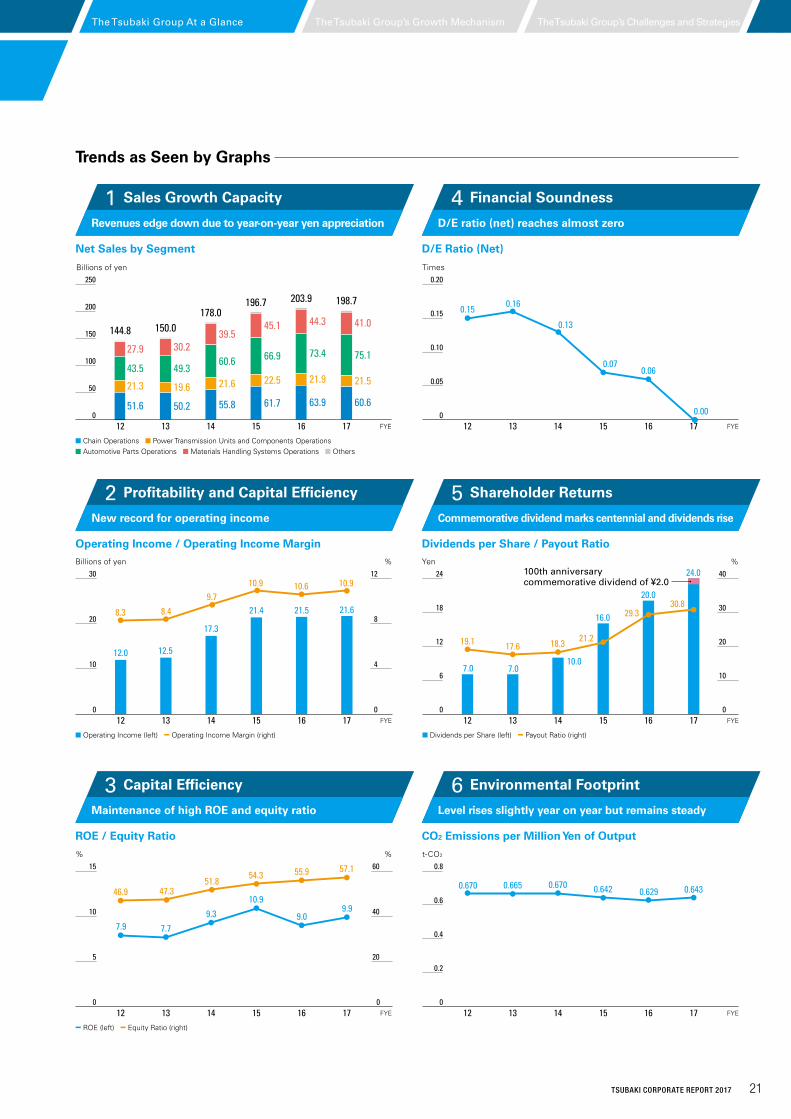
Trends as Seen by Graphs
51.6
21.3
43.5
27.9
50.2
19.6
49.3
30.2
55.8
21.6
60.6
39.5
61.7
22.5
66.9
45.1
63.9
21.9
73.4
44.3
60.6
21.5
75.1
41.0
16 17151413120
250
200
150
100
50
FYE
144.8 150.0178.0
196.7 203.9 198.7
Billions of yen
n Chain Operations n Power Transmission Units and Components Operations n Automotive Parts Operations n Materials Handling Systems Operations n Others
12.0 12.5
17.3
21.4 21.5 21.68.3 8.4
9.710.9 10.6 10.9
0
30
0
12
20 8
10 4
16 1715141312 FYE
Billions of yen %
n Operating Income (left) n Operating Income Margin (right)
0.15 0.16
0.13
0.070.06
0.000
0.20
0.15
0.10
0.05
16 1715141312 FYE
0.670 0.665 0.670 0.642 0.6430.629
0
0.8
16 1715141312
0.6
0.4
0.2
FYE
46.9 47.351.8
54.3
7.9 7.7
9.3
10.9
9.09.9
55.9 57.1
0
15
10
5
0
60
40
20
16 1715141312 FYE
Times
7.0 7.0
16.0
20.0
24.0
19.1 17.6 18.3 21.2
29.330.8
10.0
0
24
18
12
6
0
40
30
20
10
16 1715141312 FYE
Yen %
n Dividends per Share (left) n Payout Ratio (right)
100th anniversary commemorative dividend of ¥2.0
% %
n ROE (left) n Equity Ratio (right)
t-CO2
Sales Growth Capacity
Profitability and Capital Efficiency
Capital Efficiency
Financial Soundness
Shareholder Returns
Environmental Footprint
1
2
3
4
5
6
Revenues edge down due to year-on-year yen appreciation
New record for operating income
Maintenance of high ROE and equity ratio
D/E ratio (net) reaches almost zero
Commemorative dividend marks centennial and dividends rise
Level rises slightly year on year but remains steady
Net Sales by Segment
Operating Income / Operating Income Margin
ROE / Equity Ratio
D/E Ratio (Net)
Dividends per Share / Payout Ratio
CO2 Emissions per Million Yen of Output
21TSUBAKI CORPORATE REPORT 2017
The Tsubaki Group’s Growth Mechanism The Tsubaki Group’s Challenges and StrategiesThe Tsubaki Group At a Glance
Anticipation Development of the Tsubaki Group’s operations
Human capital See pages 24 and 28–29 for details.
Financial capital See pages 24 and 30 for details.
Production facilities See page 24 for details.
Motion and control -related social issues and customer needs
New product development
Marketing
Technological innovation
Establishment of competitive advantage
Productivity improvement
Energy saving
Clean manufacturing environments
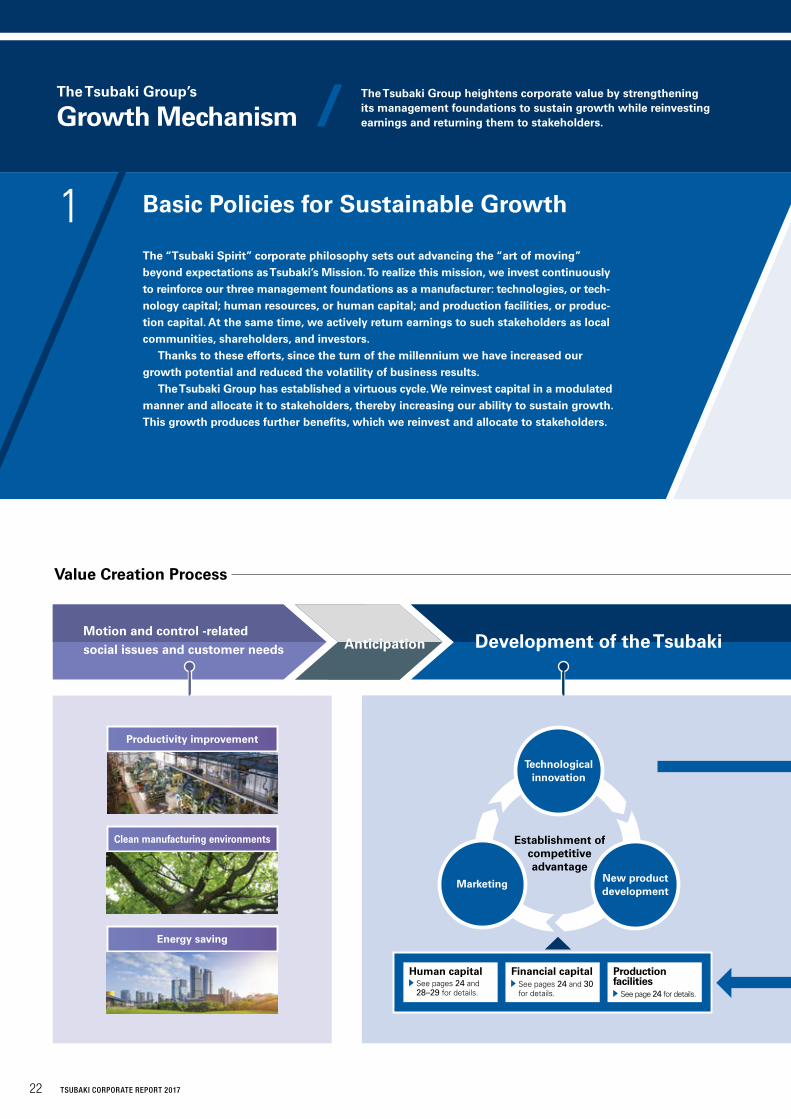
The “Tsubaki Spirit” corporate philosophy sets out advancing the “art of moving” beyond expectations as Tsubaki’s Mission. To realize this mission, we invest continuously to reinforce our three management foundations as a manufacturer: technologies, or tech-nology capital; human resources, or human capital; and production facilities, or produc-tion capital. At the same time, we actively return earnings to such stakeholders as local communities, shareholders, and investors. Thanks to these efforts, since the turn of the millennium we have increased our growth potential and reduced the volatility of business results. The Tsubaki Group has established a virtuous cycle. We reinvest capital in a modulated manner and allocate it to stakeholders, thereby increasing our ability to sustain growth. This growth produces further benefits, which we reinvest and allocate to stakeholders.
Value Creation Process
22 TSUBAKI CORPORATE REPORT 2017
The Tsubaki Group’s
Growth MechanismThe Tsubaki Group heightens corporate value by strengthening its management foundations to sustain growth while reinvesting earnings and returning them to stakeholders.
1 Basic Policies for Sustainable Growth
FYE85 86 87 88 89 90 91 92 93 94 95 96 97 98 99 00 01 02 03 04 05 06 07 08 09 10 11 12 13 14 1615
240
0
16
210 14
180 12
150 10
120 8
90 6
60 4
30 2
0
17
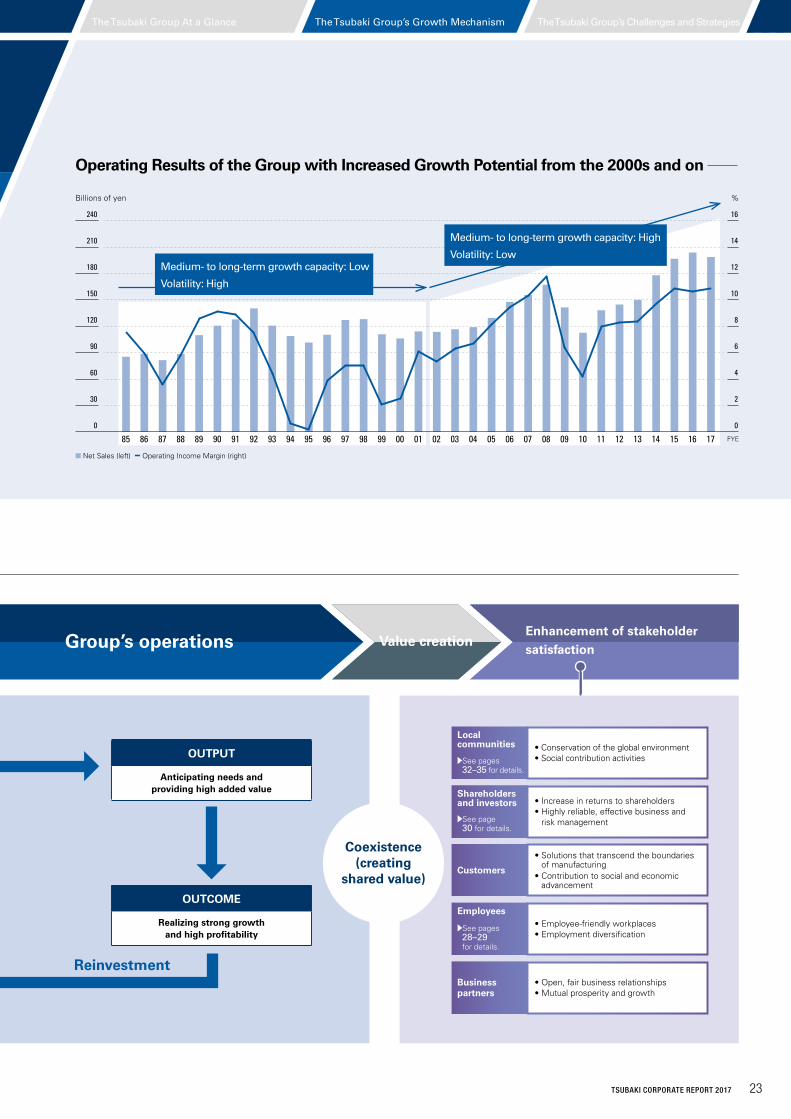
n Net Sales (left) n Operating Income Margin (right)
Billions of yen %
Medium- to long-term growth capacity: Low
Volatility: High
Medium- to long-term growth capacity: High
Volatility: Low
Operating Results of the Group with Increased Growth Potential from the 2000s and on
Development of the Tsubaki Group’s operations Value creation
Reinvestment
Coexistence (creating
shared value)
Enhancement of stakeholder satisfaction
OUTCOME
Realizing strong growth and high profitability
OUTPUT
Anticipating needs and providing high added value
Value Creation Process
• Conservation of the global environment• Social contribution activities
Local communities
See pages 32–35 for details.
• Increase in returns to shareholders• Highly reliable, effective business and
risk management
Shareholders and investors
See page 30 for details.
• Solutions that transcend the boundaries of manufacturing
• Contribution to social and economic advancement
Customers
• Employee-friendly workplaces• Employment diversification
Employees
See pages 28–29
for details.
• Open, fair business relationships• Mutual prosperity and growth
Business partners
The Tsubaki Group’s Growth Mechanism The Tsubaki Group’s Challenges and StrategiesThe Tsubaki Group At a Glance
23TSUBAKI CORPORATE REPORT 2017
Technology Capital
Financial Capital
Human Capital
Production Capital
Financial Capital
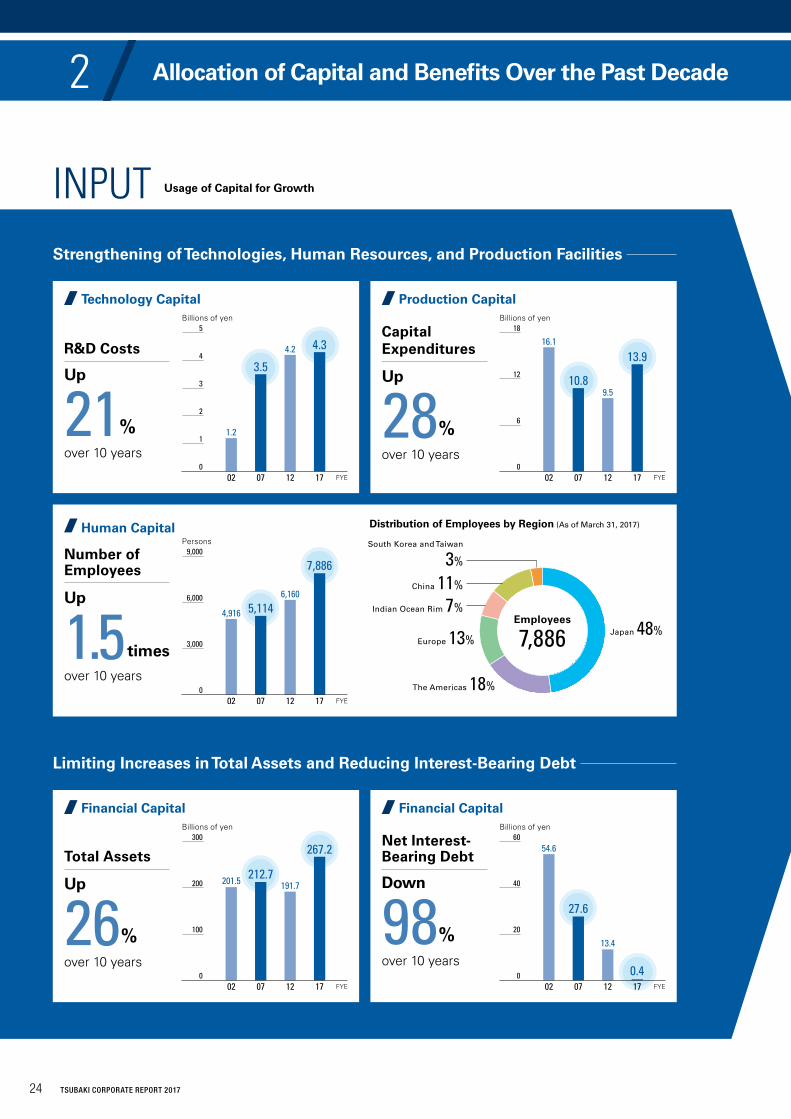
Distribution of Employees by Region (As of March 31, 2017)
Strengthening of Technologies, Human Resources, and Production Facilities
Limiting Increases in Total Assets and Reducing Interest-Bearing Debt
Usage of Capital for Growth
R&D Costs
Up
21%over 10 years
Total Assets
Up
26%over 10 years
Number of Employees
Up
1.5times
over 10 years
Capital Expenditures
Up
28%over 10 years
Net Interest-Bearing Debt
Down
98%over 10 years
Billions of yen
Billions of yen
Persons
Billions of yen
Billions of yen
4.2
1.2
4.3
3.5
0
5
4
2
3
1
FYE171202 07
Japan 48%
The Americas 18%
Europe 13%
Indian Ocean Rim 7%
China 11%
South Korea and Taiwan
3%
Employees
7,886
16.1
9.5
13.9
10.8
0
18
12
6
FYE171202 07
4,916
6,160
7,886
5,114
0
9,000
6,000
3,000
FYE171202 07
201.5 191.7
267.2
212.7
0
300
200
100
FYE171202 07
54.6
13.4
0.4
27.6
0
60
40
20
FYE171202 07
INPUT
24 TSUBAKI CORPORATE REPORT 2017
2 Allocation of Capital and Benefits Over the Past Decade
Performance
Profitability
Financial Soundness
Performance
Profitability
Energy Efficiency (improvement in emissions intensity)
*1 D/E ratio (net) = Net interest-bearing debt ÷ Shareholders’ equity *2 The scope of the calculation is the Group’s nine manufacturing bases in Japan.*3 Omitted from graph because prior to beginning of aggregation
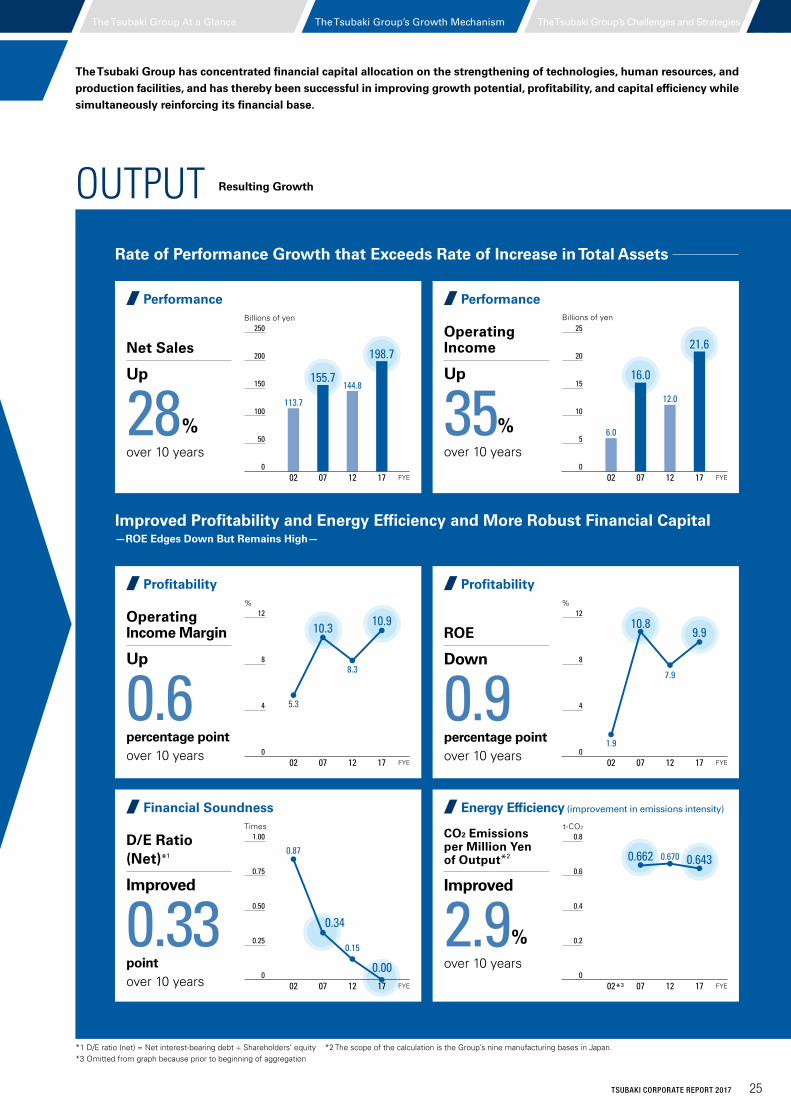
Rate of Performance Growth that Exceeds Rate of Increase in Total Assets
Improved Profitability and Energy Efficiency and More Robust Financial Capital —ROE Edges Down But Remains High—
Resulting Growth
Net Sales
Up
28% over 10 years
Operating Income Margin
Up
0.6percentage point over 10 years
D/E Ratio (Net)*1
Improved
0.33pointover 10 years
Operating Income
Up
35% over 10 years
ROE
Down
0.9percentage point over 10 years
CO2 Emissions per Million Yen of Output*2
Improved
2.9%over 10 years
Billions of yen Billions of yen
113.7
144.8
198.7
155.7
0
250
200
100
150
50
FYE171202 07
6.0
12.0
21.6
16.0
0
25
20
10
15
5
FYE171202 07
OUTPUT
The Tsubaki Group has concentrated financial capital allocation on the strengthening of technologies, human resources, and production facilities, and has thereby been successful in improving growth potential, profitability, and capital efficiency while simultaneously reinforcing its financial base.
% %
t-CO2Times
5.3
8.3
10.910.3
0
12
8
4
FYE171202 07
1.9
7.9
9.910.8
0
12
8
4
FYE171202 07
0
1.00
0.50
0.75
0.25
0.87
0.15
0.00
0.34
FYE171202 07
0.670 0.6430.662
0
0.8
0.4
0.6
0.2
FYE171202 07*3
The Tsubaki Group’s Growth Mechanism The Tsubaki Group’s Challenges and StrategiesThe Tsubaki Group At a Glance
25TSUBAKI CORPORATE REPORT 2017
Allocation of Capital and Benefits Over the Past Decade
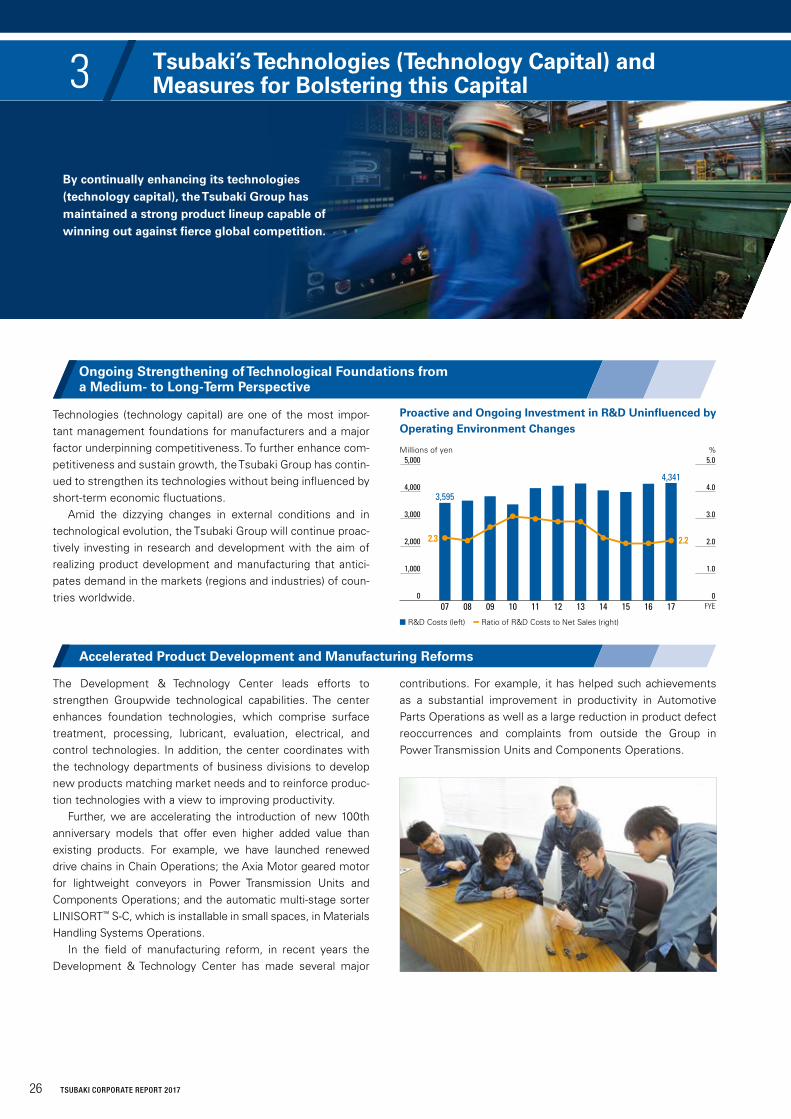
Technologies (technology capital) are one of the most impor-tant management foundations for manufacturers and a major factor underpinning competitiveness. To further enhance com-petitiveness and sustain growth, the Tsubaki Group has contin-ued to strengthen its technologies without being influenced by short-term economic fluctuations. Amid the dizzying changes in external conditions and in technological evolution, the Tsubaki Group will continue proac-tively investing in research and development with the aim of realizing product development and manufacturing that antici-pates demand in the markets (regions and industries) of coun-tries worldwide.
The Development & Technology Center leads efforts to strengthen Groupwide technological capabilities. The center enhances foundation technologies, which comprise surface treatment, processing, lubricant, evaluation, electrical, and control technologies. In addition, the center coordinates with the technology departments of business divisions to develop new products matching market needs and to reinforce produc-tion technologies with a view to improving productivity. Further, we are accelerating the introduction of new 100th anniversary models that offer even higher added value than existing products. For example, we have launched renewed drive chains in Chain Operations; the Axia Motor geared motor for lightweight conveyors in Power Transmission Units and Components Operations; and the automatic multi-stage sorter LINISORT™ S-C, which is installable in small spaces, in Materials Handling Systems Operations. In the field of manufacturing reform, in recent years the Development & Technology Center has made several major
contributions. For example, it has helped such achievements as a substantial improvement in productivity in Automotive Parts Operations as well as a large reduction in product defect reoccurrences and complaints from outside the Group in Power Transmission Units and Components Operations.
Proactive and Ongoing Investment in R&D Uninfluenced by Operating Environment Changes
By continually enhancing its technologies (technology capital), the Tsubaki Group has maintained a strong product lineup capable of winning out against fierce global competition.
n R&D Costs (left) n Ratio of R&D Costs to Net Sales (right)
Millions of yen %
2.32.3 2.22.2
3,595
4,341
0
1,000
2,000
3,000
4,000
5,000
0
1.0
2.0
3.0
4.0
5.0
FYE15 16 1713 1411 1209 1007 08
Accelerated Product Development and Manufacturing Reforms
Ongoing Strengthening of Technological Foundations from a Medium- to Long-Term Perspective
26 TSUBAKI CORPORATE REPORT 2017
3 Tsubaki’s Technologies (Technology Capital) and Measures for Bolstering this Capital
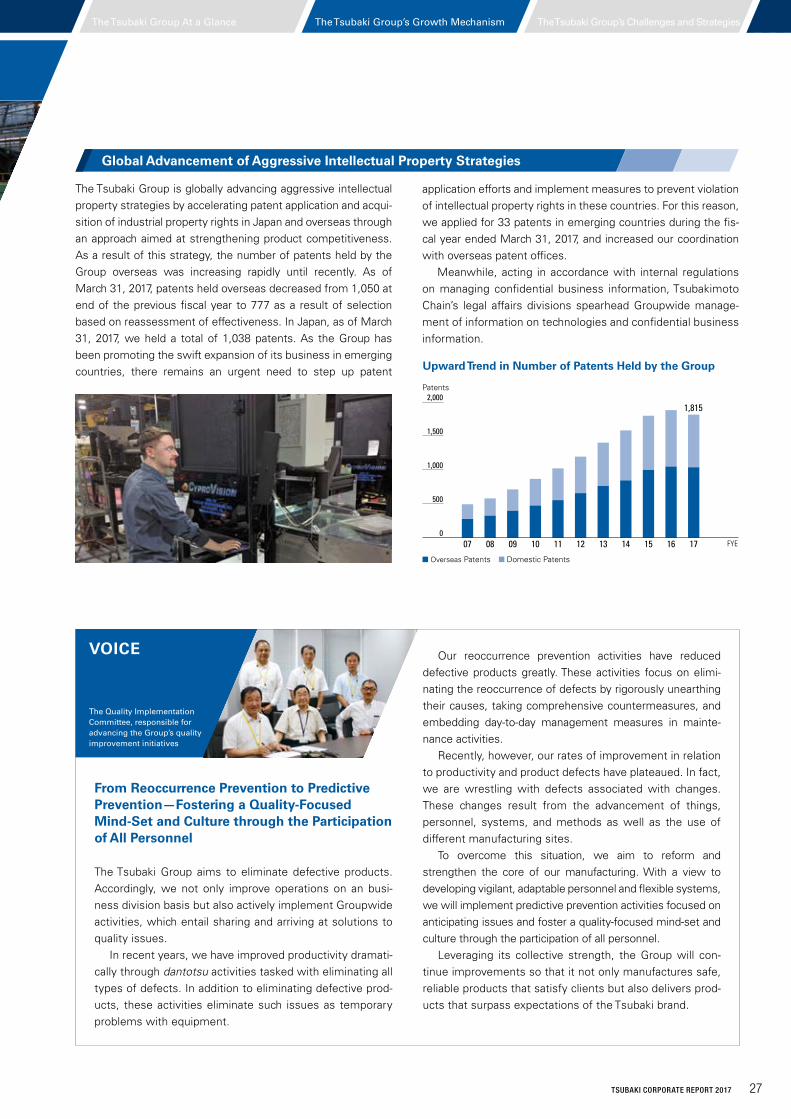
The Tsubaki Group is globally advancing aggressive intellectual property strategies by accelerating patent application and acqui-sition of industrial property rights in Japan and overseas through an approach aimed at strengthening product competitiveness. As a result of this strategy, the number of patents held by the Group overseas was increasing rapidly until recently. As of March 31, 2017, patents held overseas decreased from 1,050 at end of the previous fiscal year to 777 as a result of selection based on reassessment of effectiveness. In Japan, as of March 31, 2017, we held a total of 1,038 patents. As the Group has been promoting the swift expansion of its business in emerging countries, there remains an urgent need to step up patent Upward Trend in Number of Patents Held by the Group
n Overseas Patents n Domestic Patents
application efforts and implement measures to prevent violation of intellectual property rights in these countries. For this reason, we applied for 33 patents in emerging countries during the fis-cal year ended March 31, 2017, and increased our coordination with overseas patent offices. Meanwhile, acting in accordance with internal regulations on managing confidential business information, Tsubakimoto Chain’s legal affairs divisions spearhead Groupwide manage-ment of information on technologies and confidential business information.
From Reoccurrence Prevention to Predictive Prevention—Fostering a Quality-Focused Mind-Set and Culture through the Participation of All Personnel
The Tsubaki Group aims to eliminate defective products. Accordingly, we not only improve operations on an busi-ness division basis but also actively implement Groupwide activities, which entail sharing and arriving at solutions to quality issues. In recent years, we have improved productivity dramati-cally through dantotsu activities tasked with eliminating all types of defects. In addition to eliminating defective prod-ucts, these activities eliminate such issues as temporary problems with equipment.
Our reoccurrence prevention activities have reduced defective products greatly. These activities focus on elimi-nating the reoccurrence of defects by rigorously unearthing their causes, taking comprehensive countermeasures, and embedding day-to-day management measures in mainte-nance activities. Recently, however, our rates of improvement in relation to productivity and product defects have plateaued. In fact, we are wrestling with defects associated with changes. These changes result from the advancement of things, personnel, systems, and methods as well as the use of different manufacturing sites. To overcome this situation, we aim to reform and strengthen the core of our manufacturing. With a view to developing vigilant, adaptable personnel and flexible systems, we will implement predictive prevention activities focused on anticipating issues and foster a quality-focused mind-set and culture through the participation of all personnel. Leveraging its collective strength, the Group will con-tinue improvements so that it not only manufactures safe, reliable products that satisfy clients but also delivers prod-ucts that surpass expectations of the Tsubaki brand.
The Quality Implementation Committee, responsible for advancing the Group’s quality improvement initiatives
VOICE
1,815
0
500
1,000
1,500
2,000
FYE15 16 1713 1411 1209 1007 08
Global Advancement of Aggressive Intellectual Property Strategies
Patents
The Tsubaki Group’s Growth Mechanism The Tsubaki Group’s Challenges and StrategiesThe Tsubaki Group At a Glance
27TSUBAKI CORPORATE REPORT 2017
Tsubaki’s Technologies (Technology Capital) and Measures for Bolstering this Capital
The Group’s operations are expanding due to globalization, and labor laws are becoming stricter. Mindful of these changes, in the fiscal year ended March 31, 2016, we began reforming our personnel system with our sights set on securing our work force through diversified employment formats as well as improving job satisfaction. Moreover, these reforms will incorporate our tradi-tional emphasis on capabilities and results. We are proceeding with reforms focused on four aims: diver-sifying employment formats, enhancing the understandability of employee evaluations and compensation, developing personnel in a planned manner, and empowering female employees. Our main initiatives are the introduction of a direct employ-ment system for those aged 65 and above; the reform of the qualification, wage, and evaluation systems for regular service employees; and efforts to increase the percentage of female employees in management positions. Specifically, using the
fiscal year ended March 31, 2017, as a base year, we aim to raise the percentage of female employees from 7.7% to 10% and the percentage of female employees in management posi-tions from 2.4% to 5%. Increasing employees’ fulfillment and motivation with respect to their jobs will strengthen the capa-bilities of each employee, boost the capabilities of the Group as an organization, and contribute to its expansion. Further, as part of efforts to foster personnel in a planned manner, we will acceler-ate development through the establishment of career paths and development plans while continuing to strengthen education for general managers and managers.
4
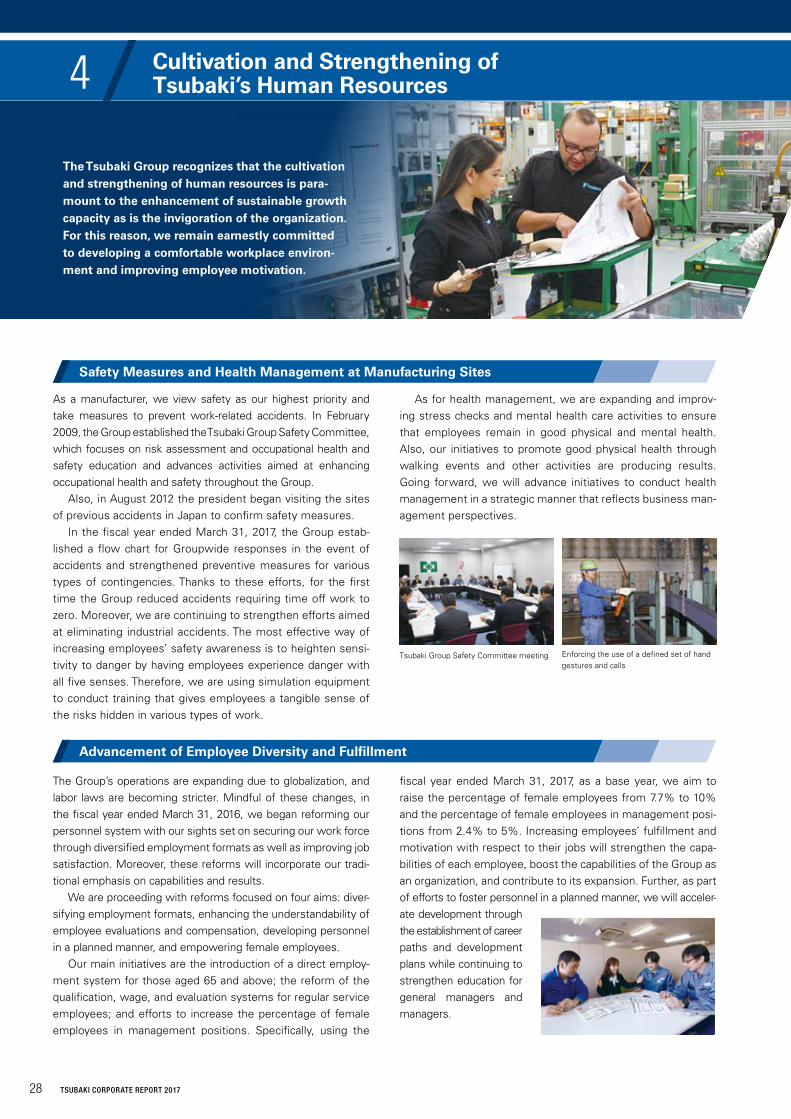
As a manufacturer, we view safety as our highest priority and take measures to prevent work-related accidents. In February 2009, the Group established the Tsubaki Group Safety Committee, which focuses on risk assessment and occupational health and safety education and advances activities aimed at enhancing occupational health and safety throughout the Group. Also, in August 2012 the president began visiting the sites of previous accidents in Japan to confirm safety measures. In the fiscal year ended March 31, 2017, the Group estab-lished a flow chart for Groupwide responses in the event of accidents and strengthened preventive measures for various types of contingencies. Thanks to these efforts, for the first time the Group reduced accidents requiring time off work to zero. Moreover, we are continuing to strengthen efforts aimed at eliminating industrial accidents. The most effective way of increasing employees’ safety awareness is to heighten sensi-tivity to danger by having employees experience danger with all five senses. Therefore, we are using simulation equipment to conduct training that gives employees a tangible sense of the risks hidden in various types of work.
As for health management, we are expanding and improv-ing stress checks and mental health care activities to ensure that employees remain in good physical and mental health. Also, our initiatives to promote good physical health through walking events and other activities are producing results. Going forward, we will advance initiatives to conduct health management in a strategic manner that reflects business man-agement perspectives.
Safety Measures and Health Management at Manufacturing Sites
Advancement of Employee Diversity and Fulfillment
The Tsubaki Group recognizes that the cultivation and strengthening of human resources is para-mount to the enhancement of sustainable growth capacity as is the invigoration of the organization. For this reason, we remain earnestly committed to developing a comfortable workplace environ-ment and improving employee motivation.
Enforcing the use of a defined set of hand gestures and calls
Tsubaki Group Safety Committee meeting
28 TSUBAKI CORPORATE REPORT 2017
Cultivation and Strengthening of Tsubaki’s Human Resources
Tsubaki’s manufacturing capabilities are exemplified by its proficiency at developing and customizing products as well as its production and foundation technologies. We aim to strengthen these capabilities while also steadily passing on Tsubaki’s superb technical skills and expertise to the next generation of young engineers. Initiatives to this end will be explained in the sections that follow.
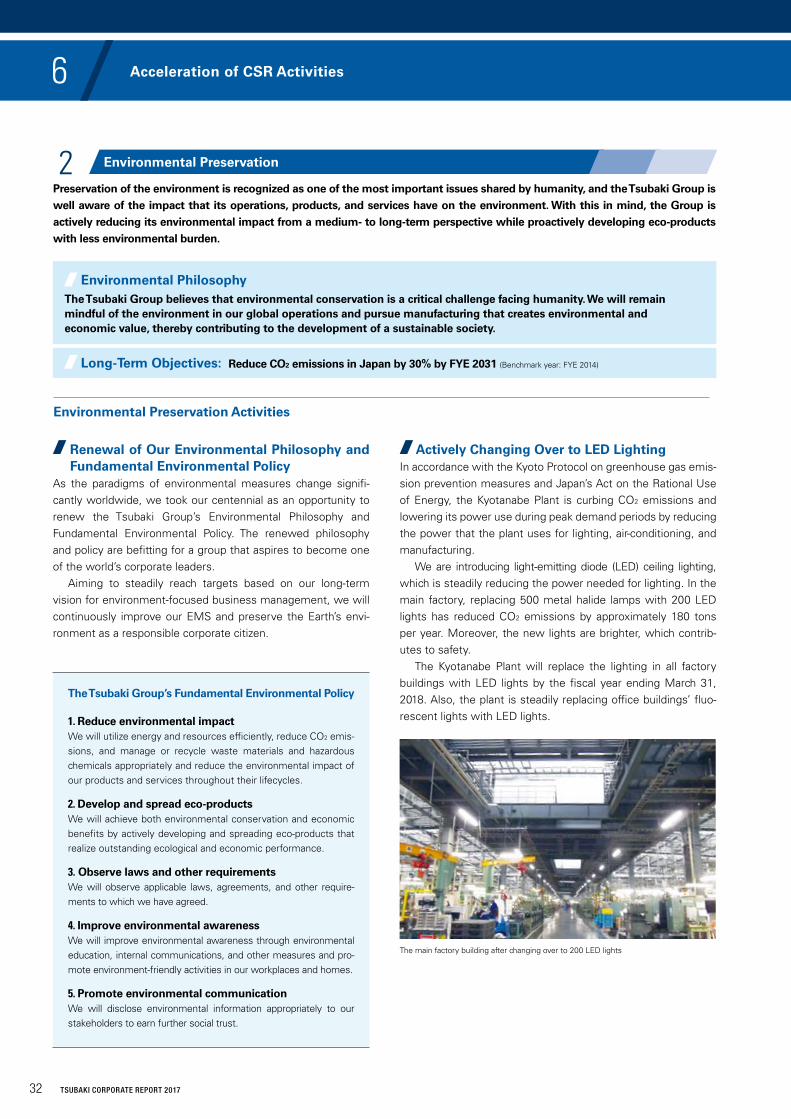
In the fiscal year ended March 31, 2017, 54.9% of the Group’s total net sales came from overseas, a substantial increase from 37.4% in the fiscal year ended March 31, 2007, demonstrating the rapid globalization of our operations. In addition, the number of Group employees positioned overseas has increased greatly; on March 31, 2017, 52% of the Group’s 7,886 employees (consoli-dated basis) were at overseas subsidiaries. This situation has made the cultivation and strengthening of human resources compatible with globalization a task of extreme
importance for the Group. For this reason, we introduced the global trainee system in the fiscal year ended March 31, 2011. This system allows young employees to be dispatched to overseas subsidiaries for training, and is designed to teach them foreign languages and international business manners as well as help them to better understand other cultures. In addition to dispatching domestic employees overseas, we have also begun inviting employees from overseas subsidiaries to undergo training in Japan.
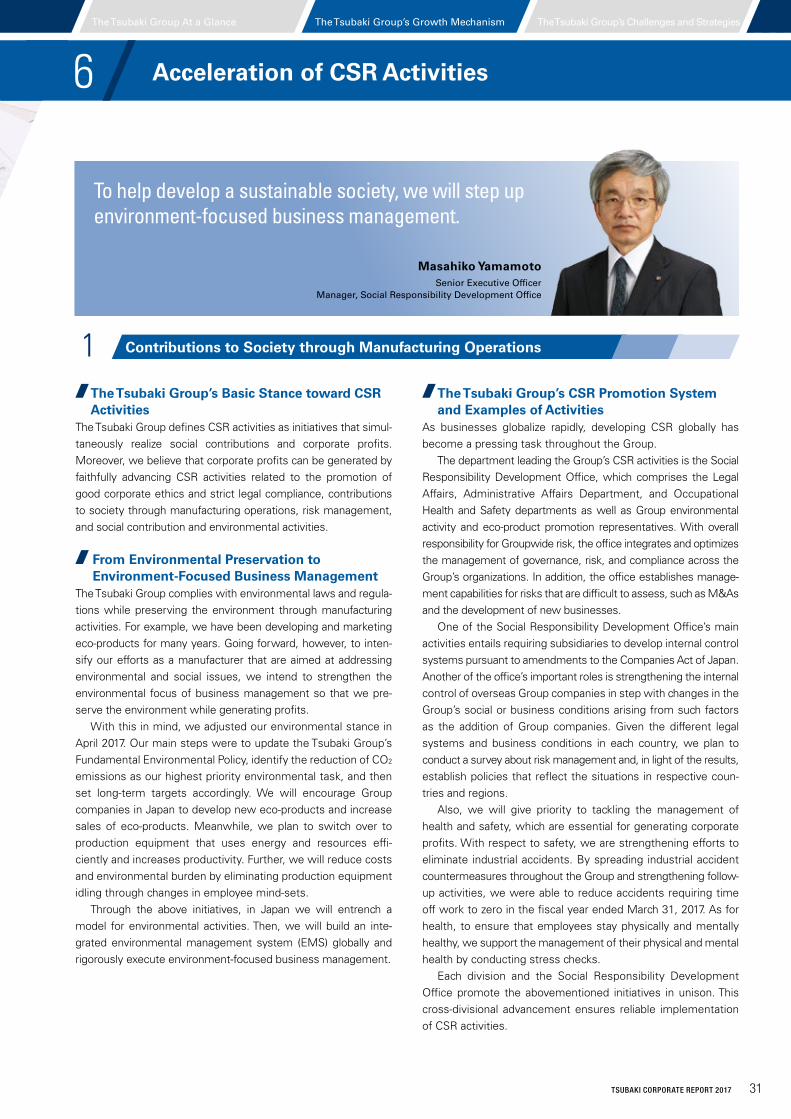
Japan 48%
The Americas 18%
Europe 13%
Indian Ocean Rim 7%
China 11%
3%
Distribution of Employees by Region (As of March 31, 2017)
Employees
7,886
Ongoing Strengthening of Manufacturing Capabilities and Passing On Technical Skills and Expertise to Young Engineers
Strengthening and Cultivation of Human Resources Compatible with Globalization
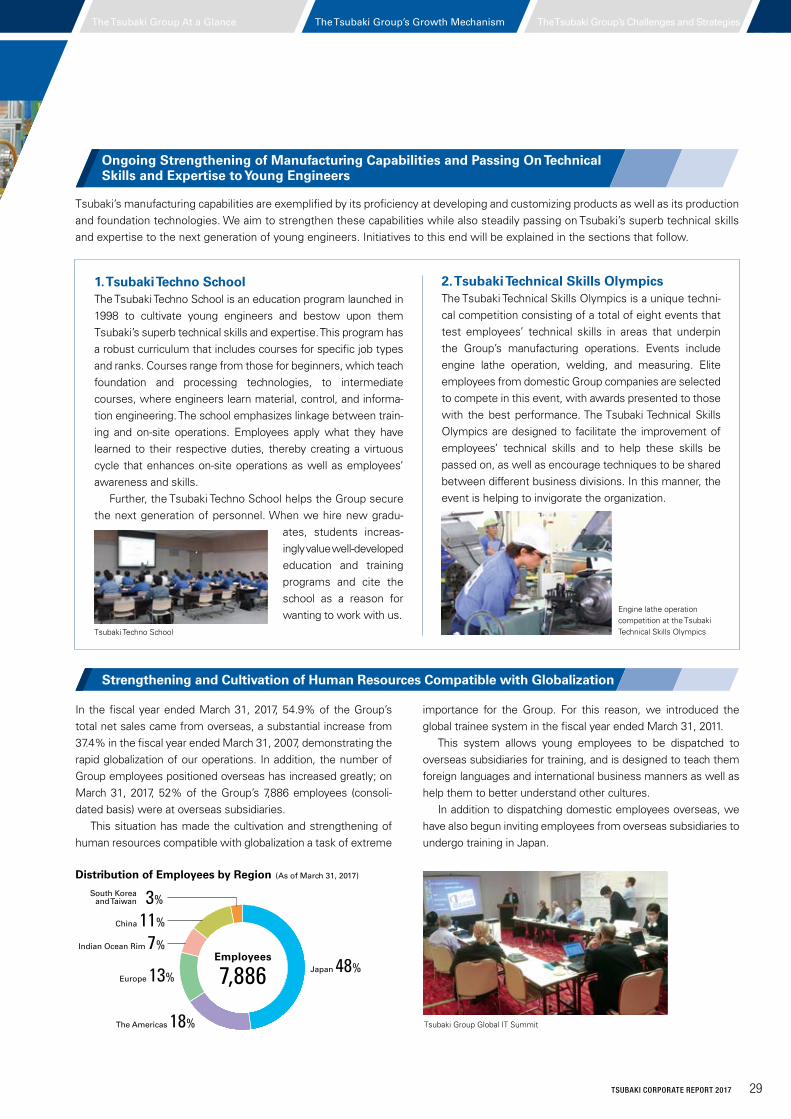
1. Tsubaki Techno SchoolThe Tsubaki Techno School is an education program launched in 1998 to cultivate young engineers and bestow upon them Tsubaki’s superb technical skills and expertise. This program has a robust curriculum that includes courses for specific job types and ranks. Courses range from those for beginners, which teach foundation and processing technologies, to intermediate courses, where engineers learn material, control, and informa-tion engineering. The school emphasizes linkage between train-ing and on-site operations. Employees apply what they have learned to their respective duties, thereby creating a virtuous cycle that enhances on-site operations as well as employees’ awareness and skills. Further, the Tsubaki Techno School helps the Group secure the next generation of personnel. When we hire new gradu-
ates, students increas-ingly value well-developed education and training programs and cite the school as a reason for wanting to work with us.
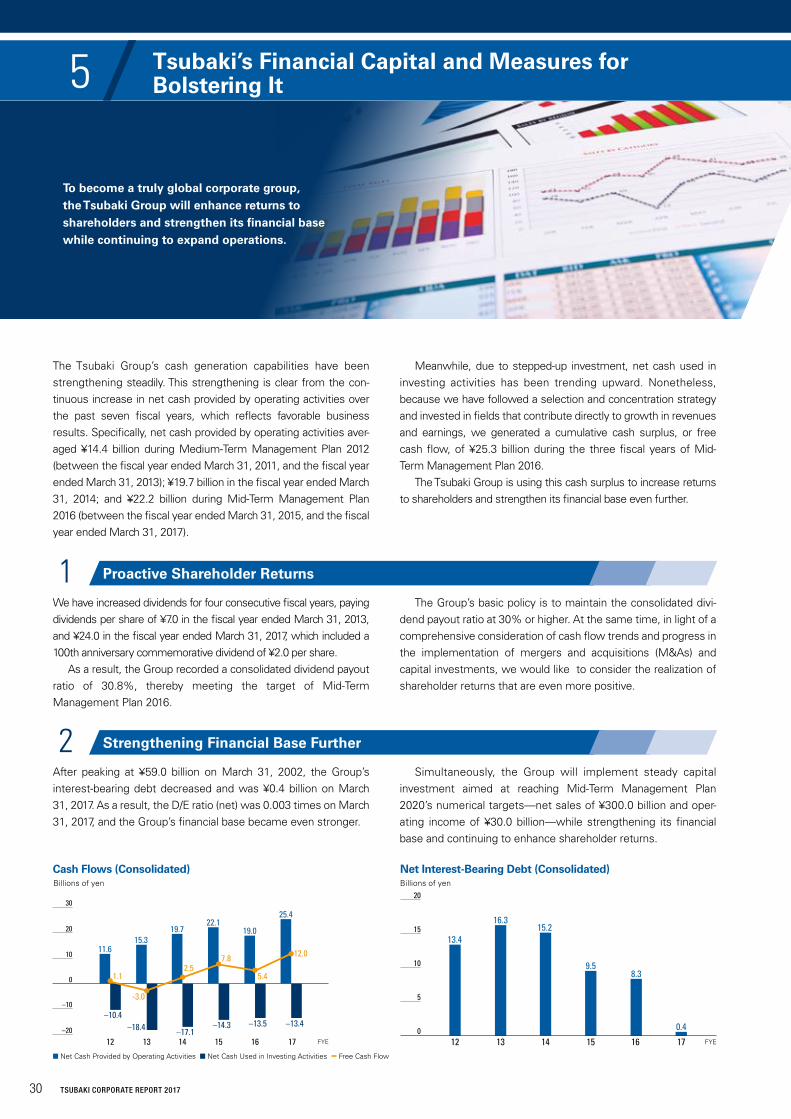
2. Tsubaki Technical Skills OlympicsThe Tsubaki Technical Skills Olympics is a unique techni-cal competition consisting of a total of eight events that test employees’ technical skills in areas that underpin the Group’s manufacturing operations. Events include engine lathe operation, welding, and measuring. Elite employees from domestic Group companies are selected to compete in this event, with awards presented to those with the best performance. The Tsubaki Technical Skills Olympics are designed to facilitate the improvement of employees’ technical skills and to help these skills be passed on, as well as encourage techniques to be shared between different business divisions. In this manner, the event is helping to invigorate the organization.
South Korea and Taiwan
Engine lathe operation competition at the Tsubaki Technical Skills Olympics
Tsubaki Group Global IT Summit
Tsubaki Techno School
The Tsubaki Group’s Growth Mechanism The Tsubaki Group’s Challenges and StrategiesThe Tsubaki Group At a Glance
29TSUBAKI CORPORATE REPORT 2017
Cultivation and Strengthening of Tsubaki’s Human Resources
The Tsubaki Group’s cash generation capabilities have been strengthening steadily. This strengthening is clear from the con-tinuous increase in net cash provided by operating activities over the past seven fiscal years, which reflects favorable business results. Specifically, net cash provided by operating activities aver-aged ¥14.4 billion during Medium-Term Management Plan 2012 (between the fiscal year ended March 31, 2011, and the fiscal year ended March 31, 2013); ¥19.7 billion in the fiscal year ended March 31, 2014; and ¥22.2 billion during Mid-Term Management Plan 2016 (between the fiscal year ended March 31, 2015, and the fiscal year ended March 31, 2017).
We have increased dividends for four consecutive fiscal years, paying dividends per share of ¥7.0 in the fiscal year ended March 31, 2013, and ¥24.0 in the fiscal year ended March 31, 2017, which included a 100th anniversary commemorative dividend of ¥2.0 per share. As a result, the Group recorded a consolidated dividend payout ratio of 30.8%, thereby meeting the target of Mid-Term Management Plan 2016.
After peaking at ¥59.0 billion on March 31, 2002, the Group’s interest-bearing debt decreased and was ¥0.4 billion on March 31, 2017. As a result, the D/E ratio (net) was 0.003 times on March 31, 2017, and the Group’s financial base became even stronger.
Meanwhile, due to stepped-up investment, net cash used in investing activities has been trending upward. Nonetheless, because we have followed a selection and concentration strategy and invested in fields that contribute directly to growth in revenues and earnings, we generated a cumulative cash surplus, or free cash flow, of ¥25.3 billion during the three fiscal years of Mid-Term Management Plan 2016. The Tsubaki Group is using this cash surplus to increase returns to shareholders and strengthen its financial base even further.
The Group’s basic policy is to maintain the consolidated divi-dend payout ratio at 30% or higher. At the same time, in light of a comprehensive consideration of cash flow trends and progress in the implementation of mergers and acquisitions (M&As) and capital investments, we would like to consider the realization of shareholder returns that are even more positive.
Simultaneously, the Group will implement steady capital investment aimed at reaching Mid-Term Management Plan 2020’s numerical targets—net sales of ¥300.0 billion and oper-ating income of ¥30.0 billion—while strengthening its financial base and continuing to enhance shareholder returns.
13.4
9.58.3
0.4
16.315.2
0
20
15
10
5
16 1715141312 FYE
n Net Cash Provided by Operating Activities n Net Cash Used in Investing Activities n Free Cash Flow
Net Interest-Bearing Debt (Consolidated)Cash Flows (Consolidated)Billions of yenBillions of yen
–20
30
20
10
0
–10
16 1715141312 FYE
–10.4–18.4 –17.1
–14.3 –13.5 –13.4
11.615.3
19.722.1
19.0
25.4
1.1
-3.0
2.57.8
5.4
12.0
5 Tsubaki’s Financial Capital and Measures for Bolstering It
To become a truly global corporate group, the Tsubaki Group will enhance returns to shareholders and strengthen its financial base while continuing to expand operations.
Proactive Shareholder Returns1
Strengthening Financial Base Further2
30 TSUBAKI CORPORATE REPORT 2017
The Tsubaki Group’s Basic Stance toward CSR Activities
The Tsubaki Group defines CSR activities as initiatives that simul-taneously realize social contributions and corporate profits. Moreover, we believe that corporate profits can be generated by faithfully advancing CSR activities related to the promotion of good corporate ethics and strict legal compliance, contributions to society through manufacturing operations, risk management, and social contribution and environmental activities.
From Environmental Preservation to Environment-Focused Business Management
The Tsubaki Group complies with environmental laws and regula-tions while preserving the environment through manufacturing activities. For example, we have been developing and marketing eco-products for many years. Going forward, however, to inten-sify our efforts as a manufacturer that are aimed at addressing environmental and social issues, we intend to strengthen the environmental focus of business management so that we pre-serve the environment while generating profits. With this in mind, we adjusted our environmental stance in April 2017. Our main steps were to update the Tsubaki Group’s Fundamental Environmental Policy, identify the reduction of CO2 emissions as our highest priority environmental task, and then set long-term targets accordingly. We will encourage Group companies in Japan to develop new eco-products and increase sales of eco-products. Meanwhile, we plan to switch over to production equipment that uses energy and resources effi-ciently and increases productivity. Further, we will reduce costs and environmental burden by eliminating production equipment idling through changes in employee mind-sets. Through the above initiatives, in Japan we will entrench a model for environmental activities. Then, we will build an inte-grated environmental management system (EMS) globally and rigorously execute environment-focused business management.
The Tsubaki Group’s CSR Promotion System and Examples of Activities
As businesses globalize rapidly, developing CSR globally has become a pressing task throughout the Group. The department leading the Group’s CSR activities is the Social Responsibility Development Office, which comprises the Legal Affairs, Administrative Affairs Department, and Occupational Health and Safety departments as well as Group environmental activity and eco-product promotion representatives. With overall responsibility for Groupwide risk, the office integrates and optimizes the management of governance, risk, and compliance across the Group’s organizations. In addition, the office establishes manage-ment capabilities for risks that are difficult to assess, such as M&As and the development of new businesses. One of the Social Responsibility Development Office’s main activities entails requiring subsidiaries to develop internal control systems pursuant to amendments to the Companies Act of Japan. Another of the office’s important roles is strengthening the internal control of overseas Group companies in step with changes in the Group’s social or business conditions arising from such factors as the addition of Group companies. Given the different legal systems and business conditions in each country, we plan to conduct a survey about risk management and, in light of the results, establish policies that reflect the situations in respective coun-tries and regions. Also, we will give priority to tackling the management of health and safety, which are essential for generating corporate profits. With respect to safety, we are strengthening efforts to eliminate industrial accidents. By spreading industrial accident countermeasures throughout the Group and strengthening follow-up activities, we were able to reduce accidents requiring time off work to zero in the fiscal year ended March 31, 2017. As for health, to ensure that employees stay physically and mentally healthy, we support the management of their physical and mental health by conducting stress checks. Each division and the Social Responsibility Development Office promote the abovementioned initiatives in unison. This cross-divisional advancement ensures reliable implementation of CSR activities.
Masahiko YamamotoSenior Executive Officer
Manager, Social Responsibility Development Office
To help develop a sustainable society, we will step up environment-focused business management.
Contributions to Society through Manufacturing Operations1
The Tsubaki Group’s Growth Mechanism The Tsubaki Group’s Challenges and StrategiesThe Tsubaki Group At a Glance
31TSUBAKI CORPORATE REPORT 2017
6 Acceleration of CSR Activities
Environmental Philosophy
Long-Term Objectives:
The Tsubaki Group believes that environmental conservation is a critical challenge facing humanity. We will remain mindful of the environment in our global operations and pursue manufacturing that creates environmental and economic value, thereby contributing to the development of a sustainable society.
Reduce CO2 emissions in Japan by 30% by FYE 2031 (Benchmark year: FYE 2014)
Renewal of Our Environmental Philosophy and Fundamental Environmental Policy
As the paradigms of environmental measures change signifi-cantly worldwide, we took our centennial as an opportunity to renew the Tsubaki Group’s Environmental Philosophy and Fundamental Environmental Policy. The renewed philosophy and policy are befitting for a group that aspires to become one of the world’s corporate leaders. Aiming to steadily reach targets based on our long-term vision for environment-focused business management, we will continuously improve our EMS and preserve the Earth’s envi-ronment as a responsible corporate citizen.
Actively Changing Over to LED LightingIn accordance with the Kyoto Protocol on greenhouse gas emis-sion prevention measures and Japan’s Act on the Rational Use of Energy, the Kyotanabe Plant is curbing CO2 emissions and lowering its power use during peak demand periods by reducing the power that the plant uses for lighting, air-conditioning, and manufacturing. We are introducing light-emitting diode (LED) ceiling lighting, which is steadily reducing the power needed for lighting. In the main factory, replacing 500 metal halide lamps with 200 LED lights has reduced CO2 emissions by approximately 180 tons per year. Moreover, the new lights are brighter, which contrib-utes to safety. The Kyotanabe Plant will replace the lighting in all factory buildings with LED lights by the fiscal year ending March 31, 2018. Also, the plant is steadily replacing office buildings’ fluo-rescent lights with LED lights.
Preservation of the environment is recognized as one of the most important issues shared by humanity, and the Tsubaki Group is well aware of the impact that its operations, products, and services have on the environment. With this in mind, the Group is actively reducing its environmental impact from a medium- to long-term perspective while proactively developing eco-products with less environmental burden.
Environmental Preservation Activities
The Tsubaki Group’s Fundamental Environmental Policy
1. Reduce environmental impactWe will utilize energy and resources efficiently, reduce CO2 emis-sions, and manage or recycle waste materials and hazardous chemicals appropriately and reduce the environmental impact of our products and services throughout their lifecycles.
2. Develop and spread eco-productsWe will achieve both environmental conservation and economic benefits by actively developing and spreading eco-products that realize outstanding ecological and economic performance.
3. Observe laws and other requirementsWe will observe applicable laws, agreements, and other require-ments to which we have agreed.
4. Improve environmental awarenessWe will improve environmental awareness through environmental education, internal communications, and other measures and pro-mote environment-friendly activities in our workplaces and homes.
5. Promote environmental communicationWe will disclose environmental information appropriately to our stakeholders to earn further social trust.
The main factory building after changing over to 200 LED lights
2 Environmental Preservation
32 TSUBAKI CORPORATE REPORT 2017
6 Acceleration of CSR Activities
Thousands of yen
Classification Details of major initiativesFYE 2017
Amount invested Costs
(1) Business area costs 358,196 440,794
Break-down
(1) - 1 Pollution prevention costsIntroduction, operation, and management of air pollution prevention facilities and wastewater treatment facilities
37,838 133,737
(1) - 2 Global environmental preservation costs
Introduction, operation, and management of electricity control systems 320,358 158,996
(1) - 3 Resource recycling costsWaste processing/recycling expenses, improvement of industrial waste storage facilities
0 148,062
(2) Upstream/downstream costs Outsourcing analysis costs, such as for substances with environmental impact 598 181
(3) Administration costsEstablishment and operation of environmental management systems (EMSs), worksite greening and maintenance, installation of air and water measurement equipment
113 244,670
(4) R&D costsR&D of environment-friendly products (reduction of environmental burden during product use)
2,128 126,591
(5) Social activity costs Regional environmental preservation initiatives 0 1,277
(6) Environmental remediation costs Groundwater purification measures, etc. 0 0
Total 361,035 813,513
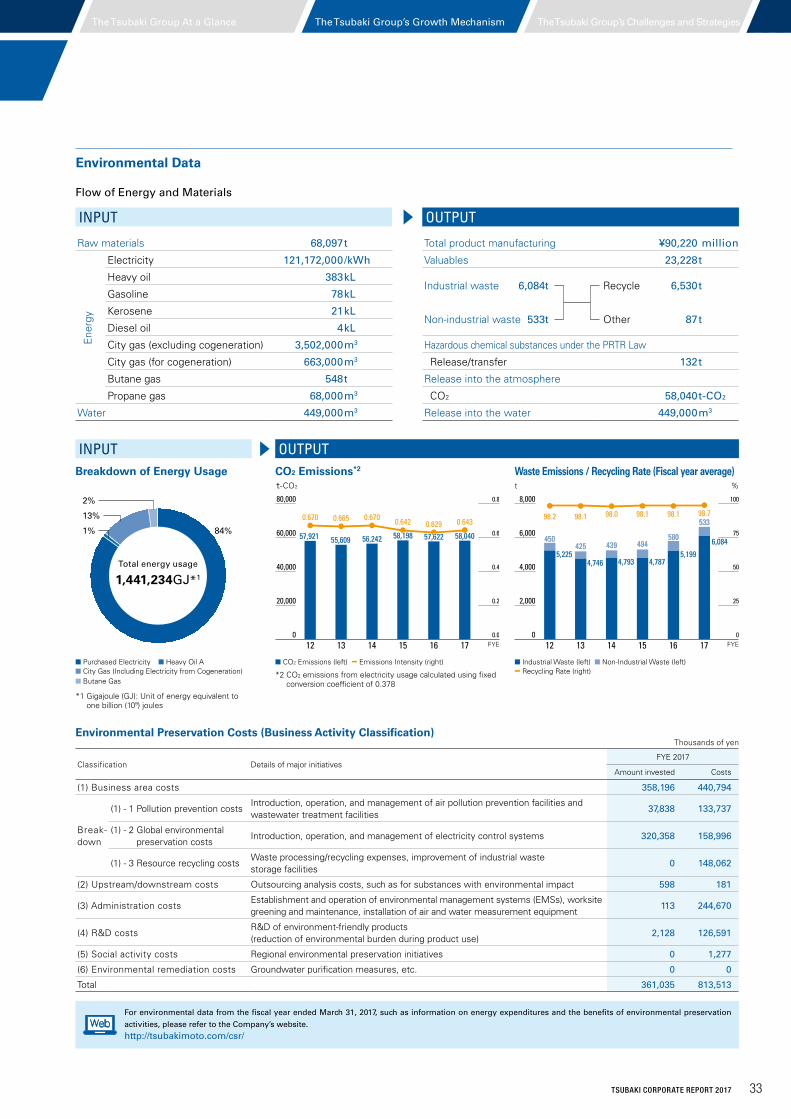
Raw materials 68,097t
Electricity 121,172,000/kWh
Heavy oil 383kL
Gasoline 78kL
Kerosene 21kL
Diesel oil 4kL
City gas (excluding cogeneration) 3,502,000m3
City gas (for cogeneration) 663,000m3
Butane gas 548t
Propane gas 68,000m3
Water 449,000m3
Flow of Energy and Materials
Ene
rgy
CO2 Emissions*2
t-CO2
Waste Emissions / Recycling Rate (Fiscal year average)t %
0
20,000
40,000
60,000
80,000
0.6430.670 0.6700.665
58,04058,04057,92157,921 55,60955,609 56,24256,242 58,19858,198
0.642
57,62257,622
0.629
FYE13 15 161412 17
0.8
0.6
0.4
0.2
0.0
n Purchased Electricity n Heavy Oil An City Gas (Including Electricity from Cogeneration)n Butane Gas
*1 Gigajoule (GJ): Unit of energy equivalent to one billion (109) joules
84%1%
13%
2%
n CO2 Emissions (left) n Emissions Intensity (right)
*2 CO2 emissions from electricity usage calculated using fixed conversion coefficient of 0.378
n Industrial Waste (left) n Non-Industrial Waste (left)n Recycling Rate (right)
INPUT
INPUT
OUTPUT
OUTPUT
Total product manufacturing ¥90,220 million
Valuables 23,228t
Industrial waste 6,084t Recycle 6,530t
Non-industrial waste 533t Other 87t
Hazardous chemical substances under the PRTR Law
Release/transfer 132t
Release into the atmosphere
CO2 58,040t-CO2
Release into the water 449,000m3
Total energy usage
1,441,234GJ*1
Environmental Data
Breakdown of Energy Usage
Environmental Preservation Costs (Business Activity Classification)
For environmental data from the fiscal year ended March 31, 2017, such as information on energy expenditures and the benefits of environmental preservation
activities, please refer to the Company’s website.
http://tsubakimoto.com/csr/
0
2,000
4,000
6,000
8,000
5,2255,225
450450
4,7464,746
425425
4,7934,793
439439
4,7874,787
4944945,1995,199
6,0846,084
533533
580580
98.2 98.1 98.0 98.1 98.1 98.7
0
25
50
75
100
FYE13 15 161412 17
The Tsubaki Group’s Growth Mechanism The Tsubaki Group’s Challenges and StrategiesThe Tsubaki Group At a Glance
33TSUBAKI CORPORATE REPORT 2017
Basic PolicyThe Tsubaki Group’s Mission Statement inspires us to act as a good corporate citizen based on an accurate understanding of the customs in the regions and countries in which we operate. In accordance with this mission, we are working to build trusting relationships with the communities through social contribution activities matched to their needs. In the future, we will incorporate creating shared value concepts into our CSR initiatives as we conduct ongoing social contribution activities.
Initiatives in JapanThe Tsubaki Group does not limit itself simply to complying with laws and social rules. Rather, we go a step further, working to build strong partnerships with local communities. Tertiary indus-tries account for nearly 70% of Japan’s working population. In recognition of this fact, we are encouraging people to find out more about and feel more familiar with the manufacturing industry by providing factory tours as well as work experience programs for elementary and junior high school students. In addition, we are forging bonds by acting as a member of local communities, opening factory grounds for local residents during seasonal events and otherwise reaching out to the community.
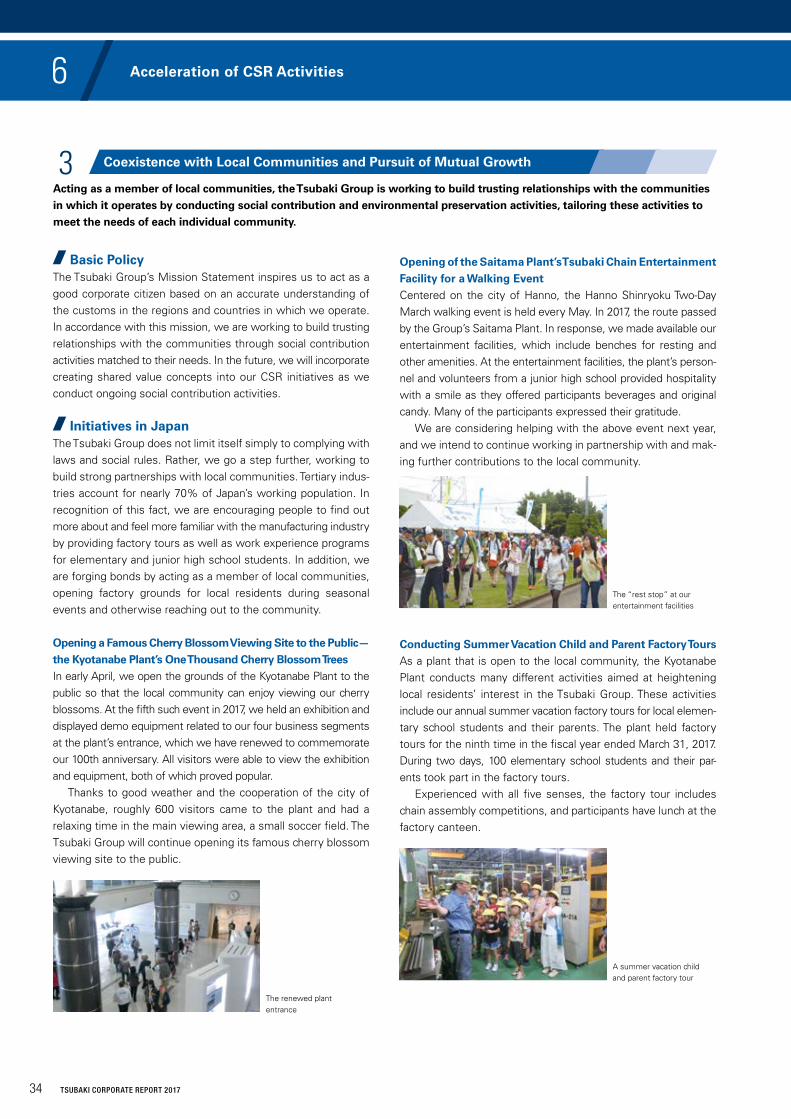
Opening a Famous Cherry Blossom Viewing Site to the Public—the Kyotanabe Plant’s One Thousand Cherry Blossom TreesIn early April, we open the grounds of the Kyotanabe Plant to the public so that the local community can enjoy viewing our cherry blossoms. At the fifth such event in 2017, we held an exhibition and displayed demo equipment related to our four business segments at the plant’s entrance, which we have renewed to commemorate our 100th anniversary. All visitors were able to view the exhibition and equipment, both of which proved popular. Thanks to good weather and the cooperation of the city of Kyotanabe, roughly 600 visitors came to the plant and had a relaxing time in the main viewing area, a small soccer field. The Tsubaki Group will continue opening its famous cherry blossom viewing site to the public.
The renewed plant entrance
Opening of the Saitama Plant’s Tsubaki Chain Entertainment Facility for a Walking EventCentered on the city of Hanno, the Hanno Shinryoku Two-Day March walking event is held every May. In 2017, the route passed by the Group’s Saitama Plant. In response, we made available our entertainment facilities, which include benches for resting and other amenities. At the entertainment facilities, the plant’s person-nel and volunteers from a junior high school provided hospitality with a smile as they offered participants beverages and original candy. Many of the participants expressed their gratitude. We are considering helping with the above event next year, and we intend to continue working in partnership with and mak-ing further contributions to the local community.
The “rest stop” at our entertainment facilities
Conducting Summer Vacation Child and Parent Factory ToursAs a plant that is open to the local community, the Kyotanabe Plant conducts many different activities aimed at heightening local residents’ interest in the Tsubaki Group. These activities include our annual summer vacation factory tours for local elemen-tary school students and their parents. The plant held factory tours for the ninth time in the fiscal year ended March 31, 2017. During two days, 100 elementary school students and their par-ents took part in the factory tours. Experienced with all five senses, the factory tour includes chain assembly competitions, and participants have lunch at the factory canteen.
A summer vacation child and parent factory tour
Acting as a member of local communities, the Tsubaki Group is working to build trusting relationships with the communities in which it operates by conducting social contribution and environmental preservation activities, tailoring these activities to meet the needs of each individual community.
3 Coexistence with Local Communities and Pursuit of Mutual Growth
34 TSUBAKI CORPORATE REPORT 2017
6 Acceleration of CSR Activities
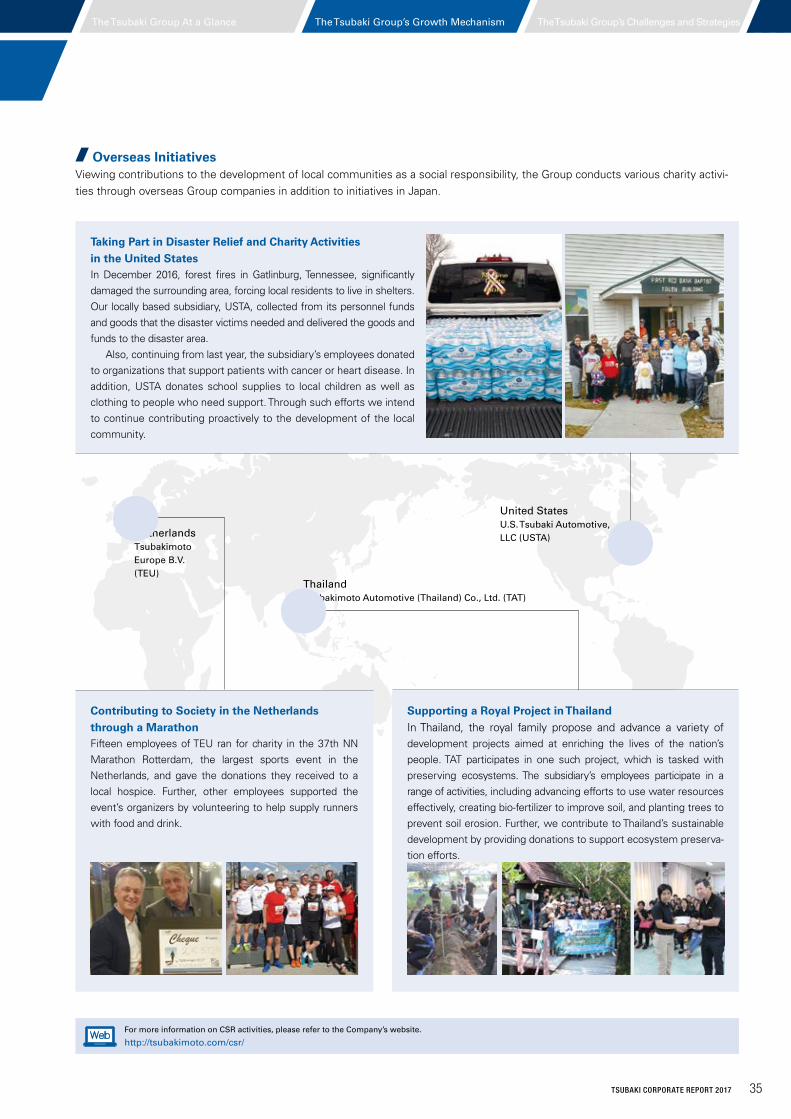
Overseas InitiativesViewing contributions to the development of local communities as a social responsibility, the Group conducts various charity activi-ties through overseas Group companies in addition to initiatives in Japan.
Taking Part in Disaster Relief and Charity Activities in the United StatesIn December 2016, forest fires in Gatlinburg, Tennessee, significantly damaged the surrounding area, forcing local residents to live in shelters. Our locally based subsidiary, USTA, collected from its personnel funds and goods that the disaster victims needed and delivered the goods and funds to the disaster area. Also, continuing from last year, the subsidiary’s employees donated to organizations that support patients with cancer or heart disease. In addition, USTA donates school supplies to local children as well as clothing to people who need support. Through such efforts we intend to continue contributing proactively to the development of the local community.
Supporting a Royal Project in ThailandIn Thailand, the royal family propose and advance a variety of development projects aimed at enriching the lives of the nation’s people. TAT participates in one such project, which is tasked with preserving ecosystems. The subsidiary’s employees participate in a range of activities, including advancing efforts to use water resources effectively, creating bio-fertilizer to improve soil, and planting trees to prevent soil erosion. Further, we contribute to Thailand’s sustainable development by providing donations to support ecosystem preserva-tion efforts.
Contributing to Society in the Netherlands through a MarathonFifteen employees of TEU ran for charity in the 37th NN Marathon Rotterdam, the largest sports event in the Netherlands, and gave the donations they received to a local hospice. Further, other employees supported the event’s organizers by volunteering to help supply runners with food and drink.
NetherlandsTsubakimoto Europe B.V.(TEU)
United StatesU.S. Tsubaki Automotive,LLC (USTA)
ThailandTsubakimoto Automotive (Thailand) Co., Ltd. (TAT)
For more information on CSR activities, please refer to the Company’s website.
http://tsubakimoto.com/csr/
The Tsubaki Group’s Growth Mechanism The Tsubaki Group’s Challenges and StrategiesThe Tsubaki Group At a Glance
35TSUBAKI CORPORATE REPORT 2017
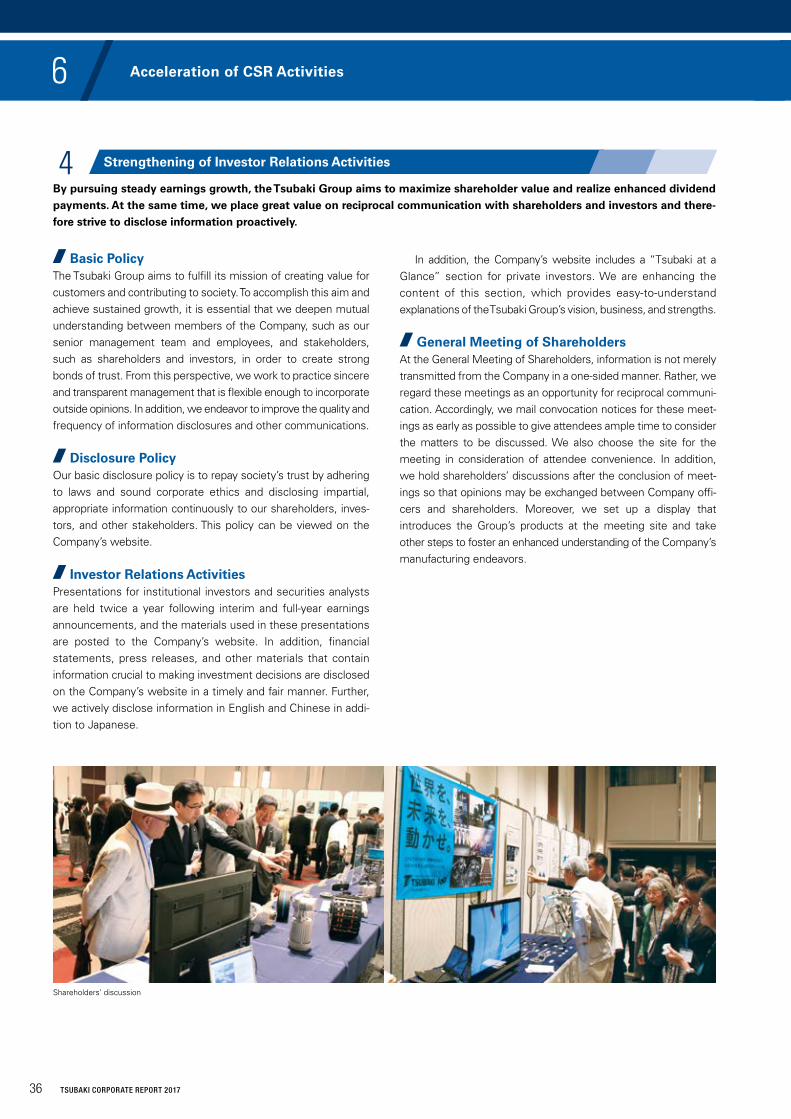
Basic PolicyThe Tsubaki Group aims to fulfill its mission of creating value for customers and contributing to society. To accomplish this aim and achieve sustained growth, it is essential that we deepen mutual understanding between members of the Company, such as our senior management team and employees, and stakeholders, such as shareholders and investors, in order to create strong bonds of trust. From this perspective, we work to practice sincere and transparent management that is flexible enough to incorporate outside opinions. In addition, we endeavor to improve the quality and frequency of information disclosures and other communications.
Disclosure PolicyOur basic disclosure policy is to repay society’s trust by adhering to laws and sound corporate ethics and disclosing impartial, appropriate information continuously to our shareholders, inves-tors, and other stakeholders. This policy can be viewed on the Company’s website.
Investor Relations ActivitiesPresentations for institutional investors and securities analysts are held twice a year following interim and full-year earnings announcements, and the materials used in these presentations are posted to the Company’s website. In addition, financial statements, press releases, and other materials that contain information crucial to making investment decisions are disclosed on the Company’s website in a timely and fair manner. Further, we actively disclose information in English and Chinese in addi-tion to Japanese.
In addition, the Company’s website includes a “Tsubaki at a Glance” section for private investors. We are enhancing the content of this section, which provides easy-to-understand explanations of the Tsubaki Group’s vision, business, and strengths.
General Meeting of ShareholdersAt the General Meeting of Shareholders, information is not merely transmitted from the Company in a one-sided manner. Rather, we regard these meetings as an opportunity for reciprocal communi-cation. Accordingly, we mail convocation notices for these meet-ings as early as possible to give attendees ample time to consider the matters to be discussed. We also choose the site for the meeting in consideration of attendee convenience. In addition, we hold shareholders’ discussions after the conclusion of meet-ings so that opinions may be exchanged between Company offi-cers and shareholders. Moreover, we set up a display that introduces the Group’s products at the meeting site and take other steps to foster an enhanced understanding of the Company’s manufacturing endeavors.
Shareholders’ discussion
By pursuing steady earnings growth, the Tsubaki Group aims to maximize shareholder value and realize enhanced dividend payments. At the same time, we place great value on reciprocal communication with shareholders and investors and there-fore strive to disclose information proactively.
4 Strengthening of Investor Relations Activities
36 TSUBAKI CORPORATE REPORT 2017
6 Acceleration of CSR Activities
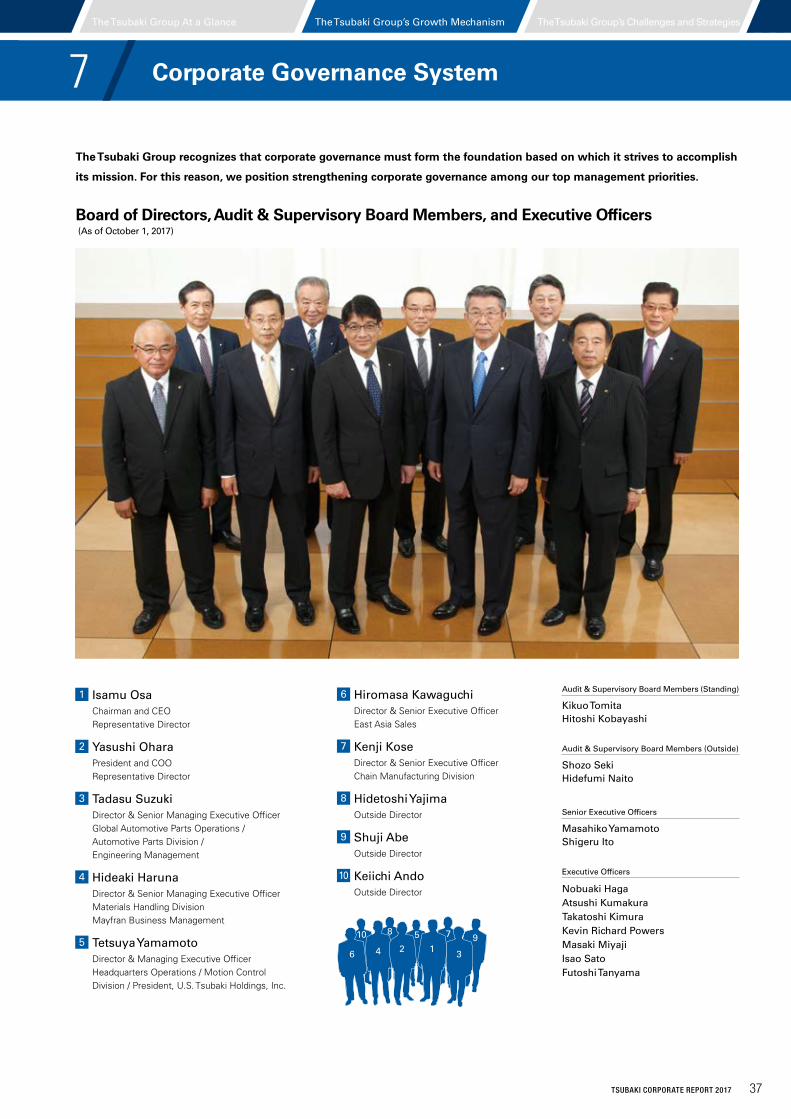
1 Isamu Osa Chairman and CEO
Representative Director
2 Yasushi Ohara President and COO
Representative Director
3 Tadasu Suzuki Director & Senior Managing Executive Officer
Global Automotive Parts Operations / Automotive Parts Division / Engineering Management
4 Hideaki Haruna Director & Senior Managing Executive Officer
Materials Handling Division Mayfran Business Management
5 Tetsuya Yamamoto Director & Managing Executive Officer
Headquarters Operations / Motion Control Division / President, U.S. Tsubaki Holdings, Inc.
6 Hiromasa Kawaguchi Director & Senior Executive Officer
East Asia Sales
7 Kenji Kose Director & Senior Executive Officer
Chain Manufacturing Division
8 Hidetoshi Yajima Outside Director
9 Shuji Abe Outside Director
10 Keiichi Ando Outside Director
Audit & Supervisory Board Members (Standing)
Kikuo TomitaHitoshi Kobayashi
Audit & Supervisory Board Members (Outside)
Shozo SekiHidefumi Naito
Senior Executive Officers
Masahiko YamamotoShigeru Ito
Executive Officers
Nobuaki Haga Atsushi Kumakura Takatoshi Kimura Kevin Richard Powers Masaki Miyaji Isao Sato Futoshi Tanyama
The Tsubaki Group recognizes that corporate governance must form the foundation based on which it strives to accomplish
its mission. For this reason, we position strengthening corporate governance among our top management priorities.
Board of Directors, Audit & Supervisory Board Members, and Executive Officers (As of October 1, 2017)
2 1 34
10 5
6
789
The Tsubaki Group’s Growth Mechanism The Tsubaki Group’s Challenges and StrategiesThe Tsubaki Group At a Glance
37TSUBAKI CORPORATE REPORT 2017
7 Corporate Governance System
The Tsubaki Group regards strengthening corporate gover-nance to realize its mission of creating value for customers and contributing to society as one of the most important tasks of business management.
Basic PolicyEnsuring the Rights and Equality of ShareholdersWe will respect the rights of shareholders, ensure the equal-ity of shareholders, and establish conditions to facilitate the appropriate exercise of rights.
Appropriate Cooperation with Stakeholders Other than ShareholdersWe will maintain and enhance relationships of trust with all stake-holders based on the “Tsubaki Spirit” corporate philosophy.
Ensuring Appropriate Disclosure and TransparencyWe have defined our basic disclosure policy as providing our shareholders, investors, and other stakeholders with timely, impartial, accurate, and continuous disclosure of information. This policy can be viewed on the Company’s website.
http://www.tsubakimoto.jp/ (in Japanese only)
Responsibilities of the Board of Directors and Other MattersAiming to heighten competitiveness amid volatile business condi-tions and to ensure the legal compliance, efficiency, and transpar-ency of business management, we introduced an executive officer system. Under this system, we have been working to enhance and expedite the decision-making of the Board of Directors, strengthen the execution and oversight of operations, and increase the efficiency of business management. Further, through the appointment of outside directors and outside Audit & Supervisory Board members, we are endeav-oring to strengthen the oversight of business management, heighten the transparency of business management, and enhance corporate value.
Dialogue with ShareholdersWe work to practice sincere and transparent management that is flexible enough to incorporate outside opinions. In addition, we endeavor to improve the quality and frequency of information disclosures and other communications.
Strengthening corporate governance
even further and enhancing transpar-
ency of business management
The Group has formulated this basic approach into the basic policy stated below and is working to realize this policy and enhance corporate governance.
3 outside directors among 10 directors
Percentage of outside directors: 30%
FYE 2010
Designated outside Audit & Supervisory Board members as independent officers
FYE 2012
Introduced the Strategy Committee
FYE 2014
Increased the number of outside directors from one to two
FYE 2016
· Reformed management system to separate the roles of CEO and COO
· Responded to Japan’s Corporate Governance Code
FYE 2018
Increased the number of outside directors from two to three(June 29, 2017)
The number of outside directors rose from two to three on June 29, 2017.
Basic Approach to Corporate Governance
Initiatives to Enhance Corporate Governance
Initiatives to Enhance Governance System
38 TSUBAKI CORPORATE REPORT 2017
7 Corporate Governance System
Corporate Governance System (As of October 1, 2017)
Audit
Divisions/Group Companies
Internal Auditing Department
Executive Officers16 (of which 5 serve concurrently as directors)
President & Representative Director
Strategy Committee
Management Committee
Audit & Supervisory Board 4 Audit & Supervisory
Board members
General Meeting of Shareholders
Appointment or dismissal
PromotionAppointment or dismissal, supervision
Placing items on agenda/Report
Placing items on agenda/Report
ReportInstruct/Supervise
Appointment or dismissal, supervision
Appointment or dismissal
Appointment or dismissal
Cooperate Cooperate
Audit
Audit
Cooperate
Board of Directors 10 directors
Independent Auditors
Overview of Corporate Governance System (As of June 29, 2017)
Organization system Company with Auditors
Chairman of the Board of Directors President
Number of directors 10 (of which 3 are outside directors)
Number of Audit & Supervisory Board members
4 (of which 2 are outside Audit & Supervisory Board members)
Independent officers 3 outside directors and 2 outside Audit & Supervisory Board members
Meetings of the Board of Directors in the fiscal year ended March 31, 2017 16
Meetings of the Audit & Supervisory Board in the fiscal year ended March 31, 2017 16
Total compensation paid to directors in the fiscal year ended March 31, 2017 (excluding outside directors)
¥317 million paid to 10 directors*
Total compensation paid to Audit & Supervisory Board members in the fiscal year ended March 31, 2017 (excluding outside Audit & Supervisory Board members)
¥65 million paid to 5 Audit & Supervisory Board members* (decided by the Audit & Supervisory Board)
Total compensation paid to outside directors and outside Audit & Supervisory Board members in the fiscal year ended March 31, 2017
¥29 million paid to 5 individuals*
* The abovementioned compensation includes compensation paid to a director and an Audit & Supervisory Board member, both of whom retired following completion of their terms of service at the conclusion of the 107th General Meeting of Shareholders held on June 29, 2016.
Inside Directors 2
Inside Directors 7
Outside Directors 2
Outside Directors 3
Committees established for:
• Risk management• Corporate ethics• Information security• The environment• Quality• Occupational safety
and health, etc.
Internal Control Committee
Decision-Making and Strategy Advancement
At the Tsubaki Group, managerial decisions are conducted by the Board of Directors. In addition, we employ an executive officer system to ensure that measures approved by the Board of Directors are quickly and effectively put into action. Further, in the fiscal year ended March 31, 2016, we undertook a management reform that separated the functions of the CEO and the COO. While the number of members of the Board of Directors can be changed based on business conditions, the Company main-tains the policy of operating with a small number of elite direc-tors, and the Board of Directors had 10 members in the fiscal year ended March 31, 2017. The compactness of the Board of Directors is intended to enable rapid responses to dramatic changes in business conditions. The Strategy Committee has been positioned as the second highest authority in the Company after the Board of Directors. This committee deliberates on and makes decisions regarding impor-tant Groupwide business strategies and management policies. The Company has appointed 16 executive officers, five of which serve concurrently as directors and all of whom possess extensive insight into their respective business field. The extensiveness of the operational execution body compared with the decision-making body is intended to enable executive officers to utilize their exper-tise in respective fields to quickly and appropriately execute the strategies formulated by the Board of Directors.
The Tsubaki Group’s Growth Mechanism The Tsubaki Group’s Challenges and StrategiesThe Tsubaki Group At a Glance
39TSUBAKI CORPORATE REPORT 2017
Further, two of the Group’s four Audit & Supervisory Board members are outside Audit & Supervisory Board members (independent officers). The Group has appointed outside Audit & Supervisory Board members who have expertise and extensive experience as attorneys.
Systems to ensure management transparency and flexibility include appointing three of 10 directors as outside directors. The Tsubaki Group added one of these outside directors in 2017.The Group’s outside directors meet the requirements for outside directors pursuant to the Companies Act of Japan as well as the independence criteria for outside directors (independent officers) that a financial instruments exchange stipulates.
Name Reason for appointmentAttendance at meetings of the Board of Directors in the fiscal year ended March 31, 2017
Hidetoshi YajimaThe Group appointed Mr. Yajima to receive objective advice concerning its focus on tech-nologies, development, and manufacturing as three core areas based on his wealth of in-sight and experience as the manager of a manufacturing company.
Attended 15 of 16 meetings
Shuji AbeThe Group appointed Mr. Abe to receive objective advice concerning its focus on technolo-gies, development, and manufacturing as three core areas based on his wealth of insight and experience as the manager of a manufacturing company.
Attended all 16 meetings
Keiichi Ando The Group appointed Mr. Ando to receive objective advice concerning its overall business manage-ment based on his wealth of insight and experience as the manager of a financial institution.
Not applicable because assumed position on June 29, 2017
Reasons for Appointing Outside Directors (Independent Officers) and Their Attendance at Meetings of the Board of Directors
Reasons for Appointing Outside Audit & Supervisory Board Members (Independent Officers) and Their Attendance at Meetings of the Board of Directors and the Audit & Supervisory Board
Name Reason for appointmentAttendance at meetings of the Board of Directors and the Audit & Supervisory Board in the fiscal year ended March 31, 2017
Shozo SekiThe Group appointed Mr. Seki so that its audit system could benefit from his independent perspective as well as his expertise and knowledge as an attorney.
Board of DirectorsAttended all 13 meetings* Number of meetings held following
his appointment on June 29, 2016
Audit & Supervisory BoardAttended all 26 meetings
Hidefumi Naito The Group appointed Mr. Naito so that its audit system could benefit from his independent perspective as well as his expertise and knowledge as an attorney.
Not applicable because assumed position on June 29, 2017
management benchmarks, the level of market capitalization, and the achievement of priority goals. In addition, the Group abolished bonuses for directors on June 29, 2006, and abolished retirement benefits for directors on June 27, 2008.
Board members when requested. In addition to participating in meetings of the Board of Directors, Audit & Supervisory Board members attend meetings of the Strategy Committee and Management Committee and other important meetings to maintain an understanding of the status of operational execu-tion and supervise proceedings in order to ensure sound and proper management.
The Group has strengthened linkage between the compensation of directors and corporate performance to heighten directors’ motivation to improve it. Under this system, we evaluate the contribution of each director to the improvement of consolidated
Directors and executive officers make reports to Audit & Supervisory Board members whenever deemed necessary. Reports are issued on matters that can seriously impact the Company or Group companies and the status of internal audits in addition to issues that are legally required to be reported. Further, employees are encouraged to quickly submit reports on the execution of their business duties to Audit & Supervisory
System for Heightening the Motivation of Directors
Effective Audits
Systems to Ensure Management Transparency and Flexibility
40 TSUBAKI CORPORATE REPORT 2017
7 Corporate Governance System
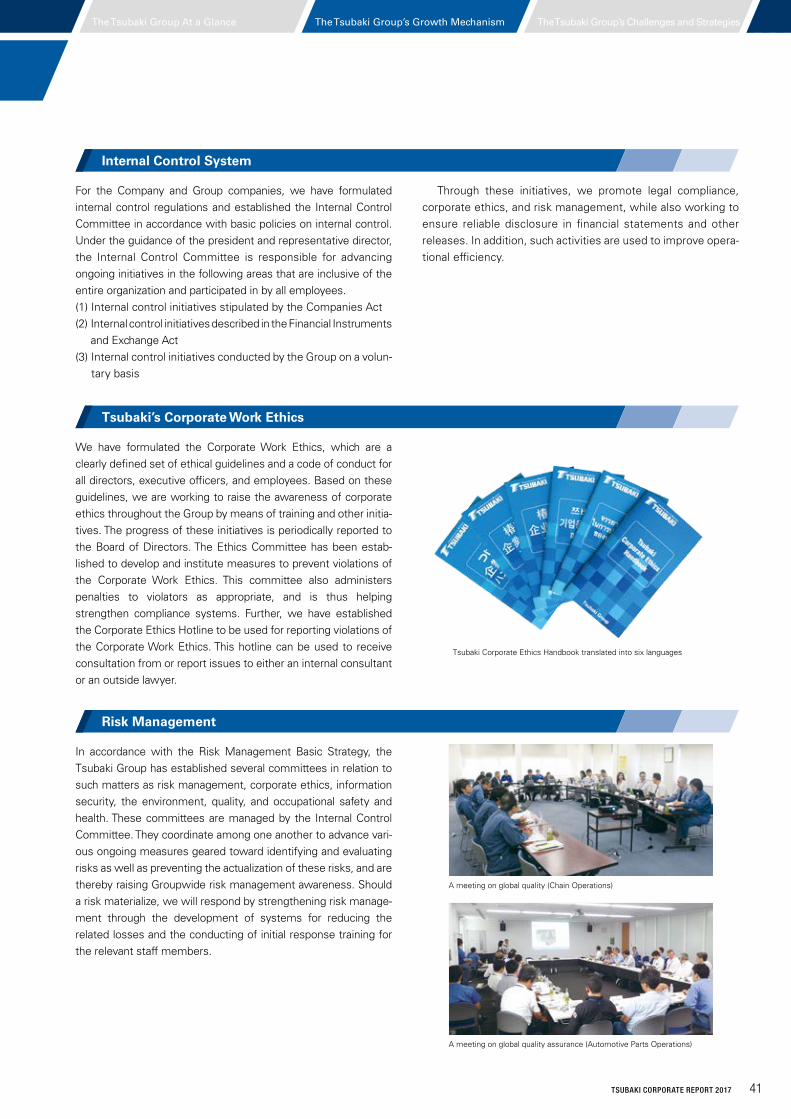
Tsubaki Corporate Ethics Handbook translated into six languages
A meeting on global quality (Chain Operations)
A meeting on global quality assurance (Automotive Parts Operations)
Through these initiatives, we promote legal compliance, corporate ethics, and risk management, while also working to ensure reliable disclosure in financial statements and other releases. In addition, such activities are used to improve opera-tional efficiency.
For the Company and Group companies, we have formulated internal control regulations and established the Internal Control Committee in accordance with basic policies on internal control. Under the guidance of the president and representative director, the Internal Control Committee is responsible for advancing ongoing initiatives in the following areas that are inclusive of the entire organization and participated in by all employees.(1) Internal control initiatives stipulated by the Companies Act(2) Internal control initiatives described in the Financial Instruments
and Exchange Act(3) Internal control initiatives conducted by the Group on a volun-
tary basis
We have formulated the Corporate Work Ethics, which are a clearly defined set of ethical guidelines and a code of conduct for all directors, executive officers, and employees. Based on these guidelines, we are working to raise the awareness of corporate ethics throughout the Group by means of training and other initia-tives. The progress of these initiatives is periodically reported to the Board of Directors. The Ethics Committee has been estab-lished to develop and institute measures to prevent violations of the Corporate Work Ethics. This committee also administers penalties to violators as appropriate, and is thus helping strengthen compliance systems. Further, we have established the Corporate Ethics Hotline to be used for reporting violations of the Corporate Work Ethics. This hotline can be used to receive consultation from or report issues to either an internal consultant or an outside lawyer.
In accordance with the Risk Management Basic Strategy, the Tsubaki Group has established several committees in relation to such matters as risk management, corporate ethics, information security, the environment, quality, and occupational safety and health. These committees are managed by the Internal Control Committee. They coordinate among one another to advance vari-ous ongoing measures geared toward identifying and evaluating risks as well as preventing the actualization of these risks, and are thereby raising Groupwide risk management awareness. Should a risk materialize, we will respond by strengthening risk manage-ment through the development of systems for reducing the related losses and the conducting of initial response training for the relevant staff members.
Internal Control System
Tsubaki’s Corporate Work Ethics
Risk Management
The Tsubaki Group’s Growth Mechanism The Tsubaki Group’s Challenges and StrategiesThe Tsubaki Group At a Glance
41TSUBAKI CORPORATE REPORT 2017
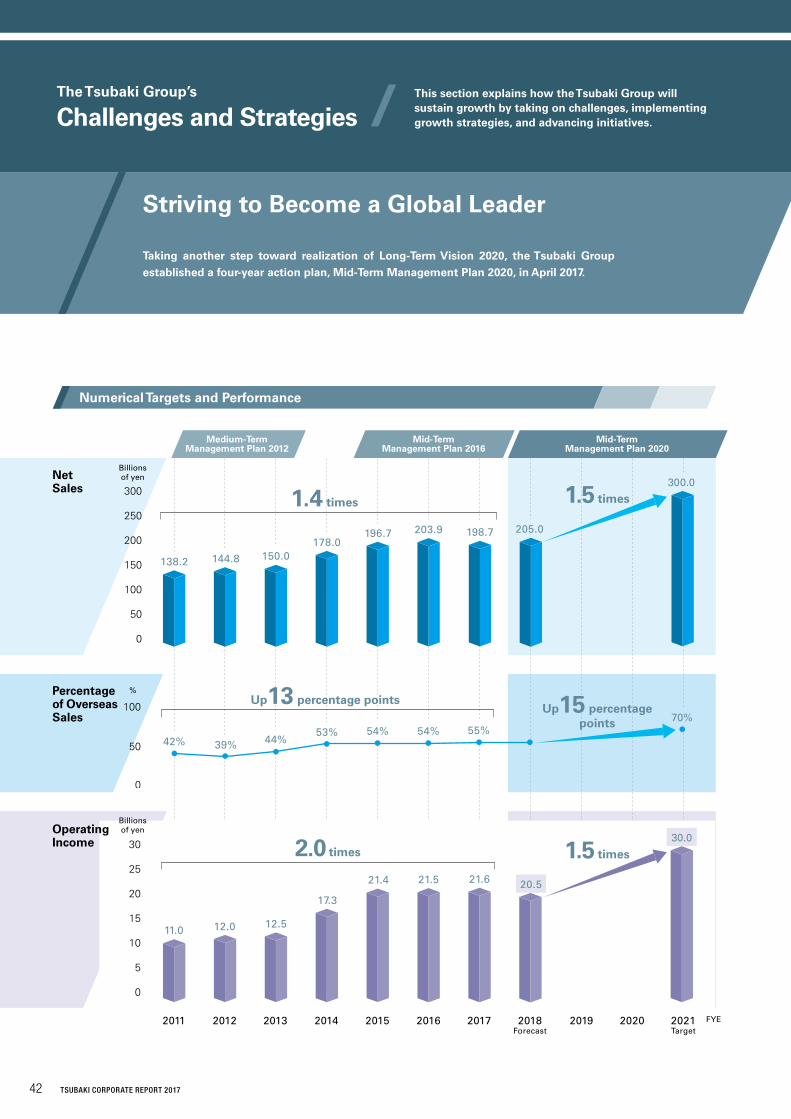
0
500
1,000
1,500
2,000
2,500
3,000
0
50
100
150
200
250
300
0
5
10
15
20
25
30
2011 2012 2013 2014 20172015 2018Forecast
2016 2019 2020
Percentage of Overseas Sales
Operating Income
12.011.0
%
Billions of yen
Billions of yen
12.5
17.3
21.4 21.5 21.6 20.5
300.0
30.0
Medium-Term Management Plan 2012
Mid-Term Management Plan 2016
Mid-Term Management Plan 2020
Net Sales
144.8138.2 150.0178.0
196.7 203.9 198.7 205.0
1.4 times 1.5 times
1.5 times2.0 times
0
50
100Up13 percentage points
44%39%42%53% 54% 54% 55%
70%Up15 percentage
points
Taking another step toward realization of Long-Term Vision 2020, the Tsubaki Group established a four-year action plan, Mid-Term Management Plan 2020, in April 2017.
Numerical Targets and Performance
2021Target
FYE
42 TSUBAKI CORPORATE REPORT 2017
The Tsubaki Group’s
Challenges and StrategiesThis section explains how the Tsubaki Group will sustain growth by taking on challenges, implementing growth strategies, and advancing initiatives.
Striving to Become a Global Leader
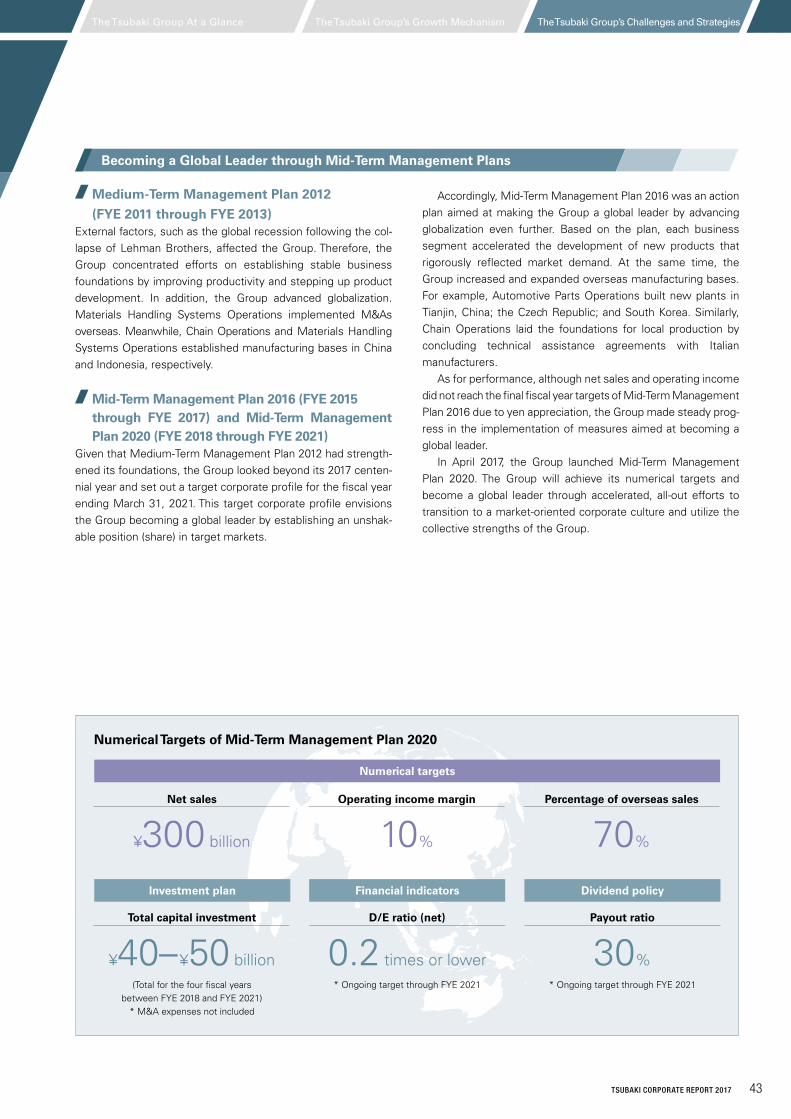
Medium-Term Management Plan 2012
(FYE 2011 through FYE 2013)External factors, such as the global recession following the col-lapse of Lehman Brothers, affected the Group. Therefore, the Group concentrated efforts on establishing stable business foundations by improving productivity and stepping up product development. In addition, the Group advanced globalization. Materials Handling Systems Operations implemented M&As overseas. Meanwhile, Chain Operations and Materials Handling Systems Operations established manufacturing bases in China and Indonesia, respectively.
Mid-Term Management Plan 2016 (FYE 2015 through FYE 2017) and Mid-Term Management Plan 2020 (FYE 2018 through FYE 2021)
Given that Medium-Term Management Plan 2012 had strength-ened its foundations, the Group looked beyond its 2017 centen-nial year and set out a target corporate profile for the fiscal year ending March 31, 2021. This target corporate profile envisions the Group becoming a global leader by establishing an unshak-able position (share) in target markets.
Accordingly, Mid-Term Management Plan 2016 was an action plan aimed at making the Group a global leader by advancing globalization even further. Based on the plan, each business segment accelerated the development of new products that rigorously reflected market demand. At the same time, the Group increased and expanded overseas manufacturing bases. For example, Automotive Parts Operations built new plants in Tianjin, China; the Czech Republic; and South Korea. Similarly, Chain Operations laid the foundations for local production by concluding technical assistance agreements with Italian manufacturers. As for performance, although net sales and operating income did not reach the final fiscal year targets of Mid-Term Management Plan 2016 due to yen appreciation, the Group made steady prog-ress in the implementation of measures aimed at becoming a global leader. In April 2017, the Group launched Mid-Term Management Plan 2020. The Group will achieve its numerical targets and become a global leader through accelerated, all-out efforts to transition to a market-oriented corporate culture and utilize the collective strengths of the Group.
Total capital investment
¥40–¥50 billion(Total for the four fiscal years
between FYE 2018 and FYE 2021)* M&A expenses not included
D/E ratio (net)
0.2 times or lower* Ongoing target through FYE 2021
Payout ratio
30%* Ongoing target through FYE 2021
Net sales
¥300 billion
Operating income margin
10%
Percentage of overseas sales
70%
Becoming a Global Leader through Mid-Term Management Plans
Investment plan Financial indicators Dividend policy
Numerical targets
Numerical Targets of Mid-Term Management Plan 2020
The Tsubaki Group’s Growth Mechanism The Tsubaki Group’s Challenges and StrategiesThe Tsubaki Group At a Glance
43TSUBAKI CORPORATE REPORT 2017
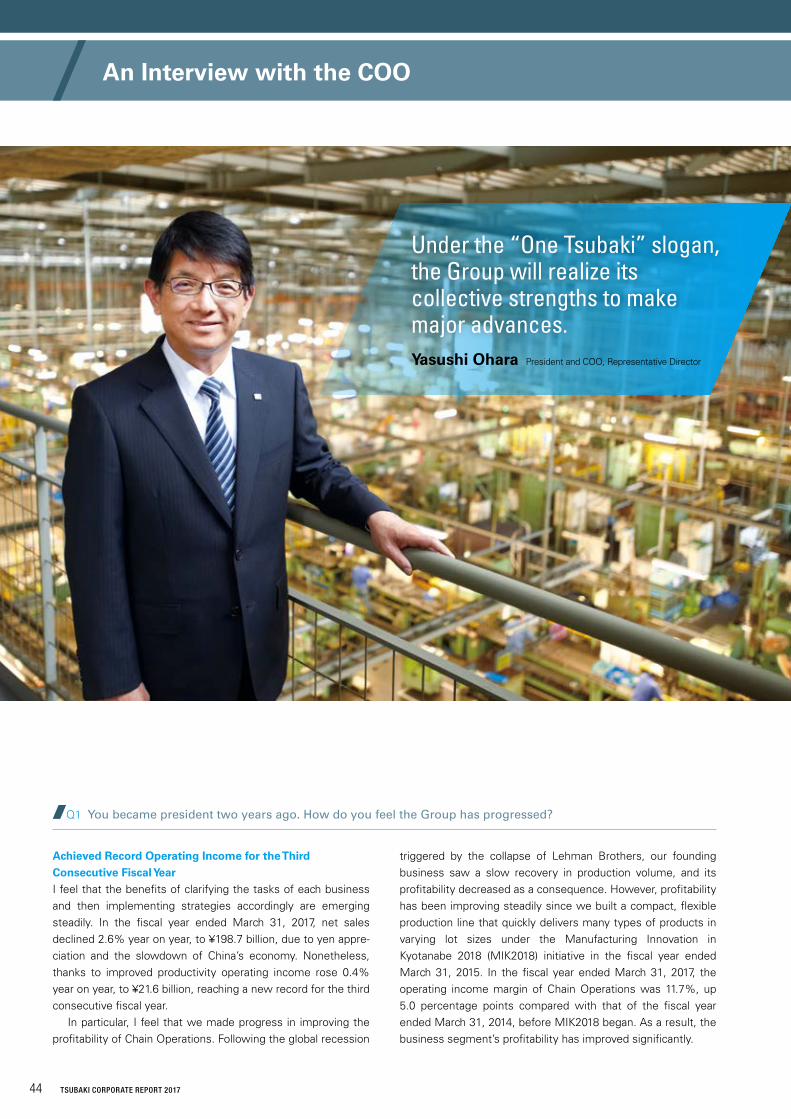
Q1 You became president two years ago. How do you feel the Group has progressed?
Under the “One Tsubaki” slogan, the Group will realize its collective strengths to make major advances.Yasushi Ohara President and COO, Representative Director
Achieved Record Operating Income for the Third Consecutive Fiscal YearI feel that the benefits of clarifying the tasks of each business and then implementing strategies accordingly are emerging steadily. In the fiscal year ended March 31, 2017, net sales declined 2.6% year on year, to ¥198.7 billion, due to yen appre-ciation and the slowdown of China’s economy. Nonetheless, thanks to improved productivity operating income rose 0.4% year on year, to ¥21.6 billion, reaching a new record for the third consecutive fiscal year. In particular, I feel that we made progress in improving the profitability of Chain Operations. Following the global recession
triggered by the collapse of Lehman Brothers, our founding business saw a slow recovery in production volume, and its profitability decreased as a consequence. However, profitability has been improving steadily since we built a compact, flexible production line that quickly delivers many types of products in varying lot sizes under the Manufacturing Innovation in Kyotanabe 2018 (MIK2018) initiative in the fiscal year ended March 31, 2015. In the fiscal year ended March 31, 2017, the operating income margin of Chain Operations was 11.7%, up 5.0 percentage points compared with that of the fiscal year ended March 31, 2014, before MIK2018 began. As a result, the business segment’s profitability has improved significantly.
44 TSUBAKI CORPORATE REPORT 2017
An Interview with the COO
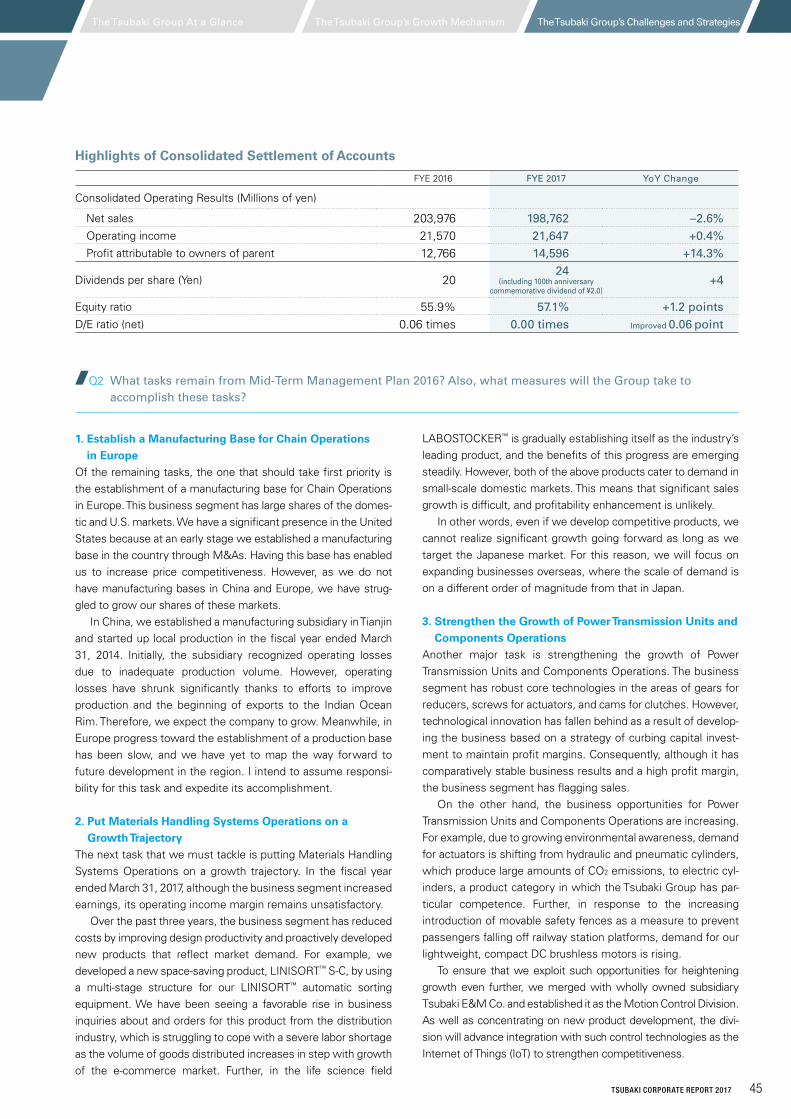
Highlights of Consolidated Settlement of Accounts
FYE 2016 FYE 2017 YoY Change
Consolidated Operating Results (Millions of yen)
Net sales 203,976 198,762 –2.6% Operating income 21,570 21,647 +0.4% Profit attributable to owners of parent 12,766 14,596 +14.3%
Dividends per share (Yen) 2024
(including 100th anniversary commemorative dividend of ¥2.0)
+4
Equity ratio 55.9% 57.1% +1.2 pointsD/E ratio (net) 0.06 times 0.00 times Improved 0.06 point
Q2 What tasks remain from Mid-Term Management Plan 2016? Also, what measures will the Group take to accomplish these tasks?
LABOSTOCKER™ is gradually establishing itself as the industry’s leading product, and the benefits of this progress are emerging steadily. However, both of the above products cater to demand in small-scale domestic markets. This means that significant sales growth is difficult, and profitability enhancement is unlikely. In other words, even if we develop competitive products, we cannot realize significant growth going forward as long as we target the Japanese market. For this reason, we will focus on expanding businesses overseas, where the scale of demand is on a different order of magnitude from that in Japan.
3. Strengthen the Growth of Power Transmission Units and Components Operations
Another major task is strengthening the growth of Power Transmission Units and Components Operations. The business segment has robust core technologies in the areas of gears for reducers, screws for actuators, and cams for clutches. However, technological innovation has fallen behind as a result of develop-ing the business based on a strategy of curbing capital invest-ment to maintain profit margins. Consequently, although it has comparatively stable business results and a high profit margin, the business segment has flagging sales. On the other hand, the business opportunities for Power Transmission Units and Components Operations are increasing. For example, due to growing environmental awareness, demand for actuators is shifting from hydraulic and pneumatic cylinders, which produce large amounts of CO2 emissions, to electric cyl-inders, a product category in which the Tsubaki Group has par-ticular competence. Further, in response to the increasing introduction of movable safety fences as a measure to prevent passengers falling off railway station platforms, demand for our lightweight, compact DC brushless motors is rising. To ensure that we exploit such opportunities for heightening growth even further, we merged with wholly owned subsidiary Tsubaki E&M Co. and established it as the Motion Control Division. As well as concentrating on new product development, the divi-sion will advance integration with such control technologies as the Internet of Things (IoT) to strengthen competitiveness.
1. Establish a Manufacturing Base for Chain Operations in Europe
Of the remaining tasks, the one that should take first priority is the establishment of a manufacturing base for Chain Operations in Europe. This business segment has large shares of the domes-tic and U.S. markets. We have a significant presence in the United States because at an early stage we established a manufacturing base in the country through M&As. Having this base has enabled us to increase price competitiveness. However, as we do not have manufacturing bases in China and Europe, we have strug-gled to grow our shares of these markets. In China, we established a manufacturing subsidiary in Tianjin and started up local production in the fiscal year ended March 31, 2014. Initially, the subsidiary recognized operating losses due to inadequate production volume. However, operating losses have shrunk significantly thanks to efforts to improve production and the beginning of exports to the Indian Ocean Rim. Therefore, we expect the company to grow. Meanwhile, in Europe progress toward the establishment of a production base has been slow, and we have yet to map the way forward to future development in the region. I intend to assume responsi-bility for this task and expedite its accomplishment.
2. Put Materials Handling Systems Operations on a Growth Trajectory
The next task that we must tackle is putting Materials Handling Systems Operations on a growth trajectory. In the fiscal year ended March 31, 2017, although the business segment increased earnings, its operating income margin remains unsatisfactory. Over the past three years, the business segment has reduced costs by improving design productivity and proactively developed new products that reflect market demand. For example, we developed a new space-saving product, LINISORT™ S-C, by using a multi-stage structure for our LINISORT™ automatic sorting equipment. We have been seeing a favorable rise in business inquiries about and orders for this product from the distribution industry, which is struggling to cope with a severe labor shortage as the volume of goods distributed increases in step with growth of the e-commerce market. Further, in the life science field
The Tsubaki Group’s Growth Mechanism The Tsubaki Group’s Challenges and StrategiesThe Tsubaki Group At a Glance
45TSUBAKI CORPORATE REPORT 2017
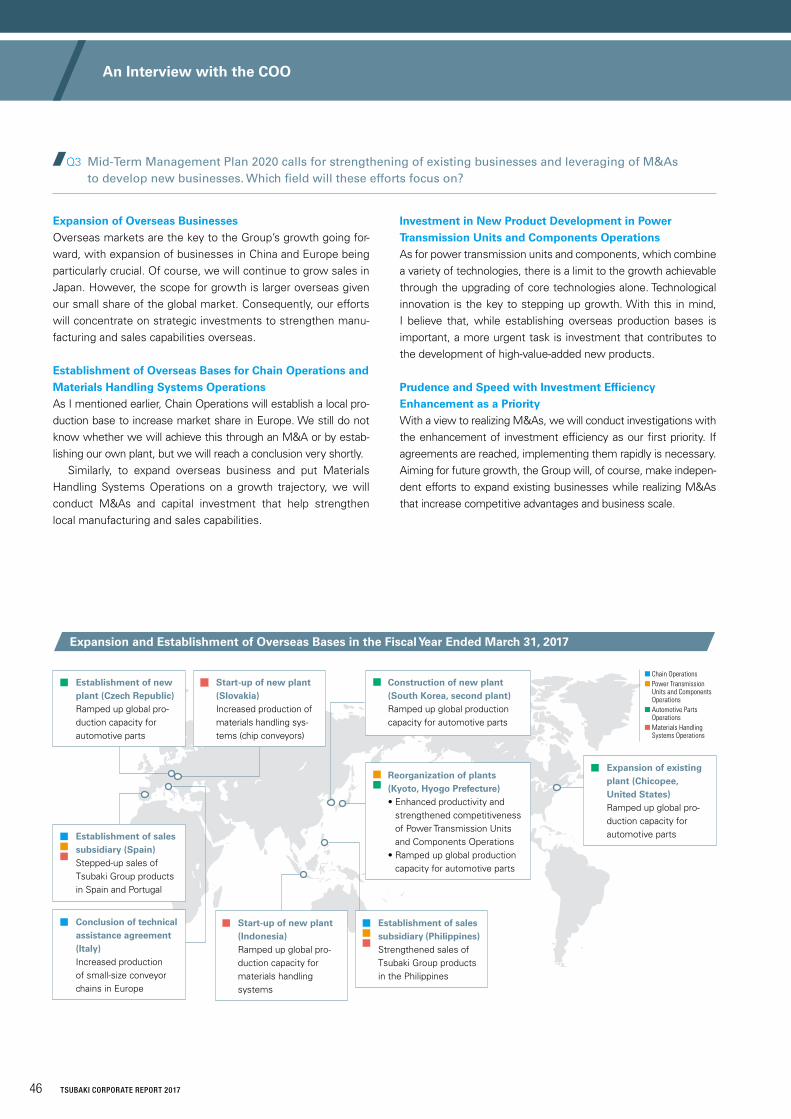
Conclusion of technical assistance agreement (Italy)Increased production of small-size conveyor chains in Europe
Establishment of sales subsidiary (Spain)Stepped-up sales of Tsubaki Group products in Spain and Portugal
Establishment of sales subsidiary (Philippines)Strengthened sales of Tsubaki Group products in the Philippines
Establishment of new plant (Czech Republic)Ramped up global pro-duction capacity for automotive parts
Expansion of existing plant (Chicopee, United States)Ramped up global pro-duction capacity for automotive parts
Start-up of new plant (Indonesia)Ramped up global pro-duction capacity for materials handling systems
Start-up of new plant (Slovakia)Increased production of materials handling sys-tems (chip conveyors)
n Chain Operationsn Power Transmission
Units and Components Operations
n Automotive Parts Operations
n Materials Handling Systems Operations
Q3 Mid-Term Management Plan 2020 calls for strengthening of existing businesses and leveraging of M&As to develop new businesses. Which field will these efforts focus on?
Expansion of Overseas BusinessesOverseas markets are the key to the Group’s growth going for-ward, with expansion of businesses in China and Europe being particularly crucial. Of course, we will continue to grow sales in Japan. However, the scope for growth is larger overseas given our small share of the global market. Consequently, our efforts will concentrate on strategic investments to strengthen manu-facturing and sales capabilities overseas.
Establishment of Overseas Bases for Chain Operations and Materials Handling Systems OperationsAs I mentioned earlier, Chain Operations will establish a local pro-duction base to increase market share in Europe. We still do not know whether we will achieve this through an M&A or by estab-lishing our own plant, but we will reach a conclusion very shortly. Similarly, to expand overseas business and put Materials Handling Systems Operations on a growth trajectory, we will conduct M&As and capital investment that help strengthen local manufacturing and sales capabilities.
Investment in New Product Development in Power Transmission Units and Components OperationsAs for power transmission units and components, which combine a variety of technologies, there is a limit to the growth achievable through the upgrading of core technologies alone. Technological innovation is the key to stepping up growth. With this in mind, I believe that, while establishing overseas production bases is important, a more urgent task is investment that contributes to the development of high-value-added new products.
Prudence and Speed with Investment Efficiency Enhancement as a PriorityWith a view to realizing M&As, we will conduct investigations with the enhancement of investment efficiency as our first priority. If agreements are reached, implementing them rapidly is necessary. Aiming for future growth, the Group will, of course, make indepen-dent efforts to expand existing businesses while realizing M&As that increase competitive advantages and business scale.
Construction of new plant (South Korea, second plant)Ramped up global production capacity for automotive parts
Reorganization of plants (Kyoto, Hyogo Prefecture)• Enhanced productivity and
strengthened competitiveness of Power Transmission Units and Components Operations
• Ramped up global production capacity for automotive parts
Expansion and Establishment of Overseas Bases in the Fiscal Year Ended March 31, 2017
46 TSUBAKI CORPORATE REPORT 2017
An Interview with the COO
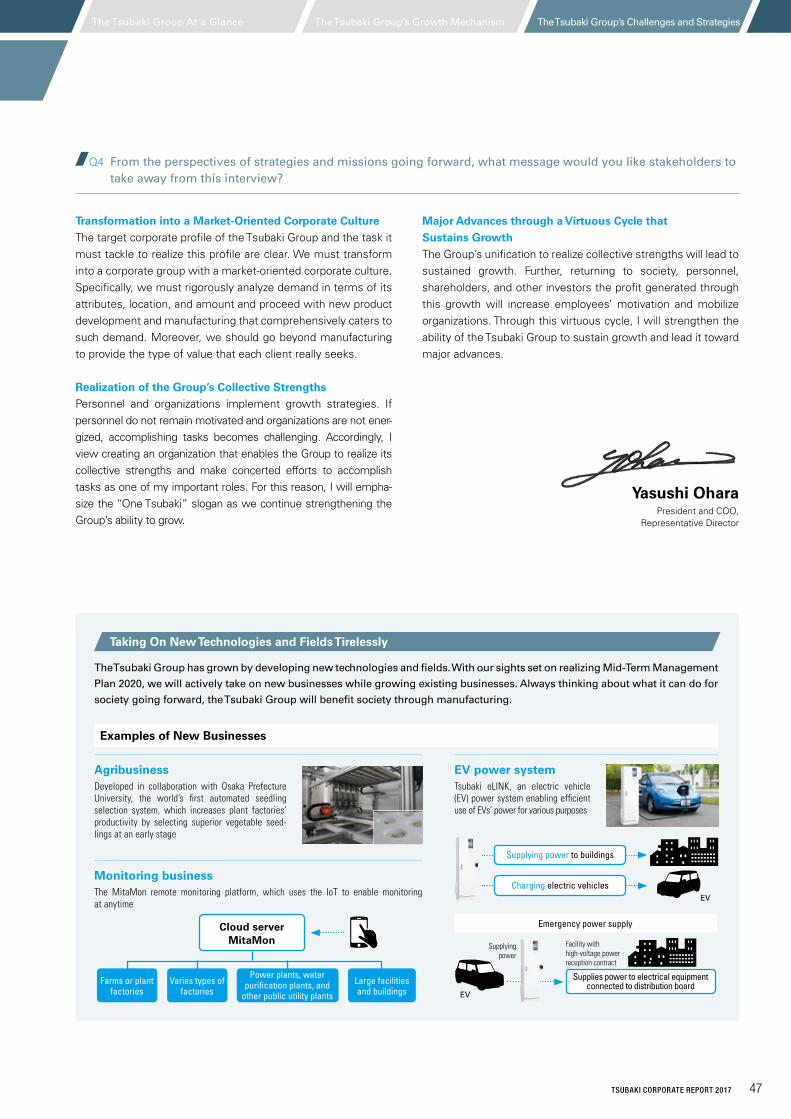
Transformation into a Market-Oriented Corporate CultureThe target corporate profile of the Tsubaki Group and the task it must tackle to realize this profile are clear. We must transform into a corporate group with a market-oriented corporate culture. Specifically, we must rigorously analyze demand in terms of its attributes, location, and amount and proceed with new product development and manufacturing that comprehensively caters to such demand. Moreover, we should go beyond manufacturing to provide the type of value that each client really seeks.
Realization of the Group’s Collective StrengthsPersonnel and organizations implement growth strategies. If personnel do not remain motivated and organizations are not ener-gized, accomplishing tasks becomes challenging. Accordingly, I view creating an organization that enables the Group to realize its collective strengths and make concerted efforts to accomplish tasks as one of my important roles. For this reason, I will empha-size the “One Tsubaki” slogan as we continue strengthening the Group’s ability to grow.
Major Advances through a Virtuous Cycle that Sustains GrowthThe Group’s unification to realize collective strengths will lead to sustained growth. Further, returning to society, personnel, shareholders, and other investors the profit generated through this growth will increase employees’ motivation and mobilize organizations. Through this virtuous cycle, I will strengthen the ability of the Tsubaki Group to sustain growth and lead it toward major advances.
Yasushi OharaPresident and COO,
Representative Director
The Tsubaki Group has grown by developing new technologies and fields. With our sights set on realizing Mid-Term Management
Plan 2020, we will actively take on new businesses while growing existing businesses. Always thinking about what it can do for
society going forward, the Tsubaki Group will benefit society through manufacturing.
Examples of New Businesses
AgribusinessDeveloped in collaboration with Osaka Prefecture University, the world’s first automated seedling selection system, which increases plant factories’ productivity by selecting superior vegetable seed-lings at an early stage
Monitoring businessThe MitaMon remote monitoring platform, which uses the IoT to enable monitoring at anytime
EV power systemTsubaki eLINK, an electric vehicle (EV) power system enabling efficient use of EVs’ power for various purposes
Cloud serverMitaMon
Supplying power to buildings
Supplies power to electrical equipment connected to distribution board
Emergency power supply
Charging electric vehicles
Farms or plant factories
Varies types of factories
Large facilities and buildings
Power plants, water purification plants, and
other public utility plants
EV
Facility with high-voltage power reception contract
Supplying power
EV
Q4 From the perspectives of strategies and missions going forward, what message would you like stakeholders to take away from this interview?
Taking On New Technologies and Fields Tirelessly
The Tsubaki Group’s Growth Mechanism The Tsubaki Group’s Challenges and StrategiesThe Tsubaki Group At a Glance
47TSUBAKI CORPORATE REPORT 2017
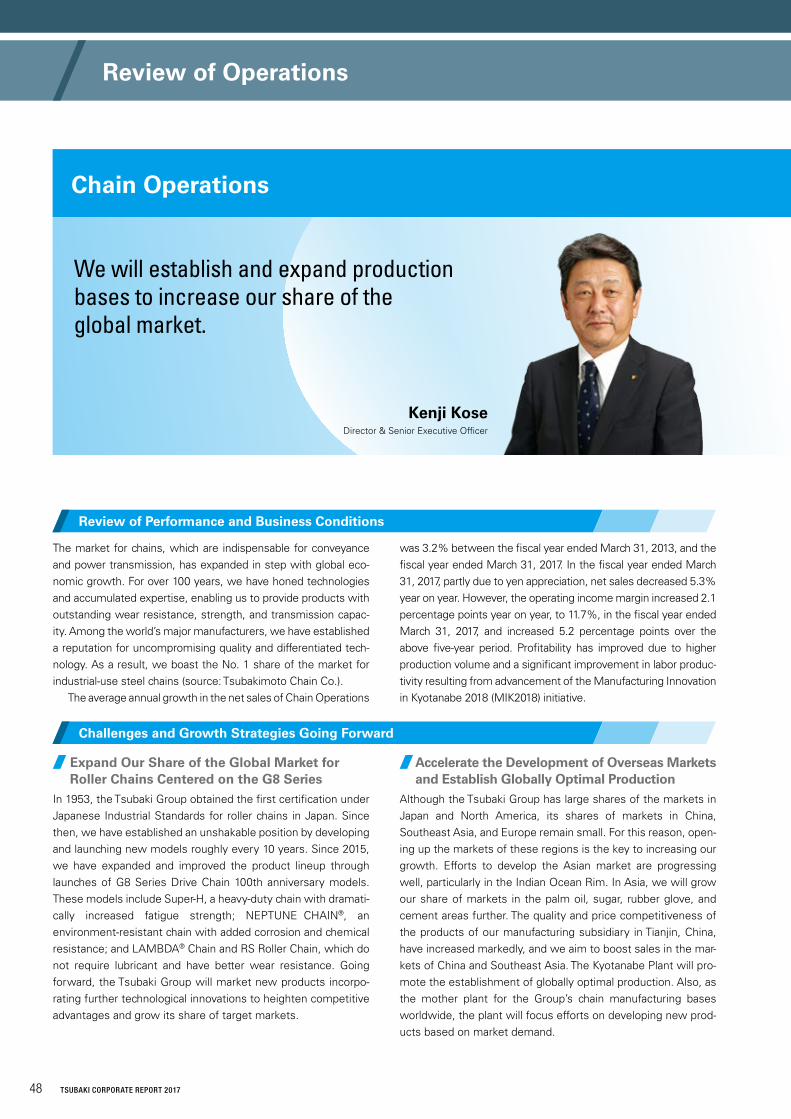
Accelerate the Development of Overseas Markets and Establish Globally Optimal Production
Although the Tsubaki Group has large shares of the markets in Japan and North America, its shares of markets in China, Southeast Asia, and Europe remain small. For this reason, open-ing up the markets of these regions is the key to increasing our growth. Efforts to develop the Asian market are progressing well, particularly in the Indian Ocean Rim. In Asia, we will grow our share of markets in the palm oil, sugar, rubber glove, and cement areas further. The quality and price competitiveness of the products of our manufacturing subsidiary in Tianjin, China, have increased markedly, and we aim to boost sales in the mar-kets of China and Southeast Asia. The Kyotanabe Plant will pro-mote the establishment of globally optimal production. Also, as the mother plant for the Group’s chain manufacturing bases worldwide, the plant will focus efforts on developing new prod-ucts based on market demand.
Expand Our Share of the Global Market for Roller Chains Centered on the G8 Series
In 1953, the Tsubaki Group obtained the first certification under Japanese Industrial Standards for roller chains in Japan. Since then, we have established an unshakable position by developing and launching new models roughly every 10 years. Since 2015, we have expanded and improved the product lineup through launches of G8 Series Drive Chain 100th anniversary models. These models include Super-H, a heavy-duty chain with dramati-cally increased fatigue strength; NEPTUNE CHAIN®, an environment-resistant chain with added corrosion and chemical resistance; and LAMBDA® Chain and RS Roller Chain, which do not require lubricant and have better wear resistance. Going forward, the Tsubaki Group will market new products incorpo-rating further technological innovations to heighten competitive advantages and grow its share of target markets.
The market for chains, which are indispensable for conveyance and power transmission, has expanded in step with global eco-nomic growth. For over 100 years, we have honed technologies and accumulated expertise, enabling us to provide products with outstanding wear resistance, strength, and transmission capac-ity. Among the world’s major manufacturers, we have established a reputation for uncompromising quality and differentiated tech-nology. As a result, we boast the No. 1 share of the market for industrial-use steel chains (source: Tsubakimoto Chain Co.). The average annual growth in the net sales of Chain Operations
Review of Performance and Business Conditions
Challenges and Growth Strategies Going Forward
Chain Operations
We will establish and expand production bases to increase our share of the global market.
Kenji KoseDirector & Senior Executive Officer
was 3.2% between the fiscal year ended March 31, 2013, and the fiscal year ended March 31, 2017. In the fiscal year ended March 31, 2017, partly due to yen appreciation, net sales decreased 5.3% year on year. However, the operating income margin increased 2.1 percentage points year on year, to 11.7%, in the fiscal year ended March 31, 2017, and increased 5.2 percentage points over the above five-year period. Profitability has improved due to higher production volume and a significant improvement in labor produc-tivity resulting from advancement of the Manufacturing Innovation in Kyotanabe 2018 (MIK2018) initiative.
48 TSUBAKI CORPORATE REPORT 2017
Review of Operations
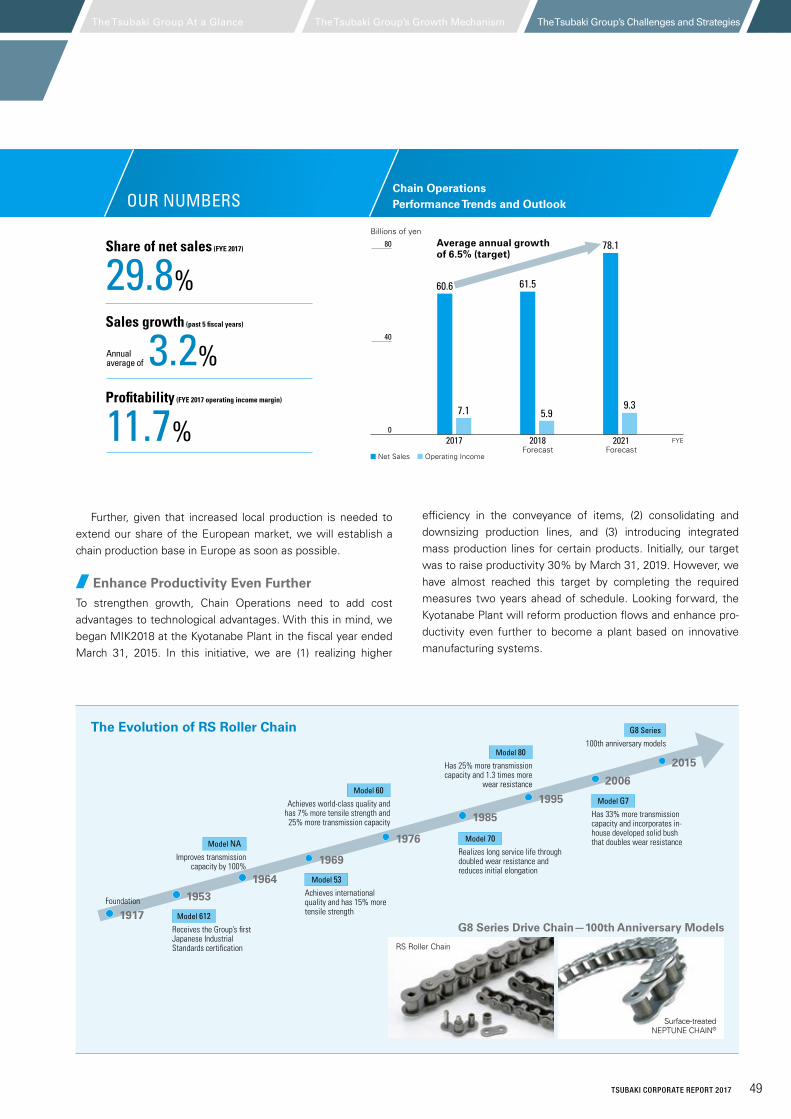
Further, given that increased local production is needed to extend our share of the European market, we will establish a chain production base in Europe as soon as possible.
Enhance Productivity Even FurtherTo strengthen growth, Chain Operations need to add cost advantages to technological advantages. With this in mind, we began MIK2018 at the Kyotanabe Plant in the fiscal year ended March 31, 2015. In this initiative, we are (1) realizing higher
Share of net sales (FYE 2017)
29.8%Sales growth (past 5 fiscal years)
3.2%Profitability (FYE 2017 operating income margin)
11.7%
OUR NUMBERSChain Operations Performance Trends and Outlook
n Net Sales n Operating Income
Billions of yen
Forecast Forecast
efficiency in the conveyance of items, (2) consolidating and downsizing production lines, and (3) introducing integrated mass production lines for certain products. Initially, our target was to raise productivity 30% by March 31, 2019. However, we have almost reached this target by completing the required measures two years ahead of schedule. Looking forward, the Kyotanabe Plant will reform production flows and enhance pro-ductivity even further to become a plant based on innovative manufacturing systems.
Average annual growth of 6.5% (target)
Annual average of
The Evolution of RS Roller Chain
RS Roller Chain
G8 Series Drive Chain—100th Anniversary Models
Surface-treated NEPTUNE CHAIN®
2015
2006
1995
1985
1976
1969
1953
1917 Model 612Receives the Group’s first Japanese Industrial Standards certification
Foundation
Model 53Achieves international quality and has 15% more tensile strength
Model 60Achieves world-class quality and
has 7% more tensile strength and 25% more transmission capacity
Model NAImproves transmission
capacity by 100%
Model 80Has 25% more transmission capacity and 1.3 times more
wear resistance
Model 70Realizes long service life through doubled wear resistance and reduces initial elongation
Model G7Has 33% more transmission capacity and incorporates in-house developed solid bush that doubles wear resistance
G8 Series
100th anniversary models
1964
FYE2017
60.6
7.1
61.5
5.9
78.1
9.3
2018 20210
40
80
The Tsubaki Group’s Growth Mechanism The Tsubaki Group’s Challenges and StrategiesThe Tsubaki Group At a Glance
49TSUBAKI CORPORATE REPORT 2017
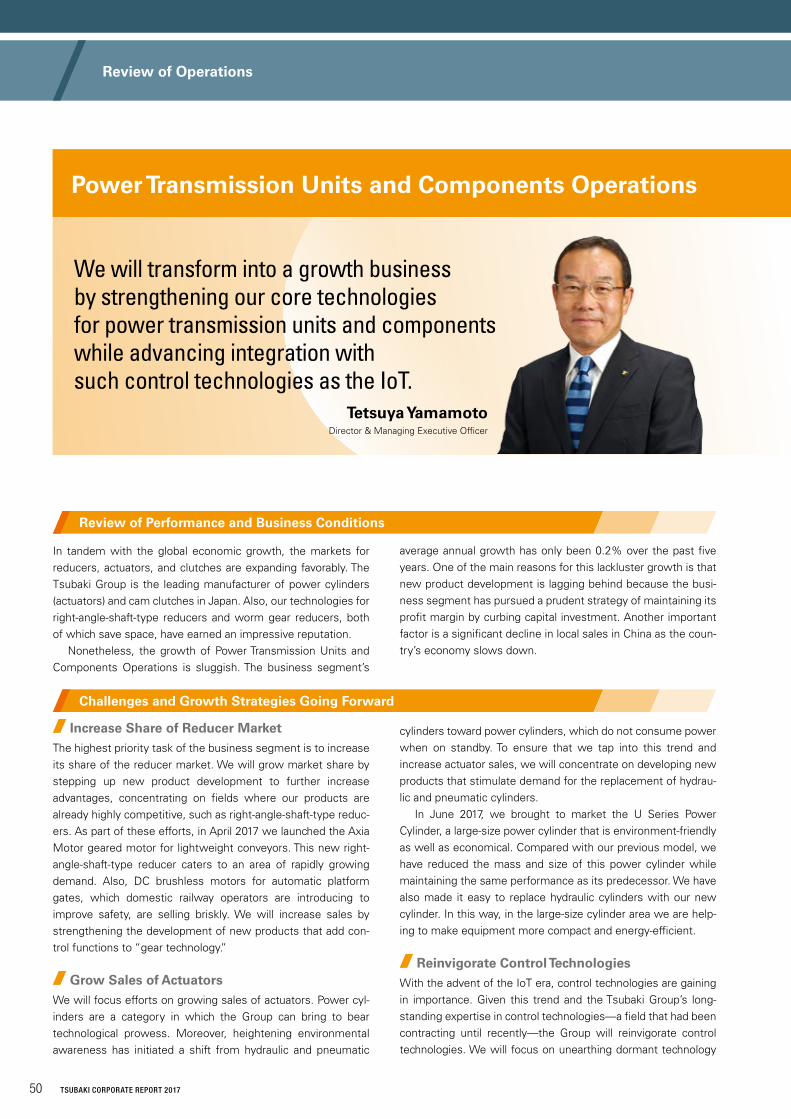
Tetsuya YamamotoDirector & Managing Executive Officer
We will transform into a growth business by strengthening our core technologies for power transmission units and components while advancing integration with such control technologies as the IoT.
cylinders toward power cylinders, which do not consume power when on standby. To ensure that we tap into this trend and increase actuator sales, we will concentrate on developing new products that stimulate demand for the replacement of hydrau-lic and pneumatic cylinders. In June 2017, we brought to market the U Series Power Cylinder, a large-size power cylinder that is environment-friendly as well as economical. Compared with our previous model, we have reduced the mass and size of this power cylinder while maintaining the same performance as its predecessor. We have also made it easy to replace hydraulic cylinders with our new cylinder. In this way, in the large-size cylinder area we are help-ing to make equipment more compact and energy-efficient.
Reinvigorate Control TechnologiesWith the advent of the IoT era, control technologies are gaining in importance. Given this trend and the Tsubaki Group’s long-standing expertise in control technologies—a field that had been contracting until recently—the Group will reinvigorate control technologies. We will focus on unearthing dormant technology
Increase Share of Reducer MarketThe highest priority task of the business segment is to increase its share of the reducer market. We will grow market share by stepping up new product development to further increase advantages, concentrating on fields where our products are already highly competitive, such as right-angle-shaft-type reduc-ers. As part of these efforts, in April 2017 we launched the Axia Motor geared motor for lightweight conveyors. This new right-angle-shaft-type reducer caters to an area of rapidly growing demand. Also, DC brushless motors for automatic platform gates, which domestic railway operators are introducing to improve safety, are selling briskly. We will increase sales by strengthening the development of new products that add con-trol functions to “gear technology.”
Grow Sales of ActuatorsWe will focus efforts on growing sales of actuators. Power cyl-inders are a category in which the Group can bring to bear technological prowess. Moreover, heightening environmental awareness has initiated a shift from hydraulic and pneumatic
In tandem with the global economic growth, the markets for reducers, actuators, and clutches are expanding favorably. The Tsubaki Group is the leading manufacturer of power cylinders (actuators) and cam clutches in Japan. Also, our technologies for right-angle-shaft-type reducers and worm gear reducers, both of which save space, have earned an impressive reputation. Nonetheless, the growth of Power Transmission Units and Components Operations is sluggish. The business segment’s
average annual growth has only been 0.2% over the past five years. One of the main reasons for this lackluster growth is that new product development is lagging behind because the busi-ness segment has pursued a prudent strategy of maintaining its profit margin by curbing capital investment. Another important factor is a significant decline in local sales in China as the coun-try’s economy slows down.
Power Transmission Units and Components Operations
Review of Performance and Business Conditions
Challenges and Growth Strategies Going Forward
50 TSUBAKI CORPORATE REPORT 2017
Review of Operations
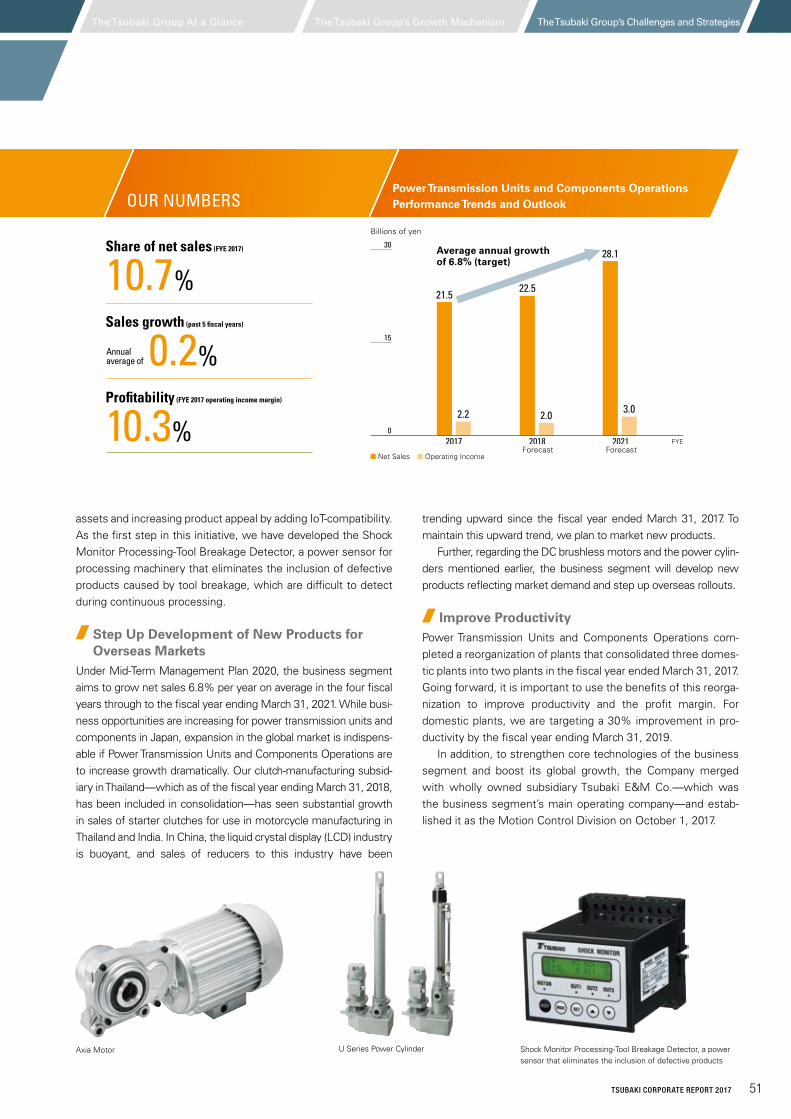
Share of net sales (FYE 2017)
10.7%Sales growth (past 5 fiscal years)
0.2%Profitability (FYE 2017 operating income margin)
10.3%
OUR NUMBERSPower Transmission Units and Components Operations Performance Trends and Outlook
n Net Sales n Operating Income
Billions of yen
Forecast Forecast
Average annual growth of 6.8% (target)
Annual average of
assets and increasing product appeal by adding IoT-compatibility. As the first step in this initiative, we have developed the Shock Monitor Processing-Tool Breakage Detector, a power sensor for processing machinery that eliminates the inclusion of defective products caused by tool breakage, which are difficult to detect during continuous processing.
Step Up Development of New Products for Overseas Markets
Under Mid-Term Management Plan 2020, the business segment aims to grow net sales 6.8% per year on average in the four fiscal years through to the fiscal year ending March 31, 2021. While busi-ness opportunities are increasing for power transmission units and components in Japan, expansion in the global market is indispens-able if Power Transmission Units and Components Operations are to increase growth dramatically. Our clutch-manufacturing subsid-iary in Thailand—which as of the fiscal year ending March 31, 2018, has been included in consolidation—has seen substantial growth in sales of starter clutches for use in motorcycle manufacturing in Thailand and India. In China, the liquid crystal display (LCD) industry is buoyant, and sales of reducers to this industry have been
trending upward since the fiscal year ended March 31, 2017. To maintain this upward trend, we plan to market new products. Further, regarding the DC brushless motors and the power cylin-ders mentioned earlier, the business segment will develop new products reflecting market demand and step up overseas rollouts.
Improve ProductivityPower Transmission Units and Components Operations com-pleted a reorganization of plants that consolidated three domes-tic plants into two plants in the fiscal year ended March 31, 2017. Going forward, it is important to use the benefits of this reorga-nization to improve productivity and the profit margin. For domestic plants, we are targeting a 30% improvement in pro-ductivity by the fiscal year ending March 31, 2019. In addition, to strengthen core technologies of the business segment and boost its global growth, the Company merged with wholly owned subsidiary Tsubaki E&M Co.—which was the business segment’s main operating company—and estab-lished it as the Motion Control Division on October 1, 2017.
Axia Motor Shock Monitor Processing-Tool Breakage Detector, a power sensor that eliminates the inclusion of defective products
U Series Power Cylinder
21.5
2.2
22.5
2.0
28.1
3.0
0
15
30
2017 2018 2021 FYE
The Tsubaki Group’s Growth Mechanism The Tsubaki Group’s Challenges and StrategiesThe Tsubaki Group At a Glance
51TSUBAKI CORPORATE REPORT 2017
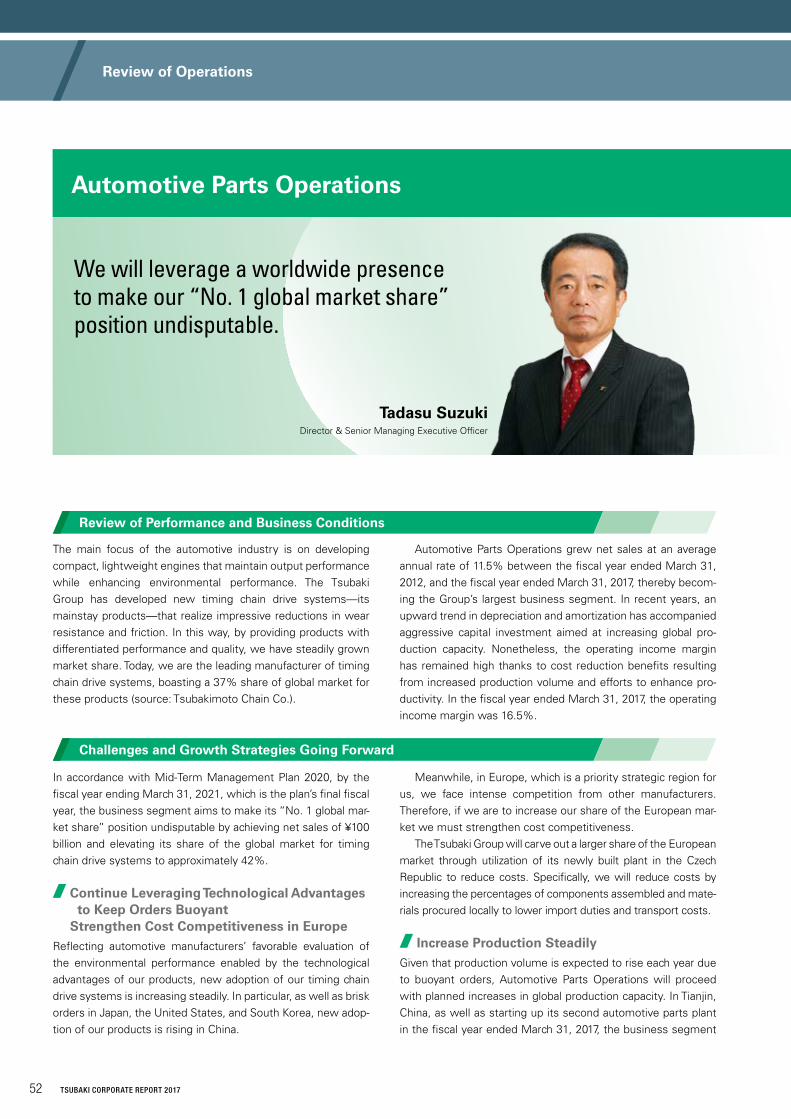
Meanwhile, in Europe, which is a priority strategic region for us, we face intense competition from other manufacturers. Therefore, if we are to increase our share of the European mar-ket we must strengthen cost competitiveness. The Tsubaki Group will carve out a larger share of the European market through utilization of its newly built plant in the Czech Republic to reduce costs. Specifically, we will reduce costs by increasing the percentages of components assembled and mate-rials procured locally to lower import duties and transport costs.
Increase Production SteadilyGiven that production volume is expected to rise each year due to buoyant orders, Automotive Parts Operations will proceed with planned increases in global production capacity. In Tianjin, China, as well as starting up its second automotive parts plant in the fiscal year ended March 31, 2017, the business segment
In accordance with Mid-Term Management Plan 2020, by the fiscal year ending March 31, 2021, which is the plan’s final fiscal year, the business segment aims to make its “No. 1 global mar-ket share” position undisputable by achieving net sales of ¥100 billion and elevating its share of the global market for timing chain drive systems to approximately 42%.
Continue Leveraging Technological Advantages to Keep Orders Buoyant Strengthen Cost Competitiveness in Europe
Reflecting automotive manufacturers’ favorable evaluation of the environmental performance enabled by the technological advantages of our products, new adoption of our timing chain drive systems is increasing steadily. In particular, as well as brisk orders in Japan, the United States, and South Korea, new adop-tion of our products is rising in China.
The main focus of the automotive industry is on developing compact, lightweight engines that maintain output performance while enhancing environmental performance. The Tsubaki Group has developed new timing chain drive systems—its mainstay products—that realize impressive reductions in wear resistance and friction. In this way, by providing products with differentiated performance and quality, we have steadily grown market share. Today, we are the leading manufacturer of timing chain drive systems, boasting a 37% share of global market for these products (source: Tsubakimoto Chain Co.).
Automotive Parts Operations grew net sales at an average annual rate of 11.5% between the fiscal year ended March 31, 2012, and the fiscal year ended March 31, 2017, thereby becom-ing the Group’s largest business segment. In recent years, an upward trend in depreciation and amortization has accompanied aggressive capital investment aimed at increasing global pro-duction capacity. Nonetheless, the operating income margin has remained high thanks to cost reduction benefits resulting from increased production volume and efforts to enhance pro-ductivity. In the fiscal year ended March 31, 2017, the operating income margin was 16.5%.
Automotive Parts Operations
Review of Performance and Business Conditions
Challenges and Growth Strategies Going Forward
We will leverage a worldwide presence to make our “No. 1 global market share” position undisputable.
Tadasu SuzukiDirector & Senior Managing Executive Officer
52 TSUBAKI CORPORATE REPORT 2017
Review of Operations
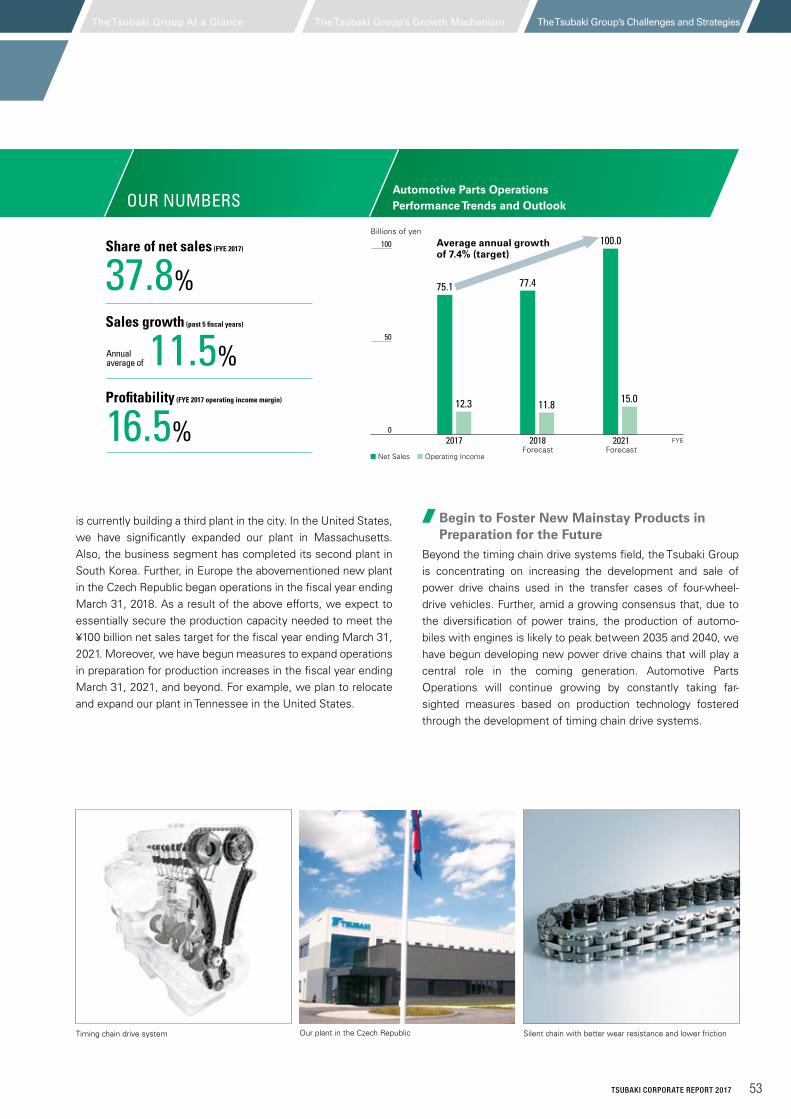
is currently building a third plant in the city. In the United States, we have significantly expanded our plant in Massachusetts. Also, the business segment has completed its second plant in South Korea. Further, in Europe the abovementioned new plant in the Czech Republic began operations in the fiscal year ending March 31, 2018. As a result of the above efforts, we expect to essentially secure the production capacity needed to meet the ¥100 billion net sales target for the fiscal year ending March 31, 2021. Moreover, we have begun measures to expand operations in preparation for production increases in the fiscal year ending March 31, 2021, and beyond. For example, we plan to relocate and expand our plant in Tennessee in the United States.
Begin to Foster New Mainstay Products in Preparation for the Future
Beyond the timing chain drive systems field, the Tsubaki Group is concentrating on increasing the development and sale of power drive chains used in the transfer cases of four-wheel-drive vehicles. Further, amid a growing consensus that, due to the diversification of power trains, the production of automo-biles with engines is likely to peak between 2035 and 2040, we have begun developing new power drive chains that will play a central role in the coming generation. Automotive Parts Operations will continue growing by constantly taking far-sighted measures based on production technology fostered through the development of timing chain drive systems.
Silent chain with better wear resistance and lower frictionOur plant in the Czech RepublicTiming chain drive system
OUR NUMBERSAutomotive Parts Operations Performance Trends and Outlook
n Net Sales n Operating Income
Billions of yen
Forecast Forecast
Average annual growth of 7.4% (target)
Share of net sales (FYE 2017)
37.8%Sales growth (past 5 fiscal years)
11.5%Profitability (FYE 2017 operating income margin)
16.5%
Annual average of
75.1
12.3
77.4
11.8
100.0
15.0
0
50
100
2017 2018 2021 FYE
The Tsubaki Group’s Growth Mechanism The Tsubaki Group’s Challenges and StrategiesThe Tsubaki Group At a Glance
53TSUBAKI CORPORATE REPORT 2017
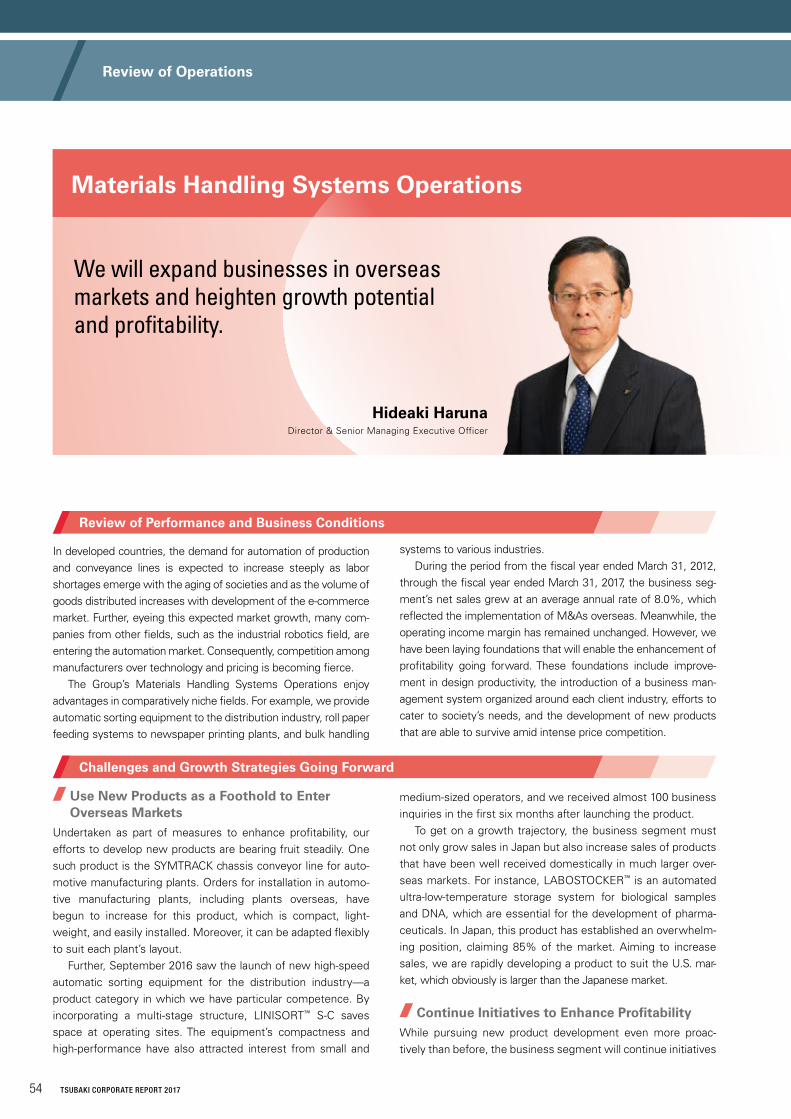
事事事事事事事事事
Hideaki HarunaDirector & Senior Managing Executive Officer
medium-sized operators, and we received almost 100 business inquiries in the first six months after launching the product. To get on a growth trajectory, the business segment must not only grow sales in Japan but also increase sales of products that have been well received domestically in much larger over-seas markets. For instance, LABOSTOCKER™ is an automated ultra-low-temperature storage system for biological samples and DNA, which are essential for the development of pharma-ceuticals. In Japan, this product has established an overwhelm-ing position, claiming 85% of the market. Aiming to increase sales, we are rapidly developing a product to suit the U.S. mar-ket, which obviously is larger than the Japanese market.
Continue Initiatives to Enhance ProfitabilityWhile pursuing new product development even more proac-tively than before, the business segment will continue initiatives
Use New Products as a Foothold to Enter Overseas Markets
Undertaken as part of measures to enhance profitability, our efforts to develop new products are bearing fruit steadily. One such product is the SYMTRACK chassis conveyor line for auto-motive manufacturing plants. Orders for installation in automo-tive manufacturing plants, including plants overseas, have begun to increase for this product, which is compact, light-weight, and easily installed. Moreover, it can be adapted flexibly to suit each plant’s layout. Further, September 2016 saw the launch of new high-speed automatic sorting equipment for the distribution industry—a product category in which we have particular competence. By incorporating a multi-stage structure, LINISORT™ S-C saves space at operating sites. The equipment’s compactness and high-performance have also attracted interest from small and
In developed countries, the demand for automation of production and conveyance lines is expected to increase steeply as labor shortages emerge with the aging of societies and as the volume of goods distributed increases with development of the e-commerce market. Further, eyeing this expected market growth, many com-panies from other fields, such as the industrial robotics field, are entering the automation market. Consequently, competition among manufacturers over technology and pricing is becoming fierce. The Group’s Materials Handling Systems Operations enjoy advantages in comparatively niche fields. For example, we provide automatic sorting equipment to the distribution industry, roll paper feeding systems to newspaper printing plants, and bulk handling
systems to various industries. During the period from the fiscal year ended March 31, 2012, through the fiscal year ended March 31, 2017, the business seg-ment’s net sales grew at an average annual rate of 8.0%, which reflected the implementation of M&As overseas. Meanwhile, the operating income margin has remained unchanged. However, we have been laying foundations that will enable the enhancement of profitability going forward. These foundations include improve-ment in design productivity, the introduction of a business man-agement system organized around each client industry, efforts to cater to society’s needs, and the development of new products that are able to survive amid intense price competition.
We will expand businesses in overseas markets and heighten growth potential and profitability.
Materials Handling Systems Operations
Review of Performance and Business Conditions
Challenges and Growth Strategies Going Forward
54 TSUBAKI CORPORATE REPORT 2017
Review of Operations
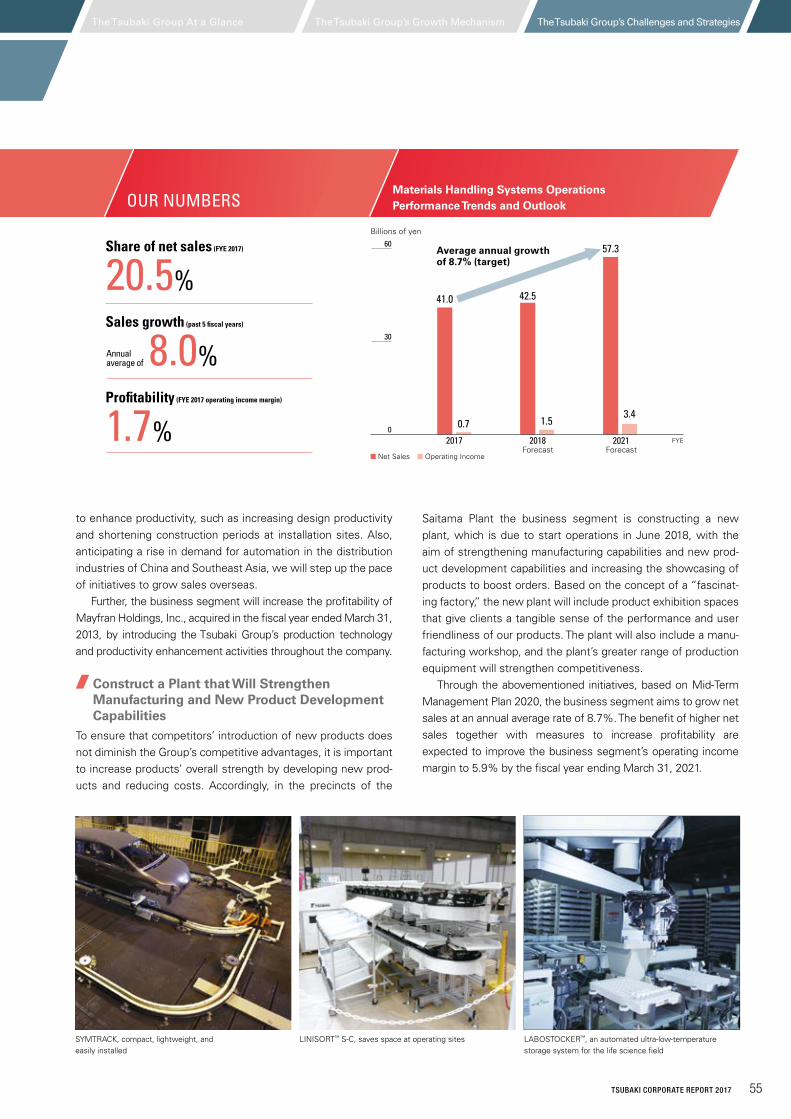
Materials Handling Systems Operations Performance Trends and Outlook
n Net Sales n Operating Income
Billions of yen
Forecast Forecast
Average annual growth of 8.7% (target)
Share of net sales (FYE 2017)
20.5%Sales growth (past 5 fiscal years)
8.0%Profitability (FYE 2017 operating income margin)
1.7%
Annual average of
to enhance productivity, such as increasing design productivity and shortening construction periods at installation sites. Also, anticipating a rise in demand for automation in the distribution industries of China and Southeast Asia, we will step up the pace of initiatives to grow sales overseas. Further, the business segment will increase the profitability of Mayfran Holdings, Inc., acquired in the fiscal year ended March 31, 2013, by introducing the Tsubaki Group’s production technology and productivity enhancement activities throughout the company.
Construct a Plant that Will Strengthen Manufacturing and New Product Development Capabilities
To ensure that competitors’ introduction of new products does not diminish the Group’s competitive advantages, it is important to increase products’ overall strength by developing new prod-ucts and reducing costs. Accordingly, in the precincts of the
LINISORT™ S-C, saves space at operating sites LABOSTOCKER™, an automated ultra-low-temperature storage system for the life science field
SYMTRACK, compact, lightweight, and easily installed
OUR NUMBERS
Saitama Plant the business segment is constructing a new plant, which is due to start operations in June 2018, with the aim of strengthening manufacturing capabilities and new prod-uct development capabilities and increasing the showcasing of products to boost orders. Based on the concept of a “fascinat-ing factory,” the new plant will include product exhibition spaces that give clients a tangible sense of the performance and user friendliness of our products. The plant will also include a manu-facturing workshop, and the plant’s greater range of production equipment will strengthen competitiveness. Through the abovementioned initiatives, based on Mid-Term Management Plan 2020, the business segment aims to grow net sales at an annual average rate of 8.7%. The benefit of higher net sales together with measures to increase profitability are expected to improve the business segment’s operating income margin to 5.9% by the fiscal year ending March 31, 2021.
41.0
0.7
42.5
1.5
57.3
3.40
30
60
2017 2018 2021 FYE
The Tsubaki Group’s Growth Mechanism The Tsubaki Group’s Challenges and StrategiesThe Tsubaki Group At a Glance
55TSUBAKI CORPORATE REPORT 2017
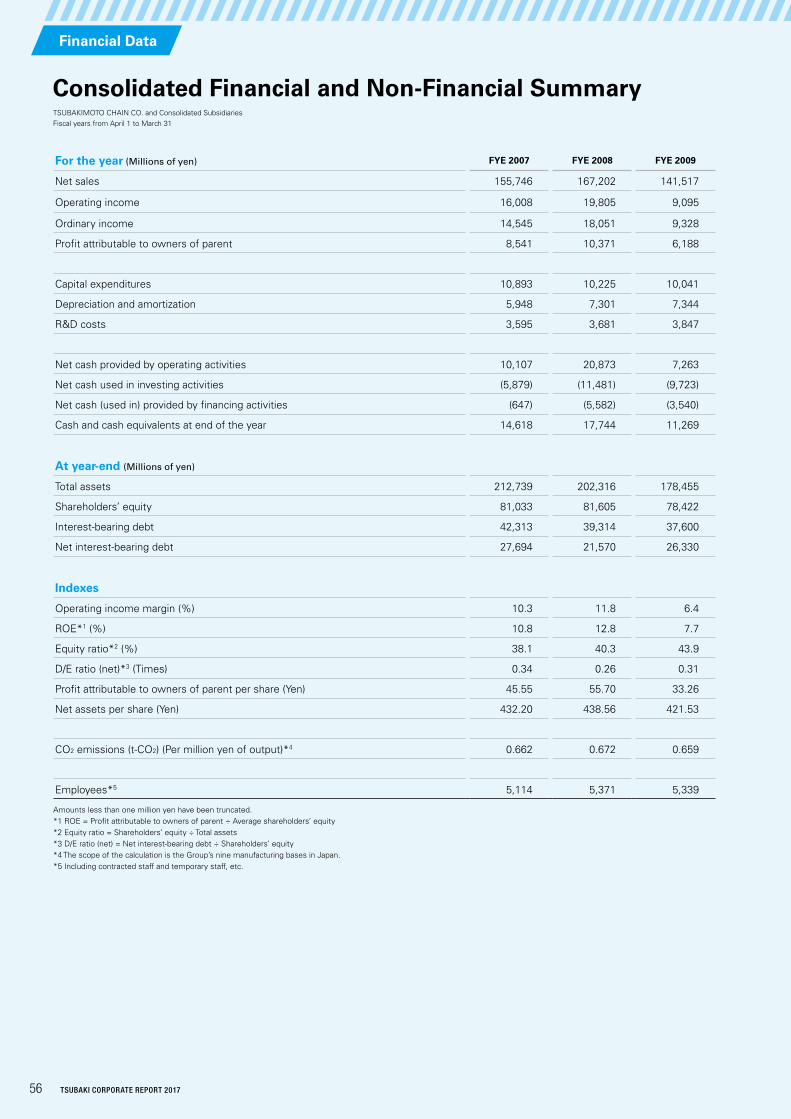
For the year (Millions of yen) FYE 2007 FYE 2008 FYE 2009 FYE 2010 FYE 2011 FYE 2012 FYE 2013 FYE 2014 FYE 2015 FYE 2016 FYE 2017
Net sales 155,746 167,202 141,517 112,759 138,243 144,896 150,002 178,022 196,738 203,976 198,762
Operating income 16,008 19,805 9,095 4,737 11,022 12,081 12,579 17,354 21,427 21,570 21,647
Ordinary income 14,545 18,051 9,328 4,990 11,111 12,140 12,813 17,993 22,263 22,109 22,004
Profit attributable to owners of parent 8,541 10,371 6,188 3,175 6,093 6,814 7,428 10,213 14,153 12,766 14,596
Capital expenditures 10,893 10,225 10,041 3,988 5,807 9,518 11,833 11,372 10,466 15,677 13,995
Depreciation and amortization 5,948 7,301 7,344 7,390 7,544 7,403 7,360 8,745 9,476 10,402 10,342
R&D costs 3,595 3,681 3,847 3,543 4,144 4,231 4,319 4,061 4,048 4,300 4,341
Net cash provided by operating activities 10,107 20,873 7,263 14,508 16,293 11,626 15,350 19,761 22,189 19,090 25,434
Net cash used in investing activities (5,879) (11,481) (9,723) (5,020) (8,281) (10,487) (18,401) (17,166) (14,306) (13,593) (13,420)
Net cash (used in) provided by financing activities (647) (5,582) (3,540) (373) (10,578) (5,460) 6,325 (3,196) (2,647) (5,476) (4,084)
Cash and cash equivalents at end of the year 14,618 17,744 11,269 20,379 17,308 13,916 20,194 21,291 27,360 26,422 34,142
At year-end (Millions of yen)
Total assets 212,739 202,316 178,455 182,641 184,206 191,766 215,837 228,840 258,742 254,106 267,215
Shareholders’ equity 81,033 81,605 78,422 80,847 83,413 89,923 102,019 118,433 140,439 142,041 152,473
Interest-bearing debt 42,313 39,314 37,600 38,910 31,240 27,405 36,507 36,538 36,907 34,817 34,634
Net interest-bearing debt 27,694 21,570 26,330 18,531 13,931 13,488 16,312 15,246 9,547 8,394 492
Indexes
Operating income margin (%) 10.3 11.8 6.4 4.2 8.0 8.3 8.4 9.7 10.9 10.6 10.9
ROE*1 (%) 10.8 12.8 7.7 4.0 7.4 7.9 7.7 9.3 10.9 9.0 9.9
Equity ratio*2 (%) 38.1 40.3 43.9 44.3 45.3 46.9 47.3 51.8 54.3 55.9 57.1
D/E ratio (net)*3 (Times) 0.34 0.26 0.31 0.21 0.17 0.15 0.16 0.13 0.07 0.06 0.00
Profit attributable to owners of parent per share (Yen) 45.55 55.70 33.26 17.07 32.76 36.60 39.69 54.58 75.65 68.24 78.03
Net assets per share (Yen) 432.20 438.56 421.53 434.59 448.43 480.46 545.14 632.94 750.63 759.27 815.10
CO2 emissions (t-CO2) (Per million yen of output)*4 0.662 0.672 0.659 0.740 0.701 0.670 0.665 0.670 0.642 0.629 0.643
Employees*5 5,114 5,371 5,339 5,271 5,891 6,160 6,792 7,068 7,398 7,579 7,886
Amounts less than one million yen have been truncated.*1 ROE = Profit attributable to owners of parent ÷ Average shareholders’ equity*2 Equity ratio = Shareholders’ equity ÷ Total assets*3 D/E ratio (net) = Net interest-bearing debt ÷ Shareholders’ equity*4 The scope of the calculation is the Group’s nine manufacturing bases in Japan.*5 Including contracted staff and temporary staff, etc.
TSUBAKIMOTO CHAIN CO. and Consolidated SubsidiariesFiscal years from April 1 to March 31
56 TSUBAKI CORPORATE REPORT 2017
Consolidated Financial and Non-Financial Summary
Financial Data
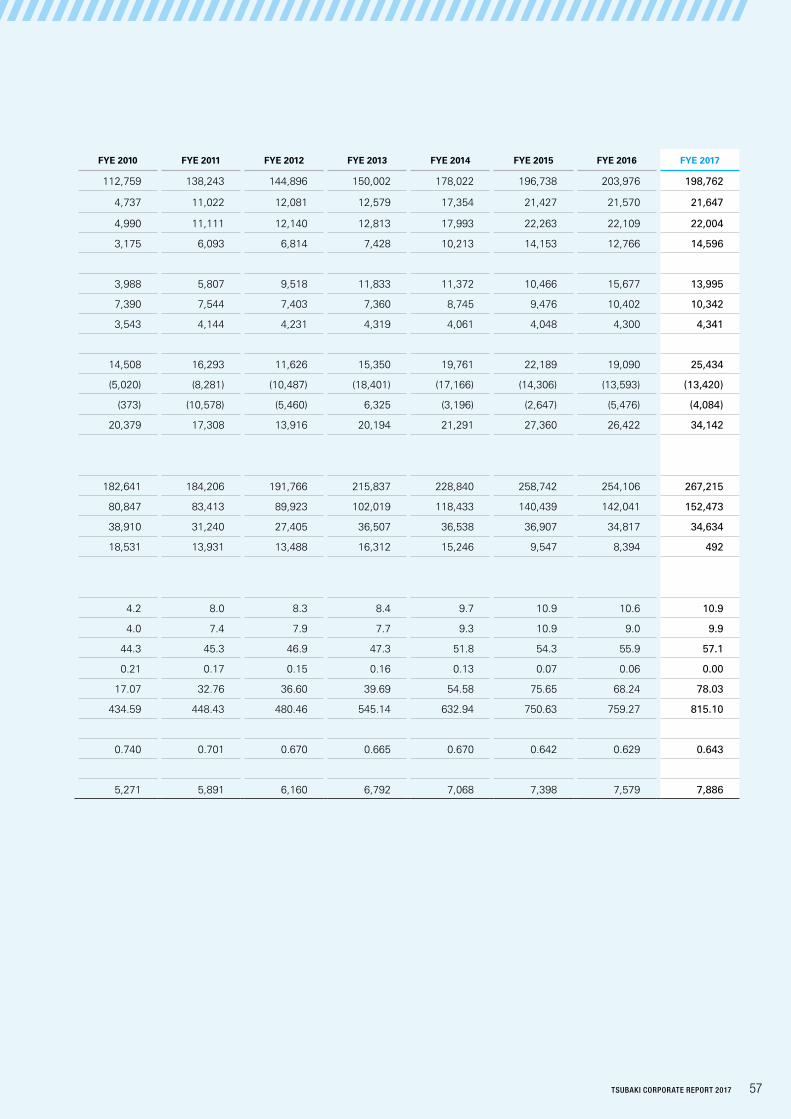
For the year (Millions of yen) FYE 2007 FYE 2008 FYE 2009 FYE 2010 FYE 2011 FYE 2012 FYE 2013 FYE 2014 FYE 2015 FYE 2016 FYE 2017
Net sales 155,746 167,202 141,517 112,759 138,243 144,896 150,002 178,022 196,738 203,976 198,762
Operating income 16,008 19,805 9,095 4,737 11,022 12,081 12,579 17,354 21,427 21,570 21,647
Ordinary income 14,545 18,051 9,328 4,990 11,111 12,140 12,813 17,993 22,263 22,109 22,004
Profit attributable to owners of parent 8,541 10,371 6,188 3,175 6,093 6,814 7,428 10,213 14,153 12,766 14,596
Capital expenditures 10,893 10,225 10,041 3,988 5,807 9,518 11,833 11,372 10,466 15,677 13,995
Depreciation and amortization 5,948 7,301 7,344 7,390 7,544 7,403 7,360 8,745 9,476 10,402 10,342
R&D costs 3,595 3,681 3,847 3,543 4,144 4,231 4,319 4,061 4,048 4,300 4,341
Net cash provided by operating activities 10,107 20,873 7,263 14,508 16,293 11,626 15,350 19,761 22,189 19,090 25,434
Net cash used in investing activities (5,879) (11,481) (9,723) (5,020) (8,281) (10,487) (18,401) (17,166) (14,306) (13,593) (13,420)
Net cash (used in) provided by financing activities (647) (5,582) (3,540) (373) (10,578) (5,460) 6,325 (3,196) (2,647) (5,476) (4,084)
Cash and cash equivalents at end of the year 14,618 17,744 11,269 20,379 17,308 13,916 20,194 21,291 27,360 26,422 34,142
At year-end (Millions of yen)
Total assets 212,739 202,316 178,455 182,641 184,206 191,766 215,837 228,840 258,742 254,106 267,215
Shareholders’ equity 81,033 81,605 78,422 80,847 83,413 89,923 102,019 118,433 140,439 142,041 152,473
Interest-bearing debt 42,313 39,314 37,600 38,910 31,240 27,405 36,507 36,538 36,907 34,817 34,634
Net interest-bearing debt 27,694 21,570 26,330 18,531 13,931 13,488 16,312 15,246 9,547 8,394 492
Indexes
Operating income margin (%) 10.3 11.8 6.4 4.2 8.0 8.3 8.4 9.7 10.9 10.6 10.9
ROE*1 (%) 10.8 12.8 7.7 4.0 7.4 7.9 7.7 9.3 10.9 9.0 9.9
Equity ratio*2 (%) 38.1 40.3 43.9 44.3 45.3 46.9 47.3 51.8 54.3 55.9 57.1
D/E ratio (net)*3 (Times) 0.34 0.26 0.31 0.21 0.17 0.15 0.16 0.13 0.07 0.06 0.00
Profit attributable to owners of parent per share (Yen) 45.55 55.70 33.26 17.07 32.76 36.60 39.69 54.58 75.65 68.24 78.03
Net assets per share (Yen) 432.20 438.56 421.53 434.59 448.43 480.46 545.14 632.94 750.63 759.27 815.10
CO2 emissions (t-CO2) (Per million yen of output)*4 0.662 0.672 0.659 0.740 0.701 0.670 0.665 0.670 0.642 0.629 0.643
Employees*5 5,114 5,371 5,339 5,271 5,891 6,160 6,792 7,068 7,398 7,579 7,886
57TSUBAKI CORPORATE REPORT 2017
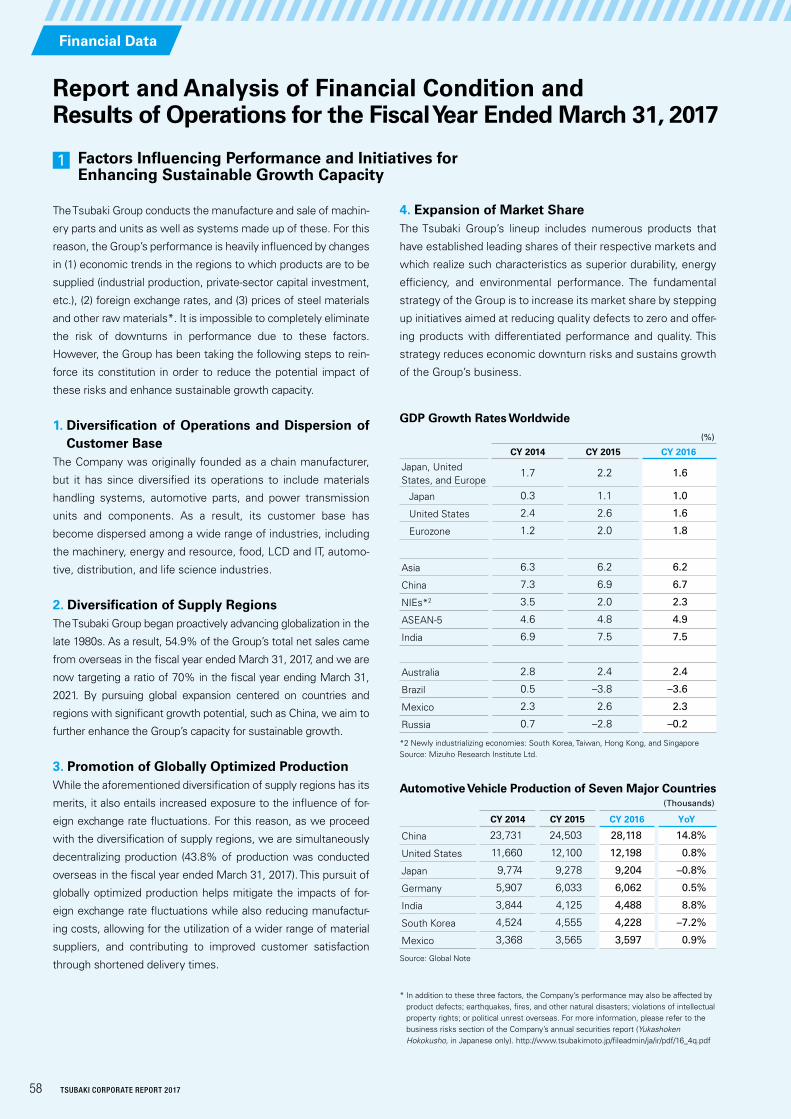
1 Factors Influencing Performance and Initiatives for Enhancing Sustainable Growth Capacity
The Tsubaki Group conducts the manufacture and sale of machin-
ery parts and units as well as systems made up of these. For this
reason, the Group’s performance is heavily influenced by changes
in (1) economic trends in the regions to which products are to be
supplied (industrial production, private-sector capital investment,
etc.), (2) foreign exchange rates, and (3) prices of steel materials
and other raw materials*. It is impossible to completely eliminate
the risk of downturns in performance due to these factors.
However, the Group has been taking the following steps to rein-
force its constitution in order to reduce the potential impact of
these risks and enhance sustainable growth capacity.
1. Diversification of Operations and Dispersion of Customer Base
The Company was originally founded as a chain manufacturer,
but it has since diversified its operations to include materials
handling systems, automotive parts, and power transmission
units and components. As a result, its customer base has
become dispersed among a wide range of industries, including
the machinery, energy and resource, food, LCD and IT, automo-
tive, distribution, and life science industries.
2. Diversification of Supply RegionsThe Tsubaki Group began proactively advancing globalization in the
late 1980s. As a result, 54.9% of the Group’s total net sales came
from overseas in the fiscal year ended March 31, 2017, and we are
now targeting a ratio of 70% in the fiscal year ending March 31,
2021. By pursuing global expansion centered on countries and
regions with significant growth potential, such as China, we aim to
further enhance the Group’s capacity for sustainable growth.
3. Promotion of Globally Optimized ProductionWhile the aforementioned diversification of supply regions has its
merits, it also entails increased exposure to the influence of for-
eign exchange rate fluctuations. For this reason, as we proceed
with the diversification of supply regions, we are simultaneously
decentralizing production (43.8% of production was conducted
overseas in the fiscal year ended March 31, 2017). This pursuit of
globally optimized production helps mitigate the impacts of for-
eign exchange rate fluctuations while also reducing manufactur-
ing costs, allowing for the utilization of a wider range of material
suppliers, and contributing to improved customer satisfaction
through shortened delivery times.
4. Expansion of Market ShareThe Tsubaki Group’s lineup includes numerous products that
have established leading shares of their respective markets and
which realize such characteristics as superior durability, energy
efficiency, and environmental performance. The fundamental
strategy of the Group is to increase its market share by stepping
up initiatives aimed at reducing quality defects to zero and offer-
ing products with differentiated performance and quality. This
strategy reduces economic downturn risks and sustains growth
of the Group’s business.
* In addition to these three factors, the Company’s performance may also be affected by product defects; earthquakes, fires, and other natural disasters; violations of intellectual property rights; or political unrest overseas. For more information, please refer to the business risks section of the Company’s annual securities report (Yukashoken Hokokusho, in Japanese only). http://www.tsubakimoto.jp/fileadmin/ja/ir/pdf/16_4q.pdf
(%)
CY 2014 CY 2015 CY 2016
Japan, United States, and Europe
1.7 2.2 1.6
Japan 0.3 1.1 1.0
United States 2.4 2.6 1.6
Eurozone 1.2 2.0 1.8
Asia 6.3 6.2 6.2
China 7.3 6.9 6.7
NIEs*2 3.5 2.0 2.3
ASEAN-5 4.6 4.8 4.9
India 6.9 7.5 7.5
Australia 2.8 2.4 2.4
Brazil 0.5 –3.8 –3.6
Mexico 2.3 2.6 2.3
Russia 0.7 –2.8 –0.2
(Thousands)
CY 2014 CY 2015 CY 2016 YoY
China 23,731 24,503 28,118 14.8%
United States 11,660 12,100 12,198 0.8%
Japan 9,774 9,278 9,204 –0.8%
Germany 5,907 6,033 6,062 0.5%
India 3,844 4,125 4,488 8.8%
South Korea 4,524 4,555 4,228 –7.2%
Mexico 3,368 3,565 3,597 0.9%
GDP Growth Rates Worldwide
Automotive Vehicle Production of Seven Major Countries
*2 Newly industrializing economies: South Korea, Taiwan, Hong Kong, and SingaporeSource: Mizuho Research Institute Ltd.
Source: Global Note
Report and Analysis of Financial Condition and Results of Operations for the Fiscal Year Ended March 31, 2017
Financial Data
58 TSUBAKI CORPORATE REPORT 2017
2 Detailed Analysis of Consolidated Financial Condition and Results of Operations for the Fiscal Year Ended March 31, 2017
Net Sales
Consolidated net sales declined 2.6% year on year, to ¥198,762
million.
In Chain Operations, net sales decreased 5.3% year on year,
to ¥60,600 million. This decrease in revenues was mainly attribut-
able to yen appreciation, which outweighed a recovery in sales of
drive chains and hose and cable carrier systems in Japan and
steady sales of drive chains in the Americas.
In Power Transmission Units and Components Operations, net
sales decreased 1.9% year on year, to ¥21,563 million. This
decrease in revenues reflected the adverse effect of China’s eco-
nomic slowdown on consolidated subsidiaries in Tianjin and
Shanghai, which counteracted steady sales of actuators and
clutches in Japan.
In Automotive Parts Operations, net sales increased 2.3%
year on year, to ¥75,147 million. Revenues rose because, although
revenues in Japan declined due to lower automotive vehicle pro-
duction, sales of timing chain drive systems rose steadily at
overseas bases.
In Materials Handling Systems Operations, net sales declined
7.5% year on year, to ¥41,043 million. The business segment
posted lower revenues because a significant decrease in sales of
systems for the life science field and the automotive industry in
Japan counteracted a recovery in sales for metalworking chip
handling and coolant processing systems in the United States
and Europe.
Operating Income
Despite lower net sales, consolidated operating income edged
up 0.4% year on year, to ¥21,647 million, reaching a record for
the third consecutive fiscal year.
The Group achieved earnings growth through higher produc-
tion volume, centered on chains and automotive parts, and
through improvements in costs resulting from enhanced pro-
ductivity, which absorbed an approximately ¥3,300 million
increase in personnel costs, depreciation and amortization, and
other fixed costs as well as a roughly ¥800 million reduction in
earnings due to yen appreciation.
The operating income margin improved 0.3 percentage point
year on year, to 10.9%.
In Chain Operations, operating income increased a significant
15.1% year on year. The business segment’s operating income
margin improved (by 2.1 percentage points) thanks to higher
production volume, enhanced productivity, and reduction in the
deficit of manufacturing subsidiaries in Tianjin, China.
In Power Transmission Units and Components Operations,
operating income declined 8.6% year on year. The business seg-
ment’s operating income margin edged down 0.7 percentage
point year on year, to 10.3%, reflecting the lackluster business
results of consolidated subsidiaries in Tianjin and Shanghai in
China as well as an increase in expenses, which arose from
plant reorganization in Japan.
As for Automotive Parts Operations, operating income grew
1.0% year on year. Earnings are continuing to trend upward due
to higher production volume and to improvements in costs
resulting from enhanced productivity. Although an increase in
depreciation and amortization that accompanied higher capital
investment caused a deterioration of 0.2 percentage point in the
business segment’s operating income margin year on year, it
remained at the high level of 16.5%.
Materials Handling Systems Operations saw operating
income increase 7.2% year on year. The business segment’s
operating income margin improved 0.2 percentage point year
on year, to 1.7%, because the steadily emerging benefits of
productivity-improvement efforts and profitability-focused sales
measures more than offset a year-on-year decline in net sales,
which stemmed from a lull in major orders in Japan.
1. Automotive Parts Operations continued to expand, and Chain Operations benefited from initiatives to increase productivity.
2. The Group absorbed yen appreciation, higher depreciation and amortization, and other negative factors for earnings to post record operating income and profit attributable to owners of parent.
1. Review of Management Performance
Key Points
59TSUBAKI CORPORATE REPORT 2017
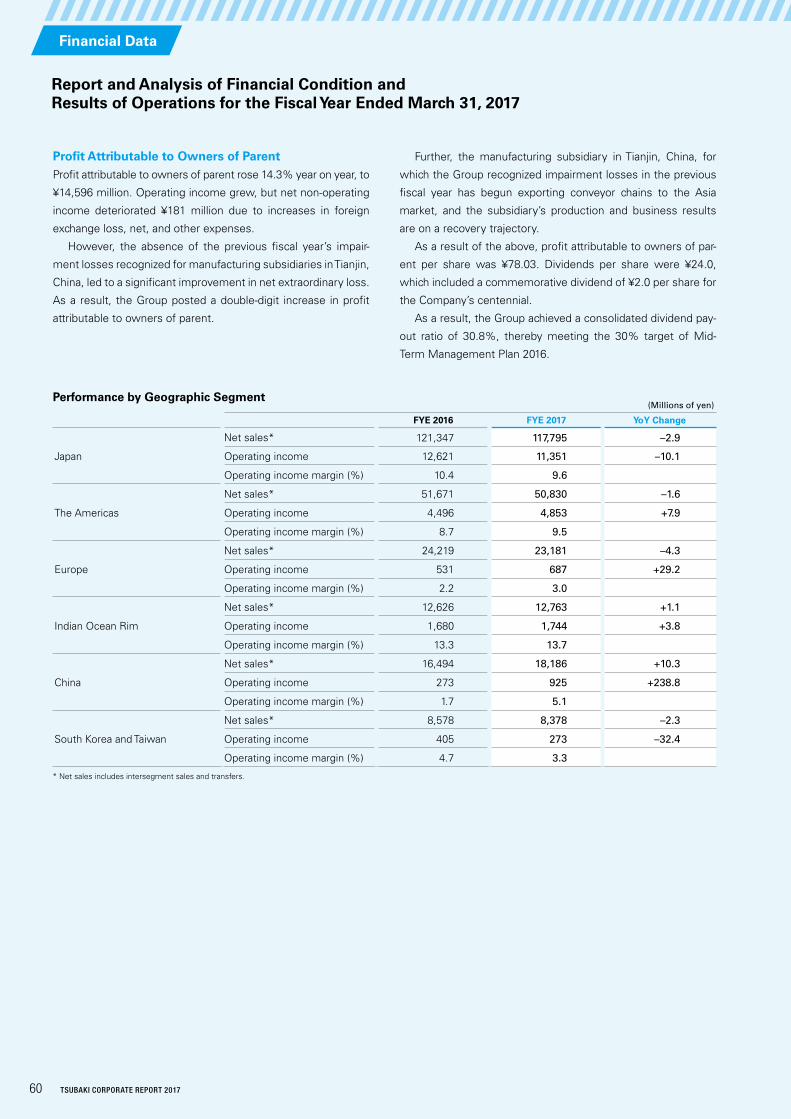
(Millions of yen)
FYE 2016 FYE 2017 YoY Change
Japan
Net sales* 121,347 117,795 –2.9
Operating income 12,621 11,351 –10.1
Operating income margin (%) 10.4 9.6
The Americas
Net sales* 51,671 50,830 –1.6
Operating income 4,496 4,853 +7.9
Operating income margin (%) 8.7 9.5
Europe
Net sales* 24,219 23,181 –4.3
Operating income 531 687 +29.2
Operating income margin (%) 2.2 3.0
Indian Ocean Rim
Net sales* 12,626 12,763 +1.1
Operating income 1,680 1,744 +3.8
Operating income margin (%) 13.3 13.7
China
Net sales* 16,494 18,186 +10.3
Operating income 273 925 +238.8
Operating income margin (%) 1.7 5.1
South Korea and Taiwan
Net sales* 8,578 8,378 –2.3
Operating income 405 273 –32.4
Operating income margin (%) 4.7 3.3
* Net sales includes intersegment sales and transfers.
Pro�t Attributable to Owners of ParentProfit attributable to owners of parent rose 14.3% year on year, to
¥14,596 million. Operating income grew, but net non-operating
income deteriorated ¥181 million due to increases in foreign
exchange loss, net, and other expenses.
However, the absence of the previous fiscal year’s impair-
ment losses recognized for manufacturing subsidiaries in Tianjin,
China, led to a significant improvement in net extraordinary loss.
As a result, the Group posted a double-digit increase in profit
attributable to owners of parent.
Further, the manufacturing subsidiary in Tianjin, China, for
which the Group recognized impairment losses in the previous
fiscal year has begun exporting conveyor chains to the Asia
market, and the subsidiary’s production and business results
are on a recovery trajectory.
As a result of the above, profit attributable to owners of par-
ent per share was ¥78.03. Dividends per share were ¥24.0,
which included a commemorative dividend of ¥2.0 per share for
the Company’s centennial.
As a result, the Group achieved a consolidated dividend pay-
out ratio of 30.8%, thereby meeting the 30% target of Mid-
Term Management Plan 2016.
Report and Analysis of Financial Condition and Results of Operations for the Fiscal Year Ended March 31, 2017
Performance by Geographic Segment
Financial Data
60 TSUBAKI CORPORATE REPORT 2017
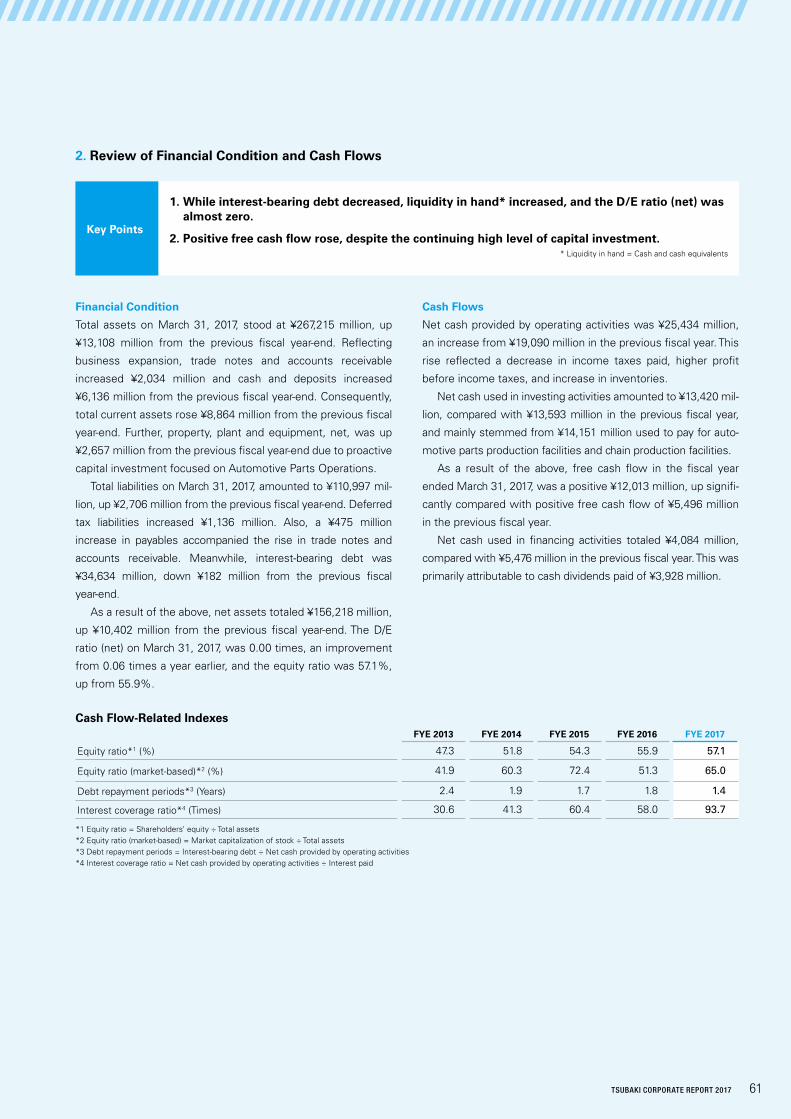
Financial Condition
Total assets on March 31, 2017, stood at ¥267,215 million, up
¥13,108 million from the previous fiscal year-end. Reflecting
business expansion, trade notes and accounts receivable
increased ¥2,034 million and cash and deposits increased
¥6,136 million from the previous fiscal year-end. Consequently,
total current assets rose ¥8,864 million from the previous fiscal
year-end. Further, property, plant and equipment, net, was up
¥2,657 million from the previous fiscal year-end due to proactive
capital investment focused on Automotive Parts Operations.
Total liabilities on March 31, 2017, amounted to ¥110,997 mil-
lion, up ¥2,706 million from the previous fiscal year-end. Deferred
tax liabilities increased ¥1,136 million. Also, a ¥475 million
increase in payables accompanied the rise in trade notes and
accounts receivable. Meanwhile, interest-bearing debt was
¥34,634 million, down ¥182 million from the previous fiscal
year-end.
As a result of the above, net assets totaled ¥156,218 million,
up ¥10,402 million from the previous fiscal year-end. The D/E
ratio (net) on March 31, 2017, was 0.00 times, an improvement
from 0.06 times a year earlier, and the equity ratio was 57.1%,
up from 55.9%.
Cash Flows
Net cash provided by operating activities was ¥25,434 million,
an increase from ¥19,090 million in the previous fiscal year. This
rise reflected a decrease in income taxes paid, higher profit
before income taxes, and increase in inventories.
Net cash used in investing activities amounted to ¥13,420 mil-
lion, compared with ¥13,593 million in the previous fiscal year,
and mainly stemmed from ¥14,151 million used to pay for auto-
motive parts production facilities and chain production facilities.
As a result of the above, free cash flow in the fiscal year
ended March 31, 2017, was a positive ¥12,013 million, up signifi-
cantly compared with positive free cash flow of ¥5,496 million
in the previous fiscal year.
Net cash used in financing activities totaled ¥4,084 million,
compared with ¥5,476 million in the previous fiscal year. This was
primarily attributable to cash dividends paid of ¥3,928 million.
*1 Equity ratio = Shareholders’ equity ÷ Total assets*2 Equity ratio (market-based) = Market capitalization of stock ÷ Total assets*3 Debt repayment periods = Interest-bearing debt ÷ Net cash provided by operating activities*4 Interest coverage ratio = Net cash provided by operating activities ÷ Interest paid
FYE 2013 FYE 2014 FYE 2015 FYE 2016 FYE 2017
Equity ratio*1 (%) 47.3 51.8 54.3 55.9 57.1
Equity ratio (market-based)*2 (%) 41.9 60.3 72.4 51.3 65.0
Debt repayment periods*3 (Years) 2.4 1.9 1.7 1.8 1.4
Interest coverage ratio*4 (Times) 30.6 41.3 60.4 58.0 93.7
2. Review of Financial Condition and Cash Flows
Cash Flow-Related Indexes
1. While interest-bearing debt decreased, liquidity in hand* increased, and the D/E ratio (net) was almost zero.
2. Positive free cash flow rose, despite the continuing high level of capital investment.Key Points
* Liquidity in hand = Cash and cash equivalents
61TSUBAKI CORPORATE REPORT 2017
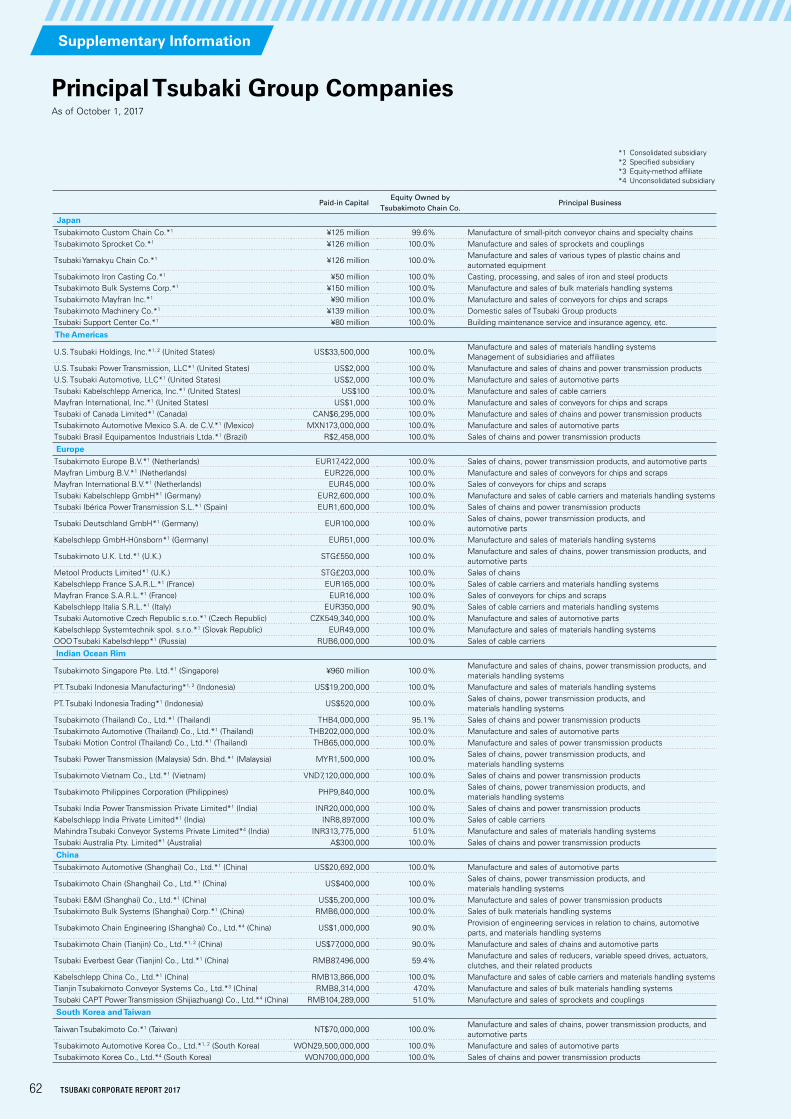
Paid-in CapitalEquity Owned by
Tsubakimoto Chain Co.Principal Business
JapanTsubakimoto Custom Chain Co.*1 ¥125 million 99.6% Manufacture of small-pitch conveyor chains and specialty chainsTsubakimoto Sprocket Co.*1 ¥126 million 100.0% Manufacture and sales of sprockets and couplings
Tsubaki Yamakyu Chain Co.*1 ¥126 million 100.0%Manufacture and sales of various types of plastic chains and automated equipment
Tsubakimoto Iron Casting Co.*1 ¥50 million 100.0% Casting, processing, and sales of iron and steel productsTsubakimoto Bulk Systems Corp.*1 ¥150 million 100.0% Manufacture and sales of bulk materials handling systemsTsubakimoto Mayfran Inc.*1 ¥90 million 100.0% Manufacture and sales of conveyors for chips and scrapsTsubakimoto Machinery Co.*1 ¥139 million 100.0% Domestic sales of Tsubaki Group productsTsubaki Support Center Co.*1 ¥80 million 100.0% Building maintenance service and insurance agency, etc.
The Americas
U.S. Tsubaki Holdings, Inc.*1, 2 (United States) US$33,500,000 100.0%Manufacture and sales of materials handling systemsManagement of subsidiaries and affiliates
U.S. Tsubaki Power Transmission, LLC*1 (United States) US$2,000 100.0% Manufacture and sales of chains and power transmission productsU.S. Tsubaki Automotive, LLC*1 (United States) US$2,000 100.0% Manufacture and sales of automotive partsTsubaki Kabelschlepp America, Inc.*1 (United States) US$100 100.0% Manufacture and sales of cable carriersMayfran International, Inc.*1 (United States) US$1,000 100.0% Manufacture and sales of conveyors for chips and scrapsTsubaki of Canada Limited*1 (Canada) CAN$6,295,000 100.0% Manufacture and sales of chains and power transmission productsTsubakimoto Automotive Mexico S.A. de C.V.*1 (Mexico) MXN173,000,000 100.0% Manufacture and sales of automotive partsTsubaki Brasil Equipamentos Industriais Ltda.*1 (Brazil) R$2,458,000 100.0% Sales of chains and power transmission products
EuropeTsubakimoto Europe B.V.*1 (Netherlands) EUR17,422,000 100.0% Sales of chains, power transmission products, and automotive partsMayfran Limburg B.V.*1 (Netherlands) EUR226,000 100.0% Manufacture and sales of conveyors for chips and scrapsMayfran International B.V.*1 (Netherlands) EUR45,000 100.0% Sales of conveyors for chips and scrapsTsubaki Kabelschlepp GmbH*1 (Germany) EUR2,600,000 100.0% Manufacture and sales of cable carriers and materials handling systemsTsubaki Ibérica Power Transmission S.L.*1 (Spain) EUR1,600,000 100.0% Sales of chains and power transmission products
Tsubaki Deutschland GmbH*1 (Germany) EUR100,000 100.0%Sales of chains, power transmission products, and automotive parts
Kabelschlepp GmbH-Hünsborn*1 (Germany) EUR51,000 100.0% Manufacture and sales of materials handling systems
Tsubakimoto U.K. Ltd.*1 (U.K.) STG£550,000 100.0%Manufacture and sales of chains, power transmission products, and automotive parts
Metool Products Limited*1 (U.K.) STG£203,000 100.0% Sales of chainsKabelschlepp France S.A.R.L.*1 (France) EUR165,000 100.0% Sales of cable carriers and materials handling systemsMayfran France S.A.R.L.*1 (France) EUR16,000 100.0% Sales of conveyors for chips and scrapsKabelschlepp Italia S.R.L.*1 (Italy) EUR350,000 90.0% Sales of cable carriers and materials handling systemsTsubaki Automotive Czech Republic s.r.o.*1 (Czech Republic) CZK549,340,000 100.0% Manufacture and sales of automotive partsKabelschlepp Systemtechnik spol. s.r.o.*1 (Slovak Republic) EUR49,000 100.0% Manufacture and sales of materials handling systemsOOO Tsubaki Kabelschlepp*1 (Russia) RUB6,000,000 100.0% Sales of cable carriers
Indian Ocean Rim
Tsubakimoto Singapore Pte. Ltd.*1 (Singapore) ¥960 million 100.0%Manufacture and sales of chains, power transmission products, and materials handling systems
PT. Tsubaki Indonesia Manufacturing*1, 2 (Indonesia) US$19,200,000 100.0% Manufacture and sales of materials handling systems
PT. Tsubaki Indonesia Trading*1 (Indonesia) US$520,000 100.0%Sales of chains, power transmission products, and materials handling systems
Tsubakimoto (Thailand) Co., Ltd.*1 (Thailand) THB4,000,000 95.1% Sales of chains and power transmission productsTsubakimoto Automotive (Thailand) Co., Ltd.*1 (Thailand) THB202,000,000 100.0% Manufacture and sales of automotive partsTsubaki Motion Control (Thailand) Co., Ltd.*1 (Thailand) THB65,000,000 100.0% Manufacture and sales of power transmission products
Tsubaki Power Transmission (Malaysia) Sdn. Bhd.*1 (Malaysia) MYR1,500,000 100.0%Sales of chains, power transmission products, and materials handling systems
Tsubakimoto Vietnam Co., Ltd.*1 (Vietnam) VND7,120,000,000 100.0% Sales of chains and power transmission products
Tsubakimoto Philippines Corporation (Philippines) PHP9,840,000 100.0%Sales of chains, power transmission products, and materials handling systems
Tsubaki India Power Transmission Private Limited*1 (India) INR20,000,000 100.0% Sales of chains and power transmission productsKabelschlepp India Private Limited*1 (India) INR8,897,000 100.0% Sales of cable carriersMahindra Tsubaki Conveyor Systems Private Limited*4 (India) INR313,775,000 51.0% Manufacture and sales of materials handling systemsTsubaki Australia Pty. Limited*1 (Australia) A$300,000 100.0% Sales of chains and power transmission products
ChinaTsubakimoto Automotive (Shanghai) Co., Ltd.*1 (China) US$20,692,000 100.0% Manufacture and sales of automotive parts
Tsubakimoto Chain (Shanghai) Co., Ltd.*1 (China) US$400,000 100.0%Sales of chains, power transmission products, and materials handling systems
Tsubaki E&M (Shanghai) Co., Ltd.*1 (China) US$5,200,000 100.0% Manufacture and sales of power transmission productsTsubakimoto Bulk Systems (Shanghai) Corp.*1 (China) RMB6,000,000 100.0% Sales of bulk materials handling systems
Tsubakimoto Chain Engineering (Shanghai) Co., Ltd.*4 (China) US$1,000,000 90.0%Provision of engineering services in relation to chains, automotive parts, and materials handling systems
Tsubakimoto Chain (Tianjin) Co., Ltd.*1, 2 (China) US$77,000,000 90.0% Manufacture and sales of chains and automotive parts
Tsubaki Everbest Gear (Tianjin) Co., Ltd.*1 (China) RMB87,496,000 59.4%Manufacture and sales of reducers, variable speed drives, actuators, clutches, and their related products
Kabelschlepp China Co., Ltd.*1 (China) RMB13,866,000 100.0% Manufacture and sales of cable carriers and materials handling systemsTianjin Tsubakimoto Conveyor Systems Co., Ltd.*3 (China) RMB8,314,000 47.0% Manufacture and sales of bulk materials handling systemsTsubaki CAPT Power Transmission (Shijiazhuang) Co., Ltd.*4 (China) RMB104,289,000 51.0% Manufacture and sales of sprockets and couplings
South Korea and Taiwan
Taiwan Tsubakimoto Co.*1 (Taiwan) NT$70,000,000 100.0%Manufacture and sales of chains, power transmission products, and automotive parts
Tsubakimoto Automotive Korea Co., Ltd.*1, 2 (South Korea) WON29,500,000,000 100.0% Manufacture and sales of automotive partsTsubakimoto Korea Co., Ltd.*4 (South Korea) WON700,000,000 100.0% Sales of chains and power transmission products
*1 Consolidated subsidiary*2 Specified subsidiary*3 Equity-method affiliate*4 Unconsolidated subsidiary
Principal Tsubaki Group CompaniesAs of October 1, 2017
Supplementary Information
62 TSUBAKI CORPORATE REPORT 2017
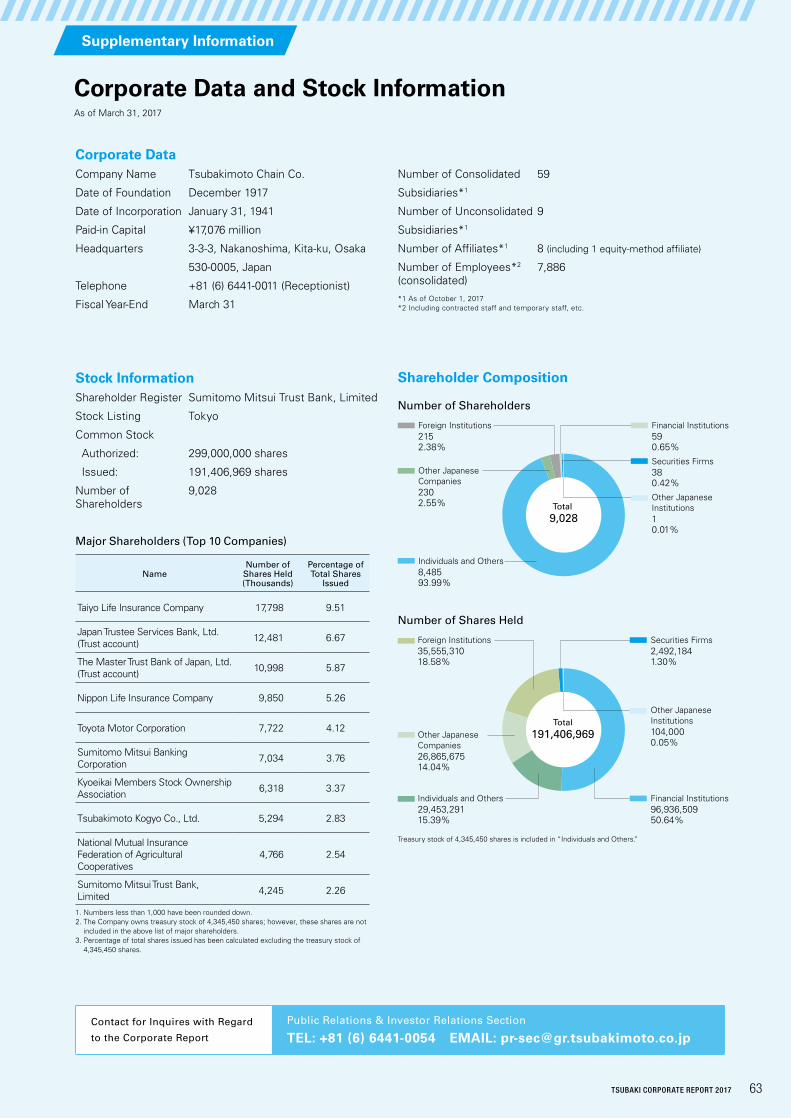
Corporate DataCompany Name Tsubakimoto Chain Co.
Date of Foundation December 1917
Date of Incorporation January 31, 1941
Paid-in Capital ¥17,076 million
Headquarters 3-3-3, Nakanoshima, Kita-ku, Osaka
530-0005, Japan
Telephone +81 (6) 6441-0011 (Receptionist)
Fiscal Year-End March 31
Stock InformationShareholder Register Sumitomo Mitsui Trust Bank, Limited
Stock Listing Tokyo
Common Stock
Authorized: 299,000,000 shares
Issued: 191,406,969 shares
Number of 9,028 Shareholders
Major Shareholders (Top 10 Companies)
Number of Consolidated 59
Subsidiaries*1
Number of Unconsolidated 9
Subsidiaries*1
Number of Affiliates*1 8 ( including 1 equity-method affiliate)
Number of Employees*2 7,886 (consolidated) *1 As of October 1, 2017 *2 Including contracted staff and temporary staff, etc.
NameNumber of
Shares Held (Thousands)
Percentage of Total Shares
Issued
Taiyo Life Insurance Company 17,798 9.51
Japan Trustee Services Bank, Ltd.(Trust account) 12,481 6.67
The Master Trust Bank of Japan, Ltd. (Trust account) 10,998 5.87
Nippon Life Insurance Company 9,850 5.26
Toyota Motor Corporation 7,722 4.12
Sumitomo Mitsui Banking Corporation 7,034 3.76
Kyoeikai Members Stock Ownership Association 6,318 3.37
Tsubakimoto Kogyo Co., Ltd. 5,294 2.83
National Mutual Insurance Federation of Agricultural Cooperatives
4,766 2.54
Sumitomo Mitsui Trust Bank, Limited 4,245 2.26
1. Numbers less than 1,000 have been rounded down.2. The Company owns treasury stock of 4,345,450 shares; however, these shares are not
included in the above list of major shareholders.3. Percentage of total shares issued has been calculated excluding the treasury stock of
4,345,450 shares.
Contact for Inquires with Regard
to the Corporate Report
Public Relations & Investor Relations Section
TEL: +81 (6) 6441-0054 EMAIL: [email protected]
Treasury stock of 4,345,450 shares is included in “Individuals and Others.”
Shareholder Composition
Number of Shares Held
Number of Shareholders
Other JapaneseCompanies2302.55%
Securities Firms380.42%
Foreign Institutions2152.38%
Individuals and Others8,48593.99%
Other JapaneseInstitutions10.01%
Financial Institutions590.65%
Total 9,028
Total191,406,969
Securities Firms2,492,1841.30%
Financial Institutions96,936,50950.64%
Other JapaneseCompanies26,865,67514.04%
Individuals and Others29,453,29115.39%
Foreign Institutions35,555,31018.58%
Other JapaneseInstitutions104,0000.05%
Corporate Data and Stock InformationAs of March 31, 2017
Supplementary Information
63TSUBAKI CORPORATE REPORT 2017
http://tsubakimoto.comPublished November 2017 Printed in Japan


![New Arrivals Central Library November 2018 · True psychology / Swami Abhedananda.: Ramakrishna Vedanta Math, 1992 159.9 N20;1 [66974] Click here for more details Who moved my cheese?](https://img.pdfslide.us/doc/110x75/5e9195089aa7b728377dcd8d/new-arrivals-central-library-november-2018-true-psychology-swami-abhedananda.jpg)