Embed Size (px)
Citation preview

TSR, Executive Compensation, and Firm Performance∗
A Brief Prepared by the Institute for Compensation Studies
ILR School, Cornell University
Hassan Enayati, Kevin Hallock, and Linda Barrington
October 1, 2015
∗Funding for this study was provided by Pearl Meyer & Partners, jointly agreeing with the Institute for
Compensation Studies (ICS) authors on the research question of interest. Pearl Meyer & Partners obtained
the underlying data from Equilar, Inc., a leading independent provider of executive and board compensation
data and analysis. Pearl Meyer & Partners provided these data to ICS for analysis, including additional
data on companies from Capital IQ, and “compensation plan TSR existence and weight” variables that they
constructed. Pearl Meyer & Partners provided valuable insight on how executive compensation is structured
in the corporate landscape, which helped ICS ensure its models were valid in terms of real-world practice
and terminology. Independently, ICS conducted the statistical analyses herein.
We thank Stephanie Thomas and the consultants at Pearl Meyer & Partners for helpful comments.
1

1 Overview
• Particularly since the recent recession, the general public and policy makers have been
interested in aligning the incentives of executives with the incentives of shareholders.
• Embedding Total Shareholder Return (TSR) target metrics into top executive com-
pensation plans have been described as a simple and direct tool to align incentives.
• Despite the increased popularity of such TSR plans, the empirical evidence supporting
the expansion of this compensation strategy is limited.
• This brief aims to shed light on whether the inclusion of TSR measures in long-term
incentive plans result in improved firm performance.1
2 Data
The population of study for this research were identified using the 2014 S&P 500 index. A
rich longitudinal dataset was constructed using compensation data and firm financial data
covering fiscal years 2004 through 2013. Our analytical sample excluded 47 firms from this
population due to missing data concerns and another two firms as outliers.2 The information
regarding compensation was derived from Equilar’s executive compensation data. These data
contain detailed records of the compensation types and amounts for named executive officers
from firms in our sample. For example, we observe base salary, bonus payouts, stock awards,
option awards, and several types of incentive plan awards. Measures of firm performance
include 1, 3 and 5-year TSR as well as annual measures of return on equity (ROE), earning
per share (EPS) growth, and total revenue growth. Firm performance measures came from
1This brief is meant only to summarize the analytical research conducted to date. A full-length academicworking paper is forthcoming.
2These two outliers were classified as such because they had firm performance measures outside of thereasonable range of values, suggesting data error. The trimming parameters were set to flag observationswhere total revenue growth exceeded 100 percent, 1/3/5 TSR was above 5, or ROE was not between negativeone and positive one.
2
Capital IQ.3
3 Methodology
To examine how the inclusion of TSR plans impact firm performance, we used both de-
scriptive analysis and also regression analysis. The descriptive analysis compared the raw
patterns among groups of firms with and without TSR plans over time. The resulting tables
and figures are valuable in understanding the unconditional relationship between TSR plans
and firm performance. All analysis was conducted on three subsamples of executives: top
five named executive officers (NEOs), CEOs only, and top five NEOs excluding CEOs.
Regression analysis was used to as a way to control for other factors related to the role of
TSR measures on firm performance. Our baseline model uses the following Ordinary Least
Squares regression framework:
Yit = β1 + Zitβ2 + Sitβ3 + Ctβ4 + β5Xit + β6Xi,t−1 + β7Xi,t−2 + εit (1)
Yit represents a given performance measure for firm i in fiscal year t. The set of firm
performance measures studied in this brief are 1-year TSR, 3-year TSR, 5-year TSR, ROE,
EPS growth, and total revenue growth. Zit is a set of control variables including functions of
market capitalization and an indicator for change in CEO. Our model also accounts for sector
performance and year fixed effects with Sit and Ct, respectively. The key variables in this
project capture the existence and weight of TSR measures in the top executive compensation
plans, represented by Xit. For the existence of a TSR plan, Xit, is an indicator variable equal
to one when a firm has any executive in the relative sample with a TSR plan during the
current fiscal year. To analyze the role of weight on performance, Xit is set to the firm-
level average of the ratio of TSR award to either long term incentives (LTI) or total direct
3We would like to thank Pearl Meyer & Partners for providing us with the data used in this brief and alsofor constructing the key measures of TSR plan existence, TSR plan awards, performance-based compensation,long-term incentive pay, total compensation, and others.
3
compensation (TDC).4 Our baseline model includes two lags of Xit. Finally, the remaining
error in the model is captured by εit, which is clustered at the firm level.
Multiple extensions of the baseline model were investigated to assess the sensitivity of our
findings. One extension replaced the sector fixed effects with firm effects, which allows the
model to control for unobserved firm-specific and fixed attributes.5 We also partitioned the
sample by firm size and by TSR plan history. Additional sensitivity checks include removing
the Financials sector from the analysis and running models with a richer set of lag measures.
4 Results
Descriptive Statistics
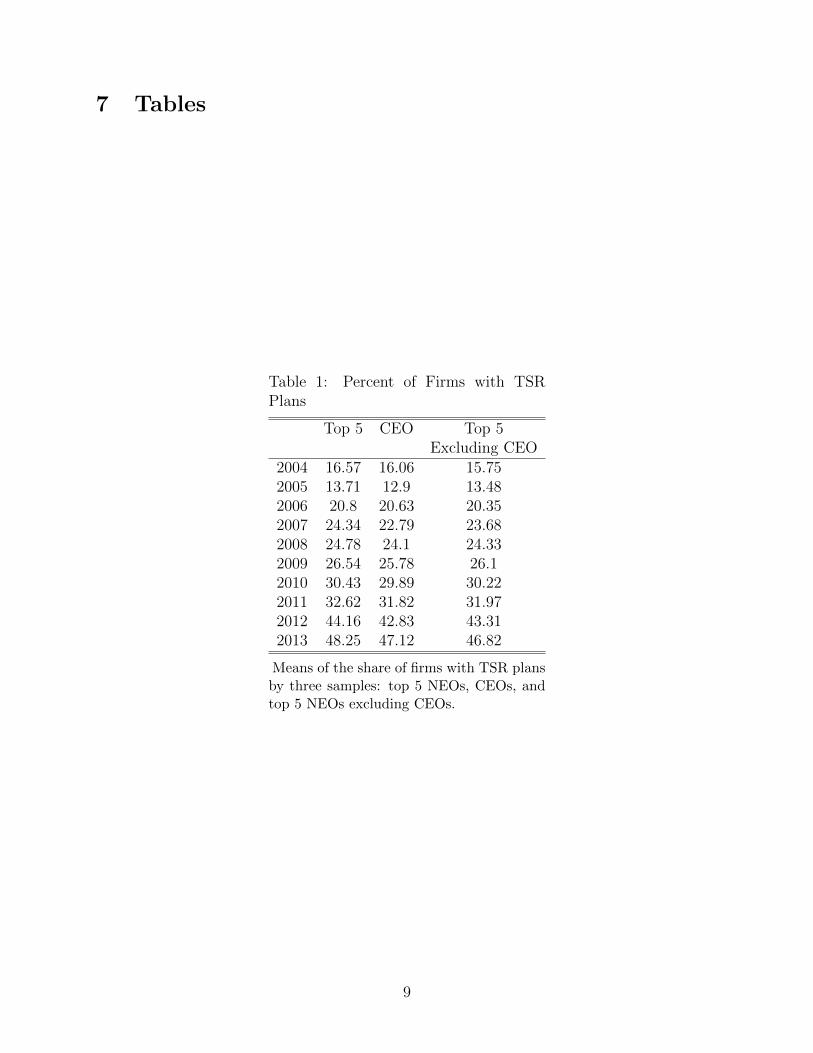
• Table 1 shows that for all three groups (Top 5, CEOs, and Top 5 Excluding CEOs)
the share of firms with TSR plans has increased from roughly 16 percent of firms to
just under 50 percent of firms.
• Table 2 reports how the weight of TSR has changed over time. The increasing pat-
terns in the unconditional columns and decreasing patterns in the conditional columns
suggests that more executives are receiving TSR measures in their compensation plans
but that the relative weight of those TSR plans is decreasing.
• Table 3 confirms the findings from Table 2 by demonstrating that the growth in the
weight of performance-based grants is a result of growth in non-TSR components.
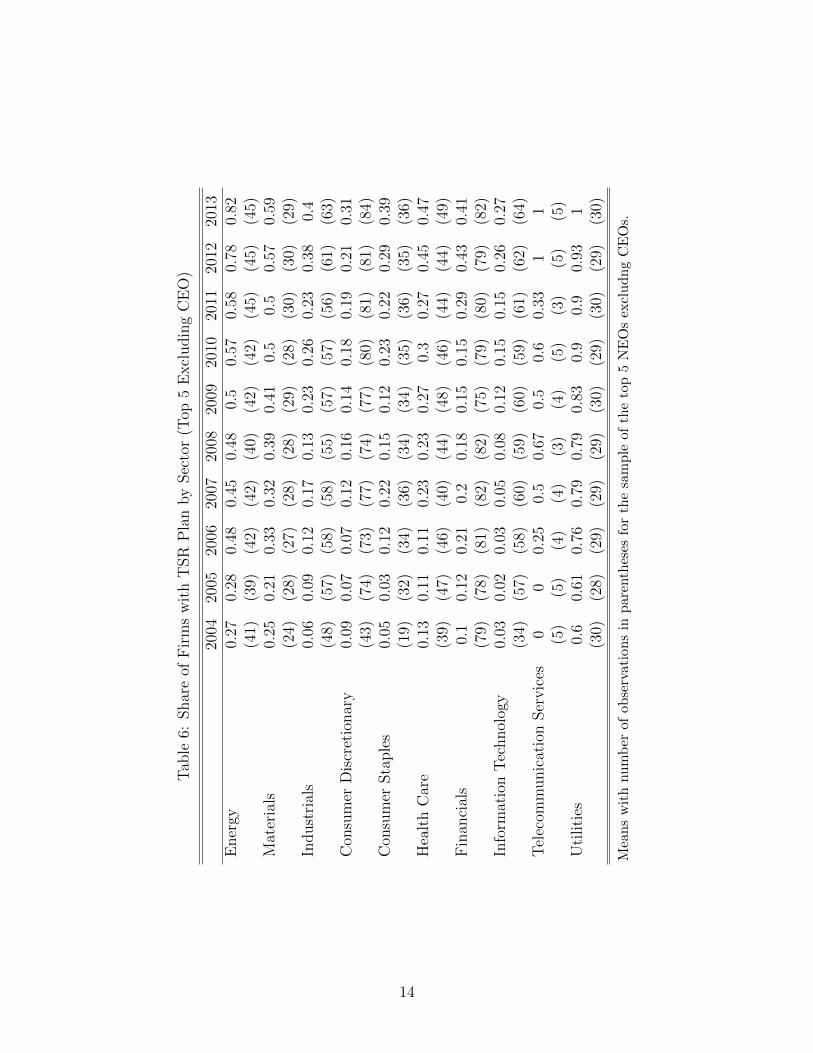
• Tables 4 through 6 show that firms in all sectors have increasingly included TSR plans
in the compensation of their executives.
• Table 7 groups firms by whether they always had a TSR plan, never had a TSR plan, or
changed. This grouping indicates that the firms that change are larger while upholding
4See Appendix for variable definitions.5For a thorough explanation of fixed effects techniques see Wooldridge, Jeffrey M. Econometric analysis
of cross section and panel data. MIT press, 2010.
4

the previous finding that those with TSR plans tend to be less profitable.
Regression Analysis
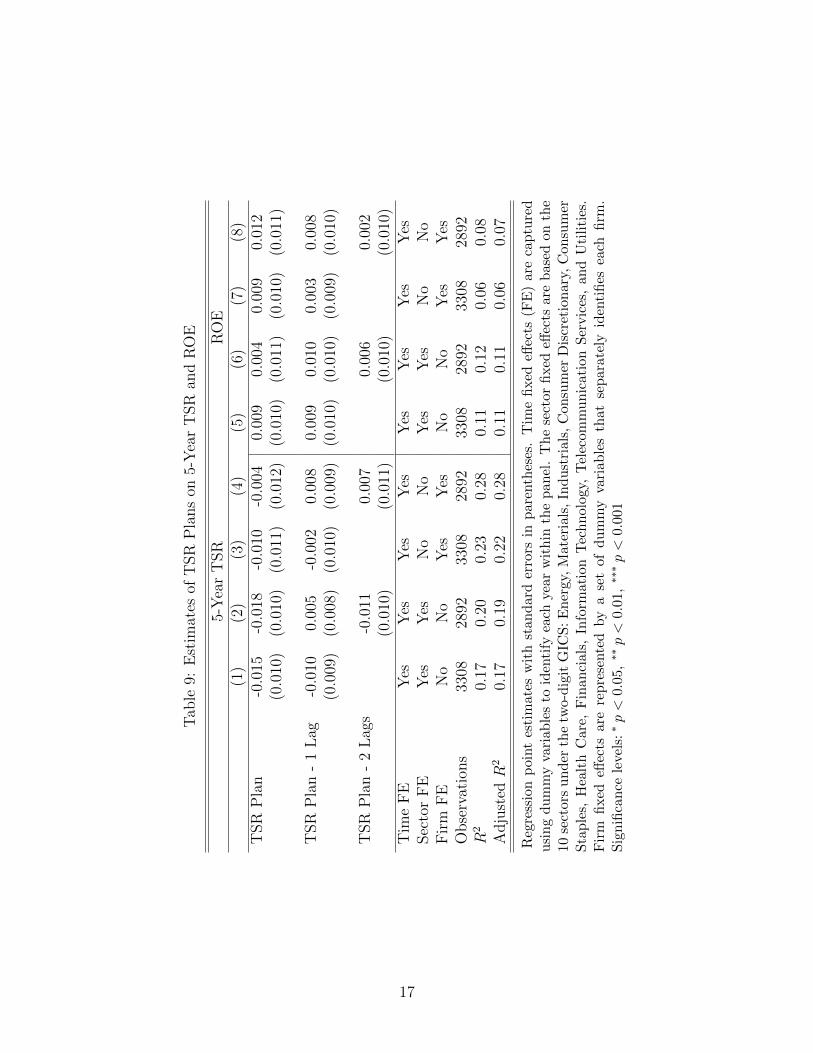
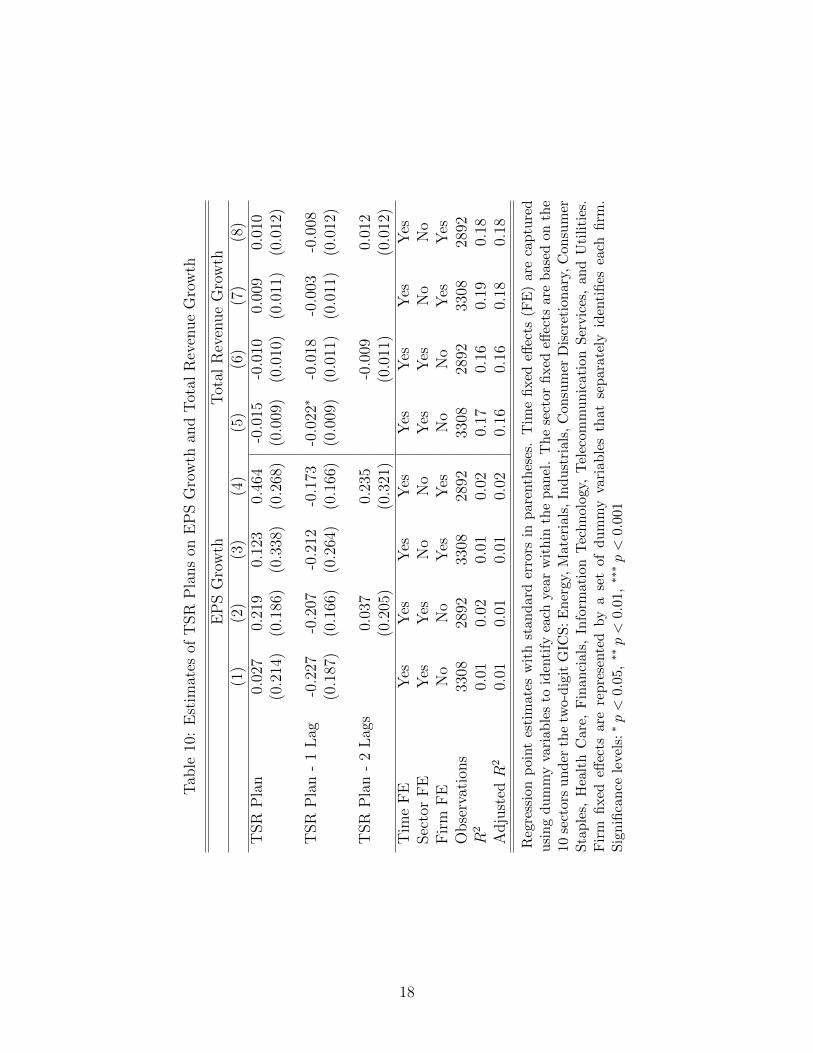
• Estimates of TSR plans on firm performance (Tables 8 through 10) indicate that there is
no strong evidence of a positive impact of TSR plans on firm performance. Moreover,
we find that point estimates of TSR plans on 1/3/5 year TSR measures are often
negative while only occasionally being statistically significant.
• For example, the right panel of Table 10 reports the estimates of the role of TSR plans
on total revenue growth.
– The estimates of the first lag of TSR plan on revenue growth, i.e., how is the
existence of a TSR plan among any of the company’s NEOs one year ago related
to current revenue growth, are negative.
– Column 5 indicates that the existence of a TSR plan one year ago is associated
with a decline in current revenue growth by 2.2 percentage points.
• Moreover, further analyses find a consistent pattern of a negative relationship between
TSR plans and total revenue growth, where the one year lag appears to be the driving
factor.
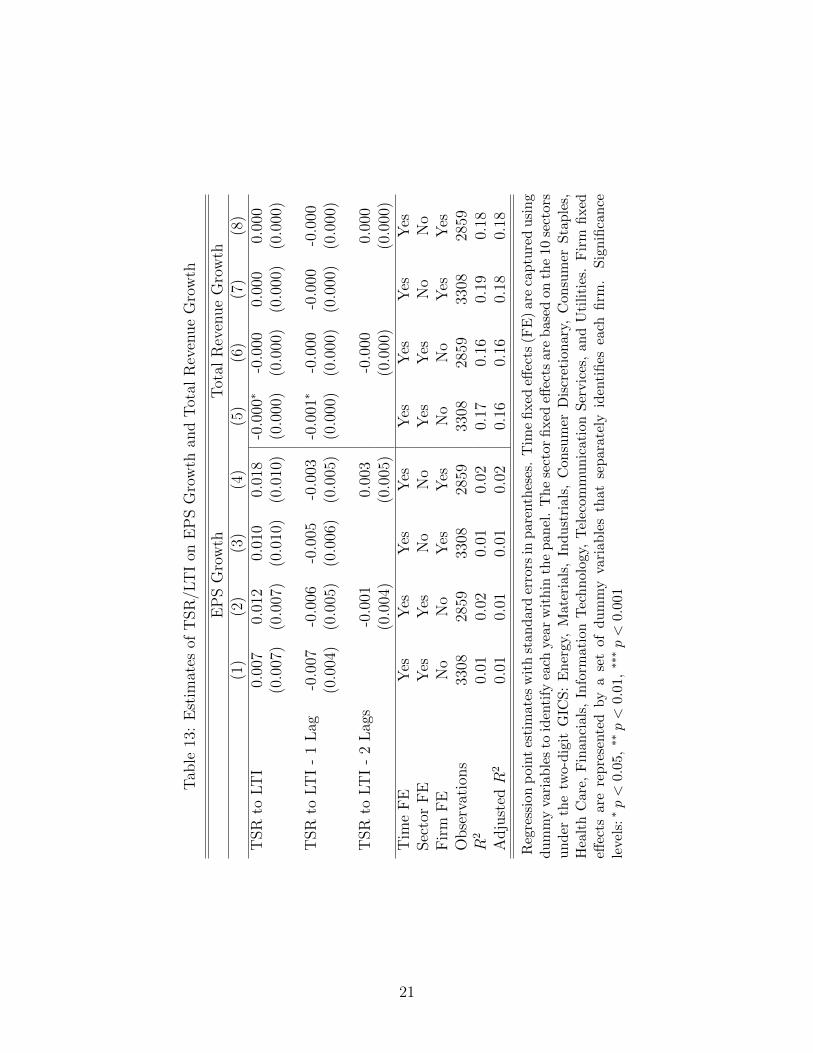
• Estimates of relative TSR to LTI on firm performance (Tables 11 through 13) continue
to present evidence of a negative relationship between TSR measures and total revenue
growth.
– Models incorporating firm fixed effects find small but statistically significant pos-
itive estimates of the role of contemporaneous TSR weights on ROE
– Specifically, a one percent increase in the ratio of TSR to LTI is associated with
a 0.1 percent increase in ROE.
5
• Additional analyses examined the sensitivity of the above regression estimates by quar-
tile of market capitalization, exclusion of the Financials sector, exclusion of firms with-
out changing TSR policies, richer five year lagged dependent variable structure, and
limiting the analysis to only those firms with relative TSR to LTI greater than 50
percent.6
5 Discussion and Future Direction
Currently, almost half of the 2014 S&P 500 firms offer TSR plans to their named executive
officers (NEO) - a twofold increase between 2004 and 2013. As evidenced by Table 2, the
increase in the weight of TSR awards to both LTI and TDC appears to be the result of
more NEOs receiving low weighted TSR plans. Furthermore, increases in the weight of
performance-based pay to both LTI and TDC over time are related to the increases in both
the frequency and weight of performance-based grants over time. The expansion of TSR
plans is observed across all sectors, with particularly large uptake within the Consumer
Staples and Information Technology sectors.
Differences are observable in the firms that include TSR measures into the compensation
plans of their executives compared to those that do not include TSR plans. Firms with TSR
plans tend to be larger (as measured by market capitalization and total revenue) and less
profitable (as measured by 10 year compound annual growth rates (CAGR) of Net Income,
ROIC, EBIT, EPS, ROA, ROE, and Free Cash Flow). The evidence from our primary model
specifications as well as numerous sensitivity checks indicate that there is either no impact
of TSR plans on firm performance or weak evidence of a negative relationship.
An important caution of these results needs to be noted. As with any regression models
of the type deployed here, statistical results only indicate relationship, not causation. That
said, the models controlled for a wide range of likely influential factors, including firm size,
sector, change in CEO leadership, time effects, and firm-specific fixed effects.
6The results of these analyses are available from the authors upon request.
6
The academic literature around TSR awards and firm performance is very limited. This
project represents the first academic effort to address this topic. The importance of this work
is not only to clarify the trends associated with expanding TSR plans for executives of S&P
500 companies, but to surface the need for further empirical research on the relationship
between including TSR and other metrics of firm performance in the compensation plans of
top executives and the ultimate sustainable financial success for the firms they lead. The
future steps in this line of research could examine, for example, more refined measures of
TSR awards. This work is an important first, not final, step in the examination of executive
performance pay.
7

6 Appendix
This appendix provides variable definitions for key measures used in this study.
• TSR outcome measures, where the closing price is adjusted for dividends
– 1-Year TSR: (Fiscal year end stock price/previous fiscal year end stock price)-1
– 3-Year TSR: {(Fiscal year end stock price/three fiscal year priors end stock
price)(̂1/3)}-1
– 5-Year TSR: {(Fiscal year end stock price/five fiscal year priors end stock price)(̂1/5)}-
1
• TDC measures
– For FY 2006-2013: TDC = Long-Term Incentives + Base Salary + Short-Term
Portion of NEIP Compensation + Bonus
– For FY 2004-2005: TDC = Base Salary + Bonus + Other Annual Compensation
+ Restricted Stock + Value of Stock Options (FAS 123(R)) + LTIP Payouts +
Other Compensation
• LTI measures
– For FY 2006-2013: LTI = Grant Date Present Value of Securities + Grant Date
Present Value of Option (FAS 123(R)) + Grant Date Present Value of Target
Award
– For FY 2004-2005: LTI = Restricted Stock Awards + Grant Date Present Value
of Option (FAS 123(R)) + FYE Target Value
8
7 Tables
Table 1: Percent of Firms with TSRPlans
Top 5 CEO Top 5Excluding CEO
2004 16.57 16.06 15.752005 13.71 12.9 13.482006 20.8 20.63 20.352007 24.34 22.79 23.682008 24.78 24.1 24.332009 26.54 25.78 26.12010 30.43 29.89 30.222011 32.62 31.82 31.972012 44.16 42.83 43.312013 48.25 47.12 46.82
Means of the share of firms with TSR plansby three samples: top 5 NEOs, CEOs, andtop 5 NEOs excluding CEOs.
9

Tab
le2:
Wei
ght
ofT
SR
Pla
n
Top
5C
EO
Top
5E
xcl
udin
gC
EO
Unco
ndit
ional
Con
dit
ional
onT
SR
Unco
ndit
ional
Con
dit
ional
onT
SR
Unco
ndit
ional
Con
dit
ional
onT
SR
(1)
(2)
(3)
(4)
(5)
(6)
(7)
(8)
(9)
(10)
(11)
(12)
Yea
rLT
IT
DC
LT
IT
DC
LT
IT
DC
LT
IT
DC
LT
IT
DC
LT
IT
DC
2004
7.77
546
.64
31.6
57.
875.
2750
.13
37.6
47.
584.
6247
.86
30.9
220
056.
293.
4845
.68
26.6
16.
343.
4948
.23
29.9
66.
333.
3246
.54
25.8
2006
7.87
4.89
38.0
424
.24
8.8
5.73
41.6
428
.66
7.87
4.91
38.5
724
.65
2007
8.69
5.41
36.2
322
.86
9.37
6.12
41.1
27.8
38.
595.
2536
.47
22.6
2008
8.8
5.71
35.2
623
.04
10.0
66.
9740
.24
28.7
38.
565.
4134
.96
22.2
520
098.
915.
8334
.12
22.5
410
.23
6.99
38.9
427
.53
8.68
5.57
33.8
321
.920
1010
.29
6.44
33.8
221
.27
11.5
17.
6537
.94
25.7
210
.05
6.16
33.3
20.4
820
1110
.88
7.04
34.0
522
.12
11.6
98.
0336
.78
25.7
10.7
46.
8134
.321
.83
2012
14.8
59.
6735
.28
23.0
716
.74
11.5
140
28.2
314
.46
9.23
35.0
822
.47
2013
16.3
810
.77
35.2
423
.31
18.3
512
.95
39.9
628
.62
15.9
510
.24
35.4
122
.87
Mea
ns
ofth
ew
eigh
tof
TS
Rp
lan
sby
thre
esa
mp
les:
top
5N
EO
s,C
EO
s,an
dto
p5
NE
Os
excl
udin
gC
EO
s.U
nco
nd
itio
nal
esti
mat
esin
clu
de
firm
sw
ith
zero
ind
ivid
uals
(wit
hre
spec
tto
the
sam
ple
)re
por
ted
toh
ave
aT
SR
pla
n.
Con
dit
ion
alon
TS
Res
tim
ates
excl
ud
efi
rms
wit
hze
roin
div
idu
als
(wit
hre
spec
tto
the
sam
ple
)re
por
ted
toh
ave
aT
SR
pla
n.
10

Tab
le3:
Wei
ght
ofP
erfo
rman
ceP
ay
Un
con
dit
ion
alC
ond
itio
nal
onP
erfo
rman
ceP
ay
Yea
rN
on
-TS
RP
PN
on-T
SR
PP
PP
PP
Non
-TS
RP
PN
on-T
SR
PP
PP
PP
toLT
Ito
TD
Cto
LT
Ito
TD
Cto
LT
Ito
TD
Cto
LT
Ito
TD
C(1
)(2
)(3
)(4
)(5
)(6
)(7
)(8
)
Top
52004
8.8
55.
9616
.62
10.9
52.
983.
5749
.62
35.2
220
05
9.35
615
.64
9.49
1.87
1.7
47.5
528
.31
2006
30.3
17.3
838
.17
22.2
822
.44
13.7
360
.48
37.9
720
07
38.2
422
46.9
327
.41
21.7
613
.31
57.9
936
.17
2008
39.3
324
.14
48.1
329
.85
26.7
517
.35
62.0
140
.39
2009
40.5
424
.72
49.4
430
.55
29.3
218
.48
63.4
341
.02
2010
40.1
423
.79
50.4
230
.23
28.1
717
.15
61.9
938
.42
2011
41.8
425
.952
.72
32.9
329
.14
18.2
663
.19
40.3
820
12
41.6
326
.44
56.4
836
.11
29.9
219
65.2
42.0
720
13
42.8
327
.56
59.2
138
.33
3119
.86
66.2
443
.17
CE
O20
04
8.6
6.79
16.4
712
.06
1.63
1.82
51.7
639
.45
2005
10.0
97.
3516
.43
10.8
40.
510.
548
.74
30.4
620
06
30.7
19.0
439
.524
.77
19.2
413
.260
.88
41.8
620
07
38.5
223
.53
47.9
29.6
519
.53
13.5
160
.63
41.3
420
08
39.0
125
.73
49.0
732
.724
.01
17.1
164
.25
45.8
420
09
41.0
526
.66
51.2
833
.65
26.6
418
.53
65.5
946
.06
2010
40.3
525
.551
.86
33.1
525
.88
17.1
463
.82
42.8
620
11
41.9
627
.73
53.6
535
.76
26.7
418
.36
63.5
244
.06
2012
41.5
428
.21
58.2
839
.72
28.0
419
.59
68.0
547
.83
2013
42.4
829
.92
60.8
342
.87
28.0
720
.03
68.0
348
.65
Top
5-
2004
9.0
55.
816
.63
10.4
21.
41.
4449
.26
32.3
6E
xcl
ud
ing
CE
O2005
9.2
85.
6715
.62
8.99
0.49
0.41
47.0
326
.22
2006
30.3
17.0
438
.18
21.9
522
.08
13.3
360
.65
37.9
820
07
38.2
421
.65
46.8
326
.922
.38
13.2
758
.85
35.8
720
08
39.4
223
.77
47.9
929
.19
27.3
217
.36
62.2
839
.61
2009
40.4
424
.27
49.1
229
.85
29.9
618
.46
63.7
940
.36
2010
40.1
823
.38
50.2
429
.53
28.6
117
.11
61.9
137
.59
2011
41.8
625
.44
52.6
32.2
529
.28
17.9
163
.57
39.7
420
12
41.7
325
.99
56.1
935
.22
29.8
518
.48
64.9
340
.94
2013
42.9
826
.96
58.9
337
.230
.86
19.2
466
.27
42.1
2
Mea
ns
ofth
ew
eigh
tof
per
form
an
cepay
by
thre
esa
mp
les:
top
5N
EO
s,C
EO
s,an
dto
p5
NE
Os
excl
udin
gC
EO
s.U
nco
nd
itio
nal
esti
mat
esin
clu
de
firm
sw
ith
zero
ind
ivid
ual
s(w
ith
resp
ect
toth
esa
mp
le)
rep
orte
dto
hav
ep
erfo
rman
ce-b
ased
com
pen
sati
on.
Con
dit
ion
alon
TS
Res
tim
ates
excl
ud
efi
rms
wit
hze
roin
div
idu
als
(wit
hre
spec
tto
the
sam
ple
)re
por
ted
toh
ave
per
form
ance
-b
ased
com
pen
sati
on
.
11

Tab
le4:
Shar
eof
Fir
ms
wit
hT
SR
Pla
nby
Sec
tor
(Top
5)
2004
2005
2006
2007
2008
2009
2010
2011
2012
2013
Ener
gy0.
270.
280.
480.
450.
480.
50.
570.
580.
780.
84(4
1)(3
9)(4
2)(4
2)(4
0)(4
2)(4
2)(4
5)(4
5)(4
5)M
ater
ials
0.25
0.21
0.33
0.32
0.39
0.41
0.5
0.5
0.57
0.59
(24)
(28)
(27)
(28)
(28)
(29)
(28)
(30)
(30)
(29)
Indust
rial
s0.
080.
090.
140.
220.
150.
250.
260.
270.
380.
41(4
8)(5
7)(5
8)(5
8)(5
5)(5
7)(5
7)(5
6)(6
1)(6
3)C
onsu
mer
Dis
cret
ionar
y0.
090.
070.
070.
120.
160.
140.
190.
190.
230.
32(4
3)(7
4)(7
3)(7
7)(7
4)(7
7)(8
0)(8
1)(8
1)(8
4)C
onsu
mer
Sta
ple
s0.
050.
030.
120.
220.
150.
120.
230.
220.
290.
42(1
9)(3
2)(3
4)(3
6)(3
4)(3
4)(3
5)(3
6)(3
5)(3
6)H
ealt
hC
are
0.13
0.11
0.11
0.23
0.25
0.29
0.3
0.27
0.45
0.49
(39)
(47)
(46)
(40)
(44)
(48)
(46)
(44)
(44)
(49)
Fin
anci
als
0.1
0.12
0.21
0.2
0.18
0.15
0.15
0.3
0.43
0.44
(79)
(78)
(81)
(82)
(82)
(75)
(79)
(80)
(79)
(82)
Info
rmat
ion
Tec
hnol
ogy
0.03
0.02
0.03
0.05
0.08
0.12
0.15
0.15
0.29
0.27
(34)
(57)
(58)
(60)
(59)
(60)
(59)
(61)
(62)
(64)
Tel
ecom
munic
atio
nSer
vic
es0.
20.
20.
50.
50.
670.
50.
60.
331
1(5
)(5
)(4
)(4
)(3
)(4
)(5
)(3
)(5
)(5
)U
tiliti
es0.
630.
610.
760.
790.
790.
830.
90.
90.
931
(30)
(28)
(29)
(29)
(29)
(30)
(29)
(30)
(29)
(30)
Mea
ns
wit
hnu
mb
erof
obse
rvat
ion
sin
par
enth
eses
for
the
sam
ple
ofth
eto
p5
NE
Os.
12

Tab
le5:
Shar
eof
Fir
ms
wit
hT
SR
Pla
nby
Sec
tor
(CE
O)
2004
2005
2006
2007
2008
2009
2010
2011
2012
2013
Ener
gy0.
250.
280.
490.
430.
480.
50.
590.
590.
760.
78(4
0)(3
9)(4
1)(4
2)(4
0)(4
2)(4
1)(4
4)(4
5)(4
5)M
ater
ials
0.25
0.21
0.33
0.32
0.39
0.38
0.5
0.5
0.53
0.59
(24)
(28)
(27)
(28)
(28)
(29)
(28)
(30)
(30)
(29)
Indust
rial
s0.
090.
090.
140.
220.
150.
250.
250.
270.
350.
4(4
7)(5
7)(5
8)(5
8)(5
5)(5
7)(5
7)(5
6)(6
0)(6
3)C
onsu
mer
Dis
cret
ionar
y0.
070.
040.
070.
10.
140.
120.
180.
160.
230.
31(4
2)(7
3)(7
1)(7
7)(7
3)(7
6)(7
8)(8
0)(7
9)(8
4)C
onsu
mer
Sta
ple
s0.
050.
030.
120.
170.
120.
120.
230.
230.
290.
42(1
9)(3
2)(3
3)(3
5)(3
3)(3
4)(3
5)(3
5)(3
5)(3
6)H
ealt
hC
are
0.13
0.11
0.11
0.23
0.25
0.27
0.26
0.25
0.45
0.49
(39)
(47)
(46)
(40)
(44)
(48)
(46)
(44)
(44)
(49)
Fin
anci
als
0.1
0.1
0.2
0.17
0.18
0.15
0.15
0.3
0.41
0.44
(78)
(78)
(80)
(81)
(82)
(71)
(79)
(80)
(79)
(82)
Info
rmat
ion
Tec
hnol
ogy
0.03
0.02
0.04
0.03
0.09
0.1
0.16
0.13
0.3
0.25
(31)
(55)
(57)
(58)
(57)
(59)
(57)
(60)
(61)
(63)
Tel
ecom
munic
atio
nSer
vic
es0.
20.
20.
50.
50.
670.
50.
60.
331
1(5
)(5
)(4
)(4
)(3
)(4
)(5
)(3
)(5
)(5
)U
tiliti
es0.
60.
570.
720.
760.
760.
830.
90.
870.
91
(30)
(28)
(29)
(29)
(29)
(30)
(29)
(30)
(29)
(30)
Mea
ns
wit
hnu
mb
erof
obse
rvat
ion
sin
par
enth
eses
for
the
sam
ple
ofC
EO
s.
13
Tab
le6:
Shar
eof
Fir
ms
wit
hT
SR
Pla
nby
Sec
tor
(Top
5E
xcl
udin
gC
EO
)
2004
2005
2006
2007
2008
2009
2010
2011
2012
2013
Ener
gy0.
270.
280.
480.
450.
480.
50.
570.
580.
780.
82(4
1)(3
9)(4
2)(4
2)(4
0)(4
2)(4
2)(4
5)(4
5)(4
5)M
ater
ials
0.25
0.21
0.33
0.32
0.39
0.41
0.5
0.5
0.57
0.59
(24)
(28)
(27)
(28)
(28)
(29)
(28)
(30)
(30)
(29)
Indust
rial
s0.
060.
090.
120.
170.
130.
230.
260.
230.
380.
4(4
8)(5
7)(5
8)(5
8)(5
5)(5
7)(5
7)(5
6)(6
1)(6
3)C
onsu
mer
Dis
cret
ionar
y0.
090.
070.
070.
120.
160.
140.
180.
190.
210.
31(4
3)(7
4)(7
3)(7
7)(7
4)(7
7)(8
0)(8
1)(8
1)(8
4)C
onsu
mer
Sta
ple
s0.
050.
030.
120.
220.
150.
120.
230.
220.
290.
39(1
9)(3
2)(3
4)(3
6)(3
4)(3
4)(3
5)(3
6)(3
5)(3
6)H
ealt
hC
are
0.13
0.11
0.11
0.23
0.23
0.27
0.3
0.27
0.45
0.47
(39)
(47)
(46)
(40)
(44)
(48)
(46)
(44)
(44)
(49)
Fin
anci
als
0.1
0.12
0.21
0.2
0.18
0.15
0.15
0.29
0.43
0.41
(79)
(78)
(81)
(82)
(82)
(75)
(79)
(80)
(79)
(82)
Info
rmat
ion
Tec
hnol
ogy
0.03
0.02
0.03
0.05
0.08
0.12
0.15
0.15
0.26
0.27
(34)
(57)
(58)
(60)
(59)
(60)
(59)
(61)
(62)
(64)
Tel
ecom
munic
atio
nSer
vic
es0
00.
250.
50.
670.
50.
60.
331
1(5
)(5
)(4
)(4
)(3
)(4
)(5
)(3
)(5
)(5
)U
tiliti
es0.
60.
610.
760.
790.
790.
830.
90.
90.
931
(30)
(28)
(29)
(29)
(29)
(30)
(29)
(30)
(29)
(30)
Mea
ns
wit
hnu
mb
erof
obse
rvat
ion
sin
par
enth
eses
for
the
sam
ple
ofth
eto
p5
NE
Os
excl
ud
ng
CE
Os.
14

Tab
le7:
Fir
mC
har
acte
rist
ics
by
TSR
Pla
nP
atte
rn(T
op5)
Alw
ays
TSR
Chan
geT
SR
Nev
erT
SR
Mar
ket
Cap
-A
vg
2538
0.28
2574
6.1
1922
3.57
(0.3
1)(0
.1)
Tot
alR
even
ue
-A
vg
1884
6.49
1722
3.51
1507
2.41
(0.3
9)(0
.46)
10Y
rN
etIn
cC
AG
R6.
667.
711
.51
(0.0
2)(0
)10
Yr
RO
ICC
AG
R0.
880.
421.
82(0
.5)
(0.1
5)10
Yr
EB
ITC
AG
R5.
757.
6612
.38
(0)
(0)
10Y
rE
PS
CA
GR
6.95
6.05
11.4
7(0
.03)
(0)
10Y
rR
OA
CA
GR
0.05
0.06
0.07
(0)
(0)
10Y
rR
OE
CA
GR
0.31
0.14
0.18
(0.0
4)(0
.29)
10Y
rF
CF
CA
GR
4.33
8.56
11.3
7(0
.01)
(0.0
9)O
bse
rvat
ions
5518
820
8
Mea
ns
wit
hp
-val
ues
inp
aren
thes
esfo
rth
esa
mp
leof
the
top
five
NE
Os.
Fir
ms
are
gro
up
edin
toth
ree
grou
ps
bas
edon
the
sam
ple
per
iod
:th
ose
that
alw
ays
had
aT
SR
pla
n,
thos
eth
atn
ever
had
aT
SR
pla
n,
and
thos
eth
atch
anged
thei
rT
SR
pla
ns
by
eith
erin
trod
uci
ng
orre
mov
ing
them
.
15

Tab
le8:
Est
imat
esof
TSR
Pla
ns
on1-
Yea
rT
SR
and
3-Y
ear
TSR
1-Y
ear
TSR
3-Y
ear
TSR
(1)
(2)
(3)
(4)
(5)
(6)
(7)
(8)
TSR
Pla
n-0
.010
-0.0
090.
011
0.01
0-0
.004
-0.0
020.
016
0.02
1(0
.028
)(0
.023
)(0
.034
)(0
.028
)(0
.010
)(0
.011
)(0
.013
)(0
.012
)
TSR
Pla
n-
1L
ag-0
.008
0.02
2-0
.012
0.00
2-0
.009
0.01
00.
007
0.01
0(0
.029
)(0
.039
)(0
.033
)(0
.036
)(0
.011
)(0
.012
)(0
.014
)(0
.013
)
TSR
Pla
n-
2L
ags
-0.0
48-0
.021
-0.0
21-0
.003
(0.0
30)
(0.0
31)
(0.0
13)
(0.0
15)
Tim
eF
EY
esY
esY
esY
esY
esY
esY
esY
esSec
tor
FE
Yes
Yes
No
No
Yes
Yes
No
No
Fir
mF
EN
oN
oY
esY
esN
oN
oY
esY
esO
bse
rvat
ions
3308
2892
3308
2892
3308
2892
3308
2892
R2
0.15
0.17
0.18
0.21
0.16
0.21
0.19
0.29
Adju
sted
R2
0.14
0.16
0.18
0.21
0.15
0.21
0.19
0.29
Reg
ress
ion
poi
nt
esti
mate
sw
ith
stan
dar
der
rors
inp
aren
thes
es.
Tim
efi
xed
effec
ts(F
E)
are
cap
ture
du
sin
gd
um
my
vari
ab
les
toid
enti
fyea
chye
arw
ith
inth
ep
anel
.T
he
sect
orfi
xed
effec
tsar
eb
ased
onth
e10
sect
ors
un
der
the
two-
dig
itG
ICS
:E
ner
gy,
Mat
eria
ls,
Ind
ust
rial
s,C
onsu
mer
Dis
cret
ion
ary,
Con
sum
erS
tap
les,
Hea
lth
Car
e,F
inan
cial
s,In
form
atio
nT
ech
nol
ogy,
Tel
ecom
mu
nic
atio
nS
ervic
es,
and
Uti
liti
es.
Fir
mfi
xed
effec
tsare
rep
rese
nte
dby
ase
tof
du
mm
yva
riab
les
that
sep
arat
ely
iden
tifi
esea
chfi
rm.
Sig
nifi
can
cele
vels
:∗p<
0.0
5,∗∗
p<
0.0
1,∗∗
∗p<
0.00
1
16
Tab
le9:
Est
imat
esof
TSR
Pla
ns
on5-
Yea
rT
SR
and
RO
E
5-Y
ear
TSR
RO
E(1
)(2
)(3
)(4
)(5
)(6
)(7
)(8
)T
SR
Pla
n-0
.015
-0.0
18-0
.010
-0.0
040.
009
0.00
40.
009
0.01
2(0
.010
)(0
.010
)(0
.011
)(0
.012
)(0
.010
)(0
.011
)(0
.010
)(0
.011
)
TSR
Pla
n-
1L
ag-0
.010
0.00
5-0
.002
0.00
80.
009
0.01
00.
003
0.00
8(0
.009
)(0
.008
)(0
.010
)(0
.009
)(0
.010
)(0
.010
)(0
.009
)(0
.010
)
TSR
Pla
n-
2L
ags
-0.0
110.
007
0.00
60.
002
(0.0
10)
(0.0
11)
(0.0
10)
(0.0
10)
Tim
eF
EY
esY
esY
esY
esY
esY
esY
esY
esSec
tor
FE
Yes
Yes
No
No
Yes
Yes
No
No
Fir
mF
EN
oN
oY
esY
esN
oN
oY
esY
esO
bse
rvat
ions
3308
2892
3308
2892
3308
2892
3308
2892
R2
0.17
0.20
0.23
0.28
0.11
0.12
0.06
0.08
Adju
sted
R2
0.17
0.19
0.22
0.28
0.11
0.11
0.06
0.07
Reg
ress
ion
poi
nt
esti
mate
sw
ith
stan
dar
der
rors
inp
aren
thes
es.
Tim
efi
xed
effec
ts(F
E)
are
cap
ture
du
sin
gd
um
my
vari
ab
les
toid
enti
fyea
chye
arw
ith
inth
ep
anel
.T
he
sect
orfi
xed
effec
tsar
eb
ased
onth
e10
sect
ors
un
der
the
two-
dig
itG
ICS
:E
ner
gy,
Mat
eria
ls,
Ind
ust
rial
s,C
onsu
mer
Dis
cret
ion
ary,
Con
sum
erS
tap
les,
Hea
lth
Car
e,F
inan
cial
s,In
form
atio
nT
ech
nol
ogy,
Tel
ecom
mu
nic
atio
nS
ervic
es,
and
Uti
liti
es.
Fir
mfi
xed
effec
tsare
rep
rese
nte
dby
ase
tof
du
mm
yva
riab
les
that
sep
arat
ely
iden
tifi
esea
chfi
rm.
Sig
nifi
can
cele
vels
:∗p<
0.0
5,∗∗
p<
0.0
1,∗∗
∗p<
0.00
1
17
Tab
le10
:E
stim
ates
ofT
SR
Pla
ns
onE
PS
Gro
wth
and
Tot
alR
even
ue
Gro
wth
EP
SG
row
thT
otal
Rev
enue
Gro
wth
(1)
(2)
(3)
(4)
(5)
(6)
(7)
(8)
TSR
Pla
n0.
027
0.21
90.
123
0.46
4-0
.015
-0.0
100.
009
0.01
0(0
.214
)(0
.186
)(0
.338
)(0
.268
)(0
.009
)(0
.010
)(0
.011
)(0
.012
)
TSR
Pla
n-
1L
ag-0
.227
-0.2
07-0
.212
-0.1
73-0
.022
∗-0
.018
-0.0
03-0
.008
(0.1
87)
(0.1
66)
(0.2
64)
(0.1
66)
(0.0
09)
(0.0
11)
(0.0
11)
(0.0
12)
TSR
Pla
n-
2L
ags
0.03
70.
235
-0.0
090.
012
(0.2
05)
(0.3
21)
(0.0
11)
(0.0
12)
Tim
eF
EY
esY
esY
esY
esY
esY
esY
esY
esSec
tor
FE
Yes
Yes
No
No
Yes
Yes
No
No
Fir
mF
EN
oN
oY
esY
esN
oN
oY
esY
esO
bse
rvat
ions
3308
2892
3308
2892
3308
2892
3308
2892
R2
0.01
0.02
0.01
0.02
0.17
0.16
0.19
0.18
Adju
sted
R2
0.01
0.01
0.01
0.02
0.16
0.16
0.18
0.18
Reg
ress
ion
poi
nt
esti
mate
sw
ith
stan
dar
der
rors
inp
aren
thes
es.
Tim
efi
xed
effec
ts(F
E)
are
cap
ture
du
sin
gd
um
my
vari
ab
les
toid
enti
fyea
chye
arw
ith
inth
ep
anel
.T
he
sect
orfi
xed
effec
tsar
eb
ased
onth
e10
sect
ors
un
der
the
two-
dig
itG
ICS
:E
ner
gy,
Mat
eria
ls,
Ind
ust
rial
s,C
onsu
mer
Dis
cret
ion
ary,
Con
sum
erS
tap
les,
Hea
lth
Car
e,F
inan
cial
s,In
form
atio
nT
ech
nol
ogy,
Tel
ecom
mu
nic
atio
nS
ervic
es,
and
Uti
liti
es.
Fir
mfi
xed
effec
tsare
rep
rese
nte
dby
ase
tof
du
mm
yva
riab
les
that
sep
arat
ely
iden
tifi
esea
chfi
rm.
Sig
nifi
can
cele
vels
:∗p<
0.0
5,∗∗
p<
0.0
1,∗∗
∗p<
0.00
1
18

Tab
le11
:E
stim
ates
ofT
SR
/LT
Ion
1-Y
ear
TSR
and
3-Y
ear
TSR
1-Y
ear
TSR
3-Y
ear
TSR
(1)
(2)
(3)
(4)
(5)
(6)
(7)
(8)
TSR
toLT
I-0
.001
-0.0
00-0
.000
0.00
0-0
.000
-0.0
000.
000
0.00
1(0
.001
)(0
.000
)(0
.001
)(0
.001
)(0
.000
)(0
.000
)(0
.000
)(0
.000
)
TSR
toLT
I-
1L
ag-0
.000
0.00
10.
000
0.00
00.
000
0.00
00.
001
0.00
0(0
.001
)(0
.001
)(0
.001
)(0
.001
)(0
.000
)(0
.000
)(0
.000
)(0
.000
)
TSR
toLT
I-
2L
ags
-0.0
01-0
.001
-0.0
000.
000
(0.0
01)
(0.0
01)
(0.0
00)
(0.0
00)
Tim
eF
EY
esY
esY
esY
esY
esY
esY
esY
esSec
tor
FE
Yes
Yes
No
No
Yes
Yes
No
No
Fir
mF
EN
oN
oY
esY
esN
oN
oY
esY
esO
bse
rvat
ions
3308
2859
3308
2859
3308
2859
3308
2859
R2
0.15
0.17
0.18
0.21
0.16
0.21
0.19
0.29
Adju
sted
R2
0.14
0.16
0.18
0.21
0.15
0.21
0.19
0.29
Reg
ress
ion
poi
nt
esti
mate
sw
ith
stan
dar
der
rors
inp
aren
thes
es.
Tim
efi
xed
effec
ts(F
E)
are
cap
ture
du
sin
gd
um
my
vari
ab
les
toid
enti
fyea
chye
arw
ith
inth
ep
anel
.T
he
sect
orfixed
effec
tsar
eb
ased
onth
e10
sect
ors
un
der
the
two-
dig
itG
ICS
:E
ner
gy,
Mat
eria
ls,
Indu
stri
als,
Con
sum
erD
iscr
etio
nar
y,C
onsu
mer
Sta
ple
s,H
ealt
hC
are
,F
inan
cials
,In
form
atio
nT
ech
nol
ogy,
Tel
ecom
mu
nic
atio
nS
ervic
es,
and
Uti
liti
es.
Fir
mfi
xed
effec
tsare
rep
rese
nte
dby
ase
tof
du
mm
yva
riab
les
that
sep
arat
ely
iden
tifi
esea
chfi
rm.
Sig
nifi
can
cele
vels
:∗p<
0.05,∗∗
p<
0.0
1,∗∗
∗p<
0.00
1
19

Tab
le12
:E
stim
ates
ofT
SR
/LT
Ion
3-Y
ear
TSR
and
RO
E
5-Y
ear
TSR
RO
E(1
)(2
)(3
)(4
)(5
)(6
)(7
)(8
)T
SR
toLT
I-0
.000
-0.0
00-0
.000
0.00
00.
000
0.00
00.
001∗
0.00
1∗
(0.0
00)
(0.0
00)
(0.0
00)
(0.0
00)
(0.0
00)
(0.0
00)
(0.0
00)
(0.0
00)
TSR
toLT
I-
1L
ag-0
.000
0.00
00.
000
0.00
0∗0.
000
0.00
00.
000
0.00
0(0
.000
)(0
.000
)(0
.000
)(0
.000
)(0
.000
)(0
.000
)(0
.000
)(0
.000
)
TSR
toLT
I-
2L
ags
-0.0
000.
000
0.00
00.
000
(0.0
00)
(0.0
00)
(0.0
00)
(0.0
00)
Tim
eF
EY
esY
esY
esY
esY
esY
esY
esY
esSec
tor
FE
Yes
Yes
No
No
Yes
Yes
No
No
Fir
mF
EN
oN
oY
esY
esN
oN
oY
esY
esO
bse
rvat
ions
3308
2859
3308
2859
3308
2859
3308
2859
R2
0.17
0.20
0.23
0.28
0.11
0.12
0.07
0.08
Adju
sted
R2
0.17
0.19
0.22
0.28
0.11
0.11
0.06
0.08
Reg
ress
ion
poi
nt
esti
mate
sw
ith
stan
dar
der
rors
inp
aren
thes
es.
Tim
efi
xed
effec
ts(F
E)
are
cap
ture
du
sin
gd
um
my
vari
ab
les
toid
enti
fyea
chye
arw
ith
inth
ep
anel
.T
he
sect
orfixed
effec
tsar
eb
ased
onth
e10
sect
ors
un
der
the
two-
dig
itG
ICS
:E
ner
gy,
Mat
eria
ls,
Indu
stri
als,
Con
sum
erD
iscr
etio
nar
y,C
onsu
mer
Sta
ple
s,H
ealt
hC
are
,F
inan
cials
,In
form
atio
nT
ech
nol
ogy,
Tel
ecom
mu
nic
atio
nS
ervic
es,
and
Uti
liti
es.
Fir
mfi
xed
effec
tsare
rep
rese
nte
dby
ase
tof
du
mm
yva
riab
les
that
sep
arat
ely
iden
tifi
esea
chfi
rm.
Sig
nifi
can
cele
vels
:∗p<
0.05,∗∗
p<
0.0
1,∗∗
∗p<
0.00
1
20
Tab
le13
:E
stim
ates
ofT
SR
/LT
Ion
EP
SG
row
than
dT
otal
Rev
enue
Gro
wth
EP
SG
row
thT
otal
Rev
enue
Gro
wth
(1)
(2)
(3)
(4)
(5)
(6)
(7)
(8)
TSR
toLT
I0.
007
0.01
20.
010
0.01
8-0
.000
∗-0
.000
0.00
00.
000
(0.0
07)
(0.0
07)
(0.0
10)
(0.0
10)
(0.0
00)
(0.0
00)
(0.0
00)
(0.0
00)
TSR
toLT
I-
1L
ag-0
.007
-0.0
06-0
.005
-0.0
03-0
.001
∗-0
.000
-0.0
00-0
.000
(0.0
04)
(0.0
05)
(0.0
06)
(0.0
05)
(0.0
00)
(0.0
00)
(0.0
00)
(0.0
00)
TSR
toLT
I-
2L
ags
-0.0
010.
003
-0.0
000.
000
(0.0
04)
(0.0
05)
(0.0
00)
(0.0
00)
Tim
eF
EY
esY
esY
esY
esY
esY
esY
esY
esSec
tor
FE
Yes
Yes
No
No
Yes
Yes
No
No
Fir
mF
EN
oN
oY
esY
esN
oN
oY
esY
esO
bse
rvat
ions
3308
2859
3308
2859
3308
2859
3308
2859
R2
0.01
0.02
0.01
0.02
0.17
0.16
0.19
0.18
Adju
sted
R2
0.01
0.01
0.01
0.02
0.16
0.16
0.18
0.18
Reg
ress
ion
poi
nt
esti
mate
sw
ith
stan
dar
der
rors
inp
aren
thes
es.
Tim
efi
xed
effec
ts(F
E)
are
cap
ture
du
sin
gd
um
my
vari
ab
les
toid
enti
fyea
chye
arw
ith
inth
ep
anel
.T
he
sect
orfixed
effec
tsar
eb
ased
onth
e10
sect
ors
un
der
the
two-
dig
itG
ICS
:E
ner
gy,
Mat
eria
ls,
Indu
stri
als,
Con
sum
erD
iscr
etio
nar
y,C
onsu
mer
Sta
ple
s,H
ealt
hC
are
,F
inan
cials
,In
form
atio
nT
ech
nol
ogy,
Tel
ecom
mu
nic
atio
nS
ervic
es,
and
Uti
liti
es.
Fir
mfi
xed
effec
tsare
rep
rese
nte
dby
ase
tof
du
mm
yva
riab
les
that
sep
arat
ely
iden
tifi
esea
chfi
rm.
Sig
nifi
can
cele
vels
:∗p<
0.05,∗∗
p<
0.0
1,∗∗
∗p<
0.00
1
21