Embed Size (px)
Citation preview

Seismic reprocessing and interpretation of a fractured-basement play:Texas Panhandle
Thang Ha1 and Kurt Marfurt1
Abstract
The Panhandle-Hugoton field, of Texas, Oklahoma, and Kansas, is a giant oil field and is the largest conven-tional gas field in North America. Most hydrocarbon production in this field comes from the Wichita Uplift area,where the basement is the most shallow. Although the field has been extensively produced, many local hydro-carbon accumulations have not been fully exploited. Recent drilling activity in the survey indicates that somewells produce directly from basement fractures, suggesting a new play type for the area. Because the target isshallow, the seismic data are heavily contaminated by coherent noise, such as ground roll and head waves,creating challenges for seismic processing. To improve the seismic interpretation, we carefully reprocessedthe field gathers resulting in improved correlation within the sedimentary and the basement sections. Correlat-ing well control to seismic attribute volumes indicates that a fractured basement gives rise to lower P-waveimpedance and strong amplitude versus azimuth anomalies. The azimuthal anisotropy is strongest in a directionparallel to the regional maximum horizontal stress, suggesting that these fractures are open. Coherence anoma-lies indicate a rugose basement surface, whereas curvature shows two lineament sets, consistent with theweathering and fractured exposure of basement in the Wichita Mountains to the southeast.
IntroductionFractured-basement reservoirs, also known as
“buried-hill” reservoirs (Trinh and Warren, 2009), havelong been famous for their complex structure. Althoughanticlinal and fault traps are among most commonly tar-geted structural shapes, fractured basement reservoirsare often associated with giant oil fields around theworld, such as the La Paz field in Venezuela and theCuu Long Basin in Vietnam. An example of such a largefractured-basement reservoir is the Panhandle Hugotonfield in the United States. Estimated ultimate recoveryof the field is 1400 million barrels of oil and 75 trillioncubic feet of gas (Sorenson, 2005). The field spans ap-proximately 9500 mi2, covering parts of 19 counties inthree states: Texas, Oklahoma, and Kansas. The firstsuccessful gas well was drilled on the Amarillo Uplift in1918 (Pippin, 1970), after which the production quicklyspread out with more than 30,000 wells across threestates. The field is well-known for its technical chal-lenges, such as low-reservoir pressure and variation influid-contact elevation (Sorenson, 2005).
The study area is located in the southern part of thePanhandle-Hugoton field, covering an area of approxi-mately 13.5 mi2 (Figure 1). Figure 2 shows a schematicgeologic cross section close to the seismic survey usedin this study (Sorenson, 2005). The survey is on top ofthe (buried) Wichita Uplift. Although most of the oil
production comes from the northern edge of the field,local hydrocarbon accumulations have been found insome wells, producing directly from basement frac-tures. By improving seismic images and performingseismic attribute analysis, we aim to identify zones ofenhanced basement fractures that can form localizedoil reservoirs.
We begin our paper by describing the geologic set-ting of the study area, before summarizing previouswork that had been done. Next, we describe our seismicreprocessing workflow, including velocity analysis, lin-ear noise suppression, and structure-oriented filtering,using well ties to compare our result with the previousvendor-processed data to show the improvement in theseismic image. Finally, we demonstrate how seismicattributes, impedance inversion, and amplitude versusazimuth (AVAz) anisotropy analysis delineate zones oflow impedance and high anisotropy surrounding the pro-ducing well locations that correspond to areas of en-hanced basement fractures oriented north–northeast/south–southwest (parallel to the direction of the regionalmaximum horizontal stress).
Geologic settingThe geologic history of the study area is tightly asso-
ciated with the development of the adjacent WichitaUplift and the Anadarko Basin (Figure 2). Source rocks
1University of Oklahoma, Norman, Oklahoma, USA. E-mail: [email protected]; [email protected] received by the Editor 14 March 2017; revised manuscript received 19 May 2017; published ahead of production 01 June 2017;
published online 05 July 2017. This paper appears in Interpretation, Vol. 5, No. 3 (August 2017); p. SK179–SK187, 19 FIGS.http://dx.doi.org/10.1190/INT-2017-0055.1. © 2017 Society of Exploration Geophysicists and American Association of Petroleum Geologists. All rights reserved.
t
Special section: Subsurface expression of igneous systems and their impacts on petroleum systems
Interpretation / August 2017 SK179Interpretation / August 2017 SK179
Dow
nloa
ded
08/2
4/17
to 1
29.1
5.66
.178
. Red
istr
ibut
ion
subj
ect t
o SE
G li
cens
e or
cop
yrig
ht; s
ee T
erm
s of
Use
at h
ttp://
libra
ry.s
eg.o
rg/

located in the deeper part of the Anadarko Basin havean age range from Ordovician to Pennsylvanian, includ-ing the Mississippian-age Woodford Shale. Figure 3shows a simplified stratigraphic column of the studyarea. The most common reservoir rocks are the earlyPermian carbonate and the Granite Wash, although lo-cal hydrocarbon accumulation has been found to be as-sociated with fractures within the granitic basement.Above the reservoir rocks, the middle Permian evapo-rite acts as a seal. Hydrocarbons are believed to migratefrom the deeper part of the Anadarko Basin through thegranite wash and fractures in the basement toward thesouth–southwest before being trapped in the upper partof the basement within the Wichita Uplift (Sorenson,2005). An analog to the fractured basement is the“crab-eye rock” at Charon’s Garden, Wichita Mountains(Figure 4).
Previous workBarnes et al. (2012) study the architecture of the
igneous basement of West Texas using geochronologicand isotopic information obtained from wells. They findthat the basement is composed of felsic (e.g., graniteand rhyolite) and mafic (e.g., basalt and gabbro) rocktypes, with the mafic rocks (1440–1560 Ma) generallyyounger than the felsic rocks (1520–1740 Ma). Maficsills are encountered in many wells, including the threein the survey discussed in this paper.
Xu (2014) provides a regional geophysical interpre-tation of the Panhandle field. By constructing regionalgravity and magnetic maps, he find that the WichitaUplift is characterized by a strong positive anomalyin gravity and magnetic data, suggesting that a maficintrusion within the granitic basement is shalloweralong the axis of the Wichita Mountains. Using 3Dtomography based on first-break picking, he was able tocorrelate the well markers of the Permian evaporates,
Figure 1. Map view of the Panhandle-Hugoton oil and gasfield (Sorenson, 2005). The red rectangle indicates the approxi-mate location of the study area. The study area is located in thesouthwest of the Wichita Uplift. Contours are of the surfaceelevation.
Figure 2. Regional geologic cross sectionthrough the Panhandle field (Sorenson, 2005).Source rocks are located in the deeper part ofthe Anadarko Basin and have an age rangefrom Ordovician to Pennsylvanian, includingthe Mississippian Woodford Shale. Reservoirrocks include the early Permian carbonate,the granite wash, and fractured basement.Above the reservoir rocks, middle Permianevaporite acts as a seal. Hydrocarbons are be-lieved to migrate from the deeper part of theAnadarko Basin through the granite washand fractures in the basement toward thesouth–southwest before being trapped in theupper part of the basement within the WichitaUplift.
SK180 Interpretation / August 2017
Dow
nloa
ded
08/2
4/17
to 1
29.1
5.66
.178
. Red
istr
ibut
ion
subj
ect t
o SE
G li
cens
e or
cop
yrig
ht; s
ee T
erm
s of
Use
at h
ttp://
libra
ry.s
eg.o
rg/

the brown dolomites, the granite wash, and the graniticbasement with discrete seismic reflection events.
Seismic reprocessingDue to financial and geologic constraints, the seismic
data acquired for this survey face some critical chal-lenges. To save time and reduce the cost during seismicacquisition, having observed “poor penetration” ofhigher frequencies to the exploration objective on older2D data surveys, the vibroseis sweeping frequency waslimited to 60 Hz, thereby lowering the vertical seismicresolution. Rough terrain and highways create gaps inthe source-receiver geometry, causing a strong acquis-ition footprint, especially in the shallow part of the data(Figure 5). Because the basement is very shallow (ap-proximately 762 m [2500 ft] deep) and is capped by athick, high-velocity evaporite layer, hyperbolic reflectionsare overprinted by strong coherent noise, includingground roll, head waves, and reverberations. Beyondcritical refraction (offsets greater than 975 m [3200 ft]),seismic data are overprinted by strong, low-frequencyhead waves, whose moveout is tangential to the reflec-tors of interest. Improving upon the vendor-processed
Figure 4. “Crab-eye rock” at Charon’s Garden, WichitaMountains (note how it looks like a frowny crab). The rockis composed of fractured granite with multiple sets of jointsthat are several tens of feet apart and serves as an outcropanalog to the fractured basement 762 m (2500 ft) below thesurface in the survey area.
Figure 5. Source (red squares) and receiver (blue crosses)geometry of the seismic survey. Linear gaps in source andreceiver locations are associated with roads. Other smaller,circular gaps are areas inaccessible to vibroseis trucks. Thesegaps, together with the rectangular gridding geometry, gener-ate acquisition footprint in seismic data, especially at a shal-low target depth.
Figure 3. Simplified stratigraphic column of the study area(Xu, 2014). Basement rock is composed mostly of granite.The basement was exposed and uplifted during Pennsylvaniantime and was subjected to weathering, thus creating a thinblanket of granitic conglomerate (or granite wash) coveringthe top basement. The Wolfcamp carbonate was depositedthereafter, including the brown dolomite. The granite washand the brown dolomite are the two main reservoir rocks.Later, a thick layer of evaporite was deposited, which actedas a seal to prevent hydrocarbon from migrating upward. Fi-nally, the Red Cave shale was deposited, which marks thechange from a marine to a fluvial environment.
Interpretation / August 2017 SK181
Dow
nloa
ded
08/2
4/17
to 1
29.1
5.66
.178
. Red
istr
ibut
ion
subj
ect t
o SE
G li
cens
e or
cop
yrig
ht; s
ee T
erm
s of
Use
at h
ttp://
libra
ry.s
eg.o
rg/
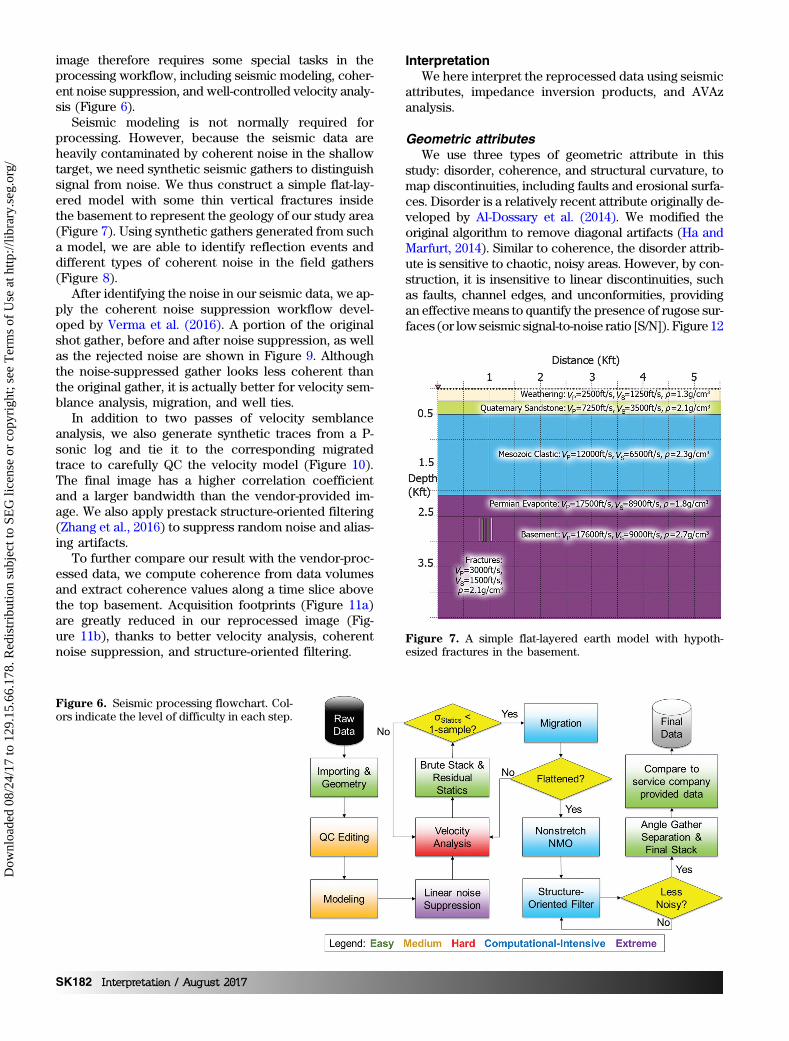
image therefore requires some special tasks in theprocessing workflow, including seismic modeling, coher-ent noise suppression, and well-controlled velocity analy-sis (Figure 6).
Seismic modeling is not normally required forprocessing. However, because the seismic data areheavily contaminated by coherent noise in the shallowtarget, we need synthetic seismic gathers to distinguishsignal from noise. We thus construct a simple flat-lay-ered model with some thin vertical fractures insidethe basement to represent the geology of our study area(Figure 7). Using synthetic gathers generated from sucha model, we are able to identify reflection events anddifferent types of coherent noise in the field gathers(Figure 8).
After identifying the noise in our seismic data, we ap-ply the coherent noise suppression workflow devel-oped by Verma et al. (2016). A portion of the originalshot gather, before and after noise suppression, as wellas the rejected noise are shown in Figure 9. Althoughthe noise-suppressed gather looks less coherent thanthe original gather, it is actually better for velocity sem-blance analysis, migration, and well ties.
In addition to two passes of velocity semblanceanalysis, we also generate synthetic traces from a P-sonic log and tie it to the corresponding migratedtrace to carefully QC the velocity model (Figure 10).The final image has a higher correlation coefficientand a larger bandwidth than the vendor-provided im-age. We also apply prestack structure-oriented filtering(Zhang et al., 2016) to suppress random noise and alias-ing artifacts.
To further compare our result with the vendor-proc-essed data, we compute coherence from data volumesand extract coherence values along a time slice abovethe top basement. Acquisition footprints (Figure 11a)are greatly reduced in our reprocessed image (Fig-ure 11b), thanks to better velocity analysis, coherentnoise suppression, and structure-oriented filtering.
InterpretationWe here interpret the reprocessed data using seismic
attributes, impedance inversion products, and AVAzanalysis.
Geometric attributesWe use three types of geometric attribute in this
study: disorder, coherence, and structural curvature, tomap discontinuities, including faults and erosional surfa-ces. Disorder is a relatively recent attribute originally de-veloped by Al-Dossary et al. (2014). We modified theoriginal algorithm to remove diagonal artifacts (Ha andMarfurt, 2014). Similar to coherence, the disorder attrib-ute is sensitive to chaotic, noisy areas. However, by con-struction, it is insensitive to linear discontinuities, suchas faults, channel edges, and unconformities, providingan effective means to quantify the presence of rugose sur-faces (or low seismic signal-to-noise ratio [S/N]). Figure 12
Figure 7. A simple flat-layered earth model with hypoth-esized fractures in the basement.
Figure 6. Seismic processing flowchart. Col-ors indicate the level of difficulty in each step.
SK182 Interpretation / August 2017
Dow
nloa
ded
08/2
4/17
to 1
29.1
5.66
.178
. Red
istr
ibut
ion
subj
ect t
o SE
G li
cens
e or
cop
yrig
ht; s
ee T
erm
s of
Use
at h
ttp://
libra
ry.s
eg.o
rg/
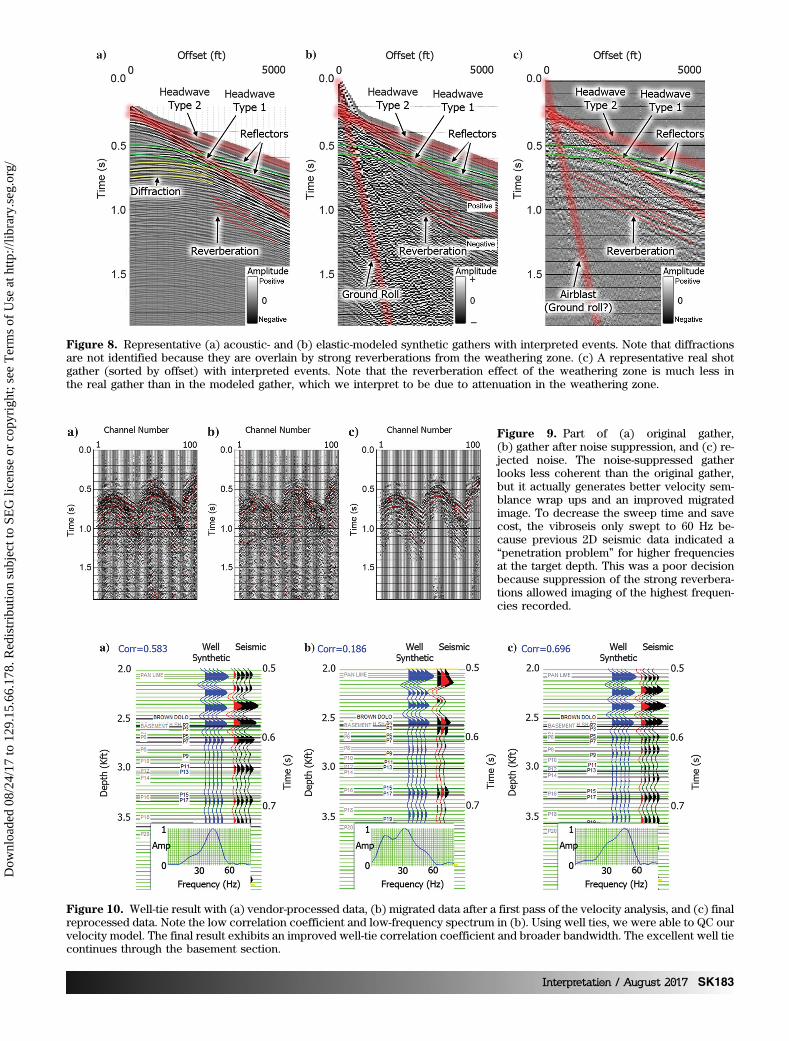
Figure 9. Part of (a) original gather,(b) gather after noise suppression, and (c) re-jected noise. The noise-suppressed gatherlooks less coherent than the original gather,but it actually generates better velocity sem-blance wrap ups and an improved migratedimage. To decrease the sweep time and savecost, the vibroseis only swept to 60 Hz be-cause previous 2D seismic data indicated a“penetration problem” for higher frequenciesat the target depth. This was a poor decisionbecause suppression of the strong reverbera-tions allowed imaging of the highest frequen-cies recorded.
Figure 8. Representative (a) acoustic- and (b) elastic-modeled synthetic gathers with interpreted events. Note that diffractionsare not identified because they are overlain by strong reverberations from the weathering zone. (c) A representative real shotgather (sorted by offset) with interpreted events. Note that the reverberation effect of the weathering zone is much less inthe real gather than in the modeled gather, which we interpret to be due to attenuation in the weathering zone.
Figure 10. Well-tie result with (a) vendor-processed data, (b) migrated data after a first pass of the velocity analysis, and (c) finalreprocessed data. Note the low correlation coefficient and low-frequency spectrum in (b). Using well ties, we were able to QC ourvelocity model. The final result exhibits an improved well-tie correlation coefficient and broader bandwidth. The excellent well tiecontinues through the basement section.
Interpretation / August 2017 SK183
Dow
nloa
ded
08/2
4/17
to 1
29.1
5.66
.178
. Red
istr
ibut
ion
subj
ect t
o SE
G li
cens
e or
cop
yrig
ht; s
ee T
erm
s of
Use
at h
ttp://
libra
ry.s
eg.o
rg/
shows the time-structure map of the top-basement hori-zon. The northern area is more rugose and harder to pickthan the southeastern area. This rugosity is reflected inthe corresponding disorder map (Figure 13). Becausethe shallower brown dolomite is coherent, we discountthis anomaly as being due to a low S/N. We hypothesizethat the northern part of the basement was heavilyeroded, causing a higher degree of disorder.
Coherence is sensitive to faults and noise, whereasstructural curvature helps to identify folds (anticlinesand synclines), flexures, and channel axes. We usemost-positive (k1) and most-negative (k2) principle cur-
vatures (Mai, 2010) to delineate subtle geologic featuresin the seismic data. Figure 14 is a corendered image ofcoherence, k1 and k2 along the top-basement horizon.Opacity curves are set to enhance the high absolute val-ues of structural curvature. An important, albeit small-displacement fault can be seen in the southwestern partof the map. In cross-sectional view (Figure 15), k1 andk2 lineaments bracket the fault on the foot wall andhanging wall. The fault has no significant displacementand exhibits the attribute pattern commonly seen abouta normal fault (Chopra and Marfurt, 2010). Thus, we in-terpret the fault to be a high-angle, basement-involved,
Figure 11. Time slice at t ¼ 0.536 s throughcoherence computed from (a) vendor-proc-essed data and (b) reprocessed data volumes.The acquisition footprint is visible in the origi-nal data, which overprints geologic features ofinterest, making it difficult to interpret. In thereprocessed data, the acquisition footprint issuppressed.
Figure 12. Time-structure map of top-basement horizon. Theblack arrows indicate a fault. The northern part of the horizonis difficult to pick.
Figure 13. Disorder attribute extracted along top-basementhorizon. The northern part of the horizon exhibits a relativelyhigh degree of disorder, which corresponds to a lower confi-dence in our picks. The high-disorder appearance of thenorthern top basement is probably because the basementwas weathered and eroded more intensively in the northernpart of the map.
SK184 Interpretation / August 2017
Dow
nloa
ded
08/2
4/17
to 1
29.1
5.66
.178
. Red
istr
ibut
ion
subj
ect t
o SE
G li
cens
e or
cop
yrig
ht; s
ee T
erm
s of
Use
at h
ttp://
libra
ry.s
eg.o
rg/
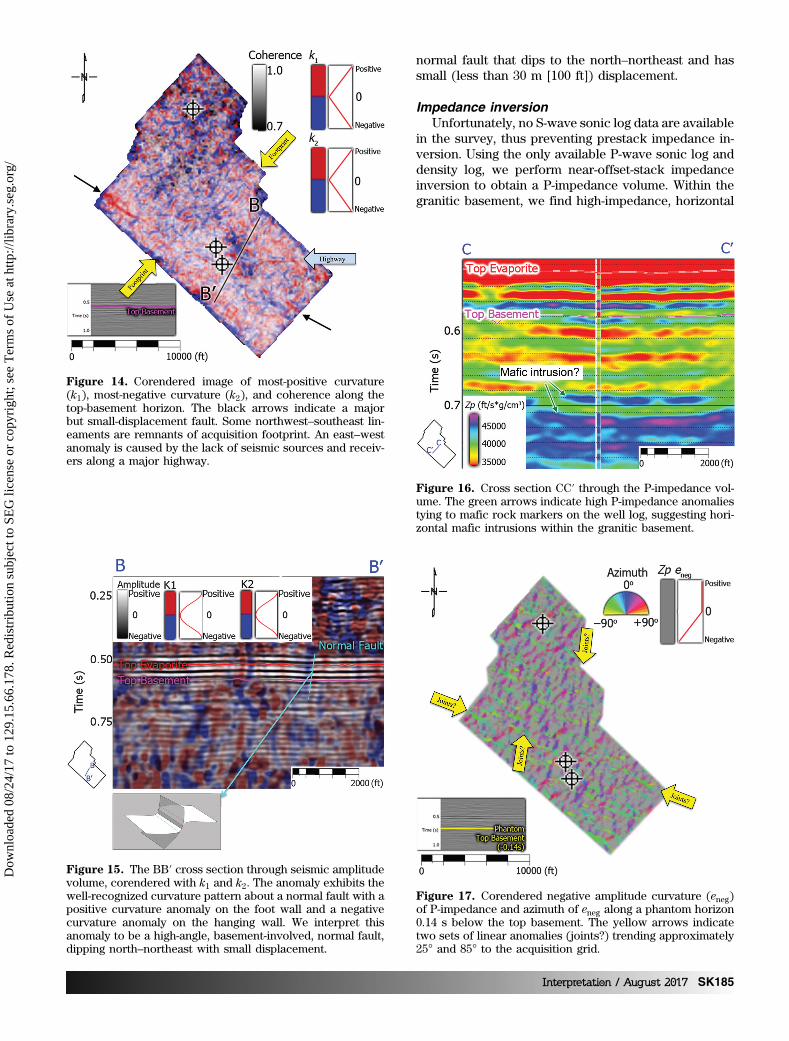
normal fault that dips to the north–northeast and hassmall (less than 30 m [100 ft]) displacement.
Impedance inversionUnfortunately, no S-wave sonic log data are available
in the survey, thus preventing prestack impedance in-version. Using the only available P-wave sonic log anddensity log, we perform near-offset-stack impedanceinversion to obtain a P-impedance volume. Within thegranitic basement, we find high-impedance, horizontal
Figure 14. Corendered image of most-positive curvature(k1), most-negative curvature (k2), and coherence along thetop-basement horizon. The black arrows indicate a majorbut small-displacement fault. Some northwest–southeast lin-eaments are remnants of acquisition footprint. An east–westanomaly is caused by the lack of seismic sources and receiv-ers along a major highway.
Figure 15. The BB′ cross section through seismic amplitudevolume, corendered with k1 and k2. The anomaly exhibits thewell-recognized curvature pattern about a normal fault with apositive curvature anomaly on the foot wall and a negativecurvature anomaly on the hanging wall. We interpret thisanomaly to be a high-angle, basement-involved, normal fault,dipping north–northeast with small displacement.
Figure 16. Cross section CC′ through the P-impedance vol-ume. The green arrows indicate high P-impedance anomaliestying to mafic rock markers on the well log, suggesting hori-zontal mafic intrusions within the granitic basement.
Figure 17. Corendered negative amplitude curvature (eneg)of P-impedance and azimuth of eneg along a phantom horizon0.14 s below the top basement. The yellow arrows indicatetwo sets of linear anomalies (joints?) trending approximately25° and 85° to the acquisition grid.
Interpretation / August 2017 SK185
Dow
nloa
ded
08/2
4/17
to 1
29.1
5.66
.178
. Red
istr
ibut
ion
subj
ect t
o SE
G li
cens
e or
cop
yrig
ht; s
ee T
erm
s of
Use
at h
ttp://
libra
ry.s
eg.o
rg/
anomalies (Figure 16) tying to mafic rock markers onthe well log that we interpret to be horizontal mafic in-trusions (i.e., sills) similar to those described by Barneset al. (2012). To further interpret the P-impedanceresult, we generate the amplitude curvature of theP-impedance. Amplitude curvature is sensitive to linea-ments smaller than flexures seen on the structural cur-vature map. By extracting the most negative amplitudecurvature of P-impedance volume along a phantomhorizon below the top basement, we identify two setsof lineaments trending approximately 25° and 85° tothe acquisition grids (Figure 17). We interpret these
lineaments to be two sets of conjugate fractures or joints that are approximately 60° apart.
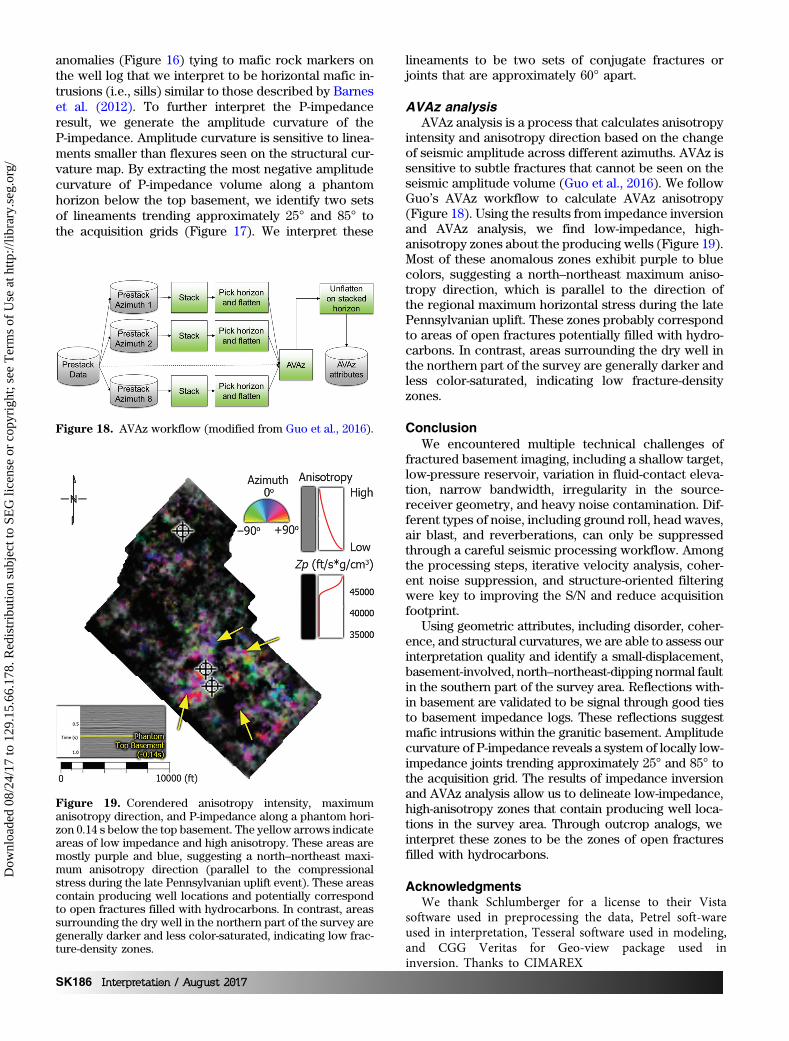
AVAz analysisAVAz analysis is a process that calculates anisotropy
intensity and anisotropy direction based on the change of seismic amplitude across different azimuths. AVAz is sensitive to subtle fractures that cannot be seen on the seismic amplitude volume (Guo et al., 2016). We follow Guo’s AVAz workflow to calculate AVAz anisotropy (Figure 18). Using the results from impedance inversion and AVAz analysis, we find low-impedance, high-anisotropy zones about the producing wells (Figure 19). Most of these anomalous zones exhibit purple to blue colors, suggesting a north–northeast maximum aniso-tropy direction, which is parallel to the direction of the regional maximum horizontal stress during the late Pennsylvanian uplift. These zones probably correspond to areas of open fractures potentially filled with hydro-carbons. In contrast, areas surrounding the dry well in the northern part of the survey are generally darker and less color-saturated, indicating low fracture-density zones.
ConclusionWe encountered multiple technical challenges of
fractured basement imaging, including a shallow target, low-pressure reservoir, variation in fluid-contact eleva-tion, narrow bandwidth, irregularity in the source-receiver geometry, and heavy noise contamination. Dif-ferent types of noise, including ground roll, head waves, air blast, and reverberations, can only be suppressed through a careful seismic processing workflow. Among the processing steps, iterative velocity analysis, coher-ent noise suppression, and structure-oriented filtering were key to improving the S/N and reduce acquisition footprint.
Using geometric attributes, including disorder, coher-ence, and structural curvatures, we are able to assess our interpretation quality and identify a small-displacement, basement-involved, north–northeast-dipping normal fault in the southern part of the survey area. Reflections with-in basement are validated to be signal through good ties to basement impedance logs. These reflections suggest mafic intrusions within the granitic basement. Amplitude curvature of P-impedance reveals a system of locally low-impedance joints trending approximately 25° and 85° to the acquisition grid. The results of impedance inversion and AVAz analysis allow us to delineate low-impedance, high-anisotropy zones that contain producing well loca-tions in the survey area. Through outcrop analogs, we interpret these zones to be the zones of open fractures filled with hydrocarbons.
AcknowledgmentsWe thank Schlumberger for a license to their Vista
software used in preprocessing the data, Petrel soft-ware used in interpretation, Tesseral software used in modeling, and CGG Veritas for Geo-view package used in inversion. Thanks to CIMAREX
Figure 18. AVAz workflow (modified from Guo et al., 2016).
Figure 19. Corendered anisotropy intensity, maximumanisotropy direction, and P-impedance along a phantom hori-zon 0.14 s below the top basement. The yellow arrows indicateareas of low impedance and high anisotropy. These areas aremostly purple and blue, suggesting a north–northeast maxi-mum anisotropy direction (parallel to the compressionalstress during the late Pennsylvanian uplift event). These areascontain producing well locations and potentially correspondto open fractures filled with hydrocarbons. In contrast, areassurrounding the dry well in the northern part of the survey aregenerally darker and less color-saturated, indicating low frac-ture-density zones.
SK186 Interpretation / August 2017
Dow
nloa
ded
08/2
4/17
to 1
29.1
5.66
.178
. Red
istr
ibut
ion
subj
ect t
o SE
G li
cens
e or
cop
yrig
ht; s
ee T
erm
s of
Use
at h
ttp://
libra
ry.s
eg.o
rg/
Energy Company for providing us a license to their seis-mic data volume for use in research and education. Financial support was through the industry sponsors of the OU Attribute-Assisted Seismic Processing and In-terpretation (AASPI) consortium. Attribute calculation, including disorder, coherence, curvatures, and AVAz analysis were done using AASPI software.
ReferencesAl-Dossary, S., W. Yuchun, and M. McFarlane, 2014, A new
algorithm for the seismic disorder attribute: Interpreta-tion, 2, no. 1, SA93–SA97, doi: 10.1190/INT-2013-0088.1.
Barnes, M., E. Y. Anthony, I. Williams, and G. B. Asquith,2012, Architecture of a 1.38–1.34 Ga granite-rhyolitecomplex as revealed by geochronology and isotopicand elemental geochemistry of subsurface samplesfrom west Texas, USA: Precambrian Research, 119,9–43, doi: 10.1016/S0301-9268(02)00116-X.
Chopra, S., and K. J. Marfurt, 2010, Integration of coher-ence and volumetric curvature images: The LeadingEdge, 29, 1092–1107, doi: 10.1190/1.3485770.
Guo, S., S. Verma, Q. Wang, B. Zhang, and K. J. Marfurt,2016, Vector correlation of amplitude variation with azi-muth and curvature in a post-hydraulic-fracture BarnettShale survey: Interpretation, 4, no. 1, SB23–SB35, doi:10.1190/INT-2015-0103.1.
Ha, T., and K. J. Marfurt, 2014, Quantifying confidence inhorizon-picking: AAPG Explorer, 35, 44.
Mai, H., 2010, Seismic attribute analysis and its applica-tions on data from the Canada: Ph.D. dissertation, theUniversity of Oklahoma.
Pippin, L., 1970, Panhandle-Hugoton Field, Texas-Okla-homa-Kansas — The first fifty years: Geology of GiantPetroleum Fields, AAPG Memoir 14, 204–222.
Sorenson, R., 2005, A dynamic model for the PermianPanhandle and Hugoton fields, western Anadarko basin:AAPG Bulletin, 89, 921–938, doi: 10.1306/03010504045.
Trinh, C., and J. K. Warren, 2009, Back Ho field, a fracturedgranitic basement reservoir, Cuu Long basin, offshoreSE Vietnam: A “buried-hill” play: Journal of PetroleumGeology, 32, 129–156, doi: 10.1111/j.1747-5457.2009.00440.x.
Verma, S., S. Guo, T. Ha, and K. J. Marfurt, 2016, Highlyaliased ground-roll suppression using a 3D multi-window Karhunen-Loeve filter: Application to a legacy
Mississippi Lime survey: Geophysics, 81, no. 1, V79–V88, doi: 10.1190/geo2014-0442.1.
Xu, X., 2014, Integrated geophysical studies of theNortheastern Caribbean Plate, Eastern Tibetan plateauin China and Panhandle field (Texas): Ph.D. disserta-tion, the University of Oklahoma.
Zhang, B., T. Lin, S. Guo, O. E. Davogustto, and K. J. Mar-furt, 2016, Noise suppression of time-migrated gathersusing prestack structure-oriented filtering: Interpreta-tion, 4, no. 2, SG19–SG29, doi: 10.1190/INT-2015-0146.1.
Thang Ha received bachelor’s andmaster’s degrees in geophysics fromthe University of Oklahoma, where heis a Ph.D. student. He is a member ofSEG, AAPG, EAGE, and the Geophysi-cal Society of Oklahoma City. Hisresearch interests include seismicprocessing, 3D seismic attributes, pre-stack data conditioning, least-squares
migration, and automatic classification of geologic facies.
Kurt Marfurt began his geophysicalcareer teaching geophysics and con-tributing to an industry-supported con-sortium on migration, inversion, andscattering (project MIDAS) at Colum-bia University’s Henry Krumb Schoolof Mines in New York City. In 1981,He joined Amoco’s Tulsa ResearchCenter and spent the next 18 years
leading research efforts inmodeling, migration, signal analy-sis, basin analysis, seismic-attribute analysis, reflectiontomography, seismic inversion, and multicomponent dataanalysis. In 1999, he joined the University of Houston as aprofessor in the Department of Geosciences and as a direc-tor of the Allied Geophysics Laboratories. He is a member ofthe Geophysical Societies of Tulsa and Houston, SEG,EAGE, AAPG, AGU, and SIAM, and he serves as editorfor Interpretation. His current research activity includesprestack imaging, velocity analysis and inversion of con-verted waves, computer-assisted pattern recognition of geo-logic features on 3D seismic data, and interpreter-drivenseismic processing. His research interests include seismicsignal analysis, 3D seismic attributes, seismic velocity analy-sis, subsurface imaging, and multicomponent data analysis.
Interpretation / August 2017 SK187
Dow
nloa
ded
08/2
4/17
to 1
29.1
5.66
.178
. Red
istr
ibut
ion
subj
ect t
o SE
G li
cens
e or
cop
yrig
ht; s
ee T
erm
s of
Use
at h
ttp://
libra
ry.s
eg.o
rg/