Embed Size (px)
Citation preview
ZionSo/utions, LLC. Technical Support Document
TSD 14-020
TSD 14-020 Revision 0
~ :-Zro SOLUTlaVSuc
At' 1!:·" ·w!.tn.'f .. -r:';"1'!'!C.";T:\~1
Sorption (Kd) Measurements in Support of Dose Assessments for Zion Nuclear Station
Decommissioning
Revision 0
Originator: Brookhaven National Laboratory Date: 12/12/2012 Name
Reviewer: ~~$:f~ Robert F. Decker
Date: lO 1 (3 / , c-J
Approval: Date: /013/;'/
Page 1 of 49
BROO,KHAVEN
TSD 14-020 Revision 0
NATIONAL LABORATORY BNL-I05981-2012-IR
SORPTION (K,J MEASUREMENTS IN SUPPORT OF DOSE ASSESSMENTS FOR ZION NUCLEAR STATION DECOMMISSIONING
S. P. Vim, T. Sullivan, and L. Milian
December 12, 2012
Informal Report
Biological, Environmental & Climate Sciences Department
Brookhaven National Laboratory P.O. Box 5000
Upton, NY 11973-5000 www.bnl.gov
l"oticc: This manuscript lw been autho:ed by employees of Brookhaven Scimcc Associates. IJ.C under Contract No. DE-AC02-~gCHI08B6 with the U.S. Department ofEncrgy. The publisher by accepting the manuscript for publication ac:knowledges that the United States Government retains I. non-exclusive, paid.up, in:cvoc:able, world·wide license to publish or reproduce the published form of this manuscript. or allow others to do so, for United States Government purposes.
Page 2 of 49
DISCLAIMER
TSD 14-020 Revision 0
This report was prepared as an account of work sponsored by an agency of the United States Government. Neither the United Slates Government nor any agency thereof. nor any of their employees, nor any of their contractors, subcontractors. or their employees, makes any warranty, express or implied, or assumes any legal liability or responsibility for the accuracy, completeness, or any third party's use or the results of such use of any information, apparatus, product, or process disclosed, or represents that its use would not infringe privately owned rights. Reference herein to any specific commercial product, process, or service by trade name, trademark. manufacturer, or otherwise, does not necessarily constitute or imply its endorsement, recommendation, or favoring by the United States Government or any agency thereof or its contractors or subcontractors. The vie.ws and opinions of authors expressed herein do not necessarily state or reflect those of the United States Government or any agency thereof.
Page 3 of 49
TSD 14-020 Revision 0
Sorption (Kct) measurements in Support of Dose Assessments for Zion Nuclear Station Decommissioning
December 12, 2012
S.P. Yim
Terry Sullivan
L. Milian
Brookhaven National Laboratory Upton, NY 11973
Page 4 of49
TSD 14-020 Revision 0
Sorption (~) measurements in Support of Dose Assessments for Zion Nuclear Station Decommissioning
Executive Summary
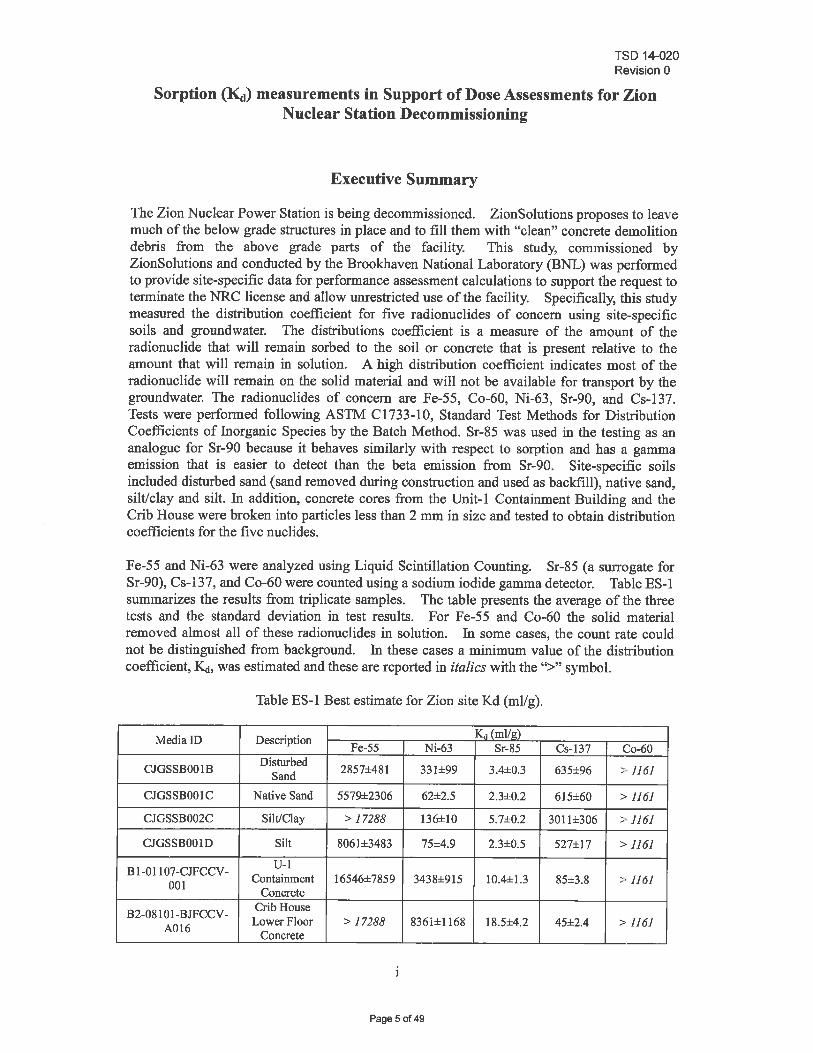
The Zion Nuclear Power Station is being decommissioned. ZionSolutions proposes to leaye much ofthe below grade structures in place and to fill them with "clean" concrete demolition debris from the above grade parts of the facility. This study, commissioned by ZionSolutions and conducted by the Brookhaven National Laboratory (BNL) was performed to provide site-specific data for performance assessment calculations to support the request to terminate the NRC license and allow unrestricted use of the facility. Specifically, this study measured the distribution coefficient for five radionuclides of concern using site-specific soils and groundwater. The distributions coefficient is a measure of the amount of the radionuclide that will remain sorbed to the soil or concrete that is present relative to the amount that will remain in solution. A high distribution coefficient indicates most of the radionuclide will remain on the solid material and will not be available for transport by the groundwater. The radionuclides of concern are Fe-55, Co-60, Ni-63, Sr-90, and Cs-137. Tests were performed following ASTM C1733-1O, Standard Test Methods for Distribution Coefficients of Inorganic Species by the Batch Method. Sr-85 was used in the testing as an analogue for Sr-90 because it behaves similarly with respect to sorption and has a gamma emission that is easier to detect than the beta emission from Sr-90. Site-specific soils included disturbed sand (sand removed during construction and used as backfill), native sand, silt/clay and silt. In addition, concrete cores from the Unit-l Containment Building and the Crib House were broken into particles less than 2 mm in size and tested to obtain distribution coefficients for the five nuclides.
Fe-55 and Ni-63 were analyzed using Liquid Scintillation Counting. Sr-85 (a surrogate for Sr-90), Cs-i37, and Co-60 were counted using a sodium iodide gamma detector. Table ES-l summarizes the results from triplicate samples. The table presents the average of the three tests and the standard deviation in test results. For Fe-55 and Co-60 the solid material removed almost all of these radionuclides in solution. In some cases, the count rate could not be distinguished from background. In these cases a minimum value of the distribution coefficient,~, was estimated and these are reported in italics with the ">" symbol.
Table ES-l Best estimate for Zion site Kd (ml/g).
MedialD Description Kd (mIlg) Fe-55 Ni-63 Sr-85 Cs-137 Co-60
CJGSSBOOIB Disturbed 2857±481 331±99 3.4±0.3 635±96 :> 1161 Sand
CJGSSBOOIC Native Sand 5579±2306 62±2.5 2.3±0.2 615±60 > 1161
CJGSSB002C Silt/Clay > 17288 136±10 5.7±0.2 30 11±306 > 1161
CJGSSBOOlD Silt 8061±3483 75±4.9 2.3±0.5 527±17 > 1161
B 1-01107 -CJFCCV -U-l
Containment 16546±7859 3438±915 1O.4±1.3 85±3.8 >- 1161 001 Concrete
B2-081 0 1-BJFCCV -Crib House Lower Floor > 17288 8361±1168 18.5±4.2 45±2.4 > 1161
A016 Concrete
1
Page 5 of 49
TSD 14-020 Revision 0
Sorption (~) measurements in Support of Dose Assessments for Zion Nuclear Station Decommissioning
Table of Contents Executive SUlnlnary .................................................................................................................... i
List of Tables ............................................................................................................................ iii
List of Figures .......................................................................................................................... iii
Acronyms and Abbreviations .................................................................................................... iv
1. Introduction ............................................................................................................................ 1
2. Methodology .......................................................................................................................... 1
2.1 Test Method ........................ .............................................................................................. 1
2.2 Test Materials .................................................................................................................... 4
2.3 Pretreatment of Samples ................................................................................................... 6
2.4 Preparation of Isotope Stock Solution ........................... ........................... ........................ 8
2.5 Sorption Study Procedure ................................................................................................. 8
2.6 Radiochemical Analysis ................................................................................................. 1 0 2.7 Distribution Coefficient Calculation ............................................................................... 10
3. Results .................................................................................................................................. 1 0 3.1 Solution pH ..................................................................................................................... 11
3.2 Fe-55 ............................................................................................................................... 11
3.3 Ni-63 ............................................................................................................................... 14
3.4 Sr-85 ............................................................................................................................... 17
3.5 Cs-137 ............................................................................................................................. 20
3.6 Co-60 .............................................................................................................................. 23
3.7 Maximum I<d in cases of low count rates ............................................................... 26
3.8 Discussion ....................................................................................................................... 27
4 Summary ............................................................................................................................... 29
References ................................................................................................................................ 30
Appendix I: ~ data on the approach to equilibrium ........................................................... . 31
Appendix II: I<d data at equilibrium ...................................................................................... 35
ii
Page 60f49
TSD 14-020 Revision 0
Sorption (~) measurements in Support of Dose Assessments for Zion Nuclear Station Decommissioning
List of Tables Table 1 Sample identification for soil samples and concrete samples .................................... 5 Table 2 Sample identitication for ground water ..................................................................... 6 Table 3 Mass of each fraction of concrete samples after crushing ......................................... 7 Table 4 Moisture content of soils samples and concrete samples ........................................... 8 Table 5 Radioactivity concentration of stock solution and test samples ................................ 9 Table 6 Fe-55 calculated l«I values ....................................................................................... 11 Table 7 Ni-63 calculated l«I values ....................................................................................... 14 Table 8 Sr-85 calculated l«I values ....................................................................................... 17 Table 9 Cs-137 calculated l«I values .................................................................................... 20 Table 10 Co-60 calculated l«I values .................................................................................... 23 Table 11 Estimated l«I based on twice the standard error in the background count rate ...... 27 Table 12 Mean and range ofKd (ml/g) values in soils (Sheppard, 1990) ............................ 28 Table 13 Best Estimates for Site-specific l«I (ml/g)l ............................................................ 29
List of Figures Figure 1 Schematic ofl«I Measurement Test... ....................................................................... 3 Figure 2 Soil samples .............................................................................................................. 4 Figure 3 Concrete samples ...................................................................................................... 5 Figure 4 Ground water samples .............................................................................................. 6 Figure 5 Crushing and fractionation of concrete samples ......................................................... 7 Figure 6 Placement of test samples in a container box and on the shaker table ..................... 9 Figure 7 Fe-55 predicted l«I values for all six media ........................................................... 14 Figure 8 Ni-63 predicted l«I values for all six media ........................................................... 17 Figure 9 Sr-85 predicted l«I values for all six media ............................................................ 20 Figure 10 Cs-137 predicted Kd values for all six media ....................................................... 23
111
Page 7 of 49
TSD 14-020 Revision 0
Sorption (K.t) measurements in Support of Dose Assessments for Zion Nuclear Station Decommissioning
Acronyms and Abbreviations
BNL- Brookhaven National Laboratory Ci - Curie a measure of radioactive decay equal to 3.7 1010 disintegrations per second Co-60 - Cobalt isotope with an atomic mass of 60. cpm - counts per minute, a measure of the radioactive content of the sample. Cs-137 - Cesium isotope with an atomic mass of 137. DI - deionized water. Fe-55 - Iron isotope with an atomic mass of 55. g - gram ~ _ Distribution Coefficient which is defined as the ratio of the mass of the solute on the
solid per unit mass of the solid phase to the mass of the solute in solution per unit volume of the liquid phase.
LSC - Liquid Scintillation Counter mL - milliliter NaI - Sodium Iodide, which is the crystal used to measure gamma radiation. Ni-63 - Nickel isotope with an atomic mass of 63. NPP - Nuclear Power Plant NRC - Nuclear Regulatory Commission PA - Performance Assessment pH - is defined as the decimal logarithm of the reciprocal of the hydrogen ion activity. ApH
of7 is neutral and most groundwater's have a pH between 5 and 8. Sr-85 - Strontium isotope with an atomic mass of 85. Used as a surrogate for Sr-90. Sr-90 - Strontium isotope with an atomic mass of 90. A fission product often found as
contamination at nuclear facilities. /lCi - micro-Curie, one millionth of a Curie.
Equation Variables V = volume of filtered ground water used, mL, Cs = starting activity of isotope in filtered ground water, counts per minute (cpm), Cf = final activity of isotope in filtered ground water in contact with the sailor the concrete sample, counts per minute (cpm), M = dry mass of sailor concrete sample, g.
iv
Page 8 of 49
TSD 14-020 Revision 0
Sorption (~) measurements in Support of Dose Assessments for Zion Nuclear Station Decommissioning
1. Introduction
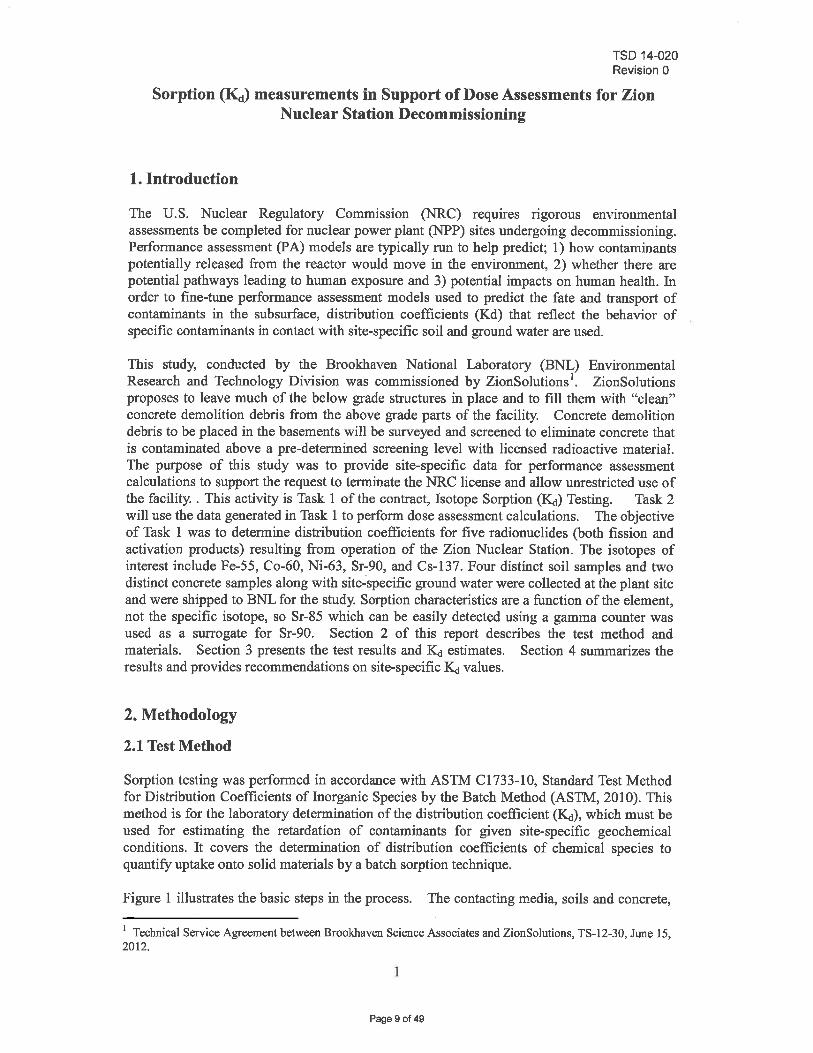
The U.S. Nuclear Regulatory Commission (NRC) requires rigorous enyironmental assessments be completed for nuclear power plant (NPP) sites undergoing decommissioning. Performance assessment (PA) models are typically run to help predict; 1) how contaminants potentially released from the reactor would move in the environment, 2) whether there are potential pathways leading to human exposure and 3) potential impacts on human health. In order to fine-tune performance assessment models used to predict the fate and transport of contaminants in the subsurface, distribution coefficients (Kd) that reflect the behavior of specific contaminants in contact with site-specific soil and ground water are used.
This study, conducted by the Brookhaven National Laboratory (BNL) Environmental Research and Technology Division was commissioned by ZionSolutions1
• ZionSolutions proposes to leave much of the below grade structures in place and to fill them with "clean" concrete demolition debris from the above grade parts of the facility. Concrete demolition debris to be placed in the basements will be surveyed and screened to eliminate concrete that is contaminated above a pre-determined screening level with licensed radioactive material. The purpose of this study was to provide site-specific data for performance assessment calculations to support the request to terminate the NRC license and allow unrestricted use of the facility .. This activity is Task 1 of the contract, Isotope Sorption (~) Testing. Task 2 will use the data generated in Task 1 to perform dose assessment calculations. The objective of Task 1 was to determine distribution coemcients for five radionuclides (both fission and activation products) resulting from operation of the Zion Nuclear Station. The isotopes of interest include Fe-55, Co-60, Ni-63, Sr-90, and Cs-137. Four distinct soil samples and two distinct concrete samples along with site~specific ground water were collected at the plant site and were shipped to BNL for the study. Sorption characteristics are a function of the element, not the specific isotope, so Sr-85 which can be easily detected using a gamma counter was used as a surrogate for Sr-90. Section 2 of this report describes the test method and materials. Section 3 presents the test results and ~ estimates. Section 4 summarizes the results and provides recommendations on site-specific ~ values.
2. Methodology
2.1 Test Method
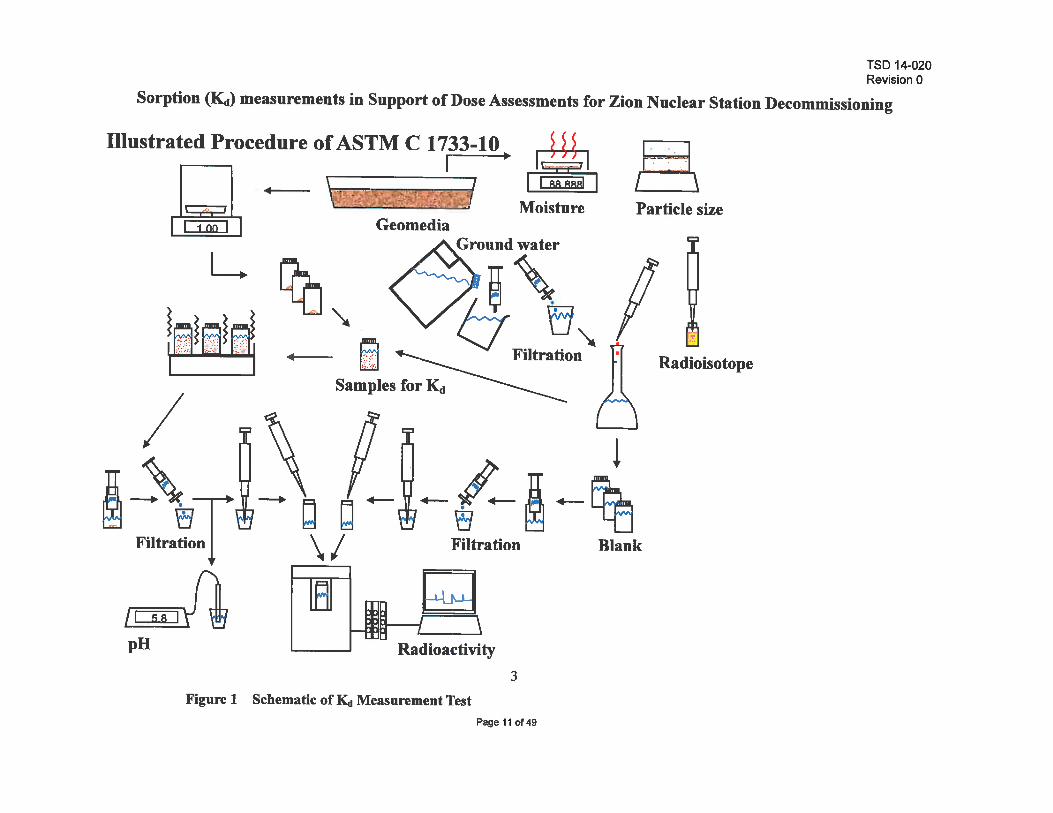
Sorption testing was performed in accordance with ASTM CI733-1O, Standard Test Method for Distribution Coefficients of Inorganic Species by the Batch Method (ASTM, 2010). This method is for the laboratory determination of the distribution coefficient (~), which must be used for estimating the retardation of contaminants for given site-specific geochemical conditions. It covers the determination of distribution coefficients of chemical species to quantify uptake onto solid materials by a batch sorption technique.
Figure 1 illustrates the basic steps in the process. The contacting media, soils and concrete,
1 Technical Service Agreement between Brookhaven Science Associates and ZionSolutions, TS-12-30, June 15, 2012.
1
Page 9 of 49
TSD 14-020 Revision 0
Sorption (~) measurements in Support of Dose Assessments for Zion Nuclear Station Decommissioning
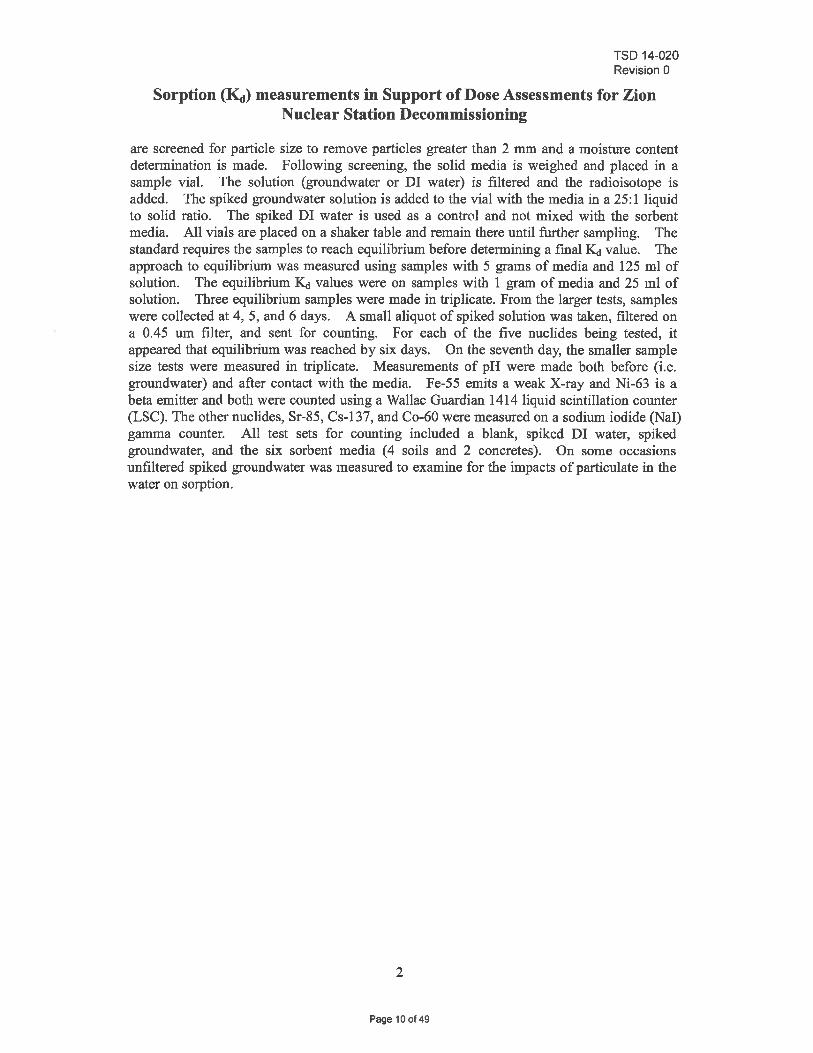
are screened for particle size to remove particles greater than 2 mm and a moisture content determination is made. Following screening, the solid media is weighed and placed in a sample vial. The solution (groundwater or DI water) is filtered and the radioisotope is added. The spiked groundwater solution is added to the vial with the media in a 25:1 liquid to solid ratio. The spiked DI water is used as a control and not mixed with the sorbent media. All vials are placed on a shaker table and remain there until further sampling. The standard requires the samples to reach equilibrium before determining a finall«J value. The approach to equilibrium was measured using samples with 5 grams of media and 125 ml of solution. The equilibrium I«J values were on samples with 1 gram of media and 25 ml of solution. Three equilibrium samples were made in triplicate. From the larger tests, samples were collected at 4, 5, and 6 days. A small aliquot of spiked solution was taken, filtered on a 0.45 urn filter, and sent for counting. For each of the five nuclides being tested, it appeared that equilibrium was reached by six days. On the seventh day, the smaller sample size tests were measured in triplicate. Measurements of pH were made both before (Le. groundwater) and after contact with the media. Fe-55 emits a weak X-ray and Ni-63 is a beta emitter and both were counted using a Wallac Guardian 1414 liquid scintillation counter (LSC). The other nuclides, Sr-85, Cs-137, and Co-60 were measured on a sodium iodide (NaI) gamma counter. All test sets for counting included a blank, spiked DI water, spiked groundwater, and the six sorbent media (4 soils and 2 concretes). On some occasions unfiltered spiked groundwater was measured to examine for the impacts of particulate in the water on sorption.
2
Page 10 of 49
TSD 14-020 Revision 0
Sorption <KcI) measurements in Support of Dose Assessments for Zion Nuclear Station Decommissioning
Illustrated Procedure of ASTM C 1733-10 I •
II; l1. ): • Geomedia
L
~[3lS3li
/ ~ EdJ
:rii: § Moisture Particle size
Radioisotope
! -f-I-ere ~ ~ \/ Filtration Blank
~ g I
pH Radioactivity 3
Figure 1 Schematic of Ktt Measurement Test Page 11 of 49
TSD 14-020 Revision 0
Sorption (~) measurements in Support of Dose Assessments for Zion Nuclear Station Decommissioning
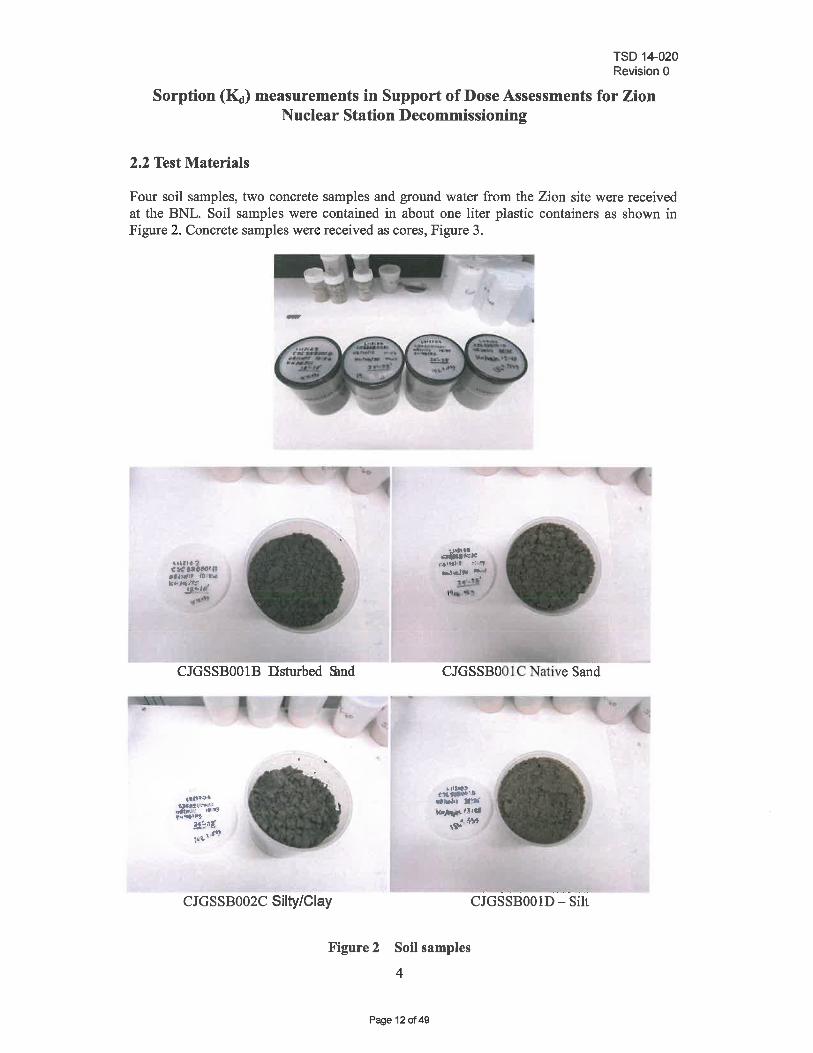
2.2 Test Materials
Four soil samples, two concrete samples and ground water from the Zion site were received at the BNL. Soil samples were contained in about one liter plastic containers as shown in Figure 2. Concrete samples were received as cores, Figure 3.
-
CJGSSBOOIB llsturbed Smd
CJGSSB002C Silty/Clay
Figure 2
~:;x f':4l~l'l' ~-;,-
.,.Iw.!" -: u
, ~ ...
CJGSSBOOl C Native Sand
Soil samples
4
-CJGSSBOOID - Silt
Page 12 of 49
TSD 14-020 Revision 0
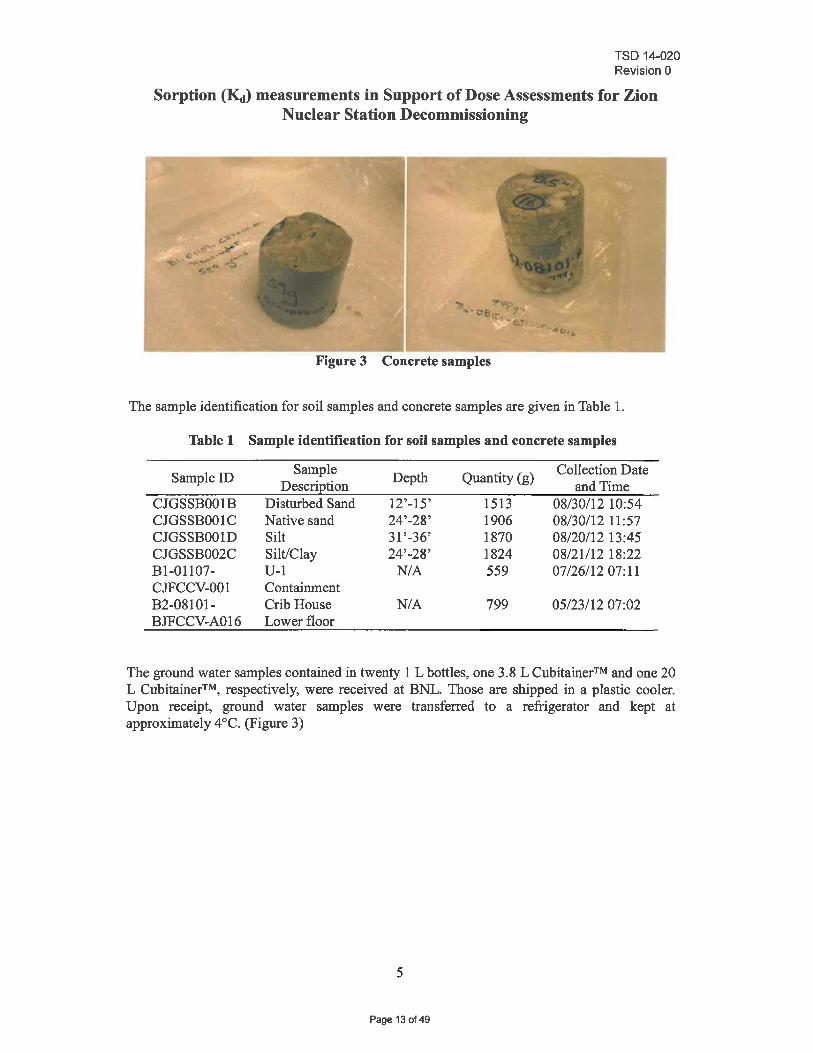
Sorption (Kct) measurements in Support of Dose Assessments for Zion Nuclear Station Decommissioning
Figure 3 Concrete samples
The sample identification for soil samples and concrete samples are given in Table 1.
Table 1 Sample identification for soil samples and concrete samples
Sample ID Sample Depth Quantity (g) Collection Date DescriEtion and Time
CJGSSBOOIB Disturbed Sand 12'-15' 1513 08/30/12 10:54 CJGSSBOOIC Native sand 24'-28' 1906 08/30112 11:57 CJGSSBOOID Silt 31 '-36' 1870 08/20112 13:45 CJGSSB002C Silt/Clay 24'-28' 1824 08/21/12 18:22 BI-01107- U-l N/A 559 07/2611207:11 CJFCCV-OOI Containment B2-08101- Crib House N/A 799 OS/2311207:02 BJFCCV-AOI6 Lower floor
The ground water samples contained in twenty 1 L bottles, one 3.8 L Cubitainer™ and one 20 L Cubitainer™, respectively, were received at BNL. Those are shipped in a plastic cooler. Upon receipt, ground water samples were transferred to a refrigerator and kept at approximately 4°C. (Figure 3)
5
Page 13 of 49
TSD 14-020 Revision 0
Sorption (~) measurements in Support of Dose Assessments for Zion Nuclear Station Decommissioning
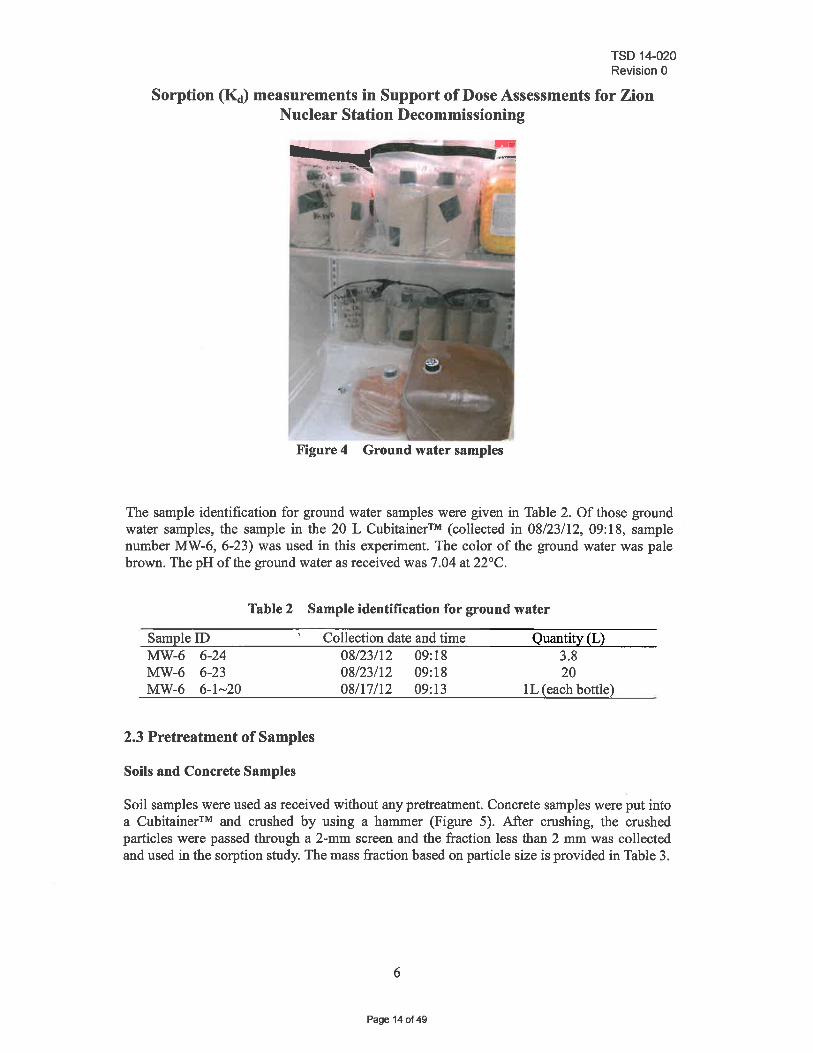
Figure 4 Ground water samples
The sample identification for ground water samples were given in Table 2. Of those ground water samples, the sample in the 20 L Cubitainer™ (collected in 08/23112, 09:18, sample number MW-6, 6-23) was used in this experiment. The color of the ground water was pale brown. The pH of the ground water as received was 7.04 at 22°C.
Table 2 Sample identification for ground water
Sample ID MW-6 6-24 MW-6 6-23 MW-6 6-1~20
2.3 Pretreatment of Samples
Soils and Concrete Samples
Collection date and time 08/23112 09: 18 08/23/12 09: 18 08117/12 09:13
Quantity (L) 3.8 20
1 L ( each bottle)
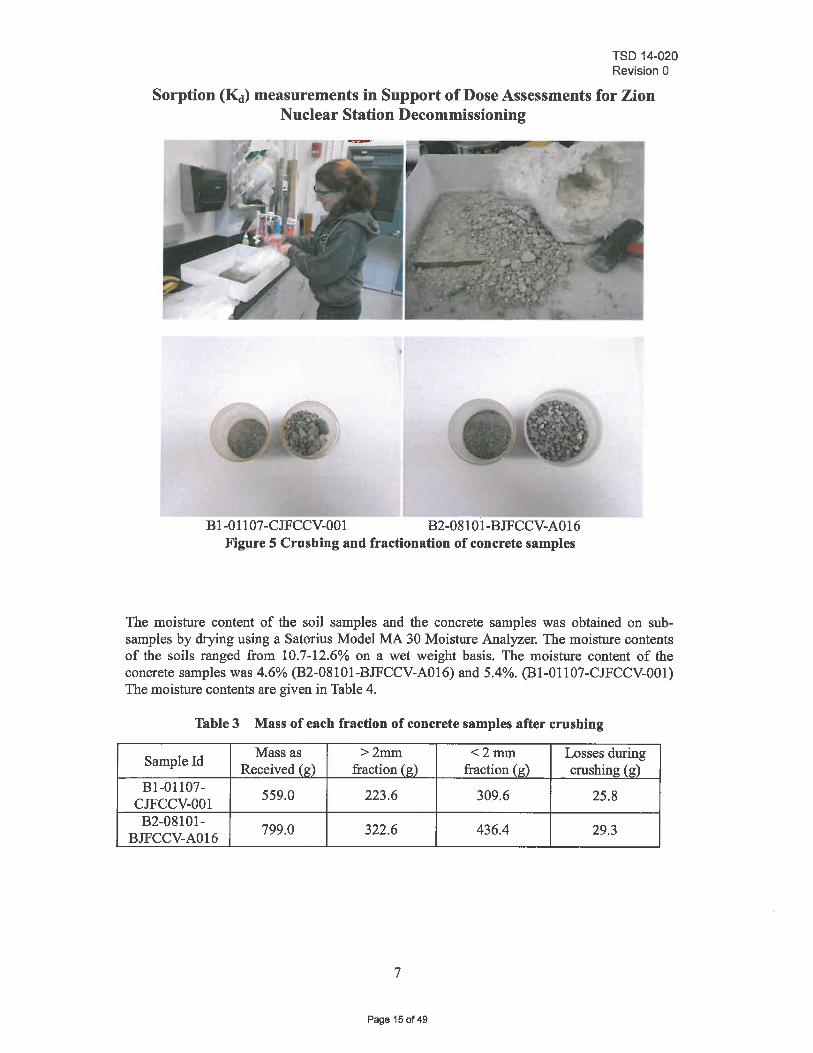
Soil samples were used as received without any pretreatment. Concrete samples were put into a Cubitainer™ and crushed by using a hammer (Figure 5). After crushing, the crushed particles were passed through a 2-mm screen and the fraction less than 2 mm was collected and used in the sorption study. The mass fraction based on particle size is provided in Table 3.
6
Page 14 of 49
TSD 14-020 Revision 0
Sorption (~) measurements in Support of Dose Assessments for Zion Nuclear Station Decommissioning
...... _ ... B 1-0 11 07 -CJFCCV-OO 1 B2-081O 1-BJFCCV-AO 16
Figure 5 Crushing and fractionation of concrete samples
The moisture content of the soil samples and the concrete samples was obtained on sub-samples by drying using a Satorius Model MA 30 Moisture Analyzer. The moisture contents of the soils ranged from 10.7-12.6% on a wet weight basis. The moisture content of the concrete samples was 4.6% (B2-08101-BJFCCV-A016) and 5.4%. (Bl-Oll07-CJFCCV-00l) The moisture contents are given in Table 4.
Table 3 Mass of each fraction of concrete samples after crushing
Sample Id Mass as >2mm <2mm Losses during Received (g) fraction (g) fraction (g) crushing (g)
BI-01107- 559.0 223.6 309.6 25.8 CJFCCV-OOI B2-08l0l- 799.0 322.6 436.4 29.3 BJFCCV-A016
7
Page 15 of 49
TSD 14-020 Revision 0
Sorption (Kct) measurements in Support of Dose Assessments for Zion Nuclear Station Decommissioning
Table 4 Moisture content of soils samples and concrete samples
Sample Id
CJGSSBOOIB CJGSSBOOIC CJGSSBOOID CJGSSB002C B 1-0 II 07 -CJFCCV-OO 1 B2-081 01-BJFCCV-AOI6
Ground water
Description
Disturbed Sand Native sand Silt Silt/Clay U-I Containment Concrete Crib House Lower floor Concrete
Moisture Content % (wet basis)
12.6 16.9 15.5 10.7 5.4 4.6
Ground water was filtered by using 0.45 micrometer syringe filter prior to addition to the soils and the concrete samples. The pH of the ground water was only very slightly changed after filtration.
2.4 Preparation of Isotope Stock Solution
The objective of this study was to determine distribution coefficients for five radionuclides in the presence of four soil samples and two concrete samples with the site-specific ground water. The isotopes of interest include Fe-55, Ni-63, Sr-85, Cs-137 and Co-60. The stock solutions of each isotope were prepared by addition of standard isotope solution to the deionized water. The radioactivity concentration of each isotope stock solution is given in Table 5.
2.5 Sorption Study Procedure
For the equilibrium studies each sample for each soil or concrete was prepared by transferring 1 gram (dried basis) of soil or crushed concrete into a 60 mL high density polyethylene (HDPE) bottle. Triplicate samples were prepared for the equilibrium testing. Twenty five milliliters of the ground water filtered using a 0.45 micrometer syringe filter were added to each bottle to yield a 25:1 liquid to solid mass ratio. Each of the test samples was then "spiked" with a quantity of 25 ilL of each isotope stock solution added to the 25 mL solution, resulting in corresponding activity concentration expressed as IlCi/mL in Table 5.
8
Page 16 of 49
TSD 14-020 Revision 0
Sorption (~) measurements in Support of Dose Assessments for Zion Nuclear Station Decommissioning
Table 5 Radioactivity concentration of stock solution and test samples
Isotope Stock solution (~Ci/mL) Test Samples (~Ci/mL) Fe-55 2.33 2.33E-3 Ni-63 2.54 2.54E-3 Sr-85 2.50 2.50E-3
Cs-137 3.16 3.16E-3 Co-60 0.40 4.00E-4
Similarly, triplicate samples without soil or concrete were prepared with deionized water, filtered ground water and unfiltered ground water, respectively. For each isotope, triplicate 25 mL samples of each solution were measured into 60 mL high density polyethylene (HDPE) bottle and a quantity of 25 ~L of each isotope stock solution added to the 25 mL solution. The pH of filtered ground waters after adding the isotope was measured by using an Oakton® pH700 pH meter.
In addition, in accordance with ASTM CI733-10, to ascertain the time required for the isotope/soil (or concrete) system to achieve constant activity concentration for each isotope, test samples of each soil or concrete were prepared by transferring 5 grams ( dried basis) of soil or crushed concrete into 125 mL high density polyethylene (HDPE) bottles. One hundred twenty five milliliters of the filtered ground water was added to each bottle to yield a 25:1 liquid to solid mass ratio. Each of the test samples was then "spiked" with a quantity of 125 ~L of each isotope stock solution added to the 125 mL solution.
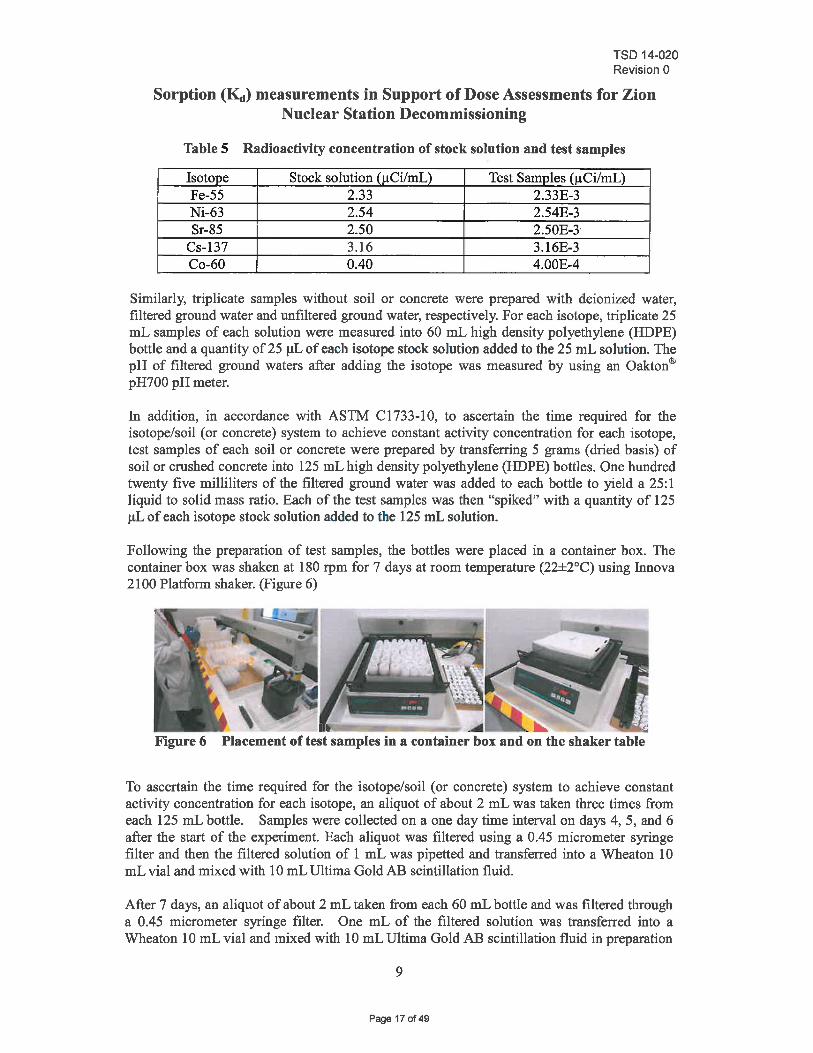
Following the preparation of test samples, the bottles were placed in a container box. The container box was shaken at 180 rpm for 7 days at room temperature (22±2°C) using Innova 2100 Platform shaker. (Figure 6)
.... Figure 6 Placement of test samples in a container box and on the shaker table
To ascertain the time required for the isotope/soil (or concrete) system to achieve constant activity concentration for each isotope, an aliquot of about 2 mL was taken three times from each 125 mL bottle. Samples were collected on a one day time interval on days 4, 5, and 6 after the start of the experiment. Each aliquot was filtered using a 0.45 micrometer syringe filter and then the filtered solution of 1 mL was pipetted and transferred into a Wheaton 10 mL vial and mixed with 10 mL Ultima Gold AB scintillation fluid.
After 7 days, an aliquot of about 2 mL taken from each 60 mL bottle and was filtered through a 0.45 micrometer syringe filter. One mL of the filtered solution was transferred into a Wheaton 10 mL vial and mixed with 10 mL Ultima Gold AB scintillation fluid in preparation
9
Page 17 of 49
TSD 14-020 Revision 0
Sorption (~) measurements in Support of Dose Assessments for Zion Nuclear Station Decommissioning
for counting.
The pH was measured for one of the triplicate test samples and one of triplicate filtered ground water samples to provide an indication of the change in pH of the ground water in contact with the soil or concrete.
2.6 Radiochemical Analysis
The activity of gamma-emitting isotopes in the filtered solution was measured on a 1 mL aliquot of the sample using a Wallac LKB 1282 COMPU gamma counter with a sodium iodide detector.
A Wallac Guardian 1414 liquid scintillation counter (LSC) was used to analyze Fe-55 and Ni-63. All samples were counted for ten minutes to improve counting statistics.
For the LSC data, background radioactivity was quantified by analyzing samples of 1 mL deionized water without any added radioacthity. The background level in counts per minute (cpm) was subtracted from the gross sample count rate to obtain the net count rate. For the gamma counter, background was subtracted from the total count rate automatically. The count rates are directly proportional to the concentration in solution and these values were used to calculate~.
2.7 Distribution Coefficient Calculation
The ~ value for each isotope was calculated using the following equation.
~ = V(Cs-Cf) /(M.cf)
Where: V = volume of filtered ground water used, mL, Cs = starting activity of isotope in filtered ground water, counts per minute (cpm), Cf = final activity of isotope in filtered ground water in contact with the soil sample or the concrete, counts per minute (cpm), M = dry mass of soil or concrete sample, g.
3. Results
The count rate in the groundwater after spiking with a radionuclide ranged from approximately 500 cpm for Co-60 to 5000 cpm for Ni-63. However, the count rate in the samples that had a sorbing media was essentially indistinguishable from background for Fe-55 and Co-60. That is, the count rate was within one standard deviation of the error in the background measurement. An error analysis is presented later and based on this analysis, a minimum ~ will be recommended based on the counting statistics. In sections 3.2 through 3.6, if the background corrected count rate was greater than zero, the count rates are taken as being accurate without error and the ~ is estimated. If the count rate was zero, a value of 1 cpm was used to calculate count rates. While this may underestimate the true ~, this should not be a major problem because the calculated K<! is greater than 1000 when the count
10
Page 180f49
TSD 14-020 Revision 0
Sorption (K..) measurements in Support of Dose Assessments for Zion Nuclear Station Decommissioning
rate is indistinguishable from background.
3.1 Solution pH The pH of the filtered ground water raised from a yalue around 7.2 to near 7.7 over the duration of the tests. This is believed to be due to CO2 present in the air. The pH of the groundwater and the pH of the groundwater in contact with the different soils were similar at the end of the test indicating the soil did not have a major impact on pH. The silt/clay soil, sample identifier CJGSSB002C, tended to lower the pH by 0.3 to 0.4 pH units as compared to the groundwater. All other soils had pH values within about 0.1 pH units. The concrete had a large impact on pH causing the solution to have a pH greater than 11.5. This could be a water quality issue if massive amounts of concrete are rubbelized and placed below grade in existing building structures as planned.
3.2 Fe-55
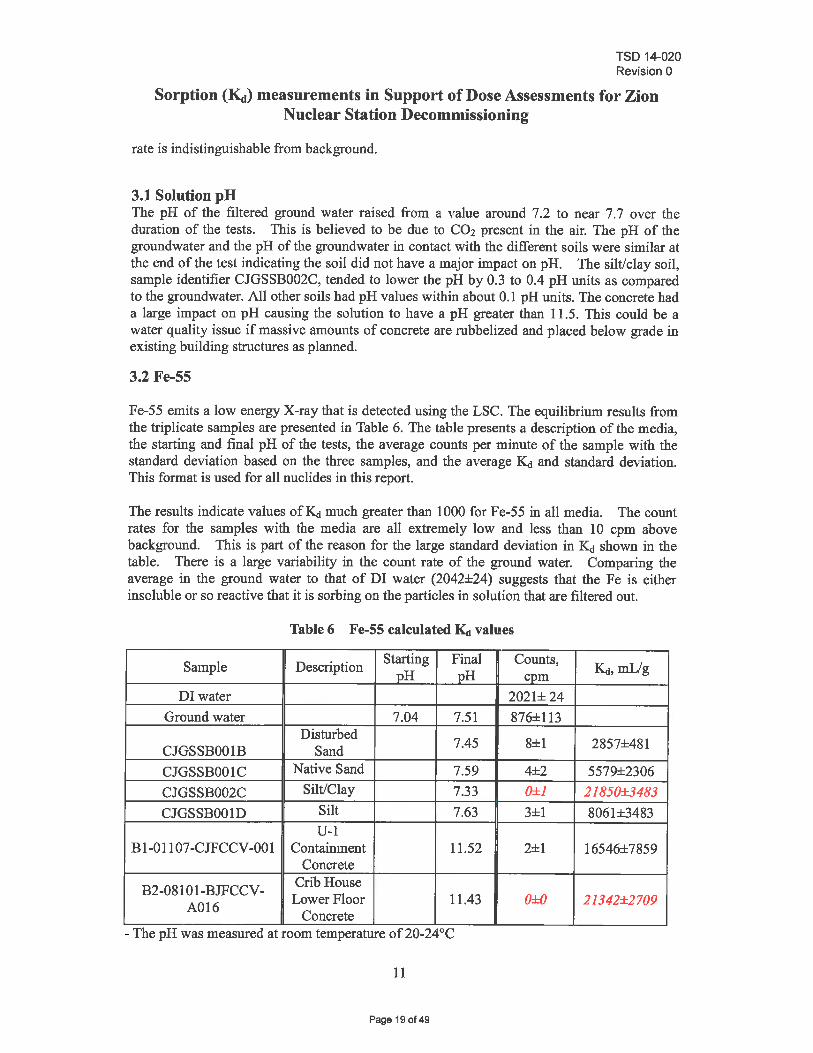
Fe-55 emits a low energy X-ray that is detected using the LSC. The equilibrium results from the triplicate samples are presented in Table 6. The table presents a description of the media, the starting and final pH of the tests, the average counts per minute of the sample with the standard deviation based on the three samples, and the average ~ and standard de\iiation. This format is used for all nuclides in this report.
The results indicate values of ~ much greater than 1000 for Fe-55 in all media. The count rates for the samples with the media are all extremely low and less than 10 cpm above background. This is part of the reason for the large standard deviation in ~ shown in the table. There is a large variability in the count rate of the ground water. Comparing the average in the ground water to that of DI water (2042±24) suggests that the Fe is either insoluble or so reactive that it is sorbing on the particles in solution that are filtered out.
Table 6 Fe-55 calculated Kc! values
Sample Description Starting Final Counts, ~,mUg pH pH cpm
DI water 2021± 24 Ground water 7.04 7.51 876±113
Disturbed 7.45 8±1 2857±481 CJGSSBOOIB Sand CJGSSBOOIC Native Sand 7.59 4±2 5579±2306 CJGSSB002C Silt/Clay 7.33 0±1 21850±3483
CJGSSBOOID Silt 7.63 3±1 8061±3483 U-1
B 1-0 11 07 -CJFCCV -001 Containment 11.52 2±1 16546±7859 Concrete
B2-081 0 1-BJFCCV- Crib House Lower Floor 11.43 O±O 21342±2709 A016 Concrete
- The pH was measured at room temperature of20-24°C
11
Page 19 of 49
TSD 14-020 Revision 0
Sorption (~) measurements in Support of Dose Assessments for Zion Nuclear Station Decommissioning
Over fifty percent of the activity in the pure groundwater has been removed (count rate 876 versus 2024). This variability in count rate of the spiked groundwater causes larger uncertainties in the calculated.K!. This variability was not found for any other nuclide.
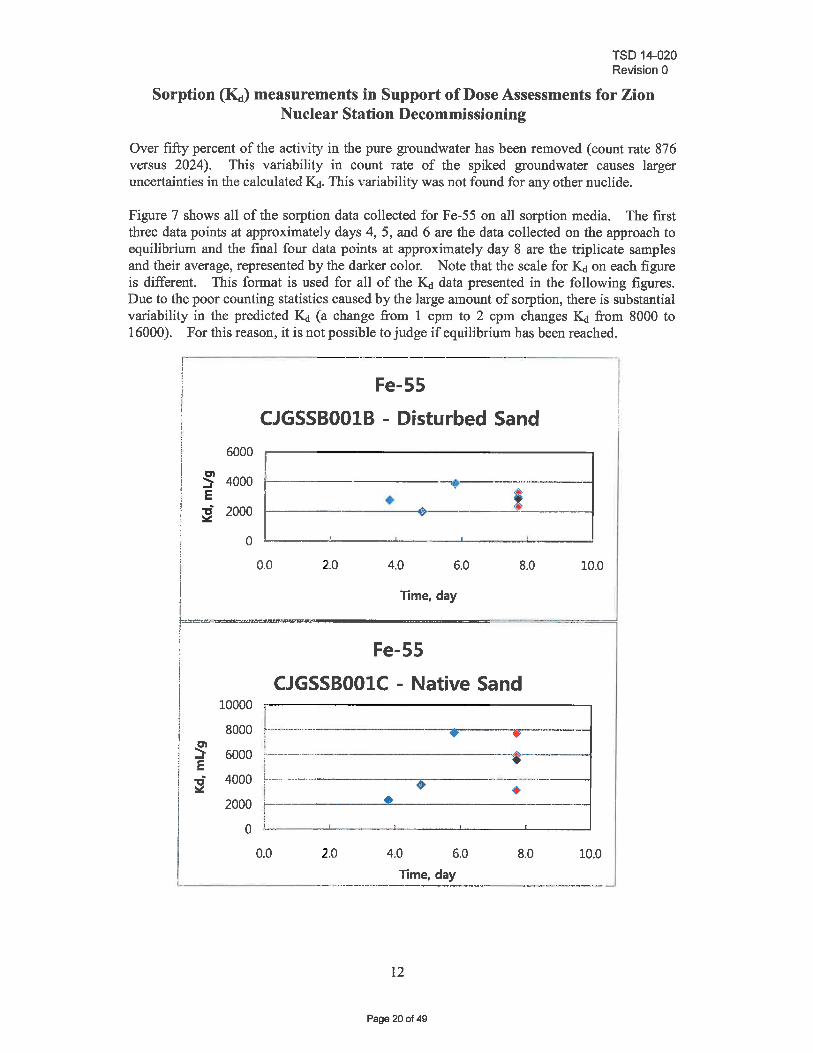
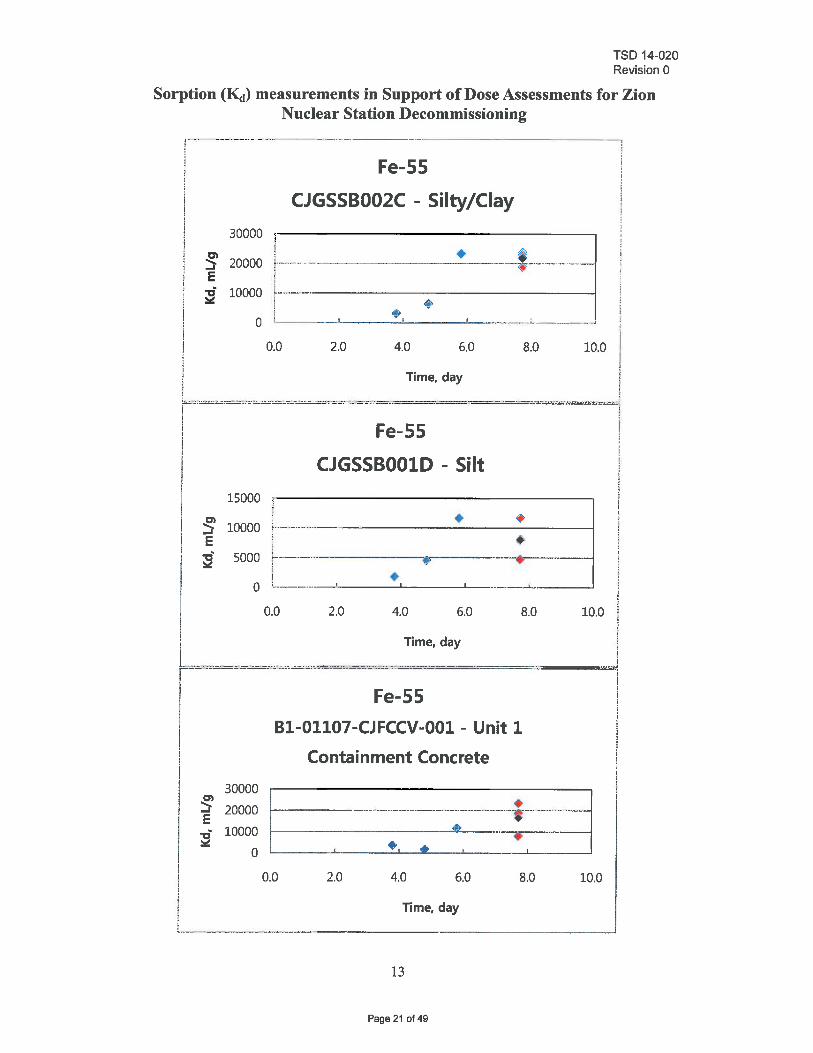
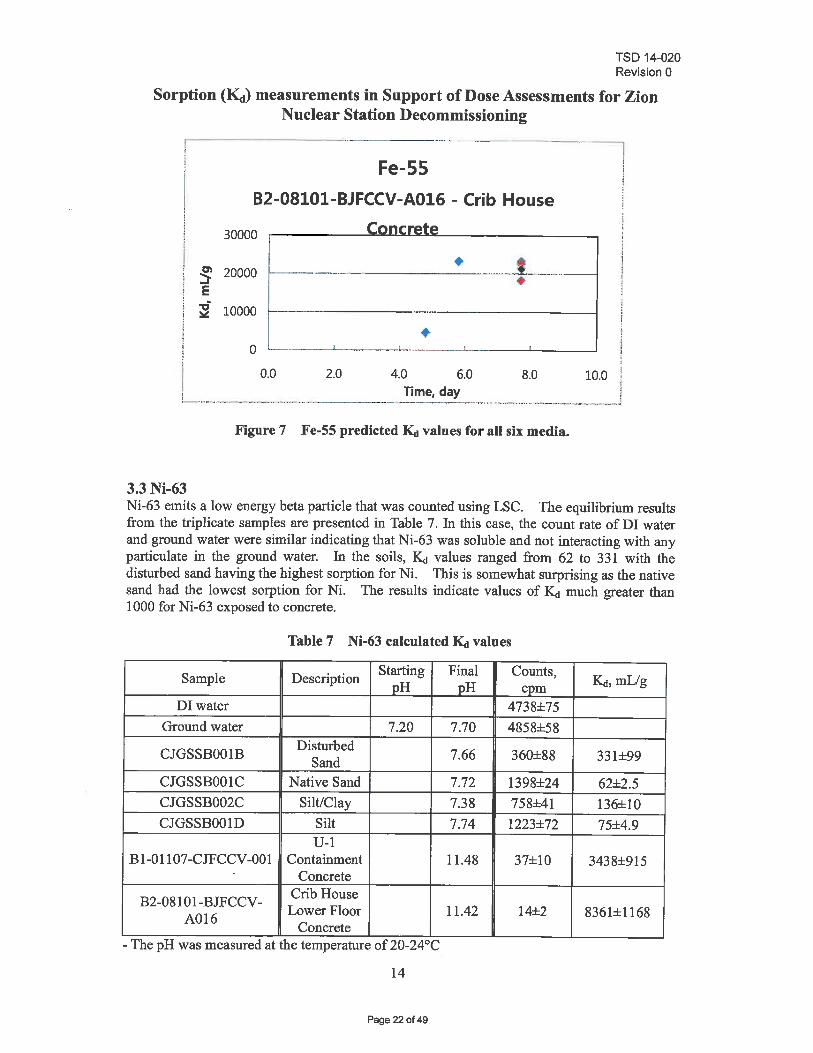
Figure 7 shows all of the sorption data collected for Fe-55 on all sorption media. The first three data points at approximately days 4, 5, and 6 are the data collected on the approach to equilibrium and the final four data points at approximately day 8 are the triplicate samples and their average, represented by the darker color. Note that the scale for .K! on each figure is different. This format is used for all of the .K! data presented in the following figures. Due to the poor counting statistics caused by the large amount of sorption, there is substantial variability in the predicted .K! (a change from 1 cpm to 2 cpm changes .K! from 8000 to 16000). For this reason, it is not possible to judge if equilibrium has been reached.
Fe-55 CJGSSB001B - Disturbed Sand
j
I
6000
~ 4000 E ~- 2000
o
-_.
0.0
r-==-=-=--='=-' . --I i I
,
2.0
_ ...
-.-. --_._-_._ ........ _ ... _-._--
• I __ ~
I I .~ ,
4.0 6.0 8.0 10.0
Time, day
- -=
Fe-55 I i !
CJGSSBOO1C - Native Sand
--._ .... _-- ._-."_.-
-~-.
I i ~ 6000 ' E r ;1 4000 j
2000 r--o i-
0.0
l.. _______ _
- • • *
2.0 4.0 6.0 Time, day ...•. -.. _--_. __ ._.
12
Page 20 of 49
~
--t---._- ...... __ ._._-• -8.0 10.0
.-" .... ----,.....-~. -."..,-- ,..,,--
TSD 14-020 Revision 0
Sorption (~) measurements in Support of Dose Assessments for Zion Nuclear Station Decommissioning
I I
r----·-·. ·-·- - -·· ... _-!
i i
30000
~ 20000 E ":i 10000
0
Fe-55
CJGSSB002C - Silty/Clay
~.- . -... _-. - • ! i L .... ____ ... I 4-I -., ,
0.0 2.0 4.0 6.0
Time, day
-1-·-- ·-_··-
8.0 10.0
~~~=.;~===-~=--="'=-~
I
I
I
15000
Fe-55
CJGSSB001D - Silt
• • ~ 10000 ; ..... - . .. --.. -----------------1 E ~ :ci 5000 ~.--.-.-.. .... i .. •
-.---~-
• , -------'-. o L ____ ,, ___ -'--__ --L.._
0.0 2.0 4.0 6.0 8.0 10.0
~="" .. "=.=,, .=-=:-~-'"'''====--'=""-''''~''''-Time, day
!
Fe-55 81-01107-CJFCCV-OOl - Unit 1
Containment Concrete
~ ~~~ ~I ~~~~~-. .!..- .----.-...... -.-.. -.~--, --... --~----------.~--,-----.--~~-~ .• --:-~-'-"--.--.. ~-=J---'.-
0.0 2.0 4.0 6.0 8.0 10.0
Time, day L._. _ __ . _ ____ ._ .. _ •. _ .. ________________ ___ ---'
13
Page 21 of49
TSD 14-020 Revision 0
Sorption (~) measurements in Support of Dose Assessments for Zion Nuclear Station Decommissioning
Fe-55 B2-08101-BJFCCV-A016 - Crib House
30000 C u"
~ 20000 E
• ---------.. --.- .~-.....• -..•. -.... -• ~ 10000
o ~ ___ ~ ____ ~ ___ L_ __ ~ ____ -J
I 0.0 2.0 4.0 6.0 8.0 10.0
i _ ________ ._. ___ . __ .. ___ _ Time, day -------_ .. _ .... -._--_._-_ .... _-_ ..
Figure 7 Fe-55 predicted Kct values for all six media.
3.3 Ni-63 Ni-63 emits a low energy beta particle that was counted using LSC. The equilibrium results from the triplicate samples are presented in Table 7. In this case, the count rate of DI water and ground water were similar indicating that Ni-63 was soluble and not interacting with any particulate in the ground water. In the soils, I«J values ranged from 62 to 331 with the disturbed sand having the highest sorption for Ni. This is somewhat surprising as the native sand had the lowest sorption for Ni. The results indicate values of I«J much greater than 1 000 for Ni-63 exposed to concrete.
Table 7 Ni-63 calculated Kct values
Sample Description Starting Final Counts, I«J, mUg pH pH cpm Dlwater 4738±75
Ground water 7.20 7.70 4858±58
CJGSSBOOIB Disturbed 7.66 360±88 331±99 Sand CJGSSBOOIC Native Sand 7.72 1398±24 62±2.5 CJGSSB002C Silt/Clay 7.38 758±41 136±10 CJGSSBOOID Silt 7.74 1223±72 75±4.9
U-l B 1-0 11 07 -CJFCCV -001 Containment 11.48 37±10 3438±915
Concrete
B2-081 01-BJFCCV- Crib House Lower Floor 11.42 14±2 8361±1168 A016 Concrete
- The pH was measured at the temperature of 20-24°C
14
Page 22 of 49
TSD 14-020 Revision 0
Sorption (KcJ) measurements in Support of Dose Assessments for Zion Nuclear Station Decommissioning
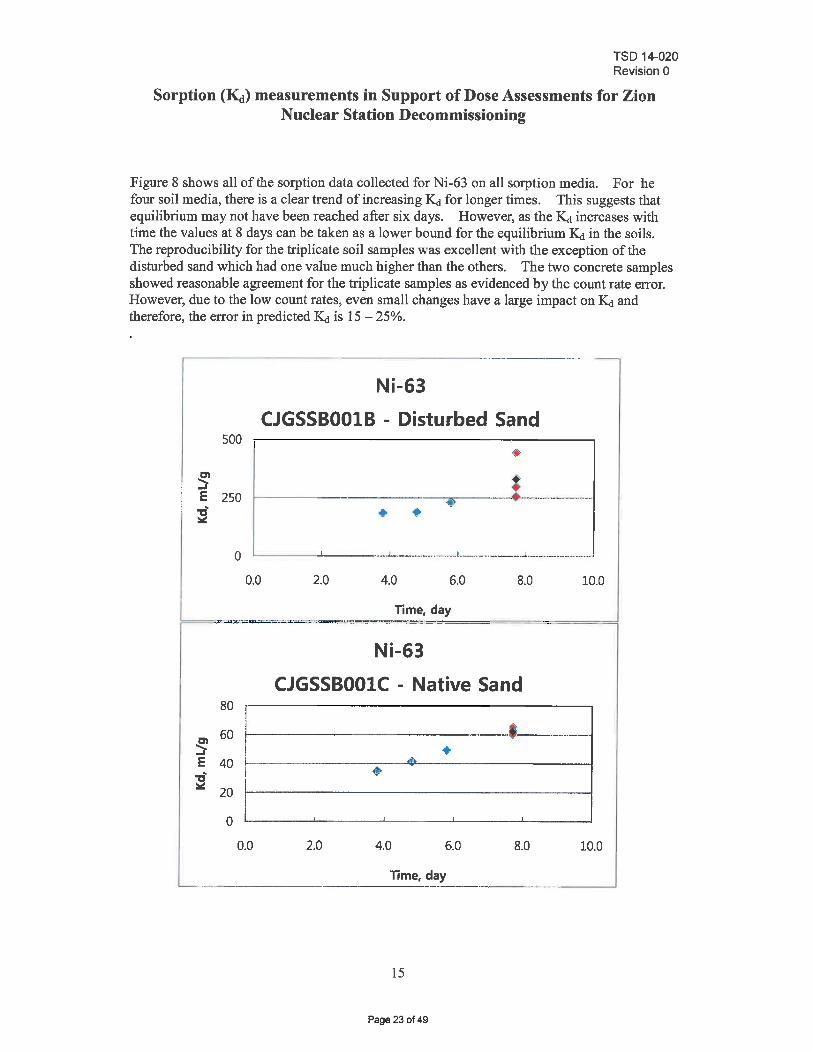
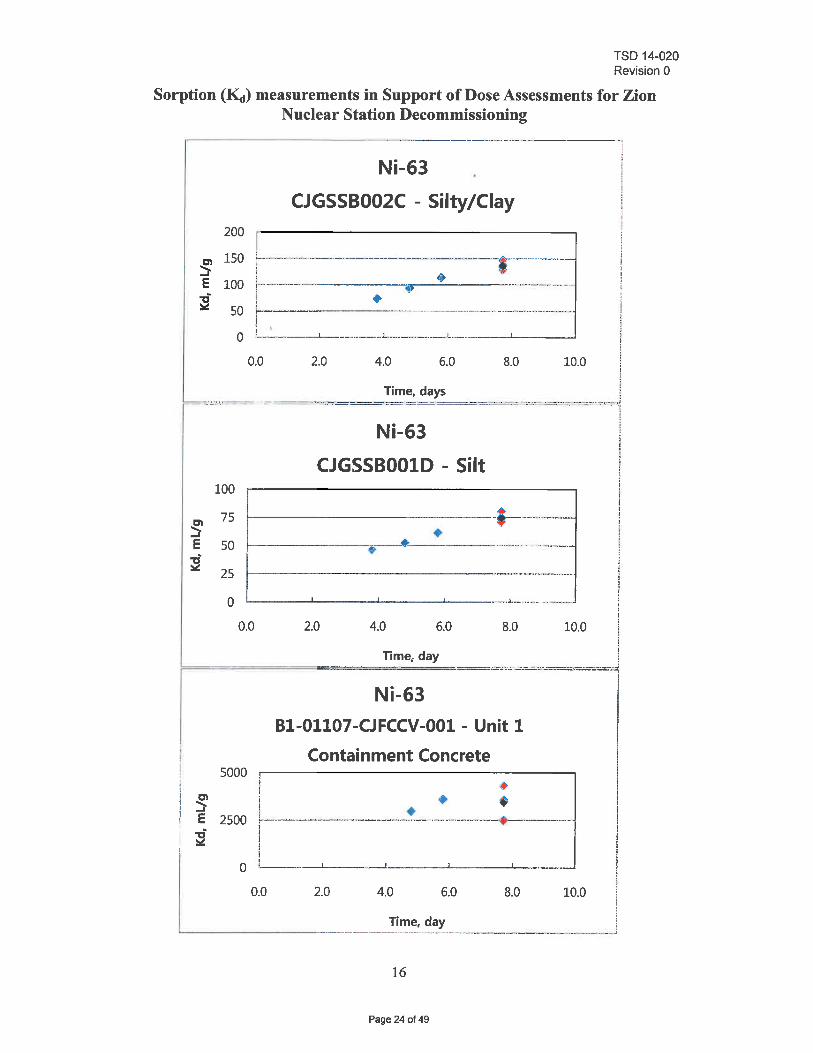
Figure 8 shows all of the sorption data collected for Ni-63 on all sorption media. For he four soil media, there is a clear trend of increasing l«J for longer times. This suggests that equilibrium may not have been reached after six days. However, as the Kd increases with time the values at 8 days can be taken as a lower bound for the equilibrium l«J in the soils. The reproducibility for the triplicate soil samples was excellent with the exception of the disturbed sand which had one value much higher than the others. The two concrete samples showed reasonable agreement for the triplicate samples as evidenced by the count rate error. However, due to the low count rates, even small changes have a large impact on l«J and therefore, the error in predicted l«J is 15 - 25%.
Ni-63 CJGSSBOOIB - Disturbed Sand
500 I • ~ • • I E 250 . ~ .-•.... -.--... -.. --- ...•.. -. J .. ; ;1 • •
0 --- , . ..L .. ___ .... M_~ _ _ .... M_--.J'
0.0 2.0 4.0 6.0 8.0 10.0
TIme, day .... ~~ .. ~~~~.!!:..= .. ~-~-=-..!!.'-~:-~--=-=-::: =-.. -.
Ni-63 CJGSSBOOIC - Native Sand
80 ! i _ .• 60 I .. _--
~ I • E 40 on "Ii i ~ ~ 20
0
0.0 2.0 4.0 6.0 8.0 10.0
TIme, day '---.., . -----.-.~ ... ~ ..... --.
15
Page 23 of 49
TSD 14-020 Revision 0
Sorption (~) measurements in Support of Dose Assessments for Zion Nuclear Station Decommissioning
200
~ 150
r
Ni-63 CJGSSB002C - Silty/Clay
r-.-----.-.--.-.. --------.---... -- .-.--... -.-, .. -.--E 100 ; ~ !-------_ .. __ .. ... _ .. ---'._-_.-.-.. _-
I • 50 ~. -.----------..... --.----.-... - ... - -.. - - ... - .... -.,- ... -.. -
j \ o L ____ .. ___ .---L-_ ........ __ .......... _ ... _ _ ..... _. __ ... l ..... _ ....... _---'-__ --'
0.0 2.0 4.0 6.0 8.0 10.0
Time, days __ ._~~..:.=..:..__ __ ~:"-....!,.""":'_: .===-=-=~=-=-~.-.... --... . ..... _----.-.---.1 - - ~-.. - .. - - ----1
~ E -t:i ~
~
100
75
50
25
0
Ni-63 CJGSSB001D - Silt
t-------------f-- --.-... -... -... --• 1------ - .---*------- -_ .... _ .. _._._ .... __ .. _ .....
1-------------_ ... _ ... _ .... _----....... _--
0.0 2.0 4.0 6.0 8.0
Time, day
Ni-63 Bl-Ol107-CJFCCV-OOl - Unit 1
Containment Concrete
10.0
5000 I
i I · · E 2500 ~.-..... --- .. -.--.--.... -.-...... - -.... -.... ,,-.! .... -.. ,.-..... - --.--.... _.-. -,,---I I
I i o ;,...! ___ ---'-__ .~ __ ___''___ _ _ .L.._.
0.0 2.0 4.0 6.0 8.0 10.0
Time, day i '---______ ._. __ . ____ .... __ .... __ .. _. ___ .. _ _ ._. __ -. _ _ ..... _. ____ -J
16
Page 24 of 49
TSD 14-020 Revision 0
Sorption (~) measurements in Support of Dose Assessments for Zion Nuclear Station Decommissioning
,------ - ----_ . . _ --_._---- -.. .. _-- -----! ,
I Ni-63
B2-08101-BJFCCV-A016 - Crib House
Concrete 10000 ----.-.---.---- ~
~ .... -.-.•..... _ .. _ ..
t ; 5000 r ----···-···----··----.----· .-.-... -.-... -............ _ ......... .
o L-I _ _____ ---'-___ --'-___ ,_L_ .....•.. _ •....•
0_0 2_0 4.0 6.0 8.0 10.0
TIme, day i ___ ... __ . ______ .. ~. ___ . ___ .-.._ ... _¥ ____ .~_ ....... ___ ._._ . ...J
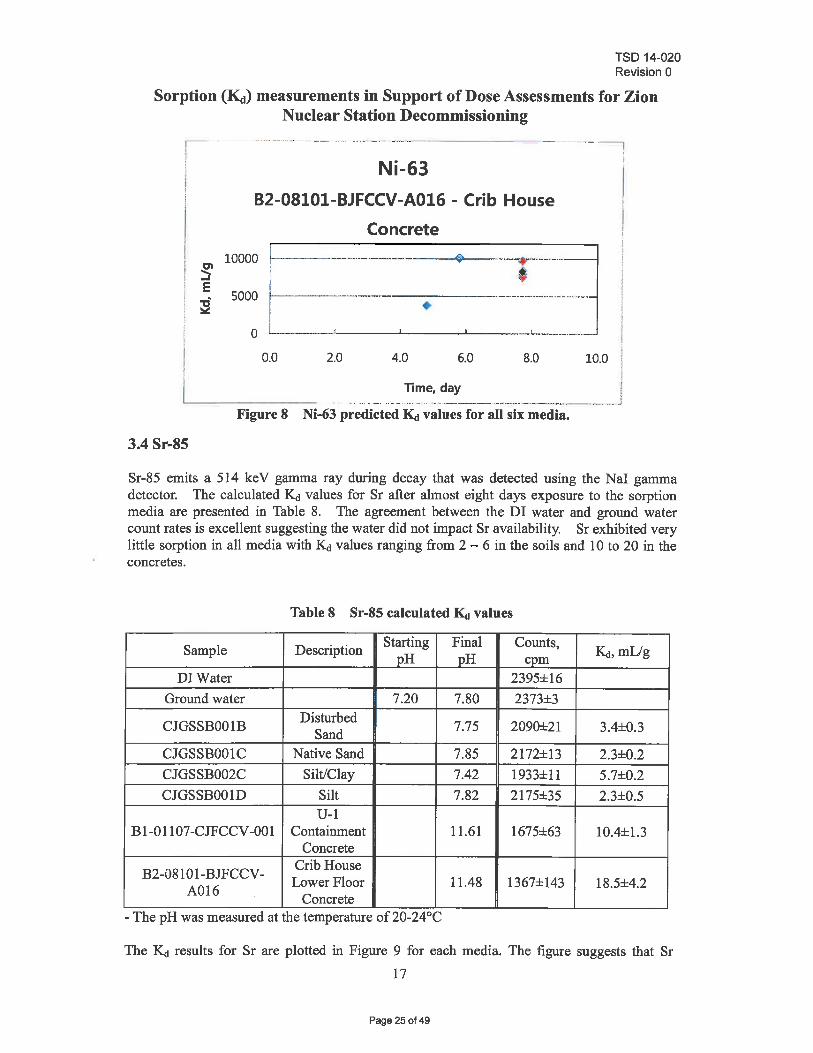
Figure 8 Ni-63 predicted ~ values for all six media.
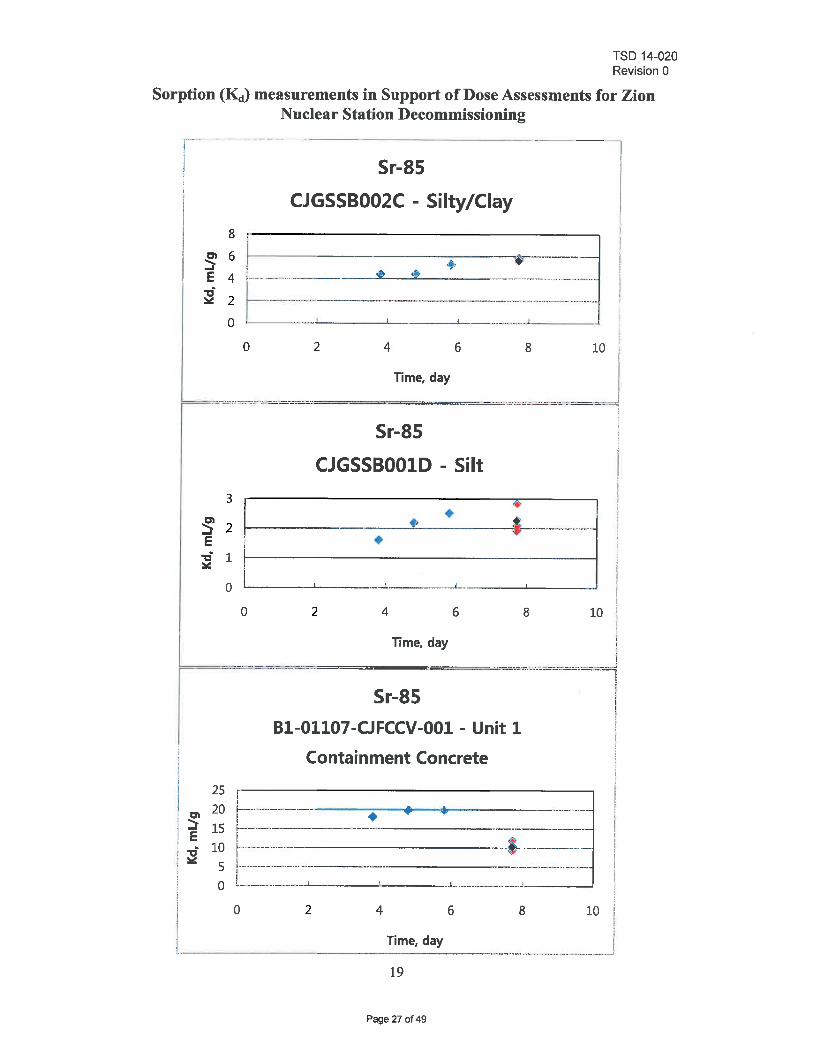
3.4 Sr-85
Sr-85 emits a 514 keY gamma ray during decay that was detected using the NaI gamma detector. The calculated l«J values for Sr after almost eight days exposure to the sorption media are presented in Table 8. The agreement between the DI water and ground water count rates is excellent suggesting the water did not impact Sr availability. Sr exhibited very little sorption in all media with l«J values ranging from 2 - 6 in the soils and 1 0 to 20 in the concretes.
Table 8 Sr-85 calculated ~ values
Sample Description Starting Final Counts, l«J, mUg pH pH cpm DIWater 2395±16
Ground water 7.20 7.80 2373±3
CJGSSBOOIB Disturbed 7.75 2090±21 3.4±O.3 Sand CJGSSBOOIC Native Sand 7.85 2172±13 2.3±0.2 CJGSSB002C Silt/Clay 7.42 1933±11 5.7±0.2 CJGSSBOOID Silt 7.82 2175±35 2.3±0.5
U-l B 1-0 11 07 -CJFCCV -001 Containment 11.61 1675±63 1O.4±1.3
Concrete
B2-0810 1-BJFCCV- Crib House Lower Floor 11.48 1367±143 18.5±4.2 A016 Concrete
- The pH was measured at the temperature of20-24°C
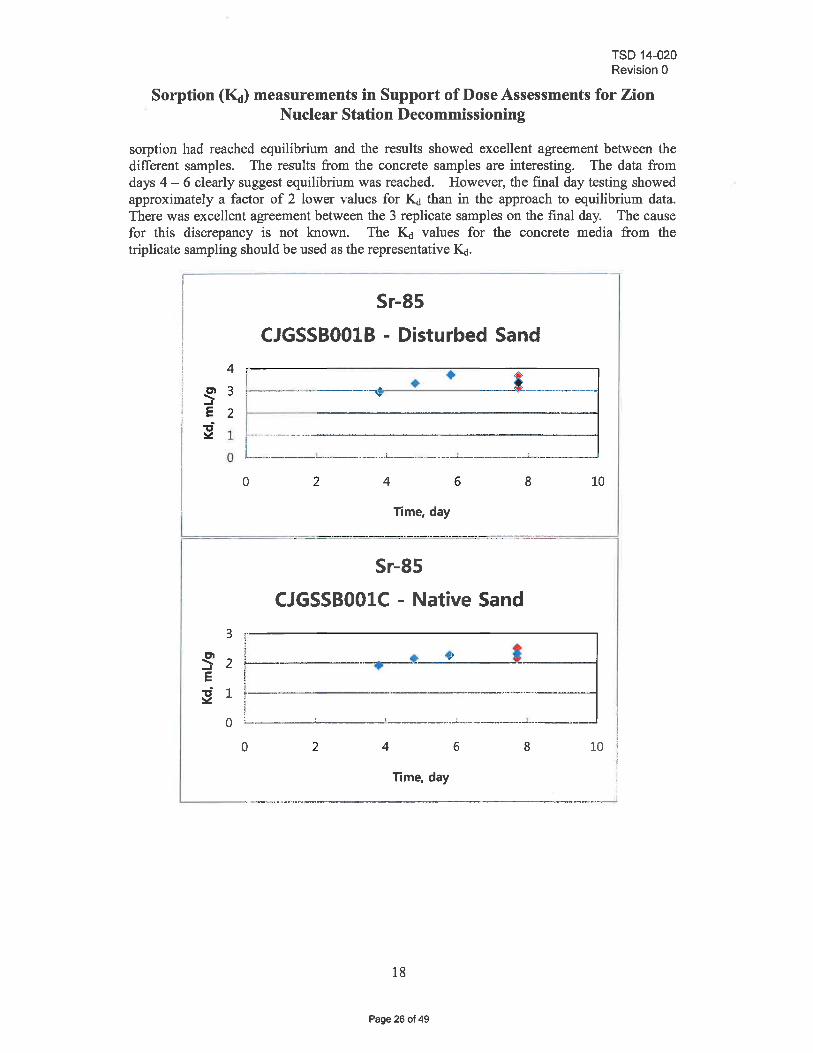
The l«J results for Sr are plotted in Figure 9 for each media. The figure suggests that Sr 17
Page 25 of 49
TSD 14-020 Revision 0
Sorption (~) measurements in Support of Dose Assessments for Zion Nuclear Station Decommissioning
sorption had reached equilibrium and the results showed excellent agreement between the different samples. The results from the concrete samples are interesting. The data from days 4 - 6 clearly suggest equilibrium was reached. However, the final day testing showed approximately a factor of 2 lower values for ~ than in the approach to equilibrium data. There was excellent agreement between the 3 replicate samples on the final day. The cause for this discrepancy is not known. The ~ values for the concrete media from the triplicate sampling should be used as the representative ~.
Sr-85 CJGSSB001B - Disturbed Sand
! ~ L.-----m~r-------'--.--·----I'--- .--.----! o L . _____ ! ___ .... __ .. __ .m_ ... _ .. _._. __ ~ __ ___'"_ .. _. _ _ ___J
o 2 4 6 8 10
Time. day
~======~--====--==.-===~-==~====~-====--;====:
3
~ 2 E ~ 1
0
r-! i
Sr-85 CJGSSB001C - Native Sand
r--'--' ------------_._---_.-_ ....• --_._--------~ ____ .l__ ___ ,' •• _._. __ .. .L _____ .. _._. ______ .L ________ _
0 2 4 6 8
Time. day
18
Page 26 of 49
TSD 14-020 Revision 0
Sorption (KcJ) measurements in Support of Dose Assessments for Zion Nuclear Station Decommissioning
I--I
-- --l
I !
Sr-85
CJGSSB002C - Silty/Clay 8 r------------------.
~ 6 ]f-------------.- - ... -;-....... -.. ---.. --
~ ~ F=.--~:. ·-:~~.~.L_! ~_-=.~_-=~_~-._~~~~_=_.:~_=_~~~~~=-----~-~_=~_~.~_-~-~_~:_=.~_-~-_~~:_: .... !
3
~ 2
o 2 4 6
TIme, day
Sr-85
CJGSSB001D - Silt
• • I----------~·!:.......----~f-- .. -.. ·-.. ·-···---· ! 11-ji _______ • ______ ____ ~
~ I o 1-1 ___ --' ___ . _ __ . ___ -1. ____ 1.-__ --'
o 2 4 6
Time, day
=
Sr-85 BI-OII07-CJFCCV-OOl - Unit 1
Containment Concrete
8 10
i 25 r--------------------,
I ~ ~~ ~:::=~~-~.-----! .. --. --+--.... - .. ----... --: -d 10 t.-··-.. · .. ·---------------tf~-----l l ~ , 5 1-..... --.... -- ... -...... . --- ---------.. ---.- .......... - ... -i 0 l_ .. _ .... __ . --'-____ ' ___ .. J...! --... --.~----"
11-; ___ 0 ____ 2 ____ 4_T_im_e_, d_a_y_6 ___ __ B_ _ _ __ ':_"
19
Page 27 of 49
,
TSD 14-020 Revision 0
Sorption (KcI) measurements in Support of Dose Assessments for Zion Nuclear Station Decommissioning
- -- - - - - - - -_._ - --- --- -_._-----,
Sr-85 B2-08101-BJFCCV-A016 - Crib House
Concrete 40 r--------------------------------------~ ,
i • • • ~ 30 i· -·····-··· ~·'" ··· .. '· E 20 I ··-·--·-------·------ - -t-- ·--·--
----_._----_ ............ _-_. __ .-
;:i 1~ t -==-'-, ___ ---'- .. o 2 4 6 8 10
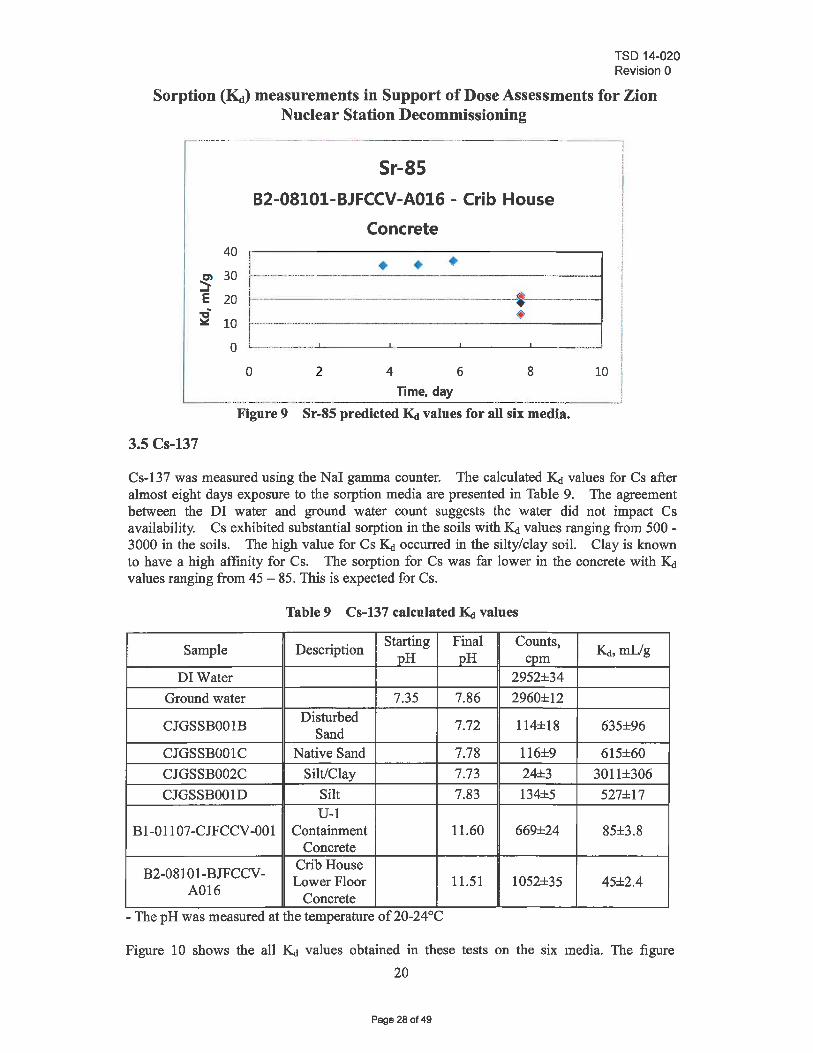
TIme. day [ ... __ ...... _.-.. __ .. __ ._ ........ _ ._-------=-----... _ ._ ... __ ..... _ ... _--_ .. . Figure 9 Sr-85 predicted ~ values for all six media.
3.5 Cs-137
Cs-137 was measured using the NaI gamma counter. The calculated :K! values for Cs after almost eight days exposure to the sorption media are presented in Table 9. The agreement between the DI water and ground water count suggests the water did not impact Cs availability. Cs exhibited substantial sorption in the soils with :K! values ranging from 500 -3000 in the soils. The high value for Cs :K! occurred in the silty/clay soil. Clay is known to have a high affinity for Cs. The sorption for Cs was far lower in the concrete with ~ values ranging from 45 - 85. This is expected for Cs.
Table 9 Cs-137 calculated ~ values
Sample Description Starting Final Counts, ~,mUg pH pH cpm
DIWater 2952±34 Ground water 7.35 7.86 2960±12
CJGSSBOOIB Disturbed 7.72 114±18 635±96 Sand CJGSSBOOIC Native Sand 7.78 116±9 615±60 CJGSSB002C Silt/Clay 7.73 24±3 3011±306 CJGSSBOOID Silt 7.83 134±5 527±17
U-I B 1-0 1107 -CJFCCV -00 I Containment 11.60 669±24 85±3.8
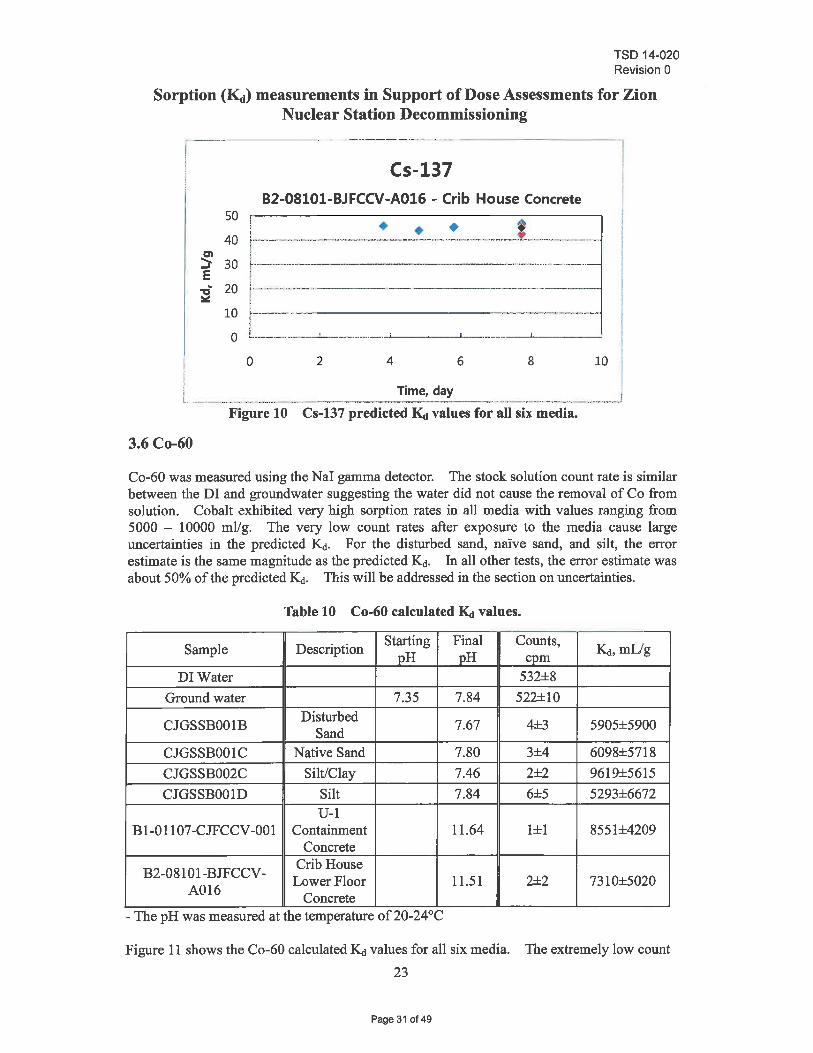
Concrete
B2-081 0 1-BJFCCV- Crib House Lower Floor 11.51 1052±35 45±2.4 AOl6 Concrete
- The pH was measured at the temperature of 20-24°C
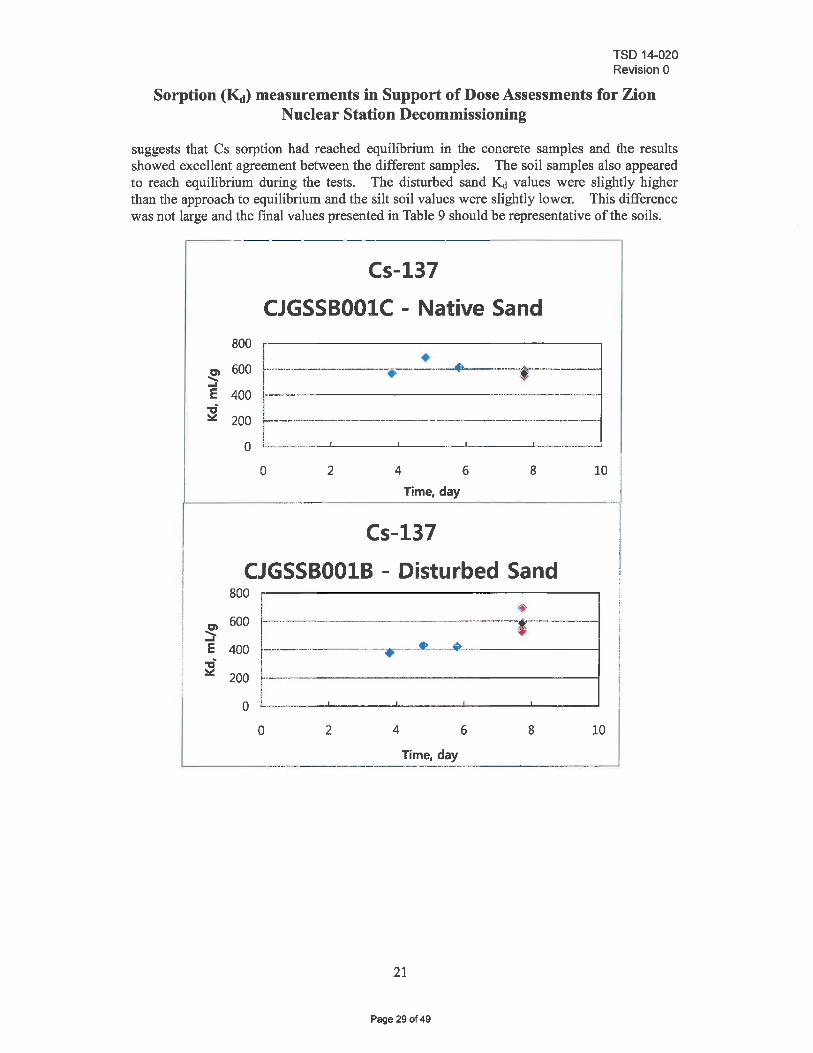
Figure 10 shows the all l«J values obtained in these tests on the six media. The figure
20
Page 28 of 49
TSD 14-020 Revision 0
Sorption (~) measurements in Support of Dose Assessments for Zion Nuclear Station Decommissioning
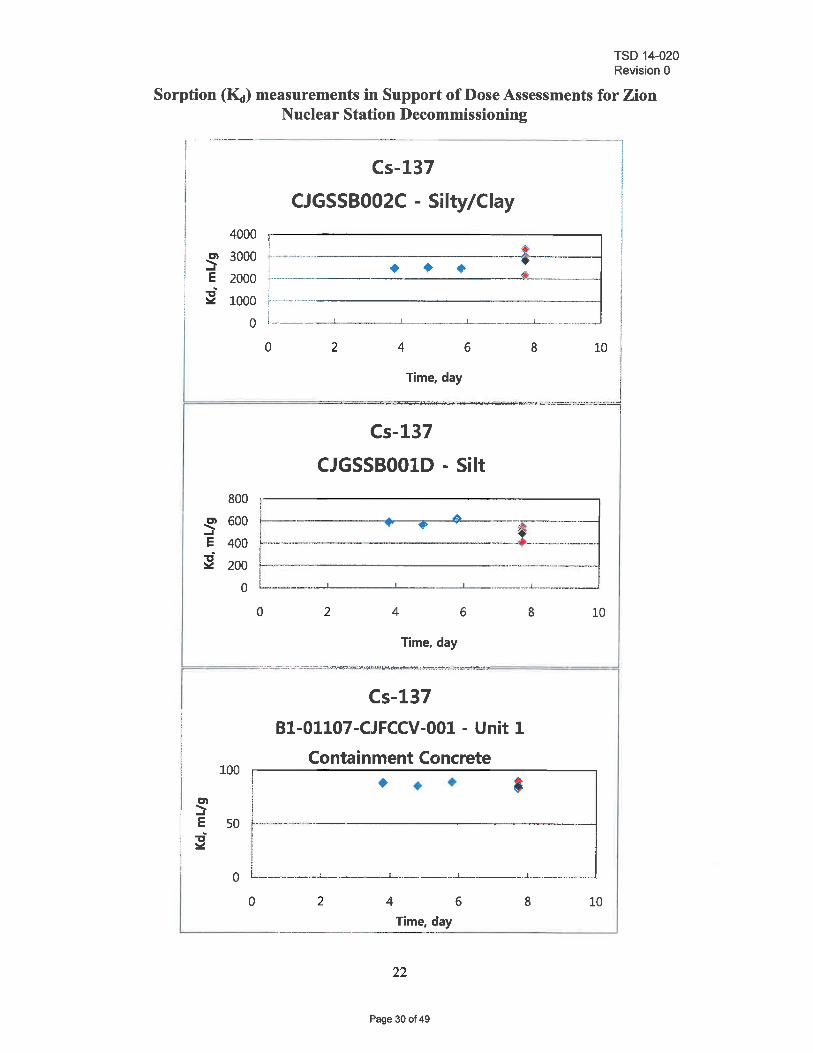
suggests that Cs sorption had reached equilibrium in the concrete samples and the results showed excellent agreement between the different samples. The soil samples also appeared to reach equilibrium during the tests. The disturbed sand :KJ values were slightly higher than the approach to equilibrium and the silt soil values were slightly lower. This difference was not large and the final values presented in Table 9 should be representative of the soils .
.------------- - --------- -------,
800
~ 600
E 400
~ 200
Cs-137
CJGSSB001C - Native Sand
r" , . I· .. ··· .. · .. ········-.. ·--·-----·--.----·--+--··· ........ -T ·-·······.-----.-i ! .. _ ...... _ ....... _--------_ ................ _ . _ _ ._._--_ .. _._ ..
L-.---.. ----.--.--.-.-... --... --.--........... -.-.-.. -----. I
I a l_ .... ~. ___ ....L._ ___ -'---__ --'-----', ...... . .. _ •• - . . ...... .. _ .... .
;
a 2 4 6 8 10 i _____ T_im_e_,_d_a_Y __________ J
~
Cs-137
CJGSSB001B - Disturbed Sand 800
600 1---·· - • .. _ .... _ ... .,.. •.. - .... _._ ... __ .. _-
*
I
I i
E 400 r--···--·---·-- -.. -.-.--..... ---... - ------1 ~-
200 ~ ... --... - .-... ------f
a L .. ,_ ... _ .. ~_.L-___ .L.-_ __ '--_ _ ----''--__ ---'
. __ 2 ____ 4_T_im_e, d_ay_6 _ ___ 8 __ __ 1~ a
21
Page 29 of 49
TSD 14-020 Revision 0
Sorption (KcJ) measurements in Support of Dose Assessments for Zion Nuclear Station Decommissioning
r. - - ------. . _ ..... -.-. . - .. . _ -.
I C5-137
11' CJGSSB002C - Silty/Clay 4000
I I
j ~ 3000 r------..r I E 2000 1---- - -- • ... ... .-.----t------
<i;
I -rJ ! : =-: 1000 r-·- - ·----- ---------------f o 1---. ~~---~----~-
800
~ 600 E 400 ~ 200
0
o
,. I
2 4 6
Time, day
C5-137
CJGSSBOOID - Silt
• ..
__ --1-___ ._ .. _. __ ..
8 10
! ~-... ~.-...... ~~-.. ~ .. -
-IQ.~'---.---.~----.--
. _--------_._--_ ..• :-..• _ ............ _-_ .. _ ... .. I
!I ._-------_ .......... -.... -.- .. _._ . ... __ ........ . r:--- =-.-.----...... --...-; L __ .. ____ .... .--I.. ___ .L..-.. __ -'--_ .... _ ... __ . _ _ L. _ _ .• ____ .•. ___ _
0 2 4 6 8 10
Time, day r---...... --'.=.==~ .. "' .. ==='==-==-~~" ... .. '
I C5-137 i BI-OII07-CJFCCV-OOl - Unit 1
Containment Concrete
22
Page 30 of 49
TSD 14-020 Revision 0
Sorption (~) measurements in Support of Dose Assessments for Zion Nuclear Station Decommissioning ,---------_._ .. _--_ ._ .. _ ... _ ..
, C5-137
B2-08101-BJFCCV-A016 - Crib House Concrete 50 r --------------------------------------~
; . .. . : . 40 r--'-"'-'-"----... -... -.---.-......... -.. ----.... -.-... -.'-.-.. , ............. _- .. --.-_ .... -._-.'-'''' -'-'-'--"'- '- -'-"
~ 30 r"--"-~ 20 r--------·-----·
-----------_. __ ....•.•. _ .. _-_ ... __ ...
10 l----- ------------------------.. --... - .... -- .. - .-- ... --..... I t o L ... __ ._ .... __ ... __ .. _ · ___ ·_ .... _ .. _ .. __ ._-'---, ___ ----L.._
o 2 4 6 8 10 I I nm~d~ L .. _._ .. _._________ __ ____ ._._. ______ !
Figure 10 Cs-137 predicted KcJ values for all six media.
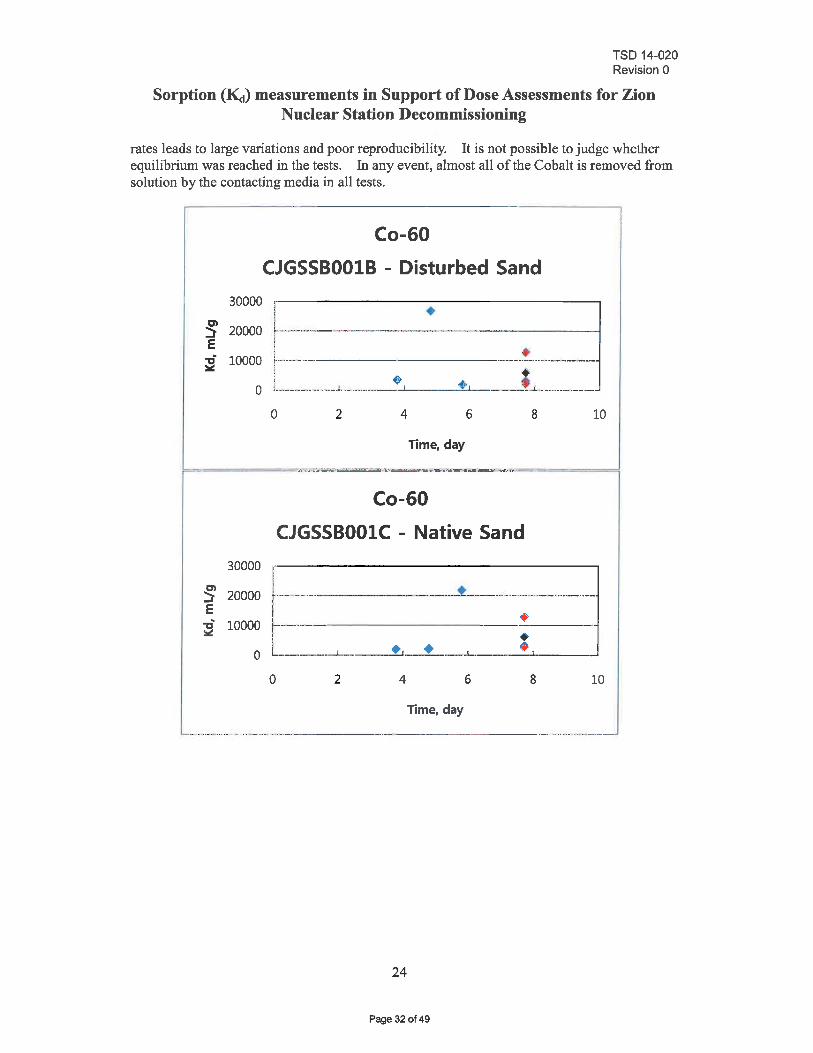
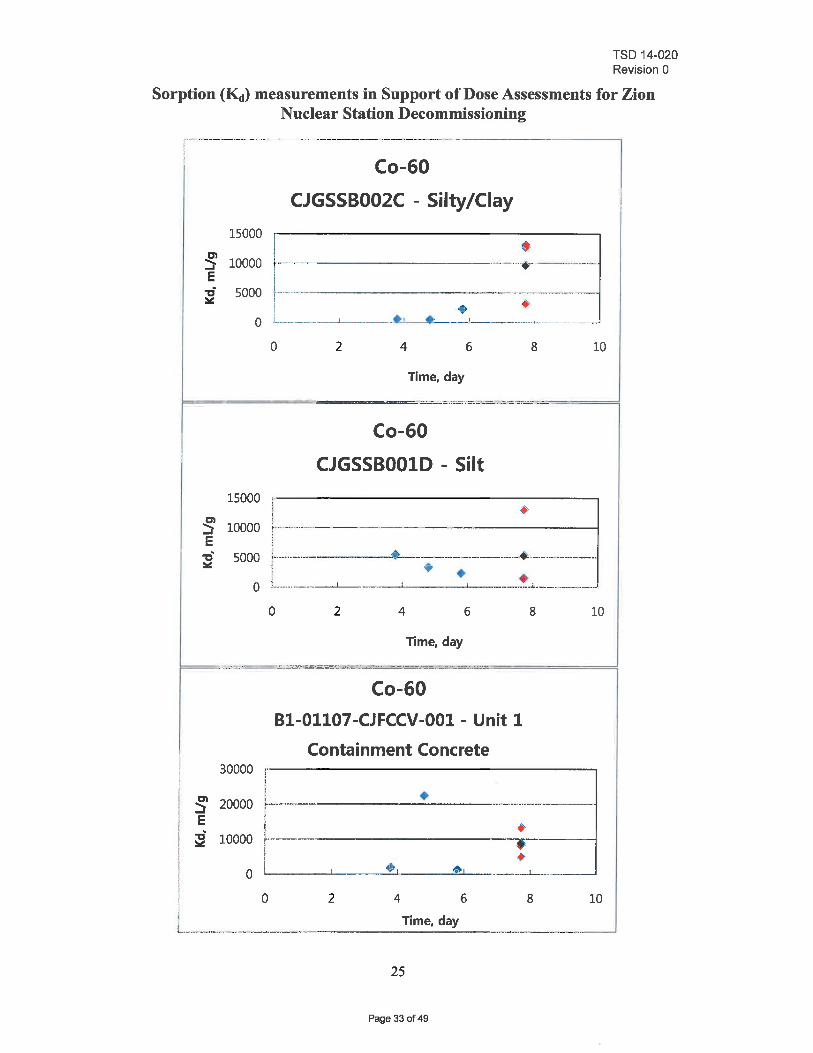
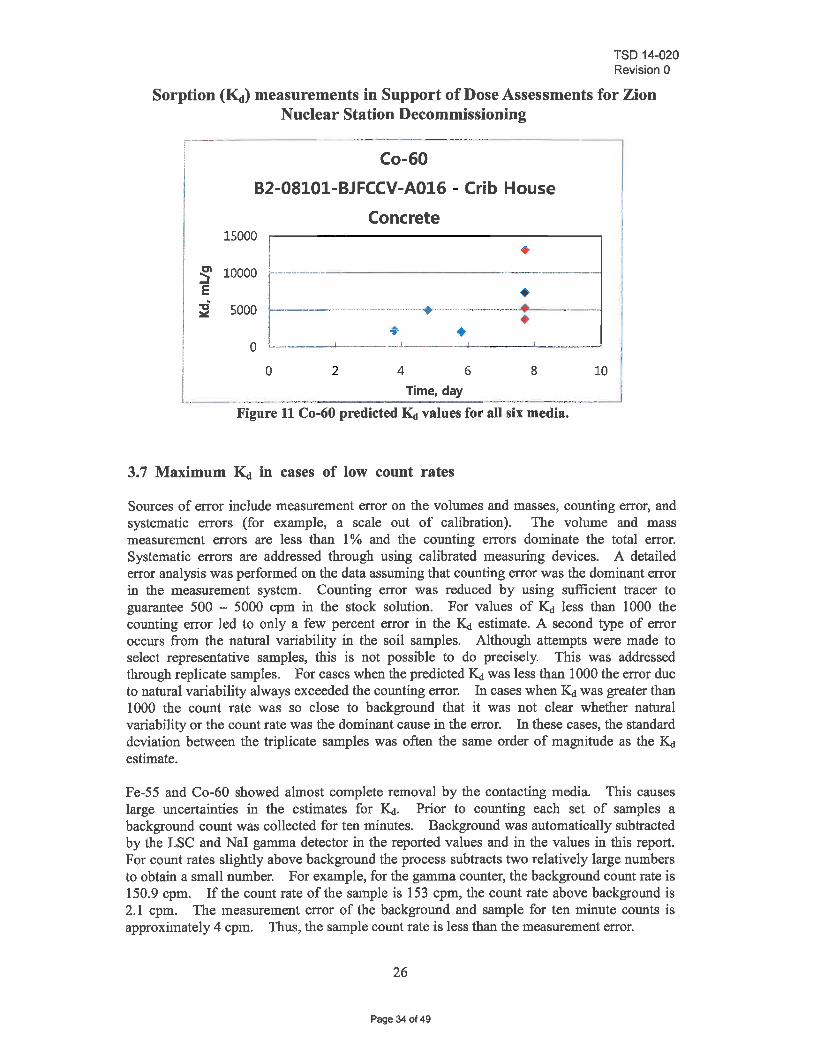
3.6 Co-60
Co-60 was measured using the NaI gamma detector. The stock solution count rate is similar between the DI and groundwater suggesting the water did not cause the removal of Co from solution. Cobalt exhibited very high sorption rates in all media with values ranging from 5000 - 10000 mllg. The very low count rates after exposure to the media cause large uncertainties in the predicted I"<tt. For the disturbed sand, naive sand, and silt, the error estimate is the same magnitude as the predicted I"<tt. In all other tests, the error estimate was about 50% of the predicted I"<tt. This will be addressed in the section on uncertainties.
Table 10 Co-60 calculated KcJ values.
Sample Description Starting Final Counts, I"<tt, mUg pH pH cpm DI Water 532±8
Ground water 7.35 7.84 522±10
CJGSSBOOIB Disturbed 7.67 4±3 5905±5900 Sand CJGSSBOOIC Native Sand 7.80 3±4 6098±5718 CJGSSB002C Silt/Clay 7.46 2±2 9619±5615 CJGSSBOOID Silt 7.84 6±5 5293±6672
U-l B 1-0 11 07 -CJFCCV -001 Containment 11.64 1±1 8551±4209
Concrete
B2-08101-BJFCCV- Crib House Lower Floor 11.51 2±2 7310±5020 A016 Concrete
- The pH was measured at the temperature of20-24°C
Figure 11 shows the Co-60 calculated I"<tt values for all six media. The extremely low count 23
Page 31 of 49
TSD 14-020 Revision 0
Sorption (~) measurements in Support of Dose Assessments for Zion Nuclear Station Decommissioning
rates leads to large variations and poor reproducibility. It is not possible to judge whether equilibrium was reached in the tests. In any event, almost all of the Cobalt is removed from solution by the contacting media in all tests.
30000
~ 20000 E
30000
~ 20000 E ~ 10000
0
Co-60
CJGSSBOOIB - Disturbed Sand ,----------------------------------~ ; • i ~ ..... ~ .. -...... ~- ------ ----------------------l
o 2 4 6
Time, day
Co-60
CJGSSBOOIC - Native Sand I
I r---- ...... ! •
8
;,--------- ----------------- -- ----, !
10
.-'----'.:<...1. • L ___ .. ; . ...!._._._ .. ,---'-...1...-___ ---'
0 2 4 6 8 10
Time, day
.• . , .. -.--..... " .. --- , .. --.----.. - ----- - ---------.. - ... ..... ~---.-
24
Page 32 of 49
TSD 14-020 Revision 0
Sorption (~) measurements in Support of Dose Assessments for Zion Nuclear Station Decommissioning
!I
r--- - . -------~------.------- - .. ----- -----
f , Co-60
CJGSSB002C - Silty/Clay 15000 • ~ 10000 ~-------------.-----.---.. ---.-... --.---,.
E I ~ 5000 f--- ----'--------------- -·---------·-----
I + '-o L. ____ .-~----.-...,'---'._ , _ ___ --1 _____________ _
o 2 4 6 8 10
Time. day
i=======~====-=-=-.=--=--=---=--=---"-=- -=.=,,=--===="l
15000
Co-60
CJGSSBOOID - Silt
~ 10000 f--·,------- ·---------- ------------/ E !
i ~ 5000 !-.--.. -.-.. - .. ---~.'-----.---.. ------.------.. --.... - ....... -- .. _----.-•. • • ---1._. __ ~ __ ._ .• _ .. ! ..i._. ___ ._ .... __ ,
o ! .. -... --..... - ... -.-'---
o 2 4 6
Time. day
Co-60 Bl-Ol107-CJFCCV-OOl - Unit 1
Containment Concrete
8 10
30000 r------------------. !
DI i • :::::r 20000 ~-.. --..... ------------.-".-... -...... -.-.. -.... ,---E I ~ 10000 !--------------
i o 1-1 __ ---1..._~-~ 4) , I ... _---'
o 2 4 6 8 10
L_ .. __ ..... _ .. _ .. __ .. _. __ . ___ .. ______ ~ ___ _____ Ti_m_e_. d_a_y _ _ ._ ... "._ .... __ . ____ ... .......
25
Page 33 of 49
TSD 14-020 Revision 0
Sorption (KcJ) measurements in Support of Dose Assessments for Zion Nuclear Station Decommissioning
I
f----------- ... -------- -.--- - --------.. ----------.
Co-60
B2-08101-BJFCCV-A016 - Crib House
Concrete 15000
~ 10000 E
5000
•
.' . ll~=~~ __ ----+ ---"'::-'--"'''''''---i ---o __ . ___ ---L-___ .l _ _ • __ --l.. _ __ ---1_. __ • _ _ .. _~,
! 0 L_ . _______ .... _____ ... __ 2 4 6 8 10 Time, day I ________ ---.: ___ "_' _" __ _ _____ .. __ ---l
Figure 11 Co-60 predicted ~ values for all six media.
3.7 Maximum Kd in cases of low count rates
Sources of error include measurement error on the volumes and masses, counting error, and systematic errors (for example, a scale out of calibration). The volume and mass measurement errors are less than 1 % and the counting errors dominate the total error. Systematic errors are addressed through using calibrated measuring devices. A detailed error analysis was performed on the data assuming that counting error was the dominant error in the measurement system. Counting error was reduced by using sufficient tracer to guarantee 500 - 5000 cpm in the stock solution. For values of ~ less than 1000 the counting error led to only a few percent error in the ~ estimate. A second type of error occurs from the natural variability in the soil samples. Although attempts were made to select representative samples, this is not possible to do precisely. This was addressed through replicate samples. For cases when the predicted :K! was less than 1000 the error due to natural variability always exceeded the counting error. In cases when :K! was greater than 1000 the count rate was so close to background that it was not clear whether natural variability or the count rate was the dominant cause in the error. In these cases, the standard deviation between the triplicate samples was often the same order of magnitude as the :K! estimate.
Fe-55 and Co-60 showed almost complete removal by the contacting media. This causes large uncertainties in the estimates for:K!. Prior to counting each set of samples a background count was collected for ten minutes. Background was automatically subtracted by the LSC and NaI gamma detector in the reported values and in the values in this report. For count rates slightly above background the process subtracts two relatively large numbers to obtain a small number. For example, for the gamma counter, the background count rate is 150.9 cpm. If the count rate of the sample is 153 cpm, the count rate above background is 2.1 cpm. The measurement error of the background and sample for ten minute counts is approximately 4 cpm. Thus, the sample count rate is less than the measurement error.
26
Page 34 of 49
TSD 14-020 Revision 0
Sorption (~) measurements in Support of Dose Assessments for Zion Nuclear Station Decommissioning
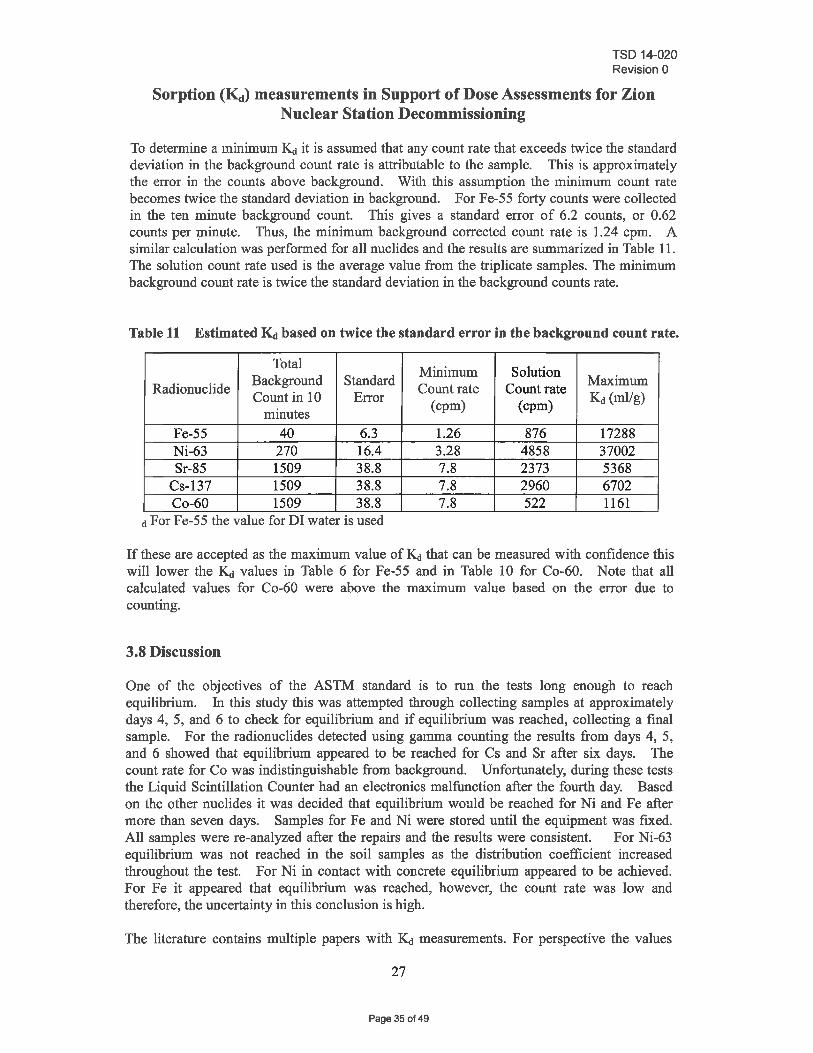
To determine a minimum ~ it is assumed that any count rate that exceeds twice the standard deviation in the background count rate is attributable to the sample. This is approximately the error in the counts above background. With this assumption the minimum count rate becomes twice the standard deviation in background. For Fe-55 forty counts were collected in the ten minute background count. This gives a standard error of 6.2 counts, or 0.62 counts per ~inute. Thus, the minimum background corrected count rate is 1.24 cpm. A similar calculation was performed for all nuclides and the results are summarized in Table 11. The solution count rate used is the average value from the triplicate samples. The minimum background count rate is twice the standard deviation in the background counts rate.
Table 11 Estimated KcJ based on twice the standard error in the background count rate.
Total Minimum Solution Radionuclide Background Standard Count rate Count rate Maximum
Count in 10 Error (cpm) (cpm) ~ (ml/g) minutes
Fe-55 40 6.3 1.26 876 17288 Ni-63 270 16.4 3.28 4858 37002 Sr-85 1509 38.8 7.8 2373 5368
Cs-137 1509 38.8 7.8 2960 6702 Co-60 1509 38.8 7.8 522 1161
d For Fe-55 the value for DI water is used
If these are accepted as the maximum value of ~ that can be measured with confidence this will lower the ~ values in Table 6 for Fe-55 and in Table 10 for Co-60. Note that all calculated values for Co-60 were above the maximum value based on the error due to counting.
3.8 Discussion
One of the objectives of the ASTM standard is to run the tests long enough to reach equilibrium. In this study this was attempted through collecting samples at approximately days 4, 5, and 6 to check for equilibrium and if equilibrium was reached, collecting a final sample. For the radionuclides detected using gamma counting the results from days 4, 5, and 6 showed that equilibrium appeared to be reached for Cs and Sr after six days. The count rate for Co was indistinguishable from background. Unfortunately, during these tests the Liquid Scintillation Counter had an electronics malfunction after the fourth day. Based on the other nuclides it was decided that equilibrium would be reached for Ni and Fe after more than seven days. Samples for Fe and Ni were stored until the equipment was fixed. All samples were re-analyzed after the repairs and the results were consistent. For Ni-63 equilibrium was not reached in the soil samples as the distribution coefficient increased throughout the test. For Ni in contact with concrete equilibrium appeared to be achieved. For Fe it appeared that equilibrium was reached, however, the count rate was low and therefore, the uncertainty in this conclusion is high.
The literature contains multiple papers with ~ measurements. For perspective the values
27
Page 35 of 49
TSD 14-020 Revision 0
Sorption (~) measurements in Support of Dose Assessments for Zion Nuclear Station Decommissioning
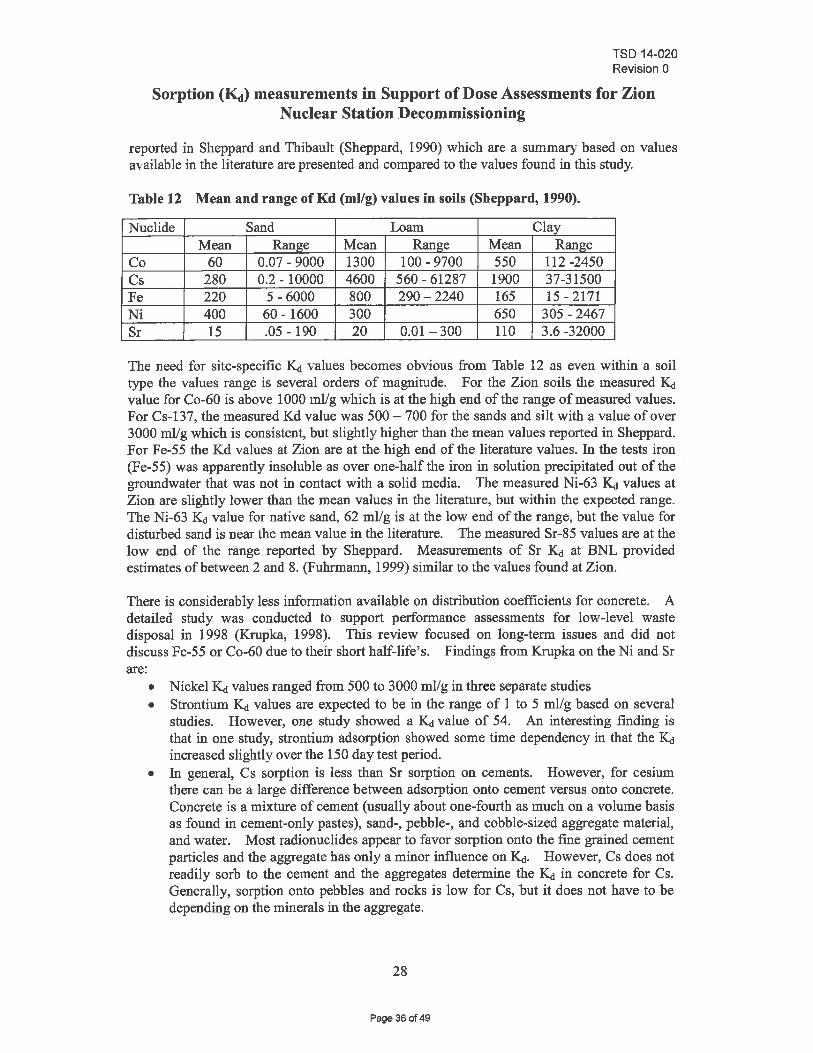
reported in Sheppard and Thibault (Sheppard, 1990) which are a summary based on values ayailable in the literature are presented and compared to the values found in this study.
Table 12 Mean and range of Kd (ml/g) values in soils (Sheppard, 1990).
Nuclide Sand Loam Clay Mean Range Mean Range Mean Range
Co 60 0.07 - 9000 1300 100 - 9700 550 112 -2450 Cs 280 0.2 - 10000 4600 560 - 61287 1900 37-31500 Fe 220 5 - 6000 800 290-2240 165 15 - 2171 Ni 400 60 - 1600 300 650 305 - 2467 Sr 15 .05 - 190 20 0.01- 300 llO 3.6 -32000
The need for site-specific ~ yalues becomes obvious from Table 12 as even within a soil type the values range is several orders of magnitude. For the Zion soils the measured ~ value for Co-60 is above 1000 mllg which is at the high end of the range of measured values. For Cs-137, the measured Kd value was 500 -700 for the sands and silt with a value of over 3000 mllg which is consistent, but slightly higher than the mean values reported in Sheppard. For Fe-55 the Kd values at Zion are at the high end of the literature values. In the tests iron (Fe-55) was apparently insoluble as over one-half the iron in solution precipitated out of the groundwater that was not in contact with a solid media. The measured Ni-63 ~ values at Zion are slightly lower than the mean values in the literature, but within the expected range. The Ni-63 ~ value for native sand, 62 ml/g is at the low end of the range, but the value for disturbed sand is near the mean value in the literature. The measured Sr-85 values are at the low end of the range reported by Sheppard. Measurements of Sr ~ at BNL provided estimates of between 2 and 8. (Fuhrmann, 1999) similar to the values found at Zion.
There is considerably less information available on distribution coefficients for concrete. A detailed study was conducted to support performance assessments for low-level waste disposal in 1998 (Krupka, 1998). This review focused on long-term issues and did not discuss Fe-55 or Co-60 due to their short half-life's. Findings from Krupka on the Ni and Sr are:
• Nickel ~ values ranged from 500 to 3000 mUg in three separate studies • Strontium ~ values are expected to be in the range of 1 to 5 mllg based on several
studies. However, one study showed a ~ value of 54. An interesting finding is that in one study, strontium adsorption showed some time dependency in that the ~ increased slightly over the 150 day test period.
• In general, Cs sorption is less than Sr sorption on cements. However, for cesium there can be a large difference between adsorption onto cement versus onto concrete. Concrete is a mixture of cement (usually about one-fourth as much on a volume basis as found in cement-only pastes), sand-, pebble-, and cobble-sized aggregate material, and water. Most radionuclides appear to favor sorption onto the fine grained cement particles and the aggregate has only a minor influence on~. However, Cs does not readily sorb to the cement and the aggregates determine the ~ in concrete for Cs. Generally, sorption onto pebbles and rocks is low for Cs, but it does not have to be depending on the minerals in the aggregate.
28
Page 36 of 49
TSD 14-020 Revision 0
Sorption (~) measurements in Support of Dose Assessments for Zion Nuclear Station Decommissioning
More recent studies to support perfonnance assessment calculations at the Savannah River site (Kaplan, 2008 and McDowell-Boyer, 2009) suggested :K! values similar to those found in Krupka (Krupka, 1998). In these reports they differentiated between oxidizing and reducing conditions with :K! values lower for reducing conditions. McDowell-Boyer (2009) suggested the following values:
• Nickel :K! values ranged from 1000 to 5000 mllg with the lower values for reducing conditions.
• Strontium :K! values are expected to be in the range of 3 to 30 mllg. • Cesium:K! values are expected to be in the range of 0 to 20 ml/g.
The estimated :K! values for Nickel and Strontium from these tests are consistent with those found in the literature. The:K! value for Cesium generated in these studies is higher than previously measured values. This could be due to the aggregate material used in the concrete. Literature values are generally for sorption on cement paste. Literature values for sorption of Iron and Cobalt on to cement were not found. However, both were above 1000 mllg in these tests.
4. Summary
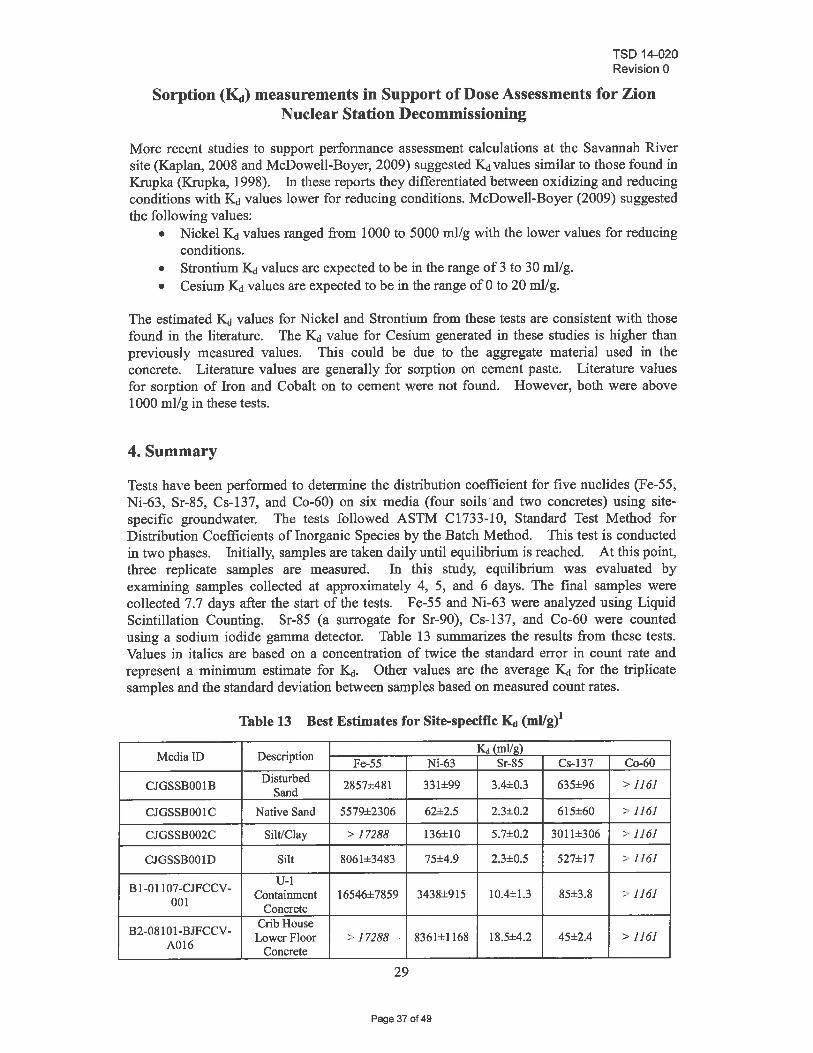
Tests have been performed to determine the distribution coefficient for five nuclides (Fe-55, Ni-63, Sr-85, Cs-137, and Co-60) on six media (four soils·and two concretes) using site-specific groundwater. The tests followed ASTM C1733-1O, Standard Test Method for Distribution Coefficients of Inorganic Species by the Batch Method. This test is conducted in two phases. Initially, samples are taken daily until equilibrium is reached. At this point, three replicate samples are measured. In this study, equilibrium was evaluated by examining samples collected at approximately 4, 5, and 6 days. The final samples were collected 7.7 days after the start of the tests. Fe-55 and Ni-63 were analyzed using Liquid Scintillation Counting. Sr-85 (a surrogate for Sr-90), Cs-137, and Co-60 were counted using a sodium iodide gamma detector. Table 13 summarizes the results from these tests. Values in italics are based on a concentration of twice the standard error in count rate and represent a minimum estimate for:K!. Other values are the average Kd for the triplicate samples and the standard deviation between samples based on measured count rates.
Table 13 Best Estimates for Site-specific Kct (mllg)l
Media ID Description Kd (mUg) Fe-55 Ni-63 Sr-85 Cs-137 Co-60
CJGSSBOOlB Disturbed 2857±481 331±99 3.4±0.3 635±96 > 1161 Sand
CJGSSBOOIC Native Sand 5579±2306 62±2.5 2.3±0.2 615±60 >1161
CJGSSB002C Silt/Clay > 17288 136±1O 5.7±0.2 3011±306 :> 1161
CJGSSBOOlD Silt 8061±3483 75±4.9 2.3±0.5 527±17 >1161
B 1-01107 -CJFCCV - U-I Containment 16546±7859 3438±915 1O.4±1.3 85±3.8 > 1161
001 Concrete
B2-08101-BJFCCV- Crib House Lower Floor >- 17288 8361±1168 18.5±4.2 45±2.4 > 1161 A016 Concrete
29
Page 37 of 49
TSD 14-020 Revision 0
Sorption (KcJ) measurements in Support of Dose Assessments for Zion Nuclear Station Decommissioning
IYalues in italics and red are based on a concentration of twice the standard error in count rate. These are a lower bound on the value of~.
References
AS1M-I0 American Society for Testing and Materials, AS1M C-1733-1O, 2010. "Standard Test Method for Distribution Coefficients of Inorganic Species by the Batch Method," AS1M International, 100 Barr Harbor Drive, PO Box C700, West Conshohocken, PA 19428-2959, United States. Published October 2010. DOl: 1 0.1520/C1733-1 O.
Bucari, C., Olteanu, M., Cristache, C., Pavelescu, M. , 2010, "Radionuc1ide Transport through Cement Matrices," REY. CHIM. (Bucharest) Y. 61, Nr. 5 ,2010, http://www.revistadechimie.ro/pdfIBUCUR %20CRlNA.pdfOIo205%20 1 O.pdf, Accessed November 28'\ 2012.
Fuhrmann, M. 1999. "Radionuclide Partition Coefficients for the BNL Site- For the Saturated and Unsaturated Zones", BNL Technical Report 82426-2009-IR, February 1999.
Kaplan, D.J. Roberts, K., Coates, J., Sigegried, M., and Serkiz, S., 2008. "Saltstone and concrete interactions with radionuc1ides sorption (:K!), desorption, and reduction capacity measurements," SRNS-STI-2008-00045, Savannah River National laboratory, Savannah River, SC.
Krupka, K M., Serne, J.R, 1998. "Concentr$ltions by CementlGround-Water Interactions in Support of Performance Assessment of Low-Level Radioactive Waste Disposal Facilities", NUREG/CR-6377, PNL-11408, Pacific Northwest Laboratory, Richland, W A.
McDowell-Boyer, L, Kaplan, D.J. 2009. "Distribution Coefficients (:K!s), ~ Distributions, and Cellulose Degradation Product Correction Factors for the Composite Analysis, SRNL-STI-2009-00150, rev. 1, Savannah River National laboratory, Savannah River, SC.
Sheppard, M. and Thibault, D.H., 1990. "Default Soil Solid/Liquid Partition Coefficients, ~s, For Four Major Soil types: A Compendium", Hea]th Physics, Yol. 59, No.4, pp. 471-481, Oct, 1990.
30
Page 38 of 49
TSD 14-020 Revision 0
Sorption CKrl) measurements in Support of Dose Assessments for Zion Nuclear Station Decommissioning
Appendix I: ~ data on the approach to equilibrium
Sample Identifiers Samples were identified with a one or two letter code. The samples labeled BG, DI, G, and UG were water samples prior to contact with the sorbing media. Samples J- M were samples of water in contact with one of the soils and Samples N and P were samples of water in contact with concrete. The codes and sample descriptions are: BG: Back Ground, 1 mL Deionized Water + 10 mL Ultima Gold AB scintillation fluid DI: 1 mL Subsample from (125 ilL Stock solution + 125 mL Deionized water) + 10 mL Ultima Gold AB scintillation fluid G: ImL Subsample from (125 ilL Stock solution + 125 mLFiltered ground water) + 10 mL Ultima Gold AB scintillation fluid UG: 1mL Subsample from (125 f.lL Stock solution + 125 mL Unfiltered ground water) + 10 mL Ultima Gold AB scintillation fluid J: 1 mL Subsample from (125 f.lL Stock solution + 125 mLFiltered ground water + 5 g CJGSSBOOIB - Disturbed Sand soil sample) + + 10 mL Ultima GoldAB scintillation fluid K: 1 mL Subsample from (125 f.lL Stock solution + 125 mL Filtered ground water + 5 g CJGSSBOOIC - Nath-e Sand soil sample) + 10 mL Ultima Gold AB scintillation fluid L: 1 mL Subsample from (125 f.lL Stock solution + 125 mL Filtered ground water + 5 g CJGSSB002C - Silt/Clay soil sample) + 10 mL Ultima GoidAB scintillation fluid M: 1 mL Subsample from (125 f.lL Stock solution + 125 mLFiltered ground water + 5 g CJGSSBOOID - Silt soil sample) + 10 mL Ultima Gold AB scintillation fluid N: 1 mL Subsample from (125 ilL Stock solution + 125 mL Filtered ground water + 5 g BI-Ol107-CJFCCV-OOl -U-l containment concrete sample) + 10 mL Ultima GoldAB scintillation fluid P: 1 mL Subsample from (125 f.lL Stock solution + 125 mL Filtered ground water + 5 g B2-08101-BJFCCV-A016 - Crib House concrete sample) + 10 mL Ultima Gold AB scintillation fluid
In the following tables I«J is calculated from the equation:
I«J = V(Cs-Cf) /(M.Cf)
Where: V = volume of filtered ground water used, mL, Cs = background corrected starting activity of isotope in filtered ground water, counts
per minute (cpm), Cf = background corrected final activity of isotope in filtered ground water in contact
with the soil sample or the concrete,counts per minute (cpm), M = dry mass of soil or concrete sample, g.
The Cs term is obtained from the groundwater sample (sample G), the final concentration, Cf is obtained from the samples labeled J - P. The volume of filtered groundwater and the dry mass are in the table. It should be noted that for samples with low count rates, using the above equation with the values in the table may lead to slightly different estimates of I«J due to round off error. For example for Fe-55 and sample L1 multiplying the volume (125 ml) by the difference in count rates between the groundwater and the groundwater in contact with the soil (1286 - 5) and dividing by the product of the dry mass (5.01 g) and final count rate (5
31
Page 39 of 49
TSD 14-020 Revision 0
Sorption (Kct) measurements in Support of Dose Assessments for Zion Nuclear Station Decommissioning
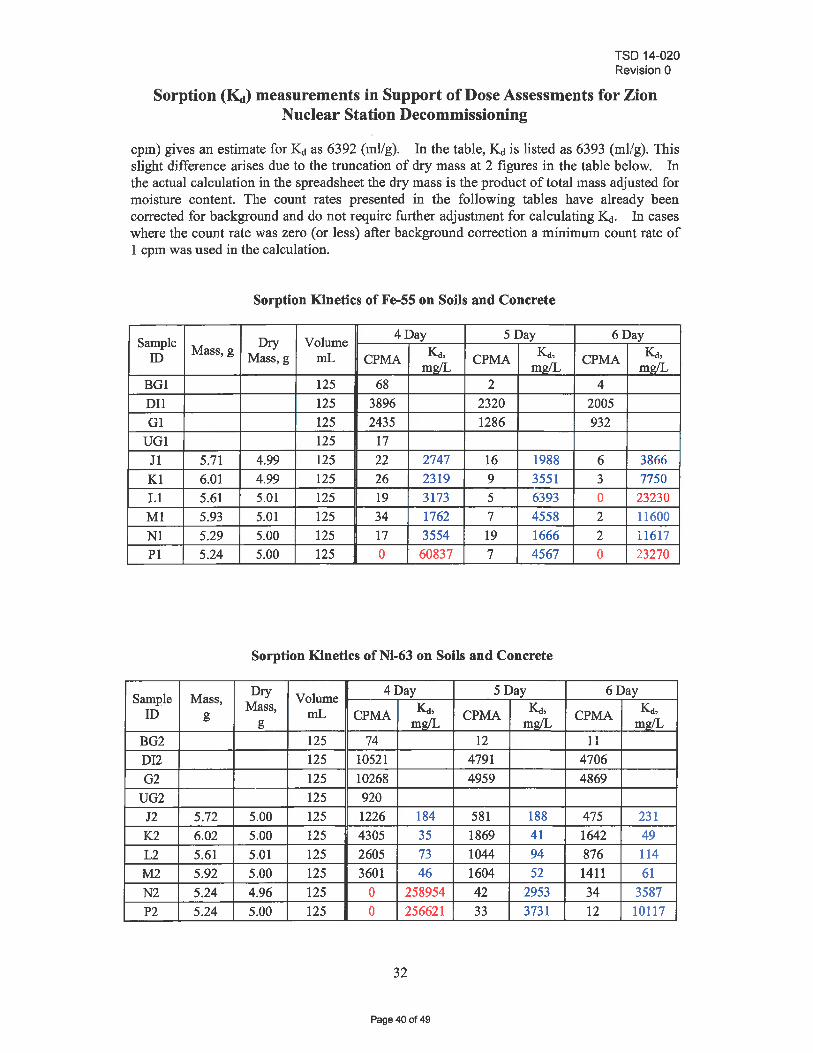
cpm) gives an estimate for:Ki as 6392 (mllg). In the table, :Ki is listed as 6393 (ml!g). This slight difference arises due to the truncation of dry mass at 2 figures in the table below. In the actual calculation in the spreadsheet the dry mass is the product of total mass adjusted for moisture content. The count rates presented in the following tables have already been corrected for background and do not require further adjustment for calculating:Ki. In cases where the count rate was zero (or less) after background correction a minimum count rate of 1 cpm was used in the calculation.
Sorption Kinetics of Fe-55 on Soils and Concrete
Sample Dry Volume 4 Day 5 Day 6 Day Mass, g Kd, Kd, ~, ID Mass, g mL CP!tAA
m~_ CPMA mgIL CPMA mg/L
BG1 125 68 2 4 DII 125 3896 2320 2005 G1 125 2435 1286 932
UG1 125 17 11 5.71 4.99 125 22 2747 16 1988 6 3866 Kl 6.01 4.99 125 26 2319 9 3551 3 7750 Ll 5.61 5.01 125 19 3173 5 6393 0 23230 Ml 5.93 5.01 125 34 1762 7 4558 2 11600 Nl 5.29 5.00 125 17 3554 19 1666 2 11617 PI 5.24 5.00 125 0 60837 7 4567 0 23270
Sorption Kinetics of Ni-63 on Soils and Concrete
Sample Mass, Dry Volume 4 Day 5 Day 6 Day ID g Mass, mL CPMA ~, CPMA ~, CPMA ~,
g mg/l mg/l mg/L BG2 125 74 12 11 DI2 125 10521 4791 4706 G2 125 10268 4959 4869
UG2 125 920 J2 5.72 5.00 125 1226 184 581 188 475 231 K2 6.02 5.00 125 4305 35 1869 41 1642 49 L2 5.61 5.01 125 2605 73 1044 94 876 114 M2 5.92 5.00 125 3601 46 1604 52 1411 61 N2 5.24 4.96 125 0 258954 42 2953 34 3587 P2 5.24 5.00 125 0 256621 33 3731 12 10117
32
Page 40 of 49
TSD 14-020 Revision 0
Sorption (~) measurements in Support of Dose Assessments for Zion Nuclear Station Decommissioning
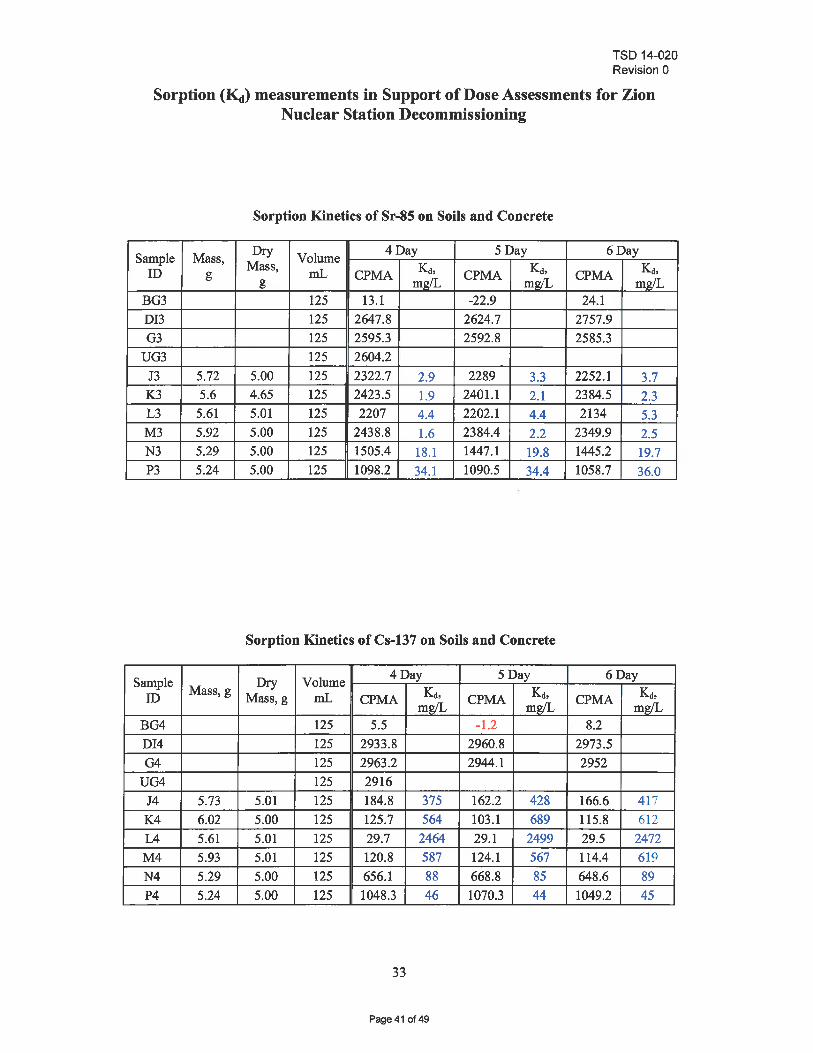
Sorption Kinetics of Sr-85 on Soils and Concrete
Sample Mass, Dry Volume 4 Day 5 Day 6 Day
ID g Mass, mL CPMA K.!, CPMA Kd, CPMA Kd, g mgIL mglL mg/L
BG3 125 13.1 -22.9 24.1 DB 125 2647.8 2624.7 2757.9 G3 125 2595.3 2592.8 2585.3
UG3 125 2604.2 J3 5.72 5.00 125 2322.7 2.9 2289 3.3 2252.1 3.7 K3 5.6 4.65 125 2423.5 1.9 2401.1 2.1 2384.5 2.3 L3 5.61 5.01 125 2207 4.4 2202.1 4.4 2134 5.3 M3 5.92 5.00 125 2438.8 1.6 2384.4 2.2 2349.9 2.5 N3 5.29 5.00 125 1505.4 18.1 1447.1 19.8 1445.2 19.7 P3 5.24 5.00 125 1098.2 34.1 1090.5 34.4 1058.7 36.0
Sorption Kinetics ofCs-137 on Soils and Concrete
Sample Dry Volume 4 Day 5 Day 6 Day
ID Mass, g Mass, g mL CPMA K.!, CPMA Kd, CPMA Kd,
mg/L mg/L mg/L BG4 125 5.5 -1.2 8.2 DI4 125 2933.8 2960.8 2973.5 G4 125 2963.2 2944.1 2952
UG4 125 2916 J4 5.73 5.01 125 184.8 375 162.2 428 166.6 4 17 K4 6.02 5.00 125 125.7 564 103.1 689 115.8 612 L4 5.61 5.01 125 29.7 2464 29.1 2499 29.5 2472 M4 5.93 5.01 125 120.8 587 124.1 567 114.4 619 N4 5.29 5.00 125 656.1 88 668.8 85 648.6 89 P4 5.24 5.00 125 1048.3 46 1070.3 44 1049.2 45
33
Page 41 of49
TSD 14-020 Revision 0
Sorption (Kci) measurements in Support of Dose Assessments for Zion Nuclear Station Decommissioning
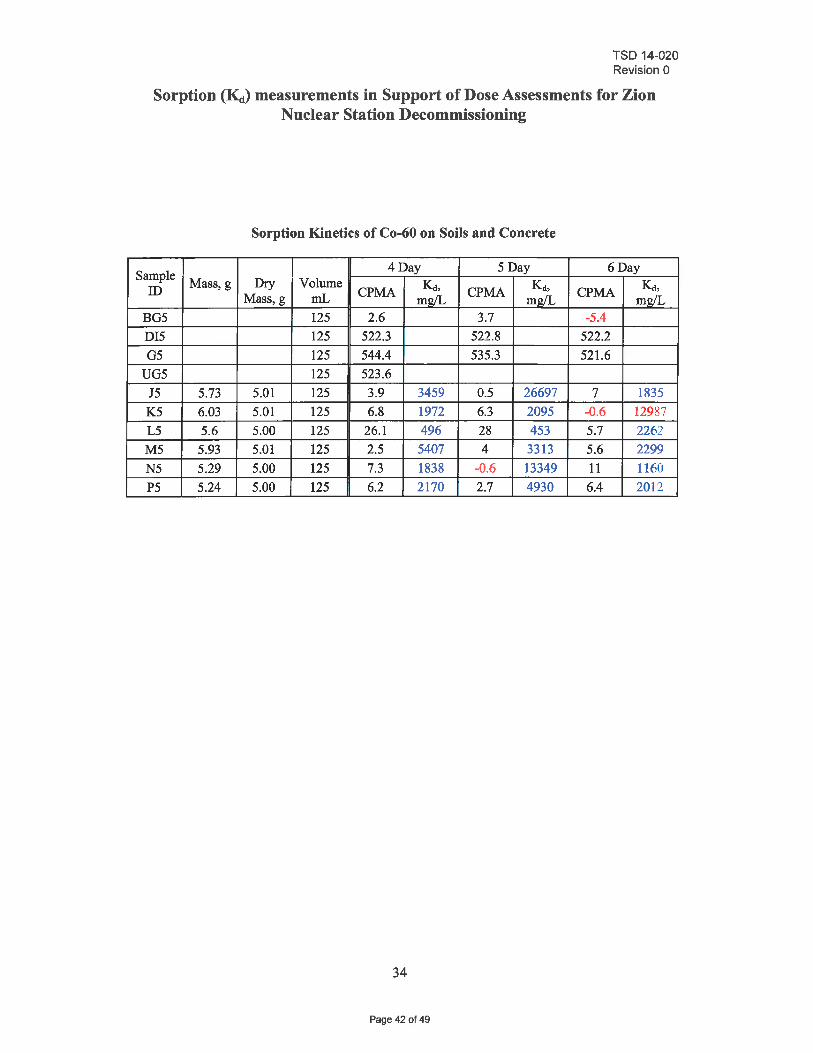
Sorption Kinetics of Co-60 on Soils and Concrete
Sample 4 Day 5 Day 6 Day
Mass, g Dry Volume K.!, Kd, K.!, ID Mass, g mL CPMA mg/L CPMA mg/L CPMA mg/L BG5 125 2.6 3.7 -5.4 DIS 125 522.3 522.8 522.2 G5 125 544.4 535.3 521.6
UG5 125 523.6 J5 5.73 5.01 125 3.9 3459 0.5 26697 7 1835 K5 6.03 5.01 125 6.8 1972 6.3 2095 -0.6 12987 L5 5.6 5.00 125 26.1 496 28 453 5.7 2262 M5 5.93 5.01 125 2.5 5407 4 3313 5.6 2299 N5 5.29 5.00 125 7.3 1838 -0.6 13349 11 1160 P5 5.24 5.00 125 6.2 2170 2.7 4930 6.4 2012
34
Page 42 of 49
TSD 14-020 Revision 0
Sorption (KcJ) measurements in Support of Dose Assessments for Zion Nuclear Station Decommissioning
Appendix II: KcJ data at equilibrium
Sample Identifiers Samples were identified with a one or two letter code. The samples labeled BG, DI, G, and UG were water samples prior to contact with the sorbing media. Samples J- M were samples of water in contact with one of the soils and Samples Nand P were samples of water in contact with concrete. The codes are:
BG: Background, 1 mL Deionized Water + 10 mL Ultima Gold AB scintillation fluid DI: ImL Subsample from (25 ~L Stock solution + 25 mLDeionized water) + 10 mL Ultima Gold AB scintillation fluid G: ImL Subsample from (25 ~L Stock solution + 25 mLFiltered ground water) + 10 mL Ultima Gold AB scintillation fluid UG: ImL Subsample from (25 ilL Stock solution + 25 mL Unfiltered ground water) + 10 mL Ultima Gold AB scintillation fluid J: 1 mL Subsample from (25 ilL Stock solution + 25 mL Filtered ground water + 1 g
CJGSSBOOIB - Disturbed Sand soil sample) + 10 mL Ultima Gold AB scintillation fluid
K: 1 mL Subsample from (25 ilL Stock solution + 25 mL Filtered ground water + 1 g CJGSSBOO 1 C - Native Sand soil sample) + 10 mL Ultima Gold AB scintillation fluid
L: 1 mL Subsample from (25 ilL Stock solution + 25 mL Filtered ground water + 1 g CJGSSB002C - Silt/Clay soil sample) + 10 mL Ultima Gold AB scintillation fluid
M: 1 mL Subsample from (25 ilL Stock solution + 25 mL Filtered ground water + 1 g CJGSSBOOID - Silt soil sample) + 10 mL Ultima Gold AB scintillation fluid
N: 1 mL Subsample from (25 ilL Stock solution + 25 mL Filtered ground water + 1 g Bl -Ol107-CJFCCV-OOI-U-l Containment concrete sample) + 10 mL Ultima GoldAB scintillation fluid
P: 1 mL Subsample from (125 ilL Stock solution + 125 mL Filtered ground water + 1 g B2-08101-BJFCCV-A016 - Crib House concrete sample) + 10 mL Ultima Gold AB scintillation fluid
In the following tables Kd is calculated from the equation:
I«I = V(Cs-Cf) /(M .. Cf)
Where: V = volume of filtered ground water used, mL, Cs = background corrected starting activity of isotope in filtered ground water, counts
per minute (cpm), Cf = background corrected final activity of isotope in filtered ground water in contact
with the soil sample or the concrete, counts per minute (cpm), M = dry mass of soil or concrete sample, g.
The Cs term is obtained from the groundwater sample (sample G), the final concentration, Cf is obtained from the samples labeled J - P. The volume of filtered groundwater and the dry mass are in the table. It should be noted that for samples with low count rates, using the
35
Page 43 of49
TSD 14-020 Revision 0
Sorption (~) measurements in Support of Dose Assessments for Zion Nuclear Station Decommissioning
above equation with the values in the table may lead to slightly different estimates of KcJ due to round off error. For example for Fe-55 and sample III multiplying the volume (25 ml) by the difference in count rates between the groundwater and the groundwater in contact with the soil (746 - 8) and dividing by the product of the dry mass (0.99 g) and final count rate (8 cpm) gives an estimate for KcJ as 2330 (mllg). In the table, KcJ is listed as 2335 (mllg). This slight difference arises due to the truncation of dry mass at 2 figures in the table. In the actual calculation in the spreadsheet the dry mass is the product of total mass adjusted for moisture content and comes to 0.98762 g. Using this value, the KcJ estimate is 2335 mllg. The count rates presented in the following tables have already been corrected for background and do not require further adjustment for calculating KcJ. In cases where the count rate was zero (or less) after background correction a minimum count rate of I cpm was used in the calculation.
36
Page 44 of 49
TSD 14-020 Revision 0
Sorption (KcJ) measurements in Support of Dose Assessments for Zion Nuclear Station Decommissioning
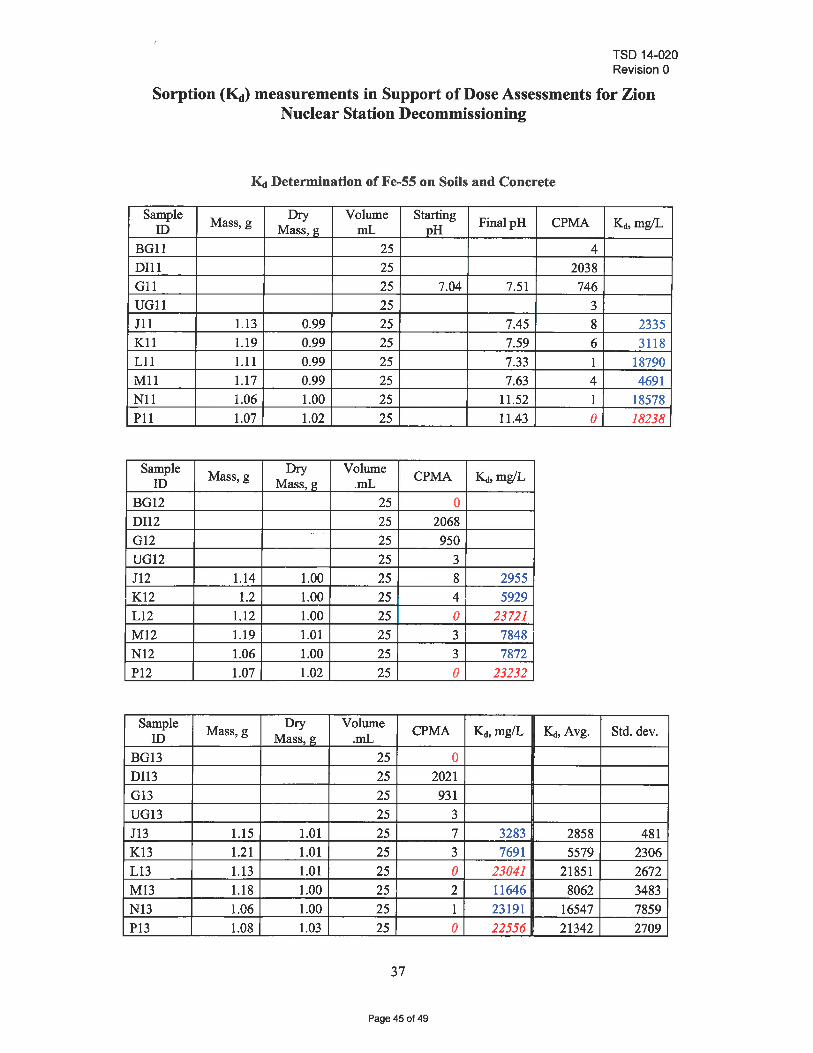
~ Determination of Fe-55 on Soils and Concrete
Sample Mass, g Dry Volume Starting Final pH CPMA Kd,mg/L ID Mass, g mL pH BGll 25 4 DIll 25 2038 GIl 25 7.04 7.51 746 UGll 25 3 111 1.13 0.99 25 7.45 8 2335 Kll 1.19 0.99 25 7.59 6 3118 LIl 1.11 0.99 25 7.33 1 18790 MIl 1.17 0.99 25 7.63 4 4691 NIl 1.06 1.00 25 11.52 1 18578 Pll 1.07 1.02 25 11.43 0 18238
Sample Mass, g Dry Volume CPMA ~,mg/L ID Mass, g .mL BG12 25 0 DIl2 25 2068
.. GI2 25 950 UG12 25 3 112 1.14 1.00 25 8 2955 K12 1.2 1.00 25 4 5929 LI2 1.12 1.00 25 0 23721 M12 1.19 1.01 25 3 7848 N12 1.06 1.00 25 3 7872 P12 1.07 1.02 25 0 23232
Sample Mass, g Dry Volume CPMA ~,mg/L ~,Avg. Std. dev. ID Mass, g .mL BG13 25 0 DI13 25 2021 GI3 25 931 UG13 25 3 113 1.15 1.01 25 7 3283 2858 481 K13 1.21 1.01 25 3 7691 5579 2306 L13 1.13 1.01 25 0 23041 21851 2672 M13 1.18 1.00 25 2 11646 8062 3483 N13 1.06 1.00 25 1 23191 16547 7859 P13 1.08 1.03 25 0 22556 21342 2709
37
Page 45 of 49
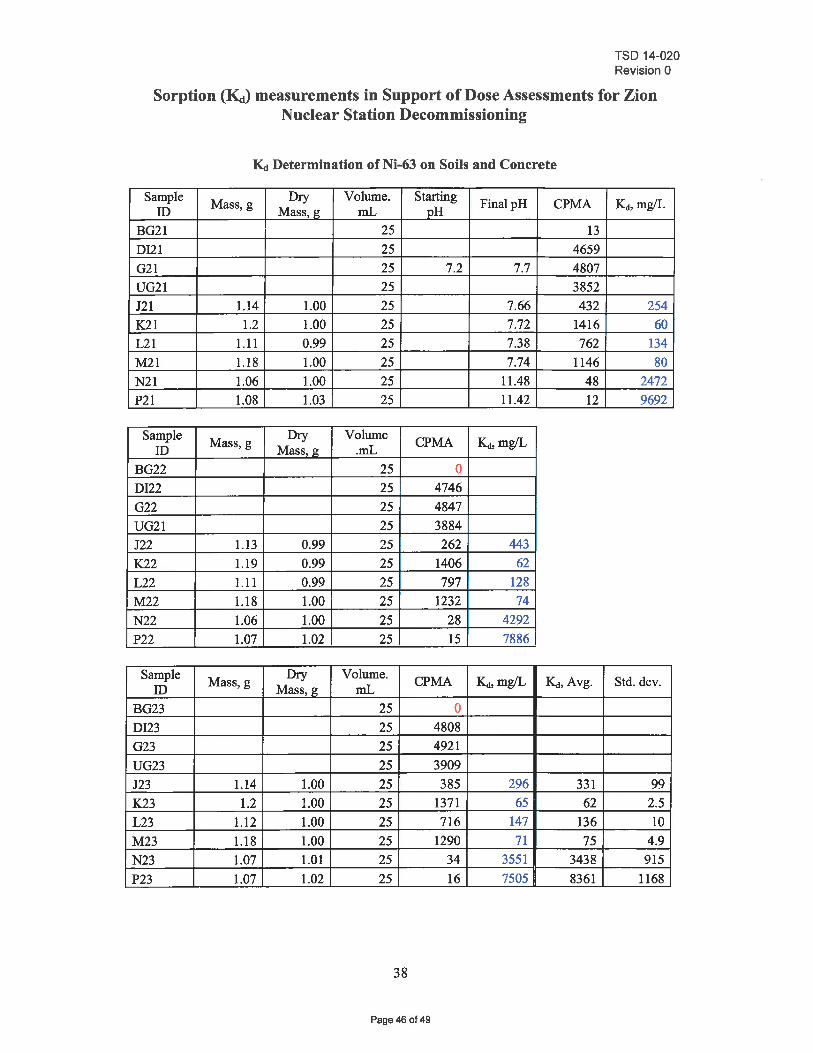
TSD 14-020 Revision 0
Sorption (~) measurements in Support of Dose Assessments for Zion Nuclear Station Decommissioning
~ Determination of Ni-63 on Soils and Concrete
Sample Mass, g Dry Volume. Starting Final pH CPMA Kd, mg/L ID Mass, g mL pH BG21 25 13 DI21 25 4659 G21 25 7.2 7.7 4807 VG21 25 3852 J21 1.14 1.00 25 7.66 432 254 K21 1.2 1.00 25 7.72 1416 60 L21 1.11 0.99 25 7.38 762 134 M21 1.18 1.00 25 7.74 1146 80 N21 1.06 1.00 25 11.48 48 2472 P21 1.08 1.03 25 11.42 12 9692
Sample Mass, g Dry Volume CPMA K..!, mglL ID Mass, g .mL BG22 25 0 DI22 25 4746 G22 25 4847 VG21 25 3884 122 1.13 0.99 25 262 443 K22 1.19 0.99 25 1406 62 L22 1.11 0.99 25 797 128 M22 1.18 1.00 25 1232 74 N22 1.06 1.00 25 28 4292 P22 1.07 1.02 25 15 7886 1
Sample Mass, g Dry Volume. CPMA K..!, mgIL K..!, Avg. Std. dev. ID Mass, g mL BG23 25 0 DI23 25 4808 G23 25 4921 VG23 25 3909 123 1.14 1.00 25 385 296 331 99 K23 1.2 1.00 25 1371 65 62 2.5 L23 1.12 1.00 25 716 147 136 10 M23 1.18 1.00 25 1290 71 75 4.9 N23 1.07 1.01 25 34 3551 3438 915 P23 1.07 1.02 25 16 7505 8361 1168
38
Page 46 of 49
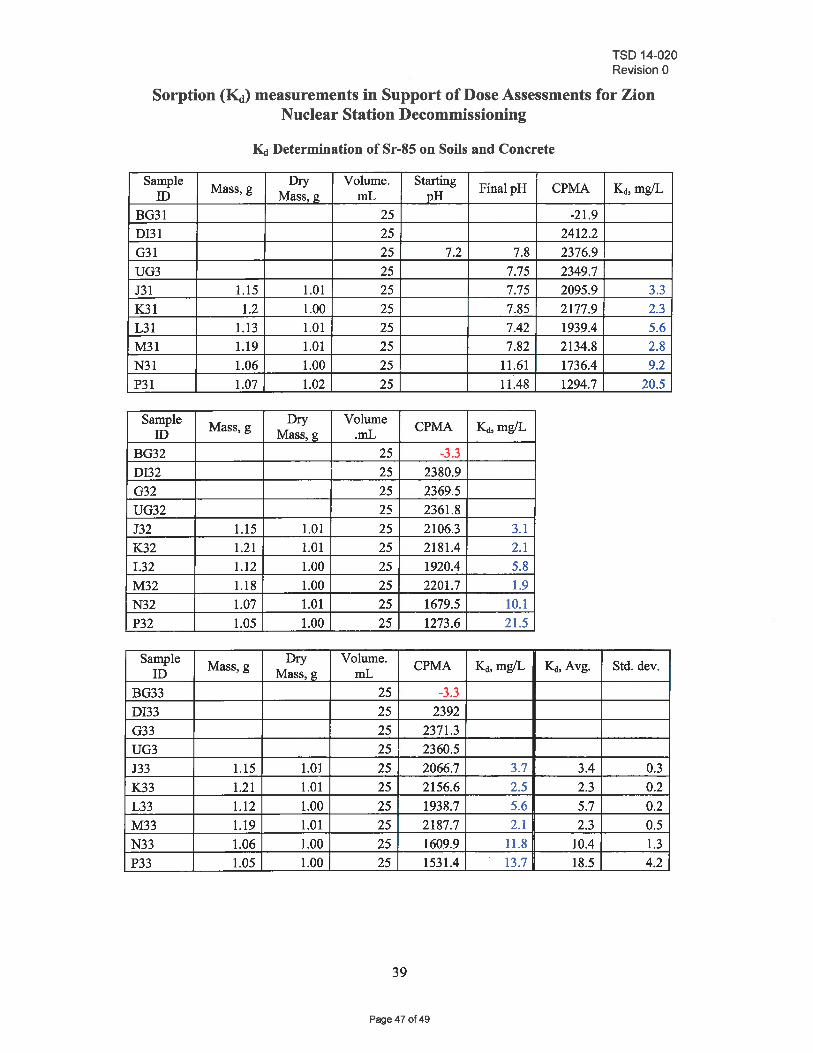
TSD 14-020 Revision 0
Sorption (KcJ) measurements in Support of Dose Assessments for Zion Nuclear Station Decommissioning
Kc! Determination of Sr-85 on Soils and Concrete
Sample Mass, g Dry Volume. Starting Final pH CPMA Kd, mglL ill Mass, g mL pH BG31 25 -21.9 DI31 25 2412.2 G31 25 7.2 7.8 2376.9 UG3 25 7.75 2349.7 131 1.15 1.01 25 7.75 2095.9 3.3 K31 1.2 1.00 25 7.85 2177.9 2.3 L31 1.13 1.01 25 7.42 1939.4 5.6 M31 1.19 1.01 25 7.82 2134.8 2.8 N31 1.06 1.00 25 11.61 1736.4 9.2 P31 1.07 1.02 25 11.48 1294.7 20.5
Sample Mass, g Dry Volume CPMA ~,mglL ill Mass, g .mL BG32 25 -3.3 DI32 25 2380.9 G32 25 2369.5 UG32 25 2361.8 132 1.15 1.01 25 2106.3 3.1 K32 1.21 1.01 25 2181.4 2.1 L32 1.12 1.00 25 1920.4 5.8 M32 1.18 1.00 25 2201.7 1.9 N32 1.07 1.01 25 1679.5 10.1 P32 1.05 1.00 25 1273.6 21.5
Sample Mass, g Dry Volume. CPMA Kd,mg/L ~,Avg. Std. dey. ill Mass, g mL
BG33 25 -3.3 DI33 25 2392 G33 25 2371.3 UG3 25 2360.5 133 1.15 1.01 25 2066.7 3.7 3.4 0.3 K33 1.21 1.01 25 2156.6 2.5 2.3 0.2 L33 1.12 1.00 25 1938.7 5.6 5.7 0.2 M33 1.19 1.01 25 2187.7 2.1 2.3 0.5 N33 1.06 1.00 25 1609.9 11.8 10.4 1.3 P33 1.05 1.00 25 1531.4 13.7 18.5 4.2
39
Page 47 of 49
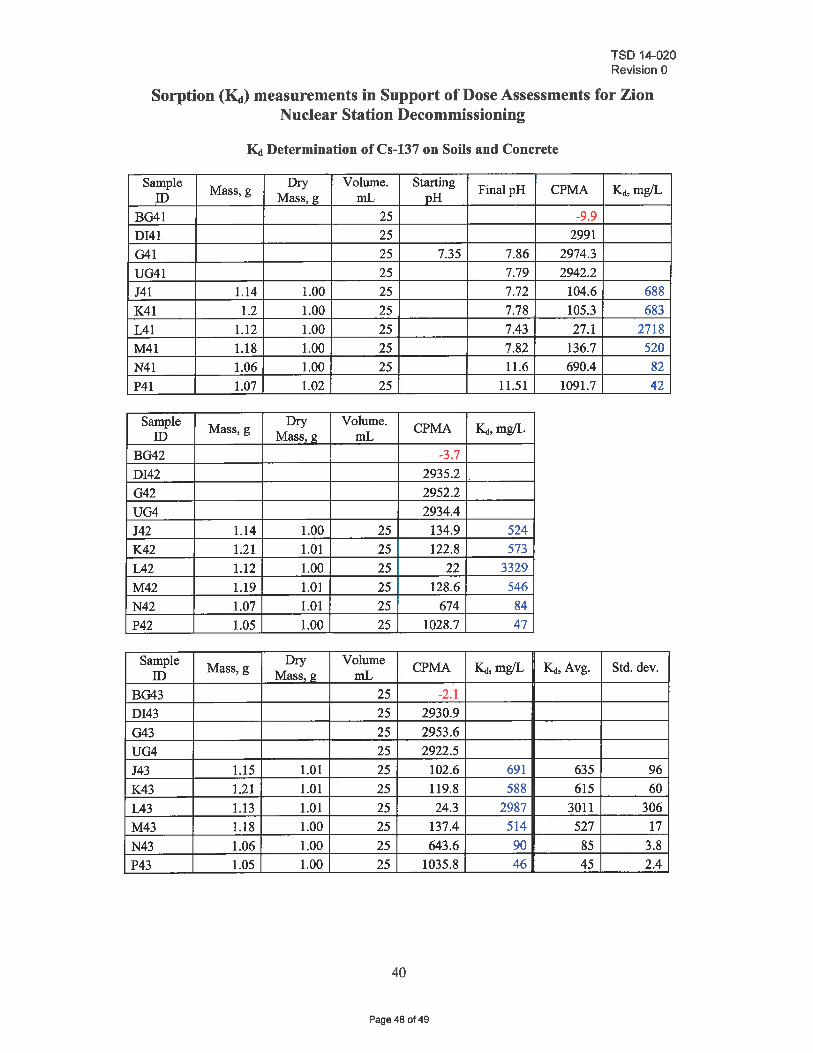
TSD 14-020 Revision 0
Sorption (~) measurements in Support of Dose Assessments for Zion Nuclear Station Decommissioning
Kc! Determination ofCs-137 on Soils and Concrete
Sample Mass, g Dry Volume. Starting Final pH CPMA Kd,mg/L ill Mass, g mL pH BG41 25 -9.9 DI41 25 2991 G41 25 7.35 7.86 2974.3 UG41 25 7.79 2942.2 J41 1.14 1.00 25 7.72 104.6 688 K41 1.2 1.00 25 7.78 105.3 683 L41 1.12 1.00 25 7.43 27.1 2718 M41 1.18 1.00 25 7.82 136.7 520 N41 1.06 1.00 25 11.6 690.4 82 P41 1.07 1.02 25 11.51 1091.7 42
Sample Mass, g Dry Volume. CPMA ~,mg/L ID Mass, g mL BG42 -3.7 DI42 2935.2 G42 2952.2 UG4 2934.4 J42 1.14 1.00 25 134.9 524 K42 1.21 1.01 25 122.8 573 L42 1.12 1.00 25 22 3329 M42 1.19 1.01 25 128.6 546 N42 1.07 1.01 25 674 84 P42 1.05 1.00 25 1028.7 47
Sample Mass, g Dry Volume CPMA ~,mg/L ~,Avg. Std. dey. In Mass, g mL BG43 25 -2.1 DI43 25 2930.9 G43 25 2953.6 UG4 25 2922.5 J43 1.15 1.01 25 102.6 691 635 96 K43 1.21 1.01 25 119.8 588 615 60 L43 1.13 1.01 25 24.3 2987 3011 306 M43 1.18 1.00 25 137.4 514 527 17 N43 1.06 1.00 25 643.6 90 85 3.8 P43 1.05 1.00 25 1035.8 46 45 2.4
40
Page 48 of 49
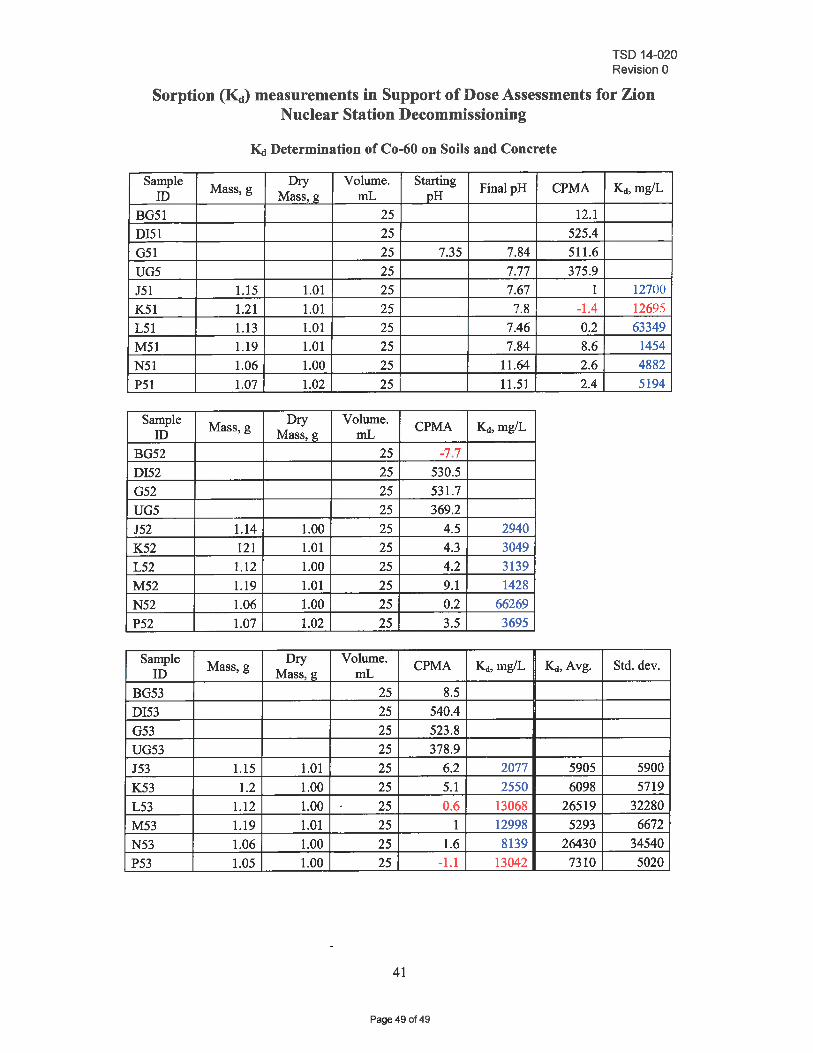
TSD 14-020 Revision 0
Sorption (~) measurements in Support of Dose Assessments for Zion Nuclear Station Decommissioning
~ Determination of Co-60 on Soils and Concrete
Sample Mass, g Dry Volume. Starting Final pH ePMA Kd,mg/L ID Mass, g mL pH BG5l 25 12.1 DI51 25 525.4 G51 25 7.35 7.84 511.6 UG5 25 7.77 375.9 J5l 1.15 1.01 25 7.67 1 12700 K51 1.21 1.01 25 7.8 -1.4 12695 L51 1.13 1.01 25 7.46 0.2 63349 M51 1.19 1.01 25 7.84 8.6 1454 N51 1.06 1.00 25 11.64 2.6 4882 P51 1.07 1.02 25 11.51 2.4 5194
Sample Mass, g Dry Volume. ePMA K.!, mgIL ID Mass, g mL BG52 25 -7 .7 DI52 25 530.5 G52 25 531.7 UG5 25 369.2 J52 1.14 1.00 25 4.5 2940 K52 121 1.01 25 4.3 3049 L52 1.12 1.00 25 4.2 3139 M52 1.19 1.01 25 9.1 1428 N52 1.06 1.00 25 0.2 66269 P52 1.07 1.02 25 3.5 3695
Sample Mass, g Dry Volume. ePMA Kd,mg/L ~,Avg. Std. dey. ID Mass g mL BG53 25 8.5 DI53 25 540.4 G53 25 523.8 UG53 25 378.9 J53 1.15 1.01 25 6.2 2077 5905 5900 K53 1.2 1.00 25 5.1 2550 6098 5719 L53 1.12 1.00 25 0.6 13068 26519 32280 M53 1.19 1.01 25 1 12998 5293 6672 N53 1.06 1.00 25 1.6 8139 26430 34540 P53 1.05 1.00 25 -1.1 13042 7310 5020
41
Page 49 of 49