Embed Size (px)
Citation preview
TSCA Work Plan Chemical Risk Assessment
N-Methylpyrrolidone: Paint Stripper Use
CASRN: 872-50-4
March 2015
N O
United States Environmental Protection Agency
EPA Document# 740-R1-5002 March 2015
Office of Chemical Safety and Pollution Prevention

TABLE OF CONTENTS TABLE OF CONTENTS ............................................................................................................. 2
AUTHORS / CONTRIBUTORS / ACKNOWLEDGEMENTS / REVIEWERS ...................................... 9
ABBREVIATIONS .................................................................................................................. 11
EXECUTIVE SUMMARY ......................................................................................................... 14
1 BACKGROUND AND SCOPE ....................................................................................... 20
1.1 INTRODUCTION ............................................................................................................................................. 20 1.2 USES AND PRODUCTION VOLUMES ............................................................................................................... 21
1.2.1 Assessment and Regulatory History ................................................................................................ 21 1.2.2 Scope of the Assessment ................................................................................................................. 23
1.3 PROBLEM FORMULATION ............................................................................................................................. 23 1.3.1 Physical and Chemical Properties .................................................................................................... 24 1.3.2 Environmental Fate ......................................................................................................................... 25 1.3.3 Conceptual Model ........................................................................................................................... 26
1.3.3.1 Exposure Pathways .......................................................................................................................... 26 1.3.3.2 Health Effects and Human Receptors .............................................................................................. 27
1.3.4 Analysis Plan ................................................................................................................................... 28
2 EXPOSURE ASSESSMENT ........................................................................................... 30
2.1 OCCUPATIONAL EXPOSURES ......................................................................................................................... 30 2.1.1 Approach and Methodology ........................................................................................................... 30
2.1.1.1 Identification of Relevant Industries ............................................................................................... 31 2.1.1.2 Approach for Determining Occupational Exposure Data and Input Parameters for PBPK Modeling
......................................................................................................................................................... 31 2.1.1.3 Estimates of Occupational Exposure Parameters and Number of Exposed Workers ...................... 32
2.1.2 Use of Occupational Exposure Estimates in PBPK Modeling ........................................................... 35 2.2 CONSUMER EXPOSURES ................................................................................................................................ 37
2.2.1 Approach and Methodology ........................................................................................................... 37 2.2.1.1 Consumer Dermal Exposure Assessment ........................................................................................ 38 2.2.1.2 Consumer Users and Residential Non-Users Inhalation Exposure Assessment............................... 38
2.2.2 Model Outputs and Exposure Calculations ..................................................................................... 46 2.2.3 Use of Consumer Exposure Estimates in PBPK Modeling ................................................................ 46
3 HAZARD IDENTIFICATION AND DOSE-RESPONSE ....................................................... 48
3.1 APPROACH AND METHODOLOGY .................................................................................................................. 48 3.1.1 Selection of Peer-Reviewed Assessments for Hazard Identification and Dose-Response Analysis .. 48 3.1.2 Hazard Summary and Hazard Identification ................................................................................... 49 3.1.3 Selection of Developmental Toxicity Studies and Endpoints ........................................................... 60
3.1.3.1 Decreased Fetal and Postnatal Body Weights ................................................................................. 63 3.1.3.2 Resorptions and Fetal Mortality ...................................................................................................... 65 3.1.3.3 Other Fetal Effects ........................................................................................................................... 66 3.1.3.4 Conclusions and Selection of Key Endpoints ................................................................................... 67
3.2 DOSE-RESPONSE ASSESSMENT AND STUDY SELECTION ................................................................................ 68 3.2.1 Identification of Studies for BMD Modeling .................................................................................... 68 3.2.2 Derivation of Internal Doses ............................................................................................................ 69 3.2.3 PODs for Acute Exposure ................................................................................................................. 73 3.2.4 PODs for Chronic Exposure .............................................................................................................. 76
Page 2 of 281

3.2.5 Considerations for Sensitive Subpopulations and Lifestages .......................................................... 78
4 HUMAN HEALTH RISK CHARACTERIZATION ............................................................... 80
4.1 RISK ESTIMATION APPROACH FOR ACUTE AND CHRONIC EXPOSURES ........................................................ 80 4.1.1 Risk Estimates for Acute Occupational Exposure to NMP ............................................................... 82 4.1.2 Risk Estimates for Acute Consumer Exposure to NMP .................................................................... 87 4.1.1 Risk Estimates for Chronic Occupational Exposures to NMP........................................................... 90
4.2 HUMAN HEALTH RISK CHARACTERIZATION SUMMARY ................................................................................ 94 4.3 KEY SOURCES OF UNCERTAINTY AND DATA LIMITATIONS ........................................................................... 95
4.3.1 Key Uncertainties in the Occupational Exposure Assessment ......................................................... 95 4.3.2 Key Uncertainties in the Consumer Exposure Assessment .............................................................. 96 4.3.3 Key Uncertainties in the Hazard and Dose-Response Assessments ................................................ 99 4.3.4 Key Uncertainties in the Risk Assessment ..................................................................................... 101
4.4 RISK ASSESSMENT CONCLUSIONS ............................................................................................................... 103
REFERENCES ...................................................................................................................... 106
APPENDICES ...................................................................................................................... 120
Appendix A ENVIRONMENTAL EFFECTS SUMMARY ........................................................ 121
A-1 ACUTE TOXICITY TO AQUATIC ORGANISMS ............................................................................................................ 121 A-2 CHRONIC TOXICITY TO AQUATIC ORGANISMS ......................................................................................................... 123 A-3 TOXICITY TO SEDIMENT AND SOIL ORGANISMS ....................................................................................................... 123 A-4 TOXICITY TO WILDLIFE ....................................................................................................................................... 123 A-5 SUMMARY OF ENVIRONMENTAL HAZARD ASSESSMENT............................................................................................ 124
Appendix B CHEMICAL REPORTING DATA ....................................................................... 125
B-1 CONSUMER USES ............................................................................................................................................. 127 B-2 PAINT STRIPPING APPLICATIONS .......................................................................................................................... 128
Appendix C STATE NMP REGULATIONS .......................................................................... 129
Appendix D OCCUPATIONAL EXPOSURE ASSESSMENT SUPPORT INFORMATION ............. 130
D-1 SUMMARY OF DERMAL EXPOSURE PARAMETERS, INHALATION CONCENTRATIONS AND EXPOSURE REDUCTION FACTORS ...... 130 D-2 DATA NEEDS AND DATA COLLECTION ................................................................................................................... 130 D-3 INDUSTRIES THAT EMPLOY PAINT STRIPPING ACTIVITIES ........................................................................................... 133 D-4 OCCUPATIONAL PAINT STRIPPING PROCESSES AND ASSOCIATED WORKER ACTIVITIES .................................................... 134 D-5 FACILITY AND POPULATION DATA AND INFORMATION ............................................................................................. 139 D-6 DERMAL EXPOSURE PARAMETERS........................................................................................................................ 144 D-7 OCCUPATIONAL INHALATION EXPOSURE LITERATURE DATA ...................................................................................... 146
Appendix E CONSUMER EXPOSURE ASSESSMENT .......................................................... 153
E-1 ESTIMATION OF EMISSION PROFILES FOR PAINT REMOVERS/STRIPPERS ...................................................................... 153 E-2 SENSITIVITY ANALYSIS FOR INHALATION SCENARIOS ................................................................................................ 165 E-3 INHALATION EXPOSURE SCENARIO INPUTS ............................................................................................................. 166 E-4 INHALATION MODEL OUTPUTS AND EXPOSURE CALCULATIONS ................................................................................. 177 E-5 MCCEM INHALATION MODELING CASE SUMMARIES.............................................................................................. 185
E-5-1 NMP Scenario 1. Coffee Table, Brush-On, Workshop, User in ROH during wait time, 0.45 ACH, 0.25 Weight Fraction............................................................................................................................. 185
E-5-2 NMP Scenario 2. Coffee Table, Brush-On, Workshop, User in Workshop during wait time, 0.45 ACH, 0.5 Weight Fraction .............................................................................................................. 188
E-5-3 NMP Scnario 3. Chest, Brush-On, Workshop, User in ROH during wait time, 0.18 ACH, 0.5 Weight Fraction ......................................................................................................................................... 191
Page 3 of 281

E-5-4 NMP Scenario 4. Bathtub, Brush-On, Bathroom + Source Cloud, User in ROH during wait time, 0.18 ACH, 0.5 Weight Fraction ...................................................................................................... 194
E-5-5 NMP Scenario 5. Bathtub, Brush-On, Bathroom + Source Cloud, User in ROH during wait time, 0.18 ACH, 0.5 Weight Fraction ...................................................................................................... 197
E-5-6 NMP Scenario 6a. Coffee Table, Spray-On, Workshop, User in workshop during wait time, 0.45 ACH, 0.53 Weight Fraction ............................................................................................................ 200
E-5-7 New Scenario 6b. Coffee Table, Spray-On, Workshop, User in workshop during wait time, 0.45 ACH, 0.53 Weight Fraction ............................................................................................................ 203
E-5-8 NMP Scenario 7a Chest, Spray-On, Workshop, User in ROH during wait time, 0.18 ACH, 0.53 Weight Fraction............................................................................................................................. 206
E-5-9 NMP Scenario 7b Chest, Spray-On, Workshop, User in ROH during wait time, 0.18 ACH, 0.53 Weight Fraction............................................................................................................................. 209
Appendix F TOXICOLOGY STUDIES ................................................................................. 212
F-1 LITERATURE COLLECTION ................................................................................................................................... 212 F-2 STUDY QUALITY AND SELECTION CONSIDERATIONS ................................................................................................. 212 F-3 DEVELOPMENTAL TOXICITY STUDIES CONSIDERED FOR USE IN RISK ASSESSMENT .......................................................... 214
F-3-1 Oral Toxicity Studies ...................................................................................................................... 214 F-3-2 Inhalation Toxicity Studies ............................................................................................................ 218 F-3-3 Dermal Toxicity Studies ................................................................................................................. 221
F-4 HUMAN CASE REPORT ...................................................................................................................................... 221
Appendix G HUMAN EXPOSURE STUDIES ....................................................................... 223
G-1 REVIEW OF AKKESON ET AL., 2004 ...................................................................................................................... 224 G-2 REVIEW OF AKKESON AND JONSSON, 2000 ........................................................................................................... 225 G-3 REVIEW OF AKESSON AND PAULSSON, 1997 ......................................................................................................... 226 G-4 REVIEW OF BADER ET AL., 2005 ......................................................................................................................... 227 G-5 REVIEW OF BADER AND VAN THRIEL, 2006 ........................................................................................................... 228 G-6 REVIEW OF BADER ET AL., 2007 ......................................................................................................................... 229 G-7 REVIEW OF BADER ET AL., 2008 ......................................................................................................................... 230 G-8 REVIEW OF XIAOFEI ET AL., 2000 ........................................................................................................................ 231
Appendix H BENCHMARK DOSE ANALYSIS ...................................................................... 232
H-1 BENCHMARK DOSE MODELING OF FETAL/PUP BODY WEIGHT CHANGES FOR CHRONIC EXPOSURES ................................. 232 H-1-1 Results for Saillenfait et al., 2003 .................................................................................................. 234 H-1-2 Results for Saillenfait et al., 2002 .................................................................................................. 237 H-1-3 Results for Saillenfait et al., 2002 and 2003 combined ................................................................. 240 H-1-4 Results for DuPont, 1990 ............................................................................................................... 243 H-1-5 Results for Becci et al., 1982 ......................................................................................................... 246
H-2 BENCHMARK DOSE MODELING OF EFFECTS FOR ACUTE EXPOSURES ........................................................................... 248 H-2-1 Results for Saillenfait et al., 2002 and 2003 combined using Cmax ................................................ 249 H-2-2 Results for Saillenfait et al., 2002 and 2003 combined using AUC ................................................ 252 H-2-3 Results for Sitarek et al., 2012....................................................................................................... 255
Appendix I PBPK MODELING ......................................................................................... 256
I-1 RAT MODEL .................................................................................................................................................... 256 I-2 HUMAN MODEL............................................................................................................................................... 263
I-2-1 Corrections to Human Model Structure ........................................................................................ 264 LIST OF TABLES Table 1-1 Physical and Chemical Properties of NMP ................................................................................................... 24 Table 1-2 Environmental Fate Characteristics of NMP ................................................................................................ 26
Page 4 of 281

Table 2-1 Summary of Parameters for Worker Dermal Exposure to Liquidsa ............................................................. 33 Table 2-2 Summary of Parameters for Worker Inhalation Exposure Concentrationsa ................................................ 34 Table 2-3 Workplace Exposure Scenario Characteristics ............................................................................................. 36 Table 2-4 NMP Exposure Scenarios for Characterizing Consumer Inhalation Exposures ............................................ 44 Table 2-5 NMP Consumer Paint Stripping Scenario Descriptions and Parameters ..................................................... 47 Table 3-1 Summary of Studies with Reproductive or Developmental Effects ............................................................. 52 Table 3-2 Summary of Exposure Pathways, Toxicity Endpoints and Risk Estimation Approach ................................. 60 Table 3-3 NMP Studies with Evidence for Developmental Toxicity ............................................................................. 62 Table 3-4 Summary of Derivation of the PODs for Fetal Resorptions and Fetal Mortality Following Acute Exposure
to NMP .......................................................................................................................................................... 75 Table 3-5 Summary of Derivation of the PODs for Decreased Body Weight Following Chronic Exposure to NMP .... 77 Table 4-1 Margin of Exposure (MOE) Equation to Estimate Non-Cancer Risks Following Acute or Chronic Exposures
to NMP .......................................................................................................................................................... 80 Table 4-2 Use Scenarios, Populations of Interest and Toxicological Endpoints for Assessing Risks to NMP-containing
Paint Strippers ............................................................................................................................................... 81 Table 4-3 Acute Risk Estimates for Occupational Exposures to NMP-Based Paint Strippers - Miscellaneous Stripping
Activities ........................................................................................................................................................ 84 Table 4-4 Acute Risk Estimates for Occupational Exposures to NMP-Based Paint Strippers – Graffiti Removal ........ 85 Table 4-5 Acute Risk Estimates for Consumer Exposures to NMP-Based Paint Strippers ........................................... 88 Table 4-6 Chronic Risk Estimates for Occupational Exposures to NMP-Based Paint Strippers - Miscellaneous
Stripping Activities ......................................................................................................................................... 91 Table 4-7 Chronic Risk Estimates for Occupational Exposures to NMP-Based Paint Strippers – Graffiti Removal ..... 92 Table 4-8 Spectrum of Exposure and Risks Based on Scenarios Evaluated in This Risk Assessment......................... 105 LIST OF APPENDIX TABLES Table_Apx A-1 Aquatic Toxicity Data for NMP - Acute Toxicity ................................................................................. 122 Table_Apx A-2 Aquatic Toxicity Data for NMP - Chronic Toxicity .............................................................................. 123 Table_Apx A-3 Aquatic Toxicity Data for NMP - Wildlife ........................................................................................... 124 Table_Apx B-1 National Chemical Information for NMP from 2012 CDR .................................................................. 125 Table_Apx B-2 Summary of Industrial NMP Uses from 2012 CDR ............................................................................ 125 Table_Apx B-3 NMP Commercial/Consumer Use Category Summary ...................................................................... 127 Table_Apx B-4 Consumer Uses of NMP ..................................................................................................................... 128 Table_Apx C-1 State NMP Regulations ...................................................................................................................... 129 Table_Apx D-1 Study Quality Criteria and Acceptance Specifications ....................................................................... 132 Table_Apx D-2 2007 North American Industry Classification System (NAICS) Codes ............................................... 133 Table_Apx D-3 2007 US Economic Census Data for Painting and Wall Covering and Flooring Contractors ............. 140 Table_Apx D-4 2007 US Economic Census Data for Automotive Body, Paint and Interior Repair and Maintenance
..................................................................................................................................................................... 141 Table_Apx D-5 2007 US Economic Census Data for Reupholstery and Furniture Repair .......................................... 142 Table_Apx D-6 2007 US Economic Census Data for Industry Sectors that May Engage in Art Restoration and
Conservation Activities ................................................................................................................................ 142 Table_Apx D-7 2007 US Economic Census Data for Aircraft Manufacturing ............................................................. 143 Table_Apx D-8 2007 US Economic Census Data for Ship Building and Repairing ...................................................... 144 Table_Apx D-9 Summary of NMP Inhalation Exposure Data Identified in the Literature ......................................... 147 Table_Apx D-10 NMP Personal Air Measurements Obtained during Graffiti Removal (Anundi et al., 2000) ........... 151 Table_Apx E-1 Sequence of Stripping Activities for MRI study ................................................................................. 156 Table_Apx E-2 Results from GC-FID Samples (EPA, 1994a) ....................................................................................... 157 Table_Apx E-3 Table 1 from the MRI Report to EPA (EPA, 1994a) ............................................................................ 158 Table_Apx E-4 Fitted Parameters to the Rescaled MRI (EPA, 1994) Results for Wood Finisher’s Pride ................... 161 Table_Apx E-5 Assumed Model Parameters for Estimates of User and Non-user Exposures for a Spray-applied
Product Containing NMP ............................................................................................................................. 164 Table_Apx E-6 Time Schedule for Paint Stripping with Repeat Application .............................................................. 168
Page 5 of 281

Table_Apx E-7 NMP Mass Released for Brush-on Application, by Application Target .............................................. 169 Table_Apx E-8 NMP Mass Released for Spray-on Application, by Application Target .............................................. 169 Table_Apx F-1 Study Quality Considerations ............................................................................................................. 213 Table_Apx F-2 Reproductive Performance of Females, Summarized from Sitarek et al, 2012 ................................. 215 Table_Apx H-1 Fetal Body Weight Data Selected for Dose-Response Modeling for NMP ........................................ 232 Table_Apx H-2 Model Predictions for Fetal Body Weights in Rats Exposed to NMP by Inhalation Using Daily Average
AUC as the Dose Metric (Saillenfait et al., 2003)......................................................................................... 234 Table_Apx H-3 Model Predictions for Fetal Body Weights in Rats Exposed to NMP by Gavage Using Daily Average
AUC as the Dose Metric (Saillenfait et al., 2002)......................................................................................... 237 Table_Apx H-4 Model Predictions for Fetal Body Weights in Rats Exposed to NMP by Gavage or Inhalation using
Daily Average AUC as the Dose Metric (Saillenfait et al., 2002 and 2003) .................................................. 240 Table_Apx H-5 Model Predictions for Fetal Body Weights in Rats Exposed to NMP by Inhalation using Daily Average
AUC as the Dose Metric (DuPont 1990) ...................................................................................................... 243 Table_Apx H-6 Model Predictions for Fetal Body Weights in Rats Exposed to NMP Dermally Using Daily Average
AUC as the Dose Metric (Becci et al., 1982) ................................................................................................ 246 Table_Apx H-7 Skeletal Malformations, Resorptions and Fetal Mortality Data Selected for Dose-Response Modeling
for NMP ....................................................................................................................................................... 248 Table_Apx H-8 Model Predictions for Resorptions in Rats Exposed to NMP via Gavage or Inhalation Using Cmax as
the Dose Metric (Saillenfait et al., 2002 and 2003) ..................................................................................... 249 Table_Apx H-9 Model Predictions for Resorptions in Rats Exposed to NMP via Gavage or Inhalation Using AUC as
the Dose Metric (Saillenfait et al., 2002 and 2003) ..................................................................................... 252 Table_Apx H-10 Model Predictions for Fetal Mortality in Rats Exposed to NMP by Gavage Using Cmax as the Dose
Metric (Sitarek et al., 2012) ......................................................................................................................... 255 Table_Apx I-1 Estimated PBPK Parameters for Each Subject of the Bader and van Thriel (2006) Experiments ....... 273 LIST OF FIGURES Figure 1-1 Chemical Structure of N-Methylpyrrolidone .............................................................................................. 24 Figure 1-2 Schematic of Human Exposure Pathways for NMP .................................................................................... 27 Figure 1-3 Schematic of Analysis Plan for Quantifying Risks of NMP .......................................................................... 29 Figure 2-1 Example of Time-varying User Exposure Concentration and Maximum TWA Values for Selected
Averaging Times ............................................................................................................................................ 41 Figure 2-2 Example of Time-varying Non-user Exposure Concentration and Maximum TWA Values for Selected
Averaging Times ............................................................................................................................................ 42 Figure 2-3 Model Sensitivity Results (Percent Change from Base-case Response) for Peak 1-hr TWA for Consumer
User and Non-user ........................................................................................................................................ 43 Figure 2-4 Model Sensitivity Results (Percent Change from Base-case Response) ..................................................... 43 Figure 3-1 Hazard Identification and Dose-Response Process .................................................................................... 48 Figure 3-2 Studies that Measured Fetal/Pup Body Weight after Oral Exposure of the Dams to NMP with NOAEL and
LOAELs Identified .......................................................................................................................................... 64 Figure 3-3 Studies that Measured Fetal/Pup Body Weight after Inhalation and Dermal Exposure of the Dams to
NMP with NOAEL and LOAELs Identified....................................................................................................... 65 Figure 3-4 Analysis of Fit: Average Daily AUC vs Fetal or Postnatal Body Weight ....................................................... 73 LIST OF APPENDIX FIGURES Figure_Apx D-1 Typical Flow Tray for Applying Stripper to Furniture (IRTA, 2006) .................................................. 136 Figure_Apx D-2 Typical Water Wash Booth Used to Wash Stripper and Coating Residue from Furniture (IRTA, 2006)
..................................................................................................................................................................... 137 Figure_Apx D-3 Example Diagram of a Dipping Tank for Furniture Stripping (HSE, 2001) ........................................ 137 Figure_Apx E-1 Results from FTIR Samples (EPA, 1994a) .......................................................................................... 157 Figure_Apx E-2 Uncorrected (Run 12) and Corrected (All Runs) FTIR Results for NMP – Wood Finisher’s Pride ..... 158 Figure_Apx E-3 Corrected and Rescaled FTIR Results for NMP – Wood Finisher’s Pride (Brush Application) .......... 159 Figure_Apx E-4 NLS Fit of Exponential-emissions Model to Rescaled FTIR Results for Wood Finisher’s Pride ......... 160
Page 6 of 281

Figure_Apx E-5 Theoretical Cumulative Mass of NMP Released from Wood Finisher’s Pride .................................. 161 Figure_Apx E-6 Zone Volumes and Airflow Rates for Workshop Scenarios .............................................................. 171 Figure_Apx E-7 Zone Volumes and Airflow Rates for Bathroom Scenario ................................................................ 171 Figure_Apx E-8 Modeling Representation of the Bathtub and Virtual Compartment (aka “Source Cloud”) ............ 173 Figure_Apx E-9 Air Velocity Distributions from Matthews et al. (1989) .................................................................... 174 Figure_Apx E-10 Example of the Personal Concentration Calculation as Defined in Equation C-13 ......................... 178 Figure_Apx E-11 Scenario 1, Brush Applied: Modeled NMP Concentrations and User Exposure for Stripper
Application in Workshop Using Parameter Values Selected for Central Tendency Exposure. ................... 180 Figure_Apx E-12 Scenario 2, Brush Applied: Modeled NMP Concentrations and User Exposure for Stripper
Application in Workshop Using Parameter Values Selected for Upper-end User Exposure. ...................... 180 Figure_Apx E-13 Scenario 3, Brush Applied: Modeled NMP Concentrations for Stripper Application in Workshop
using Parameter Values Selected for Upper-end User and Non-User Exposures. ...................................... 181 Figure_Apx E-14 Modeled NMP Concentrations for Scenarios 4 and 5, Brush Application in Bathroom using
Parameter Values selected for Upper-end to Bounding User and Non-User Exposures. ........................... 182 Figure_Apx E-15 Modeled NMP Concentrations for Scenarios 6a and 6b, Spray Application to Coffee Table in
Workshop using Lower and Upper Estimates for Emission Parameter Values selected for Upper-end User Exposures. ................................................................................................................................................... 183
Figure_Apx E-16 Modeled NMP Concentrations for Scenarios 7a and 7b, Spray Application to Chest in Workshop using Lower and Upper Estimates fir Parameter Values selected for Upper-end User and Non-user Exposures. ................................................................................................................................................... 184
Figure_Apx H-1 Plot of Mean Response by Dose, with Fitted Curve for Selected Model for Fetal Body Weight in Rats Exposed to NMP via Inhalation (Saillenfait et al., 2003) ............................................................................. 235
Figure_Apx H-2 Plot of Mean Response by Dose, with Fitted Curve for Selected Model for Fetal Body Weight in Rats Exposed to NMP via Gavage (Saillenfait et al., 2002) .................................................................................. 238
Figure_Apx H-3 Plot of Mean Response by Dose, with Fitted Curve for Selected Model for Fetal Body Weight in Rats Exposed to NMP via Gavage or Inhalation (Saillenfait et al., 2002 and 2003) ............................................ 241
Figure_Apx H-4 Plot of Mean Response by Dose, with Fitted Curve for Selected Model for Fetal Body Weight in Rats Exposed to NMP via Inhalation (DuPont 1990) ........................................................................................... 244
Figure_Apx H-5 Plot of Mean Response by Dose, with Fitted Curve for Selected Model for Fetal Body Weight in Rats Exposed to NMP Dermally (Becci et al., 1982) ............................................................................................ 246
Figure_Apx H-6 Plot of Mean Response by Dose, with Fitted Curve for Selected Model for Resorptions in Rat Exposed to NMP via Gavage or Inhalation (Saillenfait et al., 2002 and 2003) ............................................ 250
Figure_Apx H-7 Plot of Mean Response by Dose, with Fitted Curve for Selected Model for Resorptions in Rat Exposed to NMP via Gavage or Inhalation (Saillenfait et al., 2002 and 2003) ............................................ 253
Figure_Apx I-1 Model Fits to IV Injection Data in Rats .............................................................................................. 258 Figure_Apx I-2 Model Fits to Rat Oral PK Data .......................................................................................................... 260 Figure_Apx I-3 Model Fits to Dermal PK Data from Payan et al. (2003) in Rats ........................................................ 261 Figure_Apx I-4 Model Simulations vs. Inhalation PK Data from Ghantous (1995) for NMP Inhalation in Rats ......... 262 Figure_Apx I-5 NMP Blood Concentration Data from Bader and van Thriel (2006) .................................................. 270 Figure_Apx I-6 Alternate Fits to Collective Data from Bader and van Thriel (2006).................................................. 271 Figure_Apx I-7 Model Fits to Subjects 1 and 4 of Bader and van Thriel (2006) ......................................................... 274 Figure_Apx I-8 Model Fits to Subjects 10 and 12 of Bader and van Thriel (2006) ..................................................... 275 Figure_Apx I-9 Model Fits to Subjects 14 and 16 of Bader and van Thriel (2006) ..................................................... 276 Figure_Apx I-10 Model Fits to Subjects 17 and 25 of Bader and van Thriel (2006) ................................................... 277 Figure_Apx I-11 Model Fits to Human Inhalation Data of Akesson and Paulsson (1997), With and Without Dermal
Absorption of Vapors .................................................................................................................................. 278 Figure_Apx I-12 Model Fits to Human Dermal Exposure Data of Akesson et al. (2004) ........................................... 280 Figure_Apx I-13 Workplace Observer Simulations Representing Subjects of Xioafei et al. (2000) ........................... 281 LIST OF EQUATIONS Equation D-1 Mass Balanced Concentration of NMP ................................................................................................ 153 Equation E-1 Exponential Decay of Emissions ........................................................................................................... 154
Page 7 of 281

Equation E-2 Total Mass Released ............................................................................................................................. 154 Equation E-3 Initial Emission Rate ............................................................................................................................. 154 Equation E-4 Air Concentration for a Single Exponential as a Function of Time ....................................................... 155 Equation E-5 Air Concentration for a Double Exponential as a Function of Time ..................................................... 155 Equation E-6 Sensitivity Analysis of Linear Variables ................................................................................................ 165 Equation E-7 Sensitivity Analysis for Discrete Variables ............................................................................................ 165 Equation E-8 Interzonal Airflow Rate ........................................................................................................................ 170 Equation E-9 Saturation Concentration ..................................................................................................................... 176 Equation E-10 Maximum Time Weighted Concentrations ........................................................................................ 177 Equation H-1 Linear Model. (Version: 2.19; Date: 06/25/2014) ............................................................................... 235 Equation H-2 Exponential Model. (Version: 1.9; Date: 01/29/2013) ........................................................................ 238 Equation H-3 Exponential Model. (Version: 1.9; Date: 01/29/2013) ........................................................................ 241 Equation H-4 Exponential Model. (Version: 1.9; Date: 01/29/2013) ........................................................................ 244 Equation H-5 Polynomial Model. (Version: 2.19; Date: 06/25/2014)........................................................................ 246 Equation H-6 Hill Model. (Version: 2.17; Date: 01/28/2013) .................................................................................... 250 Equation H-7 Power Model. (Version: 2.18; Date: 05/19/2014) ............................................................................... 253 Equation I-1 Cardiac Output ...................................................................................................................................... 257 Equation I-2 Rat Skin Model Equations ..................................................................................................................... 260 Equation I-3 Rat Skin Partition Coefficients ............................................................................................................... 261 Equation I-4 Dermal Dosing Equations ...................................................................................................................... 262 Equation I-5 NMP Dermal Transport ......................................................................................................................... 263 Equation I-6 NMP Vapor Exposure Control ............................................................................................................... 263 Equation I-7 5-HNMP Metabolism and Elimination .................................................................................................. 264 Equation I-8 Vapor Exposure Scheduling ................................................................................................................... 265 Equation I-9 NMP Liquid Rate of Delivery to Skin ..................................................................................................... 266 Equation I-10 NMP Vapor Rate of Delivery to Skin ................................................................................................... 266 Equation I-11 NMP Unabsorbed Fraction Remaining on Skin ................................................................................... 266
Page 8 of 281

AUTHORS / CONTRIBUTORS / ACKNOWLEDGEMENTS / REVIEWERS
This report was developed by the United States Environmental Protection Agency (EPA), Office of Pollution Prevention and Toxics (OPPT), Office of Chemical Safety and Pollution Prevention (OCSPP). The 2012 Work Plan Risk Assessment for N-Methylpyrrolidone (also called N-Methyl-2-Pyrrolidinone, or NMP) was prepared based on existing data and any additional information received during the public comment period and peer review process. Mention of trade names does not constitute endorsement by EPA. EPA Assessment Team Leads:
Cal Baier-Anderson, OPPT/Risk Assessment Division (RAD) Iris Camacho, OPPT/RAD Team Members:
Kent Anapolle, OPPT/ Chemistry, Economics and Sustainable Strategies Division (CESSD) Chris Brinkerhoff, OPPT/RAD
Judith Brown, OPPT/CESSD Ernest Falke, OPPT/RAD Amuel Kennedy, OPPT/RAD Andy Mamantov, OPPT/RAD
Scott Prothero, OPPT/RAD Justin Roberts, OPPT/CESSD
Paul Schlosser, Office of Research and Development (ORD)/National Center for Environmental Assessment (NCEA)
David Tobias, OPPT/RAD Management Lead: Stan Barone Jr., OPPT/RAD Contributors
Chester E. Rodriguez, formerly with Office of Pesticide Programs (OPP)/Health Effects Division (HED), currently, The Coca Cola Company
Kan Shao, formerly with ORD/NCEA, currently, Indiana University, School of Public Health, Department of Environmental Health
Acknowledgements We acknowledge the contributions of Mary Dominiak (OPPT/Chemical Control Division; retired) and Conrad Flessner (OPPT/RAD; retired) in the development of the draft work plan risk assessment for NMP. In addition, we appreciate the assistance from members of OPPT’s Environmental Assistance Division (John Shoaff, Ana Corado and Pamela Buster) for providing updates to the regulatory history of NMP. Portions of this document were prepared for EPA/OPPT by Abt Associates, the Eastern Research Group (ERG), Inc., SRC and Versar.
Page 9 of 281

EPA Internal Peer Reviewers Office of Chemical Safety and Pollution Prevention Anjali Lamba, OPPT/RAD Office of Children’s Health Protection Brenda Foos and Greg Miller Federal Peer Reviewers Occupational Safety and Health Administration Val Schaeffer and Joe Coble National Institute of Occupational Safety and Health
David Dankovic and Christine Whittaker Consumer Product Safety Commission
Mike Babich External Peer Reviewers EPA/OPPT released the peer review plan in August of 2012 and draft risk assessment and charge questions for peer review for public comment in January 2013. EPA/OPPT contracted with The Scientific Consulting Group, Inc. (SCG) to convene a panel of ad hoc reviewers to conduct an independent external peer review for the EPA/OPPT’s draft work plan risk assessment for NMP. As an influential scientific product, the draft risk assessment was peer reviewed in accordance with EPA’s peer review guidance. The peer review panel performed its functions by web conference and teleconference between September 26 and December 13, 2013. The panel consisted of the following individuals: Gary Ginsberg (Chair), Ph.D. Connecticut Department of Public Health Thomas W. Armstrong, Ph.D. Occupational Hygiene Consulting, LLC Frank A. Barile, Ph.D. St. John’s University College of Pharmacy and Health Sciences Anneclaire J. De Roos, PhD. Drexel University School of Public Health
Ronald D. Hood, Ph.D. Ronald D. Hood and Associates, Toxicology Consultants Dale Hattis, Ph.D. George Perkins Marsh Institute, Clark University John C. Kissel, Ph.D. University of Washington Stephen B. Pruett, Ph.D. College of Veterinary Medicine, Mississippi State University
Please visit the EPA/OPPT’s Work Plan Chemicals web page for additional information on the NMP’s peer review process (http://www.epa.gov/oppt/existingchemicals/pubs/riskassess.html) and the public docket (Docket: EPA-HQ-OPPT-2012-0725) for the independent external peer review report and the response to comments document.
Page 10 of 281

ABBREVIATIONS °C Degrees Celsius 2-HMSI 2-Hydroxy-N-methylsuccinimide 5-HNMP 5-Hydroxy-N-methyl-2-pyrrolidone ACH Air changes per hour ADC Average daily concentration ADR Acute dose rate AIC Akaike’s Information Criterion AIHA American Industrial Hygiene Association APF Assigned protection factor Atm atmosphere(s) AUC Area under the curve BAF Bioaccumulation factor BCF Bioconcentration factor BMC Benchmark concentration BMCL 95 Percent lower confidence limit of the benchmark concentration BMCL1SD 95 Percent lower confidence limit of one standard deviation of the benchmark
concentration BMD Benchmark dose BMDS Benchmark Dose Software BMR Benchmark response BW Body weight CASRN Chemical Abstracts Service Registry Number CDC Center for Disease Control and Prevention cm Centimeter(s) cm2 Square centimeter(s) cm3 Cubic centimeter(s) Cmax Peak concentration CO2 Carbon dioxide CYP Cytochrome P450 CYP2E1 Cytochrome P450, family 2, subfamily E, polypeptide 1 DCM Dichloromethane (or methylene chloride) DIY Do-it-yourself DNEL Derived no effect level dw Dry weight E Emission Rate EC European Commission EFH Exposure Factors Handbook EPA Environmental Protection Agency ESD Emission Scenario Document EU European Union ft Foot/feet
Page 11 of 281

ft2 or sq ft Square foot/feet FTIR Fourier transform infrared g Gram(s) GC-FID Gas chromatography with flame ionization detection GD Gestation day H2S Hydrogen sulfide HHE Health hazard evaluation HPV High production volume hr(s) Hour(s) IMIS Integrated Management Information System IRIS Integrated Risk Information System IUR Inventory Update Reporting K Kelvin Kp rate constant of permeability coefficient kg kilogram(s) kmol Kilomole(s) L Liter(s) Lb(s) Pound(s) LC50 Lethal concentration 50 percent LD50 Lethal dose 50 percent LOAEL Lowest-observed-adverse-effect level m Meter m2 Square meter(s) m3 Cubic meter(s) MCCEM Multi-Chamber Concentration and Exposure Model mg Milligram(s) min Minute(s) MITI Ministry of International Trade and Industry mmHg millimeter of mercury mmol Millimole(s) MOE Margin of exposure mol Mole(s) MRI Midwest Research Institute MSDS Material Safety Data Sheet MSHA Mining Safety and Health Administration MSI N-Methylsuccinimide NAICS North American Industry Classification System NESHAP National Emission Standards for Hazardous Air Pollutants NHANES National Health and Nutrition Examination Survey NIH National Institutes of Health NIOSH National Institute for Occupational Safety and Health NMP N-Methylpyrrolidone NOAEC No-observed-adverse-effect concentration NOAEL No-observed-adverse-effect level
Page 12 of 281

NOES National Occupational Exposure Survey OCSPP Office of Chemical Safety and Pollution Prevention OECD Organisation for Economic Cooperation and Development OPPT Office of Pollution Prevention and Toxics OSHA Occupational Safety and Health Administration PBPK Physiologically based pharmacokinetic PC Partition coefficient pH Measure of acidity or basicity of an aqueous solution PMN Premanufacture Notification POD Point of departure PPE Personal protection equipment ppm Parts per million PSKA skin:air PC PSKL skin:saline PC PV Dermal permeability or penetration constant for vapor exposure PVC Polyvinyl chloride PVL Dermal permeability constant for liquid exposure RAC Risk Assessment Committee RIVM Dutch National Institute for Public Health and the Environment ROH Rest of the house SA Surface area SAVC Fraction of total skin area exposed to NMP vapors SCBA Self-contained breathing apparatus SIC Standard Industry Classification SIDS Screening Information Data Set STEL Short-term exposure limit TD Toxicodynamics TDS Technical Data Sheets TK Toxicokinetics TRI Toxic Release Inventory TSCA Toxic Substances Control Act TWA Time-weighted average UF Uncertainty factor UFA Interspecies uncertainty factor UFH Intraspecies uncertainty factor UK United Kingdom US United States VOC Volatile organic compound WEEL Workplace Environmental Exposure Level WHO World Health Organization Yr Year(s)
Page 13 of 281

EXECUTIVE SUMMARY As a part of EPA’s comprehensive approach to enhance the Agency’s existing chemicals management program, in March 2012 EPA identified a work plan of chemicals for further assessment under the Toxic Substances Control Act (TSCA)1. The Agency is performing risk assessments on chemicals in this work plan. If an assessment identifies unacceptable risks to humans or the environment, EPA will pursue risk reduction. EPA/OPPT assessed N-methylpyrrolidone, also referred to as 1-methyl-2-pyrrolidinone (TSCA inventory name) or NMP, as part of this work plan. NMP is a solvent that exhibits low volatility, low flammability and no explosivity. It has low persistence and low bioaccumulation potential in the environment. NMP is produced or imported to the US in large quantities (i.e., 184.7 million lbs in 2012). It has a variety of TSCA uses including: petrochemical processing, engineering plastics, coatings (i.e., resins, paints, finishes, inks and enamels), paint stripping, agricultural chemicals, electronic cleaning and industrial/domestic cleaning. In the work plan, EPA/OPPT identified NMP for further evaluation based on high concern for hazard due to its reproductive toxicity and high concern for potential exposure due to use in consumer products. During scoping and problem formulation, EPA/OPPT considered all TSCA uses and chose to focus on occupational and consumer paint stripping uses because of high content in products and high potential exposure to workers and consumers. In addition, EPA/OPPT reviewed available toxicological data and existing risk assessments and concluded that the data on developmental toxicity was more relevant, consistent and sensitive than the reproductive toxicity data. Therefore the NMP hazard identification focused on developmental toxicity. Focus of this Risk Assessment This assessment characterized human health effects associated with NMP-based paint stripping uses. Based on the physical-chemical properties of NMP and the paint stripping use scenarios described in this assessment, EPA/OPPT expects the predominant route of exposure for NMP to be dermal, including absorption of vapor-through-skin. EPA/OPPT did not include a quantitative assessment of environmental effects in this risk assessment. Because NMP has a low hazard profile for ecological receptors and low persistence and bioaccumulation if released into aquatic or terrestrial environments, EPA/OPPT did not evaluate potential risks to the environment associated with releases of NMP from paint stripping activities as part of this assessment.
1 http://www.epa.gov/oppt/existingchemicals/pubs/workplans.html
Page 14 of 281
Main Conclusions of this Risk Assessment This assessment evaluated risks of adverse developmental toxicity associated with acute and chronic exposures to NMP-based paint strippers. Acute exposures were defined as occurring within a single day. Chronic exposures were defined as exposures comprising 10% or more of a lifetime (EPA, 2011a). Repeated exposures, e.g., 5 consecutive days or more, are anticipated during chronic exposure. Adverse developmental outcomes can arise from acute or repeated exposures during critical windows of development at any time during pregnancy, pregnancy can occur any time during women’s reproductive years and exposures can result in persistent chronic adverse effects. Therefore the risk assessment was based on developmental toxicity associated with consideration of acute and repeated exposures. The risk assessment evaluated a number of exposure scenarios that cover consumer and worker uses. The outcome of the risk assessment demonstrates that duration of use and product concentration are both important drivers of risk. Short term (e.g., 1-2 hour) exposures to products with low concentrations of NMP (e.g., 25% or less) result in no risks. However, the use of higher concentration products that can readily be purchased by both consumers and workers may result in risks. Specifically: The assessment identified risks from acute exposures of:
• Four hours per day, when gloves were not used. • Greater than 4 hours per day, and risks were not mitigated by personal protective
equipment such as respirators or gloves. The assessment identified risks from chronic (repeated) exposures of:
• Four hours per day, when gloves were not used. • Greater than 4 hours per day, and risks were not mitigated by personal protective
equipment such as respirators or gloves. Based on the use scenarios evaluated, there are no expected risks to people not directly engaged in using NMP, regardless of duration of exposure. Other hazards, in particular adverse reproductive and other systemic effects, could be a concern at higher exposures levels, but exposures that are protective of pregnant women and women who may become pregnant are expected to also be protective of other lifestages and subpopulations. The use of gloves was determined to be effective in reducing modeled estimates of exposure, as demonstrated by the higher MOEs. For chronic exposure, gloves may not provide sufficient protection in all scenarios. More importantly, not all glove types are effective in protecting
Page 15 of 281

against NMP exposure. EPA/OPPT did not evaluate glove efficacy, however California DOH recommends the use of gloves made of butyl rubber or laminated polyethylene/EVOH2. Human Populations Considered in This Assessment EPA/OPPT assumed that people using NMP-based paint strippers would be persons of both sexes (>16 years old), including pregnant women. EPA assessed if there would be risks to individuals of any age group (e.g., children, adults, elderly) who may be exposed if they are in a nearby area during product application. The quantification of exposures focused on pregnant women and women of childbearing age who may become pregnant, because the most sensitive health effects selected for use in the risk assessment affect the fetus. EPA/OPPT assumed that exposures that do not result in unacceptable risks for these specific lifestages would also be protective of others, including children, for other adverse outcomes. Support for this assumption includes:
• Toxicological effects that may be relevant to children and adults (i.e., reproductive effects and other systemic toxicity) are expected to occur at higher exposure concentrations (e.g., an order of magnitude higher) relative to the fetal effects, based on rodent studies.
• EPA/OPPT does not expect exposures of adult males to reach levels that would be associated with reproductive effects or other systemic toxicity.
• Similarly, EPA/OPPT estimated exposures to children who may be nearby the user and found that exposures were below levels of concern for developmental endpoints, and would thus be below levels of concern for other endpoints associated with higher exposure levels.
Acute Exposures Using NMP-Based Paint Stripper EPA/OPPT evaluated acute exposures by the dermal and inhalation routes, including vapor-through-skin exposure. Exposures to people who may be nearby those using NMP-based paint stripping products (i.e., nearby non-users) were also estimated, based on inhalation, vapor-through-skin and incidental dermal contact exposure routes. For the exposure assessment EPA/OPPT used data from literature sources where available; in the absence of data, EPA/OPPT relied on generalized use patterns and the physical and chemical properties of NMP as inputs to modeling approaches. EPA/OPPT used two different approaches to quantify acute exposures to workers and consumers. The first approach incorporated assumptions based on occupational exposures of 1, 4, or 8 hours duration, whereas the second approach incorporated assumptions considering consumer use on a single project (table, chest of drawers or bathtub). The use of personal
2 See California Health Hazard Advisory, available at: http://www.cdph.ca.gov/programs/hesis/Documents/nmp.pdf (accessed December 18, 2014)
Page 16 of 281

protective equipment was varied to determine how this might affect exposure in both approaches. EPA/OPPT did not quantify risks to consumers who may use NMP-based paint strippers on multiple products for 4 hours or more. Based on a qualitative analysis of the outcomes it is possible that exposures of 4 or more hours could present risks comparable to those associated with acute worker exposure scenarios. Chronic Exposures to NMP-Based Paint Strippers EPA/OPPT evaluated chronic exposures by the dermal and inhalation routes, including vapor-through-skin exposure. Exposures to people who may be nearby those using NMP-based paint stripping products (i.e., nearby non-users) were also estimated, based on inhalation, vapor-through-skin and incidental dermal contact exposure routes. For the exposure assessment EPA/OPPT used data from literature sources where available; in the absence of data, EPA/OPPT relied on generalized use patterns and the physical and chemical properties of NMP as inputs to modeling approaches. EPA/OPPT developed exposure scenarios that simulated repeated exposures to NMP from miscellaneous stripping, and graffiti removal, activities that are generally, but not exclusively, associated with workers. For each basic scenario EPA/OPPT considered low, moderate and high-end exposure parameters and the impact of different combinations of personal protective equipment (PPE) on exposure:
• Respirator and gloves • Respirator only • Gloves only • Neither respirator nor gloves
EPA/OPPT assumed that these variations cover most of the spectrum of repeated paint stripper uses. Since the hazard endpoint of interest was based on developmental effects, EPA/OPPT considered repeated exposures of 5 or more consecutive days to be potentially significant. Use of PBPK Model EPA/OPPT used a physiologically-based pharmacokinetic (PBPK) model to calculate internal doses of NMP, which are expected to better represent exposures related to potential adverse effects (McLanahan et al., 2012). The PBPK model also allowed EPA/OPPT to estimate aggregate exposures across multiple exposure routes, specifically dermal, vapor-through-skin and inhalation exposures. The PBPK model was based on a published, peer-reviewed model that was adapted and validated for use by EPA/OPPT.
Page 17 of 281
NMP Hazard Identification and Dose-Response Analysis A number of adverse effects were observed in different studies, including effects on body weight, liver, kidney, spleen, thymus, testes and brain. EPA/OPPT reviewed the evidence for NMP toxicity and selected developmental toxicity endpoints as the most robust, sensitive and consistent adverse effects for dose-response analysis. EPA/OPPT specifically selected increased fetal resorptions (fetal death) to assess risks from acute exposures and decreased fetal body weight to evaluate risks from chronic exposures. The exposure concentrations used in the rat studies were converted to internal doses using the PBPK model. EPA/OPPT applied benchmark dose (BMD) modeling to the internal doses to generate the appropriate point of departure (POD) for chronic and acute exposure scenarios. The POD is the dose used to estimate risk and is generally based on the No Observable Adverse Effect Level (NOAEL) or a surrogate metric, such as the BMDL (lower confidence limit on the BMD). Risk Assessment Approach EPA/OPPT calculated Margins of Exposure (MOEs) and compared them to a benchmark MOE to determine if unacceptable risks were present. EPA/OPPT calculated acute or chronic MOEs (MOEacute or MOEchronic) separately based on the appropriate POD and estimated exposure. A benchmark MOE of 30 was selected; MOEs below 30 indicated the presence of risks. Uncertainties of this Risk Assessment There are a number of uncertainties associated with this risk assessment. Uncertainties pertaining to the lack of measured data on dermal exposure resulted in several parameter values being based on assumptions. There are also uncertainties associated with the efficacy of glove use, durations of contact, and surface areas exposed. There are also uncertainties associated with the inhalation exposure assessment; the small number of exposure studies means that the data may not be representative of all scenarios. Differences in use practices and engineering controls could introduce unknown variability that EPA/OPPT could not account for in this assessment. The actual number of people exposed to NMP in paint strippers is not known. There are no data for the number of people using NMP-based paint stripper that would allow for a reliable estimate of the size of the affected population. However, it is expected that NMP-based paint strippers are less common than DCM-based strippers, so the number of potentially exposed people should be less than the number of people exposed to DCM-based strippers. The number of workers using DCM-based strippers was estimated to be 230,000 (EPA, 2014b); the number of consumers using DCM-based strippers is unknown.
Page 18 of 281

There are a number of uncertainties associated with the consumer exposure assessment. Limited data were available on consumer uses and the duration of exposure. EPA/OPPT did not quantify risks to consumers who may use NMP-based paint strippers on multiple projects for greater than 4 hours. For all exposure scenarios, inter-individual variability was assumed, but not quantified. This variability was reflected in the selection of uncertainty factors used in the calculation of risk estimates, specifically 10X for intra-human variability and 3X for interspecies (extrapolation of rat to human) uncertainty. There is also uncertainty associated with assessing risks of developmental toxicity based on decreased fetal body weight in rodents. In particular, there is uncertainty regarding the timing and duration of the exposures in humans, relative to the controlled rodent exposure studies. EPA/OPPT selected fetal resorptions/fetal mortality to evaluate risks associated with acute exposures because they were consistent, relevant and sensitive. There is uncertainty in interspecies extrapolation of concentration-response for resorptions and fetal mortality observed in rodents to spontaneous abortions and fetal mortality in humans.
Page 19 of 281

1 BACKGROUND AND SCOPE
1.1 INTRODUCTION As a part of EPA’s comprehensive approach to enhance the Agency’s existing chemicals management, in March 2012 EPA/OPPT identified a work plan of chemicals for further assessment under the Toxic Substances Control Act (TSCA)3. EPA/OPPT is assessing chemicals in this work plan; if an assessment identifies unacceptable risks to humans or the environment, EPA/OPPT will pursue risk reduction options. After gathering input from stakeholders, EPA/OPPT developed criteria used for identifying chemicals for further assessment4. The criteria focused on chemicals that meet one or more of the following factors: (1) potentially of concern to children’s health (for example, because of reproductive or developmental effects); (2) neurotoxic effects; (3) persistent, bioaccumulative and toxic (PBT); (3) probable or known carcinogens; (4) used in children’s products; or (5) detected in biomonitoring programs. Using this methodology, EPA/OPPT developed a TSCA Work Plan of chemicals as candidates for risk assessment in the next several years. In the prioritization process, N-methylpyrrolidone or 1-methyl-2-pyrrolidinone (NMP; Chemical Abstracts Service Registry Number [CASRN] 872-50-4) was identified for assessment based on high human health hazards and exposure potential. The target audience for this risk assessment is primarily EPA/OPPT risk managers; however, it may also be of interest to the broader risk assessment community as well as US stakeholders that are interested in issues related to NMP, especially when used as a paint stripper. The information presented in the risk assessment may be of assistance to other Federal, State and Local agencies as well as to members of the general public who are interested in the risks associated with the use of NMP-based paint strippers. The initial step in EPA/OPPT’s risk assessment development process includes scoping and problem formulation and is distinct from the exercise to put a chemical on the work plan. During scoping and problem formulation EPA/OPPT reviews currently available data and information, including but not limited to, assessments conducted by others (e.g., authorities in other countries), published or readily available reports and published scientific literature. During scoping and problem formulation, a robust review may result in refinement – either addition/expansion or removal/contraction – of specific hazard or exposure concerns previously identified in the work plan methodology.
3 http://www.epa.gov/oppt/existingchemicals/ 4 http://www.epa.gov/oppt/existingchemicals/pubs/wpmethods.pdf
Page 20 of 281

1.2 USES AND PRODUCTION VOLUMES According to the 2012 Chemical Data Reporting (CDR), 184.7 million pounds (lbs) of NMP were produced or imported into the US that year, making NMP a high production volume (HPV) chemical (EPA, 2013a). BASF Corporation, NOVA Molecular Technologies, Inc., Ashland, Inc, OM Group, Inc., Toray Holding (USA), Inc. and Lyondell Chemical Company currently manufacture NMP in the US (Appendix A-1). NMP is an effective solvent used in a variety of industrial, commercial and consumer use applications, including (Harreus et al., 2011):
• Petrochemical processing, acetylene recovery from cracked gas, extraction of aromatics and butadiene, gas purification (removal of carbon dioxide [CO2] and hydrogen sulfide [H2S]), lube oil extraction;
• Engineering plastics: reaction medium for the production of high-temperature polymers such as polyethersulfones, polyamideimides and polyaramids;
• Coatings: solvent for acrylic and epoxy resins, polyurethane paints, waterborne paints or finishes, printing inks, synthesis/diluent of wire enamels, coalescing agent;
• Agricultural chemicals: solvent and/or co-solvent for liquid formulations; • Electronics: cleaning agent for silicon wafers, photoresist stripper, auxiliary in
printed circuit board technology; and • Industrial and domestic cleaning: component in paint strippers and degreasers (e.g.,
removal of oil, fat and soot from metal surfaces and carbon deposits and other tarry polymeric residues in combustion engines).
Although paint stripping accounts for only about nine percent of the total use of NMP, EPA/OPPT is specifically concerned about this use because the potential for exposure is high; some of the other uses of NMP involve closed processes or lower concentrations that generally reduce exposures and are of less concern. While the cited paint stripping use percentage is from reports dated in the 1980s and 1990s, confidential business information (i.e., known to EPA/OPPT but cannot be cited here) as recent as 2011 confirmed that paint stripping is still a low percentage use for NMP in terms of market consumption.
1.2.1 Assessment and Regulatory History NMP is subject to a number of EPA regulations. NMP is listed on the Toxics Release Inventory (TRI) and is therefore subject to reporting pursuant to Section 313 of the Emergency Planning and Community Right-to-Know Act (EPCRA)5. According to the 2013 TRI dataset, 386 facilities reported releases or transfers and the top 100 facilities disposed of or released a total of
5 List of Toxics Release Inventory Chemicals, Section 313, Emergency Planning and Community Right to Know Act (EPCRA), Toxics Release Inventory (TRI) Program, US Environmental Protection Agency, 40 CFR 372.65, July 1, 2002.
Page 21 of 281

7.747 million lbs of NMP (EPA, 2013a). NMP is on The Clean Air Act (CAA) Section 111, Standards of Performance for New Stationary Sources of Air Pollutants - Equipment Leaks Chemical List6. NMP is currently approved for use by EPA as a solvent and co-solvent inert ingredient in pesticide formulations for both food and non-food uses and is exempt from the requirements of a tolerance limit.7 The Occupational Safety and Health Administration (OSHA) has not established regulatory exposure limits for NMP. The only recommended exposure limit identified for NMP is a non-regulatory limit established by the American Industrial Hygiene Association (AIHA): a workplace environmental exposure level (WEEL) of 10 ppm as an 8-hr time weighted average (TWA), with the addition of a cautionary note addressing concerns for skin contact (AIHA, 2013). EPA/OPPT expects that some workplaces may consider this WEEL when instituting respiratory and dermal protections. A number of states have taken action to address NMP hazard and risk concerns; this information is available in Appendix B. NMP is currently on the candidate list of substances of very high concern for authorization in the European Union. In August 2013, the Dutch National Institute for Public Health and the Environment (RIVM) submitted a proposal for the restriction of NMP to the European Chemicals Agency (ECHA) under the Registration, Evaluation, Authorisation and Restriction (REACH) regulation (RIVM, 2013). The restriction proposal was modified by the Risk Assessment Committee (RAC) (ECHA, 2014) and the combined opinion will be sent to the European Commission for final decision. The RAC recommended using long-term exposure DNELs for pregnant workers (the most sensitive population) for both inhalation and dermal exposure. The proposal would require that “Manufacturers, importers and downstream users of the substance on its own or in mixtures in a concentration equal or greater than 0.3% shall use in their chemical safety assessment and safety data sheets by a long term Derived No Effect Level (DNEL) value for workers inhalation exposure of 10 mg/m3 and a long term DNEL for workers dermal exposure of 4.8 mg/kg/day”(ECHA, 2014). When Canada conducted a categorization of the Domestic Substances List for its Chemicals Management Plan in 2006, NMP met Canada’s human health categorization criteria. NMP has been the subject of a Tier II health risk assessment in Australia under the Inventory Multi-tiered Assessment and Prioritisation (IMAP) (NICNAS, 2013). It is currently subject to labeling and related requirements based on concern for skin, eye and respiratory irritation and for reproductive toxicity. These government assessments consider NMP to be of low environmental concern. Australia concluded that further risk management is required and
6 List of Regulated Toxic Substances and Threshold Quantities for Accidental Release Prevention (Table 1) and List of Regulated Flammable Substances and Threshold Quantities for Accidental Release Prevention (Table 3), Section 112(r), Federal Clean Air Act Amendments, US Environmental Protection Agency, 40 CFR 68.130, Tables 1 and 3, July 1, 2008. 7 EPA Action Memorandum: Inert Reassessment: N-methylpyrrolidone (CAS Reg. No. 872-50-4), June 2006. http://www.epa.gov/opprd001/inerts/methyl.pdf (accessed October 28, 2014)
Page 22 of 281

additional assessment (Tier III) is needed to determine if current exposure controls are adequate to protect workers and the public when NMP is used in domestic products.
1.2.2 Scope of the Assessment Based on a review of available data, EPA/OPPT focused on NMP in paint stripping applications, because of high content in products and high potential exposure to workers and consumers. EPA/OPPT determined that general population and agricultural exposures were outside the scope of this assessment. Narrowing of the scope was based on a comparison of potential exposures among the primary uses identified relative to paint stripping. These comparative judgments considered potential exposure among the primary uses identified. In addition, NMP is a potential substitute for dichloromethane (DCM) in paint stripping applications, which EPA/OPPT recently assessed under the TSCA Work Plan and found to present significant cancer and non-cancer risks; hence, EPA/OPPT considered it prudent to evaluate NMP because manufacturers may consider it to be a replacement for DCM as a paint stripper. EPA/OPPT’s assessment of paint stripping activity quantitatively evaluated the risks for workers using NMP-based paint strippers considering both acute and chronic exposures. Acute exposure was defined as exposure over the course of a single day, and chronic exposure was defined as exposure of 10% or more of a lifetime (EPA, 2011a). Repeated exposures over the course of a work week are anticipated during chronic worker exposure. Occupational exposures include possible direct exposures to workers who may use these products at work, in training or other situations. Data sources did not often indicate whether exposure concentrations were for occupational users or workers who may be nearby those using NMP-based paint stripping products (i.e., nearby worker non-users). Therefore, EPA/OPPT assessed both populations of occupational workers. This assessment also examined consumer exposures to NMP-based paint strippers in consumer use scenarios. EPA/OPPT also evaluated exposures to other residents who did not use the product, but may be indirectly exposed in the home while located nearby while the product is being used (i.e., nearby residents). The consumer exposures were assumed to be of short duration (acute), based on a single project (e.g., strip paint off of a coffee table, chest of drawers or bathtub) and that NMP is readily eliminated from the body, mainly by extensive metabolism and rapid excretion in the urine (Akesson and Paulsson, 1997; Jonsson and Akesson, 2003; Payan, 2002).
1.3 PROBLEM FORMULATION During problem formulation, EPA/OPPT defined which exposure pathways, receptors and health endpoints would be included in this risk assessment. To make this determination, physical chemical properties and environmental fate were evaluated within the context of the selected use scenarios: occupational and consumer paint stripping.
Page 23 of 281

Problem formulation also led to EPA/OPPT’s conclusion not to evaluate environmental risks related to the use of NMP in paint stripping products. EPA/OPPT reviewed and summarized available published studies on ecotoxicity (EPA, 1999b, 2012b; OECD, 2007) to understand the potential environmental effects of NMP releases to the environment on ecological receptors including toxicity to fish, invertebrates, plants and birds. Based on this review, EPA/OPPT concluded that the ecotoxicological hazard of NMP is low. Thus, the potential risks to the environment based on releases of NMP from paint stripping activities were not evaluated further in this assessment. Appendix A contains a summary of the aquatic toxicity studies considered in the evaluation of environmental hazards of NMP.
1.3.1 Physical and Chemical Properties
Figure 1-1 presents the chemical structure of NMP. Table 1-1 summarizes NMP’s physical chemical properties.
Figure 1-1 Chemical Structure of N-Methylpyrrolidone
NMP is a colorless to slightly yellow liquid with a slight amine odor. NMP is in a class of dipolar aprotic solvents that are miscible in water and do not contain acidic hydrogen. Neat NMP exhibits low volatility, high boiling point, low flammability and no explosivity. Variations in humidity can cause a range of saturation concentrations. NMP is not readily oxidizable (EC, 2000; Lide, 2001; O'Neil et al., 2001). Table 1-1 Physical and Chemical Properties of NMP
Molecular formula C5H9ON
Molecular weight 99.13
Physical form Colorless to slightly yellow liquid; slight amine odor
Melting point -24.4 °C
Boiling point 202 °C
Vapor pressure 0.190 mmHg at 25 °C
Log Kow -0.727 at 25 °C
Water solubility 1,000 g/L at 25 °C
Flash point 95 °C (open cup); 91 °C (closed cup) Source: EC (2000)
N O
Page 24 of 281

1.3.2 Environmental Fate This section summarizes current knowledge of the transport, persistence, bioaccumulation and bioconcentration of NMP in the environment including biological and abiotic reactions and environmental distribution. Fate characteristics are summarized in Table 1-2. If released to the atmosphere, NMP is expected to exist solely in the vapor-phase based on its vapor pressure. Vapor-phase NMP is degraded in air by reaction with photochemically produced hydroxyl radicals. The half-life of this reaction is approximately 5.8 hrs, assuming a hydroxyl radical concentration of 1.5 × 10⁶ hydroxyl radicals/cm3 air over a 12-hr day. NMP in the atmosphere can be expected to dissolve into water droplets, where it will be removed by condensation or further reactions with hydroxyl radicals. When released to water, NMP is not expected to adsorb to suspended solids or sediment in the water column based upon its Koc value. Although neat NMP is slightly volatile, the rate of volatilization from water is expected to be low based on a Henry’s Law constant of 3.2 × 10⁻⁹ atm-m3/mole. Based on its low soil organic carbon partitioning coefficient (log Koc = 0.9), NMP is expected to possess high mobility in soil; releases of NMP to soil may volatilize from soil surfaces or migrate through soil and contaminate groundwater. Measured bioconcentration studies for NMP were not located; however, the estimated bioaccumulation factor (BAF) and bioconcentration factor (BCF) of 0.9 and 3.16, respectively, suggest that bioaccumulation and bioconcentration in aquatic organisms is low. Biodegradation studies have consistently shown this substance to be readily biodegradable (EPA, 1999b, 2012b; OECD, 2007). Based on the available environmental fate data, NMP is expected to have low bioaccumulation potential and low persistence.
Page 25 of 281

Table 1-2 Environmental Fate Characteristics of NMP
Property Value
CASRN 872-50-4
Photodegradation half-life
5.8 hrs (estimated)
Hydrolysis half-life
Stable
Biodegradation Half-life of 4 days in a clay soil Half-life of 8.7 days in a loam soil Half-life of 11.5 days in a sandy soil 73% after 28 days (readily biodegradable, OECD 301C, MITI (I)) 91-97% after 28 days (readily biodegradable, OECD 301B) 88% after 30 days (readily biodegradable, OECD 301D) 98% after 4 days (inherently, biodegradable, OECD 302B) 99% after 19 days (inherently biodegradable, OECD 301E)
Bioaccumulation Bioconcentration
BAF = 0.9 (estimated)b BCF = 3.16
Log Koc 0.9 (estimated)b
Fugacity (Level III Model)b
Air (%) Water (%)
Soil (%) Sediment (%)
<0.1 32.5 67.3 <0.1
Persistencec low Bioaccumulationc low Notes: a OECD (2008) b EPA (2012b) c EPA (1999b)
1.3.3 Conceptual Model
1.3.3.1 Exposure Pathways The following conceptual model (Figure 1-2) illustrates NMP uses and pathways that may result in occupational, consumer and general population exposures. The shaded components indicate the exposure pathways considered in this risk assessment, as summarized above in section 1.2.2.
Page 26 of 281
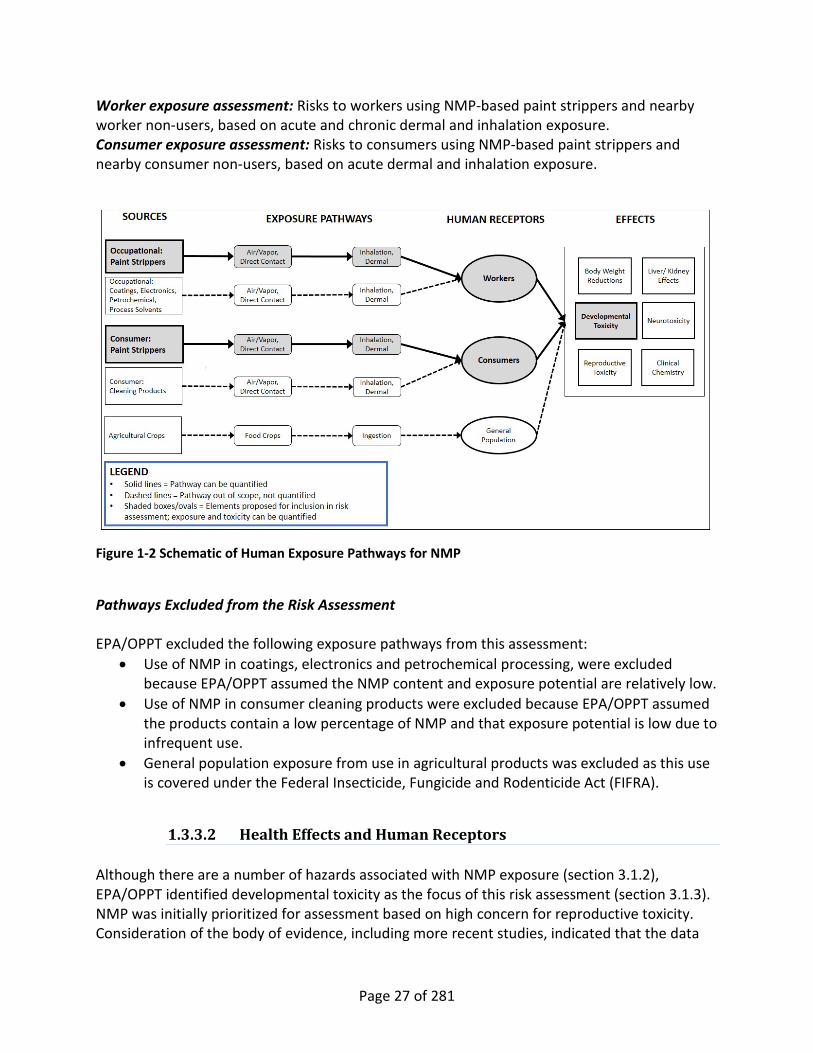
Worker exposure assessment: Risks to workers using NMP-based paint strippers and nearby worker non-users, based on acute and chronic dermal and inhalation exposure. Consumer exposure assessment: Risks to consumers using NMP-based paint strippers and nearby consumer non-users, based on acute dermal and inhalation exposure.
Figure 1-2 Schematic of Human Exposure Pathways for NMP
Pathways Excluded from the Risk Assessment EPA/OPPT excluded the following exposure pathways from this assessment:
• Use of NMP in coatings, electronics and petrochemical processing, were excluded because EPA/OPPT assumed the NMP content and exposure potential are relatively low.
• Use of NMP in consumer cleaning products were excluded because EPA/OPPT assumed the products contain a low percentage of NMP and that exposure potential is low due to infrequent use.
• General population exposure from use in agricultural products was excluded as this use is covered under the Federal Insecticide, Fungicide and Rodenticide Act (FIFRA).
1.3.3.2 Health Effects and Human Receptors Although there are a number of hazards associated with NMP exposure (section 3.1.2), EPA/OPPT identified developmental toxicity as the focus of this risk assessment (section 3.1.3). NMP was initially prioritized for assessment based on high concern for reproductive toxicity. Consideration of the body of evidence, including more recent studies, indicated that the data
Page 27 of 281

on developmental toxicity were more relevant, consistent and sensitive than the reproductive toxicity data. Reproductive and developmental toxicity endpoints can occur on a continuum and in some cases it can be difficult to distinguish whether an endpoint is due to reproductive or developmental toxicity. EPA/OPPT determined that using developmental toxicity endpoints for dose-response calculation would be protective of the most sensitive lifestages, including the fetus. Since developmental toxicity and fetal effects were more sensitive and of greatest concern, the risk assessment focused on pregnant women and women of child-bearing age who may become pregnant. EPA/OPPT recognizes that other effects, including reproductive effects and other organ toxicity, might be associated with higher exposures and may affect other lifestages and subpopulations. By basing the risk calculation on the most sensitive endpoint for the most sensitive receptors, EPA/OPPT assumed that scenarios that show no risks for developmental effects should also be protective of other receptors, including children. This issue is discussed in more detail in section 3.2.5 with specific examples in section 4.1
1.3.4 Analysis Plan Figure 1-3 describes the approach taken to quantify risks associated with use of NMP-based paint strippers. EPA/OPPT quantified occupational exposure based on a combination of monitoring data and generic assumptions (2.1.1.2) to derive dermal and inhalation exposure parameters and concentrations (2.1.1.3). EPA/OPPT estimated consumer dermal exposure based on modeled consumer behavior patterns (2.2.1.1), while inhalation exposure was informed by emissions data from a chamber study and mathematical modeling (2.2.1.2). EPA/OPPT used a physiologically-based pharmacokinetic (PBPK) model to calculate internal doses because, in general, internal doses are expected to correlate more closely with effects (McLanahan et al., 2012) and it allows for aggregating exposures across multiple exposure routes. The PBPK model was used to calculate internal doses for workers (2.1.2) and consumers (2.2.3), from dermal, vapor-through-skin and inhalation exposure routes for different scenarios. The PBPK model was based on a published model that was adapted for use by EPA/OPPT (Appendix I). For hazard identification and dose-response, EPA/OPPT reviewed available data and selected a subset of rat studies that, taken as a whole, demonstrated the most robust, sensitive and consistent fetal effects compared to other studies, for use in the risk assessment (3.1.3). EPA/OPPT converted the exposure concentrations in the selected studies to internal doses using a rat PBPK model (3.2.2). EPA/OPPT used benchmark dose (BMD) modeling to generate the appropriate point of departure (POD) for chronic (3.2.3) and acute (3.2.3) exposure scenarios. The POD is the dose used to estimate risk and is generally based on the No Observable Adverse Effect Level (NOAEL) or a surrogate metric, such as the BMDL (lower
Page 28 of 281

confidence limit on the BMD). EPA/OPPT quantified risk based on the Margin of Exposure (MoE), which is the ratio of exposure (i.e., internal doses) with the POD (4.1).
Figure 1-3 Schematic of Analysis Plan for Quantifying Risks of NMP See text in section 1.3.4 for details.
Page 29 of 281

2 EXPOSURE ASSESSMENT The exposure pathways of interest included dermal, vapor-through-skin and inhalation. NMP is well absorbed following dermal exposures and dermal absorption including NMP from the vapor phase typically contributes significantly to human exposure (Bader et al., 2008; Keener et al., 2007). NMP diluted in water has reduced dermal absorption (Keener et al., 2007; Payan, 2003) while NMP diluted in other solvents, such as d-limonene, can increase the absorption of NMP (HLS, 1998) and prolonged exposures to neat (i.e., pure) NMP increases the permeability of the skin (RIVM, 2013). NMP is also absorbed via inhalation (Akesson and Paulsson, 1997) but the low vapor pressure and mild volatility can limit the amount of NMP available for inhalation. For nearby non-users, exposures were limited to inhalation and vapor-through-skin exposure routes. In all cases, internal doses integrating the different exposure routes were derived using a PBPK model. The previously published PBPK model for NMP in humans (Poet et al., 2010) was adapted for use by EPA (see Appendix I). The model predicted absorption of liquid or vapor from the NMP concentration, duration of contact and physiological descriptions such as body weight. The physiological parameters of body weight and skin surface area used were specific to pregnant women and women of childbearing age. Absorption of NMP via inhalation depended on the NMP concentrations in air. Dermal absorption of NMP depended on the NMP weight fraction in liquid, NMP vapor concentration and skin surface area exposed to liquid and vapor. The thickness of the liquid film did not factor directly into the estimate of liquid NMP absorption. As a conservative estimate for user scenarios it was assumed that fresh material would be constantly deposited over the time of use such that the concentration on the skin would remain essentially constant at the formulation concentration. The exposure parameters used to estimate internal NMP doses for the occupational and consumer exposure scenarios are described below.
2.1 OCCUPATIONAL EXPOSURES
2.1.1 Approach and Methodology This section identifies relevant industries and worker population estimates and summarizes the occupational dermal and inhalation exposure parameters and concentrations for NMP-based strippers. These parameters were used as PBPK model inputs. Appendix D provides background details on industries that may use NMP-based strippers, worker activities, processes, numbers of sites and number of potentially exposed workers. Appendix D also provides detailed discussion on the values of the dermal exposure parameters and air concentrations and associated worker inhalation parameters presented in this section.
Page 30 of 281

2.1.1.1 Identification of Relevant Industries Because a variety of industries include paint stripping among their business activities, EPA/OPPT made an effort to determine and characterize these industries. EPA/OPPT reviewed the published literature and evaluated the 2007 North American Industry Classification System (NAICS) codes to determine industries that likely include paint stripping activities (see Appendix D, Table_Apx D-2). The identified industries are:
• Professional contractors; • Bathtub refinishing; • Automotive refinishing; • Furniture refinishing; • Art restoration and conservation; • Aircraft paint stripping; • Ship paint stripping; and • Graffiti removal.
Identifying these industries is useful to identify workers who may be exposed to NMP due to the use of the NMP-based strippers. However, EPA/OPPT was not able to determine the extent of use of NMP-based strippers in these industries. Appendix D details the industries identified and processes and worker activities that may contribute to worker exposures.
2.1.1.2 Approach for Determining Occupational Exposure Data and Input Parameters for PBPK Modeling
To derive internal dose estimates for acute and chronic occupational exposures, the PBPK model required as input parameters to describe NMP concentration, duration and physiological descriptors such as surface area and body weight. EPA/OPPT used literature sources for estimating many of these occupational exposure parameters and generic assumptions were used when data were not available. EPA/OPPT used air concentration data and estimates found in literature sources to serve as inhalation exposure concentration inputs to the PBPK modeling for occupational exposures to NMP. EPA/OPPT searched the OSHA’s Integrated Management Information System (IMIS) database for inspection data from OSHA and its State Plan States for NMP inhalation exposures. However, NMP exposure data in the IMIS database are limited, did not include any industries that matched the NAICS codes identified in Appendix D and did not appear relevant for paint stripping. For most dermal exposure parameters and inhalation concentrations, EPA/OPPT did not find enough data to determine statistical distributions of the actual exposure parameters and concentrations. Ideally, EPA/OPPT would like to know 50th and 95th percentiles for each parameter. The means and mid-ranges (means are preferable to mid-ranges) served as
Page 31 of 281

substitutes for 50th percentiles, and high ends of ranges served as substitutes for 95th percentiles. However, these substitutes were highly uncertain and not ideal substitutes for the percentiles. EPA/OPPT could not determine whether these concentrations were suitable to represent statistical distributions of real world scenarios. Parameters were selected for the most sensitive lifestages: pregnant women and women of childbearing age who may become pregnant.
2.1.1.3 Estimates of Occupational Exposure Parameters and Number of Exposed Workers
Exposure Data and Input Parameters for PBPK Modeling Table 2-1 and Table 2-2 show the occupational dermal and inhalation exposure parameters, respectively, used in the PBPK modeling for this assessment. The skin surface area and body weight dermal parameters were specific to the lifestages of interest: pregnant women and women of childbearing age who may become pregnant. Two scenarios were included for the inhalation pathway: one for miscellaneous NMP-based stripping (assumed mostly indoor and includes paint stripping by professional contractors, wood furniture stripping and other settings for which the literature source did not specify the industry) and one for NMP-based graffiti removal (assumed mostly outdoor but may include semi-confined spaces, such as outdoor escalators and elevators).
Page 32 of 281
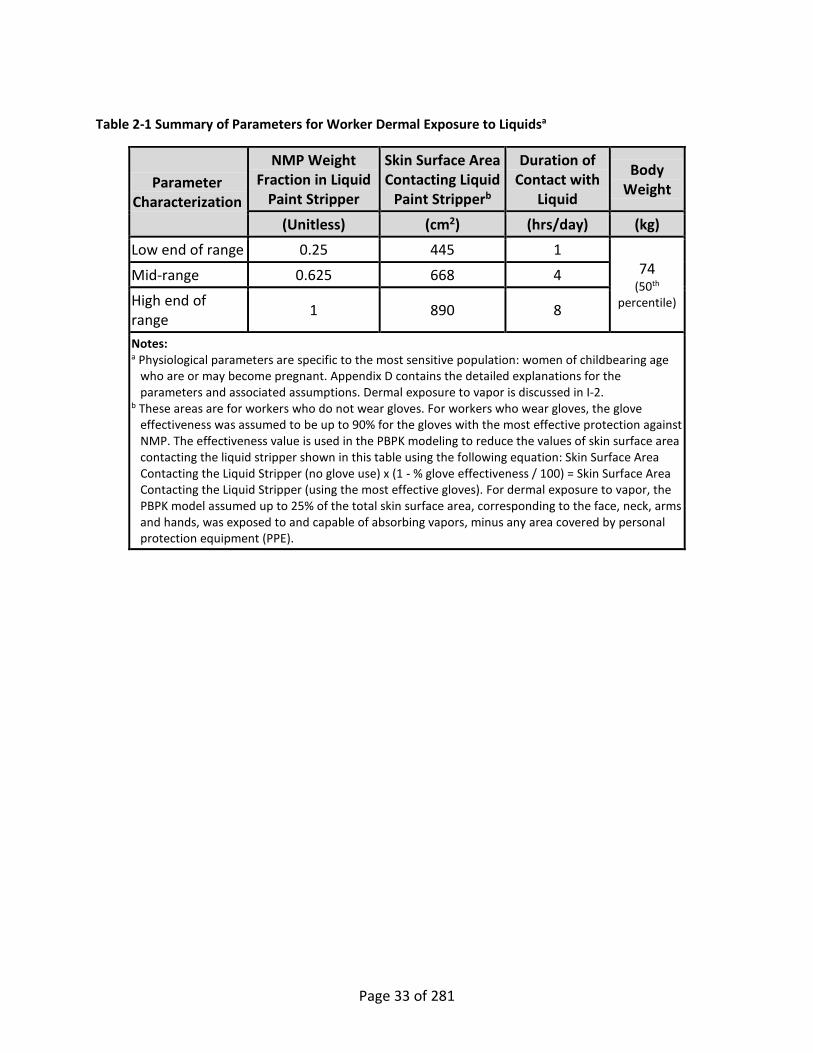
Table 2-1 Summary of Parameters for Worker Dermal Exposure to Liquidsa
Parameter Characterization
NMP Weight Fraction in Liquid
Paint Stripper
Skin Surface Area Contacting Liquid
Paint Stripperb
Duration of Contact with
Liquid
Body Weight
(Unitless) (cm2) (hrs/day) (kg)
Low end of range 0.25 445 1 74
(50th percentile)
Mid-range 0.625 668 4
High end of range 1 890 8
Notes: a Physiological parameters are specific to the most sensitive population: women of childbearing age
who are or may become pregnant. Appendix D contains the detailed explanations for the parameters and associated assumptions. Dermal exposure to vapor is discussed in I-2.
b These areas are for workers who do not wear gloves. For workers who wear gloves, the glove effectiveness was assumed to be up to 90% for the gloves with the most effective protection against NMP. The effectiveness value is used in the PBPK modeling to reduce the values of skin surface area contacting the liquid stripper shown in this table using the following equation: Skin Surface Area Contacting the Liquid Stripper (no glove use) x (1 - % glove effectiveness / 100) = Skin Surface Area Contacting the Liquid Stripper (using the most effective gloves). For dermal exposure to vapor, the PBPK model assumed up to 25% of the total skin surface area, corresponding to the face, neck, arms and hands, was exposed to and capable of absorbing vapors, minus any area covered by personal protection equipment (PPE).
Page 33 of 281

Table 2-2 Summary of Parameters for Worker Inhalation Exposure Concentrationsa
Scenario Parameter Characterization
NMP Exposure Concentration (mg/m3, 8-hr TWA)b
Miscellaneous stripping (assumed mostly indoor)
Low end of range 1.0 Mid-range 32.5
High end of range 64
Graffiti removal (assumed mostly outdoor but may include semi-confined spaces)
Low end of range 0.03
Mean 1.01
High end of range 4.52
Notes: a Appendix D contains detailed explanations including data sources and selection of values in the
ranges. b These exposure concentrations are for workers who do not wear respirators. For workers who wear
respirators, it was assumed that respirators used have an assigned protection factor (APF) of 10 and that this APF was achieved during use. This APF was used in the PBPK modeling to reduce the NMP exposure concentrations shown in this table using the following equation: exposure concentration (using no respirator) / APF = exposure concentration (using respirators with APF of 10).
Inhalation data sources did not often indicate whether NMP exposure concentrations were for occupational users or nearby worker non-users. Therefore, EPA/OPPT assumed that inhalation exposure data were applicable for a combination of users and nearby non-users. Some nearby worker non-users may have lower inhalation exposures than users, especially when they are further away from the source of exposure. EPA/OPPT assumed that non-users that might be close by workers handling NMP usually do not directly contact the liquid strippers. Numbers of Exposed Workers and Shop Sizes Knowing the sizes of exposed populations provides perspective on the prevalence of the potential health effects. For this assessment, the exposed populations were workers exposed to NMP from NMP-based paint strippers. However, EPA/OPPT was unable to estimate the current total number of workers in the potentially exposed populations for this assessment. Estimates of the number of workers exposed to DCM during paint stripping provide perspective on the number of workers potentially exposed to NMP during paint stripping. EPA/OPPT estimated that over 230,000 workers at 13,500 facilities nationwide were directly exposed to DCM from DCM-based strippers, including 23,400 workers at 3,000 facilities classified as area sources (EPA, 2014b). EPA/ OPPT assumed that DCM is more widely used as a paint stripper than NMP and that fewer workers are exposed to NMP than to DCM during paint stripping. Therefore, EPA/ OPPT assumed that fewer than 230,000 workers nationwide are directly exposed to NMP during paint
Page 34 of 281
stripping. These estimates do not account for workers within the facilities who are indirectly exposed due to proximity to the paint stripping operations. EPA/OPPT estimated the average number of employees per facility which can be a factor in determining shop sizes. These estimates were derived by combining the facility and population data obtained from the US Census data, as described in Appendix D. The average number of employees for the identified industries based on Census data were the following: • Professional contractors (likely to include bathtub refinishing): 5 workers/facility; • Automotive refinishing: 6 workers/facility; • Furniture refinishing: 3 workers/facility; • Art restoration and conservation (not estimated); • Aircraft paint stripping: 320 workers/facility (for aircraft manufacturing only); • Ship paint stripping: 100 workers/facility; and • Graffiti removal: 8 workers/facility. These averages give some perspective on shop size but are simple generalizations.
2.1.2 Use of Occupational Exposure Estimates in PBPK Modeling EPA/OPPT used air concentrations and dermal contact patterns as described above as inputs for the PBPK model to calculate internal dose. The skin area exposed to liquid NMP preparations (25% of the total skin surface area, corresponding to the face, neck, arms and hands) was assumed to be exposed to and capable of absorbing vapors, minus any area covered by personal protection equipment (PPE). It was assumed that respirators had an assigned protection factor (APF) of 10. In addition, it was assumed that protective gloves reduced the skin surface area exposed to 10% of the area exposed without gloves (but with the liquid concentration being the same). However, it was assumed that PPE completely eliminated vapor absorption for the covered areas: 3% of the total skin surface (599 cm2) for the face mask and 4.5% (890 cm2, both sides of both hands) for gloves. The latter is a generic assumption; since vapor absorption through these limited skin areas is predicted to be fairly small, the difference between assuming complete elimination and 90% is negligible. Workplace Exposure Scenarios EPA/OPPT evaluated six use scenarios representing combinations of the uses and exposure parameters listed in Table 2-1 and Table 2-2 (low, mid, high end of the range). For each scenario in Table 2-3 EPA/OPPT assumed that the skin was exposed dermally to NMP at the specified liquid weight fraction and skin surface area and that there was simultaneous exposure by inhalation and vapor-through-skin absorption for unobstructed skin areas. At the end of each work period, air concentrations were assumed to drop immediately to zero and any liquid on the skin was assumed to be removed by cleaning. For scenarios 3 and 6 exposure was simulated as occurring for two 4-hr work periods, with a 30 min break in between and cleaning of the skin
Page 35 of 281

assumed to occur after each 4-hr shift. Acute scenarios assumed 1 day of exposure and chronic scenarios assumed 5 days of exposure per week. Table 2-3 Workplace Exposure Scenario Characteristics
Scenario #
Scenario description
Liquid weight fraction
Skin area exposeda
(cm2)
8-hr TWA
(mg/m3)b Durationc
Air concentrationd
(mg/m3)
1 Miscellaneous stripping low end of range
25% 445 1 1 hr/day 8
2 Miscellaneous stripping
mid-range 62.5% 668 32.5 4 hr/day 65
3 Miscellaneous stripping high end of range
100% 890 64 8 hr/day with 30-min break 64
4 Graffiti removal low end of range
25% 445 0.03 1 hr/day 0.24
5 Graffiti removal
mean 62.5% 668 1.01 4 hr/day 2.02
6 Graffiti removal high end of range
100% 890 4.52 8 hr/day with 30-min break 4.52
Notes: a Total area potentially exposed to liquid NMP, in the absence of protective gloves. b TWA taken from Table 2-2. c Duration taken from Table 2-1. d Air concentration = TWA x 8hr/duration, with PBPK simulations run at concentration listed. Acute scenarios assumed 1 exposure day and chronic scenarios assumed 5 exposure days/wk. For 8-hr exposures a 30-min mid-day break was assumed.
EPA/OPPT evaluated 5 sub-cases for each workplace scenario. Each workplace scenario was evaluated including the following PPE:
• Respirator and gloves • Respirator only • Gloves only • Neither respirator nor gloves.
Page 36 of 281

The 5th case was for a nearby worker, not directly working with NMP (non-user) and assumed to not be wearing a respirator and to have incidental dermal contact equal to 1% of the skin area listed in Table 2-3. With regard to respirator use, only one of the NMP studies containing worker inhalation data used in this assessment specified a particular type of respirator in use by the workers in the study. This respirator, a half mask air-purifying respirator with organic vapor cartridges (NIOSH, 1993), is classified as having an assigned protection factor (APF) of 10. While respirators with other APFs may have been used, EPA/ OPPT only included the APF of the respirator type specified in the 1993 NIOSH study. Therefore, EPA/OPPT assumed a “what-if” type assumption that the use of respirators providing an APF of 10 will reduce inhalation concentrations by a factor of 10 when this type of respirator is used in accordance with OSHA’s Respiratory Protection standard (29 CFR 1910.134). The efficacy of gloves was not evaluated in this assessment, however California recommends the use of gloves made of butyl rubber or laminated polyethylene/EVOH. See California Health Hazard Advisory, available at: http://www.cdph.ca.gov/programs/hesis/Documents/nmp.pdf (accessed 12/18/14).
2.2 CONSUMER EXPOSURES
2.2.1 Approach and Methodology This section summarizes the consumer exposure parameters and concentrations for NMP estimated for use of NMP-based paint strippers. The exposure scenario presumed that the consumer would work on a single project (table, chest of drawers or tub), with inputs reflecting that consumers do not reliably use personal protective equipment (e.g., no ventilation fan, not wearing effective gloves8). The consumer would be exposed via inhalation, dermal contact and vapor-through-skin, while non-users who may be nearby would only be exposed via inhalation and vapor-through-skin. In the absence of representative air monitoring data, EPA/OPPT used the Multi-Chamber Concentration and Exposure Model (MCCEM) to estimate consumer inhalation exposure concentrations. The parameters needed to support the modeling effort, i.e., model input values and the rationale for their use in different exposure scenarios, are described in this section.
8 California recommends the use of gloves made of butyl rubber or laminated polyethylene/EVOH. See California Health Hazard Advisory, available at: http://www.cdph.ca.gov/programs/hesis/Documents/nmp.pdf. EPA/OPPT does not assume consumers will always use gloves, or select the proper gloves. Risks were assessed with and without gloves.
Page 37 of 281

2.2.1.1 Consumer Dermal Exposure Assessment To better understand potential risks to consumers from the use of NMP-containing paint stripping products, EPA/OPPT included dermal exposure in calculating internal doses. Dermal absorption of NMP depended on the liquid and vapor concentrations, dermal contact patterns and exposed skin surface area. Estimates for the amount of surface area exposed to the chemical during brush or spray application were designed to be protective or upper end9. EPA/OPPT assumed that the skin surface area exposed to liquid NMP during brush application was 490 cm2 to represent the palm side of both hands and for spray application, that 1 cm2 was wetted by liquid to approximate the tip of one finger. For brush application scenarios where gloves were worn, a glove effectiveness factor of 90% was applied and the exposed surface area was reduced to 49 cm2. EPA/OPPT assumed that the surface area exposed to NMP vapor was up to 25% of the total body surface area or 4989 cm2, to account for the face, neck, arms and hands minus the area covered by gloves when used. It was also assumed that a thin film of NMP could remain on the user’s hands for the period of product application. For further details please see the PBPK Appendix I-2.
2.2.1.2 Consumer Users and Residential Non-Users Inhalation Exposure Assessment
Background In the absence of representative air monitoring data, EPA/OPPT used MCCEM to estimate consumer inhalation exposure concentrations. The parameters needed to support the modeling effort, i.e., model input values and the rationale for their use in different exposure scenarios, are described in this section.
9 As noted in Section 2.3.1 (Individual Risk) of the EPA (1992) exposure assessment guidelines, “Individual risk descriptors will generally require the assessor to make estimates of high-end exposure and sometimes additional estimates (e.g., estimates of central tendency such as average or median exposure).” For this assessment, scenarios with central parameter values refer to a set of inputs that are expected to result in a central (i.e., near the median) estimate of individual exposure. As noted in EPA (1992), “a high end exposure estimate is a plausible estimate of the individual exposure for those persons at the upper end of an exposure distribution. The intent of this designation is to convey an estimate of exposures in the upper range of the distribution, but to avoid estimates that are beyond the true distribution. Conceptually, the high end of the distribution means above the 90th percentile of the population distribution, but not higher than the individual in the population who has the highest exposure.” For this assessment, scenarios labeled “upper-end” were modeled by selecting low- and high-end values for sensitive parameters. An “upper-end” exposure estimate is above central tendency and may include the high end of the exposure distribution. As noted in EPA (1992), an exposure above the distribution of actual exposures is termed 'bounding.'
Page 38 of 281
Model Input Parameters and Rationale MCCEM requires inputs of several chemical-specific parameters including values for: current product characteristics, use patterns, exposure factors and air emissions data to develop appropriate exposure scenarios. The majority of the source documents EPA/OPPT used for these input values were over a decade old. All sources were compared to EPA/OPPT quality criteria (i.e., currency, scope, accuracy/reliability, transparency, clarity and completeness of the information provided). EPA/OPPT used published values for NMP-containing products currently available for consumer purchase to determine reasonable percentages of NMP in products and product densities (Brown, 2012). Other resources that provided information on product characteristics included: (1) the NIH’s Household Products Database; (2) Material Safety Data Sheets; and (3) Product Labels and Technical Data Sheets (i.e., TDS). The information collected from available product labels or TDSs included approximately half of the products listed in Brown (2012). To estimate air concentrations for consumer inhalation exposures, EPA/OPPT identified published air monitoring data from one chamber study of NMP previously conducted for EPA/OPPT (EPA, 1994a). Despite its age, EPA/OPPT considered the study to be reliable and that the associated data to be transparent and complete. In this study chamber experiments were conducted for five paint stripping products including one product containing 65 to 70 percent NMP (i.e., fairly high concentration). However, the experimental data could not be used directly to model consumer inhalation exposures because the values for the required exposure factors (e.g., room/house volume, airflow rates and surface area of object) were not entirely representative of the range of consumer values. Additionally, the experiments were conducted in a one-room chamber which did not provide concentrations for areas of the house other than the treatment room. An advantage of this study was that it used a US product and provided sufficient descriptions of the study design and results for the purposes of this risk assessment. The chamber study was useful in determining product application rates (i.e., in g/ft2 and g/min) and in estimating the fraction of applied chemical emission mass emitted to indoor air. As also described in Appendix E, chamber data were available for brush-on products but not for spray-on products. EPA/OPPT obtained the raw data associated with the study and conducted a thorough evaluation of the data and reported results. Through this evaluation, EPA/OPPT identified analytical method calibration issues for the near real-time sampling data that were collected for brush-on products, as well as incomplete adjustments made to some of data with respect to relative humidity and temperature conditions. After EPA /OPPT made adjustments to account for these issues, as discussed in Appendix E, the data were considered reliable for use as model inputs. Information on exposure factors was identified from a variety of sources, including the EPA’s Exposure Factors Handbook (EFH) (EPA, 2011a). The EFH provides information on generic exposure factors such as body weights, body part surface areas, house volumes and house
Page 39 of 281

ventilation rates. Information on specific uses of paint strippers (i.e., use amounts, frequencies and durations) was obtained from WESTAT (1987) and Abt (1992). EPA/OPPT incorporated additional information on use patterns of paint strippers as reported by Riley et al. (2001). This study had limitations, including: a single-site survey was used in the study, it was not specific to NMP paint strippers, it was based on a small sample size (n = 20) and it was based on respondent recall of product-use behavior. Other information, not specific to paint strippers but used to identify input parameters for the inhalation modeling, such as interzonal air flows and air exchange rates, was obtained from peer-reviewed publications, including EPA (1995) and (Matthews et al., 1989). Finally, in cases where no data were available for fitting model-specific parameters, EPA/OPPT applied professional judgment and confirmed with other sources of information where possible. This information has been identified in the report along with the rationale for the chosen values. Methodology EPA/OPPT estimated consumer inhalation exposures for both users and non-users to NMP emitted during paint stripper application and associated scraping using MCCEM (EPA, 2010). Non-user residents or occupants may be individuals of any age indirectly exposed to NMP while being in the rest of the house during product use. MCCEM is ideally suited to this application, as it provides for modeling of “incremental source” emissions, whereby a product is applied at a constant rate and the emission rate of the chemical in each instantaneously applied segment is assumed to decline exponentially over time. Depending on the type of applied product, either one or two exponential expressions may be needed to characterize the declining emission rate. In this case, it was determined that a double-exponential expression was appropriate (for more details, see E-1, Estimation of Emission Profiles for Paint Removers/Strippers in Appendix E). Sensitivity Analysis Background To select exposure scenarios for characterizing the consumer inhalation exposures, EPA/OPPT conducted a sensitivity analysis for optimizing the parameters used in the model for those that had the most influence over the results of the assessment. Changing those values (i.e., by varying combinations of parameters) enabled the generation of a wide range of plausible exposure scenarios and increased the level of confidence in the model results. The methods for and results of, this sensitivity analysis are described immediately below. The types of factors that can be varied in the MCCEM model include:
• The configuration of the structure (residence in this case) being modeled, including the number of zones, volume of each zone, airflow rates between each zone and outdoors and airflow rates between zones (i.e., interzonal airflow rates);
• The quantity of NMP emitted from the applied product and the time-varying emission rate, which are related to: the type and area of surface being stripped, the type of application (i.e., brush-on vs. spray-on), and the rate at which the product is applied to the surface; and
Page 40 of 281

• Locations during and after stripping of: the user(s)—the individual(s) applying the product and the non-user(s)—other individual(s) present in the house who are not involved in the paint-stripping activity and, by assumption, are located in a house zone other than the one in which the paint-stripping activity is taking place.
The sensitivity analysis was conducted using an approach that has been termed “nominal range sensitivity analysis” (Frey and Patil, 2002). With this approach, an initial “base case” set of model parameters was first defined, consisting of central tendency values (i.e., approximating average or median values) for each model parameter (input). Next, the inputs were varied—one at a time—and the model result (estimated average or peak concentrations to which individuals are exposed) was noted. The index of sensitivity was the magnitude of change in the model results, typically expressed as a percent change from that for the base case. Details on this approach are in section E-2 Sensitivity Analysis for Inhalation Scenarios in Appendix E. The time required to apply and scrape the paint stripper, including the wait time between applying and scraping, is typically on the order of an hour, as determined by Abt (1992). The model was run for a 24-hr period for the sensitivity analysis and the formal model runs to capture all or most of the declining indoor-air concentrations following the product use event. Illustrative time-varying concentrations, to which the user and non-user could be exposed, based on a preliminary model run, are shown in Figure 2-1 and Figure 2-2 along with the maximum TWA values and the corresponding time periods for selected averaging times. For the sensitivity analysis, only the maximum 1-hr TWA along with the 24-hr TWA were used.
Figure 2-1 Example of Time-varying User Exposure Concentration and Maximum TWA Values for Selected Averaging Times
Page 41 of 281

Figure 2-2 Example of Time-varying Non-user Exposure Concentration and Maximum TWA Values for Selected Averaging Times
The base case for the sensitivity analysis was formed using central (i.e., roughly equivalent to “average” or mean) values for the various inputs, as follows:
• House volume of 492 m3 (corresponds to 36 × 30 ft2, two-story house with an 8-foot ceiling), workshop (area of product use) volume of 54 m3 (corresponds to 20 × 12 ft2 with an 8-foot ceiling) and an indoor-outdoor airflow rate of 68 m3/hr (approximate value for a room with multiple open windows).
• Airflow rate of 197 m3/hr for the rest of the house (ROH), assuming windows are closed, corresponding to an air exchange rate of 0.45 air changes per hr (ACH).
• Brush-on application with a target surface area of 10 ft2, applied product mass of 1,080 g (108 g/ft2) and emitted (released to indoor air).
• NMP mass of 70.2 g, assuming an NMP weight fraction of 0.25 in the product and a release fraction of 0.26.
• User located in workshop during application and scraping periods, but in ROH during wait periods between applying/scraping and after completion of all applying/scraping.
Sensitivity Analyses Results Figure 2-3 and Figure 2-4 display the results of the sensitivity analyses for two exposure measures, peak 1- and 24-hr TWAs, respectively. For both measures and for both the user and the non-user, the change in model output for changing chemical mass was 75 percent. This outcome was indicative of a linear and proportional response. For the user, the model response was highly sensitive to location during the wait period between applying and scraping (i.e.,
Page 42 of 281

consumer stays in workshop versus moving to the ROH), so that if the consumer stayed in the workshop during the wait period, inhalation exposures likely would be higher. The model response was somewhat less sensitive to the ROH air exchange rate with outdoor air (ROH ACH) for the non-user, but not for the user. This outcome could be explained for the non-user as the rate of air exchange in the ROH is less of a factor in inhalation exposure because initial exposures to the non-user were likely low. For the user, initial exposures were higher and if the user moves to the ROH, the rate of air flow in the ROH could reduce inhalation exposures under some conditions (i.e., high exchange rates).
Figure 2-3 Model Sensitivity Results (Percent Change from Base-case Response) for Peak 1-hr TWA for
Consumer User and Non-user
Figure 2-4 Model Sensitivity Results (Percent Change from Base-case Response)
24-hr TWA for Consumer User and Non-user
Results and Implications of Model Sensitivity Analyses As a result of the model sensitivity analyses, EPA/OPPT concluded that the chosen modeling scenarios should include some variations in each of the three factors (i.e., chemical mass,
Page 43 of 281

location and ROH ACH); with greater model sensitivity, it is more likely a wide range of plausible exposures can be estimated. Description of Exposure Scenarios Inhalation exposures for consumer users and non-users were determined. EPA/OPPT developed seven exposure scenarios for the assessment, as summarized in Table 2-4. The following factors were considered in developing the exposure scenarios:
• The type of application (i.e., brush-on or spray-on), weight fraction of applied product, application rate, surface area of object to be stripped and emission rate of the chemical, which can affect the amount of NMP that ultimately is released to the indoor environment;
• The location where the product is applied, which relates to exposure factors such as the room volume and its air exchange rate with outdoors;
• The house volume and air exchange rate, for reasons similar to those for the product use location; and
• Precautionary behaviors such as opening windows in the application room, the user leaving the application room during the wait period and related changes to the air exchange rates and the proximity of the user to the source of NMP emissions.
Table 2-4 NMP Exposure Scenarios for Characterizing Consumer Inhalation Exposures
Case ID Case Description
Type of Application Location of Product Use Concentration Characterizationa
1 Brush-on Workshop Central tendency
2 Brush-on Workshop User upper-end
3 Brush-on Workshop Non-user upper-end
4 Brush-on Bathroom Upper-end to bounding for user and non-user, constrained by Csat = 1,013 mg/m3
5 Brush-on Bathroom Upper-end to bounding for user and non-user, constrained by Csat = 640 mg/m3
6 Spray-on Workshop User upper-end b
7 Spray-on Workshop Non-user upper-end b
Notes: a Conditions obtained by varying the most sensitive parameters: NMP mass emitted; user location during the
effect or wait period; and the ROH air exchange rate with outdoors. b Scenarios 6 and 7 provide lower (6a & 7a) and upper (6b & 7b) estimates with different NMP volatility parameters;
See Estimation Procedures for Spray Application in section E-1 of Appendix E for a detailed description.
The primary distinctions among the seven cases above are the application method (i.e., brush or spray), location of product application (i.e., workshop versus bathroom), the user’s location during the use or wait period and values used for certain inputs, including the NMP mass emitted and the ROH air exchange rate with outdoors (i.e., central tendency versus upper-end).
Page 44 of 281

Of the five brush-on scenarios listed in Table 2-4, one was considered central tendency for both the user and the non-user, one was developed to estimate upper-end concentrations for the user and one was developed to estimate upper-end concentrations primarily for the non-user. Central-tendency values are exposure values expected to be near the average or median for the range of exposure values; upper-end values are plausible exposure values from the upper end of the range of expected exposure amounts. Scenarios 4 and 5 were developed to estimate NMP concentrations for the user and non-user from use conditions similar to those reported by the Centers for Disease Control and Prevention (CDC) / National Institute of Occupational Safety and Health (NIOSH) for an occupational-exposure case involving brush application of a DCM-containing paint stripper used on a bathtub in a small bathroom (CDC, 2012b). The brush application in a small bathroom scenario represents high product use in a confined (i.e., closed, poorly ventilated) space, and the shape of the bathtub produces a “cloud” of NMP above it (“source cloud”), which contributes to elevated exposures, particularly, the absorption of vapor through the skin and inhalation. Selected parameter values for these scenarios (i.e., large surface area, small room size, minimal ventilation, upper-end weight fraction and low ROH ventilation) would increase concentrations and exposures so that the combinations of parameter values would be expected to result in upper-end to bounding concentrations for the user and non-user; as a result, the concentrations could approach or exceed the vapor saturation concentration for NMP. The only difference between Scenarios 4 and 5 is the assumed saturation concentration. EPA/OPPT developed the two spray-on scenarios listed in Table 2-4 to estimate upper-end concentrations for the user (Scenario 6) and for the non-user (Scenario 7) by setting the consumer behavior pattern inputs (mass of product used, time in room of use, etc.) to high end values. After running the scenarios, the calculated concentrations from scenario 7 were found to be higher than scenario 6 for both the user and non-user. No chamber study data are available for a spray applied NMP product, so a lower emission simulation for the evaporation of the NMP to the room air from a spray applied product used the coefficients from the brush product. However it is likely that a spray product would result in more NMP entering the room air quickly due to the greater surface area of the droplets moving through the air to the application surface. To reflect this effect, the brush-on coefficients were altered to create a simulation of upper emission parameters which assumed more of the NMP mass would volatilize rapidly. Further details of the exposure scenario inputs, including the parameter values for the NMP saturation concentration and the procedures for representing the NMP emission behavior at the saturation concentration, are discussed in Appendix E, section E-3 (Inhalation Exposure Scenario Inputs). Summary of Exposure Scenarios and Model Inputs The exposure scenario inputs are as follows: the stripping method, the amount of NMP released, room of use volume and ventilation characteristics, house volume and ventilation
Page 45 of 281

characteristics, the user location during the wait period and the non-user location. Table 2-5 summarizes the inputs used for all seven scenarios, in which the major and minor differences among the scenarios are shown. For example, Scenarios 2 and 3 (for brush-on products) estimated upper-end exposures for the user and non-user, respectively, by changing the application amount, location of the user during the wait period and airflows between the workshop and the ROH. Similarly, Scenarios 6 and 7 (for spray-on products) estimated upper-end exposures for the user and non-user, respectively.
2.2.2 Model Outputs and Exposure Calculations To account for an individual’s location at specific times, MCCEM provides a detailed time series of zone-specific (i.e., house, workshop and bathroom) and exposure concentrations. This model output is in the form of instantaneous values at the end of consecutive 1-min time intervals for the entire duration of the model run (i.e., 24 hrs). The model is responsive to changes in the location of the user during the 24-hr model run. Appendix E provides a more detailed, mathematical description of the calculations. The MCCEM Inhalation Modeling Case Summaries in section E-5 of Appendix E list both model inputs and results for each of the seven scenarios modeled with MCCEM.
2.2.3 Use of Consumer Exposure Estimates in PBPK Modeling Air concentrations and dermal contact patterns were used as inputs for the PBPK model to calculate measures of internal dose, specifically the peak blood concentration of NMP and the 24-hr area-under-the-concentration-curve (AUC). EPA/OPPT assumed that for consumer exposures, use occurred on a single day and the AUC calculated for the 24 hrs starting with the initiation of use. Consumer Exposure Scenarios For consumer scenarios the predicted air concentrations from the exposure modeling for users and non-users, such as depicted in Figure 2-1 and Figure 2-2 respectively, were inputs to the PBPK modeling software, acslX and used to define the moment-by-moment air concentration inhaled and in contact with unobstructed skin. The liquid weight fractions for dermal contact were as defined in Table 2-5 and dermal contact assumed to occur only during the periods of application, with removal by washing at the end of each application. EPA/OPPT assumed that consumer users did not to wear respirators, but evaluated exposure both with and without gloves, which reduced the exposed area by 90%. The concentration in the liquid on the exposed skin was assumed to be constant for the period of application. The non-user was assumed to be in another room and to have negligible dermal contact.
Page 46 of 281

Table 2-5 NMP Consumer Paint Stripping Scenario Descriptions and Parameters
Case ID Scenario
NMP Released Stripping Method
Room of Use House User Location During Wait Periodb
Non-User Location
Weight Fraction
Surface Area Treateda ft2
Application Rate, g/ft2
Release Fraction
Volume, m3
Ventilation/ ACH, hr-1
Volume, m3
ROH ACH, hr-1
Brush-on Exposure Scenarios in Workshop 1 Central 0.25
(central) 10 Coffee table (central)
108 0.8695 Coffee table: 5-min. application, 30-min. wait and 10-min. scrape per application; process repeated after completion of first scraping. Scrapings removed from house after last scraping.
54 (central)
Open windows / 1.26 (Professional judgment, 90th percentile)
492 (central)
0.45 (central)
ROH ROH (entire time)
2 Upper-end for user 0.5 (upper-end)
Workshop
3 Upper-end for non-user
25 Chest of drawers (upper-end)
Chest: 12.5/ 30/25 min. per application; process repeated after completion of first scraping. Scrapings removed from house after last scraping.
0.18 (low-end)
ROH
Brush-on Exposure Scenario in Bathroom 4 and 5
Upper-end to bounding for user and non-user
0.5 (upper-end)
36 Bathtub (maximum)
108 0.8695 Bathtub: 18-min. application, 30-min. wait and 36-min. scrape per application; process repeated after completion of first scraping. Scrapings removed from house after last scraping.
9c
(low-end) Window closed, no exhaust fan/ 0.18d (low-end)
492 (central)
0.18 (low-end)
ROH ROH (entire time)
Spray-on Exposure Scenarios in Workshop 6a Upper-end for user
(Lower spray volatility) e 0.53 (upper-end)
10 Coffee table (central)
81 0.8695 Coffee table: 2.5-min. application, 30-min. wait and 10-min. scrape per application; process repeated after completion of first scraping. Scrapings removed from house after last scraping.
54 (central)
Open windows / 1.26 (Professional judgment, 90th percentile)
492 (central)
0.45 (central)
Workshop ROH (entire time)
6b Upper-end for user (Upper spray volatility) e
7a Upper-end for non-user (Lower spray volatility) e
0.53 (upper-end)
25 Chest of drawers (upper-end)
Chest: 6.25/ 30/25 min. per application; process repeated after completion of first scraping. Scrapings removed from house after last scraping.
0.18 (low-end)
ROH
7b Upper-end for non-user (Upper spray volatility) e
Notes: aSurface area values were selected so that the calculated amount of product applied (g) corresponds approximately to the Abt (1992) survey results for amount of paint stripper used (50th percentile value of 32 ounces or 1,000 g for the central surface area of 10 ft2 and ~80th percentile value of 80 ounces or 2,500 g for the upper-end surface area of 25 ft2).
bFor all scenarios, the user is in the treatment room during the application and scraping times and in the ROH after the last scraping. c1 m3 for the vicinity of the tub (source cloud) and 8 m3 for the rest of the bathroom. dBecause the user is working in close proximity to the target (bathtub) for an extended period, a third zone (“source cloud”) was created within the bathroom to represent the NMP concentrations in the vicinity of the tub; this is a virtual zone, with no physical boundaries. The airflow rate between the cloud and the rest of the bathroom was based on work by Matthews et al. (1989). (For more information, see discussion in Appendix E under Inhalation Exposure Scenario Inputs (Airflow Rates and Volumes.)
eFor the first exponential, the Upper spray case assigns 10 times the mass of the Lower spray case. The theoretical total mass released is the same for the two cases. See Estimation Procedures for Spray Application in section E-1 of Appendix E for a detailed description.
Page 47 of 281

3 HAZARD IDENTIFICATION AND DOSE-RESPONSE
3.1 APPROACH AND METHODOLOGY Figure 3-1 depicts the process EPA/OPPT used for review and selection of studies for use in the risk assessment. EPA/OPPT reviewed existing assessments for the purpose of hazard identification (3.1.1). Brief summaries for each hazard endpoint are presented in section 3.1.2 with more detailed information about study quality review for study selection provided in Appendix F. Developmental and reproductive toxicity endpoints were evaluated for consistency, sensitivity and relevance (section 3.1.3). Based on this review, EPA/OPPT narrowed the focus to increased fetal resorptions and fetal mortality (section 3.1.3.4). EPA/OPPT then conducted the dose-response assessment for these endpoints (section 3.2), including benchmark dose analysis (section 3.2.1) using rat PBPK model-derived internal doses (section 3.2.2), to select the points of departure (PODs) (sections 3.2.3 and 3.2.4) for use in the risk characterization (section 4).
Figure 3-1 Hazard Identification and Dose-Response Process
3.1.1 Selection of Peer-Reviewed Assessments for Hazard Identification and Dose-Response Analysis
EPA reviewed a number of reports and peer reviewed studies on NMP. EPA/OPPT notes that an Integrated Risk Information System (IRIS) toxicological review is not available for NMP. Toxicological information was obtained from the following peer-reviewed assessments:
• RIVM Proposal for a Restriction of NMP (RIVM, 2013); • OECD SIDS Initial Assessment Report (OECD, 2007); • WHO Concise International Chemical Assessment Document (CICAD) for NMP (WHO,
2001); and
Page 48 of 281

• California Office of Environmental Health Hazard Assessment (OEHHA) Maximum Allowable Dose Levels (MADL) for NMP (OEHHA, 2003).
EPA/OPPT considered these assessments to be reasonably robust, as they were peer reviewed and generally consistent in their conclusions. EPA/OPPT began by reviewing these assessments to identify key endpoints, meaning those endpoints that are relevant, sensitive and found in multiple studies. Once key endpoints were identified, EPA/OPPT collected all publicly available data to refine the hazard identification and complete the dose-response analysis. Additional studies were identified based on public comments and peer review. Appendix F contains information on literature collection, study quality evaluation and summaries of toxicology studies considered in the risk assessment.
3.1.2 Hazard Summary and Hazard Identification A number of adverse effects were observed in different studies, including effects on body weight, liver, kidney, splenic, thymic, and testicular effects and neurotoxicity. Irritation and Sensitization NMP is a skin, eye and possible respiratory irritant (OSHA, 2012; RIVM, 2013; WHO, 2001). Human volunteer chamber studies revealed some discomfort during exposure but are otherwise suggestive of humans being less sensitive to NMP irritation than rodents (RIVM, 2013). NMP is not corrosive. There are limited data to draw conclusions on sensitization; the available studies have significant limitations (RIVM, 2013), but there have been multiple intentional human exposure studies (0) and no reports of sensitization following those exposures. Acute Toxicity The acute toxicity of NMP is considered to be low based on a number of studies including oral, dermal, inhalation, intraperitoneal and intravenous routes of exposure in rats and mice (OSHA, 2012; RIVM, 2013; WHO, 2001). Oral LD50 values ranged from 3605 to 7725 mg/kg bw, dermal LD50 values ranged from 5000 to 7000 mg/kg bw and the 4 hr LC50 was > 5100 mg/m3 (RIVM, 2013). Systemic Effects Systemic effects identified via oral repeat dose testing include body weight reductions, foot splay, alterations in clinical chemistry and blood cell counts, liver and kidney toxicity, neurotoxicity and thymic atrophy, with highly variable NOAELs (OSHA, 2012; RIVM, 2013; WHO, 2001). The RIVM report highlights a 90-day oral repeat dose study in rats with a neurotoxicity screening panel that identified a NOAEL of 169/217 mg/kg bw/day for males and females, respectively, based on decreased body weight, foot splay (males only) and reversible neurotoxic
Page 49 of 281

effects (RIVM, 2013). The results of rabbit 28-day dermal exposure study yielded a NOAEL of 826 mg/kg bw/day, although local irritation was observed at lower doses (OECD, 2007; RIVM, 2013). More severe effects were noted in a whole body inhalation study, compared to two head-nose exposure studies. The whole body study, which likely included dermal contact and oral contact through grooming, identified bone marrow hypoplasia, testicular effects, necrosis of lymphoid tissue in the thymus, spleen and lymph nodes, as well as mortality at the highest dose (RIVM, 2013). The NOAEC was considered to be 500 mg/m3 (OECD, 2007; RIVM, 2013). Mutagenicity and Carcinogenicity NMP is not mutagenic, based on results from multiple bacterial and mammalian in vitro test and in vivo systems and is not considered carcinogenic (OECD, 2007; OEHHA, 2011; RIVM, 2013; WHO, 2001). Neurotoxicity A small number of studies noted effects related to neurotoxicity. Hass et al. (1994) investigated the effects of NMP on postnatal development and behavior in rats. Dams were exposed by whole-body inhalation to measured levels of 151 ppm (612 mg/m3) for six hrs/day from GD 7 to 20. Performance was impaired in certain difficult tasks (i.e., reversal procedure in Morris water maze and operant delayed spatial alternation). Performance appeared to be associated with body weight at weaning. Since only one dose was used, a NOAEL could not be established. In a study by Lee et al. (1987) rats were exposed to 100 and 360 mg/m3 (analytical) of NMP for six hrs/day from GD 6 through 15. In the dams, sporadic lethargy and irregular respiration were observed during the first three days of exposure in both dose groups. These effects were not seen during the remainder of the exposure period or during the 10-day recovery period and thus considered reversible. Reproductive and Developmental Toxicity When observed, reproductive effects were variable in occurrence and dose ranges. Several studies identified some type of testicular effect. Four oral repeat dose studies detected testicular lesions, atrophy or smaller testes with NOAELs ranging from 207 mg/kg bw/day to 1,057 mg/kg bw/day (BASF AG, 1978; Malek et al., 1997; Malley et al., 2001; Sitarek and Stetkiewicz, 2008). Two different 28-day repeat dose studies found testicular lesions and/or degeneration at oral doses > 2000 mg/kg/ bw/day (BASF AG, 1978; Malek et al., 1997). In a study involving pre-mating and mating oral exposures of male rats, cellular depletion of the seminiferous tubule epithelium were recorded at the highest dose, 1000 mg/kg/bw/day (Sitarek and Stetkiewicz, 2008). Two inhalation studies, one a 28-day and the other a 90-day, also identified testicular atrophy (BASF AG, 1994; Lee et al., 1987). The 90-day BASF study had a LOAEC of 1000 mg/m3 bw/day. Whereas the 28-day Lee et al. study identified slight atrophy at 88 mg/m3, the lowest dose tested, and very low incidence of severe atrophy at 1000 mg/m3. As described in Table 3-1 a larger number of studies did not identify testicular effects.
Page 50 of 281
The occurrence of reproductive effects was significantly less frequent or consistent than the occurrence of developmental effects. For example, two oral reproductive studies found reduced fertility or reproductive success; Exxon Biomedical Sciences (1991) reported a NOAEL of 50 mg/kg bw/day based on decreased male fertility and female fecundity and Sitarek et al. (2012) reported a NOAEL of 150 mg/kg bw/day based on decreased percent of pregnant females. A number of studies yielded no effects at the highest dose tested (DuPont, 1990; Exxon Biomedical Sciences, 1992; Lee et al., 1987; NMP Producers Group, 1999a, 1999b; Saillenfait et al., 2002; Saillenfait et al., 2003). The reproductive toxicity findings are more difficult to interpret due to the wide-ranging effect levels and lack of consistency in findings, when looking at the complete database. In contrast, as described below, developmental effects occurred with greater consistence at similar or lower exposures.
Page 51 of 281

Table 3-1 Summary of Studies with Reproductive or Developmental Effects
Species and Strain
Study Type Doses or exposure concentrations
NOAEL or LOAEL for Reproductive Effects and Maternal Body Weight
NOAEL or LOAEL for Developmental Effects
Reference
Oral Studies Rat, SD 2-generation
reproductive 0, 50, 160, 500 mg/kg bw/day Diet, premating through weaning
LOAEL=50 mg/kg bw/day NOAEL= not determined ↓ Male fertilitya, female fecunditya LOAEL= 500 mg/kg bw/day NOAEL= 160 mg/kg bw/day ↓ Maternal body weights
Insufficient data presented to make a determination
Exxon Biomedical Sciences, 1991b
Rat, Wistar
2-generation reproductive
0, 50, 160, 350 mg/kg bw/day in diet. Highest dose was reduced from 500 to 350 mg/kg bw/day due to severe pup mortality Premating, mating, gestation and lactation exposure, with rest period between pregnancies.
NOAEL=350 mg/kg bw/day Highest dose tested Reproductive effects LOAEL=350 mg/kg bw/day NOAEL=160 mg/kg bw/day ↓ Maternal body weight
LOAEL=350 mg/kg bw/day NOAEL=160 mg/kg bw/day ↓ Pup body weights ↑ Pup mortality
NMP Producer’s Group 1999b
Page 52 of 281

Species and Strain
Study Type Doses or exposure concentrations
NOAEL or LOAEL for Reproductive Effects and Maternal Body Weight
NOAEL or LOAEL for Developmental Effects
Reference
Rat, SD 2-generation reproductive
0, 50, 160, 350 mg/kg bw/day in diet. Highest dose was reduced from 500 to 350 mg/kg bw/day due to severe pup mortality Premating, mating, gestation and lactation, exposure with rest period between pregnancies
NOAEL=350 mg/kg bw/day Highest dose tested Reproductive effects Maternal body weights
LOAEL=350 mg/kg bw/day NOAEL=160 mg/kg bw/day ↓ Mean litter size ↓ Pup body weights ↑ Pup mortality
NMP Producer’s Group 1999b
Rat, SD Developmental 0, 40, 125, 400 mg/kg bw/day by oral gavage, gestation day 6-15
NOAEL=400 mg/kg bw/day Highest dose tested Reproductive effects LOAEL=400 mg/kg bw/day NOAEL=125 mg/kg bw/day ↓ Maternal body weight
LOAEL= 400 mg/kg bw/day NOAEL=125 mg/kg bw/day ↓ Fetal BW
Exxon Biomedical Sciences, 1992b
Page 53 of 281

Species and Strain
Study Type Doses or exposure concentrations
NOAEL or LOAEL for Reproductive Effects and Maternal Body Weight
NOAEL or LOAEL for Developmental Effects
Reference
Rat, SD Developmental 0, 125, 250, 500, 750 mg/kg bw/day by oral gavage, gestation day 6-20
NOAEL=750 mg/kg bw/day Highest dose tested Reproductive effects LOAEL=250 mg/kg bw/day NOAEL=125 mg/kg bw/day ↓ Maternal body weight
LOAEL=250 mg/kg bw/day NOAEL=125 mg/kg bw/day ↓ fetal BW
Saillenfait et al., 2002
LOAEL=500 mg/kg bw/day NOAEL=250 mg/kg bw/day ↑ Resorptions/post-implantation loss ↑ Skeletal malformations
Rabbit, New Zealand White
Developmental 0, 55, 175, 540 mg/kg bw/day in aqueous NMP solution, gestation day 6-18
NOAEL= 540 mg/kg bw/day Highest dose tested Reproductive toxicity LOAEL=175 mg/kg bw/day NOAEL=55 mg/kg bw/day ↓ Maternal body weight
LOAEL=540 mg/kg bw/day NOAEL=175 mg/kg bw/day for Developmental toxicity and malformations
IRDC, 1991 b
Rat, Wistar
Male reproduction
0, 100, 300, 1,000 mg/kg bw/day by gavage Males: premating and mating exposures
LOAEL=1,000 mg/kg bw/day NOAEL=300 mg/kg bw/day Cellular depletion of the seminiferous tubule epithelium
LOAEL=300 mg/kgc bw/day NOAEL=100 mg/kg bw/day ↓ Pup survival PND 0-4
Sitarek and Stetkiewicz, 2008
Page 54 of 281
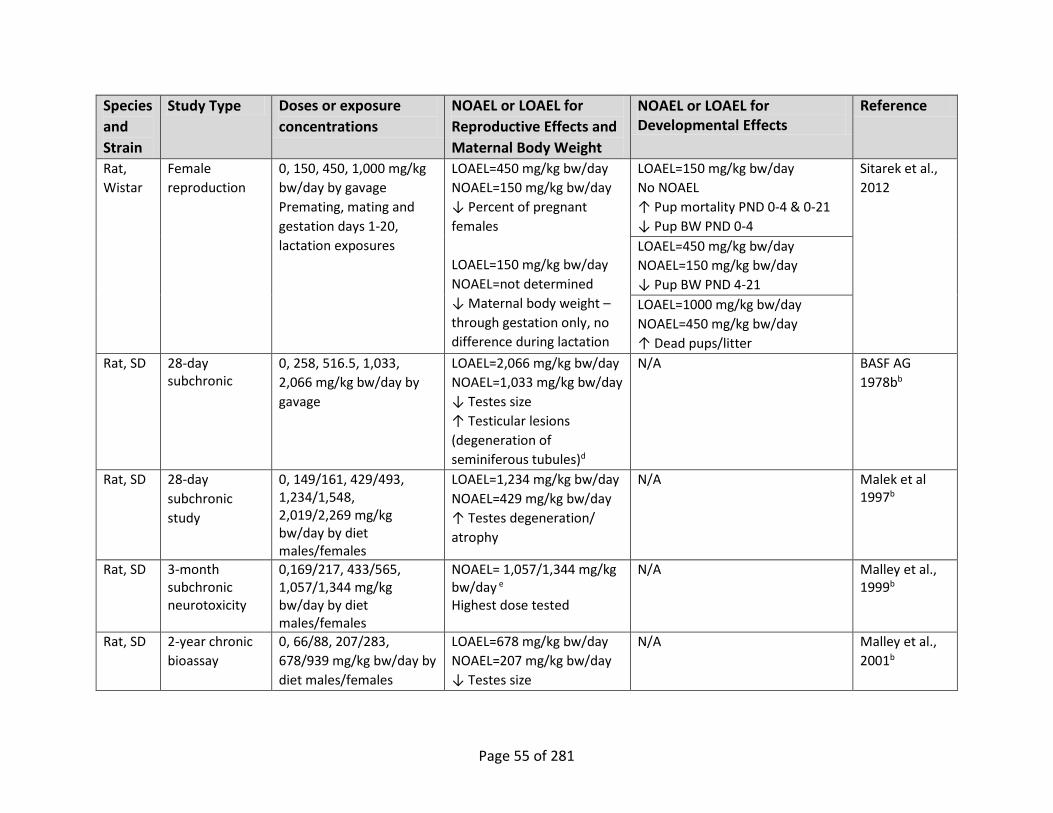
Species and Strain
Study Type Doses or exposure concentrations
NOAEL or LOAEL for Reproductive Effects and Maternal Body Weight
NOAEL or LOAEL for Developmental Effects
Reference
Rat, Wistar
Female reproduction
0, 150, 450, 1,000 mg/kg bw/day by gavage Premating, mating and gestation days 1-20, lactation exposures
LOAEL=450 mg/kg bw/day NOAEL=150 mg/kg bw/day ↓ Percent of pregnant females LOAEL=150 mg/kg bw/day NOAEL=not determined ↓ Maternal body weight – through gestation only, no difference during lactation
LOAEL=150 mg/kg bw/day No NOAEL ↑ Pup mortality PND 0-4 & 0-21 ↓ Pup BW PND 0-4
Sitarek et al., 2012
LOAEL=450 mg/kg bw/day NOAEL=150 mg/kg bw/day ↓ Pup BW PND 4-21 LOAEL=1000 mg/kg bw/day NOAEL=450 mg/kg bw/day ↑ Dead pups/litter
Rat, SD 28-day subchronic
0, 258, 516.5, 1,033, 2,066 mg/kg bw/day by gavage
LOAEL=2,066 mg/kg bw/day NOAEL=1,033 mg/kg bw/day ↓ Testes size ↑ Testicular lesions (degeneration of seminiferous tubules)d
N/A BASF AG 1978bb
Rat, SD 28-day subchronic study
0, 149/161, 429/493, 1,234/1,548, 2,019/2,269 mg/kg bw/day by diet males/females
LOAEL=1,234 mg/kg bw/day NOAEL=429 mg/kg bw/day ↑ Testes degeneration/ atrophy
N/A Malek et al 1997b
Rat, SD 3-month subchronic neurotoxicity
0,169/217, 433/565, 1,057/1,344 mg/kg bw/day by diet males/females
NOAEL= 1,057/1,344 mg/kg bw/day e Highest dose tested
N/A Malley et al., 1999b
Rat, SD 2-year chronic bioassay
0, 66/88, 207/283, 678/939 mg/kg bw/day by diet males/females
LOAEL=678 mg/kg bw/day NOAEL=207 mg/kg bw/day ↓ Testes size
N/A Malley et al., 2001b
Page 55 of 281

Species and Strain
Study Type Doses or exposure concentrations
NOAEL or LOAEL for Reproductive Effects and Maternal Body Weight
NOAEL or LOAEL for Developmental Effects
Reference
Mouse, B6C3F1
28-day subchronic
0, 160, 820, 2500, 3370 mg/kg bw/day by diet
NOAEL = 3370 mg/kg bw/day f
N/A Malek et al., 1997 b
Mouse, B6C3F1
28-day subchronic
0, 229/324, 561/676, 1704/2158 mg/kg bw/day by diet males/females
NOAEL = 2158 mg/kg bw/day g
N/A Malley et al., 1999 b
Inhalation Studies Rat, Charles River CD
Developmental 0, 100, 360 mg/m3 (0, 25, 89 ppm) aerosol for 6 hrs/day on days 6-15 of gestation
NOAEC=360 mg/m3
Highest dose tested Reproductive effects Maternal body weight
NOAEC=360 mg/m3 Highest dose tested
Lee et al., 1987
Rat, SD Reproductive 2-generation
0, 42, 206, 470 mg/m3 (0, 10, 52, 116 ppm) 6 hrs/day, 7 days/week Premating, mating, gestation day 1-20 and postpartum day 21 exposures
NOAEC=470 mg/m3
Highest dose tested Reproductive effects Maternal body weight
LOAEC= 470 mg/m3
Highest dose tested ↓ Pup BW
DuPont 1990
Developmental toxicity
0, 470 mg/m3 (0, 116 ppm) 6 hrs/day, 7 days/week Premating, mating and Gestation day 1-20 exposures
N/A LOAEC=470 mg/m3
Only dose tested ↓ Fetal BW ↑ Incomplete ossificationa ↑ Skeletal malformationsa ↑ Fetal resorptionsa
Rat, Wistar
Developmental toxicity
0, 669 mg/m3 (0, 165 ppm) g hrs/day, Gestation days 4-20
NOAEC=669 mg/m3 ↓Maternal body weight
LOAEC=669 mg/m3 Only dose tested ↑ Preimplantation loss ↓ Fetal BW ↑ Delayed ossification
Hass et al., 1995
Page 56 of 281

Species and Strain
Study Type Doses or exposure concentrations
NOAEL or LOAEL for Reproductive Effects and Maternal Body Weight
NOAEL or LOAEL for Developmental Effects
Reference
Rat, Wistar
Developmental neurotoxicity
0, 612 mg/m3 (0, 151 ppm) 6 hrs/day, Gestation days 6-20
NOAEC=612 mg/m3 Only dose tested Reproductive effects Maternal body weight
LOAEC=612 mg/m3 Highest dose tested ↓ Fetal, pup BW, delayed developmental milestones and difficult tasks
Hass et al., 1994
Rat, SD Developmental 0,122, 243, 487 mg/m3
(0, 30, 60, 120 ppm) 6 hrs/day on gestation day 6-20
NOAEC=487 mg/m3 Highest dose tested Reproductive effects LOAEC=243 mg/m3 NOAEC=122 mg/m3
↓Maternal body weight
LOAEC=487 mg/m3 NOAEC=243 mg/m3 ↓ Fetal BW
Saillenfait et al., 2003
Rat, Charles River CD
28-day subchronic
0, 88, 423, 740 mg/m3 (0, 22, 104, 182 ppm)
LOAEC=88 mg/m3 Lowest dose tested slight testicular atrophya
N/A Lee et al., 1987
Rat, Wistar
28-day subchronic
0, 10, 30, 101 mg/m3 (0, 2.5, 7.4, 25 ppm)
NOAEC=101 mg/m3
Highest dose tested N/A BASF AG,
1993b Rat, Wistar
90-day subchronic
0, 500, 1,000, 3,000 mg/m3 (123, 247, 740 ppm)
LOAEC=3,000 mg/m3 NOAEC=1,000 mg/m3 ↑testes germinal epithelium cellular depletion, testicular atrophy
N/A BASF AG, 1994b
Page 57 of 281

Species and Strain
Study Type Doses or exposure concentrations
NOAEL or LOAEL for Reproductive Effects and Maternal Body Weight
NOAEL or LOAEL for Developmental Effects
Reference
Dermal Studies Rat, SD Developmental 0, 75, 237, 750 mg/kg
bw/day Gestation day 6-15
NOAEL=750 mg/kg bw/day Highest dose tested Reproductive effects LOAEL=750 mg/kg bw/day NOAEL=237 mg/kg bw/day ↓ Maternal body weight
LOAEL=750 mg/kg bw/day NOAEL=237 mg/kg bw/day ↑ Incomplete ossification ↓ Fetal and pup BW ↑ Resorptions ↓ Viable offspring
Becci et al., 1982
Notes: a Considered biologically, but not statistically significant. b As cited in OECD (2007) c Due to internal conflicts in data, this study is considered unreliable. d NOAEL= 258 mg/kg bw/day, LOAEL=516.5 mg/kg bw/day for ↓ BW in males e NOAEL= 169 mg/kg bw/day, LOAEL= 433 mg/kg bw/day for ↓ BW in males f NOAEL= 820 mg/kg bw/day, LOAEL= 2500 mg/kg bw/day for epithelial swelling of distal kidney tubuli g NOAEL= 2500 mg/kg bw/day, LOAEL= 7500 mg/kg bw/dayfor ↓ ALP and centrilobular liver cell hypertrophy (at 3 months after end of dosing) SD = Sprague Dawley PND = postnatal day
Page 58 of 281

Nearly every study that evaluated developmental toxicity identified some type of adverse effect. Moreover, a review of effect levels reveals that the effects are observed within a comparable dose range, with NOAELs typically 100-200 mg/kg bw/day for oral exposure studies and effect levels ranging 479-612 mg/m3 in the inhalation exposure studies. Specifically, EPA/OPPT identified a number of biologically relevant, consistent and sensitive effects that represent a continuum of reproductive and developmental effects, including decreased fetal and pup body weight, delayed ossification, skeletal malformations and increased fetal and pup mortality, for consideration in assessing human health risks. These endpoints are discussed in more detail below in the section 3.1.3. In addition to the laboratory animal studies, there is one case report that is consistent with a hypothesis of NMP fetotoxicity but no cause and effect was established. In this report the fetus of a pregnant woman died in utero at week 31 of pregnancy (Solomon et al., 1996). The worker was exposed throughout pregnancy to NMP by inhalation and dermal exposure but the exposure levels were unknown. The worker’s tasks involved other chemicals, including acetone and methanol, among others. During week 16 of the pregnancy the worker cleaned up a spill of NMP using latex gloves that dissolved in the NMP. She was ill for the next 4 days and experienced malaise, headache, nausea and vomiting. This study provides some evidence that NMP may be fetotoxic. The lack of quantitative exposure data precludes its use in the risk assessment. While NMP was initially prioritized based on reproductive toxicity EPA/OPPT’s subsequent in-depth analysis determined that developmental toxicity was a more appropriate sensitive endpoint for risk assessment purposes. EPA/OPPT assessed developmental toxicity within the context of the exposure pathways and exposure durations identified in the exposure assessment, as summarized in Table 3-2.
Page 59 of 281

Table 3-2 Summary of Exposure Pathways, Toxicity Endpoints and Risk Estimation Approach
Receptors Exposure Pathway and Analytical Approach
Acute Dermal and Inhalation Exposures
Chronic Dermal and Inhalation Exposures
Worker Users and Nearby Worker Non-Users Toxic endpoint: Developmental toxicitya
Risk approach: Margin of Exposure (MOE)
Toxic Endpoint: Developmental toxicity Risk approach: Margin of Exposure (MOE)
Consumer Users and Nearby Residential Non-Users
Chronic risks were not evaluated. This pathway was not expected to occur in consumer users or nearby occupants.
Notes: a Acute dermal and inhalation toxicity studies were not used because they typically measure lethality at high doses and do not provide the level of analysis to assess non-effect levels from single exposures.
3.1.3 Selection of Developmental Toxicity Studies and Endpoints This section identifies the developmental toxicity studies that EPA/OPPT selected for use in the risk assessment. Available data were reviewed to determine test species, test conditions, toxicity endpoints, statistical significance and strengths/limitations of the study, which were summarized and evaluated for study quality (see Appendix F). Guideline studies as well as studies using other protocols were included if they met study quality criteria. The selected studies were then evaluated in the dose-response assessment. The endpoints that were observed in multiple studies, sensitive and biologically relevant, were considered for selecting point of departures (PODs) for dose-response in the risk assessment. These endpoints included:
• Decreased fetal/pup weight, PND 0, 4, 21 • Increased fetal/pup mortality, PND 0, 4, 21 • Skeletal malformations • Incomplete skeletal ossification.
It is not clear if the fetus is the target or if fetal effects are secondary to maternal effects, although there is evidence that NMP can cross the placenta (RIVM, 2013). While maternal body weights or weight gain were decreased in a number of studies, the effect level was similar to that of the fetal effects. Therefore EPA/OPPT considered the fetal effects to be more direct and biologically relevant.
Page 60 of 281
There are a number of rat studies available to assess these endpoints (Table 3-3). Most studies are based on the oral exposure route, although several studies relied on inhalation exposure. A single study was conducted based on dermal exposure. The availability of the PBPK model allows for the conversion of data from different dosing route studies to a single, internal dose metric. Table 3-3 summarizes the endpoints observed in the developmental studies reviewed and illustrates which endpoints are consistent and which are not. Different outcomes may be due to differences in exposure duration, the exposure window, route of exposure or other as yet uncharacterized factors, e.g., dose rate and frequency. EPA/OPPT interpreted the presence of concurrent outcomes across exposure routes, exposure windows and durations as supportive of the robustness of the continuum of developmental toxicity endpoints.
Page 61 of 281

Table 3-3 NMP Studies with Evidence for Developmental Toxicity
Study
Fetal Weight GD 20 - PND 1
Pup Weight PND 4
Pup Weight PND 21
Fetal Mortality (multiple metricsa)
Pup Mortality
PND 4
Pup Mortality PND 21
Incomplete Ossification
Skeletal Malformations
OR
AL
ST
UD
IES
Sitarek et al., 2012
-- ↓ ↓ ↑ ↑ ↑ NA NA Sitarek et al.,
2008 NA NA NA -- ↑ -- NA NA
NMP Producers
Group, 1999a
↓ ↓ ↑ ↑ ↑
NMP Producers
Group, 1999b
↓ ↓ ↑ ↑ ↑
Saillenfait et al., 2002
↓ NA NA ↑ NA NA ↑ ↑ Exxon, 1992 ↓
INH
ALA
TIO
N
ST
UD
IES
Saillenfait et al., 2003
↓ NA NA -- NA NA -- --
Hass et al.,1995
↓ NA NA ↑ NA NA ↑ -- Hass et al.,
1994 ↓ ↓ ↓ -- -- -- NA NA
DuPont, 1990 ↓ ↓ ↓ ↑b -- -- ↑ ↑ Lee et al.,
1987 -- NA -- NA -- --
DE
RM
AL
ST
UD
IES
Becci et al., 1982 ↓ NA NA ↑ NA NA ↑ ↑
Notes: ↓ indicates decrease, ↑ indicates increase, -- indicates no change a May be based on resorptions, post-implantation loss, dead pups at birth or decreased live pups at birth b Statistically significant increase for p = 0.1 NA = Not Assessed Blank = Data not publicly available
Page 62 of 281

3.1.3.1 Decreased Fetal and Postnatal Body Weights Decreased fetal and/or postnatal body weights were consistently observed across studies despite variations in dosing time and exposure routes. The fetal and postnatal body weight effects noted in Table 3-3 were plotted graphically in exposure-response arrays (Figure 3-2). Exposure-response arrays are a graphical representation of available dose-response data for significant effects. Included in the exposure-response arrays are LOAELs and NOAELs, based on applied doses. The graphical display allows the reader to quickly compare the outcomes of a number of studies, based on the same or groups of related endpoints for growth and development. In this case, the exposure –response arrays illustrate that there is a coherence and consistency of these effects – meaning that the effects were present in multiple studies and the NOAELs and LOAELs occurred within a narrow range. As illustrated in Figure 3-2, fetal body weights were decreased with oral (gavage) exposures of 250 mg/kg bw/day (Exxon Biomedical Sciences, 1992) and at 400 mg/kg bw/day (Saillenfait et al., 2002). Sitarek et al. (2012) observed decrements in PND 4 pup body weight at 450 mg/kg bw/day and at PND 4-21 pup body weight at 1000 mg/kg bw/day (Sitarek et al., 2012). In the Sitarek study exposures to dams continued through the post-natal period, therefore the decreased pup body weights may indicate that NMP was transferred to the pup via lactation. Figure 3-3 presents the exposure-response array for the inhalation studies. At inhalation exposure concentrations of 479 to 612 mg/m3, statistically significant decreased body weights at GDs 20 or 21 and PNDs 0 or 1 were observed in multiple studies (DuPont, 1990; Hass et al., 1995; Hass et al., 1994; Saillenfait et al., 2003). Both Saillenfait et al. (2003) and DuPont (1990) observed decrements in fetal body weights at 486 mg/m3 and 479 mg/m3, respectively. Two studies by Hass et al. (1995; 1994) also indicated that fetal body weights were decreased in both Wistar and Sprague- Dawley rats, however only one dose (612 mg/m3) was used in each study. In contrast, no changes in fetal body weight were observed in a study by (Lee et al., 1987). The study by DuPont and the studies by Hass et al. also noted decreased pup body weights (DuPont, 1990; Hass et al., 1995; Hass et al., 1994). In the DuPont study, exposures to dams was suspended from GD 20 through PND 4, yet decreased body weight was not a transient effect, lending support to the consideration that decreased body weight is a persistent, adverse effect. Based on the observations of decreased fetal and postnatal body weights, EPA/OPPT selected decreased fetal body weights as a key endpoint for use in the risk calculation for chronic exposure. These effects were consistent among multiple studies with different dosing regimens and across exposure routes. Reduced fetal body weight is a sensitive endpoint that is considered a marker for fetal growth restriction which is often assumed to be representative of chronic rather than acute exposures (Van Raaij et al., 2003). Decreases in fetal and postnatal body weights occur at similar dose levels. Fetal body weights were assumed to be the proximate event.
Page 63 of 281

Figure 3-2 Studies that Measured Fetal/Pup Body Weight after Oral Exposure of the Dams to NMP with NOAEL and LOAELs Identified
Page 64 of 281
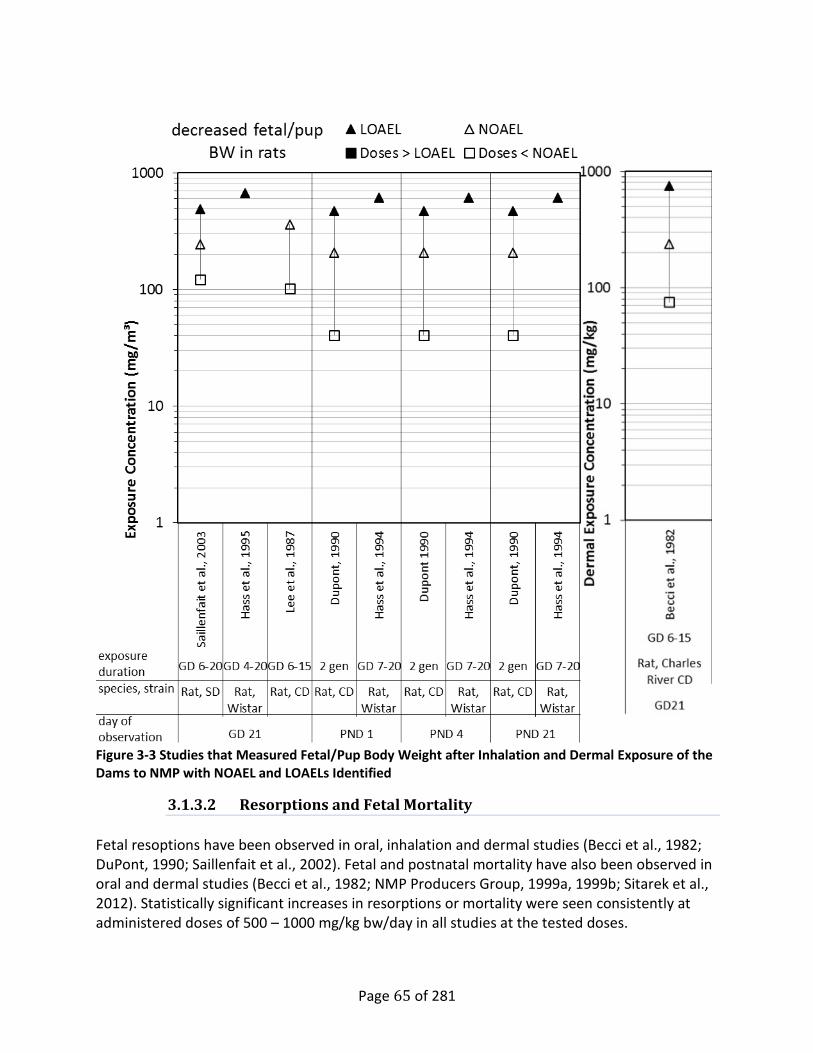
Figure 3-3 Studies that Measured Fetal/Pup Body Weight after Inhalation and Dermal Exposure of the Dams to NMP with NOAEL and LOAELs Identified
3.1.3.2 Resorptions and Fetal Mortality Fetal resoptions have been observed in oral, inhalation and dermal studies (Becci et al., 1982; DuPont, 1990; Saillenfait et al., 2002). Fetal and postnatal mortality have also been observed in oral and dermal studies (Becci et al., 1982; NMP Producers Group, 1999a, 1999b; Sitarek et al., 2012). Statistically significant increases in resorptions or mortality were seen consistently at administered doses of 500 – 1000 mg/kg bw/day in all studies at the tested doses.
Page 65 of 281

In the single dermal study fetal/pup mortality was increased at 750 mg/kg bw/day (Becci et al., 1982). In inhalation studies with exposures up to the air saturating concentration statistically significantly increased resorptions or fetal and postnatal pup mortality were not observed, possibly due to the limited NMP exposure concentration (see TK/PBPK section). Resorptions and mortality can occur as a consequence of single exposures during a sensitive developmental stage and as such, resorptions and fetal and postnatal mortality are a relevant endpoint for acute effects (Van Raaij et al., 2003). EPA/OPPT also considered the relevance of increased postnatal mortality observed in the Sitarek et al. (2012) and NMP Producers Group (NMP Producers Group, 1999a, 1999b) studies. This outcome was not consistently observed in other studies: Sitarek et al. (2012) observed increased pup mortality at 150 mg/kg bw/day, the NMP producers group studies did not see increased pup mortality until 350 mg/kg bw/day and no increase in pup mortality was observed in DuPont (1990). When increased post-natal mortality was observed, the NOAELs were within the same range as other sensitive endpoints, such as reduced fetal body weight (e.g., see Table 3-5). EPA/OPPT selected increased fetal resorptions/fetal mortality as a key endpoint for the calculation of risks associated with acute exposures. Fetal resorptions and mortality, may result from a single exposure at a developmentally critical period (Davis et al., 2009; EPA, 1991b; Van Raaij et al., 2003). In the studies reviewed, increased fetal mortality occurred at relatively low exposures, suggesting that this was a sensitive and relevant endpoint, suitable for use in the risk assessment.
3.1.3.3 Other Fetal Effects Incomplete ossification was observed following exposures to NMP via oral, inhalation and dermal routes. Incomplete ossification is a decrease in the amount of mineralized bone expected for developmental age and is one of the most common findings in developmental toxicity studies (Carney and Kimmel, 2007). Saillenfait et al. (2002) reported statistically significant increases in incidences of incomplete ossification of sternebrae, skull and thoracic vertebral centra at GD 20 for oral doses of 500 and 750 mg/kg bw/day. Hass et al. (1995) reported statistically significant increases in delayed ossification of cervical vertebrae 4 through 7 and digital bones following an inhalation exposure at a concentration of 669 mg/m³. Becci et al. (1982) reported a statistically significant increase in incidences of incomplete ossification of vertebrae at 750 mg/kg bw/day dermal application. On the other hand, increased incidences of incomplete ossification were not observed in inhalation studies (DuPont, 1990; Lee et al., 1987; Saillenfait et al., 2003) The areas of increased incomplete ossification that were observed in fetuses at GD 20 or 21 were in bones that are undergoing rapid ossification during the period of observation, but there are a number of hormones considered to be important for regulating skeletal development (Carney and Kimmel, 2007). There are several clues that may be indicative of effects due to
Page 66 of 281

something other than generalized delay, including: delays in the presence of specific skeletal malformations, teratogenesis or unusual patterns of delayed ossification (Carney and Kimmel, 2007; Van Raaij et al., 2003). Based on these observations EPA/OPPT considered NMP-associated delayed ossification to represent a continuum of effects related to delays in fetal growth and development, associated with decreased fetal and/or pup body weight. Skeletal malformations are considered to be permanent structural changes that are likely to adversely affect the survival or health of the species (Daston and Seed, 2007) and were observed in some NMP studies via oral exposure. The Saillenfait et al. (2002) study reported aggregated skeletal malformations (including ribs, vertebrae and others) at GD 20 for oral doses of 500 and 750 mg/kg bw/day. In contrast, skeletal malformations were not observed in one dermal study and inhalation studies conducted up to the air saturating concentration. Increased skeletal malformations may not have been observed in the inhalation studies because the vapor pressure of NMP limited the attainment of toxic concentration in air.
3.1.3.4 Conclusions and Selection of Key Endpoints Collectively, decreased fetal and postnatal body weight, incomplete ossification, skeletal malformations and fetal and postnatal mortality are biologically relevant endpoints that provide important insight into NMP toxicity and may represent a coherent continuum of possibly related effects. The observed effects, even those from different studies, occur within a narrow range of doses of 100 to 1000 mg/kg bw/day (for oral exposures) or 470 to 669 mg/m³ (for inhalation exposures). In addition, these body weight and mortality effects appeared to persist, based on those studies that carried out the observations to PND 21. EPA/OPPT has selected reduced fetal body weight as the basis of the dose-response analysis for chronic exposures. As documented above, reduced fetal body weight was consistent among multiple studies with different dosing regimens and across exposure routes. Reduced fetal body weight is a sensitive endpoint that is considered a marker for fetal growth restriction which is often assumed to be representative of chronic rather than acute exposures (Van Raaij et al., 2003). A comparison of the NOAEL and LOAELs for repeated and single dose studies across a range of chemicals showed that for fetal body weight the repeat dose NOAELs and LOAELs are 2-4 fold lower than single-dose values (Van Raaij et al., 2003), showing these endpoints are more sensitive to repeated exposures. As such fetal body weight reduction is most applicable to estimating risks for chronic exposures. EPA/OPPT has selected fetal resorptions and fetal mortality as the basis of the dose-response analysis for acute exposures. Acute toxicity studies were not used for the acute POD because the doses at which acute toxic effects or lethality were observed are higher than those that caused toxic effects in developmental studies. Developmental studies involve multiple exposures given on the order of 10-15 days; however, they are relevant to single exposures because some developmental effects, such as fetal resorptions and mortality, may result from a single exposure at a developmentally critical period (Davis et al., 2009; EPA, 1991b; Van Raaij et
Page 67 of 281
al., 2003). In an analysis of the utility of developmental toxicity repeat dose studies for use in the assessment of risks following acute exposures, Van Raaij found that there is a relatively small difference between the NOAEL and LOAELs for resorptions and related mortality events in repeated and single dose studies (Van Raaij et al., 2003). Consequently, EPA/OPPT concluded that these endpoints are most applicable to assessing risks from acute exposures, where the risk of their occurrence is assumed to depend on exceedance of a threshold value for even a single day (i.e., peak concentration) rather than a time weighted average value and the magnitude of the exposure is considered to be more important for these effects under these study conditions.
3.2 DOSE-RESPONSE ASSESSMENT AND STUDY SELECTION EPA/OPPT evaluated data from studies described above (3.1.2) to characterize NMP’s dose-response relationships and select studies to quantify risks for specific exposure scenarios. In order to select the most appropriate key studies for this analysis, EPA/OPPT considered the relative merits of the oral, inhalation and dermal animal studies, with respect to: (1) the availability of primary data for statistical analysis; (2) the robustness of the dose-response analysis; and (3) the exposure levels at which adverse effects were observed. The selected key studies provided the dose-response information for the selection of points of departure (PODs). EPA/OPPT defines a POD as the dose-response point that marks the beginning of a low-dose extrapolation. This point can be the lower bound on the dose for an estimated incidence or a change in response level from a dose-response model (i.e., benchmark dose or BMD), a NOAEL or a lowest-observed-adverse-effect level (LOAEL) for an observed incidence or change in level of response. PODs were adjusted as appropriate to conform to the exposure scenarios derived in section 1.3.
3.2.1 Identification of Studies for BMD Modeling Studies with only one exposure group (Hass et al., 1995; Hass et al., 1994) provide limited information about the shape of the dose-response curve and could not be used for BMD modeling. Given their concordance with other studies that had multiple exposure groups they were still seen as supportive of the dose-response relationship. Studies that did not report a statistically significant effect for the endpoint being considered (Lee et al., 1987) may help with dose metric selection, but provide only limited information about the shape of the dose-response curve and were not included in the dose-response assessment of that endpoint. For reduced fetal body weights EPA/OPPT selected the following studies for dose-response analysis:
• Becci et al., 1982; • DuPont, 1990;
Page 68 of 281
• Saillenfait et al., 2002 and • Saillenfait et al., 2003.
For fetal resorptions and increased fetal mortality EPA/OPPT selected the following studies for dose-response analysis:
• Becci et al., 1982; • Saillenfait et al., 2002; • Saillenfait et al., 2003 and • Sitarek et al, 2012.
The Saillenfait et al. (2002) and Saillenfait et al. (2003) studies administered NMP via different routes but were otherwise similar using the same exposure duration (GD 6-20) and the same strain of rat (Sprague-Dawley), so these studies were combined based on PBPK-derived internal dose metrics to provide additional statistical power for informing the dose-response curve. EPA guidance recommends a hierarchy of approaches for deriving PODs from data in laboratory animals, with the preferred approach being physiologically-based pharmacokinetic modeling (EPA, 2012a). When data were amenable, benchmark dose (BMD) modeling was used in conjunction with the PBPK models to estimate PODs. For the studies for which BMD modeling was not possible (Becci et al., 1982; Sitarek et al., 2012), the NOAEL was used for the POD. Details regarding BMD modeling can be found in Appendix H. Details regarding the PBPK model can be found in Appendix I.
3.2.2 Derivation of Internal Doses This section summarizes the toxicokinetics of NMP, the PBPK model and dose metrics used to estimate internal doses. Toxicokinetic Parameters used in PBPK Modeling NMP is well absorbed following inhalation, oral and dermal exposures (NMP Producers Group, 1995). In rats, NMP is distributed throughout the organism and eliminated mainly by hydroxylation to polar compounds, which are excreted via urine. About 80 percent of the administered dose is excreted as NMP and NMP metabolites within 24 hrs. The major metabolite is 5-hydroxy-N-methyl-2-pyrrolidone (5-HNMP). Studies in humans show that NMP is rapidly biotransformed by hydroxylation to 5-HNMP, which is further oxidized to N-methyl- succinimide (MSI); this intermediate is further hydroxylated to 2-hydroxy-N-methylsuccinimide (2-HMSI). The excreted amounts of NMP metabolites in the urine after inhalation or oral intake represented about 100 and 65 percent of the administered doses, respectively (Akesson and Jönsson, 1997). Dermal absorption of NMP has been extensively studied as it typically poses the greatest potential for human exposure. Dermal penetration through human skin has been shown to be
Page 69 of 281

very rapid and the absorption rate is in the range of 1-2 mg/cm2-hr. These values are 2- to 3-fold lower than those observed in the rat. Prolonged exposures to neat NMP were shown to increase the permeability of the skin. Water reduces the amount of dermal absorption (Payan, 2003) while other organic solvents (e.g., d-limonene) can increase it (HLS, 1998). The dermal penetration of 10 percent NMP in water is 100-fold lower than that of neat NMP, while dilution of NMP with d-limonene can increase the absorption of NMP by as much as 10-fold. The dermal absorption of neat NMP under different occulsion conditions indicated that dermal absorption 1 hr post-exposure was greatest under un-occluded conditions (69 percent), followed by semi-occluded (57 percent) and occluded (50 percent) conditions (OECD, 2007). Dermal uptake of vapor NMP has been reported in toxicokinetic studies in humans. Bader et al. (2008) exposed volunteers for 8 hrs to 80 mg/m3 of NMP. Exposure was whole body or dermal-only (i.e., with a respirator). Excretion of NMP and metabolites was used to estimate absorption under different conditions. The authors found that dermal-only exposures resulted in the excretion of 71 mg NMP equivalents whereas whole-body exposures in resting individuals resulted in the excretion of 169 mg NMP equivalents. Under a moderate workload, the excretion increased to 238 mg NMP equivalents. Thus, the authors estimated that the dermal absorption component of exposure from the air will be in the range of 30 to 42 percent under whole-body exposure conditions to vapor. Previously published PBPK models for NMP in rats and humans (Poet et al., 2010) were adapted for use by EPA. (See Appendix I for details on changes made by EPA and Dr. Torka Poet). The rat version of the model allows for estimation of NMP time-courses in rat blood from inhalation, oral and dermal exposures. The human version of the model, based on non-pregnant and pregnant women, also includes skin compartments for portions of the skin in contact with NMP vapor and liquid and we describe here some of those details because it is an important component of human risk. Analyzing the experimental studies of Akesson et al. (2004), the model yielded an average uptake of 2.1 mg/cm2-hr of neat NMP, but only 0.24 mg/cm2-hr of 50% NMP diluted in water. Therefore distinct values of the liquid permeability constant (PVL), 2.05x10⁻³ cm/h and 4.78x10⁻⁴ cm/h, were identified from the experimental data. The appropriate value of PVL for neat vs. diluted NMP was used in the respective exposure scenarios in this assessment. Absorption also depends on the partition coefficient (PC) skin:liquid equilibrium, PSKL, which was taken to be the skin:saline PC reported by Poet et al. (2010), PSKL = 0.42 [no units] and assumed not to vary with dilution. Predicted dermal uptake from liquid exposure is then a function of the liquid concentration, skin surface exposed and duration of contact. The thickness of the liquid film does not factor directly into the estimate. As a conservative estimate for user scenarios it is assumed that fresh material is constantly depositing over the time of use such that the concentration on the skin remains essentially constant at the formulation concentration. This is in contrast to simulations of experimental studies where the volume placed on the skin at the start of the experiment is
Page 70 of 281

not replenished (Akesson et al., 2004), in which case the model tracks the amount of NMP remaining in the film and hence the changing concentration for absorption from diluted NMP. Penetration from vapor was estimated as part of model calibration using the Bader and van Thriel (2006) inhalation data set. This report does not state how the subjects were dressed but the exposures were conducted between late May and mid-June in Germany, so EPA/OPPT assumed they wore short-sleeved shirts and long pants. While there is no reason to expect that NMP vapors do not penetrate clothing, clothing likely reduces uptake compared to open areas of skin. Since the fitted penetration constant (PV) is multiplied by the skin surface area assumed to be exposed when calculating the penetration rate, these cannot be uniquely determined from the toxicokinetic data. For the purpose of calibration and subsequent modeling, it is assumed that the head, arms and hands are entirely exposed unless personal protection equipment (PPE) is worn. Together the fractional skin area exposed to vapor (SAVC) is 25% of the total skin surface area in the absence of PPE or liquid dermal contact. The skin:air PC, PSKA, was calculated from the measured skin:saline and blood:saline PCs reported by Poet et al. (2010) and the blood:air PC specified in their model code: PSKA = 44.5. With these values of SAVC and PSKA, the average permeation constant for vapor-skin transport was estimated as PV = 16.4 cm/h. These assumptions and the value of PV resulted in a prediction of 20% of a total uptake from air (vapor) exposure via the dermal route. In contrast, Bader et al. (2008) measured 42% of total urinary excretion occurring after only dermal exposure to vapors compared to combined inhalation and dermal exposure under resting conditions. The discrepancy between the Bader et al. (2008) data and the current model predictions could be because the subjects in Bader and van Thriel (2006), on which this model is based, wore long-sleeved shirts, thereby reducing dermal absorption or due to the use of an idealized model of inhalation uptake which could over-predict uptake by that route. For use scenarios in this assessment the air concentration in contact with the skin is assumed to be the same as that available for inhalation with SAVC kept at 25% for consistency, except as specified in the sections below when PPE is worn. Rat Internal Doses for BMD EPA/OPPT modified and validated PBPK models for extrapolating NMP doses across routes of exposure and from animals to humans based on NMP-specific data (See PBPK section, Appendix I). An internal dose metric such as a measure of toxicant concentration in the blood is expected to be a better predictor of response than the applied dose (e.g., concentration in air) since it is closer to the site of the toxic effect (McLanahan et al., 2012). Further, a good internal dose metric should correlate with or be predictive of toxicity irrespective of the route of exposure by which it occurs. However this is only true if the metric is in fact a measure of the likelihood of a toxic response or intensity of a toxic effect. For NMP the existing toxicity data identified the parent (NMP) rather than the metabolites 5-hydroxy-N-methyl-2-pyrrolidone (5-HNMP), N-methylsuccinimide (MSI) or 2-hydroxy-N-methyl-
Page 71 of 281

succinimide (2-HMSI) as the proximate toxicant (Saillenfait et al., 2007). Therefore, PBPK model-derived blood concentrations of NMP were considered a better basis than applied dose for the dose-metric used in extrapolation of health effects. Dose Metrics Selected The selection of the internal dose metric, used to establish “equivalent” exposures, is an important decision in the use of the PBPK model for extrapolation of doses across routes and from rats to humans. Internal dose metric selection is endpoint specific (EPA, 2006). For example, the dose metric area-under-the curve (AUC) of the average blood concentration, is generally considered appropriate for endpoints associated with repeat dose, assuming that a sustained internal dose of NMP is needed to induce the effects. Endpoints that are associated with a single or short term acute exposure, assuming that a single dose effect is needed to induce these effects, are generally best evaluated by a metric that captures peak exposure, such as Cmax. As described above in section 3.1.3.4, the endpoint of decreased fetal body weight was presumed to be a marker of reduced fetal growth resulting from chronic exposure. Therefore decreased fetal body weight is expected to be better represented by the AUC of average blood concentration during the vulnerable period of fetal development. EPA/OPPT evaluated average AUC (total AUC divided by the number of days, starting from the first day of exposure until the day of measurement), e.g., GD6-20 for Becci et al. (1982) or GD5-21 for Saillenfait et al. (2003) with decreased fetal body weights for oral, inhalation and dermal routes of exposure to confirm the metric is consistent in its estimation of a toxic response across routes. Seven studies that measured fetal body weights were used for evaluating consistency between the internal dose and the response expressed as percent change from control in body weight. The data points were fit to a line and the correlation coefficient (R2) was used to evaluate linearity, shown in Figure 3-4. The Average Daily AUC metric had a reasonable correlation with fetal body weight changes. Varying the period of averaging for the daily AUC metric may provide higher correlations with fetal body weights.
Page 72 of 281

Figure 3-4 Analysis of Fit: Average Daily AUC vs Fetal or Postnatal Body Weight
As described in section 3.1.3.4, fetal resorptions and fetal mortality are assumed to be associated with acute exposures during fetal development, but lacking a clear understanding of the possible mode of action, the best dose metric for the evaluation of fetal resorptions and mortality is unclear. Per EPA guidance (EPA, 2006), both AUC and peak blood dose (Cmax) were used to evaluate this endpoint.
3.2.3 PODs for Acute Exposure Acute exposure was defined for workers as a 1, 4, or 8 hour exposure over the course of a single day. For consumer uses, acute exposure was based a single project on a given day for a specified duration, less than 4 hours. EPA/OPPT selected increased resorptions and fetal mortality as the most relevant endpoint for calculating risks associated with acute worker and consumer scenarios. Since the studies used to evaluate resorptions and fetal mortality were repeat dose studies and the mode of action was uncertain, EPA/OPPT assessed dose-response with both the internal dose metric of Cmax and AUC. The Saillenfait et al. (2002); Saillenfait et al. (2003); Becci et al. (1982); and Sitarek et al. (2012) studies were selected for dose-response analysis. The Saillenfait et al. studies measured fetal resorptions and were pooled across exposure routes. The Saillenfait et al. studies also used the
Page 73 of 281

same exposure duration (GD 6-20) and the same strain of rat (Sprague-Dawley). Combining the data sets should provide additional statistical power for identifying the BMDL and provide a more robust dose-response (low to high). Moreover the results for this endpoint were similar, via inhalation and oral exposure routes. Therefore, the combined analysis was retained. A BMR of 1% for increased resorptions/fetal mortality was used to address the relative severity of this endpoint (EPA, 2012a). Table 3-4 summarizes the calculations leading to the determinations of a POD for each of the studies selected for dose-response analysis.
Page 74 of 281
Table 3-4 Summary of Derivation of the PODs for Fetal Resorptions and Fetal Mortality Following Acute Exposure to NMP
Endpoint and reference (exposure duration/route)
Dose Metric Modela BMR
BMD Internal
dose
BMDL Internal
dose
POD
Internal dose
Equivalent administered dose (route)a
Resorptions
Saillenfait et al. 2002 and 2003 (GD 6-20, oral and inhalation)
Cmax (mg/L) Hill 1%
RD 429 216 216 218 mg/kg
bw/day (oral)
AUC (hr mg/L) Power 1%
RD 3343 2128 2128 217 mg/kg
bw/day (oral)
Becci et al., 1982 (GD 6-15, dermal)
NOAEL = 237 mg/kg bw/day 662
237 mg/kg bw/day (dermal)
612 mg/kg bw/day (oral)b
Fetal Mortality
Sitarek et al., 2012 (GD1-PND1, oral)
Cmax (mg/L)
No model
selectedc
1% RD N/A N/A N/A 264 mg/kg
bw/day (oral)
NOAEL = 450 mg/kg bw/day 265
Notes: RD = relative deviation ER = extra risk a Assuming daily oral gavage and initial BW 0.259 kg (i.e. the same experimental conditions as the Saillentfait et al., 2002 study) for the purposes of comparison across the studies. b An oral dose of 612 mg/kg bw/day, given on GD 6-20, is predicted to yield the same peak concentration (662 mg/L). c BMD modeling failed to calculate an adequate BMD or BMDL value by either dose metric (see 0).
EPA/OPPT selected the combined analysis of the Saillenfait et al. (2002) oral study and the Saillenfait et al. (2003) inhalation study for the derivation of the POD, 216 mg/L, to be used in the calculation of risk estimates associated with acute exposure. The combination of the two
Page 75 of 281

Saillenfait et al. studies provides a larger number of dose levels, hence further characterization of the dose-response curve. Moreover, similar results for this endpoint were obtained in these studies which supports combining them. Additionally the Saillenfait et al. studies were amenable to BMD modeling which also accounts for the variability in the observed response. Neither the Becci study nor the Sitarek study were suitable for BMD modeling, hence the NOAEL was used to derive a POD. Accordingly EPA/OPPT selected fetal resorptions from the combined Saillenfait et al. studies for use as the basis for calculating risk for acute NMP exposures. The PODs based on internal dose (AUC and Cmax) were converted to an equivalent applied dose using the PBPK model. The calculated equivalent administered doses are nearly the same as the NOAELs identified in each study demonstrating consistency between the two methods for deriving PODs.
3.2.4 PODs for Chronic Exposure Chronic worker exposure was defined as exposure of 10% or more of a lifetime (EPA, 2011a). Repeated exposures over the course of a work week are anticipated during chronic worker exposure. The most sensitive endpoint was selected based on developmental studies on NMP. These adverse outcomes can arise from exposure during critical windows of development during pregnancy and pregnancy can occur any time during the defined chronic worker exposure period. The derivation of the point of departure based on developmental toxicity considered repeated exposures, and is expected to be protective of pregnant women and women who may become pregnant. Decreased fetal body weight was selected as the endpoint of concern and the Becci et al. (1982), DuPont (1990), Saillenfait et al. (2002), and Saillenfait et al. (2003) studies were selected for dose-response analysis. The PBPK model and BMD modeling were applied to these studies to calculate the BMDLs and PODs. A benchmark response (BMR) of 5% relative deviation for decreased fetal body weight was used because in the absence of knowledge as to what level of response to consider adverse, it has been suggested to consider a 5% change relative to the control mean for developmental endpoints (Kavlock et al., 1995). The results are summarized in Table 3-5. It should be noted that the Saillenfait et al. studies were analyzed separately and combined. Also, the PBPK model was used to present the POD as the equivalent applied oral dose, to allow for comparison.
Page 76 of 281

Table 3-5 Summary of Derivation of the PODs for Decreased Body Weight Following Chronic Exposure to NMP
Endpoint and reference (exposure duration/route) Modela BMR
BMD Internal
dose AUC (hr mg/L)
BMDL Internal
dose AUC (hr mg/L)
POD
Internal dose AUC (hr mg/L)
Equivalent applied oral dosea
Fetal Body Weight
Saillenfait et al. 2002 and 2003 (GD 6-20, oral and inhalation)
Exponential (M5)b
5% RD 1937 1424 1424 152 mg/kg bw/day
Saillenfait et al. 2002 (GD 6-20 oral)
Exponential (M5)
5% RD 1637 1184 1184 129 mg/kg bw/day
Saillenfait et al. 2003 (GD 6-20 inhalation)
Linear 5% RD 652 411 411 48 mg/kg bw/day
DuPont 1990 (pre-conception exposure, GD 1–20, inhalation)
Exponential (M2)
5% RD 315 223 223 27 mg/kg bw/day
Becci et al., 1982 (GD 6-15, dermal)
Polynomial (3°) 5% RD 5341 4018 4018 375 mg/kg bw/day
Notes: RD = relative deviation The POD selected for calculating risk of chronic NMP exposures is highlighted in bold. a Assuming daily oral gavage GDs 6-20 and initial BW 0.259 kg (i.e. the same experimental conditions as the
Saillentfait et al., 2002 study) for the purposes of comparison across the studies. b The Saillenfait et al. 2002 and 2003 studies do not meet the assumption of homogeneity of variance as
recommended for Benchmark Dose Modeling (EPA, 2012a), however the means are well-modeled. EPA/OPPT evaluated the impact on the BMDL of the smallest observed standard deviation for all dose levels, the largest standard deviation and the pooled standard deviation. The BMDLs differed by less than 25% which provides assurance that the impact of the variances on the BMDL was minimal.
Page 77 of 281

EPA/OPPT selected the Saillenfait et al. (2003) inhalation study for the derivation of the POD, (411 hr mg/L) to be used in the calculation of risk estimates associated with chronic exposure. This study yielded results similar to the DuPont (1990) study, had a strong, significant dose-response relationship and was adequately modeled by the BMD model. The combination of the Saillenfait et al. (2002) and Saillenfait et al. (2003) studies routes provided a more extensive characterization of the dose-response curve. However the Saillenfait et al. (2003) study observed a statistically significant decrease in fetal body weights at an internal dose that corresponds to an oral dose lower than the NOAEL in the Saillenfait et al. (2002) oral study. This implies that the rats were more sensitive to inhalation exposures and this was not fully accounted for in the PBPK model. Therefore the combined analysis was not retained. The two inhalation studies, DuPont (1990) and Saillenfait et al. (2003), had similar BMD and BMDLs that are more conservative PODs than exposures via other routes. In addition, both were whole body exposures where dermal absorption of NMP vapors likely contributed to the toxicity, which is similar to human exposure scenarios; however the unknown differences between human and rat dermal absorption of NMP vapor adds uncertainty to values derived from either of these studies alone. While the POD for the DuPont study was lower than the Saillenfait study, the dose-response relationship in the DuPont study was not as robust as the Saillenfait study, which had lower variability in body weights than in the DuPont study, where statistically significant differences only occurred in the lowest and highest dose groups, not the middle dose group. Therefore, EPA/OPPT selected the Saillenfait et al. inhalation study as the basis for the POD. There are limitations to the Becci study: the duration of dosing was shorter than for the Saillenfait studies and it resulted in a higher POD. The uncertainty regarding exposure duration and sampling time leads to uncertainty about recovery and compensation. Therefore, this study was not selected for the POD. The PODs based on internal dose (AUC) were converted to an equivalent applied dose using the PBPK model. The calculated equivalent administered doses are nearly the same as the NOAELs identified in each study demonstrating consistency between the two methods for deriving PODs.
3.2.5 Considerations for Sensitive Subpopulations and Lifestages Certain human subpopulations may be more susceptible to exposure to NMP than others. One basis for this concern is that the enzyme CYP2E1 is partially involved in metabolism of NMP in humans and there are large variations in CYP2E1 expression and functionality in humans (Ligocka et al., 2003). The variability in CYP2E1 in pregnant women could affect how NMP reaches the fetus, which typically does not express CYP2E1 (Hines, 2007). Therefore, the
Page 78 of 281

variability in CYP2E1 was identified as an important uncertainty that was reflected in the calculation of the benchmark MOE (described below in section 4.1.1). Based on a review of studies during hazard identification, the most sensitive endpoint is associated with fetal effects. Therefore the lifestages that are of greatest concern would be pregnant women and women of childbearing age who may become pregnant. In addition there is some evidence that exposures to male rats prior to mating could be a contributing factor to developmental toxicity (DuPont, 1990; Sitarek and Stetkiewicz, 2008). However, neither study was particularly robust; in the DuPont (1990) study, significant decreases in fetal body weight were not observed at every dose level and the Sitarek and Stetkiewicz (2008) study had errors in reporting that decreased confidence in the study. Based on the endpoints and range of doses considered in this risk assessment, consideration that other endpoints like male reproductive endpoints may be less sensitive, EPA/OPPT assumed that exposures that are protective of women of childbearing age and pregnant women will also be protective of other lifestages and subpopulations.
Page 79 of 281
4 HUMAN HEALTH RISK CHARACTERIZATION This assessment determined risk estimates for four categories of individuals: (1) occupational users via dermal contact, vapor-through-skin and inhalation; (2) occupational non-users who are being indirectly exposed (inhalation and vapor-through-skin) through proximity to use, (3) consumer users via dermal contact, vapor-through-skin and inhalation; and (4) consumer non-users who are being indirectly exposed (inhalation and vapor-through-skin) to NMP in paint strippers through proximity to use.
4.1 RISK ESTIMATION APPROACH FOR ACUTE AND CHRONIC EXPOSURES
EPA/OPPT calculated MOEs and compared them to a benchmark MOE to determine if unacceptable risks were present. EPA/OPPT calculated acute or chronic MOEs (MOEacute or MOEchronic) separately based on the POD and estimated exposure (Table 4-1). Table 4-1 Margin of Exposure (MOE) Equation to Estimate Non-Cancer Risks Following Acute or Chronic Exposures to NMP MOE acute or chronic = Non-cancer Hazard value (POD) Human Exposure MOE = Margin of Exposure (unitless) Hazard value (POD) = PBPK derived from toxicological studies (see Table 3-4 and Table 3-5) Human Exposure = Internal dose exposure estimate from occupational or consumer
exposure assessment. The benchmark MOE was used as a threshold to determine the presence or absence of risk and was obtained by multiplying the total uncertainty factors (UFs) associated with each POD. These UFs accounted for (1) the variation in susceptibility among the members of the human population (i.e., inter-individual or intraspecies variability) and (2) the uncertainty in extrapolating animal pharmacodynamic data to humans (i.e., interspecies uncertainty). Table 4-2 explains the selection of UFs and derivation of the benchmark MOE, based on the use scenarios, populations of interest and toxicological endpoints that were used for estimating acute or chronic risks, respectively.
Page 80 of 281

Table 4-2 Use Scenarios, Populations of Interest and Toxicological Endpoints for Assessing Risks to NMP-containing Paint Strippers
Use & Exposure Scenarios Populations And Toxicological Approach
CONSUMER USE ACUTE EXPOSURE
OCCUPATIONAL USE ACUTE AND CHRONIC EXPOSURE
Population of Interest and Exposure Scenario: Users
Women of childbearing age and pregnant women (>16 years old) exposed to NMP, single project.
Women of childbearing age and pregnant women (>16 years old) exposed to NMP during an 8-hr workday a,b
Population of Interest and Exposure Scenario: Nearby Non-User
Women of childbearing age and pregnant women (>16 years old) exposed to NMP while being in the rest of house (ROH) during product use.
Women of childbearing age and pregnant women (>16 years old) indirectly exposed to NMP while being in the same building during product use.
Health Effects of Concern, Concentration and Time Duration
Decreased fetal body weight, Internal dose, chronic exposure Increased fetal resorptions, Internal dose, acute exposure
Uncertainty Factors (UF) used in Benchmark Margin of Exposure (MOE) calculations
UFA accounts for the uncertainties in extrapolating from rodents to humans, comprised of toxicodynamics (TD), toxicokinetic (TK) differences and differences in sensitivity. 3X was used for TD differences between laboratory animals and humans and the differences in sensitivity. Use of the PBPK model accounted for TK differences between laboratory animals and humans. UFH accounts for the variation in sensitivity within the human population. 10X was used to account for human variability. The PBPK model did not account for human pharmacokinetic variability. The majority of the data used for calibrating and evaluating the PBPK model were from healthy males. These data are assumed to represent an average person i.e., the 50th percentile. However there are no data pertaining to differential NMP metabolism based on lifestage. In addition, CYP2E1 is partly involved in the metabolism of NMP in humans. There are large variations in CYP2E1 activity in humans (Ligocka et al., 2003) which supported the retention of the 10X uncertainty factor for human toxicokinetic variability. Benchmark MOE = 30
Notes: a It is assumed that there is no substantial buildup of NMP in the body between exposure events due to NMP’s
short biological half-life (~2.5 hrs).
b EPA/OPPT expects that the users of these products are generally adults, but younger individuals may be users of NMP-based paint strippers.
Because fetal effects were selected as key endpoints, risks were calculated for pregnant women and women of childbearing age who may become pregnant. It was assumed that exposures that do not result in unacceptable risks for these particular lifestages would also be protective of other receptors, including children and adult males. The basis of this is:
• Toxicological effects that may be relevant to children and other adult receptors (i.e., reproductive effects and other systemic toxicity) are expected to occur at higher
Page 81 of 281

exposure concentrations, relative to the fetal effects, based on rodent studies, e.g., an order of magnitude higher.
• EPA/OPPT does not expect exposures of other adult workers (e.g., males) to reach levels that would be associated with reproductive effects or other systemic toxicity.
• Similarly, EPA/OPPT estimated exposures to children who may be nearby the consumer user and found that exposures were below levels of concern for developmental endpoints, and would thus be below levels of concern for other endpoints associated with higher exposure levels.
For example, simulations with the physiological parameters representative of a 1 year old girl in the “rest of house” residential scenarios estimated internal exposures similar to adults. Simulations were run for a 9-kg, 75 cm tall person, approximately the average weight/height for a 1-year-old girl. Air concentrations for the “rest of house” residential scenarios were used as inputs. While children have faster respiration/body weight and higher skin surface area/body weight, once they are metabolically competent that metabolism is also expected to be relatively faster based on allometric scaling. The resulting simulations predict that while peak concentrations in the child would be 22-34% higher than a 74 kg woman, the blood AUC would actually be 0.6 to 2.4% lower than the adult. In addition this estimation of small differences in internal exposures between a child and an adult also suggests that lifestages in the women of child bearing ages (from young women to adults) would have similar internal exposures. In addition, the exposure of residents nearby the consumer users are via inhalation, (with limited dermal contact for nearby workers) whereas dermal exposure is the more important pathway. EPA/OPPT does not expect that exposures of children near to the consumer user to be significantly greater than the exposure of adults near to the consumer user. To assess risks, the MOE estimate was interpreted as a risk of concern if the MOE estimate was less than the benchmark MOE (i.e. the total UF). On the other hand, the MOE estimate indicated negligible concerns for adverse human health effects if the MOE estimate exceeded the benchmark MOE. Typically, the larger the MOE, the more unlikely it is that an adverse effect would occur.
4.1.1 Risk Estimates for Acute Occupational Exposure to NMP Increased fetal resorptions was used as the toxicological endpoint to evaluate the occupational acute exposure scenario. Given that fetal effects are considered most sensitive, the focus for the risk calculations was on women of childbearing age and pregnant women. As described in Table 2-1 and Table 2-2, the selected exposure scenarios represent combined inhalation, dermal and vapor-through-skin exposures with a range of conservative assumptions. The assumptions are then varied, such as use of PPE (respirator and gloves), time spent in contact with NMP and concentration of NMP in the product, to obtain a range of plausible scenarios. The acute exposure scenario was based on a single day’s work.
Page 82 of 281

Table 4-3 and Table 4-4 show the MOE estimates calculated for workers handling NMP-based paint strippers on an acute basis. Table 4-3 summarizes the MOE estimates calculated for acute exposures to NMP-based paint strippers, miscellaneous stripping activities, while Table 4-4 summarizes the results of the risk estimates for graffiti removal. The Margin of Exposure was derived based on the ratio of the PODacute of 216 mg/L (the BMDL for 1% increased fetal resorptions, based on Saillenfait et al. 2002 and Saillenfait et al. 2003, as described in Table 3-4) to the estimated peak exposure (Cmax, mg/L) for the sensitive lifestages. As described in section 4.1, the presence of risk was defined as MOEs below the benchmark MOE of 30. Calculations of risks for the full set of scenarios are provided in the supplemental Excel spreadsheet, Occupational PBPK Results and Risk Estimates.xlsx, located in the public docket (Docket: EPA-HQ-OPPT-2012-0725). There were very small differences in the risk estimates for women of childbearing age and pregnant women. As with the chronic exposure scenarios, since risks were highly influenced by dermal exposure, the small difference in risk estimates is likely due to the relatively small differences in exposed surface area between women of childbearing age and pregnant women on which estimates were calculated. Risks were identified in a number of exposure scenarios. For miscellaneous stripping scenarios (Table 4-3), unacceptable risks were identified for workers in contact with NMP for a total of 8 hrs/day (two 4 hr segments), regardless of whether PPE (gloves or respirator) were used. For workers in contact with NMP for 4 hrs/day, risks could be mitigated with the use of gloves. Further mitigation occurs with use of a respirator, but use of a respirator alone is not sufficient to mitigate the risk. Workers in contact with NMP for 1 hr/day should not experience excess risk. There were no risks to nearby worker non-users. A similar situation is observed for the graffiti removal scenarios (Table 4-4). Unacceptable risks were identified for workers in contact with NMP for a total of 8 hrs/day (two 4 hr segments), regardless of whether PPE (gloves or respirator) were used. For workers in contact with NMP for 4 hrs/day, risks could be mitigated with the use of gloves. Unlike the miscellaneous paint stripping scenarios, respirator use did not appear to provide any significant mitigation because the air concentrations are lower. Workers in contact with NMP for 1 hr/day should not experience excess risk. There were no risks to nearby workers not directly engaged in using NMP.
Page 83 of 281

Table 4-3 Acute Risk Estimates for Occupational Exposures to NMP-Based Paint Strippers - Miscellaneous Stripping Activities
Exposure Scenario PPE Used
Air Concentration
mg/m3a
Exposure, Internal Dose Blood Cmax, mg-hr/L Margin of Exposure (MOE)
Women of Childbearing Age
Pregnant Women
Women of Childbearing Age
Pregnant Women
1) Miscellaneous stripping (assumed mostly indoor) -- low end of parameter range 1 hr/day contact
No respirator, No gloves
8
1.81 1.60 119.5 135.0
With respirator, No gloves 1.75 1.55 123.4 139.6
No respirator, With gloves 0.25 0.23 849.0 951.6
With respirator and gloves 0.20 0.18 1092.8 1233.6
1) Nearby worker non-user NA 0.08 0.07 2619.9 2886.5
2) Miscellaneous stripping (assumed mostly indoor) -- mid-range parameter characterization 4 hr/day contact
No respirator, No gloves
65
16.99 16.03 12.7 13.5
With respirator, No gloves 15.75 14.84 13.7 14.6
No respirator, With gloves 2.97 2.87 72.6 75.3
With respirator and gloves 1.89 1.80 114.2 119.7
2) Nearby worker non-user NA 1.53 1.49 141.4 144.8
3) Miscellaneous stripping (assumed mostly indoor) -- high end of parameter range two 4 hr/day contacts
No respirator, No gloves
64
320.55 294.92 0.7 0.7
With respirator, No gloves 317.44 292.00 0.68 0.74
No respirator, With gloves 21.56 20.79 10.0 10.4
Page 84 of 281

Exposure Scenario PPE Used
Air Concentration
mg/m3a
Exposure, Internal Dose Blood Cmax, mg-hr/L Margin of Exposure (MOE)
Women of Childbearing Age
Pregnant Women
Women of Childbearing Age
Pregnant Women
With respirator and gloves 19.76 19.03 10.93 11.35 3) Nearby worker non-user
NA 1.95 1.95 111.0 111.0
NOTES: a For parameters influencing air concentrations, see Tables 2-1, 2-2 and 2-3 MOEs that are < 30, denoting unacceptable risks are highlighted in bold. NA = Not applicable PPE = Personal protective equipment APF = Assigned Protection Factor; and APF of 10 means that the respirator will reduce the personal breathing concentration by 10-fold (0.1) AUC = Area Under Curve
Table 4-4 Acute Risk Estimates for Occupational Exposures to NMP-Based Paint Strippers – Graffiti Removal
Exposure Scenario PPE Used Air Concentration mg/m3
Exposure, Internal Dose Blood Cmax, mg/L Margin of Exposure (MOE)
Women of Childbearing Age
Pregnant Women
Women of Childbearing Age
Pregnant Women
4) Graffiti removal (assumed mostly outdoor but may include semi-confined spaces) -- low end of parameter range -- 0.25 weight fraction, 445 cm² skin surface area, 1 hr/day contact
No respirator, No gloves
0.24
1.73 1.53 124.9 141.3
With respirator, No gloves 1.73 1.53 125.1 141.5
No respirator, With gloves 0.17 0.15 1238.8 1399.3
With respirator and gloves 0.17 0.15 1251.0 1413.6
4) Nearby worker non-user NA 0.003 0.002 86051.5 94837.9
Page 85 of 281
Exposure Scenario PPE Used Air Concentration mg/m3
Exposure, Internal Dose Blood Cmax, mg/L Margin of Exposure (MOE)
Women of Childbearing Age
Pregnant Women
Women of Childbearing Age
Pregnant Women
5) Graffiti removal (assumed mostly outdoor but may include semi-confined spaces) -- mid-range parameter characterization -- 0.625 weight fraction, 668 cm² skin surface area, 4 hr/day contact
No respirator, No gloves
2.02
15.32 14.44 14.1 15.0
With respirator, No gloves 15.28 14.40 14.1 15.0
No respirator, With gloves 1.47 1.40 147.2 154.4
With respirator and gloves 1.43 1.37 150.6 158.1
5) Nearby worker non-user NA 0.05 0.05 4574.2 4678.4
6) Graffiti removal (assumed mostly outdoor but may include semi-confined spaces) -- high end of parameter range -- 1.0 weight fraction, 890 cm² skin surface area, two 4 hr/day contacts
No respirator, No gloves
4.52
316.59 291.22 0.7 0.7
With respirator, No gloves 316.37 291.01 0.68 0.74
No respirator, With gloves 19.17 18.47 11.3 11.7
With respirator and gloves 19.05 18.34 11.34 11.78
6) Nearby worker non-user NA 0.14 0.14 1579.2 1579.0
NOTES: MOEs that are < 30, denoting unacceptable risks are highlighted in bold. NA = Not applicable PPE = Personal protective equipment APF = Assigned Protection Factor; and APF of 10 means that the respirator will reduce the personal breathing concentration by 10-fold (0.1) AUC = Area Under Curve
Page 86 of 281

4.1.2 Risk Estimates for Acute Consumer Exposure to NMP Increased fetal resorptions was used as the toxicological endpoint to evaluate the consumer acute exposure scenario. Given that fetal effects are considered most sensitive, the focus for the risk calculations was on women of childbearing age and pregnant women. Conservative assumptions were used to evaluate a variety of possible exposure scenarios based on combined inhalation, dermal and vapor-through-skin exposures. The assumptions are then varied, with and without the use of gloves, to obtain a range of plausible exposure scenarios. Table 4-5 summarizes the MOE estimates calculated for acute exposure. The Margin of Exposure was derived based on the ratio of the PODacute of 216 mg/L (the BMDL for 1% increased fetal resorptions, based on Saillenfait et al. 2002 and Saillenfait et al. 2003, as described in Table 3-4) to the estimated peak exposure (Cmax, mg/L) for the sensitive lifestages. As described in section 4.1, the presence of risk was defined as MOEs below the benchmark MOE of 30. Calculations of risks for the full set of scenarios are provided in the supplemental Excel spreadsheet, Consumer PBPK Results and Risk Estimates.xlsx , located in the public docket (Docket: EPA-HQ-OPPT-2012-0725). The results of the risk calculations for all exposure scenarios indicates that one scenario in particular, brush application on a bathtub, in a bathroom, upper-end parameters, with higher air saturation and in the absence of gloves, yields an MOE of 29.5 for woman of childbearing age. EPA/OPPT considers this value to be equivalent to the benchmark MOE of 30, indicating low risk. EPA/OPPT designed this scenario to represent an upper bound exposure scenario based on assumptions from a reported fatality using a DCM-based paint stripper and is thus considered an upper bounding estimate of exposure for surface area treated (and hence mass of product used), volume of room of use and ventilation rate for both the room of use and the entire house. The shape of the bathtub contributed to the production of a “source cloud”, consisting of higher NMP concentrations above the tub. These factors combined to result in the highest airborne concentrations of NMP in the room of use. The only difference between the two scenarios, 4 and 5, is the choice of saturation concentration for the NMP, with the higher saturation concentration leading to larger exposures. The brush on product was used in the bathroom scenario because it was the only product that had measured emission rates (there are no measured emission data for NMP spray products), it is also possible that dermal exposure would be more likely from a brush on product. In general, the proper use of gloves significantly reduces exposures across scenarios, based on higher MOEs. It should be noted that not all gloves provide effective protection against NMP exposure; EPA/OPPT has not independently evaluated glove efficacy, but California recommends the use of gloves made of butyl rubber or laminated polyethylene/EVOH (See California Health Hazard Advisory, available at: http://www.cdph.ca.gov/programs/hesis/Documents/nmp.pdf, accessed 12/18/14.)
Page 87 of 281
Table 4-5 Acute Risk Estimates for Consumer Exposures to NMP-Based Paint Strippers
Exposure Scenario Individual
Peak Blood Exposure Cmax, mg/L Margin of Exposure (MOE)
Women of Childbearing Age
Pregnant Women
Women of Childbearing Age
Pregnant Women
Scenario #1 Brush application in workshop, central parameter values
User without gloves
0.65 0.56 333 388
User with gloves 0.10 0.08 2244 2613
Nearby resident 0.03 0.03 7725 7855
Scenario #2 Brush application in workshop, upper-end values for user
User without gloves
1.36 1.17 159 184
User with gloves 0.26 0.24 836 912
Nearby resident 0.06 0.06 3862 3927
Scenario #3 Brush application in workshop, upper-end values for nearby residents
User without gloves
2.55 2.15 85 101
User with gloves 0.56 0.48 385 447
Nearby resident 0.19 0.19 1134 1141
Scenario #4 Brush application in bathroom, upper-end for user and nearby residents, constrained by Csat = 1,013 mg/m3a
User without gloves
7.32 6.28 29.5b 34.4
User with gloves 4.76 4.12 45.4 52.4 Nearby resident 0.62 0.61 350 352
Scenario #5 Brush application in bathroom, upper-end for user and nearby residents, constrained by Csat = 640 mg/m3a
User without gloves
6.98 5.99 30.9 36.1
User with gloves 4.42 3.84 48.9 56.3 Nearby resident 0.62 0.61 350 352
Scenario #6a User without gloves
0.18 0.17 1203.8 1295.1
Page 88 of 281

Exposure Scenario Individual
Peak Blood Exposure Cmax, mg/L Margin of Exposure (MOE)
Women of Childbearing Age
Pregnant Women
Women of Childbearing Age
Pregnant Women
Spray application in workshop, upper-end values for user
User with gloves 0.17 0.16 1268.4 1354.8
Nearby resident 0.04 0.04 4882 4965
Scenario #6b Spray application in workshop, upper-end values for user
User without gloves
1.55 1.36 139.8 158.5
User with gloves 1.47 1.30 147.1 166.0
Nearby resident 0.35 0.34 619 630
Scenario #7a Spray application in workshop, upper-end values for nearby residents
User without gloves
0.23 0.21 944.6 1029.0
User with gloves 0.24 0.22 897.6 980.8 Nearby resident 0.12 0.12 1802 1832
Scenario #7b Spray application in workshop, upper-end values for nearby residents
User without gloves
1.45 1.36 149.2 159.4
User with gloves 1.38 1.30 156.4 166.5 Nearby resident 0.88 0.86 246 251
NOTES: MOEs that are < 30, denoting unacceptable risks are highlighted in bold. a For scenarios 4 and 5, unrestrained exposure modeling predicts concentrations above the level of saturation,
hence the exposure concentration for these scenarios had to be capped at saturation. For other scenarios predicted concentrations remained below saturation.
b EPA/OPPT considers 29.5 to be equivalent to 30.
Page 89 of 281

4.1.1 Risk Estimates for Chronic Occupational Exposures to NMP The assessment of risks to workers, based on chronic exposures, used decreased fetal body weight as the critical endpoint for the derivation of the POD. As described in Table 2-1 and Table 2-2, the selected exposure scenarios represent combined inhalation, dermal and vapor-through-skin exposures with a range of conservative assumptions. The assumptions are then varied, such as use of PPE (respirator and gloves), time spent in contact with NMP and concentration of NMP in the product, to obtain a range of plausible scenarios. Table 4-6 and Table 4-7 show the MOE estimates calculated for workers handling NMP-based paint strippers on a repeated basis. Table 4-6 summarizes the results of the risk estimates for miscellaneous stripping activities, while Table 4-7 summarizes the results of the risk estimates for graffiti removal. The MOE was derived based on the ratio of the PODchronic of 415 mg-h/L (the BMDL for 5% reduction in fetal body weight, based on Saillenfait et al. (2003), as described in Table 3-5) to the estimated average exposures (AUC ) for the sensitive lifestages. As described in section 4.1, the presence of risk was defined as MOEs below the benchmark MOE of 30. Calculations of risks for the full set of industries and scenarios are provided in the supplemental Excel spreadsheet, Occupational PBPK Results and Risk Estimates.xlsx , located in the public docket (Docket: EPA-HQ-OPPT-2012-0725). There were very small differences in the risk estimates for women of childbearing age and pregnant women. Since risks were highly influenced by dermal exposure, the small difference in risk estimates is likely due to the relatively small differences in exposed surface area between women of childbearing age and pregnant women on which estimates were calculated. Risks were identified in a number of exposure scenarios. For miscellaneous stripping scenarios (Table 4-6), unacceptable risks were identified for workers in contact with NMP for a total of 8 hrs/day (two 4 hr segments), regardless of whether PPE (gloves or respirator) were used. For workers in contact with NMP for 4 hrs/day, risks could be mitigated with the use of gloves. Further mitigation occurs with use of a respirator, but use of a respirator alone is not sufficient to mitigate the risk. Workers in contact with NMP for 1 hr/day should not experience excess risk. There were no risks to nearby worker non-users. A similar situation is observed for the graffiti removal scenarios (Table 4-7). Unacceptable risks were identified for workers in contact with NMP for a total of 8 hrs/day (two 4 hr segments), regardless of whether PPE (gloves or respirator) were used. For workers in contact with NMP for 4 hrs/day, risks could be mitigated with the use of gloves. Unlike the miscellaneous paint stripping scenarios, respirator use did not appear to provide any significant mitigation because the air concentrations are rather low. Workers in contact with NMP for 1 hr/day should not experience excess risk. There were no risks to nearby workers not directly engaged in using NMP.
Page 90 of 281

Table 4-6 Chronic Risk Estimates for Occupational Exposures to NMP-Based Paint Strippers - Miscellaneous Stripping Activities
Exposure Scenario PPE Used
Air Concentration
mg/m3a
Exposure, Internal Dose Blood AUC, mg-hr/L Margin of Exposure (MOE)
Women of Childbearing Age
Pregnant Women
Women of Childbearing Age
Pregnant Women
1) Miscellaneous stripping (assumed mostly indoor) -- low end of parameter range 1 hr/day contact
No respirator, No gloves
8
4.24 4.23 97.0 97.1
With respirator, No gloves 4.09 4.08 100.4 100.7
No respirator, With gloves 0.60 0.61 680.1 676.4
With respirator and gloves 0.46 0.46 892.4 893.2
1) Nearby worker non-user NA 0.20 0.21 2008.6 1968.6
2) Miscellaneous stripping (assumed mostly indoor) -- mid-range parameter characterization 4 hr/day contact
No respirator, No gloves
65
75.55 75.09 5.4 5.5
With respirator, No gloves 69.63 69.08 5.9 5.9
No respirator, With gloves 12.95 13.07 31.7 31.5
With respirator and gloves 8.10 8.10 50.7 50.8
2) Nearby worker non-user NA 6.73 6.87 61.1 59.9
3) Miscellaneous stripping (assumed mostly indoor) -- high end of parameter range two 4 hr/day contacts
No respirator, No gloves
64
4085.28 3969.28 0.1 0.1
With respirator, No gloves 4021.20 3905.60 0.1 0.1
No respirator, With gloves 146.65 145.84 2.8 2.8
Page 91 of 281

Exposure Scenario PPE Used
Air Concentration
mg/m3a
Exposure, Internal Dose Blood AUC, mg-hr/L Margin of Exposure (MOE)
Women of Childbearing Age
Pregnant Women
Women of Childbearing Age
Pregnant Women
With respirator and gloves 133.88 133.87 3.1 3.1 3) Nearby worker non-user
NA 13.35 13.62 30.8 30.2
NOTES: a For parameters influencing air concentrations, see Tables 2-1, 2-2 and 2-3 MOEs that are < 30, denoting unacceptable risks are highlighted in bold. NA = Not applicable PPE = Personal protective equipment APF = Assigned Protection Factor; and APF of 10 means that the respirator will reduce the personal breathing concentration by 10-fold (0.1) AUC = Area Under Curve
Table 4-7 Chronic Risk Estimates for Occupational Exposures to NMP-Based Paint Strippers – Graffiti Removal
Exposure Scenario PPE Used Air Concentration mg/m3
Exposure, Internal Dose Blood AUC, mg-hr/L Margin of Exposure (MOE)
Women of Childbearing Age
Pregnant Women
Women of Childbearing Age
Pregnant Women
4) Graffiti removal (assumed mostly outdoor but may include semi-confined spaces) -- low end of parameter range -- 0.25 weight fraction, 445 cm² skin surface area, 1 hr/day contact
No respirator, No gloves
0.24
4.04 4.03 101.7 102.0
With respirator, No gloves 4.04 4.02 101.8 102.1
No respirator, With gloves 0.41 0.40 1013.6 1015.1
With respirator and gloves 0.40 0.40 1024.5 1026.4
4) Nearby worker non-user NA 0.006 0.006 66048.7 64746.5
Page 92 of 281

Exposure Scenario PPE Used Air Concentration mg/m3
Exposure, Internal Dose Blood AUC, mg-hr/L Margin of Exposure (MOE)
Women of Childbearing Age
Pregnant Women
Women of Childbearing Age
Pregnant Women
5) Graffiti removal (assumed mostly outdoor but may include semi-confined spaces) -- mid-range parameter characterization -- 0.625 weight fraction, 668 cm² skin surface area, 4 hr/day contact
No respirator, No gloves
2.02
67.64 67.11 6.1 6.1
With respirator, No gloves 67.46 66.92 6.1 6.1
No respirator, With gloves 6.27 6.26 65.5 65.6
With respirator and gloves 6.13 6.11 67.1 67.3
5) Nearby worker non-user NA 0.21 0.21 1981.3 1941.8
6) Graffiti removal (assumed mostly outdoor but may include semi-confined spaces) -- high end of parameter range -- 1.0 weight fraction, 890 cm² skin surface area, two 4 hr/day contacts
No respirator, No gloves
4.52
4003.88 3888.80 0.1 0.1
With respirator, No gloves 3999.38 3884.33 0.1 0.1
No respirator, With gloves 129.79 128.82 3.2 3.2
With respirator and gloves 128.91 127.93 3.2 3.2
6) Nearby worker non-user NA 0.94 0.96 438.4 429.7
NOTES: MOEs that are < 30, denoting unacceptable risks are highlighted in bold. NA = Not applicable PPE = Personal protective equipment APF = Assigned Protection Factor; and APF of 10 means that the respirator will reduce the personal breathing concentration by 10-fold (0.1) AUC = Area Under Curve
Page 93 of 281
4.2 HUMAN HEALTH RISK CHARACTERIZATION SUMMARY This risk assessment focused on the occupational and consumer uses of NMP-containing paint strippers. The population of interest consisted of people using NMP-based paint strippers, and those who may be nearby. Dermal and inhalation routes of exposure, including vapor-through-skin, were considered in this risk assessment. As discussed in section 4.1, because the fetal effects are the most sensitive, EPA/OPPT calculated risks for pregnant women and women of childbearing age who may become pregnant. It was assumed that exposures that do not result in unacceptable risks for these particular lifestages would also be protective of other receptors, including children and adult males against other adverse outcomes. EPA/OPPT identified acute and chronic risks for a number of exposure scenarios. The variables that were associated with elevated risks included longer duration of contact time (e.g., 4 or more hours), the NMP content of the product (e.g., > 25%) and not using gloves. EPA/OPPT identified low concern for acute exposures to products formulated with low concentrations of NMP. For example, consumer use of 25% NMP-based paint for 30 minutes does not result in significant risk, nor does worker use of 25% NMP-based paint stripper for one hour. Users of NMP-based paint stripper formulated with 62.5% NMP or higher for 4 hours or more may be at risk, particularly when gloves are not used. Risks to consumers who may use NMP-based paint strippers on multiple projects for 4 hours or more, were not quantified. Based on a qualitative analysis of the outcomes it is possible that exposures of 4 or more hours could present risks comparable to those associated with acute worker exposure scenarios. The use of appropriate gloves can reduce exposures, as demonstrated by higher MOEs achieved when gloves were used. Not all glove types are effective in protecting against NMP exposure. EPA/OPPT did not evaluate glove efficacy, however California recommends the use of gloves made of butyl rubber or laminated polyethylene/EVOH10. The risk assessment found low concern for non-users nearby to either the worker user or consumer user scenarios. EPA/OPPT expects that this risk assessment will be protective of other lifestages and subpopulations for the occupational and consumer scenarios evaluated because it was based on the most sensitive endpoints.
10 See California Health Hazard Advisory, available at: http://www.cdph.ca.gov/programs/hesis/Documents/nmp.pdf (accessed December 18, 2014)
Page 94 of 281
4.3 KEY SOURCES OF UNCERTAINTY AND DATA LIMITATIONS The characterization of variability and uncertainty is fundamental to the risk assessment. Variability refers to “the true heterogeneity or diversity in characteristics among members of a population (i.e., inter-individual variability) or for one individual over time (intra-individual variability)”(EPA, 2001). This risk assessment was designed to reflect critical sources of variability to the extent allowed by available methods and data and given the resources and time available. On the other hand, uncertainty is “the lack of knowledge about specific variables, parameters, models, or other factors” (EPA, 2001) and can be described qualitatively or quantitatively. Uncertainties in the risk assessment can raise or lower the confidence of the risk estimates. In this assessment, the uncertainty analysis also included a discussion of data gaps/limitations. Below is a discussion of the uncertainties and data gaps in the exposure, hazard/dose-response and risk characterization.
4.3.1 Key Uncertainties in the Occupational Exposure Assessment Uncertainties in the occupational exposure assessment arise from the following sources: Dermal Exposure Parameters The dermal exposure parameters (Table 2-1) used in this assessment have uncertainties because no data were found for these parameters and all of their values were based on assumptions. The assumed parameter values with the greater uncertainties are glove effectiveness, durations of contact and skin surface areas for contact with liquids. The assumed values for effectiveness, durations and surface areas may or may not be representative of actual values. The assumed values for human body weight and NMP concentrations in strippers have relatively lower uncertainties. The midpoints of the ranges serve as substitutes for 50th percentiles of the actual distributions and high ends of ranges serve as substitutes for 95th percentiles of the actual distributions. However, these substitutes are uncertain and are weak substitutes for the ideal percentiles. Inhalation Exposure Parameters Limitations of the inhalation exposure data also introduce uncertainties into the exposure summary (Table 2-2). The principal limitation of the exposure data is the uncertainty in the representativeness of the data. EPA/OPPT identified a limited number of exposure studies that provided data on the number of facilities, job sites or residences where NMP was used. These studies primarily focused on single sites. This small sample pool introduces uncertainty into the observed data because it is unclear how representative the data are to all sites and for all workers within the particular end-use application across the US. Differences in work practices
Page 95 of 281
and engineering controls across sites can introduce variability and limit the representativeness of any one site with regard to all sites. The impact of these uncertainties precluded EPA/OPPT from describing actual exposure distributions. The midpoint of the range serves as a substitute for 50th percentile of the actual distributions and high ends of ranges serve as substitutes for 95th percentiles of the actual distributions. However, these substitutes are uncertain and are weak substitutes for the ideal percentiles. Central tendency and high-end exposures may or may not lie within the range of values estimated for this assessment. Number of Exposed Workers EPA/OPPT could not estimate the number of workers exposed to NMP-based stripper as there are no data available. Literature data are available on the use of DCM-based paint strippers and since NMP-based paint strippers are expected to be less common than DCM-based paint strippers, the DCM data provides an upper-limit estimate of possible worker exposures. The comparison of the estimated worker population exposed to DCM-based strippers and the NIOSH National Occupational Exposure Study (NOES) data for NMP give only a rough estimate of this population.
4.3.2 Key Uncertainties in the Consumer Exposure Assessment EPA/OPPT based the consumer dermal exposure scenarios for this assessment on survey data for hand sizes and activity patterns involved in consumer use of paint strippers. The resulting assessments were intended to be upper end to bounding assessments of potential dermal exposures. The consumer inhalation exposure assessment is composed of modeled exposure scenarios whose inputs were based on experimental data, survey information and a number of assumptions with varying degrees of uncertainty. The results were characterized as either plausible estimates of central tendency exposures or upper end bounding exposures. Further discussion of uncertainties as they relate specifically to the dermal and inhalation assessments is provided in the subsections that follow. Dermal Exposure It was assumed that protective gloves were not worn as upper bound of exposures. This assumption was considered relevant because consumers, unlike workers, may not take the necessary precautions (i.e., wearing appropriate gloves) to avoid dermal exposures to irritating compounds like NMP. It is known that consumer do not reliably utilize appropriate personal protective approaches, whether exhaust fans to reduce exposure, only using certain products outside or reading MSDS to look for product warnings (Abt, 1992).
Page 96 of 281

Another case of parameter uncertainty is the surface area of the skin exposed to the product. No studies have been conducted on this value for paint stripping with NMP; thus, the assumed surface area of 50 percent of both hands (central estimate) was based on professional judgment. The EPA (1996) report assumed that the palms and fingers of both hands would be exposed. This was not based on information specific to NMP product use and there is no information on how long a consumer would allow the chemical to remain on the hands. As noted above for the inhalation assessment, there is a high degree of confidence in the weight fractions and product density for the paint stripper products. There also is a high degree of confidence in the chosen surface area and body weight values, which are recommended values in the EFH (EPA, 2011a). Limitations of the Consumer Inhalation Exposure Analysis Due to the absence of indoor air monitoring data from consumer use of NMP, the EPA used modeling based on chamber emissions data to estimate indoor air concentrations resulting from the use of paint strippers. This complex modeling approach of indoor air concentration has a number of limitations. The primary limitation is that the model input for the emissions profile was derived from an older chamber study, introducing uncertainty as to the relevance for current consumer settings where NMP paint strippers may be used. In addition, EPA/OPPT considers the assumptions used for the model exposure scenarios are believed to be reasonable, but may not reflect actual usage patterns or use conditions in consumer settings. Consequently, the limited data and variable results associated with different exposure scenarios, when used to extrapolate to consumer acute inhalation risk characterization, have associated uncertainty. As noted in Appendix E (see Discussion and Conclusions at the end of section E-1), there also is uncertainty in the NMP near real-time sampling results from the chamber tests that provided a basis for estimating an emission profile as one of the MCCEM inputs. EPA (1994b) data were available as a quantitative basis for development of the estimates for the fraction of applied chemical mass that is released to the indoor air (see the Estimation of Emission Profiles for Paint Removers/Strippers in Appendix D), but the number of cases on which the estimates were based was very limited. This data was collected with two measurement techniques, infrared spectroscopy which collected time series data and by gas chromatography using activated charcoal which collected an integrated measure of total mass released over the experiment. Unfortunately information in the study shows that the IR data was miscalibrated and the assessment used the integrated data to post-calibrate the IR data. This assumes that miscalibration resulted in only a scaling error and that the relative magnitude of the measurement was still correct. As discussed in Appendix E another uncertainty is the lack of chamber data for the spray applied product. The emissions profile for the brush applied product was used as a baseline with the assumption that spray application would result in a larger fraction of the applied product aerosolizing during its use. During the use of a spray product a large number of
Page 97 of 281

droplets are propelled toward the use site, as these droplets move through the air, a large amount of surface area is available for an initial burst of evaporation of the solvent to the room air. To capture this effect the brush applied product emission constants were modified to result in a larger initial burst of NMP into the room air, based on professional judgment. The spray application has the same limitations as the brush application, as well as an additional limitation – the NMP volatility estimates may not have accounted for all relevant factors governing NMP emissions and, thus, may have underestimated the magnitude of the maximum emission rates for a spray NMP product. There is a high degree of confidence in the weight fractions and product density for the paint stripper products. These values are based on currently available consumer products, as identified in Brown (2012). However, the products were not weighted for percent of market share. Similarly, there is a high degree of confidence in the values chosen to represent the house volume and air exchange rate, as they were based on scientifically defensible data cited in the EFH. The confidence level is similarly high for the amount of product applied and application rates, with data from surveys cited in the EFH as well as experiments conducted in EPA (1994b). For the paint stripping sequence, the wait time per segment has a high level of confidence because the time was based on what is shown on current product labels. The application and scraping times have a slightly lower confidence level because they were based on the EPA (1994b) study, which is considered to be of high quality but only included a limited number of experiments with limited formulations. The MCCEM inputs for the interzonal airflow rates assumed in the model represent another area of uncertainty. The chosen rates were based on an empirical algorithm, by authors whose report was cited in the EFH. This algorithm is expected to provide a rough approximation of the “average case,” but there are numerous consumer choices that can significantly affect the extent of residential air flow, such as whether to operate a central heating and air conditioning system, if available and whether to close or open doors to certain rooms or areas in the house. However, the sensitivity analysis indicated that the modeling results were relatively insensitive to the value assumed for the interzonal airflow rate. Given such potential variability across paint stripping exposure scenarios not only for airflow rates, but also for factors such as amount of product used, application rates and locations in the house, uncertainties exist in the percentiles of the distribution that are represented by the modeled scenarios. Regarding the brush application on a bathtub in a bathroom scenario, it is uncertain whether a DIY consumer would use practices, based on an occupational scenario, that violate label warnings for ventilation; for this reason, the user characterization is upper-end to bounding. Given the sensitivity of concentrations in the ROH to room-of-use ACH and interzonal air flow, there is also uncertainty about the likelihood that a non-user would be exposed to this scenario’s ROH concentrations and thus the non-user was characterized as upper-end to bounding.
Page 98 of 281
4.3.3 Key Uncertainties in the Hazard and Dose-Response Assessments Varying degrees of uncertainty are associated with the evaluation of adverse health effects in potentially exposed consumer populations to NMP-based paint strippers. Some of the identified sources of uncertainty in the toxicity assessment follow. Uncertainty Regarding Neurotoxicity A small number of studies noted effects related to neurotoxicity; additional studies would be needed to clarify concern for this endpoint. Both Hass et al. (1994) and Lee et al. (1987) identified effects that could be linked to neurotoxicity. Hass investigated the effects of NMP on postnatal development and behavior in rats and found that performance was impaired in certain difficult tasks (i.e., reversal procedure in Morris water maze and operant delayed spatial alternation). Since only one dose was used, a NOAEL could not be established (Hass et al., 1994). Lee exposed rats to 100 and 360 mg/m3 NMP for six hrs/day from GD 6 through 15. The dams initially exhibited sporadic lethargy and irregular respiration, which the study authors considered reversible. A review of intentional human studies (0) did not yield evidence of reportable neurotoxicity, such as headaches or indicators of irritation. It is possible that the concentrations used in the intentional human studies were not sufficiently high to initiate irritation or other neurotoxic effects. Extrapolation of PODs Based on Developmental Toxicity to Chronic Exposures The chronic POD was based on decreased fetal body weight in a developmental toxicity study that exposed rats for 15 days (GDs 5-20), with the assumption that fetal effects are the most sensitive. During pregnancy, working women may be exposed to NMP on a regular basis, continuing over a period of human pregnancy (fetal development) comparable to that of the rat developmental study. To distinguish them from single-day exposures that are more likely for someone using NMP at home (consumers), the cases for work-place NMP use occurring every work-day for weeks or months of time are herein considered “chronic” and the associated risks predicted from the rat developmental studies. Selection of Developmental Toxicity for the Evaluation of Acute Exposure Increased fetal resorptions was selected as an endpoint to evaluate risks associated with acute exposures to NMP. Although the developmental toxicity studies included repeated exposures, EPA/OPPT considered evidence that a single exposure to a toxic substance can result in adverse developmental effects, described by Van Raaij et al. (2003), as relevant to NMP. Although there is clear evidence of biological effects in both the fetus and neonate, there are uncertainties in extrapolating doses for these lifestages. It is not known if NMP or its metabolites are transferred to the pups via lactation. It is possible that the doses reaching the fetus and the neonate are similar and that these lifestages are equally sensitive. But it is also possible that one lifestage is more sensitive than the other or that doses are different.
Page 99 of 281

Additional data would be needed to refine dose estimates for the fetus and pups and to determine if there are specific windows of sensitivity. Protection of Different Lifestages and Subpopulations EPA also is interested in the impact of NMP on other lifestages and subpopulations. Consideration of other lifestages, such as male and non-pregnant female workers in the occupational environment, children in the home environment would require using an alternative POD based on systemic toxicity, instead of using the POD based on developmental toxicity. Other endpoints associated with systemic toxicity generally had higher human equivalent doses than those associated with developmental toxicity. Therefore EPA assumed that margins of exposure for pregnant women would also be protective of other lifestages. While it is anticipated that there may be differential NMP metabolism based on lifestage; currently there are no data available so the impact of this cannot be quantified. Similarly, while it is known that there may be genetic differences that influence CYP2E1 metabolic capacity, there may also be other metabolizing enzymes that are functional. There is insufficient data to quantify these differences for risk assessment purposes. Dermal Absorption Rate of Liquid NMP There is uncertainty in the rate of dermal absorption of liquid NMP. NMP diluted in water has reduced dermal absorption (Keener et al., 2007; Payan, 2003) while NMP diluted in other solvents, such as d-limonene, can increase the absorption of NMP (HLS, 1998) and prolonged exposures to neat (i.e., pure) NMP increases the permeability of the skin (RIVM, 2013). The PBPK model simulates dermal absorption of liquid NMP as a first order process with the rate constant of permeability coefficient (Kp) and the value of Kp was optimized to human data separately for neat NMP and for NMP diluted in water (Akesson et al., 2004). For exposure scenarios with neat NMP the value for Kp was fit to neat NMP was used. For exposure scenarios with diluted NMP the NMP was assumed diluted in water and Kp fit to diluted NMP was used. The effects of prolonged exposures to NMP on permeability were not accounted for in the model because there are not sufficient data to quantify this effect. It is possible that chronic exposures to NMP could be more quickly absorbed and increase the risk. Dermal Uptake Duration Inhalation Exposures The use of a PBPK model made it possible to assess the uptake of vapor through the skin for both the acute or chronic exposure scenarios. The key developmental toxicity study based on the inhalation route, Saillenfait et al. (2003) used whole-body exposures, which would allow the rats to also absorb NMP vapors through their skin. Hence, actual internal doses may have been higher than those predicted by the PBPK model, which was calibrated using nose-only inhalation data. However this uncertainty is health-protective in that higher internal doses in the rat bioassay would lead to higher PODs and hence higher benchmark MOEs.
Page 100 of 281

On the other hand, there is uncertainty as to the extent of exposed skin and hence dermal uptake among various human study populations and scenarios. It is possible that NMP readily penetrates normal clothing, hence that vapor uptake through the skin occurs over most of the body. The modeling assumes that the net uptake by vapor-through-skin penetration in worker and consumer users is the same as in the Bader and van Thriel (2006) study used to calibrate the human model. Specifically it was assumed that the extent to which clothing other than protective gloves or face-masks might reduce vapor uptake did not differ between the Bader and van Thriel (2006) subjects and the workers and consumers for whom risks were assessed. It was assumed that 25% of the total skin surface, corresponding to face, neck, arms and hands, was available for uptake and the effective uptake (penetration) constant (PV) for vapor-through skin was then fitted to the data of Bader and van Thriel (2006). Roughly, net uptake is given by the product of the exposed surface area (SA) and PV: uptake ~ SA x PV. Therefore, if the actual SA was twice as much as assumed, then the fitted PV would have come out to one half of the value obtained here such that SA x PV, hence predicted net uptake, remained the same. To the extent that workers’ and users’ clothing occludes more of the skin surface than the subjects of Bader and van Thriel (2006), their absorption and risk would be reduced, but the contribution of this route is fairly small, so the error is not expected to be large. However the use of protective gloves or face-mask and liquid-dermal contact, were assumed to completely block vapor uptake by the skin areas they occlude. While this correction only had a small impact on the predictions, they were easy to implement and the skin area affected was known. It is possible that a worker or consumer user might wear less clothing; e.g., shorts and a tank-top vs. long pants and a short-sleeved shirt. But given the small contribution of this route and the fact that some clothing penetration probably occurred in the PK study (Bader and van Thriel, 2006), the increased risk from such a difference should be negligible.
4.3.4 Key Uncertainties in the Risk Assessment Extrapolation of Data Due to Intraspecies Variability Heterogeneity among humans is an uncertainty associated with extrapolating the derived PODs to a diverse human population. One component of human variability is toxicokinetic such as variations in CYP2E1 activity in humans (Ligocka et al., 2003) which is partly involved in the metabolism of NMP in humans. EPA evaluated the impact of CYP2E1 and physiological parameters across lifestages for a related chemical, DCM and found the ratio between the 1st percentile and the mean was approximately 2 for the RfD and 3 for the RfC (EPA, 2011b). Given the significant differences between DCM and NMP (e.g. the use of different dose metrics because DCM toxicity is mediated by its metabolite while NMP developmental toxicity is due to NMP) this result is not directly applicable, however it suggests that the default UF for intra-human toxicokinetic variability of 3 may be protective across the human population. Therefore to account for the variation in toxicokinetic variability within the human population the default factor of 3 was used.
Page 101 of 281

EPA did not have the chemical specific data/information on susceptible human populations or on the distribution of susceptibility in the general population to decrease or increase the default intraspecies UFH for toxicodynamic variability of 3. As such, EPA used an intraspecies UFH of 10 for the risk assessment. Extrapolation of Data from Animals to Humans In the derivation of the benchmark MOE, EPA/OPPT applied an uncertainty factor to account for the uncertainties in extrapolating from rodents to humans. In the absence of data, the default UFA of 10 is adopted which breaks down to a factor of 3 for toxicokinetic variability and a factor of 3 for toxicodynamic variability. In this assessment the PBPK model accounted for the interspecies extrapolation using rodent toxicokinetic data to estimate internal doses for a particular dose metric, thus reducing the interspecies toxicokinetic uncertainty to 1. Since the PBPK model did not address interspecies toxicodynamic differences, the total UFA of 3 was retained (EPA, 2011b) Time Scaling for Acute and Chronic PODs The risk associated with NMP exposures was calculated using internal doses from PODs relevant acute or chronic exposures based on studies in rats compared with internal doses from human exposure scenarios. The chronic PODs were the AUC calculated for exposures of 6 hrs/day (Saillenfait et al., 2003). The occupational exposure scenarios calculated internal doses for exposures of varying duration from 1 to 8 hrs/day. Comparing the chronic PODs to occupational exposure scenarios implicitly assumes that the effects are related to concentration × time, independent of the exposure regimen. The differences in exposure durations between the chronic POD and exposure scenarios adds uncertainty to the estimation of risk. For acute occupational and consumer exposures the Cmax was calculated over the single day in which the use occurs; the risk is then estimated by comparing the Cmax to the POD associated with increased fetal resorptions evaluated from the combined data of Saillenfait et al. (2002; 2003). However, the validity of these time extrapolation assumptions is unknown. Repeated Use by Consumers The consumer use scenario considered a single paint stripping project period on a single day with a duration of less than four hrs. It is possible that a subset of consumers may be more frequent users of paint strippers (e.g., hobbyists). Since NMP is rapidly metabolized and excreted, it is considered unlikely that more frequent use (e.g., a repeated project lasting less than four hrs each weekend) will result in risks, given that the single-use scenarios had an adequate MOE, particularly if exposures are limited to less than four hrs per day. In fact, given the half-life (t1/2) is approximately 2 ½ hrs, exposures are effectively independent events unless
Page 102 of 281

multiple projects are undertaken over a very short time. However there is a lack of information regarding frequent use patterns to inform a quantitative assessment.
4.4 RISK ASSESSMENT CONCLUSIONS NMP is used by workers and consumers as a paint stripper. Exposures may occur by the dermal and inhalation routes. For all scenarios, EPA/OPPT based the exposure estimates on combined dermal, inhalation and vapor-through-skin absorption. Exposure values were converted to internal doses using PBPK modeling. EPA/OPPT selected the developmental toxicity endpoints of decreased fetal body weight and increased fetal resorptions/fetal mortality for quantifying dose-response and calculating the PODs, because they were consistent, relevant and sensitive across studies. EPA/OPPT has high confidence in these endpoints, as they were identified in multiple studies, with different exposure routes. EPA/OPPT calculated MOEs by dividing the POD by internal dose exposure estimates. The MOEs were compared to a benchmark MOE of 30. The benchmark MOE value accounted for intra- (10X for humans) and interspecies (3X for rat to human TD) uncertainty. Hence, EPA/OPPT interpreted exposures with MOEs below 30 to present potential risks. Acute exposure was defined as exposure over the course of a single day. EPA/OPPT used two different approaches to evaluate acute exposures. The first approach incorporated assumptions based on occupational exposures of 1, 4, or 8 hours duration, whereas the second approach incorporated assumptions considering consumer use on a single project lasting less than 4 hours. Chronic exposures were defined as exposures comprising 10% or more of a lifetime (EPA, 2011a). Chronic exposures are mostly, but not exclusively, associated with occupational uses. Repeated exposures over the course of a work week, e.g., 5 consecutive days, are anticipated during chronic exposures. Since the most sensitive endpoints were adverse developmental effects, EPA/OPPT recognized that these outcomes can arise from exposure during critical windows of development during pregnancy, that pregnancy can occur any time during a woman’s reproductive years and the exposure can result in persistent chronic adverse effects. Therefore, the derivation of the POD was based on developmental toxicity associated with repeated exposures. This is expected to be protective of pregnant women and women who may become pregnant. EPA/OPPT has moderate confidence in the exposure assessments, which aggregated inhalation, dermal and vapor-through-skin exposure routes. It was not possible to quantify variability among humans.
Page 103 of 281
The actual number of people exposed to NMP in paint strippers is not known. There are no data for the number of people using NMP-based paint stripper that would allow for a reliable estimate of the size of the affected population. However, it is expected that NMP-based paint strippers are less common than DCM-based strippers, so the number of potentially exposed people should be less than the number of people exposed to DCM-based strippers. The number of workers using DCM-based strippers was estimated to be 230,000 (EPA, 2014b); the number of consumers using DCM-based strippers is unknown. Outcome of Risk Assessment The assessment identified risks from acute exposures of:
• Four hours per day, when gloves were not used. • Greater than 4 hours per day, and risks were not mitigated by personal protective
equipment such as respirators or gloves. The assessment identified risks from chronic (repeated) exposures of:
• Four hours per day, when gloves were not used. • Greater than 4 hours per day, and risks were not mitigated by personal protective
equipment such as respirators or gloves. Based on the use scenarios evaluated, there are no expected risks to people not directly engaged in using NMP, regardless of duration of exposure Other hazards, in particular reproductive and other systemic effects, could present risks at higher exposures levels, but exposures that are protective of pregnant women and women who may become pregnant are expected to also be protective of other lifestages and subpopulations. The use of gloves was determined to be effective in reducing modeled estimates of exposure, as demonstrated by the higher MOEs. For chronic exposure, gloves may not provide sufficient protection in all scenarios. More importantly, not all glove types are effective in protecting against NMP exposure. EPA/OPPT did not evaluate glove efficacy, however California recommends the use of gloves made of butyl rubber or laminated polyethylene/EVOH11. Risk Conclusions Although EPA/OPPT did not quantify risks to consumers who may use NMP-based paint strippers on multiple projects with exposure duration equal to or greater than 4 hours, based on analysis of other acute exposure scenarios in this risk assessment it is possible that consumer exposures greater than 4 hours could present risks. An EU report states that there is “probably…no fundamental difference between the application of paint removers by
11 See California Health Hazard Advisory, available at: http://www.cdph.ca.gov/programs/hesis/Documents/nmp.pdf (accessed December 18, 2014)
Page 104 of 281

professional painters and consumers” and goes on to further state that, in regard to the cited consumer exposure studies, “the test situations and data described…are assumed valid for occupational exposure during professional use as well” (TNO, 1999). EPA/OPPT used different methods to quantify occupational and consumer risks in this assessment, so a direct quantitative comparison is not feasible. Table 4-8 presents a qualitative comparison of a subset of different exposure scenarios evaluated in this assessment, illustrating general trends. Duration of use and product concentration are both important drivers of risk. Short term (e.g., 1-2 hours) exposures to products with low concentrations of NMP (e.g., 25% or less) result in no risks. However, the use of higher concentration products that can be readily purchased by both consumers and workers may result in risks. Table 4-8 Spectrum of Exposure and Risks Based on Scenarios Evaluated in This Risk Assessment Based on Women of Childbearing Age, With no PPE in Use.
Exposure Duration 30 Minutes 1 Hour 2 Hours 4 Hours 8 Hours Product Concentration 25% 25% 50% 62.5% 100% Use Scenario # Consumer 1 Worker 1 Consumer 4 Worker 2 Worker 3 User Population Consumer Worker Consumer Worker Worker Acute Exposure Risks MOE to:
User 333 119.5 29.5 2.7 0.7 Nearby Non-user
7752 2619.9 350 141.4 111.0
Based on this qualitative analysis, it appears that consumers could engage in a pattern of use that is comparable to worker exposures that present risk. Therefore, EPA/OPPT considers there to be risks to both workers and consumers associated with acute exposures to NMP-based paint strippers of four hours or more. The scenarios examined included both spray on and brush on application methods, with and without glove use. The use of gloves was determined to be effective in reducing modeled estimates of exposure, as demonstrated by the higher MOEs. Not all glove types are effective in protecting against NMP exposure. EPA/OPPT did not evaluate glove efficacy, however California recommends the use of gloves made of butyl rubber or laminated polyethylene/EVOH12. For both occupational and consumer exposure scenarios, EPA/OPPT focused this risk assessment on developmental toxicity endpoints. As discussed in section 3.1.2, there are a number of hazard concerns other than developmental toxicity associated with NMP exposures; in particular, testicular toxicity stood out, with a number of studies, but not all, indicating an association with NMP exposure. The evidence indicates that these effects were associated with higher doses than those associated with decreased fetal body weight. EPA/OPPT assumed that exposures below those that present risks to workers and consumer would also be protective against other hazard endpoints for all subpopulations and lifestages.
12 See California Health Hazard Advisory, available at: http://www.cdph.ca.gov/programs/hesis/Documents/nmp.pdf (accessed 12/18/14)
Page 105 of 281

REFERENCES Abbas, A. (About.com). 2012. Standard Furniture Measurements.
http://furniture.about.com/od/furnishingdesignresources/a/measurements.htm (accessed on October 31, 2012).
Abt. 1992. Methylene chloride consumer products use survey findings. Prepared by Abt
Associates, Inc., for the U.S. Consumer Product Safety Commission, Bethesda, MD. AIHA. 2013. Workplace Environmental Exposure Limit (WEEL). WEEL® Values 2011. American
Industrial Hygiene Association Guideline Foundation. https://www.aiha.org/get-involved/AIHAGuidelineFoundation/WEELs/Documents/2011WEELValues.pdf (accessed on August 20, 2012).
Akesson, B., M. A. Carnerup, and B. A. G. Jönsson. 2004. Evaluation of Exposure Biomarkers
from Percutaneous Absorption of N-Methyl-2-Pyrrolidone. Scandinavian Journal of Work, Environment & Health, 30, 306-312.
Akesson, B., and B. A. G. Jönsson. 1997. Major Metabolic Pathway for N-Methyl-2-Pyrrolidone in
Humans. Drug Metabolism and Disposition, 25, 267-269. Akesson, B., and K. Paulsson. 1997. Experimental Exposure of Male Volunteers to N-Methyl-2-
Pyrrolidone (NMP): Acute Effects and Pharmacokinetics of NMP in Plasma and Urine. Journal of Occupational and Environmental Medicine, 54(4), 236-240.
American Unfinished Furniture (CaliberCommerce). 2012. Summit Bedroom Collection. Item
3702w. http://www.furnitureunfinished.com/product_info.php?products_id=1093 (August 8, 2012).
Anundi, H., S. Langworth, G. Johanson, M. L. Lind, B. Akesson, L. Friis, N. Itkes, E. Soderman, B.
Jonsson, and C. Edling. 2000. Air and Biological Monitoring of Solvent Exposure During Graffiti Removal. International Archives of Occupational and Environmental Health, 73(8), 561-569.
Anundi, H., M. Lind, L. Friis, N. Itkes, S. Langworth, and C. Edling. 1993. High Exposures to
Organic Solvents among Graffiti Removers. International Archives of Occupational and Environmental Health, 65(4), 247-251.
Ash, M., and I. Ash (Editors). 2009. Specialty Chemicals Source Book. Volume 2 (4th ed.).
Endicott, NY: Synapse Information Resources, Inc.
Page 106 of 281

ASTM (ASTM International). 1997. Standard Practice for Estimation of Short-Term Inhalation Exposure to Volatile Organic Chemicals Emitted from Bedding Sets. Designation: D 6178-97 (Reapproved 2008). West Conshohocken, PA.
Bader, M., S. Keener, and R. Wrbitzky. 2005. Dermal Absorption and Urinary Elimination of N-
Methyl-2-Pyrrolidone. International Archives of Occupational and Environmental Health, 78, 673-676.
Bader, M., and C. van Thriel. 2006. Human Volunteer Study on Biomarkers of N-Methyl-2-
Pyrrolidone (NMP) after Inhalational Exposure. Hannover Medical School and University of Dortmund, Institute of occupational Physiology, Hannover and Dortmund, Germany.
Bader, M., R. Wrbitzky, M. Blaszkewicz, M. Schaper, and C. van Thriel. 2008. Human Volunteer
Study on the Inhalational and Dermal Absorption of N-Methyl-2-Pyrrolidone (NMP) from the Vapour Phase. Archives of Toxicology, 82(1), 13-20.
BASF AG. 1978. Unpublished Study (Xxv/436), 22 May 1978. Department of Toxicology. (as cited
in OECD, 2007). BASF AG. 1988. Unpublished Research (1035/88). Labor Oekologie,. (as cited in Verschuren,
2009). BASF AG. 1989. Unpublished Results, Project No. 36i0794/87088, 03 Jan 1989. Department of
Toxicology (as cited in OECD, 2007). BASF AG. 1992. Unpublished Results, Project No. 36i0794/87088, 21 Apr 1992. Department of
Toxicology. (as cited in OECD, 2007). BASF AG. 1994. Unpublished Results, Project No. 50i0544/90061, 04 Jan 1994. Department of
Toxicology. (as cited in OECD, 2007). BASF AG. 1995a. Unpublished Results, N-Methylpyrrolidone: Synopsis of Project Nos.
36i0587/89023, /89042, /89044, /89045, /89054, /89069, /89070, and Supplement Report (Techn. Part), 19 May 1995. Department of Toxicology (as cited in OECD, 2007).
BASF AG. 1995b. Unpublished Results, Project No. 36i0587/89045, 19 May 1995. Department of
Toxicology. (as cited in OECD, 2007). BASF AG. 1995c. Unpublished Results, Project No. 36i05876/89023, 19 May 1995. Department
of Toxicology (as cited in OECD, 2007). BASF AG. 2001. Unpublished Study, Project No. 00/0969/51/125, Jul 2001. Experimental
Toxicology and Ecology (as cited in OECD, 2007).
Page 107 of 281

Becci, P., M. Knickerbocker, R. Parent, and L. Burnette. 1981. Teratogenic Evaluation of N-Methylpyrrolidone in Sprague-Dawley Rats. Toxicologist, 1, 29-30.
Becci, P., M. Knickerbocker, E. Reagan, R. Parent, and L. Burnette. 1982. Teratogenicity Study of
N-Methylpyrrolidone after Dermal Application to Sprague-Dawley Rats. Fundamental and Applied Toxicology, 2(2), 73-76.
Brown, J. (US Environmental Protection Agency). 2012. Formulations Spreadsheet File Personal
communication with Conrad Flessner, Washington, DC. Cal EPA (California Environmental Protection Agency). 2006. Methylene Chloride Consumer
Product Paint Strippers: Low-VOC, Low Toxicity Alternatives. http://www.irta.us/Methylene%20Chloride%20Consumer%20Product%20Paint%20Strippers%20REPORT%20ONLY.pdf (accessed on August 7, 2012).
Carney, E., and C. Kimmel. 2007. Interpretation of Skeletal Variations for Human Risk
Assessment: Delayed Ossification and Wavy Ribs. Birth Defects Research (Part B), 80, 473-496.
CDC. 2012a. Fatal Exposure to Methylene Chloride among Bathtub Refinishers -- United States,
2000-2011. Mobidity and Mortality Weekly Report, 61(7), 119-122. CDC (Centers for Disease Control and Prevention). 2012b. Tub Refinisher Died Due to Methylene
Chloride Overexposure While Stripping a Bathtub. Michigan Case Report: 10m1013. http://www.cdc.gov/niosh/face/stateface/mi/10MI013.html (accessed on August 1, 2012).
Chen, Q., and W. Xu. 1998. A Zero-Equation Turbulence Model for Indoor Airflow Simulation.
Energy and Buildings, 28, 137-144. Cheng, K.-C., V. Acevedo-Bolton, R.-T. Jiang, N. Klepeis, W. Ott, O. Fringer, and L. Hildemann.
2011. Modeling Exposure Close to Air Pollution Sources in Naturally Ventilated Residences: Association of Turbulent Diffusion Coefficient with Air Change Rates. ENVIRONMENTAL SCIENCE & TECHNOLOGY, 45, 4016-4022.
Cherrie, J. W. 1999. The Effect of Room Size and General Ventilation on the Relationship
between near and Far-Field Concentrations. Applied Occupational and Environmental Hygiene, 14(8), 539-546.
Daston, G. P., and J. Seed. 2007. Skeletal Malformations and Variations in Developmental
Toxicity Studies: Interpretation Issues for Human Risk Assessment. Birth Defects Res (Part B), 80, 421-424.
Page 108 of 281

Davis, A., J. S. Gift, G. M. Woodall, M. G. Narotsky, and G. L. Foureman. 2009. The Role of Developmental Toxicity Studies in Acute Exposure Assessments: Analysis of Single-Day Vs. Multiple-Day Exposure Regimens. Regulatory Toxicology and Pharmacology, 54(2), 134-142.
DuPont (EI du Pont de Nemours and Company,). 1990. 1-Methyl-2-Pyrrolidinone (NMP):
Reproductive and Developmental Toxicity in the Rat. HLR 294-90. Medical Research Project 3872-001/HLR 294-90, unpublished data, 05 Oct 1990.
DuPont (EI Dupont de Nemours and Co.). 1992. Initial Submission: Teratologic Dose Range-
Finding Study with N-Methylpyrrolidone in Sprague Dawley Rats with Cover Letter Dated 09/01/92. Study conducted by Authors of the Study (Required field. Type "author's last name, first name initials". OTS0555033.
EC (European Commission). 2000. Iuclid Dataset. 1-Methyl-2-Pyrrolidone. EC (European Commission). 2004. Effectiveness of Vapour Retardants in Reducing Risks to
Human Health from Paint Strippers Containing Dichloromethane. Final Report. http://ec.europa.eu/enterprise/sectors/chemicals/files/studies/etvaread-paint_stripper_dcm_en.pdf (accessed on October 24, 2012).
EC (European Commission). 2007. Impact Assessment of Potential Restrictions on the Marketing
and Use of Dichloromethane in Paint Strippers. Final Report. http://ec.europa.eu/enterprise/sectors/chemicals/files/markrestr/j549_dcm_final_report_en.pdf.
ECHA (European Chemicals Agency). 2011. Annex XV Dossier. Proposal for Identification of a
Substance as a Category 1a or 1b CMR, PBT, Vpvb or a Substance of an Equivalent Level of Concern, 1-Methyl-2-Pyrrolidone. Helsinki, Finland.
ECHA (European Chemicals Agency). 2014. Opinion on an Annex XV Dossier Proposing
Restrictions on -Methyl-2-Pyrrolidone. ECHA/RAC/RES-O-0000005316-76-01/F. Committee for Risk Assessment (RAC).
Enander, R. T., H. J. Cohen, D. M. Gute, L. C. Brown, A. M. Desmaris, and R. Missaghian. 2004.
Lead and Methylene Chloride Exposures among Automotive Repair Technicians. Journal of Occupational Environmental Hygiene, 1(3), 119-125.
EPA. 1990. N-Methylpyrrolidone; Proposed Test Rule. Federal Register, 55(60), 11398-11487. EPA (US Environmental Protection Agency). 1991a. Chemical Engineering Branch Manual for the
Preparation of Engineering Assessments. Volume I. Ceb Engineering Manual. Office of Pollution Protection and Toxics, Washington, DC.
Page 109 of 281

EPA (US Environmental Protection Agency). 1991b. Guidelines for Developmental Toxicity Risk Assessment. EPA/600/FR-91/001. Risk Assessment Forum, Washington, DC. http://www.epa.gov/raf/publications/pdfs/DEVTOX.pdf.
EPA (US Environmental Protection Agency). 1992. Guidelines for Exposure Assessment.
Washington, DC. http://ofmpub.epa.gov/eims/eimscomm.getfile?p_download_id=429103 (August 7, 2012).
EPA (US Environmental Protection Agency). 1994a. Consumer Exposure to Paint Stripper
Solvents. EPA Contract No 68-DO-0137. MRI, Washington, DC. EPA (US Environmental Protection Agency). 1994b. Consumer Exposure to Paint Stripper
Solvents. Washington, DC. EPA (US Environmental Protection Agency. National Center for Environmental Assessment).
1995. Estimation of Distributions for Residential Air Exchange Rates. EPA600R95180. EPA (US Environmental Protection Agency). 1996. Consumer/Small Shop Paint Stripping Use
Cluster. Ar-161. Risk Management Report. Public Comment Draft. Washington, DC. EPA (US Environmental Protection Agency). 1997. Use of Small-Chamber Data to Estimate and
Model Chemical Emissions from Latex and Alkyd Paints. IE-2812. Washington, DC. EPA. 1999a. Category for Persistent, Bioaccumulative, and Toxic New Chemical Substances.
Federal Register, 64(213), 60194-60204. EPA (US Environmental Protection Agency). 1999b. Category for Persistent, Bioaccumulative,
and Toxic New Chemical Substances. 64 Federal Register 213, pp. 60194-60204. EPA (U.S. Environmental Protection Agency). 2001. Risk Assessment Guidance for Superfund:
Volume 3 - Part a, Process for Conducting Probabilistic Risk Assessment. EPA/540-R-02-002. Office of Emergency and Remedial Response, Washington, DC. http://www.epa.gov/oswer/riskassessment/rags3adt/.
EPA (US Environmental Protection Agency). 2006. Approaches for the Application of
Physiologically Based Pharmacokinetic (PBPK) Models and Supporting Data in Risk Assessment. EPA/600/R-05/043F. National Center for Environmental Assessment, Office of Research and Development, Washington, DC.
EPA (US Environmental Protection Agency). 2007. Technical Support Document for Proposed
Rule: National Emission Standards for Hazardous Air Pollutants: Paint Stripping Operations at Area Sources. OAQPS/Sector Policies and Programs Divsion, Research Triangle Park, NC. http://www.epa.gov/airtoxics/6h/tsd.pdf.
Page 110 of 281

EPA (US Environmental Protection Agency). 2009. Methodology for Risk-Based Prioritization
under ChAMP. Office of Pollution Prevention and Toxics, Washington, DC. EPA (US Environmental Protection Agency). 2010. Multi-Chamber Concentration and Exposure
Model (Mccem) Version 1.2. http://www.epa.gov/oppt/exposure/pubs/mccem.htm (accessed on October 31, 2012).
EPA (US Environmental Protection Agency). 2011a. Exposure Factors Handbook: 2011 Edition.
National Center for Environmental Assessment, Washington, DC. http://www.epa.gov/ncea/efh/pdfs/efh-complete.pdf.
EPA (US Environmental Protection Agency). 2011b. Toxicological Review of Dichloromethane
(Methylene Chloride; CAS No. 75-09-2). EPA/635/R-10/003F. Integrated Risk Information System, Office of Research and Development, Washington, DC. http://www.epa.gov/iris/toxreviews/0070tr.pdf.
EPA (US Environmental Protection Agency). 2012a. Benchmark Dose Technical Guidance.
EPA/100/R-12/001. Risk Assessment Forum, Washington, DC. http://www.epa.gov/raf/publications/pdfs/benchmark_dose_guidance.pdf.
EPA (US Environmental Protection Agency). 2012b. Estimation Programs Interface Suite™ for
Microsoft® Windows, V4.10. Washington, DC. http://www.epa.gov/opptintr/exposure/pubs/episuitedl.htm (March 19, 2012).
EPA (US Environmental Protection Agency). 2013a. Chemical Data Access Tool: 2-Pyrrolidinon,
1-Methyl. Office of Chemical Safety and Pollution Prevention, Office of Pollution Prevention and Toxics. http://java.epa.gov/oppt_chemical_search/ (12/10/2014).
EPA (US Environmental Protection Agency). 2013b. Pesticide Ecotoxicity Database (Formerly:
Environmental Effects Database (EEDB)). Environmental Fate and Effects Division, Washington, DC. http://www.ipmcenters.org/ecotox/.
EPA (US Environmental Protection Agency). 2013c. TSCA Workplan Chemical Risk Assessment N-
Methylpyrrolidone: Paint Stripping Use CASRN: 872-50-4. Draft. Office of Pollution Prevention and Toxics, Washington, DC.
EPA (US Environmental Protection Agency). 2014a. Framework for Human Health Risk
Assessment to Inform Decision Making. EPA/100/R-14/001. Office of the Science Advisor, Risk Assessment Forum, Washington, DC.
EPA (US Environmental Protection Agency). 2014b. TSCA Work Plan Chemical Risk Assessment.
Methylene Chloride: Paint Stripping Use. EPA/740/R1/4003. Office of Chemical Safety and Pollution Prevention, Office of Pollution Prevention and Toxics.
Page 111 of 281

EWG (Environmental Working Group). 2012. Ewg's Skin Deep Cosmetic Database. Methyl
Pyrrolidone. http://www.ewg.org/skindeep/ingredient/products/703913/METHYL_PYRROLIDONE/ (August 9, 2012).
Exxon Biomedical Sciences. 1991. Project No. 236535, 26 Nov 1991. GAF Corp., Wayne, USA. (as
cited in OECD, 2007). Exxon Biomedical Sciences. 1992. Project No. 136534, 05 Jun 1992 (as cited in OECD, 2007). GAF
Corp., Wayne, USA. FDRL (Food and Drug Research Laboratories). 1979. Lab. No. 6161, Unpublished Report, 18 Oct
1979. GAF Corp., Wayne, NJ, USA. (as cited in OECD, 2007). Frey, H. C., and S. R. Patil. 2002. Identification and Review of Sensitivity Analysis Methods. Risk
Analysis, 22(3), 553-578. Furtaw, J., EJ, M. Pandian, D. Nelson, and J. Behar. 1996. Modeling Indoor Air Concentrations
near Emission Sources in Imperfectly Mixed Rooms. Journal Air & Waste Management Association, 46(9), 861-868.
GAF Corp. 1979. Unpublished Study, Contract No. L1393-05, Aug 1976. Aquatic Toxicology
Laboratory. (as cited in OECD, 2007). Ghantous, H. 1995. Oral, Dermal, and Inhalation Pharmacokinetics and Disposition of [2-14 C]
NMP in the Rat. Report for E.I. Du Pont De Nemours and Company. Haskell Laboratory for Toxicology and Industrial Medicine, Wilmington, DE.
Harreus, A. L., R. Backes, J. Eichloer, R. Feuerhake, C. Jakel, U. Mahn, R. Pinkos, and R.
Vogelsang. 2011. 2-Pyrrolidone. Ullmann's Encyclopedia of Industrial Chemistry. http://onlinelibrary.wiley.com/doi/10.1002/14356007.a22_457.pub2/abstract (accessed on August 8, 2012).
Hass, U., B. M. Jakobsen, and S. P. Lund. 1995. Developmental Toxicity of Inhaled N-
Methylpyrrolidone on Postnatal Development and Behavior in Rats. Neurotoxicology and Teratology, 16, 241-249.
Hass, U., S. P. Lund, and J. Elsner. 1994. Effects of Prenatal Exposure to N-Methylpyrrolidone on
Postnatal Development and Behavior in Rats. Neurotoxicology and Teratology, 16(3), 241-249.
Hazelton Laboratories America, I. 1979. Unpublished Report, Project No. 257-110, 02 Oct 1979.
(as cited in OECD, 2007).
Page 112 of 281
Hazelton Laboratories America, I. 1980. Unpublished Report, Project No. 257-109, 11 Feb, 1980 (as cited in OECD, 2007). Heffernan, A., L. Aylward, L. Toms, P. Sly, M. Macleod, and J. Mueller. 2014. Pooled Biological
Specimens for Human Biomonitoring of Environmental Chemicals: Opportunities and Limitations. Journal of Exposure Science and Environmental Epidemiology, 24(3), 225-232.
Hines, R. N. 2007. Ontogeny of Human Hepatic Cytochrome P450. J Biochem Mol Toxicol, 21(4),
169-175. HLS (Huntingdon Life Sciences (HLS) Ltd,). 1998. [14c]-N-Methylpyrrolidone: Topical Application:
Dermal Absorption Study in the Rat. Report 982974. (as cited in RIVM, 2013). HSE (Health and Safety Executive). 2001. Health Risks During Furniture Stripping Using
Dichloromethane (Dcm). www.hse.gov.uk/pubns/wis19.pdf (August 6, 2012). IRTA (Institute for Research and Technical Assistance). 2006. Assessment, Development and
Demonstration of Alternatives for Five Emerging Solvents. www.cdph.ca.gov/programs/hesis/Documents/emergingsolvents.pdf (August 6, 2012).
Jonsson, B. A., and B. Akesson. 2003. Human Experimental Exposure to N-Methyl-2-Pyrrolidone
(NMP): Toxicokinetics of NMP, 5-Hydroxy- N-Methyl-2-Pyrrolidone, N-Methylsuccinimide and 2-Hydroxy- N-Methylsuccinimide (2-HMSI), and Biological Monitoring Using 2-HMSI as a Biomarker. International Archives of Occupational and Environmental Health, 76(4), 267-274.
Kavlock, R. J., B. C. Allen, E. M. Faustman, and C. A. Kimmel. 1995. Dose-Response Assessments
for Developmental Toxicity: IV. Benchmark Doses for Fetal Weight Changes. Fundamental and Applied Toxicology, 26, 211-222.
Keener, S., R. Wrbitzky, and M. Bader. 2007. Human Volunteer Study on the Influence of
Exposure Dilution of Dermally Applied N-Methyl-2-Pyrrolidone (NMP) on the Urinary Elimination of NMP Metabolites. International Archives of Occupational and Environmental Health, 80(4), 327-334.
Lan, C. H., C. Y. Peng, and T. S. Lin. 2004. Acute Aquatic Toxicity of N-Methyl-2-Pyrrolidinone to
Daphnia Magna. Bulletin of Environmental Contamination and Toxicology, 73(2), 392-397.
Lee, K. P., N. C. Chromey, R. Culik, J. R. Barnes, and P. W. Schneider. 1987. Toxicity of N-Methyl-
2-Pyrrolidone (NMP): Teratogenic, Subchronic, and Two-Year Inhalation Studies. Fundamental and Applied Toxicology, 9(2), 222-235.
Page 113 of 281

Levitt, M. D., Li, R., Demaster, E.G., Elson, M., Furne, J., Levitt, D.G. 1997. Use of Measurements
of Ethanol Absorption from Stomach and Intestine to Assess Human Ethanol Metabolism. American Journal of Gastrointestinal and Liver Physiology, 273, G951–957.
Lide, D. 2001. Physical Constants of Organic Compounds. In Crc Handbook of Chemistry and
Physics, 82nd Edition (pp. 3-206). CRC Press Inc., Boca Raton, FL. Ligocka, D., D. Lison, and V. Haufroid. 2003. Contribution of CYP2E1 to N-Methyl-2-Pyrrolidone
Metabolism. Archives of Toxicology, 77(5), 261-266. Malek, D. E., L. A. Malley, T. W. Slone, G. S. Elliott, G. L. Kennedy, W. Mellert, K. Deckardt, C.
Gembardt, B. Hildebrand, S. R. Murphy, D. B. Bower, and G. A. Wright. 1997. Repeated Dose Toxicity Study (28 Days) in Rats and Mice with N-Methylpyrrolidone (NMP). Drug Chemistry and Toxicology, 20(1-2), 63-77.
Malley, L. A., G. L. Kennedy, G. S. Elliott, T. W. Slone, W. Mellert, K. Deckardt, K. Kuttler, B.
Hildebrand, M. I. Banton, R. J. Parod, and J. C. Griffiths. 2001. Chronic Toxicity and Oncogenicity of N-Methylpyrrolidone (NMP) in Rats and Mice by Dietary Administration. Drug Chemistry and Toxicology, 24(4), 315-338.
Matthews, T., C. Thompson, D. Wilson, A. Hawthorne, and D. Mage. 1989. Air Velocities inside
Domestic Environments: An Important Parameter in the Study of Indoor Air Quality and Climate. Environment International, 15, 545-550.
McDougal, J. N., Jepson, G.W., Clewell, H.J.-III, MacNaughton, M.G., Andersen, M.E. 1986. A
Physiological Pharmacokinetic Model for Dermal Absorpotion of Vapors in the Rat. Toxicology and Applied Pharmacology, 85, 286-294.
McLanahan, E. D., H. A. El-Masri, L. M. Sweeney, L. Y. Kopylev, H. J. Clewell, J. F. Wambaugh,
and P. M. Schlosser. 2012. Physiologically Based Pharmacokinetic Model Use in Risk Assessment—Why Being Published Is Not Enough. Toxicological Sciences, 126(1), 5-15.
Midgley, I., A. Hood, L. Chasseaud, C. Brindley, S. Baughman, and G. Allan. 1992. Percutaneous
Absorption of Co-Administered N-Methyl-2-[4c]Pyrrolidinone and S-[14c]Pyrrolidinone in the Rat. Food Chemistry and Toxicology, 30(1), 57-64.
MSU/MIFACE (Michigan State University/Michigan Fatality Assessment and Control Evaluation).
2011. Tub Refinisher Died Due to Methylene Chloride Overexposure While Stripping a Bathtub. Report # 10MI013. East Lansing, MI. http://www.oem.msu.edu/MiFace/10MI013Report.pdf.
Musy, M., E. Wurtz, and J.-M. Nataf. 1999. An Intermediate Model to Predict Thermal Comfort
and Air Quality in a Building. Indoor Air, 1, 685-690.
Page 114 of 281

NICNAS. 2013. Human Health Tier Ii Assessment for 2-Pyrrolidinone, 1-Methyl, CAS Number 872-
50-4. Department of Health, National Industrial Chemicals Notification and Assessment Scheme (Australia). http://www.nicnas.gov.au/chemical-information/imap-assessments/imap-assessment-details?assessment_id=91.
NIH (US Department of Health & Services, National Institute of Health). 2012. Household
Products Database. N-Methylpyrrolidone. National Library of Medicine, Bethesda, MD. http://householdproducts.nlm.nih.gov/cgi-bin/household/brands?tbl=chem&id=1193 (accessed on August 8, 2012).
NIOSH (National Institute for Occupational Safety and Health). 1977. Health Hazard Evaluation
Determination Report. United Airlines Maintenance Base San Francisco International Airport, Burlingame, California. 75-195-396. Cincinnati, OH. www.ntis.gov/search/product.aspx?ABBR=PB273779.
NIOSH (National Institute for Occupational Safety and Health). 1990. Walk-Though Survey
Report: Control of Methylene Chloride in Furniture Stripping at Colonial Furniture Stripping. ECTB number: 170-14a. Cincinnati, OH. www.cdc.gov/niosh/surveyreports/pdfs/170-14a.pdf.
NIOSH (National Institute for Occupational Safety and Health). 1992. Health Hazard Evaluation.
Ackerman and Sons, Littleton, Colorado. HETA 92-0360-2372. Scand. J. Work. Environ. Health. www.cdc.gov/niosh/hhe/reports/pdfs/1992-0360-2372.pdf.
NIOSH (National Institute for Occupational Safety and Health). 1993. Health Hazard Evaluation.
Rosebud Company. HETA 93-0844-2411. http://www.cdc.gov/niosh/hhe/reports/pdfs/1993-0844-2411.pdf.
NMP Producers Group. 1995. Subchronic Oral Toxicity: 90-Day Feeding and Neurotoxicity Study
in Rats with N-Methylpyrrolidone (NMP). Unpublished Report. Project No. 9737-001. E. I. du Pont de Nemours and Company, Haskell Laboratory for Toxicology and Industrial Medicine, Newark, DE. (as cited in OECD, 2007).
NMP Producers Group. 1999a. Two Generation Reproduction Toxicity Study with N-
Methylpyrrolidone (NMP) in Sprague Dawley Rats - Administration in the Diet. Project No. 97-4106. Huntingdon Life Science, East Millestone, NJ. (as cited in RIVM 2013).
NMP Producers Group. 1999b. Two Generation Reproduction Toxicity Study with N-
Mythylpyrrolidone (NMP) in Wistar Rats - Administration in the Diet. Project No. 70R0056/97008. Department of Toxicology of BASF Aktiengesellschaft, Ludwigshafen, Germany. (as cited in RIVM, 2013).
Page 115 of 281

NMP Producers Group. 2012. NMP Exposure Summary. Communication with US EPA , June, 2012. Scand. J. Work. Environ. Health.
O'Neil, M. J., A. Smith, P. E. Heckelman, and J. R. Obenchain. 2001. N-Methylpyrroline. In The
Merck Index, 13th Edition (pp. 6141). Merck & Co, Inc, Whitehouse Station, NJ. OECD (Organization for Economic Co-operation and Development). 2007. SIDS Initial
Assessment Report. 1-Methyl-2-Pyrrolidone. OECD (Organization for Economic Co-operation and Development). 2008. SIDS Dossier. 2-
Pyrrolidinone, 1-Methyl. http://webnet.oecd.org/hpv/ui/SponsoredChemicals.aspx (November 26, 2012).
OECD (Organization for Economic Co-operation and Development). 2010. Emission Scenario
Document on Coating and Application Via Spray Painting in the Automotive Refinishing Industry. . Number 11. OECD Environmental Health and Safety Publications. Series on Emission Scenario Documents.
OEHHA (Office of Environmental Health Hazard Assessment (California)). 2003. Proposition 65
Maximum Allowable Dose Level (MADL) for Reproductive Toxicity for N-Methypyrrolidone for Dermal and Inhalation Exposures. Reproductive and Cancer Hazard Assessment Section.
OEHHA (Office of Environmental Health Hazard Assessment (California)). 2011. Carcinogen
Identification Committee Consultation: N-Methylpyrrolidone. Carcinogen Identification Committee.
Old House Online. 2012. Making Sense of Paint Strippers.
http://www.oldhouseonline.com/making-sense-of-paint-strippers/ (accessed on June 13, 2012).
OSHA (Occupational Safety and Health Administration). 2012. Data and Statistics. US
Department of Labor. http://www.osha.gov/oshstats/index.html (accessed on 11/17/2014).
Payan, J.-P., Beydon, D., Fabry, J.-P., Boudry, I., Cossec, B., Ferrari, E. 2002. Toxicokinetics and
Metabolism of N-[(14)C]N-Methyl-2-Pyrrolidone in Male Sprague-Dawley Rats: In Vivo and in Vitro Percutaneous Absorption. Drug Metabolism and Disposition, 30, 1418–1424.
Payan, J.-P., Boudry, I., Beydon, D., Fabry, J.-P., Grandclaude, M.-C., Ferrari, E., André, J.-C.
2003. Toxicokinetics and Metabolism of N-[(14)C]N-Methyl-2-Pyrrolidone in Male Sprague-Dawley Rats: In Vivo and in Vitro Percutaneous Absorption. Drug Metabolism and Disposition, 31, 659–669.
Page 116 of 281

Poet, T. S., C. R. Kirman, M. Bader, C. van Thriel, M. L. Gargas, and P. M. Hinderliter. 2010. Quantitative Risk Analysis for N-Methyl Pyrrolidone Using Physiologically Based Pharmacokinetic and Benchmark Dose Modeling. Toxicological Sciences, 113(2), 468-482.
Pollack-Nelson, C. 1995. Analysis of Methylene Chloride Product Labelling. Ergonomics, 38(11),
2176-2187. Riley, D. M., B. Fischhoff, M. J. Small, and P. Fischbeck. 2001. Evaluating the Effectiveness of
Risk-Reduction Strategies for Consumer Chemical Products. Risk Analysis, 21(2), 357-369. Riley, D. M., M. J. Small, and B. Fischhoff. 2000. Modeling Methylene Chloride Exposure-
Reduction Options for Home Paint-Stripper Users. Journal of Exposure Analysis and Environmental Epidemiology, 10(3), 240-250.
RIVM (National Institute for Public Health and the Environment (RIVM)). 2013. Annex XV
Restriction Report: Proposal for a Restriction, N-Methylpyrrolidone (NMP). Version 2. RIVM, Bureau REACH, The Netherlands.
Saillenfait, A. M., F. Gallissot, I. Langonne, and J. P. Sabate. 2002. Developmental Toxicity of N-
Methyl-2-Pyrrolidone Administered Orally to Rats. Food Chemistry and Toxicology, 40(11), 1705-1712.
Saillenfait, A. M., F. Gallissot, and G. Morel. 2003. Developmental Toxicity of N-Methyl-2-
Pyrrolidone in Rats Following Inhalation Exposure. Food Chemistry and Toxicology, 41(4), 583-588.
Saillenfait, A. M., J. P. Sabate, and F. Gallissot. 2007. Comparative Developmental Toxicities of
the Three Major Metabolites of N-Methyl-2-Pyrrolidone after Oral Administration in Rats. Journal of Applied Toxicology, 27(6), 571-581.
Sitarek, K., J. Stekiewicz, and W. Wasowicz. 2012. Evaluation of Reproductive Disorders in
Female Rats Exposed to N-Methyl-2-Pyrrolidone. Birth Defects Research (Part B), 95, 195-201.
Sitarek, K., and J. Stetkiewicz. 2008. Assessment of Reproductive Toxicity and Gonadotoxic
Potential of N-Methyl-2-Pyrrolidone in Male Rats. International Journal of Occupational Medicine and Environmental Health, 21(1), 73-80.
Smithsonian (Smithsonian Museum Conservation Institute). 2012a. Does My Painting Need to
Be Cleaned? http://si.edu/mci/english/learn_more/taking_care/painting_clean.html (accessed on July 20, 2012).
Page 117 of 281

Smithsonian (Smithsonian Museum Conservation Institute). 2012b. What Does It Mean to Have a Painting Restored and How Do I Pick a Conservator? http://si.edu/mci/english/learn_more/taking_care/conservation_meaning.html (accessed on July 20, 2012).
Solomon, G. M., E. P. Morse, M. J. Garbo, and D. K. Milton. 1996. Stillbirth after Occupational
Exposure to N-Methyl-2-Pyrrolidone. A Case Report and Review of the Literature. Journal of Occupational and Environmental Medicine, 38(7), 705-713.
Staats, D. A., Fisher, J.W., Connolly, R.B. 1991. Gastrointestinal Absorption of Xenobiotics in
Physiologically Based Pharmacokinetic Models. A Two-Compartment Description. Drug Metabolism and Disposition, 19, 144-148.
Timchalk, C., Nolan, R.J., Mendrala, A.L., Dittenber, D.A., Brzak, K.A., Mattsson, J.L. 2002.
Physiologically Based Pharmacokinetic and Pharmacodynamic (PBPK/Pd) Model for the Organophosphate Insecticide Chlorpyrifos in Rats and Humans. Toxicol Sci, 66, 34-53.
TNO (European Commision. TNO-STB). 1999. Methylene Chloride: Advantages and Drawbacks
of Possible Market Restrictions in the EU. STB-99-53 Final. Scand. J. Work. Environ. Health, Brussels, Belgium.
USDOC (US Census Bureau). 2007a. 2007 NAICS Index File. North American Industry
Classification System. US Department of Commerce, Washington, DC. http://www.census.gov/cgi-bin/sssd/naics/naicsrch?chart=2007 (accessed on April 20, 2012).
USDOC (US Census Bureau). 2007b. American Factfinder: 2007 Economic Census. US
Department of Commerce, Washington, DC. Van Raaij, M. T. M., A. H. Janssen, and A. H. Piersma. 2003. The Relevance of Developmental
Toxicity Endpoints for Acute Limit Setting RIVM Report 601900004. van Veen, M. P., F. Fortezza, E. Spaans, and T. T. Mensinga. 2002. Non-Professional Paint
Stripping, Model Prediction and Experimental Validation of Indoor Dichloromethane Levels. Indoor Air, 12(2), 92-97.
Verschuren, K. 2009. Handbook of Environmental Data on Organic Chemicals (5th ed.). New
York: Wiley & Sons, Inc. Vincent, R., P. Poirot, I. Subra, B. Rieger, and A. Cicolella. 1994. Occupational Exposure to
Organic Solvents During Paint Stripping and Painting Operations in the Aeronautical Industry. International Archives of Occupational and Environmental Health, 65(6), 377-380.
Page 118 of 281

W. M. Barr (W.M. Barr and Company). 2009a. Material Safety Data Sheet. Citristrip Stripping Gel. Product Code: Cs61040.25. http://www.wmbarr.com/ProductFiles/CitriStrip%20Stripping%20Gel%20(CS61040.25)%205-28-09.pdf (accessed on August 8, 2012).
W. M. Barr (W. M. Barr and Company). 2009b. Material Safety Data Sheet. Klean Strip Klean
Kutter. Product Code: 130. http://www.wmbarr.com/ProductFiles/130%20(Klean%20Kutter).pdf (accessed on August 6, 2012).
W. M. Barr (W.M. Barr and Company). 2011. Material Safety Data Sheet. Citristrip Safer Paint
and Varnish Stripper Aerosol. Product Code: Acsa35.4. http://www.wmbarr.com/ProductFiles/ACSA35%204%20CSSafer%20Paint%20and%20Varnish%20Stripper%20Aerosol.pdf (accessed on August 8, 2012).
Wells, D. A., Digenis, G.A. 1988. Disposition and Metabolism of Double-Labeled [3h and 14c] N-
Methyl-2-Pyrrolidinone in the Rat. Drug Metabolism and Disposition, 16, 243-249. WESTAT (WESTAT Inc.). 1987. Household Solvent Products: A National Usage Survey. PB88-
132881. Rockville, MD. WHO (World Health Organization). 2001. Concise International Chemical Assessment Document
(CICAD) 35, N-Methyl-2-Pyrrolidone. Geneva, Switzerland. www.who.int/entity/ipcs/publications/cicad/en/cicad35.pdf.
Wollbrinck, T. 1993. The Composition of Proprietary Paint Strippers. Journal of the Amercian
Institute for Conservation, 32(1), 43-57. Xiaofei, E., Wada, Y., Nozaki, J., Miyauchi, H., Tanaka, S., Seki, Y., Koizumi, A. 2000. A Linear
Pharmacokinetic Model Predicts Usefulness of N-Methyl-2-Pyrrolidone (NMP) in Plasma or Urine as a Biomarker for Biological Monitoring for NMP Exposure. Journal of Occupational Health, 42, 321–327.
Page 119 of 281

APPENDICES
Page 120 of 281

Appendix A ENVIRONMENTAL EFFECTS SUMMARY EPA/OPPT conducted a literature search to identify ecotoxicity data for NMP. In addition to NMP synonyms, the search terms included freshwater and saltwater fish, aquatic invertebrates and aquatic plants; pelagic and benthic organisms; acute and chronic sediment toxicity in freshwater and saltwater and terrestrial toxicity to soil organisms, birds and mammals. For each study identified, EPA/OPPT evaluated the test species, test conditions, toxicity endpoints, statistical significance and strengths/limitations and study quality. NMP has been tested for acute and chronic aquatic toxicity and toxicity to birds. EPA/OPPT found no ecotoxicity studies for sediment or soil dwelling organisms. For aquatic toxicity studies that met EPA’s study quality criteria, a hazard characterization (i.e., high, medium or low toxicity) was assigned based on EPA’s methodology for existing chemical classification (EPA, 2009). EPA/OPPT summarized the available NMP ecotoxicity data that met the acceptability criteria for ecotoxicity studies (EPA, 1999a) below and in Table_Apx A-1, Table_Apx A-2 and Table_Apx A-3.
A-1 Acute Toxicity to Aquatic Organisms Table_Apx A-1 summarizes the available toxicity studies of NMP to aquatic organisms. Acute Toxicity to Fish Six species of fish were tested, five were freshwater and one was saltwater. All species, test conditions and protocols were acceptable for evaluating the acute toxicity of NMP to fish. The most sensitive species for freshwater fish is the Bluegill sunfish (96-hr LC50 of 832 mg/L) (EPA, 2013b). Overall, the acute toxicity of NMP to fish is low based on EPA’s aquatic hazard characterization criteria (EPA, 2009). Acute Toxicity to Aquatic Invertebrates EPA/OPPT identified three acute toxicity studies with aquatic invertebrates (Table_Apx A-1); two used the water flea and one used grass shrimp. All exposures were conducted at nominal concentrations under static conditions for 48-hrs. The 48-hr EC50 for the water fleas ranged from 1,230 – 4,897 mg/L and the reported 48-hr EC50 for the grass shrimp was 1,107 mg/L. (GAF Corp., 1979; Lan et al., 2004; as cited in OECD, 2007; and Verschuren, 2009). The acute toxicity of NMP to aquatic invertebrates is low based on EPA’s aquatic hazard characterization criteria (EPA, 2009).
Page 121 of 281

Toxicity to Aquatic Plants Only one study was identified testing the toxicity of NMP to aquatic plants (Table_Apx A-1). Green algae (Scenedesmus subspicatus) were exposed to nominal concentrations of NMP under static conditions for 96 hrs. A 72-hr EC50 of >500 mg/L was reported (BASF AG, 1988; as cited in Verschuren, 2009). The toxicity of NMP to aquatic plants is low based on EPA’s aquatic hazard characterization criteria (EPA, 2009). Table_Apx A-1 Aquatic Toxicity Data for NMP - Acute Toxicity
Test Species Fresh/ Salt Water
Duration End-point
Conc. (mg/L)
Test Analysis Effect References
Fish Fathead minnow (Pimphales promelas)
Fresh 96-hr LC50 1,072 Measured Mortality SRC (1979); Verschuren (2009)
Bluegill sunfish (Lepomis macrochirus)
Fresh 96-hr LC50 832 Nominal Mortality Dawson et al. (1977)
Orfe (Leuciscus idus)
Fresh 96-hr LC50 4,000 Nominal Mortality BASF (1986) Verschuren (2009)
Guppies (Poecilia reticulata)
Fresh 96-hr LC50 2,673 Nominal Mortality OECD, (2007a); Verschuren (2009); Weisbrod and Seyring (1980)
Rainbow trout (Oncorhynchus mykiss)
Fresh 96-hr LC50 >500 Nominal Mortality BASF AAG (1983 as cited in OECD 2007a); SRC (1979)
Aquatic Invertebrates
Water flea (Daphnia magna) Fresh 48-hr EC50 4,897 Nominal Immobiliza
tion
GAF Corp (1979 as cited in OECD, 2007a); Verschuren (2009)
Water flea (Daphnia magna) Fresh 48-hr EC50 1,230 Nominal Immobiliza
tion Lan et al., (2004)
Grass shrimp (Palaemonetes vulgaris) Fresh 48-hr EC50 >299 Nominal Mortality
GAF Corp (1979 as cited in OECD, 2007a); Verschuren (2009)
Aquatic Plants
Green algae (Scenedesmus subspicatus)
Fresh 72-hr EC50 >500 Nominal Not reported
BASF AG(1988a as cited in Verschuren, 2009)
Page 122 of 281

A-2 Chronic Toxicity to Aquatic Organisms Chronic Toxicity to Aquatic Invertebrates EPA/OPPT identified only one study reporting the chronic toxicity of NMP to aquatic organisms was identified (Table_Apx A-2). Water fleas (D. magna) were exposed to unspecified concentrations of NMP for 21 days. A 21-day NOEC of 12.5 mg/L was reported (BASF AG, 2001; as cited in OECD, 2007). The chronic toxicity of NMP to aquatic invertebrates is low based on EPA’s aquatic hazard characterization criteria (EPA, 2009). Table_Apx A-2 Aquatic Toxicity Data for NMP - Chronic Toxicity
Test Species Fresh/
Salt Water
Duration End-point
Conc. (mg/L)
Test Analysis Effect References
Aquatic Invertebrates
Water flea (Daphnia magna) Fresh 21-day NOEC 12.5 Nominal Biomass/
Growth rate
BASF AG (2001 as cited in OECD, 2007a)
A-3 Toxicity to Sediment and Soil Organisms There were no available acute or chronic toxicity studies that characterize the hazard of NMP to sediment- or soil-dwelling organisms.
A-4 Toxicity to Wildlife Toxicity to Birds There were two studies identified that reported the toxicity of NMP in birds as summarized in Table_Apx A-3. In one study, Bobwhite quail (Colinus virginianus) (five male and five female) were orally dosed at concentrations of 0, 312.5, 625, 1,250, 2,500 and 5,000 mg/kg body weight of NMP for 14 days. The LD50 values ranged between 2,500 and 5,000 mg/kg body weight (Hazelton Laboratories America, 1980; as cited in OECD, 2007). In another study, Mallard ducks (Anas platyrhynchus) were exposed (through basal feed) to concentrations of 0, 156.3, 312.5, 625, 1,250, 2,500 and 5,000 ppm of NMP for 8 days. No mortalities were observed and an LC50 of >5,000 ppm was derived from this study (Hazelton Laboratories America, 1979; as cited in OECD, 2007). Both of these studies show that the hazard of NMP to birds is low based on EPA’s aquatic hazard characterization criteria (EPA, 2009).
Page 123 of 281
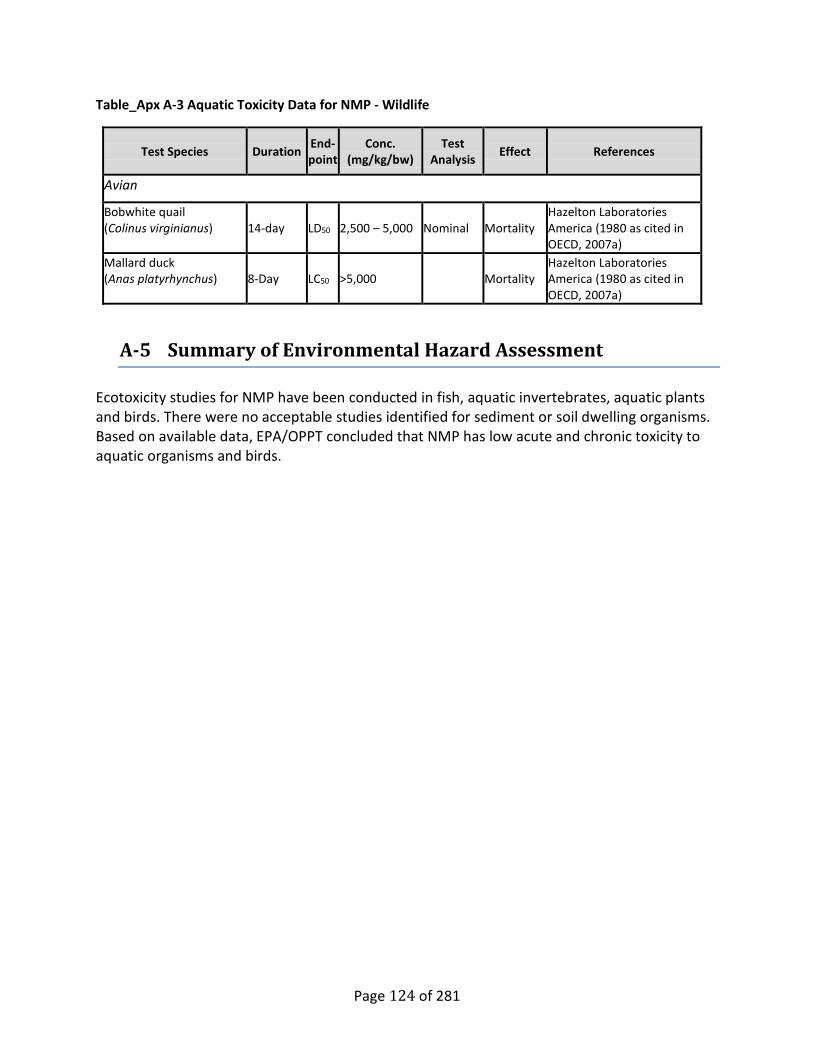
Table_Apx A-3 Aquatic Toxicity Data for NMP - Wildlife
Test Species Duration End-point
Conc. (mg/kg/bw)
Test Analysis Effect References
Avian
Bobwhite quail (Colinus virginianus) 14-day LD50 2,500 – 5,000 Nominal Mortality
Hazelton Laboratories America (1980 as cited in OECD, 2007a)
Mallard duck (Anas platyrhynchus) 8-Day LC50 >5,000 Mortality
Hazelton Laboratories America (1980 as cited in OECD, 2007a)
A-5 Summary of Environmental Hazard Assessment Ecotoxicity studies for NMP have been conducted in fish, aquatic invertebrates, aquatic plants and birds. There were no acceptable studies identified for sediment or soil dwelling organisms. Based on available data, EPA/OPPT concluded that NMP has low acute and chronic toxicity to aquatic organisms and birds.
Page 124 of 281
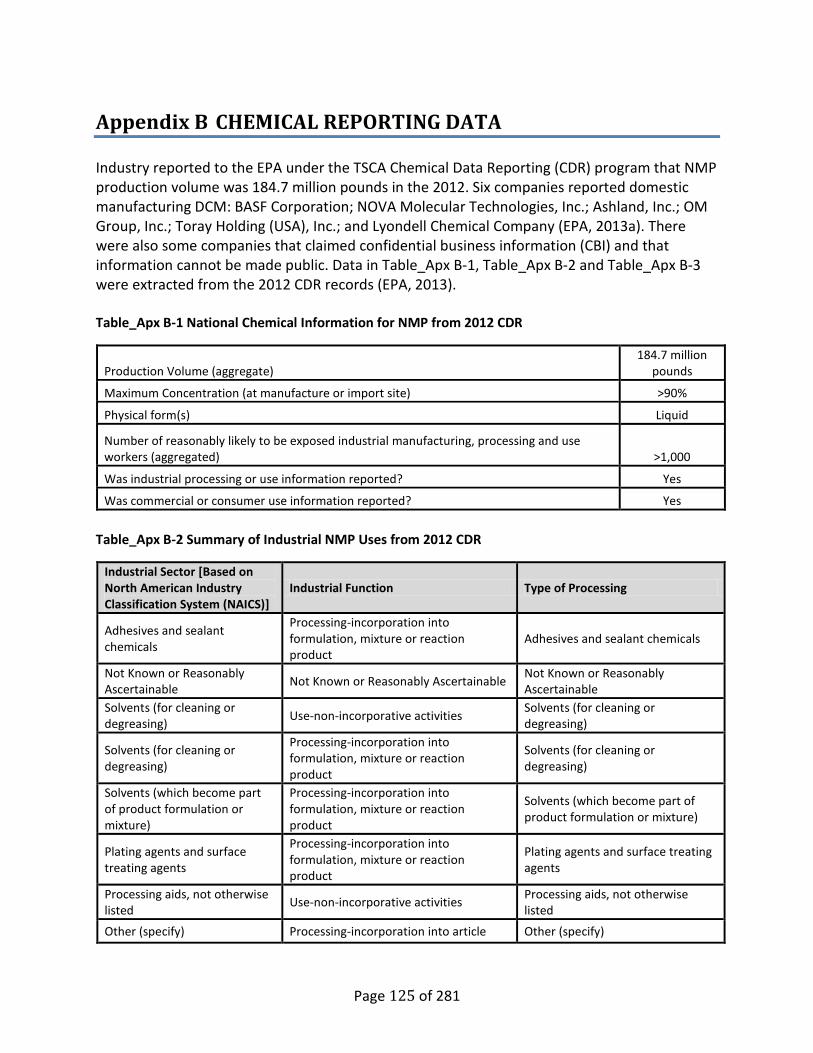
Appendix B CHEMICAL REPORTING DATA Industry reported to the EPA under the TSCA Chemical Data Reporting (CDR) program that NMP production volume was 184.7 million pounds in the 2012. Six companies reported domestic manufacturing DCM: BASF Corporation; NOVA Molecular Technologies, Inc.; Ashland, Inc.; OM Group, Inc.; Toray Holding (USA), Inc.; and Lyondell Chemical Company (EPA, 2013a). There were also some companies that claimed confidential business information (CBI) and that information cannot be made public. Data in Table_Apx B-1, Table_Apx B-2 and Table_Apx B-3 were extracted from the 2012 CDR records (EPA, 2013). Table_Apx B-1 National Chemical Information for NMP from 2012 CDR
Production Volume (aggregate) 184.7 million
pounds
Maximum Concentration (at manufacture or import site) >90%
Physical form(s) Liquid
Number of reasonably likely to be exposed industrial manufacturing, processing and use workers (aggregated) >1,000
Was industrial processing or use information reported? Yes
Was commercial or consumer use information reported? Yes Table_Apx B-2 Summary of Industrial NMP Uses from 2012 CDR
Industrial Sector [Based on North American Industry Classification System (NAICS)]
Industrial Function Type of Processing
Adhesives and sealant chemicals
Processing-incorporation into formulation, mixture or reaction product
Adhesives and sealant chemicals
Not Known or Reasonably Ascertainable Not Known or Reasonably Ascertainable Not Known or Reasonably
Ascertainable Solvents (for cleaning or degreasing) Use-non-incorporative activities Solvents (for cleaning or
degreasing)
Solvents (for cleaning or degreasing)
Processing-incorporation into formulation, mixture or reaction product
Solvents (for cleaning or degreasing)
Solvents (which become part of product formulation or mixture)
Processing-incorporation into formulation, mixture or reaction product
Solvents (which become part of product formulation or mixture)
Plating agents and surface treating agents
Processing-incorporation into formulation, mixture or reaction product
Plating agents and surface treating agents
Processing aids, not otherwise listed Use-non-incorporative activities Processing aids, not otherwise
listed
Other (specify) Processing-incorporation into article Other (specify)
Page 125 of 281

Industrial Sector [Based on North American Industry Classification System (NAICS)]
Industrial Function Type of Processing
Solvents (for cleaning or degreasing) Use-non-incorporative activities Solvents (for cleaning or
degreasing) Solvents (which become part of product formulation or mixture)
Processing-incorporation into article Solvents (which become part of product formulation or mixture)
Processing aids, specific to petroleum production Use-non-incorporative activities Processing aids, specific to
petroleum production Processing aids, specific to petroleum production Use-non-incorporative activities Processing aids, specific to
petroleum production Paint additives and coating additives not described by other categories
Processing-incorporation into formulation, mixture or reaction product
Paint additives and coating additives not described by other categories
Paint and Coating Manufacturing
Solvents (which become part of product formulation or mixture)
Processing-incorporation into formulation, mixture or reaction product
Processing aids, not otherwise listed Use-non-incorporative activities Processing aids, not otherwise
listed Solvents (which become part of product formulation or mixture)
Processing-incorporation into formulation, mixture or reaction product
Solvents (which become part of product formulation or mixture)
Processing aids, specific to petroleum production Use-non-incorporative activities Processing aids, specific to
petroleum production
Intermediates Processing as a reactant Intermediates
Other (specify) Processing as a reactant Other (specify)
Intermediates Processing as a reactant Intermediates
Other (specify) Processing-incorporation into formulation, mixture or reaction product
Other (specify)
Other (specify) Processing-incorporation into article Other (specify)
Printing Ink Manufacturing Paint additives and coating additives not described by other categories
Processing-incorporation into formulation, mixture or reaction product
Paint additives and coating additives not described by other categories
Processing-incorporation into article Paint additives and coating additives not described by other categories
Solvents (for cleaning or degreasing) Use-non-incorporative activities Solvents (for cleaning or
degreasing) Not Known or Reasonably Ascertainable Not Known or Reasonably Ascertainable Not Known or Reasonably
Ascertainable
Page 126 of 281

Table_Apx B-3 NMP Commercial/Consumer Use Category Summary
Commercial/Consumer Product Category
Intended for Commercial and/or Consumer Uses or Both
Intended for Use in Children's Products in Related Product Category
Electrical and Electronic Products Commercial Not Known or Reasonably Ascertainable
Batteries Both No
Paints and Coatings Both No
Metal Products not covered elsewhere Commercial No
Adhesives and Sealants Commercial No
Fabric, Textile and Leather Products not covered elsewhere Commercial No
Other use applications also have been reported including: microelectronics industry plastic solvent; extraction of acetylene and butadiene; metal finishing; printed circuit board manufacturing; dehydration of natural gas; spinning agent for polyvinyl chloride (PVC); lube oil processing; petrochemical processing; pigment dispersant; and adjuvant for slimicides in food-contact paper (Ash and Ash, 2009). Though paint stripping accounts for only about nine percent of the total use of NMP, EPA/OPPT is specifically concerned about this use, because the potential for exposure is high; some of the other uses of NMP involve closed processes or lower concentrations that generally reduce exposures and are of less concern. While the cited paint stripping use percentage is from reports dated in the 1980s and 1990s, proprietary information (i.e., known but not cited here) as recent as 2011 confirmed that paint stripping is still a low percentage use for NMP in terms of market consumption.
B-1 Consumer Uses The 2012 CDR data indicate that NMP is used in the following commercial and consumer use categories: “electrical and electronic products”, “paints and coatings”, “batteries”, “metal products not covered elsewhere”, “adhesives and sealants” and “fabric, textile and leather products not covered elsewhere” (EPA, 2013a). The National Institutes of Health (NIH) Household Products Database currently lists 47 products containing NMP, in concentrations ranging from 1-100 percent. The product forms include liquid, aerosol, kit, paste and pump spray (NIH, 2012). Furthermore, according to the Environmental Working Group’s Skin Deep Cosmetics Database, six cosmetic products contain NMP: five mascara products and one nail polish remover (EWG, 2012).
Page 127 of 281

Table_Apx B-4 presents the major consumer uses of NMP, which represent <30 percent of the total domestic NMP market. Table_Apx B-4 Consumer Uses of NMP
Auto products Leather cleaner/conditionera Rubbing compounda Paint protectanta Cleaner for fuel injection/carburetora
Arts and crafts products Stripper/paint removera
Home maintenance products Adhesive removera Paint, varnish, wood stain, etc.a Wood sealanta Paint strippera Graffiti removera Brush cleanera Floor finisha Floor cleanera
Pesticides Fungicidea Herbicidea Insecticidea
Cosmetics Polish removerb Mascarab
Notes: aNIH (2012) bEWG (2012)
B-2 Paint Stripping Applications Some states have done extensive research about the paint stripping market which is of interest to the EPA’s assessment of NMP. In the State of California, there are approximately 80 facilities that have stripping equipment and use relatively large quantities of stripper that they typically purchase in quantities ranging in size from five- to 55-gallon drums. Other companies provide on-site services to consumers for stripping kitchen or office cabinets for which they purchase product from paint supply or hardware stores. There are approximately 500 additional facilities in the state that do some stripping as part of their business, which would include small facilities like antique shops; these facilities purchase small quantities of stripper from hardware or paint supply stores. Consumers also purchase stripper from paint supply and hardware stores (Cal EPA, 2006).
Page 128 of 281

Appendix C STATE NMP REGULATIONS Table_Apx C-1 State NMP Regulations
State Regulation Link or Reference California California’s Proposition 65 list
because it is known to cause birth defects or other reproductive harm
State of California Environmental Protection Agency Office of Environmental Health Hazard Assessment (CA EPA OEHHA). (2007). OEHHA Proposition 65 in Plain Language!.http://oehha.ca.gov/prop65/background/p65plain.html (accessed September 11, 2014)
California Proposed a permissible exposure limit (PEL) at 1 ppm as an 8-hr time-weighted average (TWA) to reduce the risk of developmental effects
Occupational Safety and Health Standards Board, STATE OF CALIFORNIA - DEPARTMENT OF INDUSTRIAL RELATIONS Edmund G. Brown Jr., Governor Title 8: Division 1, Chapter 4, Subchapter 7, Article 107, Section 5155 of the General Industry Safety Orders
California Regulations that require employees that handle NMP to wear appropriate protective gloves
http://www.dir.ca.gov/title8/sb7g2a10.html (accessed October 28, 2014)
California California lists NMP as an informational candidate chemical under California’s Safer Consumer Products regulations
http://www.dtsc.ca.gov/SCP/ChemList.cfm (accessed October 28, 2014)
Washington Listed as chemical of high concern under the Children’s Safe Product Act
http://www.ecy.wa.gov/programs/swfa/cspa/chcc.html (accessed October 28, 2014)
Minnesota Listed chemical of high concern (development)
http://www.health.state.mn.us/divs/eh/hazardous/topics/toxfreekids/chclist/mdhchc2013.pdf (accessed September 10, 2014)
New Hampshire Listed toxic air pollutant Regulated Toxic Air Pollutants, New Hampshire Code of Administrative Rules, Chapter CHAPTER Env-A 1400, Table-1450-1 2009
New Jersey Listed hazardous substance Environmental Hazardous Substance List,” New Jersey Department of Environmental Protection, N.J.A.C. 7:1G-2, as printed in the Community Right to Know Survey Instruction Book, 2005. http://web.doh.state.nj.us/rtkhsfs/rtkhsl.aspx (accessed December 5, 2014)
Pennsylvania Listed hazardous substance Regulated Substances List, Pennsylvania Department of Environmental Protection, Bureau of Environmental Cleanup and Brownfields: Division of Storage Tanks. Revised: 3/2014 http://www.portal.state.pa.us/portal/server.pt?open=514&objID=552962&mode=2 (accessed December 5, 2014)
Vermont Listed air pollutant Air Pollution Control Regulations, State of Vermont Agency of Natural Resources, A-1: Hazardous Air Contaminants. 2014
Page 129 of 281
Appendix D OCCUPATIONAL EXPOSURE ASSESSMENT SUPPORT INFORMATION
D-1 Summary of Dermal Exposure Parameters, Inhalation Concentrations and Exposure Reduction Factors
Data sources did not often indicate whether NMP exposure concentrations were for occupational users or nearby workers. Therefore, EPA/OPPT assumes that exposures are for a combination of users and nearby workers. Some nearby workers may have lower exposures than users, especially when they are further away from the source of exposure.
D-2 Data Needs and Data Collection Before data collection began, EPA/OPPT defined the data needs for the completion of the occupational exposure assessment of NMP during paint stripping. These data needs include both quantitative data (e.g., exposure measurements) and qualitative information (e.g., descriptions of worker activities). The following data needs were required for the occupational exposure portion of this risk assessment:
• Inhalation exposure monitoring data of NMP during paint stripping. o Only breathing zone or personal samples were considered for use. Area samples
were not considered for use. o Modeling results were not considered for use. o Biological measurements (e.g., blood or urine samples) were not considered for
use. o Data from non-paint stripping industries were not considered for use.
• Dermal exposure data of NMP during paint stripping. • Description of processes and worker activities used to perform paint stripping. • Description of engineering controls and personal protective equipment used during
paint stripping. • Estimates of number of workers exposed to NMP during paint stripping in the US. • Estimates of the number of facilities that perform NMP-based paint stripping in the US.
The inhalation exposure data presented in Table_Apx D-9 below met the first bulleted data need above (breathing zone monitoring data of NMP during paint stripping). EPA/OPPT obtained inhalation exposure data from a literature search and the OSHA IMIS database. EPA/OPPT also obtained some additional studies identified during the public and peer reviews of the 2012 draft of this document. EPA/OPPT’s literature search comprised a general Internet search and a targeted search of specific Internet resources. To begin the
Page 130 of 281

literature search, EPA/OPPT defined primary keywords to use in the search queries. The defined primary keywords were:
• N-methylpyrrolidone • 1-Methyl-2-pyrrolidinone • paint stripp*
EPA/OPPT included both chemical synonyms “N-methylpyrrolidone” and “1-methyl-2-pyrrolidinone.” The wildcard (*) allows for variations of the word “strip”, including “stripper” and “stripping.” To sort through extensive search results, EPA/OPPT used secondary keywords including, but not limited to, the following:
• expos* • inhal* • breathing zone • dermal
Here, the wildcard (*) allows for the variations: “exposure”, “exposures”, “exposed”, “inhale” and “inhalation.” EPA/OPPT used these keywords in queries performed in an Internet search engine (e.g., Google) for the general Internet search and in the following targeted NIOSH online resources.
• NIOSH Workplace Survey Reports: http://www.cdc.gov/niosh/surveyreports/ • NIOSH Health Hazard Evaluations (HHEs): http://www2a.cdc.gov/hhe/search.asp
Before data collection began, EPA/OPPT defined criteria to evaluate the quality of collected data. EPA/OPPT then determined acceptance specifications for each study quality criterion to determine if the collected data are of acceptable quality for use in this risk assessment. Table_Apx D-1 summarizes the study quality criteria, the definition or description of each criterion and the corresponding acceptance specifications used to determine if the data are acceptable for use. EPA/OPPT accepted surrogate data for furniture paint stripping for use in the occupational exposure portion of this risk assessment. The accepted surrogate data are personal monitoring data collected during a chamber test study designed to replicate consumer paint stripping of wood products. The uncertainties associated with these surrogate data are described in the Occupational Inhalation Exposure Literature Data section of this appendix. Inclusion of the surrogate data do not impact the inhalation data input to the PBPK model.
Page 131 of 281

Table_Apx D-1 Study Quality Criteria and Acceptance Specifications
Quality Criterion Description/Definition Acceptance Specification Currency (up to date)
The information reflects present conditions. Data from all years are acceptable.
Geographic Scope The information reported reflects an area relevant to the assessment.
Exposure and process description data from the United States and the rest of world are acceptable. Only US estimates of number of workers and number of facilities that perform paint stripping are acceptable.
Reliability The information reported is reliable. For example, this criterion may include the following acceptance specifications: • The information or data are from a peer-reviewed, government or industry-specific source. • The source is published. • The author is engaged in a relevant field such that competent knowledge is expected (i.e., the author writes for an industry trade association publication versus a general newspaper). • The information was presented in a technical conference where it is subject to review by other industry experts.
Data are reliable if they are from one of the following sources: US or other government publication. Sources by an academic researcher where: • Publication is in peer-reviewed
journal; or • Presented at a technical conference;
or • Source has documented qualifications
or credentials to discuss particular topic.
Sources by an industry expert or trade group where: • Presented at a technical conference
where the information is subject to review by other industry experts; or
• Source has documented qualifications or credentials to discuss particular topic; or
• Source represents a large portion of the industry of interest.
Unbiased The information is not biased towards a particular product or outcome.
• Objective of the information is clear. • Methodology is designed to answer a
specific question. Comparability The data are comparable to other sources
that have been identified. Data sources will not be accepted or rejected based on their comparison to data from other sources.
Representativeness The data reflect the typical industry practices. The data are based on a large industry survey or study, as opposed to a case study or sample from a limited number of sites.
Literature sources are not rejected based on the sample size of sites. Large industry surveys as well as case studies and limited sample sizes are acceptable.
Applicability For surrogate data, the data are expected to be similar for the industry or property of interest.
Surrogate data deemed applicable if they are inhalation exposure or airborne concentration data of NMP measured during paint stripping.
Page 132 of 281

D-3 Industries that Employ Paint Stripping Activities Because a variety of industries include paint stripping among their business activities, an effort was made to determine and characterize these industries. EPA/OPPT reviewed the published literature and evaluated the 2007 North American Industry Classification System (NAICS) codes to determine industries that likely included paint stripping activities presented in Table_Apx D-2. Table_Apx D-2 2007 North American Industry Classification System (NAICS) Codes Paint Stripping Activities
2007 NAICS 2007 NAICS Title Rationale for Inclusion of NAICS with Paint
Stripping Activities 238320 Painting and wall covering contractors US Census reports an index entry of “Paint and wallpaper
stripping” (USDOC, 2007a).
238330 Flooring contractors US Census reports index entries of “Floor laying, scraping, finishing and refinishing” and “Resurfacing hardwood flooring”(USDOC, 2007a). The National Institute for Occupational Safety and Health (NIOSH) cites the paint stripping of flooring by a wood flooring and restoration company (NIOSH, 1993).
811121 Automotive body, paint and interior repair and maintenance
NAICS code 811121 is identified for automobile refinishing per the OECD Coating Application via Spray-Painting in the Automotive Refinishing Industry ESD (OECD, 2010).
811420 Reupholstery and furniture repair US Census reports index entries of “Furniture refinishing shops” and “Restoration and repair of antique furniture” (USDOC, 2007a).
711510 Independent artists, writers and performers
US Census reports index entries of “Painting restorers, independent” and “Conservators (i.e., art, artifact restorers), independent” (USDOC, 2007a). Research has shown art conservation to use paint strippers based on DCM or, preferably, NMP (Wollbrinck, 1993).
712110 Museums Research has shown art conservation to use paint strippers based on DCM or, preferably, NMP (Wollbrinck, 1993).
336411 Aircraft manufacturing US Census reports an index entry of “Aircraft rebuilding (i.e., restoration to original design specifications)” (USDOC, 2007a). Paint removal during the restoration process may use DCM- or NMP-based paint strippers.
336611 Ship building and repairing US Census 2007 NAICS definition includes shipyards involved in the construction of ships as well as “their repair and conversion and alteration” (USDOC, 2007a). Any paint removal activities during repair, conversion and alteration may use DCM- or NMP-based paint strippers.
Page 133 of 281

D-4 Occupational Paint Stripping Processes and Associated Worker Activities
Techniques for paint stripping typically include manual coating, tank dipping and spray application (TNO, 1999). Pouring, wiping and rolling are also possible application techniques and application can be manual or automated (ECHA, 2011). An individual’s exposure to paint stripping chemicals greatly depends on control measures taken and work practices adopted (TNO, 1999). The following sections summarize processes and activities for the industries found to employ paint stripping. Paint Stripping By Professional Contractors Paint strippers can be used by professional contractors to strip paint and varnish from walls, wood flooring and kitchen and wood cabinets. Professional contractors are expected to purchase strippers in commercially available container sizes that commonly range from 1 liter up to 5 gallons, although they may also purchase consumer paint stripper products from hardware stores. Stripper is typically applied to wall or floor surfaces using a hand-held brush. Strippers used in these applications often have a high viscosity since they can be applied to vertical surfaces. After application, the stripper is allowed to set and soften the old coating. Once the stripper has finished setting, the old coating is removed from the surface by scraping and brushing. During wood floor stripping, old coating and stripper may also be removed using an electric floor buffer. After the old coating is removed, the surface is wiped clean before moving to the next stages of the job. The stripping process is often completed on an incremental basis with treatment for one section of wall or flooring being completed before moving to the next section (EC, 2007; IRTA, 2006; NIOSH, 1993; TNO, 1999). Professional contractors can use portable local exhaust ventilation machines to increase ventilation in the vicinity of the paint stripping (EC, 2007). Graffiti Removal Graffiti removal is expected to employ similar job-site characteristics as professional contractors as opposed to the fixed facility operations performed in the other studied industries. Swedish studies of graffiti removal companies (using both DCM- and NMP-based solvents) identified that solvents are either spray or brush applied. Sprayed solvents can be swabbed or wiped with a cloth or tissue. After spraying and wiping or brushing the solvent on the surface, the surface is then washed with heated (70oC) wash water using a high-pressure spray. The observed work was performed in train depots and underground stations and included semi-confined spaces, such as elevators and train cars. The study authors noted poor ventilation in the semi-confined spaces. The authors also noted the potential for members of the general public to be indirectly exposed as work was conducted during the day while travelers were occupying the train depots and stations (Anundi et al., 2000; Anundi et al.,
Page 134 of 281
1993). The prevalence of graffiti removal companies in the US is uncertain. Graffiti removal in the US may be performed by public works municipal workers or contractors. Paint Stripping at Automotive Body Repair and Maintenance Shops Automotive refinishing shops apply coatings to motor vehicles subsequent to the original manufacturing process. The overall refinishing process typically involves the following steps:
• Structural repair; • Surface preparation (cleaning and sanding); • Primer coat mixing; • Spray application of primer coat; • Curing; • Sanding; • Solvent wipe-down; • Topcoat (basecoat color and clearcoat) mixing; • Spray application of topcoat; and • Curing.
The surface preparation step of the refinishing process involves “removing residual wax, grease or other contaminants from the surface to be painted, to ensure adhesion of the new coating. The new coating may be applied over an existing coating if it is free of chips or cracks after it has been roughened through sanding. Alternatively, the previous coating may be removed using a mechanical method (e.g., sanding) or a paint-removing solvent. After the coating is roughened or removed, the surface is typically wiped down with a solvent- or water-based surface preparation product” (OECD, 2010). More detailed information on the methods used to apply paint stripper to motor vehicles was not identified. Wood Furniture Stripping During furniture stripping, paint stripper may be applied to the furniture by either dipping the furniture in an open tank containing the stripper, brushing or spraying the stripper onto the furniture surface or manually applying the stripper. Larger facilities may pump the stripper through a brush. The application method depends on the size and structure of the furniture as well as the capabilities of the facility. The application area typically has a sloped surface to allow for collection and recycling of unused stripper. Larger facilities use a flow tray to apply the stripper to parts. The flow tray is a sloped, shallow tank with a drain at the lower end. After application, the stripper is left to soak on the furniture surface to soften the surface coating. Once soaking is complete, the unwanted coating is scraped and brushed from the furniture surface. The furniture is then transferred to a washing area where residuals are washed from the furniture. Washing can be performed using low-pressure washing operations or high-pressure water jets or high-pressure wands. Wash water may contain oxalic acid to brighten the wood surface. Wash water is collected and either recycled or disposed of as waste. After washing, the furniture is transferred to a drying area where it is allowed to dry before being
Page 135 of 281

transferred to other refinishing processes (e.g., sanding, painting, reupholstery) (HSE, 2001; IRTA, 2006; NIOSH, 1990, 1992). Larger facilities likely purchase stripper in drum quantities from suppliers. Smaller facilities that use hand stripping instead of stripping equipment likely purchase their stripper from hardware and home improvement stores. Stripper applied using application equipment has low viscosity so it can be pumped through the pumps in the flow tray. Stripper applied using hand stripping are typically more viscous so they will remain on the part long enough to strip the coating (IRTA, 2006). Figure_Apx D-1 shows a typical flow tray used by larger furniture strippers to apply stripper to furniture parts, obtained from IRTA (2006). Figure_Apx D-2 shows a typical water wash booth used to wash stripper and coating residue from stripped furniture, obtained from IRTA (2006). Figure_Apx D-3 shows an example diagram of a dipping tank for furniture stripping complete with local exhaust ventilation, obtained from HSE (2001).
Figure_Apx D-1 Typical Flow Tray for Applying Stripper to Furniture (IRTA, 2006)
Page 136 of 281

Figure_Apx D-2 Typical Water Wash Booth Used to Wash Stripper and Coating Residue from Furniture
(IRTA, 2006)
Figure_Apx D-3 Example Diagram of a Dipping Tank for Furniture Stripping (HSE, 2001)
Page 137 of 281

Art Restoration and Conservation Art restoration and conservation can include the care and maintenance of paintings to reverse negative effects of aging and dirt accumulation. It can also include repairing paintings that have suffered paint loss, weakened canvas, tears, water damage, fire damage and insect damage (Smithsonian, 2012b). Art restoration and conservation can include paint cleaning, which can entail removing dirt and other obscuring material, removing varnish or removing overpaint while maintaining the original layer of paint (Smithsonian, 2012a). These activities can involve the use of paint strippers. Although paint strippers used in this field can contain DCM, the use of DCM is not always favored as DCM can penetrate through the overpaint layer that is being removed and into the original paint layer that is being conserved. NMP may serve as a suitable alternate for DCM in strippers used in this field (Wollbrinck, 1993). More detailed information on the use of paint strippers in art restoration and conservation was not identified. It is anticipated that paint strippers are applied manually in this field. Aircraft Paint Stripping During aircraft paint stripping, paint stripper is pumped from bulk storage containers or tanks and applied to the body of the aircraft using hoses. Once the paint stripper has been applied, it is allowed to set for a certain period of time (usually about 30 minutes) to allow the paint to soften. Once setting is complete, the stripper and loose paint are scraped down into a collection area. Any remaining stripper and paint residue are then brushed or washed away with water and brushes. Once the surface of the aircraft has dried, a new layer of primer, paint and top coat are applied (NIOSH, 1977). Ship Paint Stripping Process description information for paint stripping of ships has not been identified. It is anticipated that paint stripping of ships may involve similar processes as the paint stripping of aircraft. Respiratory Protection The 13 MSDS for paint strippers obtained through the literature search were reviewed for recommended respiratory protection information. Of these 13 MSDS, only three contained NMP, one of which also contained DCM. One of the NMP-only MSDS recommends a NIOSH-approved respirator for organic solvent vapors without further specification of the respirator type (W. M. Barr, 2011). The second NMP-only MSDS recommends that a “NIOSH/MSHA-approved air-purifying respirator with an organic vapor cartridge or canister may be permissible under certain circumstances where airborne concentrations are expected to exceed exposure limits” (W. M. Barr, 2009a). It further states that protection provided by air-purifying respirators may be limited, in which case, a positive pressure, air-supplied respirator is recommended (such as for uncontrolled releases or unknown exposure levels) (W. M. Barr, 2009a). The MSDS for the paint stripper that contained both DCM and NMP recommends a
Page 138 of 281

NIOSH-approved self-contained breathing apparatus (SCBA) (W. M. Barr, 2009b). However, the recommendation for SCBA is likely heavily influenced by the presence of DCM in addition to NMP. Dermal Protection The 13 MSDS for paint strippers obtained through the literature search were reviewed for recommended dermal protection information. Of these 13 MSDS, only three contained NMP, one of which also contained DCM. All of the three MSDS mentioning NMP recommended either chemical-resistant or impermeable gloves. One MSDS recommended nitrile gloves and another recommended nitrile or neoprene gloves. All of the three MSDS recommend safety glasses, chemical goggles or face shields for eye protection or where eye or face contact is likely (W. M. Barr, 2009a, 2009b, 2011).
D-5 Facility and Population Data and Information EPA/OPPT attempted to estimate the current total number of workers in the potentially exposed populations. Knowing the sizes of exposed populations provides perspective on the potential prevalence of the health effects. According to the 1983 National Occupational Exposure Survey (NOES), over 25,000 US employees were exposed to NMP at 2,450 facilities. Thirteen percent of these exposures occurred during manufacture, whereas 87 percent of the exposures occurred from NMP-based product use (EPA, 1990). However, it is unknown what fraction of the NMP-based product use exposures were due to paint stripping. Estimates of the number of workers exposed to DCM during paint stripping provide perspective on the number of workers potentially exposed to NMP during paint stripping. EPA/OPPT estimated that over 230,000 workers nationwide are directly exposed to DCM from DCM-based strippers. EPA/OPPT assumes that DCM is more widely used as a paint stripper than NMP; therefore, it is likely that fewer workers are exposed to NMP than to DCM during paint stripping. Therefore, it is likely that less than 230,000 workers nationwide are directly exposed to NMP during paint stripping. These estimates do not account for workers within the facility who are indirectly exposed. EPA/OPPT’s “TSCA Work Plan Chemical Risk Assessment for Dichloromethane: Paint Stripping Use” discussed how the estimate of number of workers exposed to DCM was derived (EPA, 2014b). EPA’s 2007 National Emission Standards for Hazardous Air Pollutants (NESHAP) Paint Stripping Operations at Area Sources proposed rule cited a previous estimate from 1999 that approximately 27,000 facilities perform paint stripping nationwide (EPA, 2007). This estimate includes facilities that perform chemical paint stripping as well as physical paint stripping (such as mechanical and thermal paint stripping). The fraction of these 27,000 facilities that used NMP-based paint stripping is not known.
Page 139 of 281

This section summarizes data on the number of establishments, number of paid employees and workers and production hrs and work day estimates (for manufacturing industries) for each paint stripping industry. These industry population estimates are for the industries as a whole and do not estimate the fractions of facilities and workers that use NMP-based paint stripping. Some of these data are useful for determining the average number of workers per establishment, which can indicate relative sizes of the businesses. It may be noted that population demographics were not examined for this assessment, but may be worthy of consideration in a more detailed assessment. For example, some segment of the worker population could include children (e.g., teenagers). Numbers of Workers per Facility by Industry Paint Stripping By Professional Contractors, Bathtub Refinishing and Graffiti Removal Table_Apx D-3 summarizes the number of establishments and average number of workers for painting and wall covering contractors and flooring contractors according to the 2007 US Economic Census (USDOC, 2007b). The Census data do not include hours worked for construction industry sectors. Note that these Census data do not include bathtub refinishers/reglazers or graffiti removal. Census data that include bathtub refinishers/reglazers or graffiti removal were not identified. Table_Apx D-3 2007 US Economic Census Data for Painting and Wall Covering and Flooring Contractors
2007 NAICS 2007 NAICS Title 2007 Number of Establishments
2007 Average Number of Construction Workers
238320 Painting and Wall Covering Contractors
35,619 174,276
238330 Flooring Contractors
14,575 49,085
Source: USDOC (2007a) The number of painting and wall covering contractors and flooring contractors who use NMP-based paint strippers or the number of jobs per year a contractor uses NMP-based paint strippers and the number of workers within a job site exposed to NMP-based paint strippers is unknown. The number of establishments and workers from the US Census provide some context for potential numbers of establishments and workers potentially exposed to NMP during paint stripping. While some fraction of these workers may be exposed to NMP, the Census data do not include self-employed, single person businesses and some of these workers may also be exposed to NMP. The Census data indicate an average of approximately four to five workers per establishment.
Page 140 of 281

Many bathtub refinishers are self-employed or a small business (CDC, 2012b). Past investigations of fatalities that occurred during bathtub refinishing indicate it is likely that only one contractor refinishes a bathtub at a time (CDC, 2012a, 2012b; MSU/MIFACE, 2011). Swedish studies of graffiti removal companies identified one company with 12 workers (Anundi et al., 1993) and a separate study monitored a total of 38 workers over five companies (an average of seven to eight workers monitored per company) (Anundi et al., 2000). As previously discussed, the prevalence of graffiti removal companies in the US is uncertain and graffiti removal may also be performed by public works municipal workers or contractors. Paint Stripping at Automotive Body Repair and Maintenance Shops Table_Apx D-4 summarizes the number of establishments and average number of paid employees for automotive body, paint and interior repair and maintenance according to the 2007 US Economic Census. The Census data do not include hrs worked for this industry sector. The Census data indicate an average of approximately six employees per facility. A 2003 Rhode Island study observed two comparably-sized vehicle repainting shops. One of the two shops had a total of 14 employees (Enander et al., 2004). Table_Apx D-4 2007 US Economic Census Data for Automotive Body, Paint and Interior Repair and Maintenance
2007 NAICS 2007 NAICS Title 2007 Number of Establishments
2007 Number of Paid Employees
811121 Automotive Body, Paint and Interior Repair and Maintenance
35,581 223,942
Source: USDOC (2007b). The present day number of automotive body repair and maintenance shops within the US that use NMP-based paint strippers and the number of employees within an establishment exposed to NMP-based paint strippers are unknown. Therefore, the number of establishments and employees from the US Census are possibly overestimates of the number of establishments and employees potentially exposed to NMP during paint stripping. Wood Furniture Stripping Table_Apx D-5 summarizes the number of establishments and average number of paid employees for reupholstery and furniture repair according to the 2007 US Economic Census.
Page 141 of 281

The Census data do not include hrs worked for this industry sector. The Census data indicate an average of approximately three employees per facility. Table_Apx D-5 2007 US Economic Census Data for Reupholstery and Furniture Repair
2007 NAICS 2007 NAICS Title 2007 Number of Establishments
2007 Number of Paid Employees
811420 Reupholstery and Furniture Repair
4,693 16,142
Source: USDOC (2007b). The present-day population of reupholstery and furniture repair establishments that use NMP-based paint strippers and the number of employees within an establishment exposed to NMP-based paint strippers are unknown. Therefore, the number of establishments and employees from the US Census are possibly overestimates of the population of establishments and employees potentially exposed to NMP during paint stripping. Art Restoration and Conservation Table_Apx D-6 summarizes the number of establishments and average number of paid employees for independent artists, writers and performers and museums according to the 2007 US Economic Census. The Census data do not include hrs worked for these industry sectors. Table_Apx D-6 2007 US Economic Census Data for Industry Sectors that May Engage in Art Restoration and Conservation Activities
2007 NAICS 2007 NAICS Title 2007 Number of Establishments
2007 Number of Paid Employees
711510 Independent Artists, Writers and Performers
20,612 48,321
712110 Museums 4,664 83,899 Source: USDOC (2007b) NAICS code 711510 includes a wide variety of professions, including independent art restorers and independent conservators. The majority of the professions listed within this NAICS code according to the US Census Bureau are not expected to engage in paint stripping. Furthermore, the extent that art restorers and conservators engage in paint stripping, particularly using NMP-based paint strippers, is unknown. Similarly, the number of museums within NAICS code 712110 that engage in paint stripping and use NMP-based paint strippers, is unknown. Therefore, the number of establishments and employees from the US Census are likely
Page 142 of 281

overestimates of the number of establishments and employees potentially exposed to NMP during paint stripping. Aircraft Paint Stripping Table_Apx D-7 summarizes the number of establishments, average number of production workers and production workers hrs for aircraft manufacturing according to the 2007 US Economic Census. The table also estimates the average worker days/year and average worker hrs/day. These parameters are estimated from the production workers hrs and the average number of production workers. The average worker days/year are estimated assuming 8 worker hrs/day and the average worker hrs/day are estimated assuming 250 worker days/yr. The estimates of worker days/year and worker hrs/day are within 10 percent of the EPA/OPPT New Chemicals Program default values of 250 days/yr and 8 hr/day, respectively. The Census data indicate an average of approximately 320 production workers per facility. This observation is consistent with two dichloromethane exposure studies identified in the literature. A 1977 NIOSH study of an aircraft refinishing facility observed approximately 1,400 employees working in the dock area, which constituted seven refinishing docks but appeared to exclude workers and employees associated with security checkpoints, the front lobby, cafeterias, the credit union, the turbine shop, the medical bay and maintenance activities (NIOSH, 1977). Similarly, a 1994 French study of an aeronautical workshop monitored 30 painters, although the total number of employees was not identified (Vincent et al., 1994). Table_Apx D-7 2007 US Economic Census Data for Aircraft Manufacturing
2007 Economic Census Data Parameters Calculated from
the Corresponding 2007 Economic Census Data
2007 NAICS Code
2007 NAICS Title
Number of Establishments
Average Number of Production
Workers
Production Workers
Hrs (1,000 hr)
Average Worker Days
per Year (Assuming 8 hr/day)
Average Worker Hrs
per Day (Assuming 250
Days/yr)
336411
Aircraft Manufacturing
254 81,456 157,589 242 7.74
Source: USDOC (2007b). The present-day number of aircraft manufacturing establishments that use NMP-based paint strippers and the number of employees within an establishment exposed to NMP-based paint strippers are unknown. Therefore, the number of establishments and employees from the US
Page 143 of 281

Census are possibly overestimates of the number of establishments and employees potentially exposed to NMP during paint stripping. Ship Paint Stripping Table_Apx D-8 summarizes the number of establishments, average number of production workers and production workers hrs for ship building and repairing according to the 2007 US Economic Census. The table also estimates the average worker days/year and average worker hrs/day. These parameters are estimated from the production workers hrs and the average number of production workers. The average worker days/year are estimated assuming 8 worker hrs/day and the average worker hrs/day are estimated assuming 250 worker days/yr. The estimates of worker days/year and worker hrs/day are within 10 percent of the EPA/OPPT New Chemicals Program default values of 250 days/yr and 8 hr/day, respectively. The Census data indicate an average of approximately 100 production workers per facility. Table_Apx D-8 2007 US Economic Census Data for Ship Building and Repairing
2007 Economic Census Data
Parameters Calculated from the Corresponding 2007 Economic Census
Data
2007 NAICS Code
2007 NAICS Title
Number of Establishment
s
Average Number of Production
Workers
Production Workers
Hrs (1,000 hr)
Average Worker Days
per Year (Assuming 8 Hrs/day)
Average Worker Hrs
per Day (Assuming
250 Days/yr)
336611 Ship building and repairing
656 65,737 136,929 260 8.33
Source: USDOC (2007b). The number of ship building and repair establishments that use NMP-based paint strippers and the number of employees within an establishment exposed to NMP-based paint strippers are unknown. Therefore, the number of establishments and employees from the US Census are possibly overestimates of the number of establishments and employees potentially exposed to NMP during paint stripping.
D-6 Dermal Exposure Parameters EPA/OPPT identified dermal exposure parameter values from the literature for use in the PBPK modeling, dermal exposure assessment. Table 2-1 summarizes the parameter values used for the occupational dermal exposure assessment and this section provides a detailed discussion of
Page 144 of 281

the selected values. The dermal exposure parameters needed for the PBPK modeling are the following:
• NMP weight fraction in the liquid paint stripping product; • Skin surface area in contact with the liquid paint stripping product; • Body weight of the individual handling the liquid paint stripping product; and • Duration of dermal contact with the liquid paint stripping product.
EPA/OPPT performed the dermal exposure assessment for the sub-population most sensitive to NMP: pregnant women. Therefore, several of the dermal exposure parameters, as described below in this section, are specific to pregnant women. The occupational dermal exposure assessment modeled a low-end, high-end and mid-range value for several of the parameters described below. In each case, the mid-range value is the mid-point between the low-end and high-end values. EPA/OPPT provided this mid-range value to provide perspective on the variability of the parameter values since EPA/OPPT was not able to determine statistical distributions of values for the parameters. NMP Weight Fraction in Liquid Paint Stripping Product Both the occupational and consumer dermal exposure assessments require the weight fraction of NMP in the paint stripping product. Paint stripping products marketed for professional applications may contain higher concentrations of the active ingredients than those marketed for consumer applications. For the consumer dermal exposure assessment, EPA/OPPT surveyed several material safety data sheets (MSDS) for NMP-containing paint strippers. The lowest NMP weight fraction identified in this sample of MSDS was 0.25. EPA/OPPT used this value of 0.25 as a low-end value for the PBPK modeling for both the consumer and occupational dermal exposure assessments. However, to account for uncertainties in the formulations of paint strippers that workers may actually use, EPA/OPPT used a high-end value of one for the PBPK modeling for the occupational dermal exposure assessment as opposed to the value of 0.53 used in the consumer dermal exposure assessment. Skin Surface Area in Contact with Liquid Paint Stripping Product Both the consumer and occupational dermal exposure assessments used skin surface area values for the hands of women, obtained from the 2011 edition of EPA’s Exposure Factors Handbook (Table 7-13) (EPA, 2011a). The Exposure Factors Handbook does not differentiate skin surface area values between pregnant and non-pregnant women. For the occupational dermal exposure assessment, EPA/OPPT used a high-end value of 890 cm2, which is representative of two, full hands exposed to a liquid. EPA/OPPT used a low-end value of 445 cm2, which is half of two, full hands exposed to a liquid and represents only the palm-side of both hands exposed to a liquid.
Page 145 of 281

Body Weight Both the consumer and occupational dermal exposure assessments used the 50th percentile body weight value for pregnant women in their first trimester, which is 74 kg. EPA/OPPT obtained this value from the 2011 edition of EPA’s Exposure Factors Handbook (Table 8-29) (EPA, 2011a). Duration of Dermal Contact For the occupational dermal exposure assessment, EPA/OPPT assumed a low-end value of 1 hr/day, which is a reasonable assumption considering the initial contact time with the paint stripper plus the time after direct contact when the thin film evaporates from and absorbs into the skin. EPA/OPPT assumed a high-end value of 8 hrs/day (i.e., a full shift). The mid-range value is 4 hrs/day (the calculated mid-point of 4.5 was rounded to 4 hrs/day). The low-end and high-end values are consistent with EPA/OPPT’s documented standard model assumptions for occupational dermal exposure modeling (EPA, 1991a). Associated Background and Uncertainties A survey of a single graffiti removal company in Sweden found 87% of graffiti removers use gloves. Only a small fraction of these workers used gloves made of optimal material for protection against NMP and some used cloth or leather gloves. A majority of the workers reported splashes to skin with varying frequency (occasional to several times per week). Some workers encountered exposures through clothing “soaked” with stripper formulations. The survey results may be reasonable to assume applicable to NMP-paint stripping uses in other types of work settings (Anundi et al., 2000). Data and information (e.g., types and prevalence of glove materials used, ranges of protections provided by glove materials, splash amounts contacting skin and associated frequencies and durations, liquid exposures through wet clothing) are inadequate to make reasonable parameter assumptions needed to model quantitative estimates of dermal liquid exposure to workers who routinely wear gloves. Therefore, EPA/OPPT employed a “what-if” type assumption of 90 percent reduction of hand exposure due to use of gloves made of materials most effective to protect against NMP. Data and information on prevalence and types of respirators used are also incomplete. Therefore, EPA/OPPT employed a “what-if” type assumption that the use of respirators providing an assigned protection factor (APF) of 10 will reduce inhalation concentrations by a factor of 10 when this type of respirator is properly used.
D-7 Occupational Inhalation Exposure Literature Data EPA/OPPT used existing exposure data to estimate occupational exposures to NMP by inhalation. Several exposure studies were identified through a literature search. Exposure studies were only identified for the following industries and settings:
Page 146 of 281

• Professional contractors; • Wood furniture stripping; • Graffiti removal; and • Non-specified workplace settings.
Table_Apx D-9 summarizes the NMP inhalation exposure data obtained from the literature search. These data, including references, are discussed in detail in the sections that follow. Table_Apx D-9 Summary of NMP Inhalation Exposure Data Identified in the Literature
Industry Category
Use Description
Airborne Concentration
(mg/m3) Characterization Notes Professional Contractors (in home)
Floor stripping 9.3 Personal sample; 48-
min sample
Mean of these four samples is 13.4 mg/m3 (3.3 ppm). US NIOSH study of a flooring contractor, conducted in 1993.
Professional Contractors (in home)
Floor stripping 17.4
Personal sample; 93-min sample. Stripping solution was applied during this sample.
Professional Contractors (in home)
Floor stripping 5.7
Personal sample; 64-min sample. The window was opened during this sample.
Professional Contractors (in home)
Floor stripping 21.1
Personal sample; 46-min sample. Stripping solution was applied during this sample.
Professional Contractors (in home)
Floor stripping 12.6 Personal sample; 47-
min sample Mean of these three samples is 16.2 mg/m3 (4.0 ppm). A coat of stripping solution was applied to the floor during each sampling period; windows and doors were closed. US NIOSH study of a flooring contractor, conducted in 1993.
Professional Contractors (in home)
Floor stripping 21.1 Personal sample; 52-
min sample
Professional Contractors (in home)
Floor stripping 14.2 Personal sample; 43-
min sample
Professional Contractors (chamber test)
Manual stripping 39 Personal sample; 129-
min sample
Consumer exposures; Brush application - use as surrogate for workers.
Professional Contractors (chamber test)
Manual stripping 37 Personal sample; 130-
min sample
Consumer exposures; Brush application - use as surrogate for workers.
Professional Contractors
Manual stripping 37 Personal sample; 143-
min sample
Consumer exposures; Brush application - use as surrogate for workers.
Page 147 of 281

Industry Category
Use Description
Airborne Concentration
(mg/m3) Characterization Notes (chamber test) Furniture stripping
Furniture stripping 1.0-3.8 TWAs range 125-167
min Study of two shops in Germany.
Non-specific Workplace Settings
Paint stripping 64
Highest value in range; 8-hr TWA; personal breathing zones
Non-specific Workplace Settings
Paint stripping 280 Highest value in range;
1-hr peak samples
Non-specific Workplace Settings
Paint stripping 0.01-6 Range; Sampling time
not presented
Dipping for paint stripping and degreasing. Study conducted in the UK.
Graffiti removal
Graffiti removal 0.01-30 Short-term; Sampling
time not presented Study conducted in the UK.
Graffiti removal
Graffiti removal 0.56
Personal sampling; 8-hr TWA; average for 6 workers
Depot 1 and 2. Geometric mean=0.4 mg/m3; Range=0-1.68 mg/m3. Poorly ventilated, semi-confined spaces. Study conducted in Sweden in 2000.
Graffiti removal
Graffiti removal 1.78
Personal sampling; 8-hr TWA; average for 3 workers
Depot 3 and 4. Geometric mean=1.5 mg/m3; Range=0.61-2.56 mg/m3. Poorly ventilated, semi-confined spaces. Study conducted in Sweden in 2000.
Graffiti removal
Graffiti removal 1
Personal sampling; 8-hr TWA; average for 25 workers
Underground stations. Geometric mean=0.67 mg/m3; Range=0.03-4.52 mg/m3. Poorly ventilated, semi-confined spaces. Study conducted in Sweden in 2000.
Graffiti removal
Graffiti removal 4.71
Personal sampling; 15-min (ST), average of 40 samples
Geometric mean=1.97 mg/m3; Standard deviation=6.17 mg/m3; Range=0.01-24.61 mg/m3. Poorly ventilated, semi-confined spaces. Study conducted in Sweden in 2000.
Graffiti removal
Graffiti removal 9.9 Personal sampling; 15-
min (ST), 1 sample
Sometimes workers worked in semi-confined spaces. Did not wear respirators. Study conducted in Sweden in 1992.
Page 148 of 281

Industry Category
Use Description
Airborne Concentration
(mg/m3) Characterization Notes Note: Complete references can be found in the descriptive paragraphs, below
Paint Stripping by Professional Contractors In 1993, NIOSH was requested to conduct a health hazard evaluation (HHE) during the renovation of an antique residence in Atlanta, Georgia. NIOSH was requested to conduct the HHE by the owner of a wood flooring and restoration company for the purpose of assessing exposures during the use of an experimental solvent to remove paint from the wood floor of the building. The solvent was highly viscous, had a pH of two to three and a vapor pressure of five to six mmHg at 20oC and its primary component was NMP (at 65 to 79 percent). The renovation work was conducted entirely by the company owner. NIOSH conducted air sampling on November 27 and December 14, 1993 and obtained personal breathing zone and area air samples (NIOSH, 1993). The worker paint stripped the floor using a passive refinishing method. In this method, the worker brush-applies the solvent to the floor, allows it to set for 30 to 60 minutes, then uses a powered electric buffer with bristles to agitate and dislodge the loosened paint. The worker then uses a rubber squeegee to remove the spent solvent-paint mixture and mixes it with sawdust for disposal. Sawdust is applied to the floor, scrubbed with a wire brush and scraped with a putty knife. The worker applies a water-alcohol mixture and additional sawdust to the floor, performs additional buffing with an abrasive disc and repeats the process if needed (NIOSH, 1993). On the November 22nd sampling day, the average concentration of the personal, breathing zone samples was 3.3 ppm (13.4 mg/m3) (sampling times ranged from 46 to 93 minutes). Area samples taken at two feet and five feet above the floor had average concentrations of 3.9 ppm (15.8 mg/m3) and 3.6 ppm (14.6 mg/m3), respectively (sampling times ranged from 40 to 127 minutes). The door to the room was kept closed for the duration of the work, but the window was both closed and opened during the work day. The lowest concentrations were observed while the window was open and while solvent was not being applied to the floor (NIOSH, 1993). On the December 14th sampling day, the average concentration of the personal, breathing zone samples was 4.0 ppm (16.2 mg/m3) (sampling times ranged from 43 to 52 minutes). Area samples taken two feet above the floor had an average concentration of 7.7 ppm (31.2 mg/m3) (sampling times ranged from 42 to 46 minutes). The door to the room was again kept closed for the duration of the work, but the window was also kept closed the entire work day due to inclement weather. The higher concentrations were expected due to the closed window as compared to the first sampling day (NIOSH, 1993).
Page 149 of 281

NIOSH noted that the worker wore a half-mask air-purifying respirator with organic vapor cartridges during the paint stripping process. NIOSH further noted that protective gloves were used intermittently and no mechanical ventilation was used during the renovation (NIOSH, 1993). An EU report states that there is “probably…no fundamental difference between the application of paint removers by professional painters and consumers” and goes on to further state that, in regard to the cited consumer exposure studies, “the test situations and data described…are assumed valid for occupational exposure during professional use as well” (TNO, 1999). However, professional contractors are expected to have a higher frequency of exposure as compared to consumers. It is also not clear whether overall activity patterns and practices of contractors match those of consumers or whether the overall distributions of exposures of contractors and consumers have any semblance to one another. Despite these uncertainties, some of the literature data for consumers may be considered. Midwest Research Institute (MRI) prepared a report for EPA in 1994 that resulted from an experimental investigation of consumer exposures to solvents contained in paint stripping products with eliminated or reduced DCM content. MRI investigated five paint strippers, one of which contained NMP (other ingredients in this product were not specified). The paint stripping was conducted in a laboratory-based, environment-controlled, room-sized test chamber. The paint strippers were used on a plywood panel coated with a primer coat and two finish coats. The air exchange rate for the experiments ranged from 0.54 to 0.76 ACH, with an average of 0.58 ACH. The air exchange rate of approximately 0.5 ACH was intended to replicate the ventilation rate of an enclosed room in a typical residence as a worst-case scenario. During each experiment, the following samples were taken: a personal breathing zone sample of the test subject using the paint stripper; two stationary air samples for the duration of the paint stripping task; and one stationary air sample beginning at the start of the paint stripping and lasting for 8 hrs (EPA, 1994a). Although this investigation simulated in-home consumer paint stripping of wood products, EPA/OPPT used these data as surrogate data for in-home paint stripping performed by professional contractors. In the MRI investigation, the only NMP-based paint stripper was brush applied. The breathing zone concentrations of NMP measured by gas chromatography with flame ionization detection (GC-FID) from time-integrated samples ranged from 37 to 39 mg/m3 (9.1 to 9.6 ppm) (sampling times ranging from 129 to 143 minutes). The stationary length-of-task concentrations ranged from 38 to 45 mg/m3 (9.4 to 11.1 ppm). The stationary, 8-hr TWA concentrations ranged from 46 to 74 mg/m3 (11.3 to 18.2 ppm) (EPA, 1994a). Section E-1 of Appendix E discusses the investigation’s fourfold discrepancy in the NMP measurement results by Fourier transform infrared (FTIR) versus GC-FID. Based on the explanation provided by MRI regarding this discrepancy, EPA/ OPPT decided that time-integrated GC-FID sampling results summarized above are likely more reliable.
Page 150 of 281
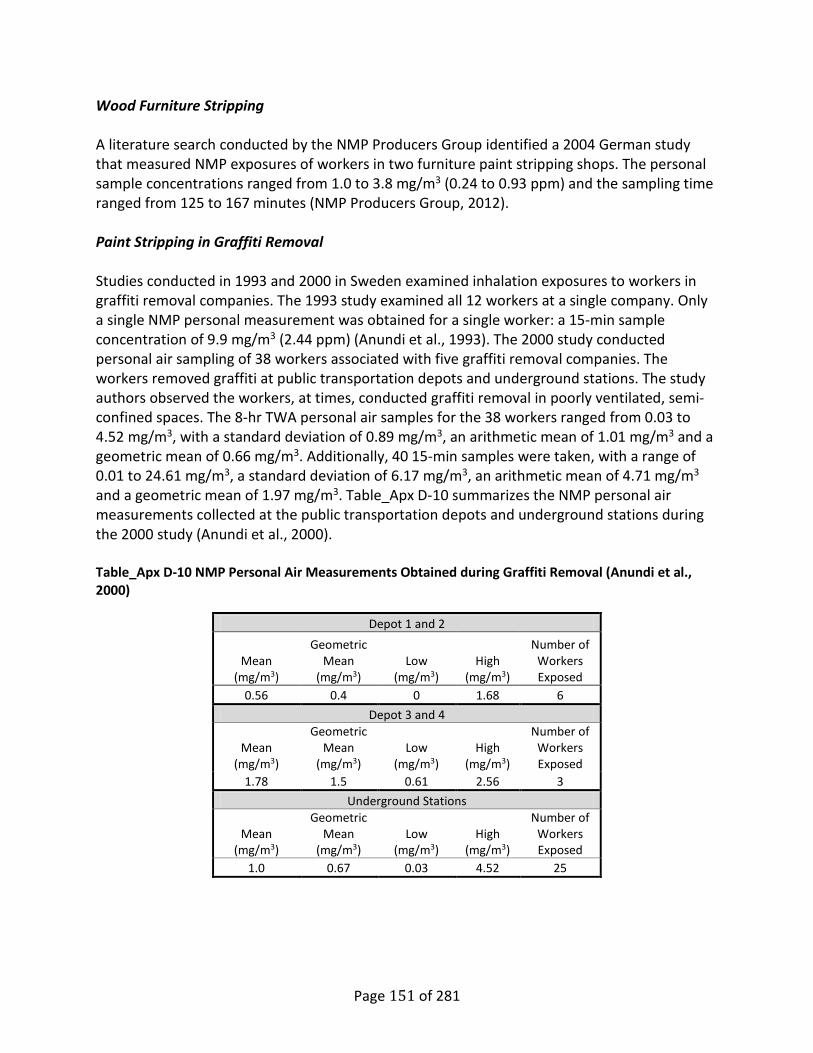
Wood Furniture Stripping A literature search conducted by the NMP Producers Group identified a 2004 German study that measured NMP exposures of workers in two furniture paint stripping shops. The personal sample concentrations ranged from 1.0 to 3.8 mg/m3 (0.24 to 0.93 ppm) and the sampling time ranged from 125 to 167 minutes (NMP Producers Group, 2012). Paint Stripping in Graffiti Removal Studies conducted in 1993 and 2000 in Sweden examined inhalation exposures to workers in graffiti removal companies. The 1993 study examined all 12 workers at a single company. Only a single NMP personal measurement was obtained for a single worker: a 15-min sample concentration of 9.9 mg/m3 (2.44 ppm) (Anundi et al., 1993). The 2000 study conducted personal air sampling of 38 workers associated with five graffiti removal companies. The workers removed graffiti at public transportation depots and underground stations. The study authors observed the workers, at times, conducted graffiti removal in poorly ventilated, semi-confined spaces. The 8-hr TWA personal air samples for the 38 workers ranged from 0.03 to 4.52 mg/m3, with a standard deviation of 0.89 mg/m3, an arithmetic mean of 1.01 mg/m3 and a geometric mean of 0.66 mg/m3. Additionally, 40 15-min samples were taken, with a range of 0.01 to 24.61 mg/m3, a standard deviation of 6.17 mg/m3, an arithmetic mean of 4.71 mg/m3 and a geometric mean of 1.97 mg/m3. Table_Apx D-10 summarizes the NMP personal air measurements collected at the public transportation depots and underground stations during the 2000 study (Anundi et al., 2000). Table_Apx D-10 NMP Personal Air Measurements Obtained during Graffiti Removal (Anundi et al., 2000)
Depot 1 and 2
Mean (mg/m3)
Geometric Mean
(mg/m3) Low
(mg/m3) High
(mg/m3)
Number of Workers Exposed
0.56 0.4 0 1.68 6 Depot 3 and 4
Mean (mg/m3)
Geometric Mean
(mg/m3) Low
(mg/m3) High
(mg/m3)
Number of Workers Exposed
1.78 1.5 0.61 2.56 3 Underground Stations
Mean (mg/m3)
Geometric Mean
(mg/m3) Low
(mg/m3) High
(mg/m3)
Number of Workers Exposed
1.0 0.67 0.03 4.52 25
Page 151 of 281

A literature search conducted by the NMP Producers Group identified a 2004 UK study of graffiti removal, which resulted in short-term exposures ranging from 0.01 to 30 mg/m3 (0.002 to 7.4 ppm) (NMP Producers Group, 2012) Paint Stripping in Non-specific Workplace Settings Some NMP exposure data were identified for which workplace settings were not specified and more specific information on the industries (such as applicable NAICS or Standard Industrial Classification [SIC] codes, primary industrial functions or products or number of sites or workers) were not provided in the identified reference. A World Health Organization (WHO) report identified NMP exposures in a non-specified paint stripping industry in the literature. Personal breathing zone samples had 8-hr TWA exposures as high as 64 mg/m3 (16 ppm) and 1-hr peak exposures as high as 280 mg/m3 (69 ppm) (WHO, 2001). The NMP Producers Group literature search results were in general agreement with the WHO report. The NMP Producers Group identified four studies of non-specified paint stripping activities with peak exposure as high as 280 mg/m3 (69 ppm) (the same study cited in the WHO report). Additional exposures from a 2004 UK study were identified ranging from 0.01 mg/m3 (0.002 ppm) to 6 mg/m3 (1.5 ppm) associated with dipping for paint stripping and degreasing, but the sampling time was not specified (NMP Producers Group, 2012). OSHA IMIS Data EPA/OPPT searched the OSHA’s Integrated Management Information System (IMIS) database for OSHA and state health inspection data for NMP inhalation exposures. However, the limited NMP exposure data in the IMIS database (42 IMIS sampling data points range from non-detect to 4.3 ppm TWA (17 mg/m3)) did not include any industries that matched the NAICS or SIC codes identified as relevant for paint stripping. Therefore, the IMIS data were not included in the risk analyses.
Derivation of NMP Concentration Conversion Factor for Occupational Exposure Calculations A factor to convert between airborne concentrations measured in volume- or mole-based ppm and airborne concentrations measured in mg/m3 was not identified in the literature search. Therefore, a conversion factor was derived and the methodology of this derivation is presented here. To convert the units of concentration between a volume- or mole-based ppm to mg/m3 at ambient room conditions, it was assumed that the ideal gas law applies to a mixture of NMP and air at ambient conditions. The mass-based concentration of NMP in air from the ideal gas law was solved for as follows:
Page 152 of 281

Equation D-1 Mass Balanced Concentration of NMP
𝐶𝐶 =𝑚𝑚𝑣𝑣
=𝑦𝑦𝑦𝑦𝑦𝑦𝑅𝑅𝑅𝑅
𝑥𝑥 �1,000 𝑚𝑚𝑚𝑚
𝑚𝑚�𝑥𝑥 (
1000 𝑚𝑚𝑚𝑚𝑚𝑚𝑘𝑘𝑚𝑚𝑚𝑚𝑚𝑚
)
where:
C = NMP concentration (mg/m3); m = total mass of NMP (mg); V = total volume of gas (m3); y = mole fraction of NMP (mol/mol); P = total pressure (atm); M = molecular weight of NMP (g/mol); R = universal gas constant (m3-atm/kmol-K); and T = temperature (K).
Here, the mole fraction of NMP, y, is equal to the NMP concentration in ppm divided by 1 million. At ambient conditions (1 atm and 298 K), with an NMP molecular weight of 99.13 g/mol and a gas constant of 0.082 m3-atm/kmol-K, the unit conversion is 4.06 mg/m3 per ppm of NMP.
Appendix E CONSUMER EXPOSURE ASSESSMENT
E-1 Estimation of Emission Profiles for Paint Removers/Strippers
In the absence of actual air monitoring data for consumer use of an NMP paint stripper, EPA/OPPT reviewed several air monitoring studies for consumer paint strippers that used DCM-containing products, including EPA (1994a), EC (2004), a Consumer Product Safety Commission study (as cited in EPA, 1996; and Riley et al., 2000) and a study conducted in the Netherlands by van Veen et al. (2002). EPA/OPPT determined, however, that data from most of these studies could not be used for this assessment because of differences in the chemical properties between NMP and DCM. Most importantly, NMP has a much lower volatility and emission rate than DCM. Additionally, these studies generally did not reflect current use patterns in the US, did not provide sufficient raw data to support necessary calculations and/or were conducted using test chambers that did not provide air concentrations for areas other than the application room. EPA/OPPT identified one study as particularly useful for the estimation of emission profiles; a 1993 study conducted by MRI involved a series of chamber tests performed on five paint stripping products, including two containing DCM and one containing NMP (“Wood Finisher’s Pride”) (EPA, 1994a). For each test, both near real-time (continuous) samples and time-integrated samples were collected at breathing-zone height during paint stripping operations
Page 153 of 281

that were conducted according to manufacturer label instructions. The test chamber was intended to represent an enclosed consumer room with a nominal ventilation rate of 0.5 air changes/hr. The near real-time air concentrations were measured using a Fourier transform infrared (FTIR) spectrometer. The time-integrated samples were collected on activated charcoal sorbent tubes using personal and stationary samplers and were analyzed by gas chromatography with flame ionization detection (GC-FID). Additional stationary samplers inside the chamber and in the supply air of the chamber were run for an 8-hr period, but these results were not deemed useful for this analysis and are not discussed herein. EPA/OPPT considered the data from the three NMP runs conducted in the MRI study (identified as Runs 10, 11 and 12 in the MRI study and this appendix) for use in this emission modeling analysis. As described below, predicted NMP air concentrations from paint stripping were derived from time-varying emission profiles that were estimated by fitting the experimental chamber study data to exponential equations. Conceptual Approach Exponential Decay of Emissions. In evaluating the experimental data, an exponential-emission model was chosen because of the general shape of the concentration profile and its similarity to other emission behaviors (e.g., for chemicals released from applied paint). The equation for an exponentially decaying emission rate has the following form: Equation E-1 Exponential Decay of Emissions
𝐸𝐸 = 𝐸𝐸0𝑒𝑒−𝑘𝑘𝑘𝑘
Where: E0 = initial emission rate (the emission rate at t = 0), mg/hr k = first-order rate constant, hr-1 t = time since application, hrs Integrating Equation E-1 to a time of infinity gives the total released mass represented by the exponential, as follows:
Equation E-2 Total Mass Released
𝑦𝑦𝑀𝑀𝑀𝑀𝑀𝑀 𝑅𝑅𝑒𝑒𝑚𝑚𝑒𝑒𝑀𝑀𝑀𝑀𝑒𝑒𝑅𝑅 = 𝐸𝐸0/k
Or: Equation E-3 Initial Emission Rate
𝐸𝐸0 = (𝑦𝑦𝑀𝑀𝑀𝑀𝑀𝑀 𝑅𝑅𝑒𝑒𝑚𝑚𝑒𝑒𝑀𝑀𝑀𝑀𝑒𝑒𝑅𝑅) ∗ 𝑘𝑘
Page 154 of 281

The single-compartment, mass-balance equations for the time-varying air concentration for single- and double-exponential representations of the emissions are given in Equation E-4 and Equation E-5 (EPA, 1997), respectively:
Equation E-4 Air Concentration for a Single Exponential as a Function of Time
𝐶𝐶(𝑡𝑡) =𝐸𝐸0
𝑉𝑉 ∗ (𝑄𝑄𝑉𝑉 − 𝑘𝑘)(𝑒𝑒−𝑘𝑘𝑘𝑘 − 𝑒𝑒−
𝑄𝑄𝑉𝑉𝑘𝑘)
Where:] V = chamber volume, m3
Q = air flow rate in and out of the chamber, m3/hr
Equation E-5 Air Concentration for a Double Exponential as a Function of Time
𝐶𝐶(𝑡𝑡) =𝐸𝐸01
𝑉𝑉 ∗ �𝑄𝑄𝑉𝑉 − 𝑘𝑘1�(𝑒𝑒−𝑘𝑘1𝑘𝑘 − 𝑒𝑒−
𝑄𝑄𝑉𝑉𝑘𝑘) +
𝐸𝐸02
𝑉𝑉 ∗ (𝑄𝑄𝑉𝑉 − 𝑘𝑘2)(𝑒𝑒−𝑘𝑘2𝑘𝑘 − 𝑒𝑒−
𝑄𝑄𝑉𝑉𝑘𝑘)
Where: E01 = initial emission rate for the first exponential, mg/hr E02 = initial emission rate for the second exponential, mg/hr k1 = first-order rate constant for the first exponential, hr-1 k2 = first-order rate constant for the second exponential, hr-1 The analysis of DCM emissions from the same MRI study (EPA, 1994a) achieved a good fit to the chamber data using a single exponential. For NMP, a double exponential was necessary due to its lower volatility and the resulting longer tail for the emission profile, as demonstrated by the results for Runs 10, 11 and 12 of the MRI study. The first exponential was used to represent the rapid rise during application and the second exponential was used to capture the extended slower release from the target surface after application. In fitting Equation E-5 to the chamber data, EPA/OPPT took the measured chamber volume (35.68 m3) and measured air exchange rate for the chamber (0.56 air changes/hr) as “known constants” in solving for the values of E01, k1, E02 and k2 that provided the best fit to the data. Data from MRI Chamber Studies Used for Estimation. Each NMP chamber run (Runs 10-12) involved sequential application of a paint stripper to each of four quarters of a 4-ft by 8-ft panel. This application sequence was repeated, for a total of eight applications or segments. For each of the eight segments, there was a 1-min application, followed by approximately a 30-min effect time and then by a 4-min scraping time. This sequence resulted in an elapsed time of approximately 35 minutes from the start of each segment through completion of that
Page 155 of 281
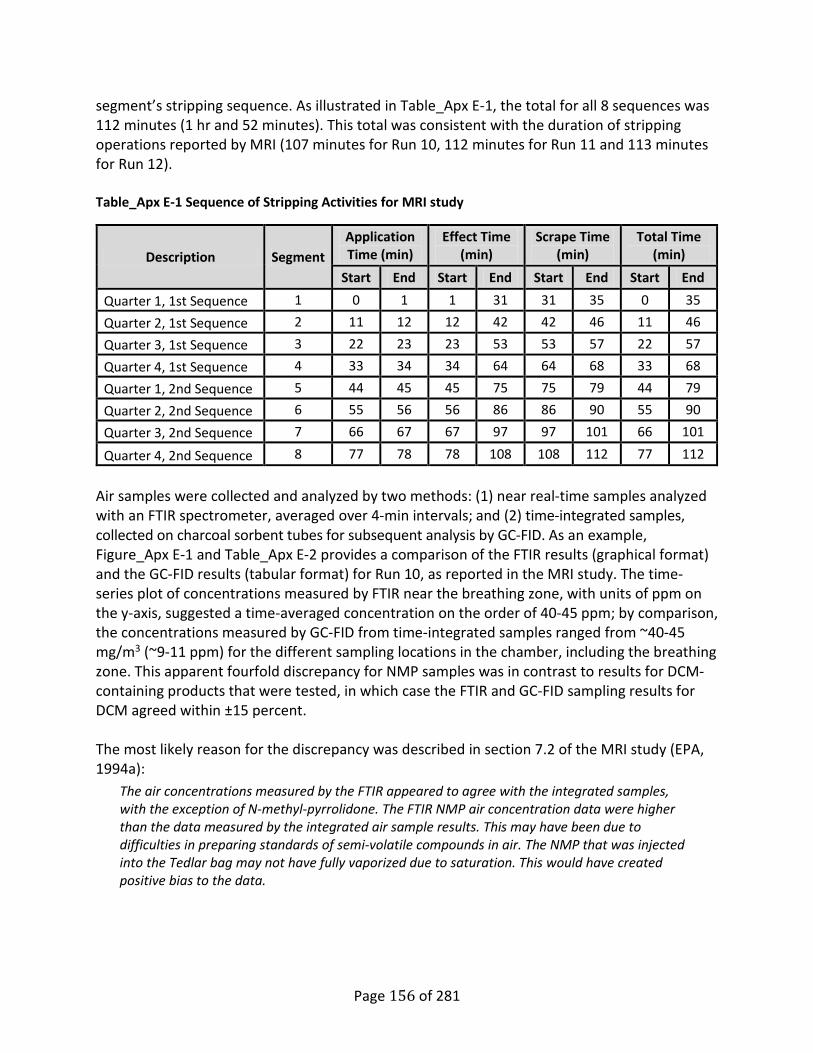
segment’s stripping sequence. As illustrated in Table_Apx E-1, the total for all 8 sequences was 112 minutes (1 hr and 52 minutes). This total was consistent with the duration of stripping operations reported by MRI (107 minutes for Run 10, 112 minutes for Run 11 and 113 minutes for Run 12). Table_Apx E-1 Sequence of Stripping Activities for MRI study
Description Segment Application Time (min)
Effect Time (min)
Scrape Time (min)
Total Time (min)
Start End Start End Start End Start End
Quarter 1, 1st Sequence 1 0 1 1 31 31 35 0 35 Quarter 2, 1st Sequence 2 11 12 12 42 42 46 11 46 Quarter 3, 1st Sequence 3 22 23 23 53 53 57 22 57 Quarter 4, 1st Sequence 4 33 34 34 64 64 68 33 68 Quarter 1, 2nd Sequence 5 44 45 45 75 75 79 44 79 Quarter 2, 2nd Sequence 6 55 56 56 86 86 90 55 90 Quarter 3, 2nd Sequence 7 66 67 67 97 97 101 66 101
Quarter 4, 2nd Sequence 8 77 78 78 108 108 112 77 112 Air samples were collected and analyzed by two methods: (1) near real-time samples analyzed with an FTIR spectrometer, averaged over 4-min intervals; and (2) time-integrated samples, collected on charcoal sorbent tubes for subsequent analysis by GC-FID. As an example, Figure_Apx E-1 and Table_Apx E-2 provides a comparison of the FTIR results (graphical format) and the GC-FID results (tabular format) for Run 10, as reported in the MRI study. The time-series plot of concentrations measured by FTIR near the breathing zone, with units of ppm on the y-axis, suggested a time-averaged concentration on the order of 40-45 ppm; by comparison, the concentrations measured by GC-FID from time-integrated samples ranged from ~40-45 mg/m3 (~9-11 ppm) for the different sampling locations in the chamber, including the breathing zone. This apparent fourfold discrepancy for NMP samples was in contrast to results for DCM-containing products that were tested, in which case the FTIR and GC-FID sampling results for DCM agreed within ±15 percent. The most likely reason for the discrepancy was described in section 7.2 of the MRI study (EPA, 1994a):
The air concentrations measured by the FTIR appeared to agree with the integrated samples, with the exception of N-methyl-pyrrolidone. The FTIR NMP air concentration data were higher than the data measured by the integrated air sample results. This may have been due to difficulties in preparing standards of semi-volatile compounds in air. The NMP that was injected into the Tedlar bag may not have fully vaporized due to saturation. This would have created positive bias to the data.
Page 156 of 281

Figure_Apx E-1 Results from FTIR Samples (EPA, 1994a)
Table_Apx E-2 Results from GC-FID Samples (EPA, 1994a)
Sampling Location in
Test Chamber
Time-integrated Concentration
mg/m3 ppm Inlet Side 38 9.4
Outlet Side 45 11 Breathing Zone 39 10
Data Adjustment For each chamber test, MRI also collected ancillary data on chamber airflow rates, as well as temperature and humidity. A review by EPA of the original laboratory data led to the discovery that MRI had applied temperature and humidity corrections to the data from Runs 10 and 11, but not to the Run 12 data. The reason why these corrections were not applied to the Run 12 data was not disclosed in the MRI report to the EPA (1994a). Because the average temperature and RH levels were quite similar for Runs 10 and 11 (see Table_Apx E-3), MRI used the same correction factor (0.839) for both. Table_Apx E-3 further indicates that average temperature and RH levels for Run 12 were very close to those for Run 10. Consequently, EPA chose to apply the same correction factor (0.839) to the FTIR samples for Run 12. Figure_Apx E-2 shows the corrected (by MRI) data for Runs 10 and 11 together with both the uncorrected and corrected (by EPA) data for Run 12.
Page 157 of 281
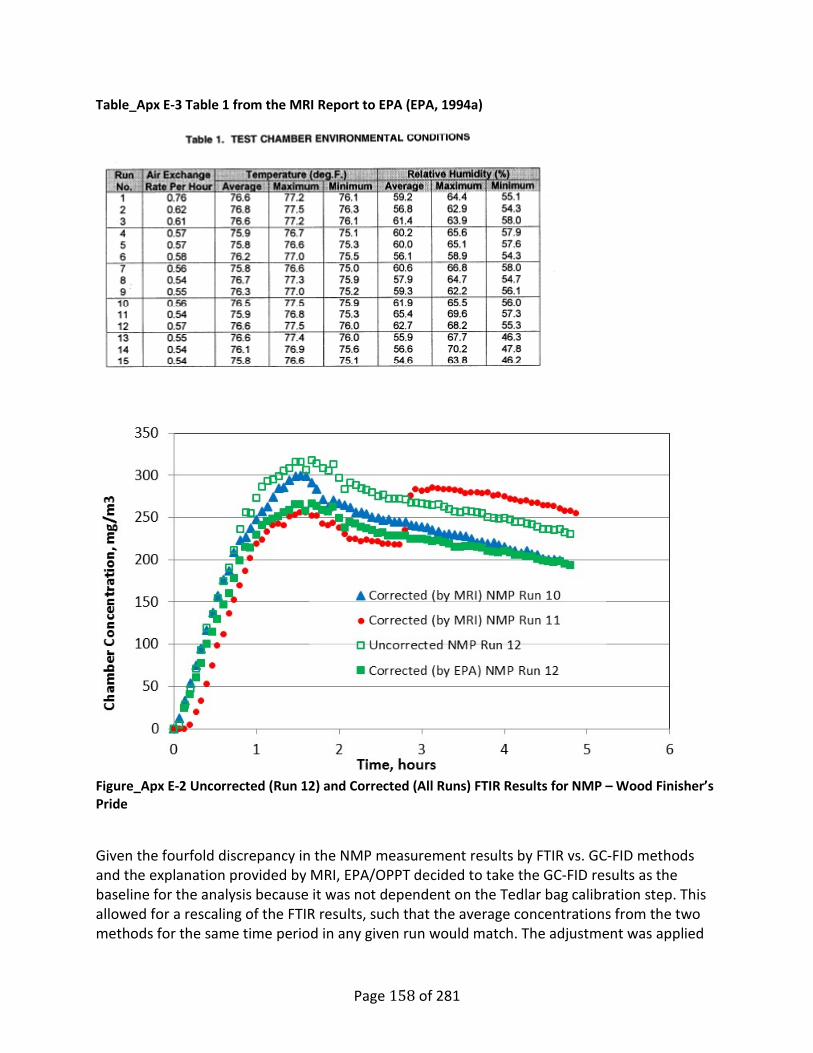
Table_Apx E-3 Table 1 from the MRI Report to EPA (EPA, 1994a)
Figure_Apx E-2 Uncorrected (Run 12) and Corrected (All Runs) FTIR Results for NMP – Wood Finisher’s Pride
Given the fourfold discrepancy in the NMP measurement results by FTIR vs. GC-FID methods and the explanation provided by MRI, EPA/OPPT decided to take the GC-FID results as the baseline for the analysis because it was not dependent on the Tedlar bag calibration step. This allowed for a rescaling of the FTIR results, such that the average concentrations from the two methods for the same time period in any given run would match. The adjustment was applied
Page 158 of 281

to the FTIR results on a run-by-run basis; that is, the rescaling factor was allowed to vary across runs. The corrected FTIR results for all runs, along with the rescaled FTIR results for Runs 10 and 12, are displayed in Figure_Apx E-3. The results from the three runs were very consistent, with the single exception of an apparent “artificial rise” in the time series for Run 11, shortly before an elapsed time of 3 hrs. This deviation was explained in the MRI report (page 36) as follows:
NMP air concentration data collected during run no. 11 sharply increases at approximately 2.7 h into the run. The vacuum in the White cell was above 2 in. Hg during the first period. The vacuum was corrected at 2.7 h by the FTIR operator. All data collected prior to the adjustment have a negative bias.
For this reason, EPA/OPPT decided to exclude Run 11 from any subsequent analysis and used only the rescaled results from Runs 10 and 12. The Run 10 results were adjusted by a multiplicative factor of 0.2207 and the Run 12 results were adjusted by a factor of 0.2365 to account for the FTIR miscalibration.
Figure_Apx E-3 Corrected and Rescaled FTIR Results for NMP – Wood Finisher’s Pride (Brush Application)
Estimation Procedure for Brush Application
As noted earlier, each NMP chamber study involved eight approximately 1-min applications of the paint stripper, with each successive application starting about 11 minutes after the previous one. The emissions from each application were represented by a double exponential, with each
Page 159 of 281
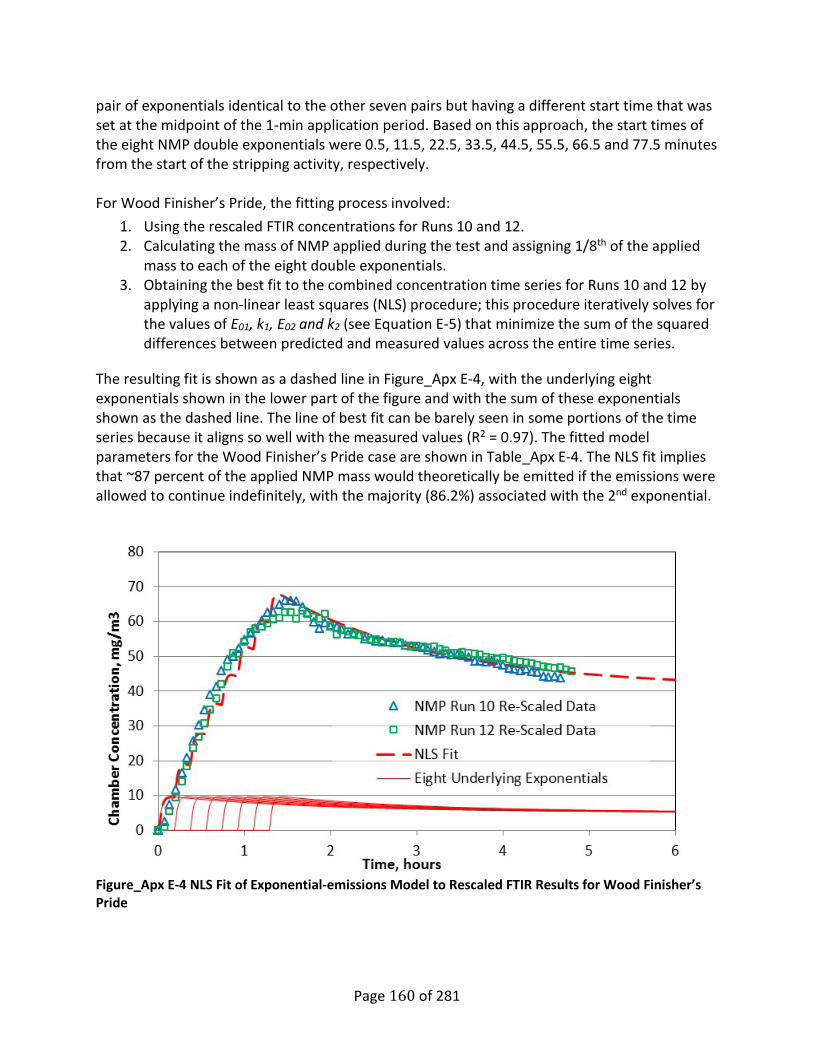
pair of exponentials identical to the other seven pairs but having a different start time that was set at the midpoint of the 1-min application period. Based on this approach, the start times of the eight NMP double exponentials were 0.5, 11.5, 22.5, 33.5, 44.5, 55.5, 66.5 and 77.5 minutes from the start of the stripping activity, respectively. For Wood Finisher’s Pride, the fitting process involved:
1. Using the rescaled FTIR concentrations for Runs 10 and 12. 2. Calculating the mass of NMP applied during the test and assigning 1/8th of the applied
mass to each of the eight double exponentials. 3. Obtaining the best fit to the combined concentration time series for Runs 10 and 12 by
applying a non-linear least squares (NLS) procedure; this procedure iteratively solves for the values of E01, k1, E02 and k2 (see Equation E-5) that minimize the sum of the squared differences between predicted and measured values across the entire time series.
The resulting fit is shown as a dashed line in Figure_Apx E-4, with the underlying eight exponentials shown in the lower part of the figure and with the sum of these exponentials shown as the dashed line. The line of best fit can be barely seen in some portions of the time series because it aligns so well with the measured values (R2 = 0.97). The fitted model parameters for the Wood Finisher’s Pride case are shown in Table_Apx E-4. The NLS fit implies that ~87 percent of the applied NMP mass would theoretically be emitted if the emissions were allowed to continue indefinitely, with the majority (86.2%) associated with the 2nd exponential.
Figure_Apx E-4 NLS Fit of Exponential-emissions Model to Rescaled FTIR Results for Wood Finisher’s Pride
Page 160 of 281
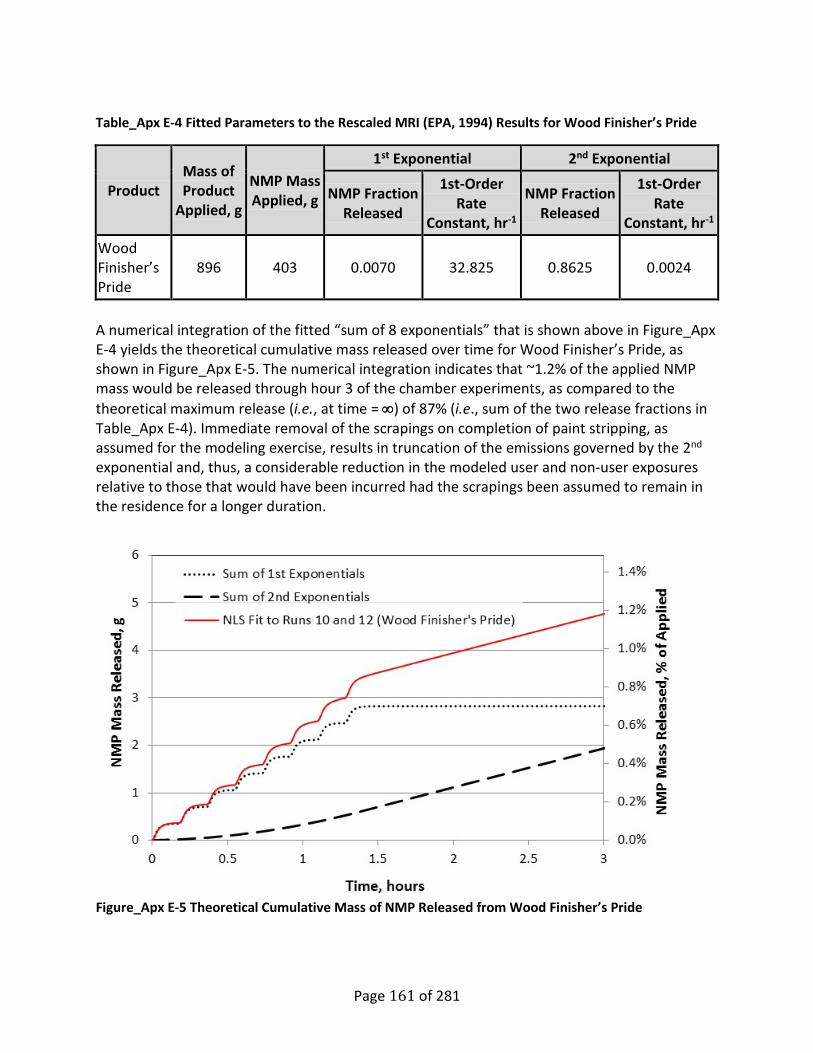
Table_Apx E-4 Fitted Parameters to the Rescaled MRI (EPA, 1994) Results for Wood Finisher’s Pride
Product Mass of Product
Applied, g
NMP Mass Applied, g
1st Exponential 2nd Exponential
NMP Fraction Released
1st-Order Rate
Constant, hr-1
NMP Fraction Released
1st-Order Rate
Constant, hr-1
Wood Finisher’s Pride
896 403 0.0070 32.825 0.8625 0.0024
A numerical integration of the fitted “sum of 8 exponentials” that is shown above in Figure_Apx E-4 yields the theoretical cumulative mass released over time for Wood Finisher’s Pride, as shown in Figure_Apx E-5. The numerical integration indicates that ~1.2% of the applied NMP mass would be released through hour 3 of the chamber experiments, as compared to the theoretical maximum release (i.e., at time = ∞) of 87% (i.e., sum of the two release fractions in Table_Apx E-4). Immediate removal of the scrapings on completion of paint stripping, as assumed for the modeling exercise, results in truncation of the emissions governed by the 2nd exponential and, thus, a considerable reduction in the modeled user and non-user exposures relative to those that would have been incurred had the scrapings been assumed to remain in the residence for a longer duration.
Figure_Apx E-5 Theoretical Cumulative Mass of NMP Released from Wood Finisher’s Pride
Page 161 of 281

Estimation Procedure for Spray Application Chamber data are not available for spray application of NMP paint strippers; consequently, the exposure estimates for the spray scenario were generated by inserting two values for the emissions parameters. The objective of this approach was to develop a reasonable range of exposure estimates for user and nearby non-user. Within the user and non-user scenarios (6 &7) the difference between the a & b versions is only the emission parameters. The consumer behavior patterns are meant to create upper end exposures, so all the scenarios are termed as upper end, but 6 b and 7b use higher emission parameters as well. The primary relevant differences between spray and brush applications of similar products relate to the surface areas associated with alternative application methods, product composition (i.e., NMP content) and use behavior (i.e., duration of application). For both the upper- and lower-emission parameter scenarios, the underlying double-exponential emissions model developed for the brush application was assumed to be equally valid for the spray application. The underlying assumptions are as follows:
1. The first exponential primarily represents the rapid-volatilization component of the emissions that occurs primarily when the paint stripper is first exposed to the air and the NMP at the surface of the bulk product “flashes off.” In the case of brush application, this component includes the releases when the can is first opened as well as the releases when the product is being agitated as it is applied to the surface with a brush. For the spray application, the first exponential is intended to represent the release from the droplets as they are created at the nozzle and fly through the air, until they re-coalesce on the surface. It is reasonable to assume that the surface area of the product during spray application is at least an order of magnitude greater than that for brush application during the application phase.
2. The second exponential primarily represents the slower-volatilization component of emissions that occur while the paint stripper is sitting on the target’s surface during the effect period. It is reasonable to assume that the bulk product behaves similarly for brush and spray applications during this effect period.
An additional assumption made in extrapolating NMP emissions from the brush application to the spray application was that the total mass ultimately released (assuming that the product is left undisturbed on the surface being stripped for an extended duration) is the same for the two methods. It is possible that a greater fraction of the applied NMP mass might be released for the spray scenario, due to the larger surface area that is exposed to air during stripper application. On the other hand, the total NMP emissions governed by the second exponential likely would be quite similar for the two methods because (1) the release rate is slow and (2) much of the theoretical mass release never actually occurs, due to the (assumed) removal of scrapings from the house immediately after scraping is completed. The product-composition and use-behavior aspects of the brush vs. spray applications were compiled from product-specific information (see section E-3 of this appendix); these differences
Page 162 of 281

are captured in certain model parameters (e.g., mass of NMP in the applied product). Incorporating the assumptions discussed here, the exponentials developed to represent emissions for the brush application were modified as follows to provide lower- and upper exposure estimates for the spray application:
1. Lower Estimate (6a and 7a): The equations developed for the brush application were used with the same model-emission parameters (i.e., fraction of applied NMP mass released and rate constants for the first and second exponentials) while modifying the product-composition and use parameters (i.e., fraction of NMP in the product, amount of product applied and duration of application) to reflect differences associated with the method of application.
2. Upper Estimate (6b and 7b): The equations developed for the brush application were used with the same model-emission parameters, as above, with one exception – the mass assigned to the first exponential was increased by a multiple of 10, to account for an assumed tenfold increase in exposed surface area during the spray application. The total (theoretical) NMP mass released was assumed to be the same as that for the lower case. In other words, the additional mass assigned to the first exponential was “taken away” from the second. In essence, these assumptions simply “remove” approximately 6% of the mass from the second (slower) release and “reassign” that mass to the first (faster) release.
Two spray scenarios have been defined to estimate the range of expected upper-end exposures for the product user (Scenario 6) and for the nearby non-user (Scenario 7). For each spray scenario, “Part a” (i.e., Scenario 6a) indicates the lower estimate and “Part b” the upper estimate. The resulting model parameters for spray application are listed in Table_Apx E-5. The model parameters imply that ~87 percent of the applied NMP mass would theoretically be emitted if the emissions were allowed to continue indefinitely, with the 0.7% associated with the first exponential for the lower case and 7.0% for the upper case.
Page 163 of 281

Table_Apx E-5 Assumed Model Parameters for Estimates of User and Non-user Exposures for a Spray-applied Product Containing NMP
Scenario Description
Emission parameter
Assumption
1st Exponential for NMP 2nd Exponential for NMP
Fraction Released
Rate Constant, hr-1
Fraction Released
Rate Constant, hr-1
Scenario 6: Upper-end for
User
Lower(6a) 0.0070 32.825
0.8625 0.0024
Upper (6b) 0.070 0.7995
Scenario 7: Upper-end for
User & Non-user
Lower (7a) 0.0070 32.825
0.8625 0.0024
Upper (7b) 0.070 0.7995
Discussion and Conclusions NMP Mass Released from Brush-on Paint Stripper From the exponential fits to the rescaled FTIR data, it was estimated that 0.7% of the applied NMP mass was accounted for by the sum of the 1st exponentials. For the 2nd exponentials, the percent accounted for depended on the duration of the activity and resulting exposure, as the off-gassing following application is very slow. The theoretical maximum for the sum of the 2nd exponentials was 86.3%, assuming that the emissions continued to infinity. Three hours after the start of the run, ~1.2% of the applied NMP mass was accounted for by the combined sums for the two exponentials. Integrating the two exponentials to a time of infinity yielded a predicted potential release of 87% of the applied NMP mass. Limitations Associated with Brush-on Paint Stripper There is considerable uncertainty in the FTIR sampling results for NMP due to calibration issues noted previously. In EPA/OPPT’s opinion, rescaling the FTIR results to match the GC-FID results on a time-integrated basis (i.e., effectively ignoring the calibration data for the FTIR) was a reasonable approach to address the calibration issues. An implicit assumption with this approach was that the FTIR results properly reflected the relative (but not absolute) magnitudes of the time-varying NMP concentrations. Limitations Associated with Spray-on Paint Stripper Because no chamber data are available for NMP-containing spray products, EPA/OPPT used professional judgment to estimate a range of upper-end exposures that might be expected. The lower estimate for the spray product assumed the same release characteristics as for the brush product, adjusted for differences in product mass, NMP weight fraction and duration of
Page 164 of 281
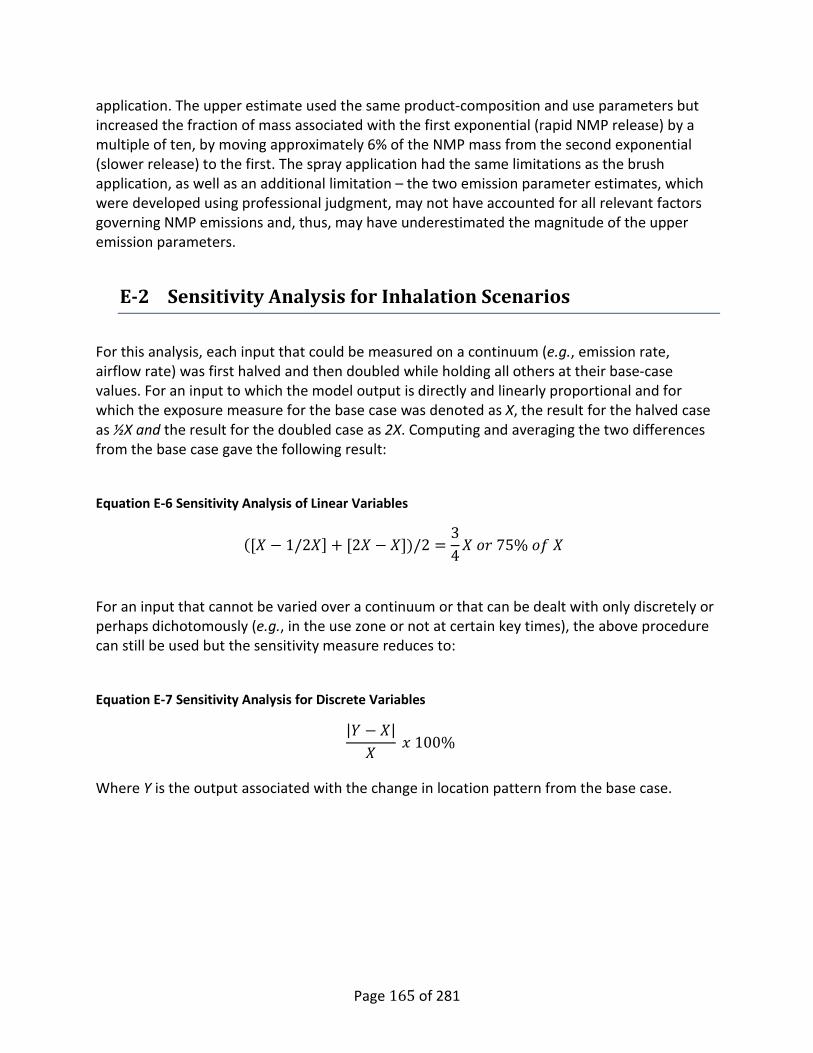
application. The upper estimate used the same product-composition and use parameters but increased the fraction of mass associated with the first exponential (rapid NMP release) by a multiple of ten, by moving approximately 6% of the NMP mass from the second exponential (slower release) to the first. The spray application had the same limitations as the brush application, as well as an additional limitation – the two emission parameter estimates, which were developed using professional judgment, may not have accounted for all relevant factors governing NMP emissions and, thus, may have underestimated the magnitude of the upper emission parameters.
E-2 Sensitivity Analysis for Inhalation Scenarios
For this analysis, each input that could be measured on a continuum (e.g., emission rate, airflow rate) was first halved and then doubled while holding all others at their base-case values. For an input to which the model output is directly and linearly proportional and for which the exposure measure for the base case was denoted as X, the result for the halved case as ½X and the result for the doubled case as 2X. Computing and averaging the two differences from the base case gave the following result:
Equation E-6 Sensitivity Analysis of Linear Variables
([𝑋𝑋 − 1/2𝑋𝑋] + [2𝑋𝑋 − 𝑋𝑋])/2 =34𝑋𝑋 𝑚𝑚𝑜𝑜 75% 𝑚𝑚𝑜𝑜 𝑋𝑋
For an input that cannot be varied over a continuum or that can be dealt with only discretely or perhaps dichotomously (e.g., in the use zone or not at certain key times), the above procedure can still be used but the sensitivity measure reduces to:
Equation E-7 Sensitivity Analysis for Discrete Variables
|𝑌𝑌 − 𝑋𝑋|𝑋𝑋
𝑥𝑥 100%
Where Y is the output associated with the change in location pattern from the base case.
Page 165 of 281

E-3 Inhalation Exposure Scenario Inputs Model Inputs Method of Application. A review of product labels and technical data sheets indicated that paint-stripping products can be applied using either brush-on or spray-on (i.e., aerosol or trigger-pump) application methods. The MRI chamber tests EPA (1994b) did not include any applications involving NMP-containing spray-on strippers. EPA/OPPT considered extrapolating results from tests of other chemicals (e.g., DCM) that included both application methods. Consequently, EPA/OPPT used professional judgment to estimate the expected range of user and non-user upper-end exposures resulting from spray-on applications, as described and discussed in section E-1 of this appendix. Application Amount (Product Mass) The product application mass (grams of product) was determined using application rates (g/ft2) calculated from the chamber tests in EPA (1994a) and the surface area of objects to be stripped (ft2). Surface areas were selected so that the resulting product mass corresponded approximately to central (near the median) and upper-end (near the 90th percentile) estimates for the amount of paint stripper product used per event from the large nationwide Abt (1992) survey, as reported in EFH Table 17-20. EFH reports a median value of 32 fluid ounces or ¼ gallon. Conversion to metric units (3.75 L/gallon) and consideration of the nominal product density (~1.1 g/cm3) (calculated from Brown, 2012) yields a product mass on the order of 1,000 g as a central estimate. An upper-end application amount (~80th percentile) from the same survey is 80 ounces or 2,500 g. Similarly, the small Riley et al. (2001) survey reported 32 ounces as the median amount of paint stripper product used. Specific product masses used in this assessment for the brush-on scenarios were 1,080 g for Scenarios 1 and 2, 2,700 g for Scenario 3 and 3,888 g for Scenarios 4 and 5. As previously mentioned, the application amounts assumed in this assessment for Scenarios 1 through 3 are a product of application rates calculated from the EPA (1994a) experiments and the surface area of objects to be treated. The calculated application rate was ~108 g/ft2 for the brush-on application (866 g of product applied to 8 ft2). Because there were no EPA (1994a) chamber tests for NMP-containing spray-on strippers, the DCM brush/spray ratio (540 g/722 g) was applied to the NMP brush rate of 108 g/ft2 to estimate a spray rate for Scenarios 6 & 7, resulting in an estimated NMP spray application rate of 81 g/ft2. This estimated spray rate is within the range of rates recommended on the Savogran Company website for paint strippers in general – 1 gallon per 50 to 100 ft2 (~ 42 to 83 g/ft2, based on a nominal density of 1.1 g/cm3)13.
13 See the following URL: http://www.savogran.com/Information/removerfaq.html
Page 166 of 281
The applied surface areas selected for central and upper-end values were 10 and 25 ft2, respectively. The upper-end surface area is 2.5 times higher than the central surface area and provides sufficient distinction from the central case. Application targets with surface areas close to the two specified surface areas (10 and 25 ft2) were used in the exposure scenarios to reflect real-world situations. A coffee table with nominal dimensions of 4 feet × 2.5 feet for the top surface was selected for the central case (10 ft2) (Abbas, 2012) and a chest of drawers with nominal dimensions of 4 feet high by 2.5 feet wide by 1.5 feet deep (American Unfinished Furniture, 2012 shows an illustrative chest of drawers with nearly the same dimensions) was selected for the upper-end case (4 × 2.5 ft2 for front + 2.5 × 1.5 ft2 for top + 2 × 4.5 × 1.5 ft2 for sides ≈ 25 ft2). For the bathroom scenario, a bathtub surface area of 36 ft2 was calculated assuming nominal dimensions of five feet wide by 2.5 feet deep by 1.5 feet high. Stripping Sequence The sequence chosen to characterize product application was intended to be consistent with labeling instructions. The stripping event consisted of an initial stripping sequence (apply-wait-scrape) followed by a second stripping sequence. The NMP product labels advise that the stripper be applied to the object followed by a wait period of at least 30 minutes (up to 24 hrs). The labels generally do not indicate that the product needs to be applied in small sections. The application sequence is also supported by Internet discussion forums suggesting that an advantage to NMP formulations is that they allow the user more flexibility because the product will not evaporate (Old House Online, 2012). The application time was derived from the EPA (1994b). From the protocol description in that report, it was deduced that the NMP stripper was brush-applied at a rate of 2 ft2/min and spray-applied at a rate of 4 ft2/min. It was further assumed that the scrape time was double the brush application time, meaning that the surface was scraped at a rate of 1 ft2/min. For the bathtub case (Scenarios 4 and 5), because of the larger surface area, the application and scrape times were scaled up proportionally to 18 and 36 minutes, respectively. The scaled initial and secondary application times, wait times and scrape times are summarized in Table_Apx E-6.
Page 167 of 281

Table_Apx E-6 Time Schedule for Paint Stripping with Repeat Application
Scenario Elapsed Time From Time Zero, Minutes (Product User Location)
Apply 1 Wait 1 Scrape 1 Apply 2 Wait 2 Scrape 2
1. Brush application to coffee table in workshop, central tendency scenario
0-5 (workshop)
5-35 (ROH)
35-45 (workshop)
45-50 (workshop)
50-80 (ROH)
80-90 (workshop)
2. Brush application to coffee table in workshop, upper-end scenario for user
0-5 (workshop)
5-35 (workshop)
35-45 (workshop)
45-50 (workshop)
50-80 (Workshop)
80-90 (workshop)
3. Brush application to chest in workshop, upper-end scenario for user & non-user
0-12.5 (workshop)
12.5-42.5 (ROH)
42.5-67.5 (workshop)
67.5-80 (workshop)
80-110 (ROH)
110-135 (workshop)
4. Brush application to bathtub in bathroom, upper-end to bounding scenario for user & non-user; Csat = 1,013 mg/m3
0-18 (bathroom)
18-48 (ROH)
48-84 (bathroom)
84-102 (bathroom)
102-132 (ROH)
132-168 (bathroom)
5. Brush application to bathtub in bathroom, upper-end to bounding scenario for user & non-user; Csat = 640 mg/m3
0-18 (bathroom)
18-48 (ROH)
48-84 (bathroom)
84-102 (bathroom)
102-132 (ROH)
132-168 (bathroom)
6. Spray application to coffee table in workshop, upper-end scenario for user
0-2.5 (workshop)
2.5-32.5 (workshop)
32.5-42.5 (workshop)
42.5-45 (workshop)
45-75 (workshop)
75-85 (workshop)
7. Spray application to chest in workshop, upper-end scenario for user & non-user
0-6.25 (workshop)
6.25-36.25 (ROH)
36.25-61.25 (workshop)
61.25-67.5 (workshop)
67.5-97.5 (ROH)
97.5-122.5 (workshop)
Note: Scenarios 6 and 7 provide two spray estimates; each scenario has a lower (Part a) and an upper (Part b) estimate for the emission parameters. See section E-1 of this Appendix for a detailed description.
Amount of Chemical Released The amount of chemical released during and after the stripping event is the product of three parameters: amount applied (discussed above), weight fraction of chemical in the applied product and fraction of the chemical that is released to indoor air. From the product list developed by Brown (2012), the median NMP weight fraction was determined to be 0.25 for the brush-on application (range of 0.03 to 0.53) and 0.44 for the spray-on application (0.28 to 0.53). The weight fractions were determined from the Brown (2012) spreadsheet by using only products intended for consumer use (i.e., adhesive removers, paint brush cleaners, deglossers and industrial/commercial use products were removed). The application method (brush-on or spray-on) for a product was determined by examining the product labels/technical data sheets and product names and through Internet research. If an application method could not be determined through the above methods, then the product
Page 168 of 281

was assigned to the brush category, as most paint stripping products are applied by the brush method and formulations such as semi-paste would be difficult to apply using a sprayer. If a weight fraction range was provided in the product list, then the average of the minimum and maximum weight fractions was used in calculations. The weight fractions were not weighted to reflect the market share of products. Analysis of the EPA (1994a) data indicates an NMP release fraction of 0.8695 for brush-on (see section E-1 of this appendix). The resultant mass applied for different application targets is summarized in Table D-5. The resultant mass applied for the assumed spray-on scenarios (see section E-1 of this appendix) is summarized in Table_Apx E-7. Table_Apx E-7 NMP Mass Released for Brush-on Application, by Application Target
Target (Surface Area) Application Rate, g/ft2
NMP Weight Fraction a Release Fraction NMP Mass
Released, g
Coffee table (10 ft2) 108 0.25 | 0.50 0.8695 234.6 | 469.5 Chest of drawers (25 ft2) 108 0.50 0.8695 1173.8 Bathroom tub (36 ft2) 108 0.5 0.8695 1690.3 Notes: a For the coffee-table case, two weight fractions are given, one for central and one for upper-end. Table_Apx E-8 NMP Mass Released for Spray-on Application, by Application Target
Target (Surface Area) Application Rate, g/ft2
NMP Weight Fraction Release Fraction NMP Mass
Released, g Coffee table (10 ft2) 81 0.53 0.8695 373.3 Chest of drawers (25 ft2) 81 0.53 0.8695 933.2 Airflow Rates and Volumes The model run requires conceptualization of a residence in terms of the number of zones and their respective volumes. The airflow rates needed to model the central and upper-end cases described above are: (1) rates between indoors and outdoors for each zone; and (2) rates between the zones. Airflow for tub stripping in the bathroom, which is somewhat more complex to conceptualize, is described below, after the central and upper-end cases. For the central and upper-end cases, the house in which the modeled stripper application occurs is conceptualized as having two zones: (1) the workshop where application occurs; and (2) the ROH. The house volume chosen for the model runs, 492 m3, was the central value listed in the EFH. The volume assigned to the in-house workshop area was 54 m3, corresponding to 12 feet × 20 feet with an 8-foot ceiling (20 × 12 × 8 = 1,920 ft3 or ~54 m3). This room volume is similar to the value reported in Riley et al. (2001) for the mean volume of the room used for paint stripping (51 m3). The volume for the ROH, 438 m3, is determined by subtraction (492 to 54 m3).
Page 169 of 281

For the bathroom scenario, the bathroom volume was set at nine m3 for consistency with that reported in a CDC/NIOSH case (CDC, 2012b). The indoor-outdoor airflow for any zone of the house is governed by the choice of air exchange rate, in ACH. The central and low-end values for the air exchange rate – 0.45/hr and 0.18/hr – that were used in assigning the indoor-outdoor airflow rate for the ROH are the mean and 10th percentile values, respectively, from the EFH. (Note that a low-end ACH would be expected to contribute to upper-end concentration estimates.) For the workshop, it was assumed that multiple windows were opened. The indoor-outdoor airflow rate assigned to this zone, 68 m3/hr, was obtained by multiplying the room volume of 54 m3 by the 90th percentile (1.26/hr) of the air-exchange-rate distribution from the EFH, thought to be a reasonable representation of the open-window case. The use of open windows in the room of use is supported by both label instructions and survey data. Even though NMP is not highly volatile, the majority of the labels indicate that adequate ventilation must be used and that to prevent build-up of vapors, windows and doors should be opened to achieve cross ventilation. Additionally, Pollack-Nelson (1995) reported that an average of 70.7 percent of paint stripper users (all products) kept a window or door open during use based on data from the WESTAT (1987) survey and that 88.8 percent of paint stripper users (all products) kept a window or door open during use based on data from the Abt (1992) survey. The increase was significant between the survey years. The more recent, small Riley et al. (2001) survey also indicates that the majority of paint stripper users (55 percent) opened a window. Both Pollack-Nelson (1995) and Riley et al. (2001) also reported that some users used an exhaust fan during the stripping process, which would affect the air exchange rate. The percentage of fan users was not reported in Pollack-Nelson (1995). The Riley et al. (2001) data suggest that only ~27 percent of the users who worked indoors used an open window and fan. Due to the small percentage of people who used a fan, coupled with the fact that a couple of labels indicate that the product should be kept away from heat, sparks, flame and all other sources of ignition, none of the scenarios were assumed to involve use of a fan in the room of product use. The interzonal airflow rate was estimated using the following algorithm, presented in EPA (1995): Equation E-8 Interzonal Airflow Rate
𝑄𝑄 = (0.078 + 0.31 ∗ 𝐴𝐴𝐶𝐶𝐴𝐴) ∗ 𝐴𝐴𝑚𝑚𝐻𝐻𝑀𝑀𝑒𝑒 𝑉𝑉𝑚𝑚𝑚𝑚𝐻𝐻𝑚𝑚𝑒𝑒 where Q is the interzonal airflow rate, in m3/hr and ACH is the air exchange rate, in 1/hr.
Substitution of the central air exchange rate of 0.45/hr and the house volume of 492 m3 yields an estimated interzonal airflow rate of 107 m3/hr. The corresponding number for the upper-end
Page 170 of 281

case, with an air exchange rate of 0.18/hr, was 65.8 m3/hr. Figure_Apx E-6 depicts the volumes and airflows that were used for the workshop scenarios.
Figure_Apx E-6 Zone Volumes and Airflow Rates for Workshop Scenarios
As previously mentioned, the bathroom scenario (Figure_Apx E-7) is more complex. While working in close proximity to the target (bathtub) for an extended period, the product user is typically exposed to elevated concentrations in the immediate vicinity of the application area, a concept that has been termed the “source cloud” in the scientific literature. There is considerable evidence of a source-cloud effect around sources (Cheng et al., 2011; Furtaw et al., 1996; Matthews et al., 1989), which generally relates the size of the source cloud and the ratio of the near- vs. far-field concentrations to the room turbulence (e.g., due to natural and mechanical ventilation) and other mixing forces such as thermal gradients.
Figure_Apx E-7 Zone Volumes and Airflow Rates for Bathroom Scenario
Several studies have investigated methods for modeling a source cloud, including use of a virtual compartment around the source (Cherrie, 1999), rough partitioning (Musy et al., 1999) and a zero-equation turbulence model (Chen and Xu, 1998). The virtual-compartment method also has been discussed in ASTM Standard Practice D 6178-97 (ASTM, 1997). Although the ideal
Room of Use
(54 m3)68
m3/hr107
m3/hr
Rest of House
(438 m3)197
m3/hr
Central Values
Room of Use
(54 m3)68
m3/hr65.8
m3/hr
Rest of House
(438 m3)78.8
m3/hr
Values for Upper-end Concentration Scenarios
denotes air flow
Denotes air flow
1.6 m3/hr
Rest of Bathroom
(8 m3)
35 m3/hr
Rest of House
(483 m3)
“Source Cloud” (1 m3)
86.9 m3/hr
80 m3/hr
Page 171 of 281

size of the virtual compartment has not been discussed in the literature, Furtaw et al. (1996) successfully represented concentrations using a sphere around the source (with an unspecified volume). Thus, both the presence of higher concentrations near a source and the concept of using a source cloud to better represent these near-field elevated concentrations appear to be well founded in the scientific literature. For the purpose of this exposure assessment, a source cloud is used for the bathroom scenario to better represent the user’s exposure to NMP emitted from the paint stripper. The bathroom scenario involves application of a relatively large amount of the product within a semi-enclosed, concave workspace, resulting in accumulation of the heavier-than-air NMP vapors toward the lower tub surfaces in particular (see the vertical stratification analysis earlier in this section). Moreover, accessibility constraints and the concave shape of the workspace would require the user to work in close proximity to the surface being stripped, particularly when working on the lower portions of the tub. For these reasons, a source-cloud representation is appropriate for the bathroom scenario. The source cloud representation was not deemed necessary for the workshop scenarios because work areas within such a space typically are not so confined and are less likely to promote localized accumulation of NMP vapors. Recognizing that the source cloud is not a well-defined area, but rather a gradual transition between near- and far-field concentrations and further recognizing that the purpose of this volume is to represent average air concentrations in the breathing zone of the product user, the approach to defining the virtual volume was to establish some geometry around the source that represents the approximate work space. Figure_Apx E-8 shows a schematic representation of the bathtub and virtual compartment representing the source cloud. Consistent with this representation, a source-cloud volume of 1.0 m3 was assumed the bathroom scenario. Matthews et al. (1989) analyzed the impact of a central, forced-air heating, ventilating and air conditioning (HVAC) system on the distribution of air velocities in three of their six study homes (the remaining three homes were not included in the analysis because in two cases the fan was operated continuously and in the third a probe malfunctioned). In Figure_Apx E-9, the results for the three analyzed homes are presented at three different indoor locations (basement, kitchen and master bedroom). For the bedroom (most similar of the three locations to the bathroom), the Matthews results include a median air velocity of 1.8 cm/sec with the fan off and 6.1 cm/sec with the fan on.
Page 172 of 281

Figure_Apx E-8 Modeling Representation of the Bathtub and Virtual Compartment (aka “Source
Cloud”)
Page 173 of 281

Figure_Apx E-9 Air Velocity Distributions from Matthews et al. (1989)
With the fan cycling on and off the air velocity would be between 1.8 and 6.1 cm/sec, with the average velocity dependent on the on-time for the fan. As of 2008, at least 25% of US homes did not have a central, forced-air heating system ((EPA, 2011a) Table 19-13). Homes with alternative systems (e.g., steam or hot-water system; baseboard/portable electric heat) would be expected to have a velocity similar to that for the fan-off case. Similarly, ~40% of US homes had either no cooling equipment or room/window cooling units ((EPA, 2011a) Table 19-15). Consequently, a velocity of 1.8 cm/sec (65 m/hr) was used for the bathroom scenario, to represent such homes as well as those with a central forced-air system that is off during paint stripping either by intent or due to mild weather. The assumed airflow rate between the source cloud and the rest of the bathroom was based on a relationship developed by Matthews et al. (1989), who determined experimentally that such an airflow could be estimated as the product of the room air velocity (m/hr) and the entry/exit surface area (m2). An assumed air velocity of 65 m/hr, representing the fan-off case, together with an assumed entry/exit surface area of 5 ft by 2 ft, 8 in (13.35 ft2 or 1.24 m2) yields an estimated airflow rate of 80 m3/hr between the source cloud and the rest of the bathroom.
HVAC OFF and ON flows for Master Bedroom
Page 174 of 281

Based on professional judgment, the interzonal airflow rate between the bathroom and rest of the house (35 m3/hr) was assumed to be ~2/3 lower than that for the workshop central scenarios (107 m3/hr), given the small bathroom volume. The indoor-outdoor airflows were based on air exchange rate of 0.18 ACH assumed for upper-end concentration scenario. Locations of Exposed Individuals Two location patterns were specified, one for a product user and one for a non-user. The user was assumed to be in the work area for stripper application and scraping for all scenarios. For the waiting phase of the stripping process, the user was assumed to be in the ROH as a central-tendency assumption for the user (Scenario 1), in the workshop as an upper-end assumption for the user (Scenario 2) and in the ROH of the house for Scenarios 3, 4 and 5, which were developed to model upper-end concentrations primarily for the non-user. The user was placed in the ROH during the waiting phase for the central assumption because the user is assumed to be aware of potential inhalation health concerns from using paint strippers based on label warnings (“Vapor Harmful”) on some labels (which are often for products containing multiple active ingredients, not solely NMP) and because the Riley survey (Riley et al., 2001) reported that 65 percent of users reported taking breaks outside the work area. Breaks typically involved a specific break activity and location, such as going to the kitchen and making a sandwich or going outside to do yard work. For the upper-end scenario (Scenario 2), it was assumed that the user would stay in the workshop, based on the fact that some people do not read/skim labels (~28% in 1990; Pollack-Nelson, 1995) and that the Riley survey (Riley et al., 2001) indicated that 20 percent of participants reported taking breaks inside the work area. For all scenarios, the user was assumed to leave the workroom immediately after the stripping process, based on the WESTAT (1987) and Abt (1992) surveys with a median value of zero minutes spent in the room after using the product (EPA, 2011a). The non-user was assumed to be in the ROH throughout the model run, as was the user for the portion of the run after all applying/scraping was completed. For the bathroom scenario, the user was assumed to be in the ROH during the wait times. It was further assumed that the scrapings were removed from the house as soon as scraping was completed for the last segment. The implication for modeling purposes is that any remaining NMP emissions would be truncated at that time. Saturation Concentration Constraint As discussed above, Scenarios 4 and 5 were used to estimate upper-end NMP concentrations, primarily for the non-user; as a result, the modeled NMP concentrations for these scenarios may approach the saturation concentration. For the purposes of this assessment, the saturation concentration was calculated based on reported vapor pressures for NMP, using the ideal gas law to convert the reported vapor pressure to airborne concentrations. MCCEM prevents airborne concentrations of NMP from exceeding its saturation concentration through the input of a saturation-constraint value. The model normally will apply the emission
Page 175 of 281

rates specified by the user without regard to the chemical’s saturation concentration in air; in other words, the saturation concentration could be exceeded. If the user selects the saturation constraint, then the model will check to ensure that the saturation concentration is not exceeded, adjusting the emission rate as needed to meet this constraint. In such cases, the same chemical mass ultimately will be released, but at a slower rate than implied by the user's source model. The following equation was used to estimate the value for the saturation concentration: Equation E-9 Saturation Concentration
𝐶𝐶𝑠𝑠𝑠𝑠𝑘𝑘 =
� 𝑉𝑉𝑦𝑦
760 𝑚𝑚𝑚𝑚 𝐴𝐴𝑚𝑚𝑀𝑀𝑡𝑡𝑚𝑚
𝑥𝑥 𝑦𝑦𝑀𝑀 𝑥𝑥 1,000𝑚𝑚𝑚𝑚𝑚𝑚 𝑥𝑥 1,000 𝐿𝐿𝑚𝑚3�
(𝑅𝑅 𝑥𝑥 𝑅𝑅)
where: Csat = saturation concentration (mg/m³) VP = vapor pressure (mm Hg) MW = molecular weight (g/mole) R = gas constant = 0.0821 liter atm/mole °K T = temperature of the air (°K)
At each time step, MCCEM checks whether the current value for the emission rate results in an indoor concentration that exceeds Csat. If so, then the emission rate is reduced to a value that results in the indoor concentration equaling Csat. In such a case, MCCEM keeps track of the cumulative mass that has been "subtracted" to meet the Csat constraint; release of this accumulated "excess" mass is initiated at a later point in time, when the modeled concentration otherwise would be below the Csat value. This procedure is continued until all excess mass has been released, unless the end of the time period for the model run is encountered first. Scenario 4 imposes a saturation concentration constraint corresponding to the vapor pressure reported in Table 1-1 of this report of 0.190 mmHg that, using Equation E-9 results in a saturation concentration of 1013 mg/m3 at 25°C. NMP’s saturation concentration is affected by the level of relative humidity. An NMP Initial Assessment Report by the OECD (2007) indicates that several studies have measured the relationship between vapor pressure for NMP and relative humidity and reported the following:
It is noteworthy that NMP exists in various proportions of vapor and aerosol depending on the concentration, temperature and humidity. The maximum vapor phase at room temperature is 1.286 mg/l (315 ppm) in dry air (0% relative humidity), 0.525 mg/l (128 ppm) at normal animal room humidity (50% relative humidity) and 0 mg/l (0 ppm) in
Page 176 of 281

humidity saturated air (100% relative humidity BASF AG, 1989, 1992, 1995a, 1995b; BASF AG, 1995c).
Based on the cited findings, the OECD report concludes: Thus, the vapor saturation of NMP under normal conditions is considered to be in the range of 0.48 - 0.64 mg/l (120 - 160 ppm) depending on humidity and temperature.
BASF AG conducted the studies and associated data cited by OECD; however, the studies are unpublished and are not readily available. To examine this potential relative humidity impact, Scenario 5 imposes a saturation concentration constraint of 640 mg/m3, representing the upper end of the saturation concentration values associated with "normal humidity conditions." This concentration corresponds to an estimated RH, calculated by interpolation, of approximately 42 percent.
E-4 Inhalation Model Outputs and Exposure Calculations Exposure Calculations TWA concentrations are only used for model evaluation during sensitivity analysis and to present information to allow for the characterization of the different exposure scenarios. The TWA numbers are not used in the PBPK model or in the risk assessment calculations, but they are helpful to translate the model results into concentrations that are routinely used in exposure assessment models and in air monitoring. The PBPK model used the minute by minute airborne concentrations that were calculated by the model directly without relying on longer time period averages. Maximum TWA concentrations for different averaging periods, described below, were calculated from the 1-min averages for both the user and non-user based on their respective exposure concentration time series. The calculations took into account the possibility that the user can change zones within a 1-min interval (e.g., at an elapsed time of 6.25 min). The exposure concentration was calculated for each 1-minute interval in the modeling period (24 hrs or 1,440 1-min intervals) as follows:
For each time interval, i to i +1, for i = 0 to 1,440:
Equation E-10 Maximum Time Weighted Concentrations
𝑬𝑬𝑬𝑬𝒊𝒊,𝒊𝒊+𝟏𝟏 = ��𝑬𝑬𝟏𝟏,𝒊𝒊 + 𝑬𝑬𝟏𝟏,𝒊𝒊+𝟏𝟏�𝟐𝟐� � ∗ 𝑭𝑭𝒊𝒊,𝒊𝒊+𝟏𝟏 + ��𝑬𝑬𝑹𝑹𝑹𝑹𝑹𝑹,𝒊𝒊 + 𝑬𝑬𝑹𝑹𝑹𝑹𝑹𝑹,𝒊𝒊+𝟏𝟏�
𝟐𝟐� � ∗ �𝟏𝟏 − 𝑭𝑭𝒊𝒊,𝒊𝒊+𝟏𝟏�
Where: ECi,i+1 = the exposure concentration over the time interval i to i +1 C1,i and C1,i+1 = the concentrations in the use zone at times i and i+1, respectively
Page 177 of 281

CROH,i and CROH,i+1 = the concentrations in the ROH zone at times i and i+1, respectively Fi,i+1 = the fraction of time spent in the use zone during the time interval i to i +1
These calculations, illustrated in Figure D-9, were implemented for each of the five scenarios.
Figure_Apx E-10 Example of the Personal Concentration Calculation as Defined in Equation C-13
TWA Concentrations In addition to the maximum 1-minute concentration and the 24-hr average concentration to which the user and non-user were exposed, a maximum TWA exposure concentration also was calculated for each of the following averaging periods: 10 minutes, 30 minutes, 1 hr, 4 hrs and 8 hrs. The maximum TWA concentration for any averaging period was defined as the highest value of the consecutive running averages for that averaging period. For any averaging period, there are (1,440 min length of the averaging period) TWA concentration values within the 24-hr (1,440-min) time series. For example, there are 1,430 10-min averaging periods (1,440-10), the first of which is for time 0 to 10 minutes, the second of which is for time 1 to 11 minutes and so on, with the last for time 1,430 to 1,440 minutes. The running averages for each averaging period were computed in an Excel spreadsheet, from which the maximum value was determined. Modeling Results The zone-specific and user-exposure concentrations predicted by MCCEM for Scenarios 1-5 are presented in Figure_Apx E-10 through Figure_Apx E-13 at the end of this section. The non-user’s exposure concentration is the same as that shown for Zone 2 (ROH). The user’s time-
Page 178 of 281

related exposure concentration follows the same pattern for all scenarios except Scenario 2: (1) an initial rise associated with the first stripper application; (2) a sharp decline when the user leaves the work area; (3) a lesser rise associated with the first scraping, immediately followed by a sharper rise associated with the second stripper application; and (4) a lesser rise associated with the second scraping. For scenario 2, the user does not leave the work area between stripper applications; thus, in this case the user’s exposure concentration time series exactly matches that in Zone 1 (Workshop), until the user moves to the ROH immediately following the second scraping. Figure_Apx E-10 shows the zone-specific and user’s exposure-concentration results for Scenario 1 (brush application in the workshop with central parameter values). The non-user exposure concentrations for this scenario, as well as for those shown in subsequent figures, are assumed to be the same as the concentrations in the ROH. Figure_Apx E-11 shows the zone-specific and exposure-concentration results for Scenario 2 for the workshop with parameter values (NMP weight fraction and user location during wait period) selected to estimate upper-end concentrations for the user. The maximum 1-min user exposure for Scenario 2 (33.4 mg/m3) is higher than that for Scenario 1 (12.6 mg/m3) by about a factor of 2.5. The maximum 1-min non-user exposure for Scenario 2 (4.1 mg/m3) is higher than that for Scenario 1 (2.0 mg/m3) by a factor of 2. Figure_Apx E-12 shows the zone-specific and exposure-concentration results for Scenario 3 for the workshop with parameter values (surface area for stripper target and air exchange rate for ROH, non-user exposure = concentration in ROH) selected to estimate upper-end concentrations for the non-user. In this case the maximum 1-min exposure for the non-user (10.4 mg/m3) is more than twice that for either of the previous scenarios; the maximum user exposure (76 mg/m3) also increases by more than a factor of two relative to Scenario 2. Figure_Apx E-13 shows the zone-specific and exposure-concentration results for the bathroom case with a bathtub stripping activity. Scenario 4 imposes a saturation-concentration constraint of 1,013 mg/m3 (250 ppm) whereas Scenario 5 imposes a constraint of 640 mg/m3 (158 ppm). The saturation concentration is never reached in Scenario 4, with a predicted peak concentration of 807 mg/m3 (199 ppm). For Scenario 5, the saturation concentration is reached within the source cloud but remains lower than the saturation concentration in the bathroom. The maximum 1-min exposure estimates for these two scenarios are 797 mg/m3 for the user (for Scenario 4) and 31 mg/m3 for the non-user (for both scenarios). Figure_Apx E-14 (Scenario 6) and Figure_Apx E-15 (Scenario 7) show zone-specific and exposure-concentration results for a spray application in the workshop. As noted previously, each scenario has a lower (6a, 7a) and an upper (6b, 7b) estimate for the emission parameters that are used for these upper-end exposure estimates. The maximum 1-min exposure estimates for these two scenarios – 387 mg/m3 for the user and 62 mg/m3 for the non-user – both are associated with Scenario 7b.
Page 179 of 281

Figure_Apx E-11 Scenario 1, Brush Applied: Modeled NMP Concentrations and User Exposure for Stripper Application in Workshop Using Parameter Values Selected for Central Tendency Exposure.
Figure_Apx E-12 Scenario 2, Brush Applied: Modeled NMP Concentrations and User Exposure for Stripper Application in Workshop Using Parameter Values Selected for Upper-end User Exposure.
Page 180 of 281

Figure_Apx E-13 Scenario 3, Brush Applied: Modeled NMP Concentrations for Stripper Application in Workshop using Parameter Values Selected for Upper-end User and Non-User Exposures.
Page 181 of 281
a) Scenario 4, Saturation Concentration Constraint at 1,013 mg/m3
b) Scenario 5, Saturation Concentration Constraint at 640 mg/m3 Figure_Apx E-14 Modeled NMP Concentrations for Scenarios 4 and 5, Brush Application in Bathroom using Parameter Values selected for Upper-end to Bounding User and Non-User Exposures.
Page 182 of 281

a) Scenario 6a, User Upper-end Concentrations and Exposure, Lower Estimate
b) Scenario 6b, User Upper-end Concentrations and Exposure, Upper Estimate
Figure_Apx E-15 Modeled NMP Concentrations for Scenarios 6a and 6b, Spray Application to Coffee Table in Workshop using Lower and Upper Estimates for Emission Parameter Values selected for Upper-end User Exposures.
Page 183 of 281
a) Scenario 7a, User and Non-user Upper-end Concentrations and Exposure, Lower Estimate for Emission Parameters
b) Scenario 7b, User and Non-user Upper-end Concentrations and Exposure, Upper Estimate for Emission Parameters
Figure_Apx E-16 Modeled NMP Concentrations for Scenarios 7a and 7b, Spray Application to Chest in Workshop using Lower and Upper Estimates fir Parameter Values selected for Upper-end User and Non-user Exposures.
Page 184 of 281

E-5 MCCEM Inhalation Modeling Case Summaries NMP Summaries Formula: C5H9NO CASRN: 872-50-4 Molecular Weight: 99.13 g/mol Density: 1.028 g/cm2 (liquid) Appearance: clear liquid Melting Point: -24 °C = -11 °F = 249 K Boiling Point: 203 °C = 397 °F = 476 K Conversion units: 1 ppm = 4.054397 mg/m3 Saturation Concentration: ~1,013 mg/m3 (equivalent to a vapor pressure of 0.190 Torr at
25 °C, used in Scenario 5, based on (OECD, 2007). See section E-3)
Saturation Concentration: ~640 mg/m3 (representing the upper end of the saturation concentration values associated with "normal humidity conditions." See section E-3)
E-5-1 NMP Scenario 1. Coffee Table, Brush-On, Workshop, User in ROH during wait time, 0.45 ACH, 0.25 Weight Fraction
MCCEM Input Summary Application Method: Brush-on` Volumes: Workshop volume = 54 m3 ROH volume = 492 – 54 = 438 m3 Airflows:
Workshop-outdoors 68 m3/h ROH-outdoors 197.1 m3/h (0.45 ACH) Workshop-ROH 107 m3/h
NMP Mass Released: Coffee table = 10 sq ft surface area Applied product mass = 108 g/sq ft = 1,080 g Applied NMP = 1,080 g × 0.25 (wt fraction) = 270 g
Page 185 of 281
Total NMP mass released (theoretical, both exponentials) = 1,080 g × 0.25 (wt fraction) × 0.8695 (release fraction, theoretical) = 234.8 g For each of the 2 applications: k1 = 32.83/hr % Mass for Exponential 1 = 0.7% = 0.007*1,080*0.25 (wt fraction) * 0.5 (half per application)
= 0.95 g or 0.8% of released NMP E01 = Mass * k1 = 0.95*32.83 = 31.1 g/hr (NOTE: only k and Mass are needed as MCCEM inputs) k2 = 0.00237/hr % Mass for Exponential 2 = 86.2% = 0.862*1,080*0.25 (wt fraction) * 0.5 (half per application)
= 116.4 g or 99.2% of released NMP E02 = Mass * k2 = 116.4*0.00237 = 0.276 g/hr (NOTE: only k and Mass are needed as MCCEM
inputs) Application Times and Activity Patterns:
Episode
Elapsed Time from Time Zero, Minutes (Product User Location)
Apply 1 Wait 1 Scrape 1 Apply 2 Wait 2 Scrape 2 1) Coffee Table, Brush-On, Workshop, User ROH during wait time, 0.45 ACH, 0.25 Weight Fraction
0-5 (Use) 5-35 (ROH)
35-45 (Use)
45-50 (Use)
50-80 (ROH)
80-90 (Use)
User in ROH at the end of Scraping 2 User in ROH for the remainder of the run (22 hrs, 30 minutes) Model Run Time: 0-24 hrs User takes out scrapings after 90 minutes; emissions truncated. MCCEM Results Summary Personal Exposures (maximum values over first 24 hrs): These values were generated for comparison purposes only as described in section E-4.
In mg/m3 Individual 1 min 10 min 30 min 1 hr 4 hr 8 hr 24 hr
User 12.6 6.8 3.6 3.5 1.8 1.1 0.4 Other 2.0 2.0 2.0 1.9 1.3 0.8 0.3
In ppm
Individual 1 min 10 min 30 min 1 hr 4 hr 8 hr 24 hr User 3.1 1.7 0.9 0.9 0.5 0.3 0.1 Other 0.5 0.5 0.5 0.5 0.3 0.2 0.1
Page 186 of 281

Plots:
Page 187 of 281

E-5-2 NMP Scenario 2. Coffee Table, Brush-On, Workshop, User in Workshop during wait time, 0.45 ACH, 0.5 Weight Fraction
MCCEM Input Summary Application Method: Brush-on Volumes: Workshop volume = 54 m3 ROH volume = 492 – 54 = 438 m3 Airflows:
Workshop-outdoors 68 m3/h ROH-outdoors 197.1 m3/h (0.45 ACH) Workshop-ROH 107 m3/h
NMP Mass Released: Coffee Table = 10 sq ft surface area Applied product mass = 1,080 g Applied NMP = 1,080 g × 0.5 (wt fraction) = 540 g Total NMP mass released (both exponentials) = 1,080 g × 0.5 (wt fraction) × 0.8695 (release fraction, theoretical) =469.5 g For each of the 2 applications: k1 = 32.83/hr % Mass for Exponential 1 = 0.7% = 0.007*1,080*0.5 (wt fraction) * 0.5 (half per application)
= 1.90 g or 0.8% of released NMP E01 = Mass * k1 = 1.86*32.83 = 62.2 g/hr (NOTE: only k and Mass are needed as MCCEM inputs) k2 = 0.00237/hr % Mass for Exponential 2 = 86.2% = 0.862*1,080*0.5 (wt fraction) * 0.5 (half per application)
= 232.9 g or 99.2% of released NMP E02 = Mass * k2 = 232.9*0.00237 = 0.553 g/hr (NOTE: only k and Mass are needed as MCCEM inputs)
Page 188 of 281

Application Times and Activity Patterns:
Episode
Elapsed Time from Time Zero, Minutes (Product User Location)
Apply 1 Wait 1 Scrape 1 Apply 2 Wait 2 Scrape 2 2) Coffee Table, Brush-On, Workshop, User in Workshop during wait time, 0.45 ACH, 0.5 Weight Fraction
0-5 (Use) 5-35 (Use) 35-45 (Use)
45-50 (Use)
50-80 (Use)
80-90 (Use)
User in ROH at the end of Scraping 2 User in ROH for the remainder of the run (22 hrs, 30 minutes) Model Run Time: 0-24 hrs User takes out scrapings after 90 minutes; emissions truncated. MCCEM Results Summary Personal Exposures (maximum values over first 24 hrs): These values were generated for comparison purposes only as described in section E-4.
In mg/m3 Individual 1 min 10 min 30 min 1 hr 4 hr 8 hr 24 hr
User 33.4 31.1 24.2 19.1 8.3 4.4 1.5 Other 4.1 4.1 4.0 3.9 2.6 1.5 0.5
In ppm
Individual 1 min 10 min 30 min 1 hr 4 hr 8 hr 24 hr User 8.2 7.7 6.0 4.7 2.0 1.1 0.4 Other 1.0 1.0 1.0 1.0 0.6 0.4 0.1
Page 189 of 281

Plots:
Page 190 of 281

E-5-3 NMP Scnario 3. Chest, Brush-On, Workshop, User in ROH during wait time, 0.18 ACH, 0.5 Weight Fraction
MCCEM Input Summary Application Method: Brush-on Volumes: Workshop volume = 54 m3 ROH volume = 492 – 54 = 438 m3 Airflows:
Workshop-outdoors 68 m3/h ROH-outdoors 78.8 m3/h (0.18 ACH) Workshop-ROH 65.8 m3/h
NMP Mass Released: Chest = 25 sq ft surface area Applied product mass = 2,700 g Applied NMP = 2,700 g × 0.5 (wt fraction) = 1,350 g Total NMP mass released (both exponentials) = 2,700 g × 0.5 (wt fraction) × 0.8695 (release fraction, theoretical) =1173.8 g For each of the 2 applications: k1 = 32.83/hr % Mass for Exponential 1 = 0.7% = 0.007*2,700*0.5 (wt fraction) * 0.5 (half per application)
= 4.74 g or 0.8% of released NMP E01 = Mass * k1 = 4.739*32.83 =155.6 g/hr (NOTE: only k and Mass are needed as MCCEM inputs) k2 = 0.00237/hr % Mass for Exponential 2 = 86.2% = 0.862*2,700*0.5 (wt fraction) * 0.5 (half per application)
= 582.2 g or 99.2% of released NMP E02 = Mass * k2 = 582.2*0.00237 = 1.382 g/hr (NOTE: only k and Mass are needed as MCCEM
inputs)
Page 191 of 281

Application Times and Activity Patterns:
Episode
Elapsed Time from Time Zero, Minutes (Product User Location)
Apply 1 Wait 1 Scrape 1 Apply 2 Wait 2 Scrape 2 3) Chest, Brush-On, Workshop, User in ROH during wait time, 0.18 ACH, 0.5 Weight Fraction
0-12.5 (Use)
12.5-42.5 (ROH)
42.5-67.5 (Use)
67.5-80 (Use)
80-110 (ROH)
110-135 (Use)
User in ROH at the end of Scraping 2 User in ROH for the remainder of the run (21 hrs, 45 minutes) Model Run Time: 0-24 hrs User takes out scrapings after 135 minutes; emissions truncated. MCCEM Results Summary Personal Exposures (maximum values over first 24 hrs): These values were generated for comparison purposes only as described in section E-4.
In mg/m3 Individual 1 min 10 min 30 min 1 hr 4 hr 8 hr 24 hr
User 76.0 51.4 32.7 25.4 15.6 10.3 3.9 Other 10.4 10.4 10.3 10.2 8.3 6.2 2.5
In ppm
Individual 1 min 10 min 30 min 1 hr 4 hr 8 hr 24 hr User 18.7 12.7 8.1 6.3 3.9 2.5 1.0 Other 2.6 2.6 2.5 2.5 2.1 1.5 0.6
Page 192 of 281

Plots:
Page 193 of 281
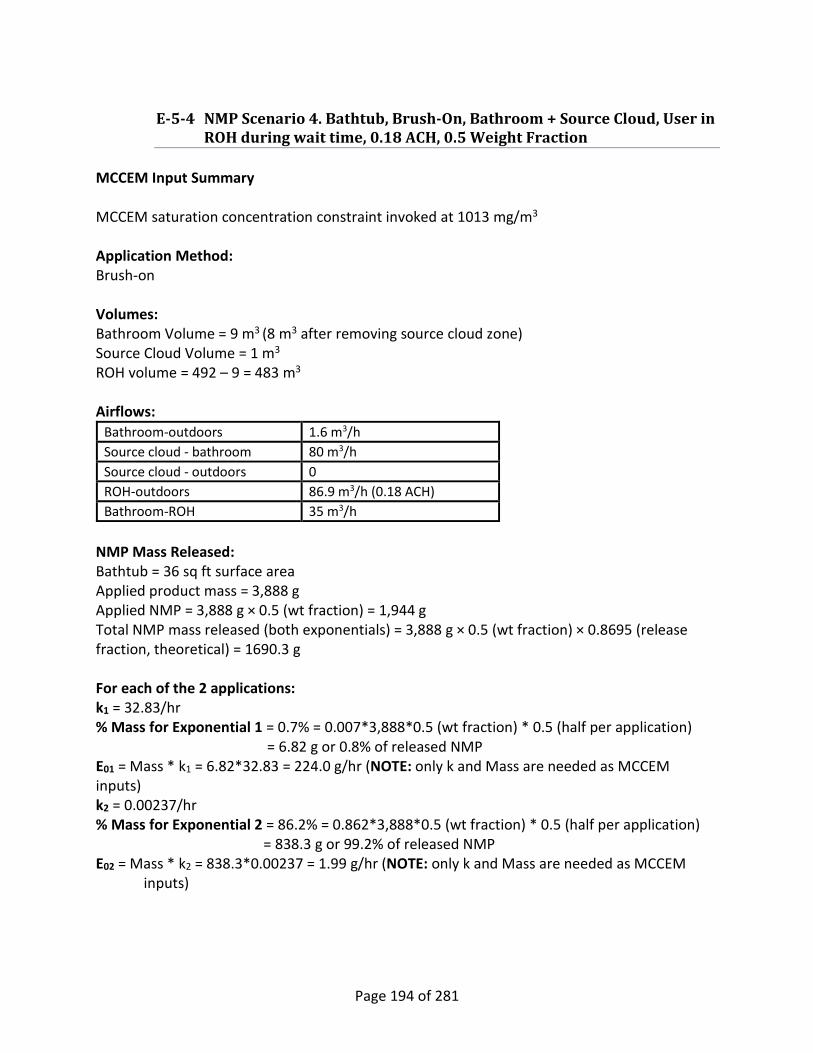
E-5-4 NMP Scenario 4. Bathtub, Brush-On, Bathroom + Source Cloud, User in ROH during wait time, 0.18 ACH, 0.5 Weight Fraction
MCCEM Input Summary MCCEM saturation concentration constraint invoked at 1013 mg/m3 Application Method: Brush-on Volumes: Bathroom Volume = 9 m3 (8 m3 after removing source cloud zone) Source Cloud Volume = 1 m3 ROH volume = 492 – 9 = 483 m3 Airflows:
Bathroom-outdoors 1.6 m3/h Source cloud - bathroom 80 m3/h Source cloud - outdoors 0 ROH-outdoors 86.9 m3/h (0.18 ACH) Bathroom-ROH 35 m3/h
NMP Mass Released: Bathtub = 36 sq ft surface area Applied product mass = 3,888 g Applied NMP = 3,888 g × 0.5 (wt fraction) = 1,944 g Total NMP mass released (both exponentials) = 3,888 g × 0.5 (wt fraction) × 0.8695 (release fraction, theoretical) = 1690.3 g For each of the 2 applications: k1 = 32.83/hr % Mass for Exponential 1 = 0.7% = 0.007*3,888*0.5 (wt fraction) * 0.5 (half per application)
= 6.82 g or 0.8% of released NMP E01 = Mass * k1 = 6.82*32.83 = 224.0 g/hr (NOTE: only k and Mass are needed as MCCEM inputs) k2 = 0.00237/hr % Mass for Exponential 2 = 86.2% = 0.862*3,888*0.5 (wt fraction) * 0.5 (half per application)
= 838.3 g or 99.2% of released NMP E02 = Mass * k2 = 838.3*0.00237 = 1.99 g/hr (NOTE: only k and Mass are needed as MCCEM
inputs)
Page 194 of 281

Application Times and Activity Patterns:
Episode
Elapsed Time from Time Zero, Minutes (Product User Location)
Apply 1 Wait 1 Scrape 1 Apply 2 Wait 2 Scrape 2 4) Bathtub, Brush-On, Bathroom + Source Cloud, User in ROH during wait time, 0.18 ACH, 0.50 Weight Fraction
0-18 (Use) 18-48 (ROH)
48-84 (Use)
84-102 (Use)
102-132 (ROH)
132-168 (Use)
User in ROH at the end of Scraping 2 User in ROH for the remainder of the run (21 hrs 12 minutes) Model Run Time: 0-24 hrs User takes out scrapings after 168 minutes; emissions truncated. MCCEM Results Summary Personal Exposures (maximum values over first 24 hrs): These values were generated for comparison purposes only as described in section E-4.
In mg/m3 Individual 1 min 10 min 30 min 1 hr 4 hr 8 hr 24 hr
User 796.8 691.7 365.96 234.4 136.0 77.4 28.6 Other 30.7 30.7 30.5 30.1 25.9 20.4 9.4
In ppm
Individual 1 min 10 min 30 min 1 hr 4 hr 8 hr 24 hr User 196.5 170.6 90.2 57.8 33.5 19.1 7.1 Other 7.6 7.6 7.5 7.4 6.4 5.0 2.3
Page 195 of 281

Plots:
Page 196 of 281

E-5-5 NMP Scenario 5. Bathtub, Brush-On, Bathroom + Source Cloud, User in ROH during wait time, 0.18 ACH, 0.5 Weight Fraction
MCCEM Input Summary MCCEM saturation concentration constraint invoked at 640 mg/m3 Application Method: Brush-on Volumes: Bathroom Volume = 9 m3 (8 m3 after removing source cloud zone) Source Cloud Volume = 1 m3 ROH volume = 492 – 9 = 483 m3 Airflows:
Bathroom-outdoors 1.6 m3/h Source cloud - bathroom 80 m3/h Source cloud - outdoors 0 ROH-outdoors 86.9 m3/h (0.18 ACH) Bathroom-ROH 35 m3/h
NMP Mass Released: Bathtub = 36 sq ft surface area Applied product mass = 3,888 g Applied NMP = 3,888 g × 0.5 (wt fraction) = 1,944 g Total NMP mass released (both exponentials) = 3,888 g × 0.5 (wt fraction) × 0.8695 (release fraction, theoretical) = 1690.3 g For each of the 2 applications: k1 = 32.83/hr % Mass for Exponential 1 = 0.7% = 0.007*3,888*0.5 (wt fraction) * 0.5 (half per application)
= 6.82 g or 0.8% of released NMP E01 = Mass * k1 = 6.82*32.83 = 224.0 g/hr (NOTE: only k and Mass are needed as MCCEM inputs) k2 = 0.00237/hr % Mass for Exponential 2 = 86.2% = 0.862*3,888*0.5 (wt fraction) * 0.5 (half per application)
= 838.3 g or 99.2% of released NMP E02 = Mass * k2 = 838.3*0.00237 = 1.99 g/hr (NOTE: only k and Mass are needed as MCCEM
inputs)
Page 197 of 281

Application Times and Activity Patterns:
Episode
Elapsed Time from Time Zero, Minutes (Product User Location)
Apply 1 Wait 1 Scrape 1 Apply 2 Wait 2 Scrape 2 5) Bathtub, Brush-On, Bathroom + Source Cloud, User in ROH during wait time, 0.18 ACH, 0.50 Weight Fraction
0-18 (Use) 18-48 (ROH)
48-84 (Use)
84-102 (Use)
102-132 (ROH)
132-168 (Use)
User in ROH at the end of Scraping 2 User in ROH for the remainder of the run (21 hrs 12 minutes) Model Run Time: 0-24 hrs User takes out scrapings after 168 minutes; emissions truncated. MCCEM Results Summary Personal Exposures (maximum values over first 24 hrs): These values were generated for comparison purposes only as described in section E-4.
In mg/m3 Individual 1 min 10 min 30 min 1 hr 4 hr 8 hr 24 hr
User 640.0 627.8 344.6 223.8 133.2 76.0 28.1 Other 30.7 30.7 30.5 30.1 25.9 20.4 9.4
In ppm
Individual 1 min 10 min 30 min 1 hr 4 hr 8 hr 24 hr User 157.9 154.9 85.0 55.2 32.8 18.7 6.9 Other 7.6 7.6 7.5 7.4 6.4 5.0 2.3
Page 198 of 281

Plots:
Page 199 of 281

E-5-6 NMP Scenario 6a. Coffee Table, Spray-On, Workshop, User in workshop during wait time, 0.45 ACH, 0.53 Weight Fraction
MCCEM Input Summary Application Method: Spray-on Volumes: Workshop volume = 54 m3 ROH volume = 492 – 54 = 438 m3 Airflows:
Workshop-outdoors 68 m3/h ROH-outdoors 197.1 m3/h (0.45 ACH) Workshop-ROH 107 m3/h
NMP Mass Released: Coffee Table = 10 sq ft surface area Applied product mass = 810 g Applied NMP = 810 g × 0.53 (wt fraction) = 429.3 g Total NMP mass released (both exponentials) = 810 g × 0.53 (wt fraction) × 0.8695 (release fraction, theoretical) =373.3 g For each of the 2 applications: k1 = 32.83/hr % Mass for Exponential 1 = 0.7% = 0.007 *810 *0.53 (wt fraction) * 0.5 (half per application)
= 1.5 g E01 = Mass * k1 = 1.5*32.83 =49.245 g/hr (NOTE: only k and Mass are needed as MCCEM inputs) k2 = 0.00237/hr % Mass for Exponential 2 = 86.25% = 0.8625 *810 *0.53 (wt fraction) * 0.5 (half per application)
= 185.1 g E02 = Mass * k2 = 185.1*0.00237=0.439 g/hr (NOTE: only k and Mass are needed as MCCEM inputs) Application Times and Activity Patterns:
Episode
Elapsed Time from Time Zero, Minutes (Product User Location)
Apply 1 Wait 1 Scrape 1 Apply 2 Wait 2 Scrape 2 6a) Coffee Table, Spray-On, Workshop, User in workshop during wait time, 0.45 ACH, 0.53 Weight Fraction
0-2.5 (Use)
2.5 -32.5 (Use)
32.5-42.5 (Use)
42.5-45 (Use)
45-75 (Use)
75-85 (Use)
User in ROH at the end of Scraping 2 User in ROH for the remainder of the run (22 hrs, 35 minutes)
Page 200 of 281

Model Run Time: 0-24 hrs User takes out scrapings after 85 minutes; emissions truncated. MCCEM Results Summary Personal Exposures (maximum values over first 24 hrs): These values were generated for comparison purposes only as described in section E-4.
In mg/m3 Individual 1 min 10 min 30 min 1 hr 4 hr 8 hr 24 hr
User 27.3 25.3 19.5 15.9 6.5 3.5 1.2 Other 3.2 3.2 3.2 3.1 2.0 1.2 0.4
In ppm
Individual 1 min 10 min 30 min 1 hr 4 hr 8 hr 24 hr User 6.7 6.2 4.8 3.9 1.6 0.9 0.3 Other 0.8 0.8 0.8 0.8 0.5 0.3 0.1
Plots:
Page 201 of 281

Page 202 of 281

E-5-7 New Scenario 6b. Coffee Table, Spray-On, Workshop, User in workshop during wait time, 0.45 ACH, 0.53 Weight Fraction
MCCEM Input Summary Application Method: Spray-on Volumes: Workshop volume = 54 m3 ROH volume = 492 – 54 = 438 m3 Airflows:
Workshop-outdoors 68 m3/h ROH-outdoors 197.1 m3/h (0.45 ACH) Workshop-ROH 107 m3/h
NMP Mass Released: Coffee Table = 10 sq ft surface area Applied product mass = 810 g Applied NMP = 810 g × 0.53 (wt fraction) = 429.3 g Total NMP mass released (both exponentials) = 810 g × 0.53 (wt fraction) × 0.8695 (release fraction, theoretical) =373.3 g For each of the 2 applications: k1 = 32.83/hr % Mass for Exponential 1 = 7% = 0.07 *810 *0.53 (wt fraction) * 0.5 (half per application)
= 15.0 g E01 = Mass * k1 = 15*32.83 =492.45 g/hr (NOTE: only k and Mass are needed as MCCEM inputs) k2 = 0.00237/hr % Mass for Exponential 2 = 79.95% = 0.7995 *810 *0.53 (wt fraction) * 0.5 (half per application)
= 171.6 g E02 = Mass * k2 = 171.6*0.00237=0.41 g/hr (NOTE: only k and Mass are needed as MCCEM inputs) Application Times and Activity Patterns:
Episode
Elapsed Time from Time Zero, Minutes (Product User Location)
Apply 1 Wait 1 Scrape 1 Apply 2 Wait 2 Scrape 2 6b) Coffee Table, Spray-On, Workshop, User in workshop during wait time, 0.45 ACH, 0.53 Weight Fraction
0-2.5 (Use)
2.5 -32.5 (Use)
32.5-42.5 (Use)
42.5-45 (Use)
45-75 (Use)
75-85 (Use)
User in ROH at the end of Scraping 2 User in ROH for the remainder of the run (22 hrs, 35 minutes)
Page 203 of 281

Model Run Time: 0-24 hrs User takes out scrapings after 85 minutes; emissions truncated. MCCEM Results Summary Personal Exposures (maximum values over first 24 hrs): These values were generated for comparison purposes only as described in section E-4.
In mg/m3 Individual 1 min 10 min 30 min 1 hr 4 hr 8 hr 24 hr
User 245.9 224.0 160.9 138.6 53.3 28.3 9.5 Other 26.4 26.4 26.0 24.8 16.2 9.6 3.3
In ppm
Individual 1 min 10 min 30 min 1 hr 4 hr 8 hr 24 hr User 60.6 55.3 39.7 34.2 13.2 7.0 2.3 Other 6.5 6.5 6.4 6.1 4.0 2.4 0.8
Plots:
Page 204 of 281

Page 205 of 281

E-5-8 NMP Scenario 7a Chest, Spray-On, Workshop, User in ROH during wait time, 0.18 ACH, 0.53 Weight Fraction
MCCEM Input Summary Application Method: Spray -on Volumes: Workshop volume = 54 m3 ROH volume = 492 – 54 = 438 m3 Airflows:
Workshop-outdoors 68 m3/h ROH-outdoors 78.8 m3/h (0.18 ACH) Workshop-ROH 65.8 m3/h
NMP Mass Released: Chest = 25 sq ft surface area Applied product mass = 2,025 g Applied NMP = 2,025 g × 0.53 (wt fraction) = 1,073.25 g Total NMP mass released (both exponentials) = 2,025 g × 0.53 (wt fraction) × 0.8695 (release fraction, theoretical) = 933.19 g For each of the 2 applications: k1 = 32.83/hr % Mass for Exponential 1 = 0.7% = 0.007 *2025 *0.53 (wt fraction) * 0.5 (half per application)
= 3.76 g E01 = Mass * k1 = 3.76*32.83 =123.322 g/hr (NOTE: only k and Mass are needed as MCCEM inputs) k2 = 0.00237/hr % Mass for Exponential 2 = 86.25% = 0.8625 *2025*0.53 (wt fraction) * 0.5 (half per application)
= 462.84 g E02 = Mass * k2 = 462.84*0.00237=1.097 g/hr (NOTE: only k and Mass are needed as MCCEM inputs) Application Times and Activity Patterns:
Episode
Elapsed Time from Time Zero, Minutes (Product User Location)
Apply 1 Wait 1 Scrape 1 Apply 2 Wait 2 Scrape 2 7a) Coffee Table, Spray-On, Workshop, User in ROH during wait time, 0.18 ACH, 0.53 Weight Fraction
0-6.25 (Use)
6.25-36.25 (ROH)
36.25-61.25 (Use)
61.25-67.5 (Use)
67.5-97.5 (ROH)
97.5-122.5 (Use)
User in ROH at the end of Scraping 2 User in ROH for the remainder of the run (21 hrs, 57.5 minutes)
Page 206 of 281

Model Run Time: 0-24 hrs User takes out scrapings after 122.5 minutes; emissions truncated. MCCEM Results Summary Personal Exposures (maximum values over first 24 hrs): These values were generated for comparison purposes only as described in section E-4.
In mg/m3 Individual 1 min 10 min 30 min 1 hr 4 hr 8 hr 24 hr
User 44.6 25.9 21.0 15.9 9.2 5.3 1.8 Other 7.9 7.9 7.9 7.7 5.4 3.3 1.1
In ppm
Individual 1 min 10 min 30 min 1 hr 4 hr 8 hr 24 hr User 11.0 6.4 5.2 3.9 2.3 1.3 0.4 Other 2.0 2.0 1.9 1.9 1.3 0.8 0.3
Plots:
Page 207 of 281

Page 208 of 281

E-5-9 NMP Scenario 7b Chest, Spray-On, Workshop, User in ROH during wait time, 0.18 ACH, 0.53 Weight Fraction
MCCEM Input Summary Application Method: Spray -on Volumes: Workshop volume = 54 m3 ROH volume = 492 – 54 = 438 m3 Airflows:
Workshop-outdoors 68 m3/h ROH-outdoors 78.8 m3/h (0.18 ACH) Workshop-ROH 65.8 m3/h
NMP Mass Released: Chest = 25 sq ft surface area Applied product mass = 2,025 g Applied NMP = 2,025 g × 0.53 (wt fraction) = 1,073.25 g Total NMP mass released (both exponentials) = 2,025 g × 0.53 (wt fraction) × 0.8695 (release fraction, theoretical) = 933.19 g For each of the 2 applications: k1 = 32.83/hr % Mass for Exponential 1 = 7% = 0.07 *2025 *0.53 (wt fraction) * 0.5 (half per application)
= 37.56 g E01 = Mass * k1 = 37.56*32.83 = 1233.22 g/hr (NOTE: only k and Mass are needed as MCCEM inputs) k2 = 0.00237/hr % Mass for Exponential 2 = 79.95% = 0.7995 *2025 *0.53 (wt fraction) * 0.5 (half per application)
= 429.03 g E02 = Mass * k2 = 429.03*0.00237=1.02 g/hr (NOTE: only k and Mass are needed as MCCEM inputs) Application Times and Activity Patterns:
Episode
Elapsed Time from Time Zero, Minutes (Product User Location)
Apply 1 Wait 1 Scrape 1 Apply 2 Wait 2 Scrape 2 7b) Coffee Table, Spray-On, Workshop, User in ROH during wait time, 0.18 ACH, 0.53 Weight Fraction
0-6.25 (Use)
6.25-36.25 (ROH)
36.25-61.25 (Use)
61.25-67.5 (Use)
67.5-97.5 (ROH)
97.5-122.5 (Use)
User in ROH at the end of Scraping 2 User in ROH for the remainder of the run (21 hrs, 57.5 minutes)
Page 209 of 281

Model Run Time: 0-24 hrs User takes out scrapings after 122.5 minutes; emissions truncated. MCCEM Results Summary Personal Exposures (maximum values over first 24 hrs): These values were generated for comparison purposes only as described in section E-4.
In mg/m3 Individual 1 min 10 min 30 min 1 hr 4 hr 8 hr 24 hr
User 386.8 168.9 118.9 100.1 61.6 35.4 12.0 Other 62.0 61.9 61.0 58.4 39.9 24.2 8.3
In ppm
Individual 1 min 10 min 30 min 1 hr 4 hr 8 hr 24 hr User 95.4 41.7 29.3 24.7 15.2 8.7 3.0 Other 15.3 15.3 15.1 14.4 9.8 6.0 2.0
Plots:
Page 210 of 281

Page 211 of 281
Appendix F TOXICOLOGY STUDIES
F-1 Literature Collection Several high quality risk and hazard assessments were available for NMP, including RIVM Proposal for a Restriction of NMP (RIVM, 2013), the OECD Screening Information Data Set (OECD, 2007), OEHHA MADL (OEHHA, 2003) and the WHO Concise International Chemical Assessment Document (CICAD) for NMP (WHO, 2001). The assessments were surveyed to determine which endpoint or endpoints yielded relevant, sensitive and consistent effects. As described in section 3.1.2, EPA/OPPT determined developmental toxicity endpoints are the most sensitive, relevant and consistent across multiple studies. Every publicly available study evaluating developmental toxicity endpoints was obtained for EPA/OPPT review. In addition, a small number of recent toxicological studies were identified by peer reviewers and public commenters and were also considered in the assessment.
F-2 Study Quality and Selection Considerations Toxicological studies were evaluated for quality, considering soundness, applicability and utility, clarity and completeness and uncertainty and variability (EPA, 2014a). Specifically, each laboratory animal-based study was reviewed considering the following factors:
• the adequacy of study design, • test animals (e.g., species, strain, source, sex, age/lifestage/embryonic stage), • environment (e.g., husbandry, culture medium), • test substance (e.g., identification, purity, analytical confirmation of stability and
concentration), • treatment (e.g., dose levels, controls, vehicle, group sizes, duration, route of
administration), • endpoints evaluated (e.g., schedule of evaluation, randomization and blinding
procedures, assessment methods) and • reporting (quality and completeness)
The evaluation also included a number of considerations, as described below in Table_Apx F-1
Page 212 of 281

Table_Apx F-1 Study Quality Considerations
Page 213 of 281

F-3 Developmental Toxicity Studies Considered for Use in Risk Assessment
The studies summarized in this section were identified for consideration in the dose-response assessment, as described in section 3.1.3.
F-3-1 Oral Toxicity Studies Sitarek et al., 2012 Sitarek et al. (2012) examined the reproductive toxicity of NMP by oral gavage in female Wistar rats. Females were exposed to aqueous NMP solutions of 0, 150, 450 and 1,000 mg/kg bw/day (26% of the LD50). The number of females in the exposure groups was 24, 26, 28 and 22 animals respectively. Exposures were 5 days/week 2 weeks before mating, 1 week of mating, 3 weeks of gestation and 3 weeks of lactation. The litter size was reduced to 8 pups 4 days after birth. Offspring were assessed for litter weight, mean pup weight and mortality. The 0, 150 and 450 mg/kg bw/day dams were sacrificed after 21 days of lactation. Females from the 1,000 mg/kg bw/day group with no delivery were sacrificed 25 days after mating. Major organs were selected for histopathology. Two of the females in the high dose group died during the experiment. No other animals died. Water and food consumption was reduced in the 1,000 mg/kg bw/day but not the other exposure groups. At day 20 of gestation, all treated female BW values were significantly less than controls but did not differ on day 21 of lactation in the low and mid dose females. The percent BW gain for this period is presented in Table_Apx F-2 below. Organ weights in the 1,000 mg/kg bw/day group were not evaluated because they were sacrificed on day 25 after insemination. Absolute and relative organ weights in the 150 and 450 mg/kg bw/day groups were not different from control with the exception of increased relative thyroid weights in 450 mg/kg females. However, the thyroid was not examined histopathologically so the significance of this single finding is uncertain. Hematocrit values were statistically significantly different from control at the 150 and 450 mg/kg bw/day doses (Sitarek et al., 2012). Microscopic examination of the 1,000 mg/kg bw/day females revealed normal lungs, liver, kidneys, spleen, brain and adrenal glands. However, they had a lower number of corpora lutea in comparison to control, low and mid dose females. Infiltrations of mononuclear cells, granulocytes and early resorptions were noted in the uterine mucosa and myometrium were also noted in the 1,000 mg/kg bw/day females. The NOAEL for the dams is 450 mg/kg bw/day (Sitarek et al., 2012). The reproductive performance of females is detailed in Table_Apx F-2. Fertility and offspring viability were drastically affected in 1,000 mg/kg bw/day females. Only 15 of 22 inseminated
Page 214 of 281

females became pregnant and only 7 of them gave birth to a total of 3 live-born and 5 stillborn. The live born fetuses did not survive to day 4 of lactation. The percent of pregnant females in the 450 mg/kg bw/day was less than control. The percent of pups that survived to day 4 and day 21 was significantly less than control in the 150 and 450 mg/kg bw/day females. The pup body weights on day 4 were significantly lower than control in the low and mid dose groups but recovered by day 21 in the 150 mg/kg bw/day group. The LOAEL for developmental effects on the offspring is 150 mg/kg, based on viability of offspring (Sitarek et al., 2012). Table_Apx F-2 Reproductive Performance of Females, Summarized from Sitarek et al, 2012
Dose mg/kg bw/day
0 150 450 1,000
Number of Animals Mating females with males
24 26 28 22
Pregnant females
22 24 20 15
Died females* 0 0 0 2 Live pups per litter
11.5 ± 3.5a 10.4 ± 2.6 10.5 ± 3.4 0.33 ± 0.82b
Dead pups per litter
0.18 ± 0.85 0 0.13 ± 0.34 0.80 ± 1.1b
Sex ratio (F : M) 132 : 125 112:137 105:107 5:3 Indices
Fertility %c 91.7 92.3 71.4b 68.2b Viability %d 94.0 86.4b 71.6b 0 Lactation %e 96.1 78.2b 43.4b 0 Body weight gain of mothers from 0 to 20 GD (% control)
100 87.7 75.6 40.8
Notes: *Two nonpregnant females died in the 30th and in the 32nd day of experiment, respectively. a Mean ± SD. b Significantly different (p < 0.05) from control value. c Fertility index = percentage of pregnant females in mating females group d Viability index = percentage of pups born alive that survived to 4 days e Lactation index = percentage of pups alive at 4 days that survived to 21 days F, female; M, male; GD, gestation day.
Sitarek and Stetkiewicz, 2008 Sitarek and Stetkiewicz (2008) examined the reproductive toxicity of NMP in male Imp:WIST rats. Male rats, 24 per dose, were exposed by gavage to aqueous NMP solutions of 0, 100, 300 and 1,000 mg/kg bw/day (identified as 25% of the LD50) for 5 days/week, 10 weeks before
Page 215 of 281
mating and 1 week during mating. Males were paired in a 1:1 ratio except 1,000 mg/kg bw/day males were paired with 2 females. Females were not treated. At the end of mating, the males were sacrificed and macroscopic examination of internal organs, hematocrit with absolute and relative organ weight data collected. Testis and epididymis were examined histopathologically. Postnatal development of the offspring was examined through the end of lactation on day 28. On day 4 the litter size was reduced to 8 animals. Pups were examined on days 1, 4, 7, 14 and 21 for body weight, day of pinna detachment, incisor eruption and lid slit opening. The body weight gain of all treated males was significantly lower than control. The food intake in the 100 and 300 mg/kg bw/day was 8-12% higher than control during the first weeks but did not differ later in the study. At 100 mg/kg bw/day water intake was 8-25% lower than control during the study whereas it was 12-16% lower only during weeks 6, 9 and 10 of exposure. Hematocrit value was higher only in the 1,000 mg/kg bw/day group. Absolute and relative testis weights were lower only in the high dose. Absolute and relative epididymis weights were higher at the 2 lower doses but lower at the high dose. Significant decreases in major organ weights were seen at the high dose. The absolute brain weight was increased at 100 and 300 mg/kg bw/day but decreased at 1,000 mg/kg bw/day. Relative brain weights were increased at all doses. Relative liver weights were increased in the mid and high doses. There appears to be an inconsistency in reporting. The paper states that body weight is lower in all exposed males and refers to Figure 1. Figure 1 illustrates change in body weight, while Table 1 lists body weights, but the table and figure do not seem to agree; Figure 1 shows significant differences between all exposures groups and the control group but Table 1 shows differences only between the control and high dose group. Because of this apparent discrepency, EPA/OPPT considers making any definitive conclusions with regard to body weight and organ weights (detailed in Table 1 of the publication) are problematic. There was a significant lack of reproductive performance in the 1,000 mg/kg bw/day group where only 2 of 44 mated females produced progeny and the total number of pups was 6. The other sperm-positive females (as evidenced by the presence of sperm in their vaginal smears) did not produce live litters. At 100 and 300 mg/kg bw/day the percent of fertile females, pups born per litter and survival from 4-21 days did not differ from controls. However, the percent of pups born that survived to day 4 (94.0, 95.9 and 80.9 in the 0, 100 and 300 mg/kg bw/day groups respectively) was significantly lower at 300 mg/kg bw/day. None of the 1,000 mg/kg pups survived to day 4. Other measures of growth and development (body weight day of pinna detachment, incisor eruption and lid slit opening) did not differ from control in the 100 and 300 mg/kg bw/day groups. The NOAEL for developmental effects was 100 mg/kg bw/day and the LOAEL was 300 mg/kg bw/day (reduced pup survival from day 0-4) (Sitarek and Stetkiewicz, 2008). At 1,000 mg/kg bw/day the seminiferous epithelium was extensively damaged and stages of spermatogenesis could not be determined. Sertoli cells and a small number of spermatogonia and spermatocytes were observed. Early and late spermatids were not found in the tubules, possibly due to the inhibition of the spermatocyte to spermatid stage of spermatogenesis.
Page 216 of 281

Interstitial edema foci and intercellular edema was observed in the parabasal zone of the seminiferous epithelium of 3/24 rats at 300 mg/kg bw/day and 2/24 rats at the 100 mg/kg bw/day groups; the statistical significance of this finding was not evaluated (Sitarek and Stetkiewicz, 2008). NMP Producers Group, 1999a In an OECD 416 guideline study, groups of 30 Sprague-Dawley rats per sex were given NMP via the diet at initial dose levels of 0, 50, 160 or 500 mg/kg bw/day for 10 weeks prior to premating, during mating, gestation and lactation and during the rest period between pregnancies. Concentrations were adjusted regularly in response to body weight gain. The highest dose was reduced to 350 mg/kg bw/day due to severe pup mortality in the first litter (F1a). The parental animals for the second generation were selected from pups of the second litter (F1b).
NMP had no adverse effects on reproductive performance or fertility of the F0 or F1 parental animals of all substance-treated groups and as demonstrated by the clinical and histopathological examinations. The parental Sprague-Dawley rats were not systemically affected after reduction to 350 mg/kg bw/day. Parental toxicity in the Wistar rats consisted of reduced body weight gain and food intake as well as kidney findings in form of impaired organ weight and histopathological findings. Developmental toxicity was evidenced by increased pup mortality and reduced body weight gain, including corresponding effects in the investigated organs, in pups treated at 500/350 mg/kg bw/day. Thus, the NOAEL for reproductive performance/fertility was 350 mg/kg bw/day. The NOAEL for systemic (parental) and developmental toxicity was 160 mg/kg bw/day (NMP Producers Group, 1999a).
NMP Producers Group, 1999b In an OECD 416 guideline study, groups of 25 Wistar rats per sex were given NMP via the diet at initial dose levels of 0, 50, 160 or 500 mg/kg bw/day for 10 weeks prior to premating, during mating, gestation and lactation and during the rest period between pregnancies. Concentrations were adjusted regularly in response to body weight gain. The highest dose was reduced to 350 mg/kg bw/day due to severe pup mortality in the first litter (F1a). The parental animals for the second generation were selected from pups of the second litter (F1b). NMP had no adverse effects on reproductive performance or fertility of the F0 or F1 parental animals of all substance-treated groups and as demonstrated by the clinical and histopathological examinations. The Wistar rats revealed signs of systemic toxicity in each of the high dose groups at 500 mg/kg bw/day and also after reduction to 350 mg/kg bw/day. Parental toxicity in the Wistar rats consisted of reduced body weight gain and food intake as well as kidney findings in form of impaired organ weight and histopathological findings. Developmental toxicity was evidenced by increased pup mortality and reduced body weight gain, including corresponding effects in the investigated organs, in pups treated at 500/350 mg/kg bw/day. Thus, the NOAEL for reproductive performance/fertility was 350 mg/kg bw/day. The NOAEL for systemic (parental) and developmental toxicity was 160 mg/kg bw/day (NMP Producers Group, 1999b).
Page 217 of 281

Saillenfait et al., 2002 In an OECD 414 guideline study, pregnant Sprague-Dawley rats were treated via gavage with aqueous NMP solutions of 0, 125, 250, 500 or 750 mg/kg bw/day during gestational days 6 through 20. Females were observed daily for signs of toxicity. On GD 21 females were killed and the uterus was removed and weight; contents were examined for implantation sites, resorptions, live/dead fetuses and corpora lutea/ovary. Live fetuses were weighed, sexed and evaluated for external and skeletal anomalies. Half of the live fetues/litter were preserved for internal evaluation. Significant decreases in maternal body weight gain and food consumption were observed at 250, 500 and 750 mg/kg bw/day. Post implantation losses and the number of resorptions were increased at 500 mg/kg bw/day. The rate of fetal malformations (external, skeletal, soft tissue) was increased at ≥500 mg/kg bw/day. Malformations included external (anasarca, anal atresia), soft tissue (persistent truncus arteriosus) and skeletal findings (fusion or absence of cervical arches were most prominent). Reduced fetal weights were observed at ≥250 mg/kg bw/day, delayed ossification of skull bones and sternebrae and an increase in skeletal variations at ≥500 mg/kg bw/day. There was also a very low proportion of live fetuses and an increase in the rate of soft tissue variations at 750 mg/kg bw/day. The NOAEL for maternal toxicity and developmental toxicity, based on fetal body weight, is 125 mg/kg bw/day. The NOAEL for malformations was 250 mg/kg bw/day (Saillenfait et al., 2002). Exxon Biomedical Sciences, 1992 Groups of 25 pregnant Sprague-Dawley (Crl:CD®BR) rats received an aqueous NMP solution at dose levels of 0, 40, 125 or 400 mg/kg bw/day by gavage during gestation days 6 – 15. Reduced body weight gain was observed between gestational days 6 – 15 in dams, reduced fetal body weights and an increase in fetal growth retardation were noted at the high dose only. The incidence of malformations was comparable among all groups. The NOAEL for maternal and developmental toxicity was 125 mg/kg bw/day (Exxon Biomedical Sciences, 1992).
F-3-2 Inhalation Toxicity Studies Saillenfait et al., 2003 Rats were exposed whole-body to 0, 30, 60 and 120 ppm (122, 243 and 486 mg/m3) for six hrs/day during gestation days (GDs) 6 through 20 (Saillenfait et al., 2003). For exposures, the females were transferred to stainless-steel wire-mesh exposure cages and the cages were moved into the 200 L stainless-steel exposure chambers. NMP vapors were generated and delivered at constant rate with an infusion pump and concentrations were monitored with a gas chromatograph. Because NMP has a low vapor pressure, particle formation was monitored by measuring and comparing in the number of particles in the exposure chamber between
Page 218 of 281

control and exposure doses; no differences were observed so it was concluded that exposures were to vapor. Slight maternal toxicity was evidenced by significantly decreased body weight gain in the dams on GDs 6 through 13 at 243 and 486 mg/m3 as well as decreased food consumption at 486 mg/m3 on GDs 13 through 21. There were no effects on embryo/fetal viability or teratogenic effects at any dose. There was a slight body weight decrease in the fetus at 486 mg/m3. The no-observed-adverse-effect level (NOAEL) for maternal toxicity was 122 mg/m3 and the observed fetal NOAEL was 243 mg/m3 (Saillenfait et al., 2003). Hass et al., 1995 Pregnant rats were exposed by whole-body inhalation to NMP at 151 ppm (612 mg/m3) for six hrs/day from GD 4 to 20. The concentration of N-methylpyrrolidone in the chamber was monitored continuously and the pregnant animals were observed daily after exposure for signs of toxicity and body weight and food consumption. On day 21 of pregnancy, the rats were sacrificed. All rats were examined for macroscopic changes body weight, weight of intact uterus, number of corpora lutea, number of implantations and fetuses alive, dead or resorbed. Live fetuses were weighed, their sex determined, examined for gross external malformations and then dissected. No clinical signs of maternal toxicity were observed and there were no statistically significant differences regarding the number of corpora lutea, implantations, resorptions or live fetuses per dam. There was in the exposed group, a higher incidence of preimplantation loss (87% of the exposed dams compared to 55% of dams in the control group (P<0.05)). In addition, the mean fetal body weight, adjusted for litter size, was significantly lower in the exposed group. Delayed ossification was generally observed among litters of NMP-exposed rats (Hass et al., 1995). Hass et al., 1994 Hass et al. (1994) investigated the effects of NMP on postnatal development and behavior in rats. Dams were exposed by whole-body inhalation to analytically determined levels of 151 ppm (612 mg/m3) for six hrs/day from GD 7 to 20. Offspring were weighed through PND 22 and males were examined with a series of different behavioral tests from day 1 to 7.5 months. There were no signs of maternal toxicity, but the mean body weight in litters from exposed dams was significantly lower than control. The difference in weights was no longer statistically significant after five weeks of age. Some developmental milestones and reflexes (i.e., surface righting reflex, incisor eruption, etc.) were delayed in exposed animals. In neurobehavioral measures (i.e., motor and balance function assessed on rotorod), as well as in activity level (i.e., open field) and performance in learning tasks that had a low grade of complexity, there were no differences between control and exposed animals. However, performance was impaired in more difficult tasks (i.e., reversal procedure in Morris water maze and operant delayed spatial alternation). It is interesting to note that the offspring with the lowest score in the Morris water maze test were those with the lowest body weight at weaning. Because only one dose was
Page 219 of 281

used, a NOAEL for neurotoxicity could not be determined. Also, this study did not include exposures during embryogenesis and organgogenesis (pre GD 7) that may contribute to postnatal development outcomes (Hass et al., 1994). Du Pont, 1990 The DuPont (1990) study included both a reproductive and developmental component. For the developmental component, 10 male and 10 female rats were exposed via whole body to 10, 52 or 116 ppm (42, 206 or 470 mg/m3 analytical) for six hrs/day seven days/week in two-generation reproductive effects study. For the reproductive effects component, males and females were exposed throughout the breeding period. Exposures continued for females through pregnancy, ending on GD 20. Exposures were continued on PND 4 through PND 21. There was no exposure after weaning of the F1 generation. F1 rats were mated with controls of the opposite sex to produce the F2 generation. In a parallel developmental toxicity study, males or females were exposed to 0 or 116 ppm during the breeding period and mated with unexposed partners. Exposure to pregnant females continued through GD 20, as described above. At GD 21, all females were sacrificed and a detailed examination of fetal development of the offspring was conducted. The two-generation reproduction study did not identify effects on reproductive performance. Ovaries and testes were examined macroscopically and were weighed and fixed, but no histology was done. No difference between control and exposed animals in ovary or testis weights was seen. The only effect seen in the parents was a slight reduced responsiveness to sound at 470 mg/m3. This effect was minor and the technician performing the test knew which group was the high dose group. This effect was poorly described in the study. It is unclear how long the effect persisted. No other signs of narcosis were observed and this effect was relatively minor (this was considered a mild narcotic effect). No macroscopic effects or weight changes were seen in testes. However, the testes were not examined microscopically. The NOAEL for the parents was 210 mg/m3. Significant reductions in fetal and pup body weight were observed. For the pups, while there was a significant trend for reduced body weight, the results were only significant at the high and low exposures. The delays persisted through 21 days after birth. Interestingly, the decrease in body weight was greatest in those pups where both parents were exposed to NMP pre-conception; pups born to dams exposed to NMP pre-conception and pups born to males exposed to NMP pre-conception, exhibited slightly decreased body weights, but the differences were not significant. A delay in skeletal ossification was also noted, considered likely to be related to delays in growth. Despite the apparent absence of effects on reproductive parameters, there was a slight increase in the number of early resorptions and a slight decrease in the number of live fetuses, both indicative of fetal mortality. In addition, there was an increase in skeletal malformations, not related to delays in ossification. There were no increases in visceral malformations (DuPont, 1990).
Page 220 of 281
Lee et al., 1987 Lee et al. (1987) includes the results of three separate studies: teratogenicity, subchronic exposure and a 2-year carcinogenicity study. In the teratogenicity study, rats were exposed to 100 and 360 mg/m3 (25 and 89 ppm, respectively) of NMP for six hrs/day from GD 6 through 15 (Lee et al., 1987). Exposures were to vapor and a trace of aerosol, but the particle size distribution was not analyzed. However, in the subchronic 28-day study, 95 percent of the particles were <10 µm in diameter. In the dams, sporadic lethargy and irregular respiration were observed during the first three days of exposure in both dose groups, but not seen during the remainder of the exposure period or during the 10-day recovery period. Hence, these minor signs of neurotoxicity, behavior and clinical findings, were considered to be reversible. At 100 mg/m3, there was an increased number of females with less than 10 corpora lutea compared with controls; this was not treatment related because NMP exposure began on GD 6 and the corpora lutea were formed following ovulation and prior to GD 6. Fetal body weight was increased at 100 mg/m3, but not at 360 mg/m3. The number of resorptions per litter was lowest in the high dose group. There were no treatment-related increases in variations or defects in organs or skeletal anomalies. The maternal and fetal NOAEL for six hrs of exposure was 360 mg/m3 (Lee et al., 1987).
F-3-3 Dermal Toxicity Studies Becci et al., 1981 Rats were exposed dermally for 8 hrs to 75, 237 and 750 mg/kg bw/day from GD 6 through 15. Dams had collars to prevent oral ingestion (Becci et al., 1981; Becci et al., 1982; DuPont, 1992; FDRL, 1979; as cited in OECD, 2007). Patches of dry skin were noted in a dose-dependent manner at the application site at all doses in the dams. The dams experienced a 17 percent (incorrectly cited as 28 percent in OECD, 2007) reduction in body weight gain at 750 mg/kg bw/day, but not at the lower doses. Developmental toxicity expressed as fewer live fetuses, increased resorption rate, reduced fetal body weight and several skeletal abnormalities only at the high dose. It was not determined whether the fetal toxicity was due to maternal toxicity or directly to the compound. The NOAEL for maternal and developmental toxicity was 237 mg/kg bw/day. An important note comes from the results of a range-finding study conducted by the same authors. In this study, all dams from a 2,500 mg/kg bw/day exposure group died before GD 20. In the 1,100 mg/kg bw/day exposure group, 65 of 66 fetuses were resorbed. The NOAEL of 237 mg/kg bw/day is essentially within a factor of 4+ of a totally lethal outcome for the fetus.
F-4 Human Case Report Solomon et al. (1996) is a case report of a pregnant woman whose fetus died in utero at week 31 of pregnancy. She was exposed throughout pregnancy to NMP by inhalation and dermal exposure. The exposure levels were unknown. However, during week 16 of the pregnancy she
Page 221 of 281

cleaned up a spill of NMP using latex gloves that dissolved in the NMP. She was ill for the next 4 days and experienced malaise, headache, nausea and vomiting. This case-report is well-documented, ruled out reasonable complicating factors and provides some evidence that NMP may be fetotoxic. The lack of quantitative exposure data precludes its use in the risk assessment other than to note the qualitative support for NMP fetotoxicity that might come about from exposures to levels causing frank toxicity.
Page 222 of 281

Appendix G HUMAN EXPOSURE STUDIES EPA/OPPT evaluated the human NMP exposure studies that were used in the development of the PBPK model, for ethics according to the standards established in the Acute Exposure Guideline Levels (AEGL) Standing Operating Procedures (SOP) (NAS, 2001) and recommendation 5-7 issued by the National Academy of Sciences (NAS) in the report “Intentional Human Dosing Studies for EPA Regulatory Purposes: Scientific and Ethical Issues” (NAS, 2004). In addition, the ethics reviews that EPA has completed are comparable to the principles and procedures for performing ethics reviews of intentional dosing human studies developed for reviews conducted by the Human Studies Review Board (HSRB). The outcome of the NMP risk assessment ethics reviews was that there was no clear and convincing evidence that the research was fundamentally unethical or significantly deficient relative to the ethical standards prevailing when the studies were conducted. A summary of each study is presented below.
Page 223 of 281

G-1 Review of Akkeson et al., 2004 Akesson, B., Carnerup, M. A. and Jonsson, B. A. (2004). Evaluation of exposure biomarkers from percutaneous absorption of N-methyl-2-pyrrolidone. Scand. J. Work Environ. Health 30, 306–312. The objective of the study was to evaluate the toxicokinetic properties of NMP and its metabolites in humans after dermal exposure to pure and diluted NMP. The authors used the information to evaluate different biomarkers of exposure to NMP. Although the societal benefit of the study was not explicitly discussed, it was presumed that the toxicokinetic information may be used to identify occupational exposures to NMP, inform proper measures to reduce exposures and/or support the derivation of occupational exposure limits for NMP. A total of 18 healthy volunteers participated in the study, which were comprised of 6 females aged 43-47 years and 12 males aged 27-56 years. Healthy volunteers were selected after a health examination. Women were tested for pregnancy before the study and presumably excluded if they were pregnant. Subjects provided written, informed consent before participating in the study. No reference was made about the subject recruitment process and risk/benefit considerations. Participants were exposed dermally on the forearm to either 300 mg of pure NMP or 300 mg of NMP in a 50% water solution for 6 hrs. Blood and urine samples were collected on the day of exposure and up to 9 days post exposure and analyzed for NMP and 3 metabolites. None of the participants reported irritation. The application site was slightly red for about 4 hrs after exposure and slight dryness was observed that disappeared in 4 days on average. Despite the gaps in the documentation of ethical information, there was no clear and convincing evidence that the research was fundamentally unethical (e.g. intended to seriously harm participants) or significantly deficient to the standards prevailing at the time the study was conducted (e.g. study collected informed consent from volunteers).
Page 224 of 281

G-2 Review of Akkeson and Jonsson, 2000 Akesson, B. and Jonsson, B. A. (2000). Biological monitoring of N-methyl-2-pyrrolidone using 5-hydroxy-N-methyl-2-pyrrolidone in plasma and urine as the biomarker. Scand. J. Work Environ. Health 26, 213–218. The objective of the study was to evaluate the toxicokinetic properties of the main NMP metabolite (i.e., 5-hydroxy-1-methyl-2-pyrrolidone or 5-HNMP). The study also assessed whether 5-HNMP can be used as a biomarker to monitor human exposure to NMP. Although the societal benefit of the study was not explicitly discussed, it was presumed that the toxicokinetic information may be used to identify occupational exposures to NMP, inform proper measures to reduce exposures and/or support the derivation of occupational exposure limits for NMP. Six male volunteers in the age range of 28-41 yrs participated in the study. The investigators conducted a general health examination to potential participants and selected those that were healthy (risk minimization measure). Subjects gave written, informed consent prior to participating in the study. No reference was made about the subject recruitment process and risk/benefit considerations. Subjects were exposed in an inhalation chamber to 0, 10, 25 and 50 mg/m3 NMP for 8 hrs with at least two weeks between exposures. It seems that the investigators considered experimental exposure human studies reporting mild irritation at 50 mg/m3 NMP when deciding to set the highest test concentration at 50 mg/m3. In addition, the Swedish occupational exposure level for NMP was 200 mg/m3 and the German limit was 90 mg/m3 at the time of the exposures. Plasma and urine were collected during and after exposure and analyzed for the presence of 5-HNMP. The study did not report health effects in the NMP-exposed subjects. Maximal plasma and urine levels of the metabolite occurred 1 hr and 0-2 hrs, respectively, after the end of the exposure. Half-times of plasma and urine levels were 6.3 and 7.3 hrs, respectively. Despite gaps in documentation of ethical information, there was no clear and convincing evidence that the research was fundamentally unethical (e.g., intended to seriously harm participants) or significantly deficient to the standards prevailing at the time the study was conducted (e.g., study collected informed consent from volunteers).
Page 225 of 281

G-3 Review of Akesson and Paulsson, 1997 Akesson, B. and Paulsson, K. (1997). Experimental exposure of male volunteers to N-methyl-2-pyrrolidone (NMP): Acute effects and pharmacokinetics of NMP in plasma and urine. Occup. Environ. Med. 54, 236–240. The objective of the study was to evaluate the acute effects of inhalation exposure to NMP in humans as well as measure plasma and urine concentrations of NMP during and after exposure. The long term goal is to develop a system for biological monitoring of human exposure. Although the societal benefit of the study was not explicitly discussed, it was presumed that the toxicokinetic information may be used to identify occupational exposures to NMP, inform proper measures to reduce exposures and/or support the derivation of occupational exposure limits for NMP. Six male volunteers in the age range of 28-41 yrs participated in the study. The investigators conducted a general health examination to potential participants and selected those that were healthy (risk minimization measure). Subjects gave written, informed consent prior to participating in the study. No reference was made about the subject recruitment process and risk/benefit considerations. Subjects were exposed in an inhalation chamber to 0, 10, 25 and 50 mg/m3 NMP for 8 hrs on 4 different days. Plasma and urine were collected during and after exposure. Nasal volume changes were measured by acoustic rhinometry and airway resistance was measured by spirometry. Volunteers filled out a questionnaire to report symptoms before the exposure and then every two hrs for 16 hrs. None of the exposures caused discomfort to the eyes or upper airways. There were no changes in nasal volume and airway resistance at any dose. NMP elimination was suggestive of a non-linear pattern. At the end of exposure, half lives in urine ranged from 2.9-5.8 hrs and 3.5 to 6.6 in plasma. The NMP was metabolized before excretion; only 2% was excreted as the parent compound. Despite gaps in the documentation of ethical information, there was no clear and convincing evidence that the research was fundamentally unethical (e.g., intended to seriously harm participants) or significantly deficient to the standards prevailing at the time the study was conducted (e.g., study collected informed consent from volunteers).
Page 226 of 281

G-4 Review of Bader et al., 2005 Bader, M., Keener, S. A. and Wrbitzky, R. (2005). Dermal absorption and urinary elimination of N-methyl-2-pyrrolidone. Int. Arch. Occup. Environ. Health 78, 673–676. The objective of the study was to evaluate the dermal absorption of NMP and its urinary elimination. Although the societal benefit of the study was not explicitly discussed, it was presumed that the toxicokinetic information may be used to identify occupational exposures to NMP, inform proper measures to reduce exposures and/or support the derivation of occupational exposure limits for NMP. A total of 7 healthy volunteers participated in the study and consisted of 4 females and 3 males, average age of 38 yrs. There is no mention of confirmation of pregnancy status for the female subjects. It was presumed that no pregnant women participated in the study since the investigators disclosed the developmental toxicity of NMP in animals. Healthy volunteers were selected after a health examination. None of the subjects reported dermal sensitization to chemicals during the medical evaluation. Subjects provided written, informed consent prior to participating in the study. They were notified about the irritating properties of NMP as well as the observed developmental effects in animals. No reference was made about the subject recruitment process and risk/benefit considerations. Subjects were dermally exposed to 1,045 mg of NMP by applying the solvent on a medical cellulose pad and placing it on the back of the hand. The site of application was occluded with aluminum foil. The duration of exposure was 2 hrs. An occupational physician examined the participants during the study. The concentration of NMP in the urine was measured for 26 hrs after the beginning of the exposure. The study reported a t1/2 of 3.2 hrs for NMP in the urine. Also, participants reported feelings of heat, prickling and itchiness during the exposure. Moderate swelling of the skin was observed at the site of application and one participant developed local erythema. The symptoms resolved in 24 hrs.
Despite gaps in the documentation of ethical information, there was no clear and convincing evidence that the research was fundamentally unethical (e.g., intended to seriously harm participants) or significantly deficient to the standards prevailing at the time the study was conducted (e.g., study collected informed consent from volunteers).
Page 227 of 281

G-5 Review of Bader and van Thriel, 2006 Bader, M. and van Thriel, C. (2006). Human volunteer study on biomarkers of N-methyl-2-pyrrolidone (NMP) after inhalation exposure. Report for the NMP Producers Group, Washington, DC. This is a supplemental study supporting the following initial study:
Bader M. and van Thriel, C. (2006) Human volunteer study on chemosensory effects and evaluation of a threshold limit value in biological material of N-methyl-2-pyrrolidone (NMP) after inhalational and dermal exposure. Final Report to the NMP Producers Group, c/o Bergeson & Campbell, P.C., 1203 Nineteenth Street, NW, Suite 300, Washington, DC, USA.
Note that the initial study was not reviewed. We assumed that the ethical information in the initial study and the supplemental study would be consistent between each other. The purpose of this study was to provide additional biomonitoring data for NMP and its main metabolites in urine and plasma. The study results were then used for a physiologically- based pharmacokinetic model. Although the societal benefit of the study was not explicitly discussed, it was presumed that the biomonitoring information may be used to may be used to identify occupational exposures to NMP, inform proper measures to reduce NMP exposures and/or support the derivation of occupational exposure limits for NMP. Eight healthy non-smoking male volunteers, age 23-29, participated in the study. Seven of the eight volunteers also participated in the main study, noted in section 5.1. Subjects underwent a medical evaluation prior to exposure. The study design was approved by the Ethics Committee of the University of Dortmund. The report stated that all participants were informed about the sampling procedures and possible risks, with written informed consent obtained prior to the experiments. No reference was made about the subject recruitment process and specific risk/benefit considerations. An environmental chamber was used and subjects were exposed to three concentrations of NMP (10, 40 and 80 mg/m3) for 6 hours via inhalation and dermal exposure. The three concentrations were presented to the volunteers in ascending order, with an exposure-free period of 1 week between two subsequent sessions. Blood and urine samples were collected at intervals from the start of the study to 48 hours from the first exposure. The concentrations of NMP and two major metabolites 5-HNMP and 2-HMSI were measured in plasma and urine. The protocol did not include any assessment of health effects and there was no mention of observed adverse health effects.
Despite gaps in the documentation of ethical information, there was no clear and convincing evidence that the research was fundamentally unethical (e.g., intended to seriously harm participants) or significantly deficient to the standards prevailing at the time the study was conducted (e.g., study collected informed consent from volunteers).
Page 228 of 281

G-6 Review of Bader et al., 2007 Bader, M., Wrbitzky, R., Blaszkewicz, M. and van Thriel, C. (2007). Human experimental exposure study on the uptake and urinary elimination of N-methyl-2-pyrrolidone (NMP) during simulated workplace conditions. Arch. Toxicol. 81, 335–346. The purpose of the study was to assess the elimination of NMP under workplace conditions and determine an effective biomonitoring scheme. Although the societal benefit of the study was not explicitly discussed, it was presumed that the toxicokinetic information may be used to identify occupational exposures to NMP, inform proper measures to reduce exposures and/or support the derivation of occupational exposure limits for NMP. Sixteen male volunteers in the average age of 26.5 ± 2.4 years participated in the study. Subjects underwent a medical evaluation to check their fitness status and the presence of respiratory, skin and cardiovascular problems. Subjects were excluded from the study if they had respiratory problems, skin diseases or cardiovascular diseases (e.g., hypertension) (risk minimization measure). The study was carried out following the principles of the Declaration of Helsinki. The study design was approved by the Ethics Committee of the University of Dortmund. No reference was made about the subject recruitment process and risk/benefit considerations. Subjects were exposed to 10, 40 and 80 mg/m3 NMP under an exposure paradigm that mimicked workplace exposures. The study tested NMP inhalation concentrations that were at or below the German workplace limit value (80 mg/m3). Exposures were whole body to resting individuals for an initial period of 4 hrs, a 30 min break and a subsequent exposure for 4 hrs. This exposure paradigm was repeated on another day with 6 periods of 10-min exercise on a bicycle at 76 Watts. In addition, participants were exposed to a baseline concentration of 25 mg/m3 NMP and peak exposures of 160 mg/m3 NMP for four 15-min periods with a 2 hr break between peak exposures. During the experiment, the study volunteers took neuropsychological test batteries and ratings to evaluate NMP’s potential chemosensory effects. In addition, urine was collected and NMP and its main metabolites, 5-hydroxy-N-methyl-2-pyrrolidone (5-HNMP) and 2-hydroxy-N-methylsuccinimide (2-HMSI), were analyzed. Urine samples were collected at the beginning, during and up to 40 hrs after exposure. The study did not report any effects for the exposed participants. NMP, 5-HNMP and 2-HMSI showed close correlation between their post-shift concentrations and exposures to airborne NMP. In addition, the study demonstrated that the total uptake of NMP was increased after moderate exercise. The authors suggested that dermal absorption has a significant contribution to the uptake of NMP in whole-body inhalation exposures based on differences between the estimated and the observed total amount of urinary metabolites.
The study was conducted in accordance with the Declaration of Helsinki, was reviewed by an ethics committee and subjects provided informed consent. There was no clear and convincing evidence that the research was fundamentally unethical (e.g., intended to seriously harm participants) or significantly deficient to the standards prevailing at the time the study was conducted.
Page 229 of 281

G-7 Review of Bader et al., 2008 Bader, M., Wrbitzky, R., Blaszkewicz, M., Schaper, M. and van Thriel, C. (2008). Human volunteer study on the inhalational and dermal absorption of N-methyl-2-pyrrolidone (NMP) from the vapour phase. Arch. Toxicol. 82, 13–20. The purpose of the study was to determine the dermal absorption of airborne NMP vapor. Although the societal benefit of the study was not explicitly discussed, it was presumed that the toxicokinetic information may be used to identify occupational exposures to NMP, inform proper measures to reduce exposures and/or support the derivation of occupational exposure limits for NMP. Sixteen male volunteers ranging from 22-30 years participated in the study. Subjects underwent a medical evaluation to check their fitness status and the presence of respiratory and skin problems. Subjects were excluded from the study if they had respiratory problems or skin diseases (risk minimization measure). The study was carried out following the principles of the Declaration of Helsinki. The study design was approved by the Ethics Committee of the University of Dortmund and subjects gave written, informed consent. No reference was made about the subject recruitment process and risk/benefit considerations. Subjects were exposed whole body to 80 mg/m3 NMP while wearing long pants and cotton shirts and being on a resting state or doing exercise in a bicycle. Initial exposure was for 4 hrs following a break of 30 minutes. Subjects were subsequently exposed to NMP for an additional 4 hrs. The tested NMP inhalation concentration was the German workplace limit value (80 mg/m3) at that time. The exercising individuals were exposed to NMP during the 8-hr exposure interval while exercising in the bicycle for 6 x 10 min periods. These exposure conditions measured both inhalation and dermal absorption of airborne NMP. For dermal-only exposures to NMP, the participants wore a face mask with activated carbon filtered air to eliminate the inhalation component of absorption. Urine was collected up to 48 hrs after the beginning of exposure. The urine was analyzed for NMP and its main metabolites, 5-hydroxy-N-methyl-2-pyrrolidone (5-HNMP) and 2-hydroxy-N-methylsuccinimide (2-HMSI). The study did not report any effects for the exposed participants. The study findings suggested that dermal absorption has a significant contribution to the uptake of NMP in whole-body inhalation exposures. The study was conducted in accordance with the Declaration of Helsinki, was reviewed by an ethics committee and subjects provided informed consent. There was no clear and convincing evidence that the research was fundamentally unethical (e.g., intended to seriously harm participants) or significantly deficient to the standards prevailing at the time the study was conducted.
Page 230 of 281

G-8 Review of Xiaofei et al., 2000 Xiaofei, E., Wada, Y., Nozaki, J., Miyauchi, H., Tanaka, S., Seki, Y. and Koizumi, A. (2000). A linear pharmacokinetic model predicts usefulness of N-methyl-2-pyrrolidone (NMP) in plasma or urine as a biomarker for biological monitoring for NMP exposure. J. Occup. Health 42, 321–327. The purpose of the study was to construct a simple pharmacokinetic model for NMP. Although the societal benefit of the study was not explicitly discussed, it was presumed that the toxicokinetic information may be used to identify occupational exposures to NMP, inform proper measures to reduce exposures and/or support the derivation of occupational exposure limits for NMP. Workers at two factories were monitored for a week during their normal work routines. In one factory four workers and five volunteers who stayed in the room were assessed. In a second factory 8 workers were evaluated. The age range of the participants was 20-56 yrs. The sex of the volunteers was not identified. This was an observational study with the exception of the volunteers who stayed in the room with the workers. Participants underwent annual medical checkups including measurements for red blood cells, white blood cells, hemoglobin, liver enzymes, total cholesterol, HDL cholesterol, triglyceride, electrocardiogram and plain chest roentgenogram. None of them had abnormal values. No reference was made about the subject recruitment process, risk/benefit considerations or independent review by ethics committee. Personal exposures to NMP were measured with a diffusive sampler with activated charcoal. Weekly time-weighted averages air concentrations ranged from 0.04 to 0.69 ppm. Blood and urine samples were collected over the course of the study and analyzed for NMP concentration. Workers were protected with gloves and apron, although one of the workers had dermatitis after dermal exposure to NMP. The study did not report additional information about NMP-associated health symptoms. The authors concluded that the measured NMP values were compared to the pharmacokinetic model predictions. Thus, the model successfully predicted the NMP plasma and urine levels. Despite the lack of documentation of ethical information, there was no clear and convincing evidence that the research was fundamentally unethical (e.g., intended to seriously harm participants) or significantly deficient to the standards prevailing at the time the study was conducted.
Page 231 of 281

Appendix H BENCHMARK DOSE ANALYSIS
H-1 Benchmark Dose Modeling of Fetal/Pup Body Weight Changes for Chronic Exposures
BMD modeling was performed using USEPA’s BMD Software package (version 2.5), in a manner consistent with EPA guidelines (EPA, 2012a). Continuous models were used to fit dose-response data for fetal/pup body weight changes. A BMR of 5% was used because this is a developmental endpoint (Kavlock et al., 1995) see section 0. A BMR of 1 standard deviation is also shown for comparison. Daily AUC for NMP in blood, averaged over the exposure period until the day of measurement (e.g. GD6-20 for Becci et al. (1982) or GD5-21 for Saillenfait et al. (2003)), was used as an appropriate dose measure for this endpoint. The doses and response data used for the modeling are presented in Table_Apx H-1. Table_Apx H-1 Fetal Body Weight Data Selected for Dose-Response Modeling for NMP
Reference Dose AUC (hr mg/L)
Number of litters
Fetal body weight (g) Mean ± Standard Deviation
Saillenfait et al., 2003
0 24 5.671 ± 0.370 158 20 5.623 ± 0.358 323 19 5.469 ± 0.252 668 25 5.393 ± 0.446
Saillenfait et al., 2002
0 21 5.73 ± 0.5 1144 21 5.59 ± 0.22 2503 24 5.18 ± 0.35 5674 25 4.02 ± 0.21 9231 8 3.01 ± 0.39
Saillenfait et al., 2002 and 2003 pooled
0 45 5.698 ± 0.44 158 20 5.623 ± 0.358 323 19 5.469 ± 0.252 668 25 5.393 ± 0.446
1144 21 5.59 ± 0.22 2503 24 5.18 ± 0.35 5674 25 4.02 ± 0.21 9231 8 3.01 ± 0.39
DuPont 1990 0 39 7.48 ± 0.701 51 16 7.03 ± 0.705
268 15 7.13 ± 0.695 633 22 6.66 ± 0.616
Page 232 of 281
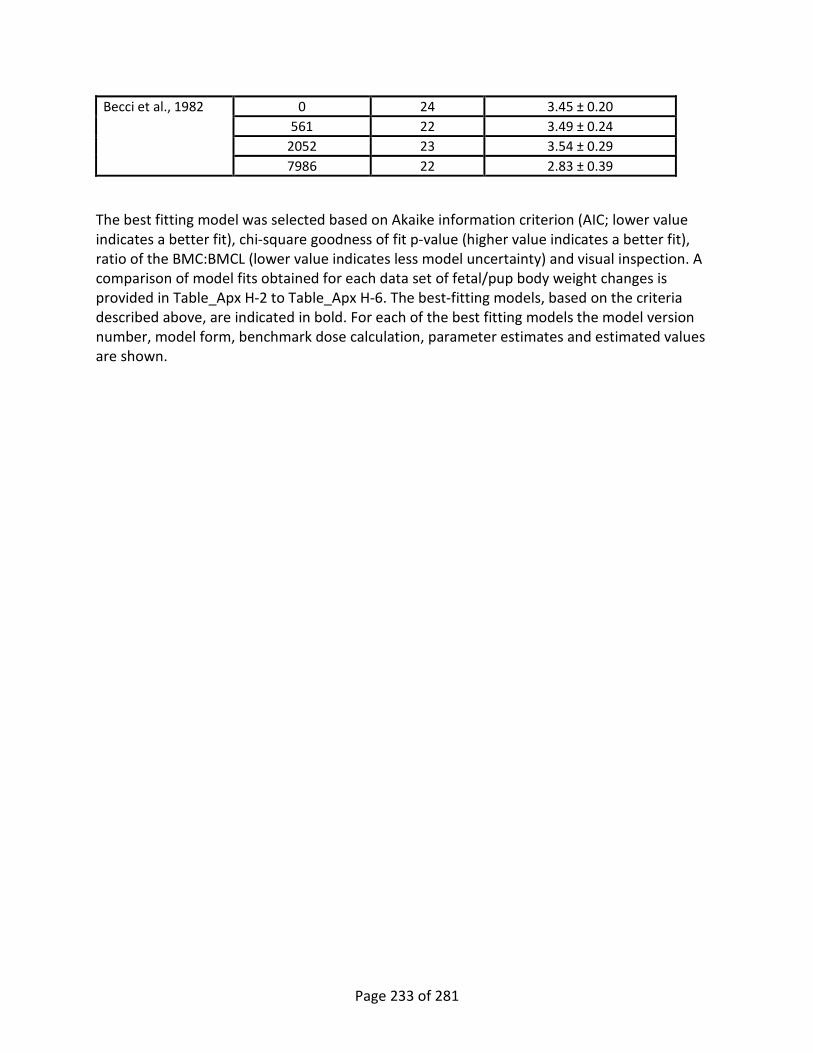
Becci et al., 1982 0 24 3.45 ± 0.20 561 22 3.49 ± 0.24
2052 23 3.54 ± 0.29 7986 22 2.83 ± 0.39
The best fitting model was selected based on Akaike information criterion (AIC; lower value indicates a better fit), chi-square goodness of fit p-value (higher value indicates a better fit), ratio of the BMC:BMCL (lower value indicates less model uncertainty) and visual inspection. A comparison of model fits obtained for each data set of fetal/pup body weight changes is provided in Table_Apx H-2 to Table_Apx H-6. The best-fitting models, based on the criteria described above, are indicated in bold. For each of the best fitting models the model version number, model form, benchmark dose calculation, parameter estimates and estimated values are shown.
Page 233 of 281

H-1-1 Results for Saillenfait et al., 2003 Table_Apx H-2 Model Predictions for Fetal Body Weights in Rats Exposed to NMP by Inhalation Using Daily Average AUC as the Dose Metric (Saillenfait et al., 2003) BMR = 5% Relative Deviation (RD) and for Comparison 1 Standard Deviation (SD)
Modela Goodness of fit BMR = 5% RD BMR = 1 SD Basis for model selection
p-value
AIC BMD5RD (hr mg/L)
BMDL5RD (hr mg/L)
BMD1SD (hr mg/L)
BMDL1SD (hr mg/L)
Linear 0.952 -84.637 642 411 747 456 The Linear model was selected based on lowest AIC and highest p-value.
Exponential (M2)
0.948 -84.629 641 405 749 451
Exponential (M4)
0.948 -84.629 641 284 749 381
Exponential (M3)
0.815 -82.682 653 406 745 453
Power 0.812 -82.680 653 413 744 458
Polynomial 3°b Polynomial 2°
0.789 -82.665 652 412 738 457
Hill N/Ac -80.737 649 176 889 error
Exponential (M5)
N/Ac -80.737 643 168 error error
Notes: a Modeled variance case presented (BMDS Test 2 p-value = 0.0670), selected model in bold; scaled residuals for selected model for doses 0, 158.3, 322.6 and 668.2 hr mg/L were 0.0675, 0.316, -0.654 and 0.24, respectively. b For the Polynomial 3° model, the b3 coefficient estimates was 0 (boundary of parameters space). The models in this row reduced to the Polynomial 2° model. c No available degrees of freedom to calculate a goodness of fit value.
Page 234 of 281

Figure_Apx H-1 Plot of Mean Response by Dose, with Fitted Curve for Selected Model for Fetal Body Weight in Rats Exposed to NMP via Inhalation (Saillenfait et al., 2003) BMR = 5% Relative Deviation; Daily Average AUC as Dose Shown in hr mg/L Equation H-1 Linear Model. (Version: 2.19; Date: 06/25/2014)
The form of the response function is: Y[dose] = beta_0 + beta_1*dose A modeled variance is fit Benchmark Dose Computation. BMR = 5% Relative deviation BMD = 642.052 BMDL at the 95% confidence level = 411.487 Parameter Estimates
Variable Estimate Default Initial Parameter Values
lalpha 10.9507 -1.98661
rho -7.59357 0
beta_0 5.66546 5.66303
beta_1 -0.000441199 -0.00043693
Table of Data and Estimated Values of Interest
Dose N Obs Mean Est Mean Obs Std Dev Est Std Dev Scaled Resid
0 24 5.67 5.67 0.37 0.33 0.0675
158.3 20 5.62 5.6 0.36 0.346 0.316
322.6 20 5.47 5.52 0.25 0.363 -0.654
Page 235 of 281

668.2 25 5.39 5.37 0.45 0.404 0.24
Likelihoods of Interest
Model Log(likelihood) # Param's AIC
A1 45.950356 5 -81.900712
A2 49.530515 8 -83.061031
A3 46.368255 6 -80.736511
fitted 46.318536 4 -84.637072
R 41.618363 2 -79.236727
Tests of Interest
Test -2*log(Likelihood
Ratio)
Test df p-value
Test 1 15.8243 6 0.01473
Test 2 7.16032 3 0.06696
Test 3 6.32452 2 0.04233
Test 4 0.099439 2 0.9515
Page 236 of 281

H-1-2 Results for Saillenfait et al., 2002 Table_Apx H-3 Model Predictions for Fetal Body Weights in Rats Exposed to NMP by Gavage Using Daily Average AUC as the Dose Metric (Saillenfait et al., 2002) BMR = 5% Relative Deviation (RD) and for Comparison 1 Standard Deviation (SD)
Modela Goodness of fit BMD5RD (hr mg/L)
BMDL5RD (hr mg/L)
BMD1SD (hr mg/L)
BMDL1SD (hr mg/L)
Basis for model selection
p-value AIC
Exponential (M2)
0.00183 -98.750 741 693 1028 876 The Exponential (M5) model was selected based on lowest AIC with highest p-value. Exponential
(M3) 0.325 -109.49 1329 1035 1578 1245
Exponential (M4)
0.00183 -98.750 741 691 1028 876
Exponential (M5)
0.966 -109.73 1637 1184 1880 1400
Hill 0.962 -109.73 1660 1194 1895 1409
Power 0.0479 -105.66 1114 904 1381 1070
Polynomial 4°b Polynomial 3°c Polynomial 2°
0.0295 -104.68 962 895 1233 1038
Linear 0.0687 -106.63 938 895 1210 1036
Notes:
a Modeled variance case presented (BMDS Test 2 p-value = 1.26E-04), selected model in bold; scaled residuals for selected model for doses 0, 1144, 2503, 5674 and 9231 hr mg/L were -0.1399, 0.1248, -0.02274, 0.1033 and -0.1213, respectively. b For the Polynomial 4° model, the b4 and b3 coefficient estimates were 0 (boundary of parameters space). The models in this row reduced to the Polynomial 2° model. c For the Polynomial 3° model, the b3 coefficient estimates was 0 (boundary of parameters space). The models in this row reduced to the Polynomial 2° model.
Page 237 of 281

Figure_Apx H-2 Plot of Mean Response by Dose, with Fitted Curve for Selected Model for Fetal Body Weight in Rats Exposed to NMP via Gavage (Saillenfait et al., 2002) BMR = 5% Relative Deviation; Daily Average AUC as Dose Shown in hr mg/L Equation H-2 Exponential Model. (Version: 1.9; Date: 01/29/2013)
The form of the response function is: Y[dose] = a * [c-(c-1) * exp(-(b * dose)^d)] A modeled variance is fit Benchmark Dose Computation. BMR = 5% Relative deviation BMD = 1637.32 BMDL at the 95% confidence level = 1184.3 Parameter Estimates
Variable Estimate Default Initial Parameter Values
lnalpha -3.80738 -2.38723
rho 1.00208 0.0548918
a 5.74092 6.0165
b 0.000143148 0.000073183
c 0.405685 0.000500291
d 1.67614 1
Page 238 of 281

Table of Data and Estimated Values of Interest Dose N Obs Mean Est Mean Obs Std Dev Est Std Dev Scaled Resid
0 21 5.73 5.741 0.5 0.3577 -0.1399
1144 21 5.59 5.58 0.22 0.3527 0.1248
2503 24 5.18 5.182 0.35 0.3398 -0.02274
5674 25 4.02 4.014 0.21 0.299 0.1033
9231 8 3.01 3.021 0.39 0.2593 -0.1213
Likelihoods of Interest
Model Log(likelihood) # Param's AIC
A1 59.67563 6 -107.3513
A2 71.17728 10 -122.3546
A3 60.86644 7 -107.7329
R -42.05093 2 88.10186
5 60.86544 6 -109.7309
Tests of Interest
Test -2*log(Likelihood
Ratio)
Test df p-value
Test 1 226.5 8 <0.0001
Test 2 23 4 0.0001264
Test 3 20.62 3 0.0001261
Test 7a 0.001995 1 0.9644
Page 239 of 281
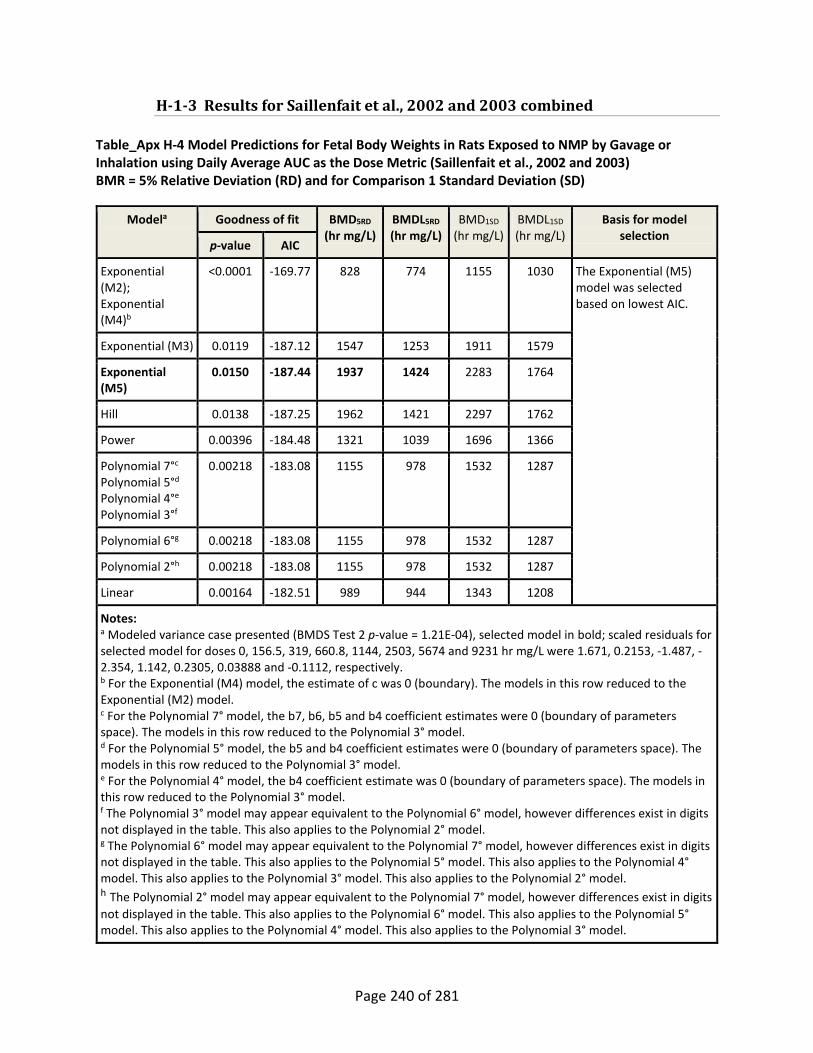
H-1-3 Results for Saillenfait et al., 2002 and 2003 combined Table_Apx H-4 Model Predictions for Fetal Body Weights in Rats Exposed to NMP by Gavage or Inhalation using Daily Average AUC as the Dose Metric (Saillenfait et al., 2002 and 2003) BMR = 5% Relative Deviation (RD) and for Comparison 1 Standard Deviation (SD)
Modela Goodness of fit BMD5RD (hr mg/L)
BMDL5RD (hr mg/L)
BMD1SD (hr mg/L)
BMDL1SD (hr mg/L)
Basis for model selection
p-value AIC
Exponential (M2); Exponential (M4)b
<0.0001 -169.77 828 774 1155 1030 The Exponential (M5) model was selected based on lowest AIC.
Exponential (M3) 0.0119 -187.12 1547 1253 1911 1579
Exponential (M5)
0.0150 -187.44 1937 1424 2283 1764
Hill 0.0138 -187.25 1962 1421 2297 1762
Power 0.00396 -184.48 1321 1039 1696 1366
Polynomial 7°c Polynomial 5°d Polynomial 4°e Polynomial 3°f
0.00218 -183.08 1155 978 1532 1287
Polynomial 6°g 0.00218 -183.08 1155 978 1532 1287
Polynomial 2°h 0.00218 -183.08 1155 978 1532 1287
Linear 0.00164 -182.51 989 944 1343 1208
Notes: a Modeled variance case presented (BMDS Test 2 p-value = 1.21E-04), selected model in bold; scaled residuals for selected model for doses 0, 156.5, 319, 660.8, 1144, 2503, 5674 and 9231 hr mg/L were 1.671, 0.2153, -1.487, -2.354, 1.142, 0.2305, 0.03888 and -0.1112, respectively. b For the Exponential (M4) model, the estimate of c was 0 (boundary). The models in this row reduced to the Exponential (M2) model. c For the Polynomial 7° model, the b7, b6, b5 and b4 coefficient estimates were 0 (boundary of parameters space). The models in this row reduced to the Polynomial 3° model. d For the Polynomial 5° model, the b5 and b4 coefficient estimates were 0 (boundary of parameters space). The models in this row reduced to the Polynomial 3° model. e For the Polynomial 4° model, the b4 coefficient estimate was 0 (boundary of parameters space). The models in this row reduced to the Polynomial 3° model. f The Polynomial 3° model may appear equivalent to the Polynomial 6° model, however differences exist in digits not displayed in the table. This also applies to the Polynomial 2° model. g The Polynomial 6° model may appear equivalent to the Polynomial 7° model, however differences exist in digits not displayed in the table. This also applies to the Polynomial 5° model. This also applies to the Polynomial 4° model. This also applies to the Polynomial 3° model. This also applies to the Polynomial 2° model. h The Polynomial 2° model may appear equivalent to the Polynomial 7° model, however differences exist in digits not displayed in the table. This also applies to the Polynomial 6° model. This also applies to the Polynomial 5° model. This also applies to the Polynomial 4° model. This also applies to the Polynomial 3° model.
Page 240 of 281
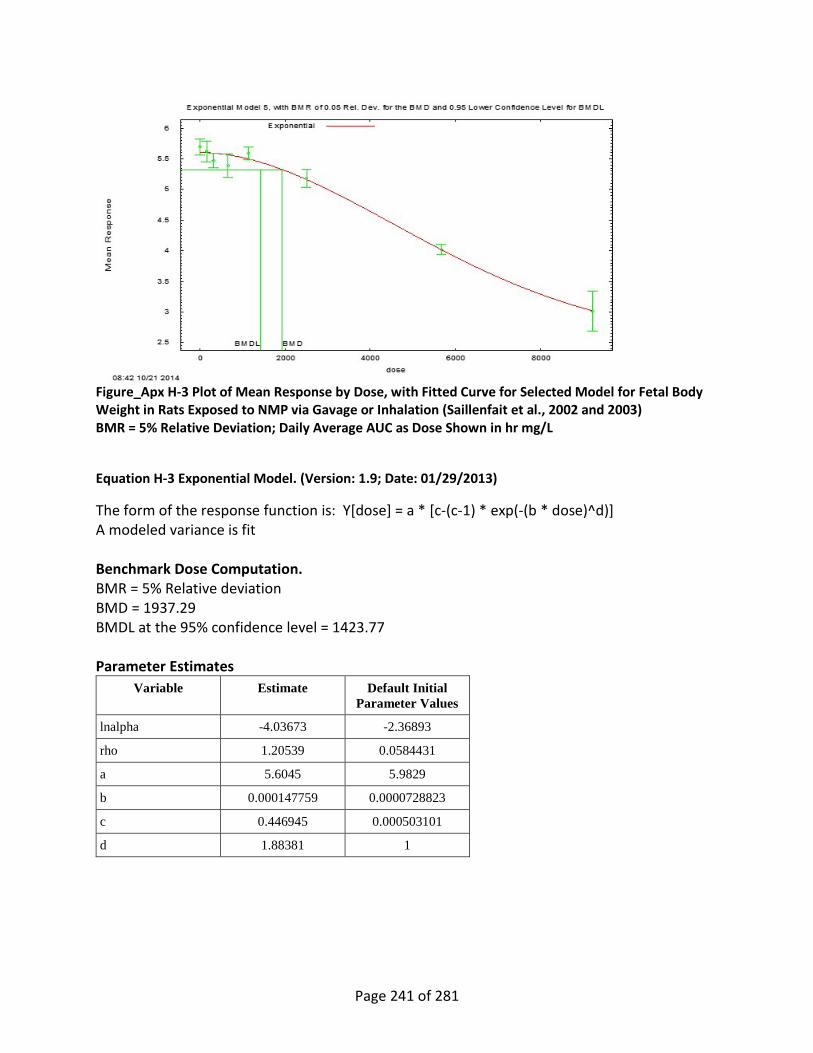
Figure_Apx H-3 Plot of Mean Response by Dose, with Fitted Curve for Selected Model for Fetal Body Weight in Rats Exposed to NMP via Gavage or Inhalation (Saillenfait et al., 2002 and 2003) BMR = 5% Relative Deviation; Daily Average AUC as Dose Shown in hr mg/L
Equation H-3 Exponential Model. (Version: 1.9; Date: 01/29/2013)
The form of the response function is: Y[dose] = a * [c-(c-1) * exp(-(b * dose)^d)] A modeled variance is fit Benchmark Dose Computation. BMR = 5% Relative deviation BMD = 1937.29 BMDL at the 95% confidence level = 1423.77 Parameter Estimates
Variable Estimate Default Initial Parameter Values
lnalpha -4.03673 -2.36893
rho 1.20539 0.0584431
a 5.6045 5.9829
b 0.000147759 0.0000728823
c 0.446945 0.000503101
d 1.88381 1
Page 241 of 281

Table of Data and Estimated Values of Interest Dose N Obs Mean Est Mean Obs Std Dev Est Std Dev Scaled Resid
0 45 5.698 5.604 0.4353 0.3755 1.671
156.5 20 5.62 5.602 0.36 0.3754 0.2153
319 20 5.47 5.595 0.25 0.3751 -1.487
660.8 25 5.39 5.566 0.45 0.3739 -2.354
1144 21 5.59 5.497 0.22 0.3711 1.142
2503 24 5.18 5.163 0.35 0.3574 0.2305
5674 25 4.02 4.018 0.21 0.3072 0.03888
9231 8 3.01 3.02 0.39 0.2587 -0.1112
Likelihoods of Interest
Model Log(likelihood) # Param's AIC
A1 104.4887 9 -190.9774
A2 119.1975 16 -206.3949
A3 105.8917 10 -191.7834
R -48.75234 2 101.5047
5 99.71803 6 -187.4361
Tests of Interest
Test -2*log(Likelihood
Ratio)
Test df p-value
Test 1 335.9 14 <0.0001
Test 2 29.42 7 0.0001214
Test 3 26.61 6 0.0001712
Test 7a 12.35 4 0.01495
Page 242 of 281

H-1-4 Results for DuPont, 1990 Table_Apx H-5 Model Predictions for Fetal Body Weights in Rats Exposed to NMP by Inhalation using Daily Average AUC as the Dose Metric (DuPont 1990) BMR = 5% Relative Deviation and for Comparison 1 Standard Deviation (SD)
Modela Goodness of fit BMD5RD (hr mg/L)
BMDL5RD (hr mg/L)
BMD1SD (hr mg/L)
BMDL1SD (hr mg/L)
Basis for model selection
p-value AIC
Exponential (M2) Exponential (M3)b
0.140 27.266 315 223 594 411 The Exponential model was selected based on lowest AIC.
Exponential (M4) 0.0494 29.191 260 1.16 580 2.61
Exponential (M5) 0.0494 29.191 260 1.30 580 3.07
Hill 0.0597 28.875 58.5 4.71E-04 609 1.98E-05
Powerc Polynomial 3°d Polynomial 2°e Linear
0.138 27.288 323 234 596 421
Notes: a Constant variance case presented (BMDS Test 2 p-value = 0.905), selected model in bold; scaled residuals for selected model for doses 0, 51.18, 267.9 and 633.3 hr mg/L were 0.8831, -1.718, 0.3504 and 0.0002752, respectively. b For the Exponential (M3) model, the estimate of d was 1 (boundary). The models in this row reduced to the Exponential (M2) model. c For the Power model, the power parameter estimate was 1. The models in this row reduced to the Linear model. d For the Polynomial 3° model, the b3 coefficient estimates was 0 (boundary of parameters space). The models in this row reduced to the Polynomial 2° model. For the Polynomial 3° model, the b3 and b2 coefficient estimates were 0 (boundary of parameters space). The models in this row reduced to the Linear model. e For the Polynomial 2° model, the b2 coefficient estimate was 0 (boundary of parameters space). The models in this row reduced to the Linear model.
Page 243 of 281

Figure_Apx H-4 Plot of Mean Response by Dose, with Fitted Curve for Selected Model for Fetal Body Weight in Rats Exposed to NMP via Inhalation (DuPont 1990) BMR = 5% Relative Deviation; Daily Average AUC as Dose Shown in hr mg/L Equation H-4 Exponential Model. (Version: 1.9; Date: 01/29/2013)
The form of the response function is: Y[dose] = a * exp(sign * b * dose) A constant variance model is fit Benchmark Dose Computation. BMR = 5% Relative deviation BMD = 314.897 BMDL at the 95% confidence level = 223.175 Parameter Estimates
Variable Estimate Default Initial Parameter Values
lnalpha -0.768852 -0.811648
rho(S) n/a 0
a 7.38373 6.90878
b 0.000162889 0.000162077
c 0 0
d 1 1
Page 244 of 281

Table of Data and Estimated Values of Interest Dose N Obs Mean Est Mean Obs Std Dev Est Std Dev Scaled Resid
0 39 7.48 7.384 0.701 0.6808 0.8831
51.18 16 7.03 7.322 0.705 0.6808 -1.718
267.9 15 7.13 7.068 0.695 0.6808 0.3504
633.3 22 6.66 6.66 0.616 0.6808 0.0002752
Likelihoods of Interest
Model Log(likelihood) # Param's AIC
A1 -8.66418 5 27.32836
A2 -8.383601 8 32.7672
A3 -8.66418 5 27.32836
R -18.52227 2 41.04454
2 -10.6328 3 27.26561
Tests of Interest
Test -2*log(Likelihood
Ratio)
Test df p-value
Test 1 20.28 6 0.002471
Test 2 0.5612 3 0.9053
Test 3 0.5612 3 0.9053
Test 4 3.937 2 0.1396
Page 245 of 281
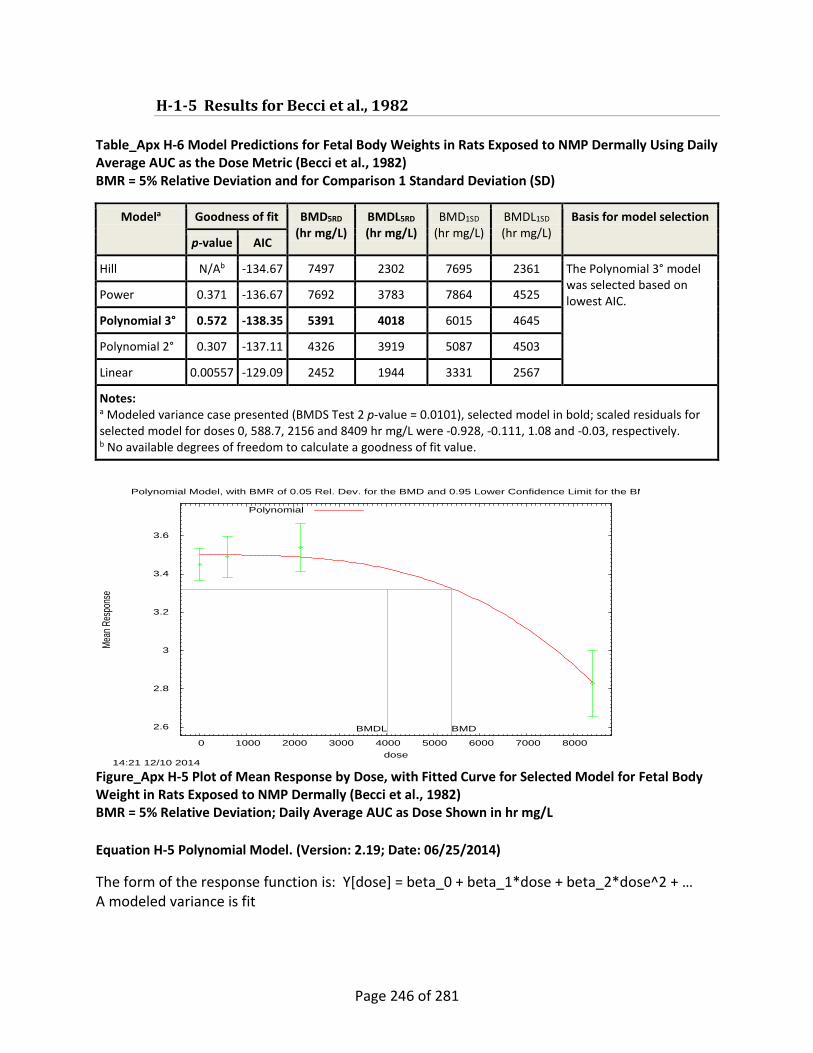
H-1-5 Results for Becci et al., 1982 Table_Apx H-6 Model Predictions for Fetal Body Weights in Rats Exposed to NMP Dermally Using Daily Average AUC as the Dose Metric (Becci et al., 1982) BMR = 5% Relative Deviation and for Comparison 1 Standard Deviation (SD)
Modela Goodness of fit BMD5RD (hr mg/L)
BMDL5RD (hr mg/L)
BMD1SD (hr mg/L)
BMDL1SD (hr mg/L)
Basis for model selection
p-value AIC
Hill N/Ab -134.67 7497 2302 7695 2361 The Polynomial 3° model was selected based on lowest AIC. Power 0.371 -136.67 7692 3783 7864 4525
Polynomial 3° 0.572 -138.35 5391 4018 6015 4645
Polynomial 2° 0.307 -137.11 4326 3919 5087 4503
Linear 0.00557 -129.09 2452 1944 3331 2567
Notes: a Modeled variance case presented (BMDS Test 2 p-value = 0.0101), selected model in bold; scaled residuals for selected model for doses 0, 588.7, 2156 and 8409 hr mg/L were -0.928, -0.111, 1.08 and -0.03, respectively. b No available degrees of freedom to calculate a goodness of fit value.
Figure_Apx H-5 Plot of Mean Response by Dose, with Fitted Curve for Selected Model for Fetal Body Weight in Rats Exposed to NMP Dermally (Becci et al., 1982) BMR = 5% Relative Deviation; Daily Average AUC as Dose Shown in hr mg/L Equation H-5 Polynomial Model. (Version: 2.19; Date: 06/25/2014)
The form of the response function is: Y[dose] = beta_0 + beta_1*dose + beta_2*dose^2 + … A modeled variance is fit
2.6
2.8
3
3.2
3.4
3.6
0 1000 2000 3000 4000 5000 6000 7000 8000
Mean
Res
pons
e
dose
Polynomial Model, with BMR of 0.05 Rel. Dev. for the BMD and 0.95 Lower Confidence Limit for the BM
14:21 12/10 2014
BMDBMDL
Polynomial
Page 246 of 281

Benchmark Dose Computation. BMR = 5% Relative deviation BMD = 5390.85 BMDL at the 95% confidence level = 4017.68 Parameter Estimates
Variable Estimate Default Initial Parameter Values
lalpha 2.56784 -2.49546
rho -4.31376 0
beta_0 3.49599 3.45
beta_1 -1.68014E-27 0
beta_2 0 -0.000000016108
beta_3 -1.11576E-12 -2.23106E-13
Table of Data and Estimated Values of Interest
Dose N Obs Mean Est Mean Obs Std Dev Est Std Dev Scaled Resid
0 24 3.45 3.5 0.2 0.243 -0.928
588.7 22 3.49 3.5 0.24 0.243 -0.111
2156 23 3.54 3.48 0.29 0.244 1.08
8409 22 2.83 2.83 0.39 0.382 -0.03
Likelihoods of Interest
Model Log(likelihood) # Param's AIC
A1 70.088658 5 -130.177316
A2 75.754919 8 -135.509838
A3 73.734901 6 -135.469801
fitted 73.175965 4 -138.35193
R 37.76879 2 -71.537581
Tests of Interest
Test -2*log(Likelihood
Ratio)
Test df p-value
Test 1 75.9723 6 <0.0001
Test 2 11.3325 3 0.01006
Test 3 4.04004 2 0.1327
Test 4 1.11787 2 0.5718
Page 247 of 281

H-2 Benchmark Dose Modeling of Effects for Acute Exposures Benchmark Dose (BMD) modeling was performed using USEPA’s BMD Software package (version 2.5), in a manner consistent with USEPA guidelines (USEPA, 2012). Dichotomous models were used to fit fetal mortality and continuous models were used to fit dose-response data for resorptions. A BMR of 1% was used to address the relative severity of this endpoint (EPA, 2012a) see section 3.2.3. BMRs of 0.5 and 1 standard deviation are also shown for comparison. The peak NMP in maternal blood (Cmax) was used as an appropriate dose measure for these endpoints. The doses and response data used for the modeling are presented in Table_Apx H-7. Table_Apx H-7 Skeletal Malformations, Resorptions and Fetal Mortality Data Selected for Dose-Response Modeling for NMP
Reference and endpoint
Dose Cmax (mg/L)
Dose AUC (hr mg/L)
Number of litters
Response Mean ± Standard Deviation
Saillenfait et al., 2002 and 2003 Resorptions
0 0 45 3.4 ± 7.13 15 156.5 20 4.3 ± 4.1 30 319 20 9.9 ± 22.3 62 660.8 25 7 ± 9.4
120 1144 21 8.9 ± 21.2 250 2503 24 4.5 ± 6.6 531 5674 25 9.4 ± 8.9 831 9231 5 91 ± 16
Sitarek et al., 2012 fetal mortality
0 0 22 0.18 ± 0.85 76 902 24 0 ± 0
265 3168 20 0.13 ± 0.34 669 8245 15 0.8 ± 1.1
The best fitting model was selected based on Akaike information criterion (AIC; lower value indicates a better fit), chi-square goodness of fit p-value (higher value indicates a better fit), ratio of the BMC:BMCL (lower value indicates less model uncertainty) and visual inspection. Comparisons of model fits obtained for resorptions and fetal mortality are provided in Table_Apx H-7 to Table_Apx H-10. The best-fitting models, based on the criteria described above, are indicated in bold. For each of the best fitting models the model version number, model form, benchmark dose calculation, parameter estimates and estimated values are shown.
Page 248 of 281

H-2-1 Results for Saillenfait et al., 2002 and 2003 combined using Cmax Table_Apx H-8 Model Predictions for Resorptions in Rats Exposed to NMP via Gavage or Inhalation Using Cmax as the Dose Metric (Saillenfait et al., 2002 and 2003) BMR = 1% Relative Deviation (RD) and for Comparison 0.5 and 1 Standard Deviation (SD)
Modela Goodness of fit BMD1RD (mg/L)
BMDL1RD (mg/L)
BMD0.5SD (mg/L)
BMDL0.5SD (mg/L)
BMD1SD (mg/L)
BMDL1SD (mg/L)
Basis for model
selection p-value AIC
Exponential (M2)
<0.0001 1288.45 1.60 1.26 424 349 530 468 Of the models that provided an adequate fit and a valid BMDL estimate the Hill model was selected based on lowest AIC.
Exponential (M3)
<0.0001 1263.09 247 97.9 621 510 685 602
Exponential (M4)
<0.0001 1364.53 0.122 0.0122 58.2 44.5 116 89.1
Exponential (M5)
<0.0001 1265.04 326 215 593 514 648 583
Hill <0.0001 1263.03 429 216 558 514 582 548
Power <0.0001 1263.04 326 215 593 514 648 583
Polynomial 4° <0.0001 1276.48 128 77.6 436 419 518 504
Polynomial 3° <0.0001 1300.17 66.7 55.2 359 345 452 435
Polynomial 2° <0.0001 1336.49 19.2 3.77 247 215 349 317
Linear <0.0001 1362.53 0.121 0.0122 58.2 44.5 116 89.1
Notes: a Modeled variance case presented (BMDS Test 2 p-value = <0.0001), selected model in bold; scaled residuals for selected model for doses 0, 15.01, 30.34, 61.86, 120, 250, 531 and 831 mg/L were -1.42, -0.619, 1.41, 0.401, 1.1, -0.599, 0.29 and -0.00443, respectively.
Page 249 of 281

Figure_Apx H-6 Plot of Mean Response by Dose, with Fitted Curve for Selected Model for Resorptions in Rat Exposed to NMP via Gavage or Inhalation (Saillenfait et al., 2002 and 2003) BMR = 1% Relative Deviation; Cmax as Dose Shown in mg/L Equation H-6 Hill Model. (Version: 2.17; Date: 01/28/2013)
The form of the response function is: Y[dose] = intercept + v*dose^n/(k^n + dose^n) A modeled variance is fit Benchmark Dose Computation. BMR = 1% Relative deviation BMD = 429.482 BMDL at the 95% confidence level = 215.783 Parameter Estimates
Variable Estimate Default Initial Parameter Values
lalpha 4.75575 5.10412
rho 0.150826 0
intercept 6.00954 3.4
v 85.8437 87.6
n 18 1.9286
k 642.982 992.029
Page 250 of 281
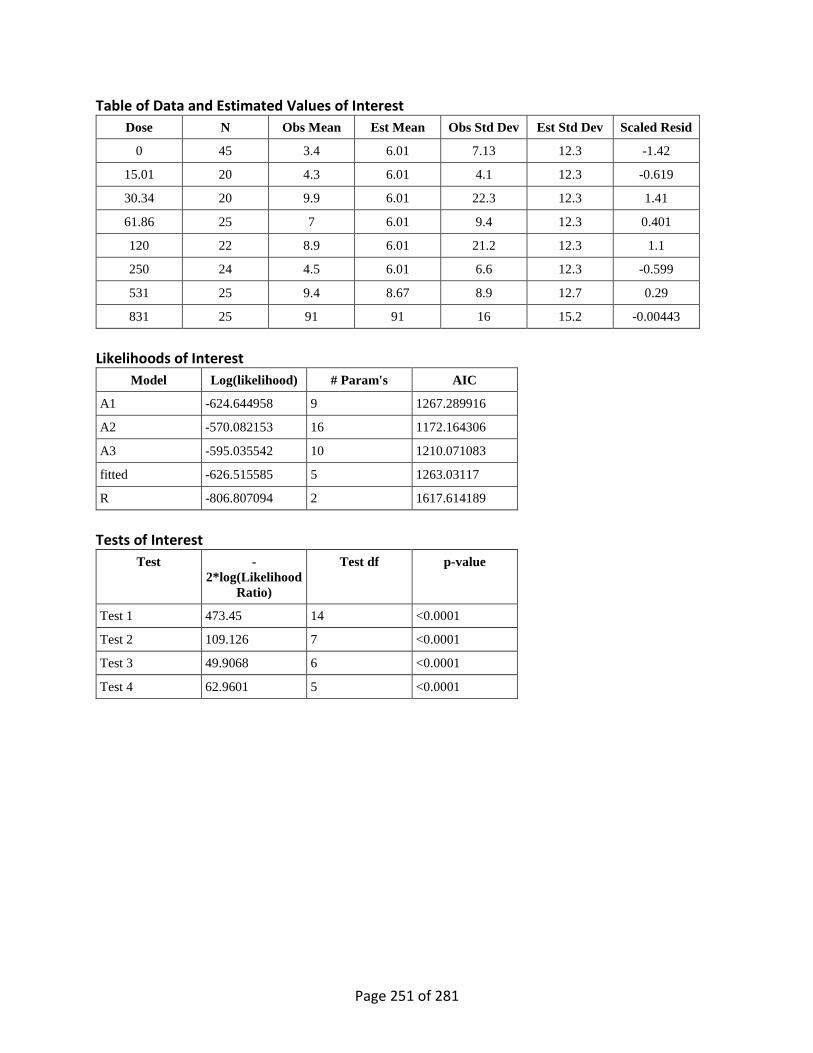
Table of Data and Estimated Values of Interest Dose N Obs Mean Est Mean Obs Std Dev Est Std Dev Scaled Resid
0 45 3.4 6.01 7.13 12.3 -1.42
15.01 20 4.3 6.01 4.1 12.3 -0.619
30.34 20 9.9 6.01 22.3 12.3 1.41
61.86 25 7 6.01 9.4 12.3 0.401
120 22 8.9 6.01 21.2 12.3 1.1
250 24 4.5 6.01 6.6 12.3 -0.599
531 25 9.4 8.67 8.9 12.7 0.29
831 25 91 91 16 15.2 -0.00443
Likelihoods of Interest
Model Log(likelihood) # Param's AIC
A1 -624.644958 9 1267.289916
A2 -570.082153 16 1172.164306
A3 -595.035542 10 1210.071083
fitted -626.515585 5 1263.03117
R -806.807094 2 1617.614189
Tests of Interest
Test -2*log(Likelihood
Ratio)
Test df p-value
Test 1 473.45 14 <0.0001
Test 2 109.126 7 <0.0001
Test 3 49.9068 6 <0.0001
Test 4 62.9601 5 <0.0001
Page 251 of 281
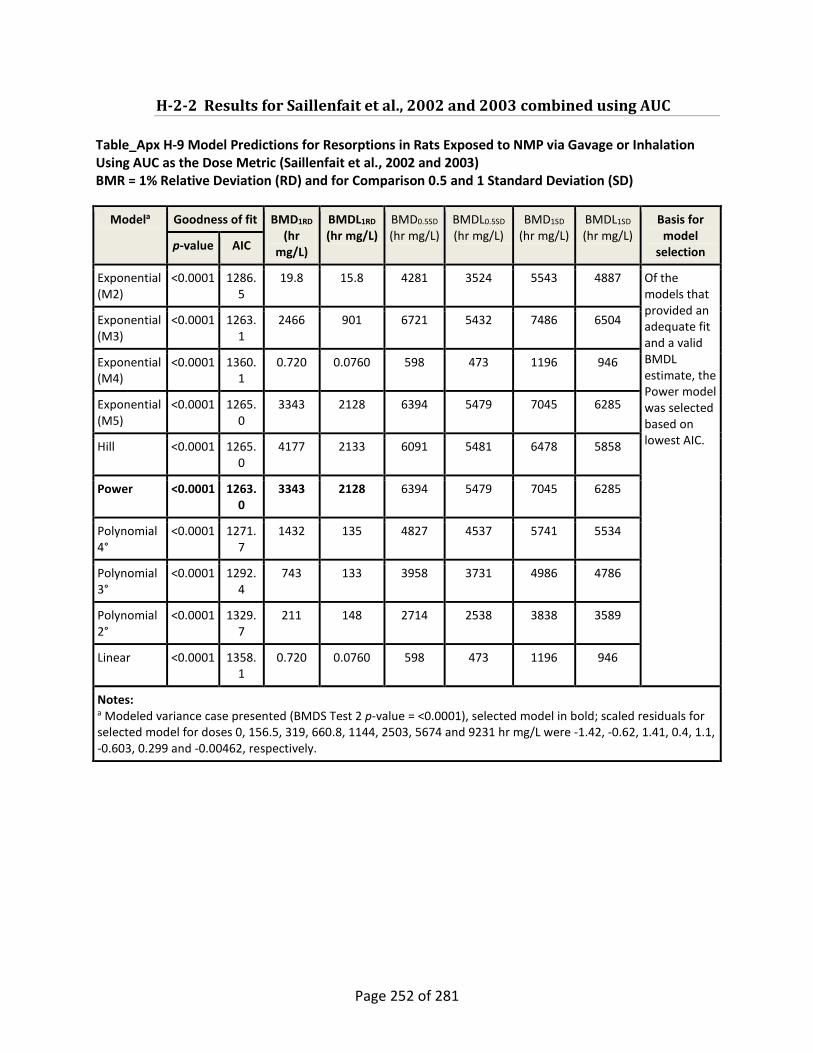
H-2-2 Results for Saillenfait et al., 2002 and 2003 combined using AUC Table_Apx H-9 Model Predictions for Resorptions in Rats Exposed to NMP via Gavage or Inhalation Using AUC as the Dose Metric (Saillenfait et al., 2002 and 2003) BMR = 1% Relative Deviation (RD) and for Comparison 0.5 and 1 Standard Deviation (SD)
Modela Goodness of fit BMD1RD (hr
mg/L)
BMDL1RD (hr mg/L)
BMD0.5SD (hr mg/L)
BMDL0.5SD (hr mg/L)
BMD1SD (hr mg/L)
BMDL1SD (hr mg/L)
Basis for model
selection p-value AIC
Exponential (M2)
<0.0001 1286.5
19.8 15.8 4281 3524 5543 4887 Of the models that provided an adequate fit and a valid BMDL estimate, the Power model was selected based on lowest AIC.
Exponential (M3)
<0.0001 1263.1
2466 901 6721 5432 7486 6504
Exponential (M4)
<0.0001 1360.1
0.720 0.0760 598 473 1196 946
Exponential (M5)
<0.0001 1265.0
3343 2128 6394 5479 7045 6285
Hill <0.0001 1265.0
4177 2133 6091 5481 6478 5858
Power <0.0001 1263.0
3343 2128 6394 5479 7045 6285
Polynomial 4°
<0.0001 1271.7
1432 135 4827 4537 5741 5534
Polynomial 3°
<0.0001 1292.4
743 133 3958 3731 4986 4786
Polynomial 2°
<0.0001 1329.7
211 148 2714 2538 3838 3589
Linear <0.0001 1358.1
0.720 0.0760 598 473 1196 946
Notes: a Modeled variance case presented (BMDS Test 2 p-value = <0.0001), selected model in bold; scaled residuals for selected model for doses 0, 156.5, 319, 660.8, 1144, 2503, 5674 and 9231 hr mg/L were -1.42, -0.62, 1.41, 0.4, 1.1, -0.603, 0.299 and -0.00462, respectively.
Page 252 of 281

Figure_Apx H-7 Plot of Mean Response by Dose, with Fitted Curve for Selected Model for Resorptions in Rat Exposed to NMP via Gavage or Inhalation (Saillenfait et al., 2002 and 2003) BMR = 1% Relative Deviation; AUC as Dose Shown in hr mg/L Equation H-7 Power Model. (Version: 2.18; Date: 05/19/2014)
The form of the response function is: Y[dose] = control + slope * dose^power A modeled variance is fit Benchmark Dose Computation. BMR = 1% Relative deviation BMD = 3343.09 BMDL at the 95% confidence level = 2127.52 Parameter Estimates
Variable Estimate Default Initial Parameter Values
lalpha 4.75548 5.10412
rho 0.150959 0
control 6.01205 3.4
slope 4.05331E-27 0.0564664
power 7.14249 0.625198
Page 253 of 281

Table of Data and Estimated Values of Interest Dose N Obs Mean Est Mean Obs Std Dev Est Std Dev Scaled Resid
0 45 3.4 6.01 7.13 12.3 -1.42
156.5 20 4.3 6.01 4.1 12.3 -0.62
319 20 9.9 6.01 22.3 12.3 1.41
660.8 25 7 6.01 9.4 12.3 0.4
1144 22 8.9 6.01 21.2 12.3 1.1
2503 24 4.5 6.02 6.6 12.3 -0.603
5674 25 9.4 8.64 8.9 12.7 0.299
9231 25 91 91 16 15.2 -0.00462
Likelihoods of Interest
Model Log(likelihood) # Param's AIC
A1 -624.644958 9 1267.289916
A2 -570.082153 16 1172.164306
A3 -595.035542 10 1210.071083
fitted -626.519051 5 1263.038102
R -806.807094 2 1617.614189
Tests of Interest
Test -2*log(Likelihood
Ratio)
Test df p-value
Test 1 473.45 14 <0.0001
Test 2 109.126 7 <0.0001
Test 3 49.9068 6 <0.0001
Test 4 62.967 5 <0.0001
Page 254 of 281
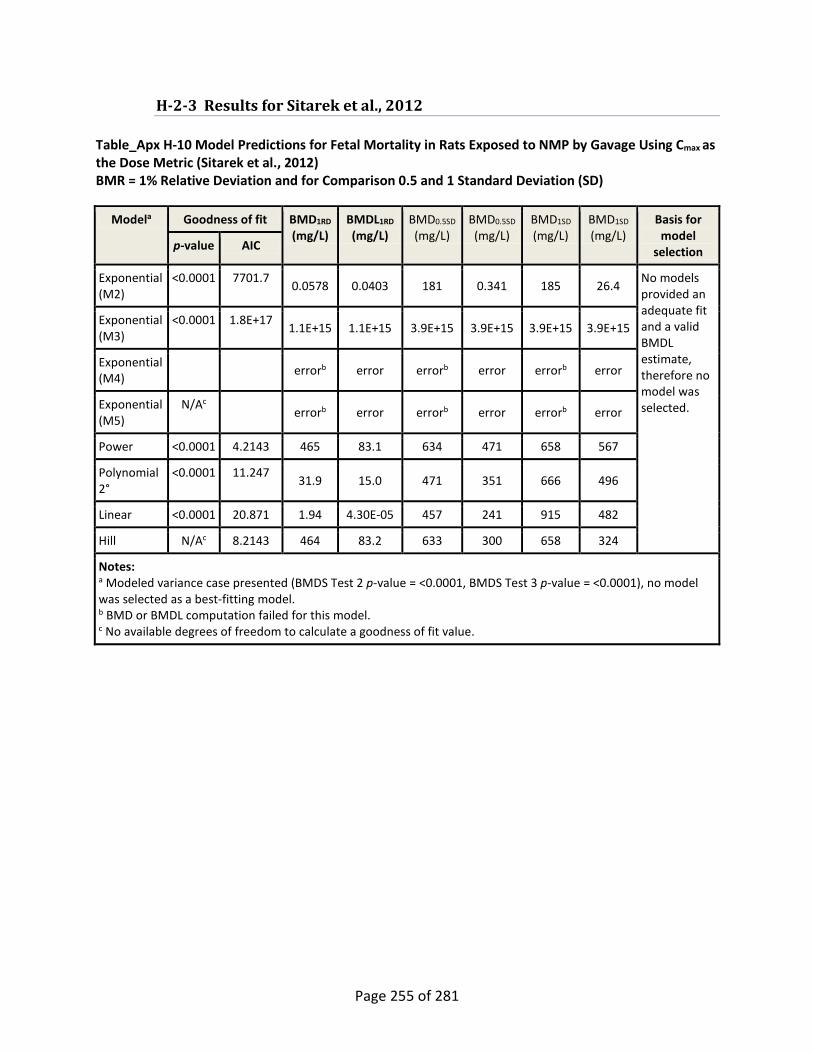
H-2-3 Results for Sitarek et al., 2012 Table_Apx H-10 Model Predictions for Fetal Mortality in Rats Exposed to NMP by Gavage Using Cmax as the Dose Metric (Sitarek et al., 2012) BMR = 1% Relative Deviation and for Comparison 0.5 and 1 Standard Deviation (SD)
Modela Goodness of fit BMD1RD (mg/L)
BMDL1RD (mg/L)
BMD0.5SD (mg/L)
BMD0.5SD
(mg/L) BMD1SD (mg/L)
BMD1SD
(mg/L) Basis for model
selection p-value AIC
Exponential (M2)
<0.0001 7701.7 0.0578 0.0403 181 0.341 185 26.4 No models provided an adequate fit and a valid BMDL estimate, therefore no model was selected.
Exponential (M3)
<0.0001 1.8E+17 1.1E+15 1.1E+15 3.9E+15 3.9E+15 3.9E+15 3.9E+15
Exponential (M4)
errorb error errorb error errorb error
Exponential (M5)
N/Ac errorb error errorb error errorb error
Power <0.0001 4.2143 465 83.1 634 471 658 567
Polynomial 2°
<0.0001 11.247 31.9 15.0 471 351 666 496
Linear <0.0001 20.871 1.94 4.30E-05 457 241 915 482
Hill N/Ac 8.2143 464 83.2 633 300 658 324
Notes: a Modeled variance case presented (BMDS Test 2 p-value = <0.0001, BMDS Test 3 p-value = <0.0001), no model was selected as a best-fitting model. b BMD or BMDL computation failed for this model. c No available degrees of freedom to calculate a goodness of fit value.
Page 255 of 281

Appendix I PBPK MODELING The PBPK models of Poet et al. (2010) for describing the toxicokinetics of NMP in rats and humans were revised for use in deriving an occupational exposure limit (OEL). These PBPK models were initially evaluated and revised by the EPA in 2013 (EPA, 2013c). Further modifications and calibration were conducted by Dr. Torka Poet in 2014 (personnel communication). In this update, additional data were considered to further calibrate and validate the model. Model calibration consists of using data to optimize parameters when those parameters are unknown or approximated, validation is used to show the fits of the model to other datasets. The EPA then evaluated the version submitted by Dr. Poet in 2014 and made some additional corrections and modifications as described below. These PBPK models simulate the pharmacokinetics of NMP and its metabolite 5HNMP5-HNMP in rats and humans, described briefly below. The models consist of nine main compartments: lung, richly perfused tissues, slowly perfused tissues, skin, fat, mammary, placenta, fetus and liver for NMP with a submodel for 5H-NMP. The model can simulate NMP exposures via the oral, inhalation and dermal routes. Dermal absorption occurs for contact with NMP liquid and vapor. Distribution of NMP to tissues is assumed to be flow-limited. The model includes mathematical descriptions of the growth of fetal and maternal tissues during gestation based on a previous PBPK model of pregnancy (Gentry et al., 2002). Due to extensive differences between rat and human gestation periods, separate rat and human models were developed. NMP metabolism was assumed to occur in the liver. NMP was assumed to be eliminated in exhaled air and urine. 5H-NMP was assumed to be eliminated by further metabolism and in urine. The physiological parameter values used in the model were obtained from the literature (Brown et al., 1997; Gentry et al., 2002) and biochemical constants for absorption, metabolism and elimination were fit to the available toxicokinetic data (Akesson and Jonsson, 1997; Wells and Digenis, 1988; Payan et al., 2002; Ghantous et al., 1995; Midgley et al., 1992). Further description of the PBPK model are available in Poet et al. (2010), (EPA, 2013c) and the modifications described below.
I-1 Rat Model Several corrections were made to the model code (.csl file) and supporting scripts (.m) files as received from Dr. Torka Poet (personnel communication). The first few of these are general and described here. Blood Flows Since the placenta is a separate compartment for the 5-HNMP model, its blood-flow and volume were subtracted from the sums used for the ‘rest of body’ for 5-HNMP. Also, the term for blood flow from the placenta was added to the mixed-venous blood mass balance for 5-HNMP.
Page 256 of 281
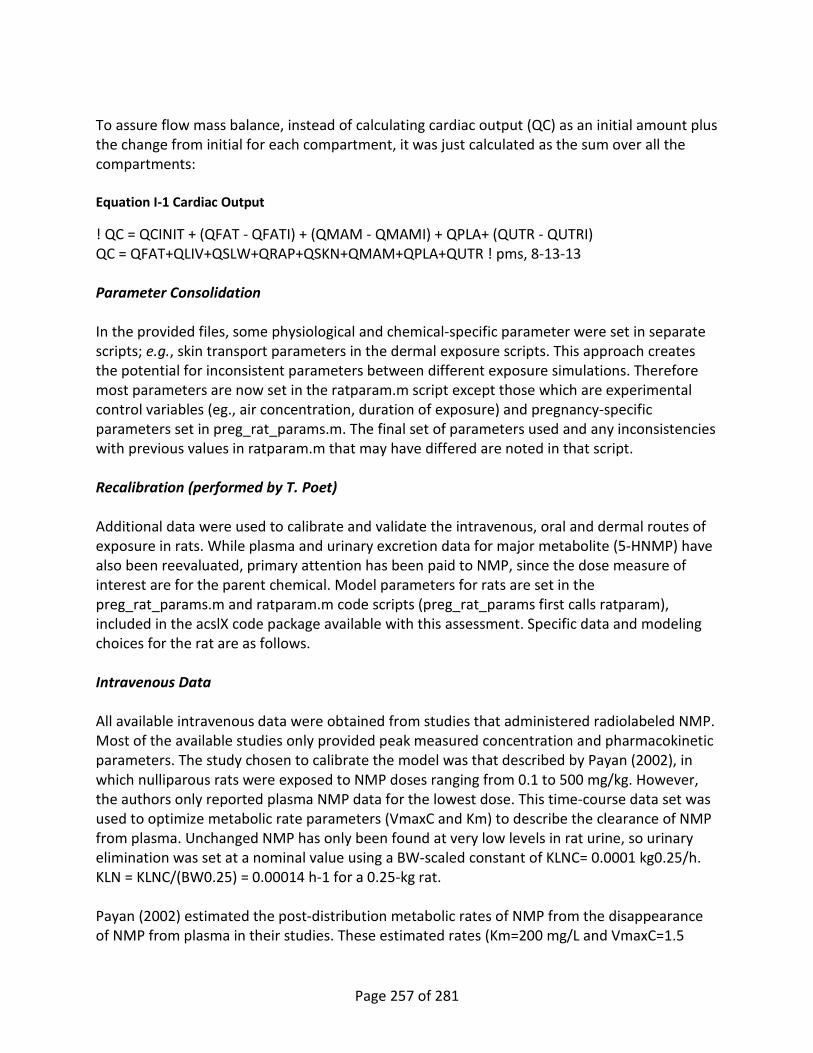
To assure flow mass balance, instead of calculating cardiac output (QC) as an initial amount plus the change from initial for each compartment, it was just calculated as the sum over all the compartments: Equation I-1 Cardiac Output
! QC = QCINIT + (QFAT - QFATI) + (QMAM - QMAMI) + QPLA+ (QUTR - QUTRI) QC = QFAT+QLIV+QSLW+QRAP+QSKN+QMAM+QPLA+QUTR ! pms, 8-13-13 Parameter Consolidation In the provided files, some physiological and chemical-specific parameter were set in separate scripts; e.g., skin transport parameters in the dermal exposure scripts. This approach creates the potential for inconsistent parameters between different exposure simulations. Therefore most parameters are now set in the ratparam.m script except those which are experimental control variables (eg., air concentration, duration of exposure) and pregnancy-specific parameters set in preg_rat_params.m. The final set of parameters used and any inconsistencies with previous values in ratparam.m that may have differed are noted in that script. Recalibration (performed by T. Poet) Additional data were used to calibrate and validate the intravenous, oral and dermal routes of exposure in rats. While plasma and urinary excretion data for major metabolite (5-HNMP) have also been reevaluated, primary attention has been paid to NMP, since the dose measure of interest are for the parent chemical. Model parameters for rats are set in the preg_rat_params.m and ratparam.m code scripts (preg_rat_params first calls ratparam), included in the acslX code package available with this assessment. Specific data and modeling choices for the rat are as follows. Intravenous Data All available intravenous data were obtained from studies that administered radiolabeled NMP. Most of the available studies only provided peak measured concentration and pharmacokinetic parameters. The study chosen to calibrate the model was that described by Payan (2002), in which nulliparous rats were exposed to NMP doses ranging from 0.1 to 500 mg/kg. However, the authors only reported plasma NMP data for the lowest dose. This time-course data set was used to optimize metabolic rate parameters (VmaxC and Km) to describe the clearance of NMP from plasma. Unchanged NMP has only been found at very low levels in rat urine, so urinary elimination was set at a nominal value using a BW-scaled constant of KLNC= 0.0001 kg0.25/h. KLN = KLNC/(BW0.25) = 0.00014 h-1 for a 0.25-kg rat. Payan (2002) estimated the post-distribution metabolic rates of NMP from the disappearance of NMP from plasma in their studies. These estimated rates (Km=200 mg/L and VmaxC=1.5
Page 257 of 281

mg/hr/kg0.75) were used as the seed values for the optimization carried out using the optimization routines supplied in acslX (v3.0.2.1; The AEgis Technologies Group, Inc, Huntsville, AL) in which the model was created. By starting with these values, it was hoped that the dose-range in that study would be represented and the optimized model would fit across doses. The final optimized parameters were Km= 225 mg/l and VmaxC=9 mg/hr/kg0.75. Wells (1988) administered an intravenous dose of 45 mg/kg to rats, which is 450x higher than the dose used for optimization and this was used to validate the metabolic rates over a large range (Figure_Apx I-1).
Figure_Apx I-1 Model Fits to IV Injection Data in Rats
Oral Data All available oral exposure data were obtained from studies that administered radiolabeled NMP. The most valuable data sets are those that specifically measured NMP in blood (dose measure used in the assessment). NMP is highly metabolized and generally not found in urine as unchanged NMP. The study chosen to calibrate the oral absorption rate was described by Midgley et al. (1992). In this study, male and female rats received an oral gavage of 105 mg/kg (22.5 mg in rats weighing 192-239 g) NMP, co-exposed with 2-pyrrolidinone in a water vehicle. The authors concluded that 94.5% of the administered radiolabel was absorbed. However, when a constant (FRACOR) was fit to the data using the PBPK model the optimal value was found to be 93%. The data indicate a rapid uptake and a slow elimination of NMP from plasma. Using the metabolic rate constants optimized to fit the intravenous dosing and the oral bioavailability measurements of Midgley et al. (1992), the model estimates of plasma NMP clearance resulted
Page 258 of 281

in a much higher AUC than the data indicated (Figure_Apx I-2). There is no suggestion of extra-hepatic (i.e., intestinal) metabolism, so another mechanism to describe this absorption pattern was investigated. NMP is readily absorbed across membranes (see dermal absorption data discussion below) and for some chemicals absorption has been proposed to occur either in the stomach or quickly in the intestine, then more slowly during later phases of transport (Levitt, 1997; Staats, 1991; Timchalk, 2002). Therefore the original PBPK model was altered to include primary (stomach) and secondary (intestine) GI compartments to describe oral absorption following the description from Staats (1991). The resulting model predictions are vastly improved (Figure_Apx I-2). Using dual oral absorption results in ~75% of the absorbed dose (after multiplying by 93% bioavailability) being absorbed via the faster process and the remaining ~25% being more slowly absorbed. Also, an unusually high fraction of the radioactivity was found in the feed residue for the females in the Ghantous (1995) study, 4.5%, so the simulated dose for that group was decreased proportionately.
Page 259 of 281

Figure_Apx I-2 Model Fits to Rat Oral PK Data
Dermal Model & Data Corrections to the mass balance equations for the rat skin are as indicated in the commented code copied below. RASK is the rate of changes in the skin compartment. The equation for the amount in the compartment, ASK, includes the initial condition, ASK0, for the initial dermal application, but otherwise the correction to RASK makes it the standard format for PBPK models. As received the code had multiplied CSK rather than CSKV (skin venous blood concentration) by the blood flow (QSKN) for the rate of efflux in blood and had not separately calculated CSKV. Equation I-2 Rat Skin Model Equations
RASK = QSKN*(CA - CSKV) + RADL ! NOW MINUS CSKV, NOT CSK; PMS 8-21-13 ASK = INTEG(RASK,ASKO) ! Initial value, ASKO, added for Becci et al. (1982) ! exposures; pms 8-14-13 CSK = ASK/VSK !'NMP IN SKIN, MG/L' CSKV = CSK/PSKB ! NMP IN VENOUS BLOOD, PMS 8-22-13 The corresponding flow term for transfer from the skin to the mixed venous blood compartment was also corrected (i.e., to use CVSK instead of CSK). While these changes to the skin compartment equations initially degraded the fits to the dermal exposure considerably, it also appeared that the associated partition coefficients were
Page 260 of 281

not consistent with the measured values reported by Poet et al. (2010), Table 5. They were recalculated as follows: Equation I-3 Rat Skin Partition Coefficients
Skin:liquid, PSKL = 0.42: % value as measured for skin:saline, vs. 450 Skin:blood, PSKB = 0.12: % (skin:saline)/(blood:saline) Skin:air, PSKA = 55: % (skin:saline)*(blood:air)/(blood:saline) = (skin:blood)*(blood:air) Developmental studies for NMP have been conducted by the dermal route (Becci et al., 1982). In the original PBPK model publication (Poet et al., 2010)(Poet et al., 2010), the dermal route was assessed using a permeability coefficient (Kp) of 4.7×10⁻³ cm/hr that was approximated from in vitro studies (Payan, 2003). For the current assessment, the in vivo dermal exposure studies described by Payan (2003) were used to optimize Kp. In this study, rats were exposed to 200 µl of neat NMP. According to Payan et al., by 24 hrs after dosing, 80% of the NMP applied had penetrated the skin. The Kp value optimized to these data was estimated to be 4.6×10⁻³ cm/hr (Figure_Apx I-3), which is consistent with the range of Kp values estimated from the in vitro studies (from 2.0 ×10⁻³ to 7.7 ×10⁻³cm/hr: (Payan, 2002)).
Figure_Apx I-3 Model Fits to Dermal PK Data from Payan et al. (2003) in Rats
Page 261 of 281

Inhalation No parameters were optimized to simulate the inhalation exposures of female rats to 104 ppm NMP for 6 hr (Ghantous, 1995), 100% inhalation bioavailability was assumed. These data, like the oral exposure data from the same source, appear to be more variable than from other studies. The model fits to the data are shown in Figure_Apx I-4.
Figure_Apx I-4 Model Simulations vs. Inhalation PK Data from Ghantous (1995) for NMP Inhalation in Rats
Exposure Control for Bioassay Simulations Because both Becci et al. (1982) and Saillenfait et al. (2002) explicitly stated that the animal BWs were measured every 3rd day of gestation and the dermal/oral doses were adjusted accordingly on those days (as BW increases during pregnancy), corresponding conditional (if/then) statements were added to the ‘GAVD’ and ‘REAPPLY’ discrete blocks, to re-calculate the doses on those days. The code for the dermal discrete blocks follows. ASK0 is the total absolute amount applied; DSK is the dose/kg BW. Because Becci et al. (1982) rubbed the material into the skin, it is assumed to be added directly into the skin compartment (ASK), rather than as a liquid on top. Hence the dose is given as an addition of ASK0 (mg/day applied) to ASK. Equation I-4 Dermal Dosing Equations
DISCRETE SKWASH ! PMS, 8-14-13 ASK = 0.0 ! Assume skin washing in Becci et al. (1982) removes all NMP IN skin
Page 262 of 281

if (DAYS.LT.15.0) SCHEDULE REAPPLY.AT.(T+DOSEINTERVAL-TWASH) END DISCRETE REAPPLY ! PMS, 8-14-13 IF (ROUND(DAYS).EQ.9.0) ASKO=DSK*BW IF (ROUND(DAYS).EQ.12.0) ASKO=DSK*BW IF (ROUND(DAYS).EQ.15.0) ASKO=DSK*BW ASK = ASK + ASKO SCHEDULE SKWASH.AT.(T+TWASH) END Also, because Becci et al. (1982) washed the skin area exposed to dermal application at the end of a set time interval, a “SKWASH” discrete block was introduced at which time the amount in that patch of skin was assumed to be momentarily reduced to zero. During periods of dermal application, transport from the liquid to the skin was turned on using the pulse function, DZONE. After removal of the liquid it was assumed that NMP in the skin patch could volatilize into the otherwise clean air, with the rate defined by the same permeability constants, but using the skin:air partition coefficient. The rate of transfer to/from the skin area is then defined by: Equation I-5 NMP Dermal Transport
RADL=(KPL*SA/1000.0)*((CSURF-(CSK/PSKL))*DZONE - (1.0-DZONE)*(CSK/PSKA)) ! 2ND term, (1.0-DZONE)*(CSK/PSKA), allows for evaporative loss when DZONE=0 The primary part of this equation for transfer when liquid is in contact with the skin, (KPL*SA/1000.0)*(CSURF-(CSK/PSKL)), is identical to that used previously by McDougal (1986). Finally, a constant, CONCMGS, was introduced so that the air concentration could be set directly in mg/m3. This is converted to the concentration in mg/L (CONCMG) in the code and added to the inhalation exposure, turned on and off using the switch, CIZONE, which is turned on and off using SCHEDULE/DISCRETE statements: Equation I-6 NMP Vapor Exposure Control
CI = CCH*PULSE(0., DOSEINTERVAL,TCHNG) + CIZONE*CONCMG ! MG/L ! Added CIZONE*CONCMG, PMS, 8-13-13
I-2 Human Model Human exposures to NMP will be primarily via the inhalation route; contribution from the dermal route (vapors or liquid) may also be significant if not primary for some scenarios. Ingestion of NMP is not expected to be a significant pathway in human populations. Both
Page 263 of 281

controlled and occupational human exposure data are available from the published literature. Controlled human biomonitoring studies were used to calibrate NMP and 5-HNMP metabolic rates and a workplace exposure assessment study was used to validate the model and exposure scenarios.
I-2-1 Corrections to Human Model Structure NMP Metabolism and Urinary Elimination Since the human PK data were consistent with a nearly linear model (first-order kinetics, including metabolism) estimation of a metabolic saturation constant, Km, using the traditional Michaelis-Menten equation for metabolism of NMP, was difficult. In particular as estimates of Km became larger, model fits became less sensitive to variation in its value. Therefore equation was changed from the standard form, rate = Vmax*C/(Km + C), where C is the concentration of NMP in the liver, to the equivalent form, rate = VK1*C/(1 + AF1*C), where VK = Vmax/Km and AF1 = 1/Km. These two forms are mathematically identical given the relationship between parameters just shown. The affinity constant, AF1, can be easily bounded to be non-negative and possibly converge to zero, corresponding to an indeterminately large Km. Since VK represents hepatic metabolism, it was assumed to scale with BW the same as Vmax; i.e., VK1 = VK1C*BW0.75. The urinary elimination of NMP was assumed to be first order, rather than saturable, using a rate constant (KUMNE) that was not scaled by BW. 5-HNMP Since 5-HNMP is not being considered as an internal metric for toxicity and its volume-of-distribution (VOD) appeared to be over-estimated using the original PBPK model structure and measured tissue partition coefficients, it’s description was replaced with a classical one-compartment PK model. Further, as the metabolism of 5-HNMP also appeared to be linear and the data for estimating a Km value even weaker, a transformation of its metabolic rate equation like that for NMP described just above was assumed, but with the affinity assumed to be effectively zero, resulting in a first-order metabolic rate equation. As with NMP, the urinary elimination of 5-HNMP was also assumed to be first-order. The resulting model then becomes: Equation I-7 5-HNMP Metabolism and Elimination
d A5H/dt = RAMET1*STOCH – RAMETM1 – RAUHP (rate of change of amount of 5-HNMP) CVEN1 = A5H/VOD5H (concentration of 5-HNMP in venous blood) VOD5H = VOD5HC*BW (volume of distribution assumed to scale with BW) RAMETM1 = ¬CVEN1 *VK2, where VK2 = VK2C*BW0.75 (rate of metabolism of 5-HNMP) RAUHP = KME*CVEN1 (rate of urinary elimination of 5-HNMP)
Page 264 of 281

RAMET1 = rate of NMP metabolism to 5-HNMP (mg NMP metabolized/h) STOCH = ratio of 5-HNMP to NMP molecular weights. Exposure and Timing Control A table function, RESLVL, was added as a place-holder for reading in defined (consumer) inhalation exposure time-courses; specifically from EPA exposure assessment modeling. A constant, GDstart, the day of gestation on which the simulation starts and a variable Gtime, the hrs into gestation, were added to facilitate separating exposure control from gestation timing. A second set of DISCRETE/SCHEDULE blocks were added to allow for split exposure scenarios (morning/afternoon worker exposure; dual-episode consumer exposures). DZONE, set in the DISCRETE/SCHEDULE blocks, controls the time within a day when discontinuous exposure occurs. Czone is the product of DZONE and a pulse function used to control for days/week exposure in workplace scenarios: Equation I-8 Vapor Exposure Scheduling
Czone = pulse(0.0,fullweek,hrsweek)*DZONE ! pms 8-20-13 ! for a 5 day/wk exposure, use fullweek=7*24, hrsweek=5*24 (Dayswk=5) ! for a single day, fullweek=1e16, hrsweek=24 (Dayswk=1) A binary constant, BRUSH, was added to set exposure scenarios when dermal contact with liquid occurs. For workplace scenarios, exposure to vapor and liquid are assumed to be simultaneous; i.e., the worker leaves the location with NMP vapor and washes his/her hands when he/she has finished applying the material. Skin Compartment The original skin compartment which is coded to include uptake from liquid-dermal contact was renamed by adding “L” to the end, SK SKL and a second skin compartment to account for concurrent vapor-skin uptake, SKV, was added. This was done because when the human model was calibrated for inhalation exposure, an exposed skin surface area of 6700 cm2 was used. When this surface is reduced to ~ 0, predicted blood levels of NMP are reduced ~ 45%. Thus vapor uptake through the skin is a significant component of inhalation exposure and there is no reason to assume, a priori, that this uptake (or desorption) does not occur through a similar area of exposed skin during workplace and consumer exposures, except for any area that would have liquid contact or otherwise be occluded (e.g., by protective equipment). So the SKV compartment allows for simultaneous absorption of vapor-through-skin that does not have liquid contact and from areas of skin with liquid contact. The surface area of SKV and SKL are SAV and SAL, respectively. SAL can set directly for different exposure scenarios.
Page 265 of 281

To account for variations with individual BW, a parameter for the fraction of skin area exposed to vapor was introduced: SAVC, with SAV = SAVC*TSA, where TSA is the total body surface area. TSA is calculated for each individual based on BW and height. For EPA simulations, SAVC was set to 0.25, representing the head, neck, arms and hands, minus any area assumed to have liquid contact or covered with protective gloves or a face-mask. The rate for delivery from a liquid film to the ‘SKL’ skin compartment (also see further below) is then defined by: Equation I-9 NMP Liquid Rate of Delivery to Skin
RADL = (PVL*SAL/1000.0)*(CSURF-(CSKL/PSKL))*Czone*BRUSH ! Net rate of delivery to "L" skin from liquid, when liquid is there The equations for transfer of vapor (air concentration = CI) to the SKL compartment, which occurs during periods with no liquid/spray contact for the SKL compartment are similarly: Equation I-10 NMP Vapor Rate of Delivery to Skin
RADVL = (PV*SAL/1000.0)*(CI - (CSKL/PSKA))*(1.0-Czone*BRUSH) ! Net rate of delivery to "L" skin from air, when liquid not present Since the dermal exposures are to neat or highly concentrated preparations of NMP, it would not be appropriate to assume that the residual liquid volume on the skin remains constant as absorption occurs. Further assuming that water penetration of the skin is minimal, the amount of water in the liquid solution is assumed to remain constant. The initial volume on the skin is defined by a new constant VLIQ0 and the density of NMP at 40C (~ skin temperature) = DENSITY = 1.02x10⁶ mg/L. To avoid potential divide-by-zero errors, the nominal initial concentration (CONCL) is reduced by 1 mg/L (1 ppm) when computing the initial amount of NMP and water in the liquid: Equation I-11 NMP Unabsorbed Fraction Remaining on Skin
DDN = (CONCL - 1.0)*VLIQ0*FAD ! Subtract 1 mg/L, ~ 1 ppm, from initial conc. to avoid VLIQ --> 0 AH20 = (DENSITY+1.0-CONCL)*VLIQ0 ! ... and add it to H20. pms 9-16-14 A mass-balance equation was then added to attract the remaining amount and volume on the skin surface, which is then used to calculate the concentration: ASURF = INTEG(-RADL, DDN) ! Amount in liquid. DDN is the initial amount. VLIQ = (AH20 + ASURF)/DENSITY CSURF = ASURF/VLIQ This volume balance is important for analysis and calibration of the dermal PK studies where small volumes (5 or 10 ml) were applied at the beginning of the exposure and not replenished. However in workplace and consumer user exposures, it is assumed that fresh liquid is
Page 266 of 281

constantly replacing any NMP that is absorbed, keeping the surface concentration essentially constant. Therefore the initial volume, VLQ0, is set to a large value (106 L) for those scenarios. The skin partition coefficients were also recalculated as was done for the rat, with rat parameters for skin:saline and blood:air, but human blood:saline. Tissue and Blood-Flow Mass Balances The model had been previously coded with an alveolar blood compartment (ALV), but this was commented out in the DYNAMIC section. Therefore this volume fraction should not be subtracted when calculating the slowly-perfused volume. The fraction of blood-flow to slowly perfused tissue was updated to also account for the SKV compartment; on the other hand a separate skin compartment is not used for 5-HNMP, so the skin blood flow is NOT subtracted for the metabolite-slowly-perfused compartment (SLW5). These have all been corrected. QSKCC (original fractional flow to the skin) had been subtracted twice, both in calculating QSLWC and then in the calculation of QSLW. The 2nd subtraction created a mass balance error and hence was removed. On the other hand, placental blood flow is now subtracted, so the total flow to slowly-perfused continues to total cardiac output minus all other tissue/group flows. For tissues for which the volume changes with gestation day, the initial values were corrected to match the calculation in the DYNAMIC section, which apply at the first time-step. In the dynamic section, the calculation of QC was corrected to include the *increase* in placental flow (QPLA – QPLAI) rather than the total placental flow (QPLA), since QCINIT includes QPLAI. QSLW5 and VSLW5 (5-HNMP slow compartment flow and volume) are now calculated in the DYNAMIC section by subtraction. The calculation of QC was otherwise left in its original form, in contrast to the rat PBPK model. Parameter Consolidation Like the rat model, the human model physiological and biochemical parameters are now primarily set in a single script, human_params.m. Initial values for the metabolic and vapor-absorption (KPV) parameters were obtained by fitting Bader et al. (2006) inhalation data with the exception of the high-concentration data from one individual, but the data otherwise grouped without distinction between individuals (further details below). An alternate set of fitted parameters was obtained by fitting the data for each individual separately, focused on the low-concentration data and then calculating the average of each parameter across the individually-fitted values. This subset of parameters is selected by using human_avg_params.m. Since further analysis of the dermal absorption of liquid NMP showed that this uptake differed between neat (100%) NMP and diluted (50%) NMP, separate value of PVL were obtained for neat vs. diluted NMP (also see below). Hence only constants which define specific exposure scenarios (include skin areas exposed) and PVL are defined in the specific simulation scripts.
Page 267 of 281
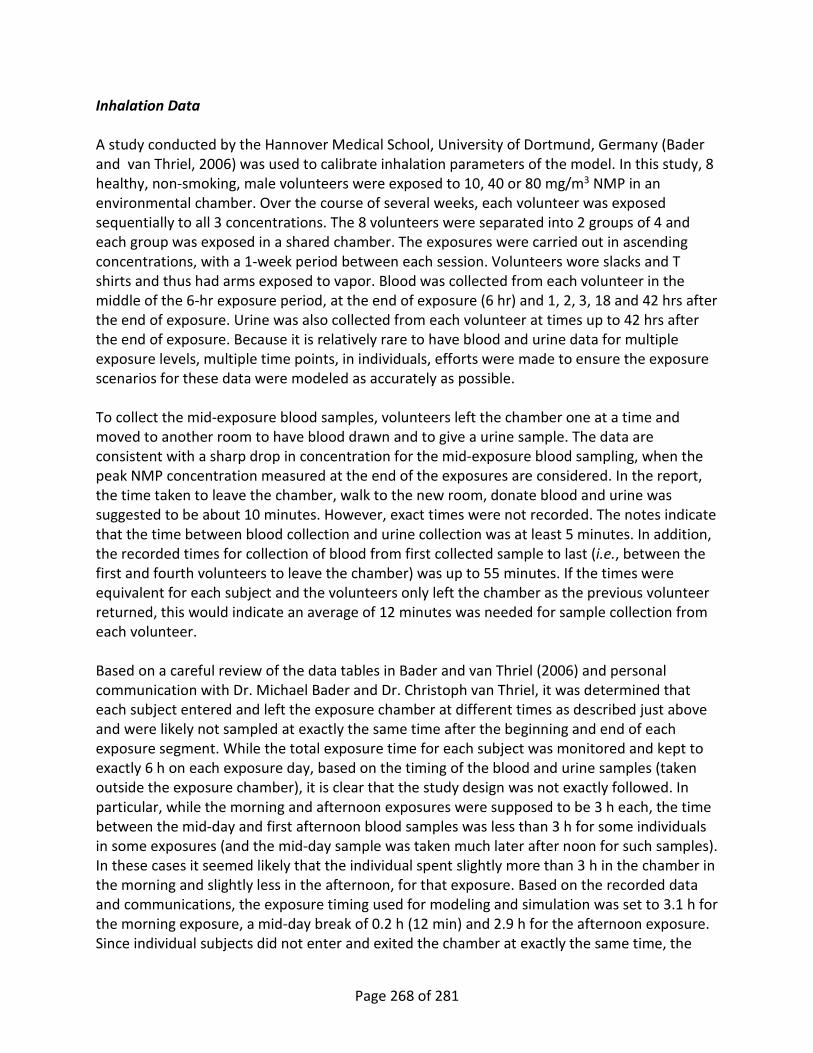
Inhalation Data A study conducted by the Hannover Medical School, University of Dortmund, Germany (Bader and van Thriel, 2006) was used to calibrate inhalation parameters of the model. In this study, 8 healthy, non-smoking, male volunteers were exposed to 10, 40 or 80 mg/m3 NMP in an environmental chamber. Over the course of several weeks, each volunteer was exposed sequentially to all 3 concentrations. The 8 volunteers were separated into 2 groups of 4 and each group was exposed in a shared chamber. The exposures were carried out in ascending concentrations, with a 1-week period between each session. Volunteers wore slacks and T shirts and thus had arms exposed to vapor. Blood was collected from each volunteer in the middle of the 6-hr exposure period, at the end of exposure (6 hr) and 1, 2, 3, 18 and 42 hrs after the end of exposure. Urine was also collected from each volunteer at times up to 42 hrs after the end of exposure. Because it is relatively rare to have blood and urine data for multiple exposure levels, multiple time points, in individuals, efforts were made to ensure the exposure scenarios for these data were modeled as accurately as possible. To collect the mid-exposure blood samples, volunteers left the chamber one at a time and moved to another room to have blood drawn and to give a urine sample. The data are consistent with a sharp drop in concentration for the mid-exposure blood sampling, when the peak NMP concentration measured at the end of the exposures are considered. In the report, the time taken to leave the chamber, walk to the new room, donate blood and urine was suggested to be about 10 minutes. However, exact times were not recorded. The notes indicate that the time between blood collection and urine collection was at least 5 minutes. In addition, the recorded times for collection of blood from first collected sample to last (i.e., between the first and fourth volunteers to leave the chamber) was up to 55 minutes. If the times were equivalent for each subject and the volunteers only left the chamber as the previous volunteer returned, this would indicate an average of 12 minutes was needed for sample collection from each volunteer. Based on a careful review of the data tables in Bader and van Thriel (2006) and personal communication with Dr. Michael Bader and Dr. Christoph van Thriel, it was determined that each subject entered and left the exposure chamber at different times as described just above and were likely not sampled at exactly the same time after the beginning and end of each exposure segment. While the total exposure time for each subject was monitored and kept to exactly 6 h on each exposure day, based on the timing of the blood and urine samples (taken outside the exposure chamber), it is clear that the study design was not exactly followed. In particular, while the morning and afternoon exposures were supposed to be 3 h each, the time between the mid-day and first afternoon blood samples was less than 3 h for some individuals in some exposures (and the mid-day sample was taken much later after noon for such samples). In these cases it seemed likely that the individual spent slightly more than 3 h in the chamber in the morning and slightly less in the afternoon, for that exposure. Based on the recorded data and communications, the exposure timing used for modeling and simulation was set to 3.1 h for the morning exposure, a mid-day break of 0.2 h (12 min) and 2.9 h for the afternoon exposure. Since individual subjects did not enter and exited the chamber at exactly the same time, the
Page 268 of 281

time of their entrance to the chamber for each exposure was estimated based on the recorded times of the blood and urine samples. The sample times used for modeling were then calculated relative to the estimated entry times. It was also clear that a number of the measurements, especially those of 5-HNMP for the low-concentration exposure, were recorded as the limit-of-detection (LOD), when the measured value fell below this limit. This was confirmed with Dr. Bader (personal communication). Therefore all measurements at/below the LOD were removed from the data set to avoid the bias they would otherwise introduce. It also appeared that the high-concentration-exposure (80 mg/m3) for one subject deviated substantially from the other subjects; see Figure_Apx I-5 below. Since the blood concentration at 6 h was well below those of the other subjects and that at 24 h well above (4 subjects had levels below the LOD), this individual’s high concentration set was excluded from analysis of the grouped data. Blood concentrations at the middle and low exposure for this individual were among the range of the other subjects, hence included in the group data. With this one data set removed, the revised model was fit to the group data for exposures at 9.7 and 80 mg/m3, by adjusting the following parameters: PV, VK1C, AF1, KUMNE, VK2C, VOD5HC and KME. Since the data for the 40 mg/m3 exposure were consistent with the 80 mg/m3, but the data for 9.7 mg/m3 appeared not to be and it was considered especially important to describe low-concentration exposures, the 40 mg/m3 data were excluded from this exercise. The resulting parameter values are as follows, with model fits to the group data shown in Figure_Apx I-6, left side. These fits are compared to ones obtained by fitting the data for each individual separately, where possible using only the low-concentration exposure data and then calculating the average across the individual fits for each parameter (right side of Figure_Apx I-6; details below).
Page 269 of 281

Figure_Apx I-5 NMP Blood Concentration Data from Bader and van Thriel (2006) Curves are simulations for 9.7, 40 and 80 mg/m3 exposures. Squares are individual blood concentration data for the 80 mg/m3 exposure. Solid squares are from the one individual with the highest BW and height (102 kg, 190 cm), compared to the other subjects (65-80 kg, 168-183 cm).
Page 270 of 281
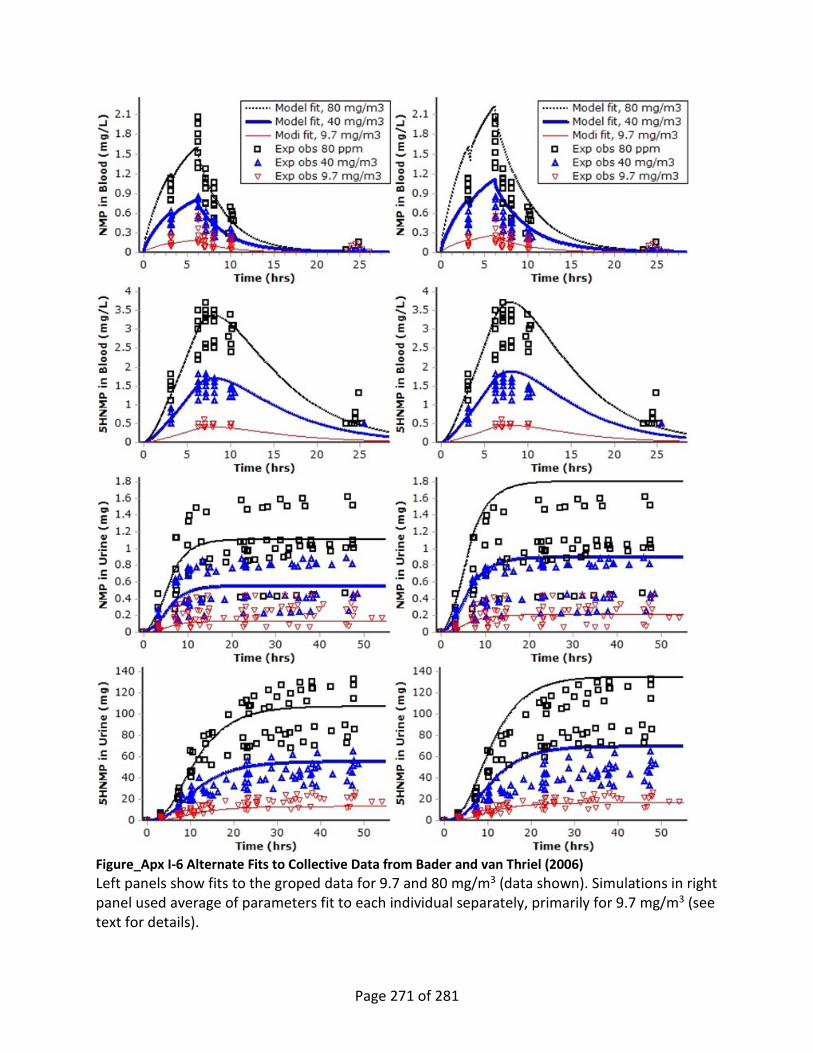
Figure_Apx I-6 Alternate Fits to Collective Data from Bader and van Thriel (2006) Left panels show fits to the groped data for 9.7 and 80 mg/m3 (data shown). Simulations in right panel used average of parameters fit to each individual separately, primarily for 9.7 mg/m3 (see text for details).
Page 271 of 281

Parameters fitted to group data for 9.7 and 80 mg/m3 exposures
Average of parameters fit to data for each individual separately, primarily 9.7 mg/m3
PV = 1.6 (cm/h)
VK1C = 0.47 (L/(h*kg0.75))
AF1 = 0.02 (L/mg)
VK2C = 0.035 (L/(h*kg0.75))
VOD5HC = 0.26 (L/kg)
KME = 2.3 (L/h)
KUMNE = 0.092 (L/h)
PV = 16.4 (cm/h)
VK1C = 0.386 (L/(h*kg0.75))
AF1 = 0.02 (L/mg) [fixed at group-fit value]
VK2C = 0.0359 (L/(h*kg0.75))
VOD5HC = 0.243 (L/kg)
KME = 2.75 (L/h)
KUMNE = 0.103 (L/h)
In their summary statistics, Bader and van Thriel (2006) reported group-averages of the peak NMP blood levels as being 0.293 mg/L for the 9.7 mg/m3 and 1.585 mg/m3. The ratio of these two (1.585/0.293 = 5.4), is considerably less than one would expect assuming linearity with exposure level (80/9.7 = 8.25) and is the opposite of what one would expect due to metabolic saturation of the conversion of NMP to 5-HNMP. This is not true for the ratio peak 5-HNMP levels in blood (8.08), however, which is comparable to the relative exposure level. If the nonlinearity in NMP blood levels were due to more efficient metabolism at the higher exposure level, then ratio of 5-HNMP blood levels would have been greater than expected. Since the mechanism for the nonlinearity in blood NMP levels is unclear and it would be undesirable to under-estimate NMP blood levels and hence human risks at lower exposure levels, it was decided to estimate parameters using only the low-exposure data, if possible or with minimal use of the high-exposure data. (For two of the subjects the blood levels of 5-HNMP did not rise above the LOD for the low exposure, making it impossible to estimate VOD5HC for them. Hence the 80 mg/m3 blood 5-HNMP data were also needed to estimate their parameters.) Given the observation that the high-exposure data for one subject was disparate from the other subjects, it also seemed possible that the apparent nonlinearity in the average PK data was due to the mixing of data from the 8 subjects in the study. Therefore fits focused on the low-exposure data were conducted separately for each subject. Since limiting to the low-exposure data would provide almost no information on metabolic saturation and the affinity (AF1) obtained from the fits to the group data was quite low (0.02 L/mg), AF1 was held at that group-fit value for this exercise. The resulting parameter values are listed in Table_Apx I-1 and fits to the individual data shown in Figure_Apx I-7 - Figure_Apx I-10. In order to allow one to see the fit to the low concentration and otherwise compare the fits across individuals, the y-axis scale was held constant for each analyte across the individuals, though this meant that the simulation curves for the higher exposure data sometimes went off the top of the plot.
Page 272 of 281

Table_Apx I-1 Estimated PBPK Parameters for Each Subject of the Bader and van Thriel (2006) Experiments
Subject VK1C KUMNE PV VK2C KME VOD5HC 1 0.25 0.11 19 0.017 3.2 0.2 4 0.17 0.042 34 0.004 3 0.14
10 0.22 0.069 35 0.027 2.8 0.12 12 0.63 0.046 12 0.044 1.9 0.39 14 0.57 0.2 10 0.08 2.5 0.4 16 0.45 0.06 0 0.08 1.9 0.2 17 0.38 0.2 20 0.02 4.3 0.26 25 0.42 0.1 1.5 0.015 2.4 0.23
average 0.386 0.103 16.4 0.0359 2.75 0.243 It is interesting to note that for half of the subjects (#12, #14, #16 and #25), the fits and data for NMP in blood show that the data are quite consistent with the essentially linear PBPK model, while for the other half the simulations with parameters fitted to the low-concentration data over-predict the high-concentration NMP data.
Page 273 of 281

Figure_Apx I-7 Model Fits to Subjects 1 and 4 of Bader and van Thriel (2006) Model fit separately to each subject. See text for details.
Page 274 of 281

Figure_Apx I-8 Model Fits to Subjects 10 and 12 of Bader and van Thriel (2006) Model fit separately to each subject. See text for details.
Page 275 of 281

Figure_Apx I-9 Model Fits to Subjects 14 and 16 of Bader and van Thriel (2006) Model fit separately to each subject. See text for details.
Page 276 of 281
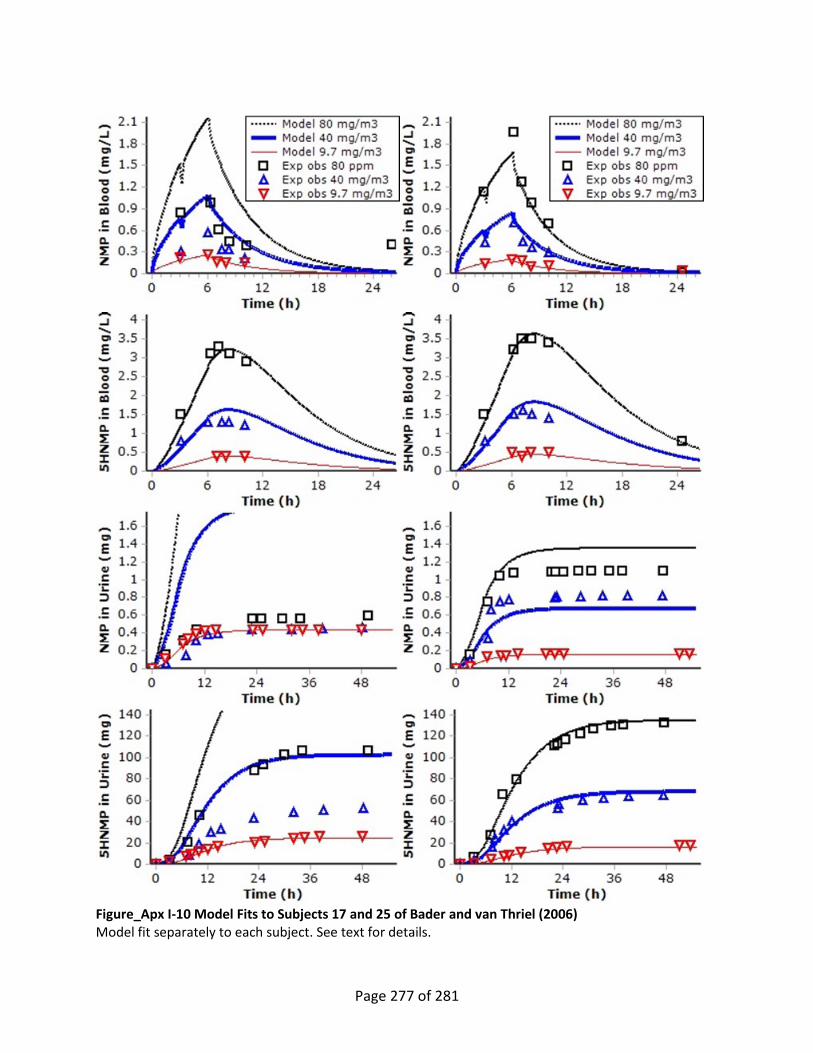
Figure_Apx I-10 Model Fits to Subjects 17 and 25 of Bader and van Thriel (2006) Model fit separately to each subject. See text for details.
Page 277 of 281

Dermal Data: Vapor and Liquid Volunteers in the study described by Akesson and Paulsson (1997) wore shorts and t-shirts and thus also had dermal (vapor) exposures, as well as inhalation exposures, to NMP. The exposure concentrations for this study were similar to those of Bader et al. (2005). With only inhalation exposures, the model under-predicted plasma NMP by about 25%, a vapor permeability coefficient, which accounts for both the skin permeability and the vapor/skin surface interaction, (PV) of 1.5 cm/hr was optimized to fit these data and is equivalent to the previously optimized value (Poet et al., 2010) (Figure_Apx I-11).
Figure_Apx I-11 Model Fits to Human Inhalation Data of Akesson and Paulsson (1997), With and Without Dermal Absorption of Vapors Model parameters were as obtained previously using the data of Bader and van Thriel (2006). Simulations are shown with dermal absorption of vapors included (“with dermal”; 25% of total surface area assumed exposed) or turned off (“no dermal”). Akesson et al. (2004) exposed 12 volunteers (6 male and 6 female) to 300 mg NMP either neat or diluted 50:50 in an aqueous solution. Blood and urine 5-HNMP concentrations were monitored for up to 9 days. The plasma 5-HNMP concentration was extracted from the figure using DigitizIt (Braunschweig, Germany). Urinary 5-HNMP concentrations were extrapolated to total amount eliminated using the assumption that the average urinary flow for an adult is 18 ml/kg-day (Heffernan et al., 2014). Aqueous dilution resulted in a slower time to reach peak plasma 5-HNMP and a reduction in peak plasma concentration. Because the urinary elimination constant (KME) for 5-HNMP was seen to vary among subjects when fitting the Bader and van Thriel (2006) data (see Table H1) and we did not want a lack-of-fit to the urinary elimination
Page 278 of 281

data (which establish the mass balance, hence total amount absorbed) to adversely impact the fitting of the 5-HNMP blood levels, KME was also fit to each data set then. Optimized liquid Kp for neat NMP was 2.05 x 10⁻³ cm/hr (with KME = 4.54L/hr). To fit the data from the diluted exposures, a lower Kp of 2.87x10⁻⁴ was needed (with KME = 2.10 L/hr) (Figure_Apx I-12). These liquid dermal permeability coefficients were used in estimating human dermal absorption for neat and diluted NMP absorption, though with KME kept at the average value from the Bader and van Thriel (2006) study (2.3 L/hr). (Note that KME does not impact NMP blood levels.) Workplace Observer Study In a biomonitoring study Xiaofei (2000) followed 4 workers and 5 observers in a lens manufacturing facility. The workers washed lenses with NMP, working 11-hr shifts with a 1-hr lunch break (total 12 hrs within the facility). Observers were stated to be in the facility from 8 am to 5 pm for a single day, but the tabulated exposure metrics indicated only 8 h of exposure, so it was assumed that they also took a 1-hr break (at noon). The mean exposures for the observers was 0.28 ppm, with a range from 0.24 to 0.32 ppm. The PBPK model underestimated plasma NMP concentrations for the workers (data not shown) and observer by ~3x when no dermal exposure is assumed (Figure_Apx I-13). However, droplets of NMP were noted on the lenses as the workers were moving those lenses to drying racks. Just assuming that these droplets were due to some aerosolized NMP and that the observers had a small surface area of skin exposed to such droplets, 0.2 cm2, gave results that better fitted the blood data during the exposure, but the clearance after exposure appeared to be too rapid. Assuming that the average metabolic rate was ½ of that identified from the Bader and van Thriel (2006) data (i.e., VK1C = 0.193 L/h-kg0.75) with an even smaller exposure to aerosol (0.1 cm2 of exposed skin) resulted in simulations that matched the data well (Figure_Apx I-13). The lowest individual VK1C estimated for the Bader and van Thriel (2006) data was 0.17 L/h-kg0.75, so the value used here is not unreasonable. In summary, the un-adjusted model gave simulations that were within a factor of three of this data set and the discrepancy can be explained by a reasonable level of metabolic variability between the two study populations and a small amount of dermal contact.
Page 279 of 281

Figure_Apx I-12 Model Fits to Human Dermal Exposure Data of Akesson et al. (2004)
Page 280 of 281

Figure_Apx I-13 Workplace Observer Simulations Representing Subjects of Xioafei et al. (2000) *Metabolic elimination was reduced to ½ that estimated from Bader and van Thriel (2006) data and 0.1 cm2 of skin was assumed exposed to liquid aerosol.
Page 281 of 281