Embed Size (px)
Citation preview

2011-03-24
TSA II Stenungsund -
Investigation of opportunities for
implementation of proposed category A energy
efficiency measures
Eva Andersson
Per-Åke Franck
CIT Industriell Energi
Chalmers Teknikpart
412 88 Göteborg
Tel: 031 772 3672
Roman Hackl
Simon Harvey
Division of Heat and Power Technology/Chalmers University of Technology
Kemivägen 4
412 96 Göteborg
Tel: 031 772 3861


i
TSA II Stenungsund - Investigation of opportunities for
implementation of proposed energy efficiency measures
Eva Andersson
Per-Åke Franck
CIT Industriell Energi AB
Roman Hackl
Simon Harvey
Division of Heat and Power Technology
Chalmers University of Technology
This project was carried out in cooperation between the Division of Heat and
Power Technology at Chalmers University of Technology, CIT Industriell
Energi AB, AGA Gas AB, Akzo Nobel Sverige AB, Borealis AB, INEOS
Sverige AB and Perstorp Oxo AB.
The project was financed by the participating companies and The Swedish
Energy Agency.

ii
SUMMARY
A Total Site Analysis (TSA) study of the chemical cluster in Stenungsund was
conducted during 2010. This previous study is hereafter referred to as the TSA
I study. The study was conducted by CIT Industriell Energi and the Division of
Heat and Power Technology at Chalmers together with the participating cluster
companies (AGA Gas AB, Akzo Nobel Sverige AB, Borealis AB, INEOS
Sverige AB and Perstorp Oxo AB).
In the TSA I study, measures to increase energy efficiency by increased energy
collaboration (i.e. increased heat exchange between the cluster plants) were
identified. The measures were classified according to ease of implementation
based on consultation with plant staff. In this report, conducted within the
framework of the second stage of the TSA research project (hereafter referred
to as the TSA II project) practical issues associated with implementation of the
identified measures are investigated. The investigation is limited to category A
measures, considered by plant staff to be relatively easy to implement from a
technical perspective. A conceptual design of a possible hot water system for
exchanging heat between the different sites is presented. Since the steam
systems of the different plants are at present only partly connected, or not at all,
the overall reduction in steam use that would results from introduction of a hot
water system would lead to steam surplus at certain sites. Therefore
introducing a hot water system is only beneficial if new steam lines are also
implemented so that it becomes possible to exchange steam between the
individual plant sites. The exchange of steam is only possible if steam demand
and steam excess are at the same pressure level. To avoid excess steam at low
pressure level, demand of low pressure steam must increase. In order to
increase the possibility to use more low pressure steam, the opportunities to
decrease utility steam pressure in individual process heaters are analyzed. The
implementation of energy efficiency measures in the refrigeration systems is
also investigated. In practice this can be achieved by changing steam as heating
utility to a fluid that can operate below ambient. In addition to the steam
saving, the heat transfer fluid can transport energy from the current cooling
systems and decrease the amount of compressor work required to operate the
existing refrigeration system units.
In order to achieve a reduction of purchased fuel for firing in boilers it is
necessary to implement both a common site-wide circulating hot water system
and a reduction of utility steam pressure used in several process heaters .
The results show that if all measures that are considered by plant energy
engineers to be feasible by moderate changes are carried out as suggested, fuel
usage in boilers could be reduced by 89 MW (corresponding to
200 MSEK/year if fuel gas is valued at 270 SEK/MWh and year-round
operation is assumed).
A rough estimate of the total investment costs for the implementation of
category A measures is 660 MSEK.

iii

iv
Table of contents
1 Background ................................................................................................. 1
2 Results from TSA I study and suggested measures .................................... 2
2.1 Work procedure ................................................................................... 2
2.2 Updated data ........................................................................................ 2
2.3 Total Site Curve ................................................................................... 3
2.3.1 Systematic analysis of TSC curve ................................................ 3
2.3.2 Qualitative evaluation of specific measures ................................. 5
2.4 Steam to turbines ................................................................................. 6
3 Detailed description of suggested measures ............................................... 8
3.1 Design of heat transfer systems including Category A heat exchangers
8
3.1.1 Hot water systems ......................................................................... 8
3.1.2 Heat sinks ................................................................................... 11
3.1.3 Heat sources ................................................................................ 12
3.1.4 Hot water system operating between 55 and 79oC ..................... 14
3.1.5 Hot water system operating between 75 and 97 oC .................... 15
3.1.6 Heat transfer system below ambient temperature....................... 16
3.1.7 Overview of consequences of new heat transfer systems........... 17
3.2 Steam generation and change of steam pressure ............................... 18
3.2.1 Additional steam generation from excess process heat .............. 18
3.2.2 Reducing steam pressure for process stream heaters.................. 19
3.2.3 New steam users ......................................................................... 19
3.3 Redistribution of steam between plants ............................................. 20
3.3.1 Re-distribution of LP steam within the cluster ........................... 20
3.4 Results if category A measures are implemented together with
redistribution of LP steam ............................................................................ 21
3.5 Further measures to reduce fuel used for steam production .............. 22
4 Summary of results if all category A measures are implemented ............ 24
5 Cost estimate ............................................................................................ 27
5.1 Investment .......................................................................................... 27
5.2 Operation costs .................................................................................. 28

1
1 BACKGROUND
A Total Site Analysis (TSA) was performed in a previous study (TSA I1) to
evaluate the benefits of integration between the process energy utility systems
within the chemical cluster in Stenungsund. The main conclusion was that, in
theory, heat recovery from the constituent processes is sufficient to completely
cover the heat demand at the site that is currently covered by boilers. This
means that 125 MW of boiler steam can be saved and, in addition, a surplus of
16 MW of high pressure steam can be released and used for e.g. additional
power generation. Note that these figures have been updated and slightly
modified since the TSA I study.
Measures necessary to reach the full saving potential were identified in the
TSA I study and include:
Introduction of a circulating hot water system and a circulating heat
transfer system below ambient
Increased steam generation from excess process heat
Reducing steam pressure level in process heaters to increase low
pressure steam use
Redistribution of steam between plants to avoid local steam surplus
The feasibility of implementing these measures was evaluated and ranked into
category A, B and C.
The aim of this study is to present a conceptual design for measures that reduce
the heat demand, and thus reduce fuel used in boilers. The conceptual design
only includes category A measures (category A: considered by plant staff to be
relatively easy to implement from a technical perspective).
The aim is also to present an economic evaluation including investment costs
1 Total Site Analysis (TSA) Stenungsund, Roman Hackl, Simon Harvey, Eva Andersson,
Chalmers 2010
2
2 RESULTS FROM TSA I STUDY AND SUGGESTED MEASURES
2.1 Work procedure
The following steps were carried out to find the practical solutions in this
report:
1. Collect data based on new information and reevaluation of measures
from TSA I
2. Incorporation of new data in TSA curves
3. Analysis of curves to find measures necessary to avoid site pinch
4. List all process heaters that are suitable for heating with a hot water
system and are considered possible to convert by moderate changes
(category A, see 0).
5. Find heat sources for a hot water system that are category A
6. Design hot water systems and heat transfer system below ambient
7. Estimate the amount of utility steam generation that is no longer
required for operation of category A process heaters
8. Check category A process heaters which could be operated using a
lower steam pressure
9. Make a new Total Site Composite (TSC) curve including all category A
measures
10. Check steam balance at individual plants where category A measures
have been implemented
11. Investigate possibilities to redistribute steam
12. Obtain result: Category A with distribution of LP steam
13. Find further measures to avoid steam surplus
2.2 Updated data
Discussions after a preliminary presentation of practical solutions have resulted
in updated evaluations of the different measures presented in TSA I. Some
measures classified as category A have been reevaluated to category B and vice
versa. The reevaluation has resulted in:
Increased amounts of heat that can be delivered to a hot water system
from heat sources categorized as A.
Increased heating requirements in category A heat sinks which makes it
possible to use more hot water to replace utility steam.
Updated data for steam production associated with process cooling.
By-products that must be fired at the site, but not necessarily in the same boiler
as used currently, are not included as a heat source in the TSC. Instead such
by-product fuel streams are considered an internal fuel that can be fired in any
boiler within the cluster. The difference is that the resulting steam production is
not fixed at a given pressure.
Some minor adjustments of total steam use have also been made to better
reflect the current steam use at different levels.

3
The updated data has been incorporated in the results presented hereafter.
2.3 Total Site Curve
Based on process stream data and the corresponding hot and cold utility
streams used for heating and cooling these streams, the total site composites
(TSC) curves shown in Figure 1 can be developed. The curves represent the
current utility system. The red full line represents the hot process streams,
which require cooling, the green dashed line represents the cold utilities used to
cool the hot process streams. The blue full line shows the cold process streams,
which need to be heated and the orange dashed line illustrates the hot utilities
used to heat these cold process streams.
In Figure 1 it can be seen that 125 MWheat from fuel fired in boilers is needed
to cover the cluster’s current heating demand. 653 MWcooling are necessary to
cool the processes. 318 MWrec of heat are recovered by the utility system.
Figure 1 TSC of the chemical cluster in Stenungsund with its current utility system
2.3.1 Systematic analysis of TSC curve
In this section the systematic procedure followed to increase site wide heat
integration via a common utility system using TSC is presented:
The TSC curves of the current utility system (Figure 1) show a large gap
between the hot utility curve and the sink profile (especially for process
temperatures below 100 °C).
This leads to high exergy losses since the process streams are
heated with utility at higher temperature than necessary.
The source profile indicates that there is heat available (currently
discharged) at suitable temperature to supply heat to the cold process
-200
0
200
400
600
800
1000
1200
1400
1600
0 200000 400000 600000 800000 1000000 1200000
Te
mp
era
ture
[°C
]
Heat load [kW]
Sink Profile Source Profile Hot Utility Cold Utility
Site Pinch
Qheating=125 MW
Qcooling=653 MW Qrec=318 MW

4
streams. Heat from hot process streams can be recovered in the
circulating hot water system and delivered to cold process streams
(between 50 and 100°C).
Detailed analysis indicates that steam used for process heating
could be replaced by hot water.
Implementation of a hot water circuit implies that after a certain degree of
increased heat integration a new site pinch is created, indicating that no further
heat integration is possible. In practice the new site pinch implies that if more
than 51 MW of utility steam is replaced with hot water there will be an overall
excess of LP steam. This is because there will still be the same amount of
2 bar(g) steam recovered from process heat, but there is less demand since
steam for heating purposes is replaced by hot water.
Further increase of heat recovery requires further shifting of the site pinch.
This can be achieved as follows:
Modify the operating conditions of certain process heaters. In this study
we focused on steam heaters currently operated with MP steam but where
it would be sufficient to operate with utility steam at 2 bar(g) the
steam level in these heat exchangers can be decreased demand for LP
steam is increased.
Proceed as above until another site pinch is created, which makes it
necessary either to lower the steam level in process heaters using higher
pressure steam or steam from excess process heat can be recovered at
higher levels.
Both measures make it possible to shift the site pinch and increase the
overlap of the TSC.
The maximum theoretical heat integration is achieved, when ΔT between
source profile/cold utility and hot utility/sink profile approaches ΔTmin
(here ΔTmin=10 K)
Figure 2 TSC after introduction of a utility system for maximum heat recovery
-200
0
200
400
600
800
1000
1200
1400
1600
0 200000 400000 600000 800000 1000000 1200000
Te
mp
era
ture
[°C
]
Heat lead [kW]Sink Profile Source Profile Hot Utility Cold Utility
Site Pinch
Qexcess=16 MW
Qcooling=495 MW Qrec=476 MW

5
Figure 2 shows the cluster with a utility system modified in order to achieve
maximum heat recovery. Several measures to recover the maximum amount of
heat from the processes and re-use it for heating process streams elsewhere in
the cluster are considered in this improved utility system. A circulating hot
water system is suggested which could enable recovery of 133 MW of heat.
Heat recovery to produce steam at 2 bar(g) can be increased by 25 MW. By
doing this it is possible to save all the current utility demand (125 MWheat). In
addition, a surplus of 16 MWsteam can be produced from excess process heat.
The amount of heat recovered by the utility system increases to 476 MW and
the cooling demand decreases to 495 MW respectively.
2.3.2 Qualitative evaluation of specific measures
Specific measures to achieve a hot water system and changes in steam level use
were identified by looking at stream data (process temperature, current utility
and duty) of individual process heaters. The aim was to assess the feasibility of
modifying process heaters in order to either reduce the pressure of utility steam
required, or replace utility steam by hot water. Similarly, process coolers were
examined with respect to feasibility to generate steam at higher pressure, or
produce hot water.
A qalitative evaluation of the suggested measures was conducted together with
plant experts to assess their feasibility. The measures were sorted into three
categories:
A. Feasible, with moderate changes: Only the heat exchanger area and
piping needs to be modified. No change to other equipment is necessary.
Sufficient space is available to conduct the modifications and no
additional pipe racks are needed.
B. Technically feasible: Besides modifying heat exchangers, changes to
other process equipment must also be conducted. Examples of such
changes or limitations include: a lack of space, additional pipe rack
needs to be installed, heat exchangers are difficult to reach (top
condensers, heat exchangers placed high above ground level etc.).
C. Not feasible: The suggested measure is not possible for other process
reasons.

6
Figure 3 TSC after introduction of energy efficiency measures classified as “A”
If Category A measures are implemented the hot and cold utility curves will
change. Figure 3 show the TSC with the new utility curves. The process curves
can now overlap a little more before the new site pinch occurs. The new heat
demand of the total site is 58 MW.
2.4 Steam to turbines
In this study we assume that mechanical drive turbines driving process
equipment such as pumps and compressors (but not electricity generators) are
essentially part of the process. This means that the steam expanding in these
turbines is only available for that purpose and consequently not available for
process heating and is therefore not included in the stream data. However,
steam leaving such mechanical drive turbines after expansion, is available for
use in the site wide utility system and are thus included in the Source Profile in
the TSC that represents the sum of all heat available in process streams that
must be cooled. This is illustrated in Figure 4.
The consequence of the assumption above is that potential benefits for the total
site energy system that could be achieved by changing the configuration of the
turbines, are not included in this study.
-200
0
200
400
600
800
1000
1200
1400
1600
0 200000 400000 600000 800000 1000000 1200000
Te
mp
era
ture
[°C
]
Heat lead [kW]Sink Profile Source Profile Hot Utility Cold Utility
New Site Pinch
Qheating=58 MW
Qcooling=586 MW Qrec=385 MW
Hot water circuit (class A)

7
Figure 4 Illustration of how steam generated by recovery of process heat is calculated
when the steam is used in mechanical drive turbines. Example: 196 MW of high pressure
steam is generated with process heat, but only 51 MW is included in the Source curve
since 145 MW is used in the mechanical drive turbine.
A= 196
B=145
C=124
D=97
E=50 LP
MP
HP
Steam generated in process
Available HP steam: A-B= 51
Available MP steam : C-D = 27
Available LP: E= 50[MW]
Work
Work

8
3 DETAILED DESCRIPTION OF SUGGESTED MEASURES
The measures suggested in the TSA I study will be described in more detail in
this chapter:
3.1 Introduction of a circulating hot water system and a circulating heat
transfer system below ambient
3.2 Increased steam generation from excess process heat and reducing
steam pressure level in process heaters to increase low pressure steam
use
3.3 Redistribution of steam between plants to avoid local steam surplus
3.5 Further measures to reduce fuel used for steam production in boilers
3.1 Design of heat transfer systems including Category A heat exchangers
3.1.1 Hot water systems
The introduction of a hot water circuit implies that process coolers have to be
redesigned to use hot water instead of cooling water or air. Process heaters
have to be redesigned for hot water instead of steam heating. The change of
utility will lead to a lower temperature difference between the exchanged
streams and larger heat exchanger areas will probably be needed. The use of
plate heat exchangers can be one solution to reduce the physical size of the
installation. For some heat exchangers only part of the heating or cooling can
be made with the hot water system, and cooling water or steam will still be
needed.
The temperature required in order to deliver heat to the heat sinks are at
different levels, and to improve the use of recovered heat, the design of hot
water systems at two temperature levels has been made, see Figure 5. One of
the systems delivers heat at ~75-80 oC and the other at ~100
oC. The heat
sources used contain more heat than required but some redundancy will be
necessary to guarantee operation if heat exchangers are out of operation. If not
needed, the excess heat can be cooled with cooling water.

9
Figure 5 A graphic representation of the heat sources and the heat sinks. The hot water
systems are divided into two systems, one at 55-79 oC that will transfer 30.5 MW and one
75-97 oC that can transfer 32.1 MW.
Figure 6 Hot water systems at two temperature intervals. The boxes show the number of
heat sources (red) and heat sinks (blue) heat exchangers involved in the hot water
systems.
It is important to note that categorization of process heaters and coolers can
affect the topography of a site-wide circulating hot water system significantly.
For example, there is significant amounts of heat available at the Borealis
Cracker that is categorized as B (i.e. technically feasible, but requires
significant changes). If this heat is considered as being available for use, no
inter-site hot water system is in fact necessary, as shown in Figure 7. In order
to make better choices regarding process heaters and coolers to be considered,
it is necessary to conduct more detailed cost estimates of possible measures,
which is beyond the scope of this study.
-40
-20
0
20
40
60
80
100
120
140
160
0 20000 40000 60000 80000 100000 120000
T (°C
)
Q (kW)
Hot water system ca 75-97 oC Heat sources
Heat sinks
Hot water system ca 55-79 oC
Cooling water
30.5 MW 32.1 MW
AGA
Borealis PE
Perstorp Oxo
Borealis Cr
Ineos
Hot water system 2
32.1 MW
Hot water system 1
30.5 MW
Akzo
95oC
79oC
97oC
75oC
55oC

10
Figure 7 Summery of possible heat sources and heat sinks that are categorized as A
measures. B measure at Borealis Cracker indicated in figure.
An inventory of category A heat sources and heat sinks (including heat sinks
below ambient) at each plant is shown in Figure 7. The figure shows that there
are possibilities to recover heat in a hot water system and deliver to heat
exchangers that are identified as category A heat sinks at all the plants except
at Borealis Cracker.
Figure 7 also shows that there is more hot water available that could be
recovered and delivered to a district heating network or, even better, to heat
sinks that have a demand all year. This type of investigation is however not
included in the scope of this study.
The excess of hot water provides the opportunity to choose between heat
sources and, after a more detailed evaluation and cost estimate, select the most
cost effective measures.
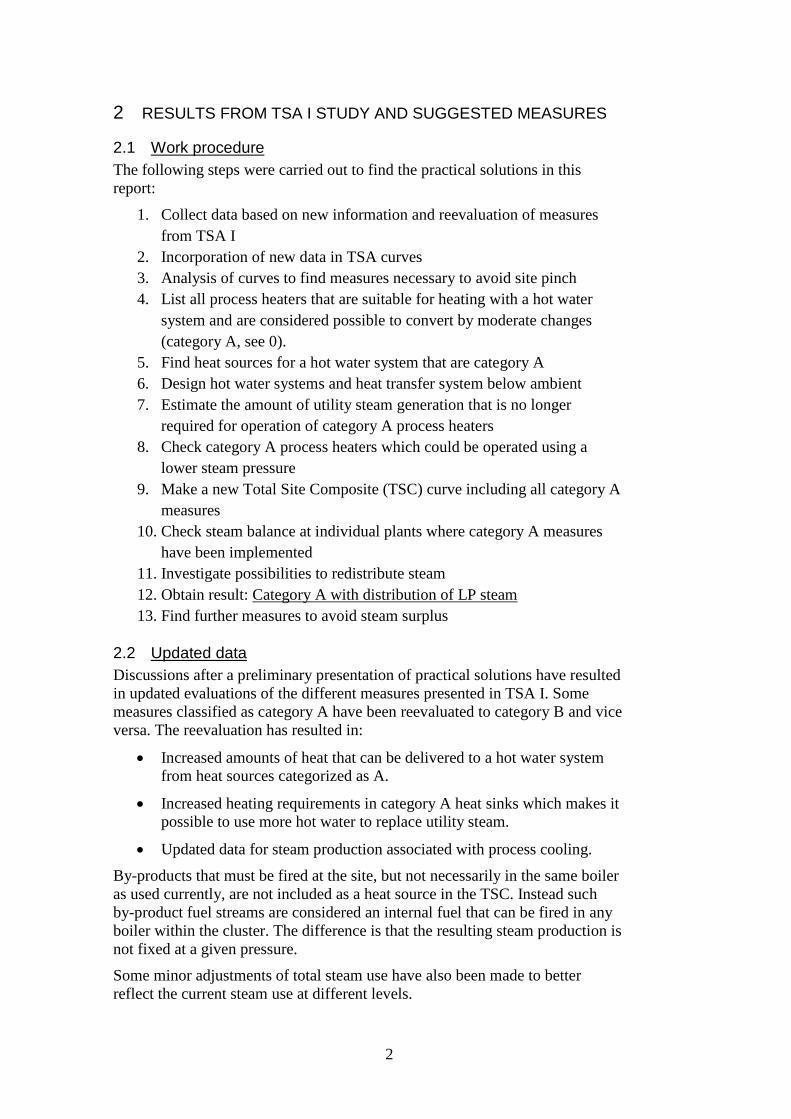
The proposed system designs are based on the concept illustrated in Figure 8,
with a header to which all the hot water is supplied and one header where all
the cold water is collected and fed to the heat sources. Steam and cooling water
can be used to reach the target temperature in case it cannot be achieved with
the hot water system.
AkzoBorealis
PEBorealis
CRIneos Perstorp
Heat sink 2,0 3,3 53,2 3,4 6,2
Heat source 4,8 62,3 11,3 12,8 51,3
0,0
10,0
20,0
30,0
40,0
50,0
60,0
70,0
80,0
90,0M
WHeat source
Category B
11
Figure 8 The hot water systems will have one line supplying the cooled water to the heat
sources and one line supplying the hot water to the heat sinks. Additional cooling or
heating may be necessary.
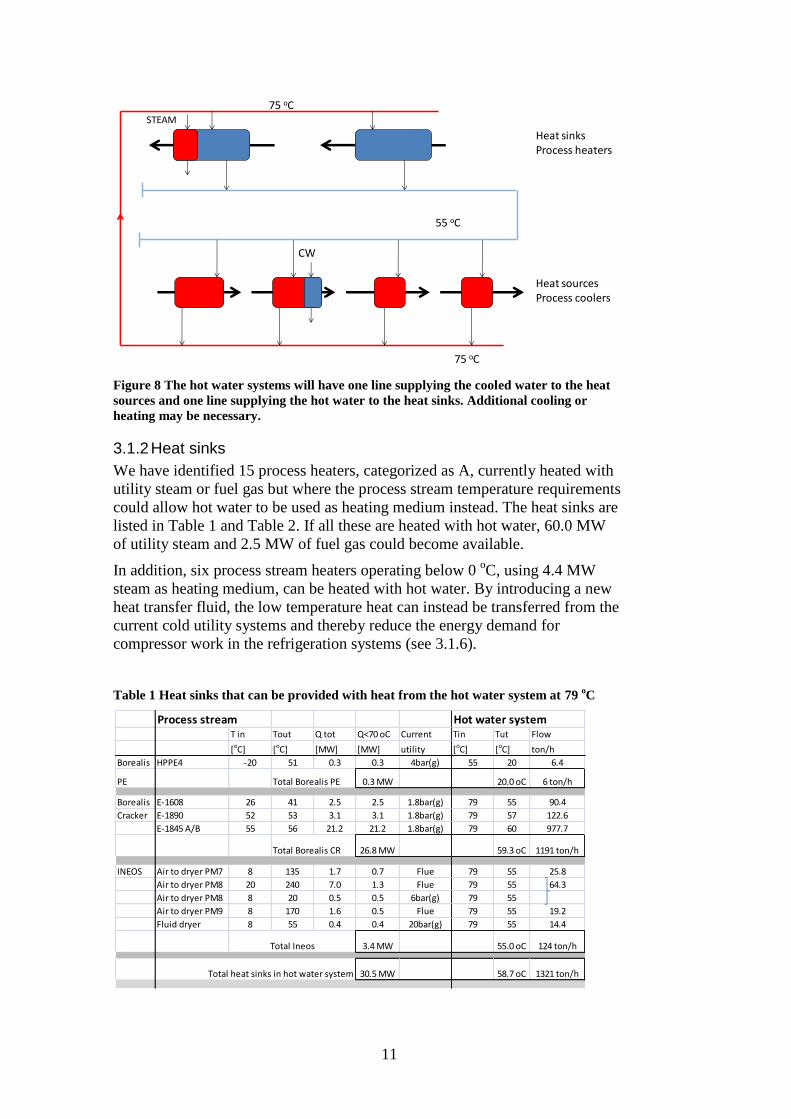
3.1.2 Heat sinks
We have identified 15 process heaters, categorized as A, currently heated with
utility steam or fuel gas but where the process stream temperature requirements
could allow hot water to be used as heating medium instead. The heat sinks are
listed in Table 1 and Table 2. If all these are heated with hot water, 60.0 MW
of utility steam and 2.5 MW of fuel gas could become available.
In addition, six process stream heaters operating below 0 oC, using 4.4 MW
steam as heating medium, can be heated with hot water. By introducing a new
heat transfer fluid, the low temperature heat can instead be transferred from the
current cold utility systems and thereby reduce the energy demand for
compressor work in the refrigeration systems (see 3.1.6).
Table 1 Heat sinks that can be provided with heat from the hot water system at 79 oC
75 oC
CW
55 oC
STEAM
75 oC
Heat sourcesProcess coolers
Heat sinksProcess heaters
Process stream Hot water systemT in Tout Q tot Q<70 oC Current Tin Tut Flow
[oC] [oC] [MW] [MW] utility [oC] [oC] ton/h
Borealis HPPE4 -20 51 0.3 0.3 4bar(g) 55 20 6.4
PE Total Borealis PE 0.3 MW 20.0 oC 6 ton/h
Borealis E-1608 26 41 2.5 2.5 1.8bar(g) 79 55 90.4
Cracker E-1890 52 53 3.1 3.1 1.8bar(g) 79 57 122.6
E-1845 A/B 55 56 21.2 21.2 1.8bar(g) 79 60 977.7
Total Borealis CR 26.8 MW 59.3 oC 1191 ton/h
INEOS Air to dryer PM7 8 135 1.7 0.7 Flue 79 55 25.8
Air to dryer PM8 20 240 7.0 1.3 Flue 79 55 64.3
Air to dryer PM8 8 20 0.5 0.5 6bar(g) 79 55
Air to dryer PM9 8 170 1.6 0.5 Flue 79 55 19.2
Fluid dryer 8 55 0.4 0.4 20bar(g) 79 55 14.4
Total Ineos 3.4 MW 55.0 oC 124 ton/h
Total heat sinks in hot water system 30.5 MW 58.7 oC 1321 ton/h

12
Table 2 Heat sinks that can be provided with heat from the hot water system at 97 oC
3.1.3 Heat sources
Table 3 and Table 4 include all the heat sinks and suggested heat sources. All
heat exchangers included are categorized as A, but all category A heat sources
are not listed. The tables show that there is still a surplus of heat that can be
generated. The cost of the hot water system can be reduced by selecting the
least costly installations. Excess heat can be used for other purposes such as
electricity generation in an ORC(Organic Rankine Cycle) unit and/or delivery
to a district heating network.
Table 3 Heat sources suggested for the hot water system at 79 oC
Process stream Hot water systemT in Tout Q tot Q<90 oC Current Tin Tut Flow
[oC] [oC] [MW] [MW] utility [oC] [oC] ton/h
Borealis V-5804 15 100 3.3 2.9 4bar(g) 100 75 101
PE Total Borealis PE 2.9 MW 75.0 oC 101 ton/h
Borealis E-1609X/ E-1606Y 4 73 2.4 2.4 8.8bar(g) 98 75 234
Cracker E-1606Y 73 83 3.9 3.9 8.8bar(g) 98
E-1802 43 84 4.1 4.1 1.8bar(g) 98 75 152
Demin 44 128 17.6 9.7 1.8bar(g) 98 75 361
Condensate CT1701 40 80 3.0 3.0 1.8bar(g) 98 75 112
Total Borealis CR 23.0 MW 75.0 oC 859 ton/h
Perstorp 1 Gas heater 10 190 0.8 0.4 40bar(g) 98 75 13
24 Reboiler 82 83 5.8 5.8 2bar(g) 98 87 453
Total Perstorp 6.2 MW 86.7 oC 466 ton/h
Total heat sinks in hot water system 32.1 MW 78.8 oC 1426 ton/h
Process stream Hot water systemT in Tout Q tot Q>60 oC Tin Tut Flow
[oC] [oC] [MW] [MW] [oC] [oC] ton/h
Borealis E-441161 101 58 9.2 8.8 55 96.0 184.3
PE E-442161 92 51 15.3 12.0 55 87.0 321.9
E-443201 78 68 14.0 14.0 55 73.0 668.4
E-453357 79 60 6.7 6.7 55 74.0 303.7
Total Borealis PE 41.4 MW 79 oC 1478 ton/h
Borealis E-2 90 40 0.8 0.5 55 85.0 14.4
Cracker E-1701 AX-DX 89 22 12.6 5.5 55 84.0 162.1
Total Borealis CR 6.0 MW 84 oC 177 ton/h
Ineos Condensor HTC kolonn, kylning86 75 0.9 0.9 70 72.4
Condensor HTC kolonn, kondensering75 74 6.0 6.0 55 70.0 344.5
Condensor EDC kolonnen89 40 6.6 3.9 55 84.0 116.2
Total Ineos 10.9 MW 75 oC 461 ton/h
Total heat in 75 hot water system 58.2 MW 79 oC 2115 ton/h

13
Table 4 Heat sources suggested for the hot water system at 97 oC
Process stream Hot water systemT in Tout Q tot Q>80 oC Tin Tut Flow
[oC] [oC] [MW] [MW] [oC] [oC] ton/h
Akzo E-6641 115 113 0.5 0.5 75 110 12.5
Total Akzo 0.5 MW 110 oC 13 ton/h
Borealis E-421433 /434 106 50 0.6 0.3 75 101 9.8
PE HPPE13 105 80 4.7 4.7 75 100 161.9
HPPE25 105 103 6.6 6.6 75 100 226.2
Total Borealis PE 11.6 MW 100 oC 398 ton/h
Borealis E-1712 A/B 123 28 1.0 0.5 75 110 11.2
Cracker Total Borealis CR 0.5 MW 110 oC 11 ton/h
Perstorp 6 Gas cooler 144 35 3.9 2.3 75 110 55.6
9 Gas cooler 100 30 2.9 0.8 75 95 35.7
14 Condensor 116 33 6.9 3.0 75 110 73.6
16 Process cooler 100 82 16.6 16.6 76 95 752.5
34 Condensor 105 33 1.5 0.5 75 100 17.9
37 Process cooler 120 90 0.9 0.9 75 110 22.9
38 Process cooler 112 60 0.7 0.4 75 107 12.0
39 Process cooler 135 105 0.4 0.4 75 110 10.6
47 Flash steem condensor100 99 0.5 0.5 75 95 21.5
49 Condensor 100 99 1.4 1.4 75 95 60.3
52 Condensor 105 35 1.4 0.5 75 100 17.2
56 Condensor 122 120 2.6 2.6 75 110 64.0
58 Condensor 100 95 0.5 0.5 75 95 19.4
65 Rx1 cooler 98 89 4.1 4.1 75 93 201.8
66 Rx2 cooler 98 95 0.6 0.6 75 93 29.5
Total Perstorp 35.2 MW 97 oC 1395 ton/h
Total heat in hot water system 47.7 MW 98 oC 1816 ton/h

14
3.1.4 Hot water system operating between 55 and 79oC
One way to construct a circulating hot water system operating between 55 and
79 oC is shown in Figure 9. The plants involved as heat sources and heat sinks
are Ineos, Borealis polyethylene (PE) and Borealis Cracker (Cr). The figure
also shows that if all the heat sources suggested are used there will be a heat
surplus of 22 MW at 79 oC.
Figure 9 Suggested network for a circulating hot water system operating between 55 and
79 oC.
0.51.8
8.85.5 3.9 6.9
79 oC
CW
55 oC
STEAM
75 oC
6.712
CW
2.5 3.1 21.2
0.3-20oC 50 oC
MW 0.4
40 oC
t/h
1991
124
CW
14
0.7
800
IneosAir, dryer PM 7
IneosCond. HTC
IneosCond. EDC
Borealis CrE-1701 AX-DX
Borealis PEHPPE 4
Excess heat
BorealisCr
E-1608
BorealisCr
E-1890
BorealisCr
E-1845 A/B
Borealis PEE-441161
Borealis PEE-442161
Borealis PE
E-443201
Borealis PEE-453357
IneosAir, dryer PM 8
IneosAir, dryer PM 9
IneosFluid dryer

15
3.1.5 Hot water system operating between 75 and 97 oC
The suggested network operating with a supply temperature of ~100 oC is
shown in Figure 10. Just as in the network at 75 oC, there is more heat
recovered from process than needed for the heat sinks. Approximately 20 MW
of 95 oC water is available for other use.
Figure 10 Suggested network for a circulating hot water system operating between 75 and
97 oC.
97 oC
2.3
Kylvatten
0.8 16.6 0.5 0.9 0.43.0
0.6
75 oC
0.5 1.4 2.6 0.50.4 4.10.5
1395
75 oC
Perstorp39
Perstorp47
Perstorp49
Perstorp52
Perstorp56
Perstorp58
Perstorp65
Perstorp66
Perstorp38
Perstorp37
Perstorp34
Perstorp16
Perstorp14
Perstorp9
Perstorp6
6.6
95 oC
75 oC
97 oC
5.8 0.4 2.4 3.9
MW
0.5 0.5 0.3 4.7
t/h
315
4.1 9.7 3.0
100 oC
110oC110oC 1113
398
2.9
107
513
100oC
989
171087 oC
721 ton/h at 90 oC
Perstorp1
Perstorp24
BorealisCr
E1609x/1606Y
Excess heat
AkzoE-6641
BorealisPEV-5804
Borealis PEE-421433
/434
CW
alt DH
BorealisCr
E-1606Y
BorealisCr
E-1606Y
BorealisCr
Demin
BorealisCr
Cond CT.1701
BorealisCr
E-1712 A/B
Borealis PE
HPPE 13Borealis PE
HPPE 25

16
3.1.6 Heat transfer system below ambient temperature
Five process heaters that operate as heat sinks at sub-ambient temperatures are
currently heated with steam. By recovering cooling capacity with a cooling
media, both steam and compressor work in the refrigeration systems can be
saved. In order to utilize the low temperature a system with a heat transfer fluid
designed for low temperatures can be used. 5.4-6.2 MW of steam are currently
used for these process stream heaters. There are some intermittent heaters
involved and the higher load is when they are in service. The included heat
exchangers are listed in Table 5 and a flow sheet is shown in Figure 11.
Table 5 Heat sinks that operate below ambient temperature
Figure 11 Sub-ambient circulating fluid system. A heat transfer fluid is required for
temperatures below 0 oC. There are fluids (e g SYLTHERM) that can be used to -100
oC.
The heat capacity of this media is 1.7 kJ/kg,K.
In addition to the steam saving, the heat transfer fluid can transport cooling
energy from the current cooling systems and decrease the amount of
compressor work required to operate the existing refrigeration system units.
Process stream Heat transfer systemT in Tout Q tot Current Tin Tut Flow
[oC] [oC] [kW] utility [oC] [oC] ton/h
AGA O2 förångare -135 20 657 28 bar(g) 25 oC -95 oC 11,6
N2 förångare -150 20 150 28 bar(g) 25 oC -95 oC 2,6
Akzo E-113-07-1 -103 40 1000 20bar(g) 45 oC -95 oC 15,1
E-113-07-2 -103 40 1000 20bar(g) 45 oC -95 oC 15,1
Borealis E-735 -10 4 688 1.8bar(g) 25 oC -8 oC 44,1
CR E-736 -30 9 1031 1.8bar(g) 25 oC -28 oC 41,2
E-973 -40 3 667 1.8bar(g) 25 oC -38 oC 22,4
E-961/E-967 -85 20 1046 1.8bar(g) 25 oC -83 oC 20,5
1.030.70
25 oC
2.00 0.66 0.15
MW
0.67
-49 oC
-95 oC-95 oC-38 oC-28oC-8 oC -95 oC
t/h
178
1.05
-83 oC
Borealis CrE-961/7
Borealis CrE-973
Borealis CrE-736
Borealis CrE-735
AGAEFAB AGA

17
Cooling utility at low temperature is costly to produce and there is an incentive
to try to cool these low temperature hot streams with as cold streams as
possible, Figure 12. This suggests that the streams with temperatures below -
90oC should be used in a separate system. A detailed design of how to use the
cold heat transfer liquid has not been conducted.
Figure 12 Energy demand for cooling at sub-ambient temperature increase drastically
with decreasing temperature, thus heat sinks at temperatures below ambient is best used
to cool heat sources at as low temperatures as possible.
3.1.7 Overview of consequences of new heat transfer systems
The introduction of hot water system and heat transfer fluid could avoid the use
of steam and cooling water, see Figure 13. The heat from the heat sources,
formerly emitted to the cooling water will now be used to heat the heat sinks.
Some of the steam used to heat streams well below ambient can be replaced
with heat from cooling systems. 65.4 MW steam and 2.5 MW fuel gas can be
saved by introducing a hot water system and a heat transfer system.
There will be additional reduction in energy use in the cooling system, but this
has not been estimated yet.
-200
-150
-100
-50
0
50
100
0 10000 20000 30000 40000 50000 60000 70000 80000 90000 100000T (°C
)
Q (kW)

18
Figure 13 Introduction of hot water system and heat transfer fluid will avoid the use of
steam and cooling water. The heat from the heat sources, formerly discharged to the
cooling water will now be used to heat the heat sinks. Some of the steam used to heat
streams well below ambient can be replaced with heat from cooling systems. 65.4 MW of
steam and 2.5 MW of fuel gas can be saved by introducing a hot water system and a heat
transfer system.
Table 6 Summery: Utility steam and fuel gas heating replaced by circulating heat
transfer systems
[MW] Steam Fuel gas
Steam replaced by hot water system 60.0
Steam replaced by heat transfer fluid below ambient 5.4
Fuel gas replaced by hot water system 2.5
Total 65.4 2.5
3.2 Steam generation and change of steam pressure
3.2.1 Additional steam generation from excess process heat
Steam generation from excess process heat is well exploited already, but we
have identified some process stream coolers, currently cooled by cooling water,
where released process heat could instead be used to produce steam. The TSC
curve indicates that an additional 25 MW of 2 bar(g) steam can be produced
from recovered process heat. Table 7 lists the three process coolers
categorized as A that can generate an additional 5.8 MW of steam.
Heat sourceProcess cooling
Refrigeration
system
Cooling water
62.5 MW
Heat transfer fluid
5.4 MW
Hot water system
62.5 MW
Current System Increased heat recovery
Heat source Process cooling
Heat sinkProcess heating
Heat sinkProcess heating
Steam 65.4 MW
Fuel gas 2.5 MW

19
Table 7 Stream data for heat sources that can be cooled with boiler feed water and
generate 5.8 MW of steam.
Tin Tut Q [kW] Current utility
Borealis PE HPPE26 228 210 1600 CW
Borealis PE HPPE11 160 145 3550 Air
Ineos Flue gas, cracker furnace 231 100 700 Air
3.2.2 Reducing steam pressure for process stream heaters
Process stream heaters that use utility steam at a higher pressure than
necessary, considering the process stream temperature requirements, were
identified and categorized in the TSA I study. One benefit of reducing steam
use at higher levels is that the potential for co-generation of electric power
increases. A more important reason to reduce steam pressure is that increased
steam demand at lower pressure also facilitates use of excess steam from other
plants. Replacing higher utility steam pressure with 1 or 2 bar(g) steam where
possible in category A process stream heaters could increase the use of low
pressure steam by approximately 20 MW. Hence these are necessary measures
to be able to make use of the surplus steam.
A list of suggested changes can be found in Appendix A.
3.2.3 New steam users
Use of low pressure steam can also be increased by replacing other heating
media.
Flue gas air heaters, currently using heat from fired fuel gas, can be partly be
heated with hot water and steam, and this will increase the use of low pressure
steam. 2.5 MW of hot water and 2.8 MW of low pressure steam will reduce the
fuel gas use by 5.3 MW, see Figure 14.
Figure 14Flue gas heating of air for use in dryers can be replaced by hot water and steam
The total effect of the measures suggested in 3.2 is summarized in Table 8.
Flue gas Flue gasHot water
Steam
2.5 MW2.8 MW
5.1 MW10.4 MW

20
Table 8 Summery: Consequences of changes in steam use
[MW] Steam Fuel gas
Steam generated from process heat 5.8
Increased low pressure steam use when using steam
at lower pressure level
20
Fuel gas replaced by steam +2.8 -2.8
In Table 9 we summarize the results so far, there is a potential to reduce steam
production in boilers with external fuel by 68.4 MW. This would together with
other reductions in fuel gas savings add up to 90.8 MW of avoided use of
external fuel. The analysis assumes that there is a common utility system and
the reduction in external fuel use depends on a redistribution of steam within
the cluster.
Table 9 Summery of 3.1 and 3.2
[MW]
Steam use reduction due to hot water system,
Table 6
65.4
Steam generation from process heat, Table 8 5.8
Steam use increase, Table 8 -2.8
Potential reduction of steam generation 68.4
Corresponding savings in fuel gas with a boiler efficiency
of 0.8
85.5
Other savings of fuel gas: replaced by hot water
replaced by LP-steam
2.5
2.8
Total reduction of fuel gas 90.8
3.3 Redistribution of steam between plants
Part of the steam supplied to the steam system is generated by excess process
heat. If process generated steam is sufficient to cover the process demand at
one plant, steam use reduction at that plant will not correspond to boiler fuel
savings, unless the steam can be redistributed and used elsewhere within the
cluster.
3.3.1 Re-distribution of LP steam within the cluster
Figure 15 shows how LP steam can be distributed within the cluster. The black
dashed lines represent new low pressure steam lines which must be constructed
between the plants.
Most of the gaseous by-products from production processes at Perstorp are
currently used as boiler fuel for steam production on-site. This steam
production is however not necessary if Perstorp can receive 40 MW of low
pressure steam from other plants within the cluster. From a total site
perspective, it is better if this fuel is used in another boiler within the cluster for

21
production of steam at a higher pressure level, thereby providing the
opportunity to co-generate additional electricity, for example.
Figure 15 The steam surplus of low pressure steam at Borealis can be delivered to the
other plants. The heat flows indicated in the figure are the amounts of steam that can be
distributed if the category A measures are implemented.
The steam distribution schematic shown in Figure 15 is based on the steam
balances that apply if all the category A measures are implemented.
3.4 Results if category A measures are implemented together with redistribution of LP steam
Identifying possible ways to save purchased fuel is the ultimate goal of a total
site analysis. The results from the theoretical study indicate that the present
external heat demand of 125 MW can be reduced to 58 MW if all category A
measures are implemented, see Figure 3.
Using the data received for the current steam systems, steam produced in
boilers is estimated to 126 MW. After low pressure steam redistribution, the
steam demand from boilers could be reduced by 67 MW and the new steam
production would be 59 MW. This includes steam from by-products from
Perstorp (27 MW) that must be fired within the cluster (but not necessarily at
Perstorp’s site).
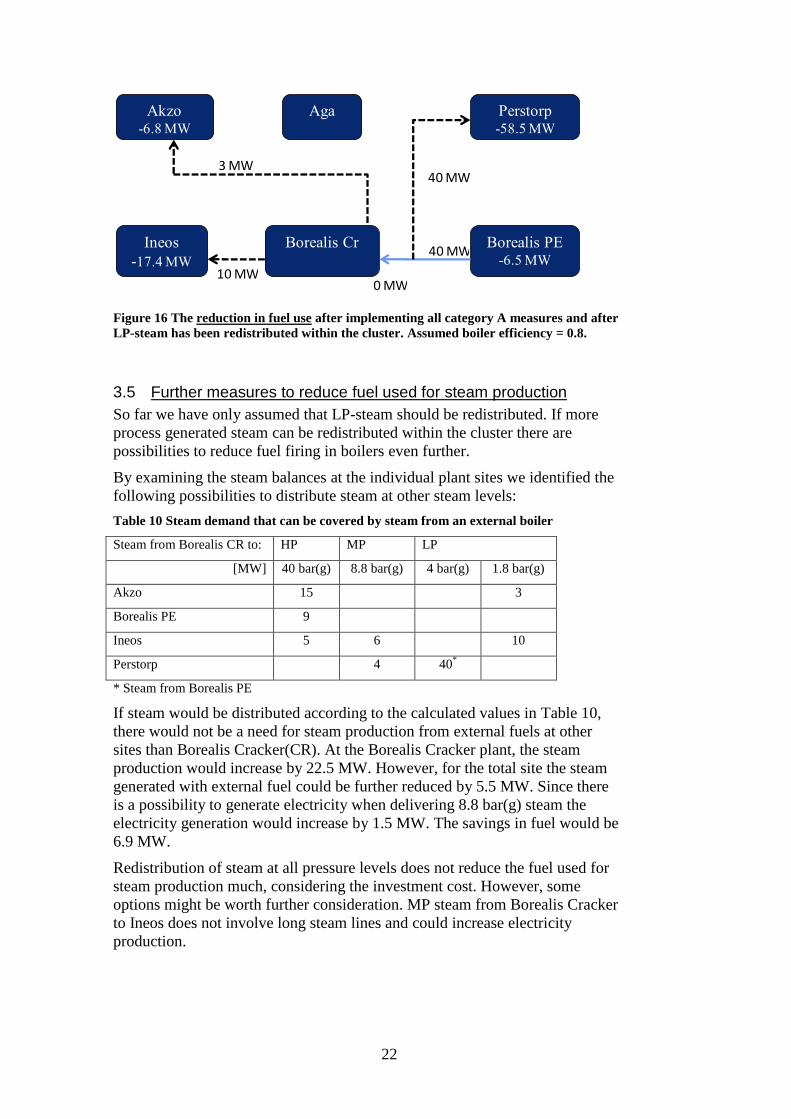
The total potential for fuel reduction in Table 9 was 90.8 MW. Figure 16
shows where the use of external fuel will be reduced based on the individual
steam balances, and the total reduction of fuel use would be 89.2 MW. The
difference between actual and potential fuel reduction indicates that when these
measures are implemented, there would be an excess of low pressure steam at
the total site.
Akzo
Ineos
Perstorp
Borealis PE
Aga
Borealis Cr
New steam lines
Existing line
10 MW
40 MW
0 MW
3 MW
40 MW
22
Figure 16 The reduction in fuel use after implementing all category A measures and after
LP-steam has been redistributed within the cluster. Assumed boiler efficiency = 0.8.
3.5 Further measures to reduce fuel used for steam production
So far we have only assumed that LP-steam should be redistributed. If more
process generated steam can be redistributed within the cluster there are
possibilities to reduce fuel firing in boilers even further.
By examining the steam balances at the individual plant sites we identified the
following possibilities to distribute steam at other steam levels:
Table 10 Steam demand that can be covered by steam from an external boiler
Steam from Borealis CR to: HP MP LP
[MW] 40 bar(g) 8.8 bar(g) 4 bar(g) 1.8 bar(g)
Akzo 15 3
Borealis PE 9
Ineos 5 6 10
Perstorp 4 40*
* Steam from Borealis PE
If steam would be distributed according to the calculated values in Table 10,
there would not be a need for steam production from external fuels at other
sites than Borealis Cracker(CR). At the Borealis Cracker plant, the steam
production would increase by 22.5 MW. However, for the total site the steam
generated with external fuel could be further reduced by 5.5 MW. Since there
is a possibility to generate electricity when delivering 8.8 bar(g) steam the
electricity generation would increase by 1.5 MW. The savings in fuel would be
6.9 MW.
Redistribution of steam at all pressure levels does not reduce the fuel used for
steam production much, considering the investment cost. However, some
options might be worth further consideration. MP steam from Borealis Cracker
to Ineos does not involve long steam lines and could increase electricity
production.
Akzo-6.8 MW
Ineos
-17.4 MW
Perstorp-58.5 MW
Borealis PE-6.5 MW
Aga
Borealis Cr
10 MW
40 MW
0 MW
3 MW
40 MW

23
Figure 17 Fuels savings/increase at the separate sites if steam at all steam levels is
distributed according to the figure.
Akzo
-24 MW
Ineos
-30 MW
Perstorp
-63 MW
Borealis PE
-6.5 MW
Aga
Borealis Cr
+28 MW
HP – 40 bar(g)
MP – 9 bar(g)
LP – 1.8/4 bar(g)
Existing lines
HP 10 MWMP 6 MWLP 5 MW
HP 15 MWLP 3 MW
MP 4MWLP 40 MW
HP 9 MW

24
4 SUMMARY OF RESULTS IF ALL CATEGORY A MEASURES ARE IMPLEMENTED
If all the proposed measures listed as category A are implemented fuel gas use
can be reduced by 89 MW.
Implementation of the following measures is necessary to reach the potential
savings:
A hot water system and heat transfer circuit that will recover heat from
process heat and deliver 65.4 MW heat to heat sinks currently heated by
steam and 2.5 MW heat to heat sinks currently heated with fuel gas
Utilizing process heat to generate 5.8 MW of steam
Redistribution of low pressure steam within the cluster to avoid steam
excess at one or several plants
Conversion of identified process stream heaters (see Appendix A)
where low-pressure steam can be used as heating medium, instead of
the higher pressure steam used today. This will increase the possibility
to transfer more low-pressure steam
Gaseous by-product gases currently fired in Perstorp boilers must be
fired in a boiler at a different process plant
If steam at pressures above low pressure steam can be redistributed the total
use of fuel gas can be reduced further.
Figure 18 Resulting demand for steam and fuel when all category A measures are
implemented
Figure 19 show the reduced steam production as black bars at different steam
pressure levels. Also shown is the steam demand at each pressure level to the
right (blue bar), steam generated from excess process heat or incineration of
by-products (red bar), steam generated in boiler with external fuel (green bar)
and avoided steam production after implementing category A measures (black
bar).
0,0
20,0
40,0
60,0
80,0
100,0
120,0
140,0
160,0
180,0
Current situation Category A measures with redistrubution of LP steam
MW
Steam
Fuel

25
Figure 19 The figure shows steam demand at each pressure level to the right (blue bar),
steam generated in process by excess heat or incineration of by-products (red bar), steam
generated in boiler with external fuel (green bar) and avoided steam production after
implementing category A measures (black bar).
Figure 20 shows all the new suggested exchange of energy between the
different process plants within the Stenungsund industrial cluster. The heat to
the process heaters below ambient is not shown, since the heat sources have not
been specified. Fuel from Perstorp and Borealis PE can go to any boiler and
not necessarily to the Borealis Cracker.
Figure 20 Energy transfer between the participating plants
-250.0 -200.0 -150.0 -100.0 -50.0 0.0 50.0 100.0 150.0 200.0 250.0
1
1.8
2.7
4
6
8.8
10
14
18
28
40
40
1 1 1.8 2 2.7 3 4 5 6 7 8.8 9 10 11 14 20 18 20 28 28 40 40 40 85
Steam demand[MW] 2.8 11.1 43.5 45.6 4.7 8.0 6.7 9.4 6.1 5.3 178.1 1.3 10.4 6.2 9.9 26.9 4.1 2.6 2.8 4.9 16.6 9.1 7.0 217.0
Steam gen. in process [MW] 0.0 -0.6 -50.0 -5.3 -10.7 -43.7 -0.7 -0.6 0.0 -185. -13.4-18.9 -32.4 -4.5 0.0 0.0 0.0 -5.5 -21.4-195.
Steam gen. by external fuel [MW] -3.6 -10.3-14.0 0.0 -30.7
Avoided steam production [MW] 0.0 0.0 0.0 0.0 0.0 0.0 0.0 0.0 0.0 0.0 0.0 0.0 0.0 0.0 -19.6 0.0 0.0 0.0 0.0 -9.7 -5.4 -5.2 -27.2 0.0
Total site - Steam exchange, category A[MW]
-67 MW
Steam pressure, bar(g)

26
Losses in long steam lines are neglected in this report but might have a
significant influence on the amount of steam delivered between the plants.
Therefore it should be taken into account in a later stage.

27
5 COST ESTIMATE
5.1 Investment
Investment in new heat exchangers, pipes for redistribution of steam,
condensate return pipes, fuel and hot water distribution will be needed to
implement all category A measures and to achieve the savings calculated in
this report.
Further process design has to be carried out to find out in detail the size of new
heat exchangers, possibilities to use old heat exchangers and to estimate other
changes to the utility systems. To get an approximate estimate, the investment
has been calculated with the following assumptions:
Table 11 Unit cost for heat exchangers and piping
Average cost of new heat exchanger 1.3 MSEK
Hot water pipes between plants 7 kSEK/m
Heat transfer pipes (below ambient) 10 kSEK/m
Steam + condensate pipes, diameter ~500 mm 35 kSEK/m
Steam + condensate pipes, diameter ~250 mm 15 kSEK/m
Fuel pipe 5 kSEK/m
Approximate heat exchanger areas were calculated for most of the included
heat exchangers (listed in Appendix B) in order to estimate an investment cost
to use at this stage. The area calculations are based on the temperature
difference between the process stream and utility and with general values for
heat-transfer coefficient for heat exchangers. There was no consideration taken
to material requirements or other process specific requirements. The aim of
such calculations was to get an approximate investment cost and not to be a
first step in a process design.
To be able to heat and cool with new utility (hot water and heat transfer
system), and to use lower steam pressure level in some exchangers, we assume
that 62 new heat exchangers have to be installed.
Transfer lines for all the energy transferred within the cluster indicated in
Figure 20 (hot-water system, heat transfer system below ambient, steam
transfer and condensate return and fuel) are included in Table 12 using unit
costs from Table 11.
The total investment adds up to 663 MSEK, see Table 12.

28
Table 12 Investment cost for the total project
5.2 Operation costs
If all Category A-measures are implemented there will be changes in operation
costs, see Table 13. All costs are estimated assuming 8400 full load operating
hour per year.
The reduction of steam use will result in a reduction of fuel fired in boilers and
fired heaters. The reduction is 89 MW and the economic value of such savings
is calculated with two values of fuel cost. One is the value today, 270
SEK/MWh, resulting in a reduction of operation cost of 200 MSEK/yr. The
savings is also calculated with a future value based on the energy scenarios
developed at Chalmers2. This future fuel price is set to 350 SEK/MWh and
would result in a reduction of operation cost of 260 MSEK/yr. The fuel cost
values include the cost for TEP (tradable emission permits), i.e. cost associated
with CO2 emissions in the EU Cap-and-Trade system.
The hot water system pump around and transportation of other fluids such as
condensate and fuel requires electricity for pump work. The pump work is
estimated to 700 kW. With an electricity price of 600 SEK/MWh, the annual
cost would be 4 MSEK/yr.
Maintenance is calculated as 2 % of the total investment cost, 13 MSEK/yr.
The introduction of hot water systems would reduce the energy transferred to
the cooling water system and where cooling towers are used, it would reduce
the demand for make-up water. Considering the situation with limited fresh
water available, this would be valuable to the cluster. This value has, however,
not been translated to an income in this cost estimate.
2 Simon Harvey and Erik Axelsson. ”Scenarios for assessing profitability and carbon balances
of energy investments in industry”. AGS Pathways report 2010:EU1. AGS, The Alliance for
Global Sustainability, Chalmers, Göteborg, 2010
Total cost
Equipment [MSEK]
Heat exchangers 80
Pumps 1
81
Total cost, installed 198
Pipelines
HW1 16
HW2 28
HTr 10
Steam/condensat Borealis PE-Perstorp 88
Steam/condensat Borealis Cr-Akzo 12
Steam/condensat Borealis Cr-Ineos 28
Fuel from Perstorp 13
194
Total cost installed 393
Total cost inc. Design & Engineering 510
Total cost inc. 30 % contingency 663

29
Table 13 Annual operation costs if Category A-measures are implemented. The operation
cost is calculated using two values, todays price and a future fuel price.
Value of fuel saved [SEK/MWh] 270 350
Electricity [SEK/MWhel] 600 800
Reduction in fuel use -89 MW -200 -260
Pump work 700 kW 4 5
Maintenance cost 2 % of investment 13 13
Net per year, [MSEK/yr] -183 -242

30
APPENDIX A
List of heat exchangers where steam pressure can be reduced, category A
Tin Tout Q kW today change to
Akzo E-6430 94 95 1135 6bar(g) 1 bar(g)
Akzo E-6450 85 86 1343 6bar(g) 1 bar(g)
Akzo E-6650 162 167 714 20bar(g) 9 bar(g)
Akzo E-6640 152 151 579 20bar(g) 9 bar(g)
Borealis PE HPPE16 61 150 2090 11bar(g) 4 bar(g)
Ineos Återkokare i HCl kolonn 86 87 1488 10bar(g) 1 bar(g)
Ineos Värmning feed till VCM kolonn 86 89 496 10bar(g) 1 bar(g)
Ineos Värmning före stripper 75 88 331 10bar(g) 1 bar(g)
Ineos Direkt anga till PM stripper 99 100 496 10bar(g) 1 bar(g)
Ineos Luft till strömtork PM 9 8 170 1645 Flue 1 bar(g)+10 bar(g)
Ineos Luft till strömtork, PM7 8 135 1737 Flue 1 bar(g)+ 6 bar(g)
Ineos Luft till spridarskivetork 20 240 7507 Flue 1 bar(g)+40 bar(g)
Ineos IA stripping värmning av feed 75 103 728 6bar(g) 1 bar(g)
Ineos Strip-ånga 104 105 265 6bar(g) 1 bar(g)
Ineos Återkokare Azeokolonn 129 130 3638 10bar(g) 6 bar(g)
Ineos Värmning reaktorer 60 90 496 6bar(g) 1 bar(g)
Ineos Värmning reaktorer 60 90 331 6bar(g) 1 bar(g)
Ineos Värmning reaktorer 50 90 562 6bar(g) 1 bar(g)
Perstorp 2 90 190 714 40bar(g) 2bar(g)+ 40 bar(g)
Perstorp 13 108 115 3500 7bar(g) 2bar(g)
Perstorp 15 111 113 1600 14bar(g) 2bar(g)
Perstorp 31 100 105 460 7bar(g) 2bar(g)
Perstorp 50 103 105 660 14bar(g) 2bar(g)
Perstorp 57 100 105 500 14bar(g) 2bar(g)
Perstorp 72 85 200 3900 40bar(g) 2bar(g)+ 40 bar(g)
Perstorp 77 80 120 2000 7bar(g) 2bar(g)
Perstorp 81 109 110 4000 7bar(g) 2bar(g)

31
APPENDIX B
List of heat exchangers where area has been calculated to use as a basis for
investment cost calculations. The current area is included in the table for a few
heat exchangers.
HXTR Location Tin Tout m Tin Tout Q U A current A HXTR costs Comments
[°C] [°C] [ton/h] [°C] [°C] [kW] [W/m2C] [m2] [m2] [SEK]
Hot water circuit (76/55)
Heat sources all HXTR use carbon steel
E443201 Borealis PE 55 73 668,4 78 68 13970 200 8343 11104006 Jacket reactor/Shell and tube assumed
E443357 Borealis PE 55 74 303,7 79 60,5 6699 700 1824 2427999 Shell and tube single pass assumed
HPPE13 Borealis PE 55 100 90 105 80 4700 700 540 719137 Shell and tube single pass assumed
E-1701 AX-DX Borealis Cr 55 84 162,1 89 60,5 5458 200 5202 6923731 Shell and tube single pass assumed
E-1703 A/B Borealis Cr 55 77 142,6 82 60,5 3643 200 3472 4621318 Shell and tube single pass assumed
Kondensor HTC kolonnINEOS 55 70 344,5 75 74 6000 650 576 903 1202080 Shell and tube single pass assumed
Heat sinks
E-1845 A/B Borealis Cr 76 58 1060,3 55 56 21230 700 3550 4725392 Shell and tube single pass assumed
Preheat demin Borealis Cr 76 60 326,2 44 73 6090 700 1120 1491051 Shell and tube single pass assumed
E-1609X/E-1606Y Borealis Cr 76 51 81,6 4 73 2377 700 212 366016 Shell and tube single pass assumed
E-1890 Borealis Cr 76 59 163,1 52 53 3090 700 334 532387 Shell and tube single pass assumed
HPPE4 Borealis PE 58 31 8,2 -20 51 260 700 17 66548 Shell and tube single pass assumed
Luft till spridarskivetorkINEOS 70 32 40 20 60 1771 200 807 1074395 Shell and tube single pass assumed
Luft till strömtork PM9INEOS 70 47 20 8 60 528 201 123 282831 Shell and tube single pass assumed
Luft till strömtork PM7INEOS 70 62 20 8 60 711 200 157 332742 Shell and tube single pass assumed
Hot water circuit (90/70)
Heat sources
6 Gaskylning Perstorp 20 25 48,7 144 75 2967 200 116 981 1109380 U-tube assumed/ corr. factor 0,85
9 Gaskylning Perstorp 70 95 28,5 100 75,5 1657 200 57 1579 1786685 U-tube assumed/ corr. factor 0,85
14 Kondensor Perstorp 70 105 73,6 116 75 4655 650 268 941 1064681 U-tube assumed/ corr. factor 0,85
56 Kondensor Perstorp 70 110 60,5 122 120 2600 650 92 153 282831 U-tube assumed/ corr. factor 0,85
37 Processkylare Perstorp 70 110 21,6 120 90 930 500 41 129 240406 U-tube assumed/ corr. factor 0,85
39 Processkylare Perstorp 70 110 9,3 135 105 430 500 8 41 113132 U-tube assumed/ corr. factor 0,85
47 Flashånga kondensorPerstorp 70 95 17,2 100 99 500 1000 6 38 113132 U-tube assumed/ corr. factor 0,85
58 Kondensor Perstorp 70 95 15,5 100 95 450 650 15 68 169698 U-tube assumed/ corr. factor 0,85
65 Rx1 kylare Perstorp 70 93 153,5 98 89 4100 650 601 680472 U-tube assumed/ corr. factor 0,85
Rx2 kylare Perstorp 70 93 22,5 98 95 600 650 74 169698 U-tube assumed/ corr. factor 0,85
Heat sinks
E-1606Y Borealis Cr 87 77 315,7 73 83,5 3875 200 5174 6886879 Shell and tube single pass assumed
E-1802 Borealis Cr 87 61 90,2 43 84 4055 200 2422 3223418 Shell and tube single pass assumed
1 Gasvärmare Perstorp 101 87 22,6 10 90 357 200 13 71 169698 U-tube assumed/ corr. factor 0,85
24 Återkokare Perstorp 101 89 428,5 82 83 5800 700 108 723 961890 Shell and tube single pass assumed
Cooling media transfer system
Heat sources
-
Heat sinks
LPG-heater Borealis Cr 25 -8 44,1 -10 4 688 650 131 282831 Shell and tube single pass assumed
Propane heater Borealis Cr 25 -28 41,2 -30 9 1031 650 236 366016 Shell and tube single pass assumed
Propylene heaterBorealis Cr 25 -38 22,4 -40 3 667 650 123 282831 Shell and tube single pass assumed
Ethylene vaporizer(EFAB)Akzo Nobel 25 -95 35,3 -103 20 2000 700 448 632209 Shell and tube single pass assumed
Förångare, O2 AGA 25 -100 11,1 -135 20 657 700 61 183008 Shell and tube single pass assumed
Förångare, N2 AGA 25 -100 2,5 -150 20 150 700 11 49911 Shell and tube single pass assumed