Embed Size (px)
Citation preview

Trying to make wise crowds, even wiser.
Name: Koen de Bruijn
Supervisor: Uyanga Turmunkh
Student number: 350179
Study: Bachelor Economie en Bedrijfseconomie
Date: 25-03-2015

Koen de Bruijn - 2015 Trying to make wise crowds, even wiser.
3
Contents Table of content..………………………………………………………………………………………………………………………3
Preface .......................................................................................................................................................................... 4
Introduction ................................................................................................................................................................ 5
Related Literature ..................................................................................................................................................... 8
Experimental Design.............................................................................................................................................. 11
Results ......................................................................................................................................................................... 13
Additional Analysis 1: Can self-reported experts outperform the crowd? ................................... 18
Additional Analysis 2: Are smaller groups sufficient? .......................................................................... 20
Concluding Discussion ......................................................................................................................................... 21
Bibliography ............................................................................................................................................................. 24
List of Figures ........................................................................................................................................................... 26
List of Tables ............................................................................................................................................................. 26
Appendix .................................................................................................................................................................... 27
Koen de Bruijn - 2015 Trying to make wise crowds, even wiser.
4
Preface
My name is Koen de Bruijn, I am 23 years old and an undergraduate student at the Erasmus University
of Rotterdam. To receive my bachelor’s degree, I am asked to write a thesis in the field of my
preference. Resulting from my ‘minor’ Behavioral Finance, I’ve grown an interest in the field of
Behavioral Economics. The psychology in the field of Economics is what attracted me the most. I
therefore decided to write my thesis in this field. Just before the first meeting with my supervisor, I
read a paper about the ‘wisdom of crowds’. It immediately awakened a certain interest. Mainly due
to the fact that this had been a theory that has proven to be accurate quite a few times, but had
never been confirmed.
If not for Mrs. Turmunkh, I would still be looking for a hypothesis. Via series of meetings and feedback
rounds, she guided me through the process of writing a thesis. Special thanks to her and the time
she spent on this paper as well. It resulted in a better paper for it.
Thanks go out to my parents as well, supporting me during the time I needed it the most. Motivation
to continue working on this paper hasn’t always been optimal, but the support they gave me
definitely helped me to bring it to a better result.
There are 3 people co-reading this paper, to cross the t’s and dot the i’s. Frank Barendse, Brenda
Vermeulen and Peter de Bruijn helped me to implement the finishing touches. I’m very grateful of
their opinions.
Finally I’d like to thank all the people that participated in my experiment. Theories are nice to come
up with, but without actual data produced by people, I couldn’t have found any answers on my own.
Maassluis, 25-03-2015
Koen de Bruijn

Koen de Bruijn - 2015 Trying to make wise crowds, even wiser.
5
Introduction
The topic of this paper is the phenomenon called ‘the Wisdom of Crowds’. Before Francis Galton
(1907) published his paper ‘Vox Populi’, people believed that a single expert was wiser than an entire
crowd of non-experts. His paper, however, showed for the first time evidence that the average answer
of a large crowd could be remarkably accurate. Since Galton’s (1907) findings, the phenomenon of
‘Wisdom of Crowds’ has been proven to be true by many studies. Griffiths and Tenenbaum (2006)
and Mozer, Pashler and Homaei (2010) survey these studies.
The mechanism behind the idea of ‘Wisdom of Crowds’ is simple. If the sample size is large and
diverse enough, the errors of individual estimates will cancel out, leaving the average of the estimates
quite close to the true value. This average is the product of numerous thought processes. Every
thought process has its reasons to either over- or underestimate the true value. If the individual
errors are unrelated, it could be said that every overestimate has an underestimate of about the same
magnitude. If this would be compared to the guess of a single expert, there is nothing to cancel out.
The classic example described by Francis Galton (1907) is that of an ox-weighing at a local farmers’
market. Here, 800 people were asked to fill out a ballot, guessing the weight of an ox that was
presented. Important to mention here is that the crowd did not consist of just butchers (experts),
but of many ordinary people (non-experts) as well. After eliminating 13 guesses for various reasons,
Galton (1907) learned that the average guess was 1207 lbs., which was just 9 lbs. away from the
actual number 1198 lbs. This is a 0.8% difference, making it a remarkably accurate ‘guess’.
The tasks performed by the crowd, however, can also be more complex. Surowiecki (2005) gave an
interesting example of such a potentially complex task in his book ‘The Wisdom of Crowds’. The task
was to guess where in the Atlantic Ocean a submarine might be that had gone missing. Because it
was hard to give an accurate estimate of where the submarine would be, Officer John Craven asked
many people, with expertise in different areas, questions concerning the submarine. Questions such
as ‘How fast was the submarine going’, ‘What was the steepness of its descent’, and so forth. After
Koen de Bruijn - 2015 Trying to make wise crowds, even wiser.
6
the answers were collected, they were fed into a formula that combined all bits of information to
one single answer. After the submarine was found 5 months later, it turned out that the estimate
based on Craven’s crowd’s guesses was only 220 yards off from the actual place where the submarine
was found. (Sontag & Drew, 2000)
This example gives rise to an intriguing question, which is the focus of my paper. If Officer John
Craven had asked his crowd a different question, namely ‘Where is the lost submarine?’, would the
average guess have been as accurate as the estimate that used the average guesses on simpler
questions that were actually posed? We’ve seen that crowds can give accurate answers to easy
questions when the guesses are combined. More complex questions, however, might be better to be
broken down into multiple but easier questions. In my paper, I would like to compare the two types
of questioning in order to find out what type of questioning provides a better result; one complex
question or multiple easy questions.
To be able to compare the two types of questioning, I conducted an experiment where the task can
be answered via both ways. I used the classic ‘jellybeans-in-a-jar’ type of experiment. The main task
in the experiment was to estimate the number of marbles in a transparent container. The participants
(crowd) were asked questions in two ways. The first way was to answer the general question of how
many marbles there are in the container. The second type of questioning consisted of questions
concerning the width, height, and depth of the container, and the diameter of a single marble. In the
second type of questioning, the number of marbles was then estimated by inputting the crowds’
average estimates of width, height and length of the container and the marble’s diameter into a
standardized formula. I would like to see if it is possible to make crowds wiser by simplifying the
question. Thus, the research question is:
Given that the theory of ‘the Wisdom of Crowds’ holds, can we make the average guess of a
crowd even better by posing the single possibly complex question as multiple simpler
questions?
Koen de Bruijn - 2015 Trying to make wise crowds, even wiser.
7
Via a one-sample T-test the first preliminary, the presence of ‘the wisdom of crowds’, is proven. When
we will look at the answers to the complex question, however, we see a big spread, like the theory
predicts. Combining the four averages (height, width and length of the container and the diameter
of a marble) of the ‘easy’ questions, we find answers that are almost double of the actual number of
marbles. One possible explanation given is guessing the diameter of a marble might not be an as
easy question as it might appear. Calculating the average with this fourth ‘easy’ variable as given, we
do see a better calculated guess than the answer to the complex question.

Koen de Bruijn - 2015 Trying to make wise crowds, even wiser.
8
Related Literature
The literature on ‘the wisdom of crowds’ generally distinguishes two types of tasks: easy questions
and complex questions.
An example of an easy question is provided by Gordon (1924). She asked 200 students to arrange
bottles according to his or her estimate, from heaviest to lightest. Her main goal was to find out if it
is possible for a group of people to judge any better than the average member of that group of
people. Results show that groups are distinctly superior to the average member, and are equal to
those of the best members.
Stroop (1932) continued on the work of Gordon (1924). He performed the same test, with roughly
the same results. Additional experiments were done as well. He combined judgments by the same
individual, did the same experiment with more bottles and changed the arrangements of the weights
to avoid judgment factors. Yet again, although with slightly different numbers, Stroop (1932) drew
the same conclusions, confirming the work done 8 years earlier. Stroop did put a very important side
note in his paper. He warned for the fact that any peculiar characteristic, that is generally common
to the group, will be exaggerated. This meant that a group needed to be as diverse as possible for
this type of experiment to be a success. If the entire group has a specific trait, biases do not cancel
out anymore.
Kelley (1925), a statistician, also placed the work of Gordon (1924) under a microscope. He concluded
that Gordon’s work was a success, due to the little intentional depth. With intentional depth is meant
the level of influence the outcome has on real life events. A higher level of intentional depth can
therefore mean a crowd can relate more to the problem and knows the consequences. Zajonc (1962)
did his research on the opposite side of the spectrum, experiments with a high level of intentional
depth. The presence of intentional depth, increases personal stimuli, which results in biased results.
The conclusion Zajonc (1962) draws is that with a higher intentional depth, the judgment of crowds

Koen de Bruijn - 2015 Trying to make wise crowds, even wiser.
9
only surpasses the accuracy of individuals in the most simple of tasks. Thus, Zajonc (1962) hinted
that the crowd may not be as wise when performing a complex task.
Shaw (1932) considers a complex problem. However, in the study groups could interact. Shaw (1932)
performed an experiment such that the problems were impossible for an individual to answer
correctly by a sudden insight of the situation. The tasks were performed by individuals, as by small
groups. The experiment existed of a series of actions, namely drawing schematics, done by each
group or individual. Compared to answers of individuals, groups came up with more correct
solutions. It turned out that groups corrected each other’s errors early on in the experiment.
To compare the complex problems, to the easy problems, however, we need comparable tests.
Smith’s (1930) test used a similar method as Gordon (1924). Instead of comparing weights,
participants judged records of the behavior of a child of seven years old. Participants were asked to
fill out a form consisting of behavior types and personality traits. The conclusion drawn by Gordon
(1924), was not discovered here. Two reasons, however, were given. The problem in this experiment
could lie in the definitions of traits by the observers and participants, or in the length of the list of
traits.
To summarize, crowds seem to perform well in simple tasks. In this paper, I investigate the possibility
of improving crowd’s performance in complex tasks by breaking down the complex problem into
multiple, simple problems.
Evidence of the wisdom of crowds for a complex problem without interaction was given not too long
ago. Yi et al. (2012) investigated two kinds of questions. He looked at the difference between a
‘Minimum Spanning Tree Problem’ (MSTP) and a ‘Traveling Salesperson Problem’ (TSP). Here each
individual had to draw a specific pattern. The goal was to do it in the shortest distance possible. The
difference between the two is that in the first case it is allowed to cover the same dot twice, but in
the second case it is not. Here each question was posed to individuals. To come to a combined
answer, they used local aspects of solutions that were common across individuals. This means that

Koen de Bruijn - 2015 Trying to make wise crowds, even wiser.
10
connections that were made the most, were selected over others. Performances of the local
decomposition aggregation method solutions were drastically better than most individuals. This
paper consists of a complex task. The answer, however, is constructed of multiple, simpler choices.
My paper tries to perform a similar task, were the focus is evenly distributed between the two types
of questioning.

Koen de Bruijn - 2015 Trying to make wise crowds, even wiser.
11
Experimental Design
To test whether the wisdom of crowds can be improved by reducing a complex single-factor
problem to a simpler multi-factor problem, I needed an experimental task that was flexible enough
to allow this. I was therefore searching for a task that could be presented both as a single-factor,
complex problem and as a multi-factor, easy problem. The classic ‘jellybeans-in-a-jar’ paradigm has
this flexibility. It fits the requirements to fall in the single-factor problem category. The complex task
in my experiment will be to estimate the number of marbles in a container. On the other hand, the
‘jellybeans-in-a-jar’ paradigm also allows for presenting the task as multiple easy problems. This kind
of presentation of the problem will in my experiment be to divide the question up; instead of
estimating the number of marbles in a container, the multi-factor task will be to estimate separately
the height, length and width of the container as well as the diameter of a single marble. Averages of
these estimates are then used as inputs into a formula for computing the number of marbles in the
container. Finally, I investigate whether the computed estimate (crowd’s performance on the multiple
easy tasks) is more accurate than the guessed estimate (crowd’s performance on the complex task).
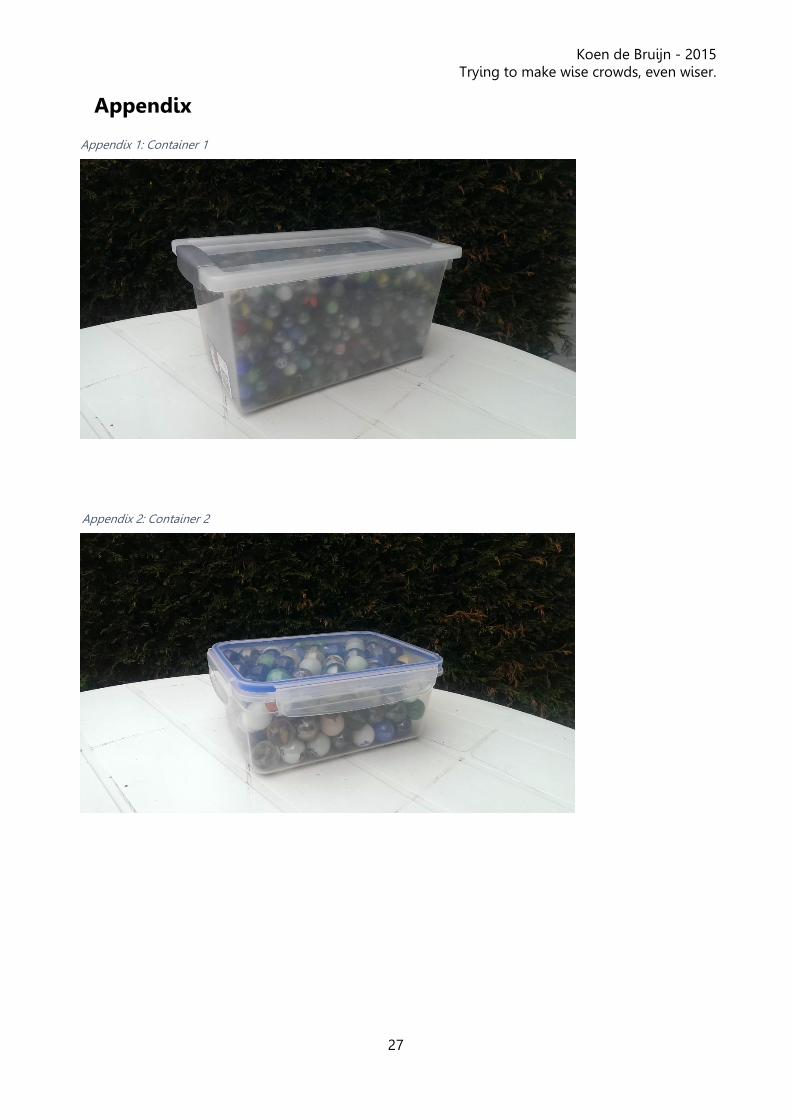
Participants were presented with 2 different containers (see Appendix 1 and 2). Container 1 was
25.5cm long, 14.8cm wide, and 14.8cm tall. Container 1 contained 361 marbles each with diameter
27 mm. Container 2 was smaller: 20.5cm long, 13.8cm wide, and 9.8cm tall. It contained 643 marbles
of diameter 16mm. Each participant was asked to fill out a questionnaire per container (see Appendix
3). While filling out the questionnaires, participants were prohibited from talking amongst each
other, nor to touch the container. After filling out the questionnaire, they were asked not to talk
about the experiment with those who had not filled out the questionnaires yet. In order for everyone
to give their truthful opinion, participants were offered real incentives: prizes were awarded to those
who gave the most accurate estimates. Offering real monetary incentives for accurate estimates was
also meant to encourage participants to keep their own private data to themselves. Independence
of individual estimates, in addition to their diversity, is another key element in wisdom of crowds.
Koen de Bruijn - 2015 Trying to make wise crowds, even wiser.
12
A total of 200 individuals participated in the experiment. The participants consisted partly of the
author’s coworkers at a local bank and partly of athletes at a local sports club. Using bankers and
athletes was meant to enhance representativeness of the participant pool and to create diversity,
which is considered to be a key element in wisdom of crowds.
For participants that might have additional information about the question at hand, the
questionnaire also asks participants whether they believe that they are in the top 10% of all guesses,
and if so, whether they are willing to bet on this belief. I will then analyze whether the estimates
given by this group of people, the self-reported “experts” are more accurate than the crowd’s
average.
The data was collected during three consecutive days, at the bank and at the sports club. Participants
were not time-pressed and were allowed to take as much time as they wished in filling out the
questionnaire. As was hoped for, a very diverse reaction was given during the test, varying from
writing down their first thought, to taking up to 25 minutes to complete the task.
Koen de Bruijn - 2015 Trying to make wise crowds, even wiser.
13
Results
A total of 200 participants filled out 400 questionnaires. The answer to the first question was that
container 1 contained 361 marbles, and container 2 contained 643 marbles. To see whether the
phenomenon of wisdom of crowds is present in my pooled data, I used the deviations of participants’
estimates from the actual amounts of marbles in the containers. If the ‘wisdom of crowds’
phenomenon is present, I should expect to see that the over-estimates (positive deviations) are
cancelled by the under-estimates (negative deviations) so that the average of all deviations
approximate to zero.
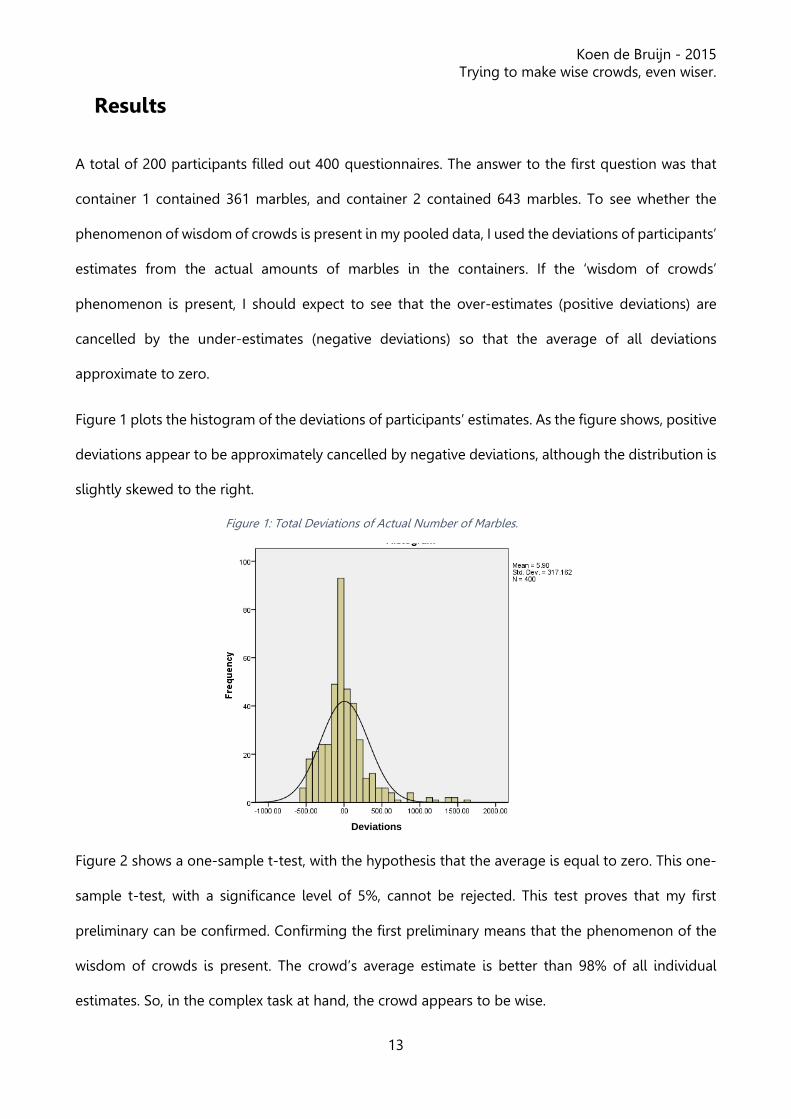
Figure 1 plots the histogram of the deviations of participants’ estimates. As the figure shows, positive
deviations appear to be approximately cancelled by negative deviations, although the distribution is
slightly skewed to the right.
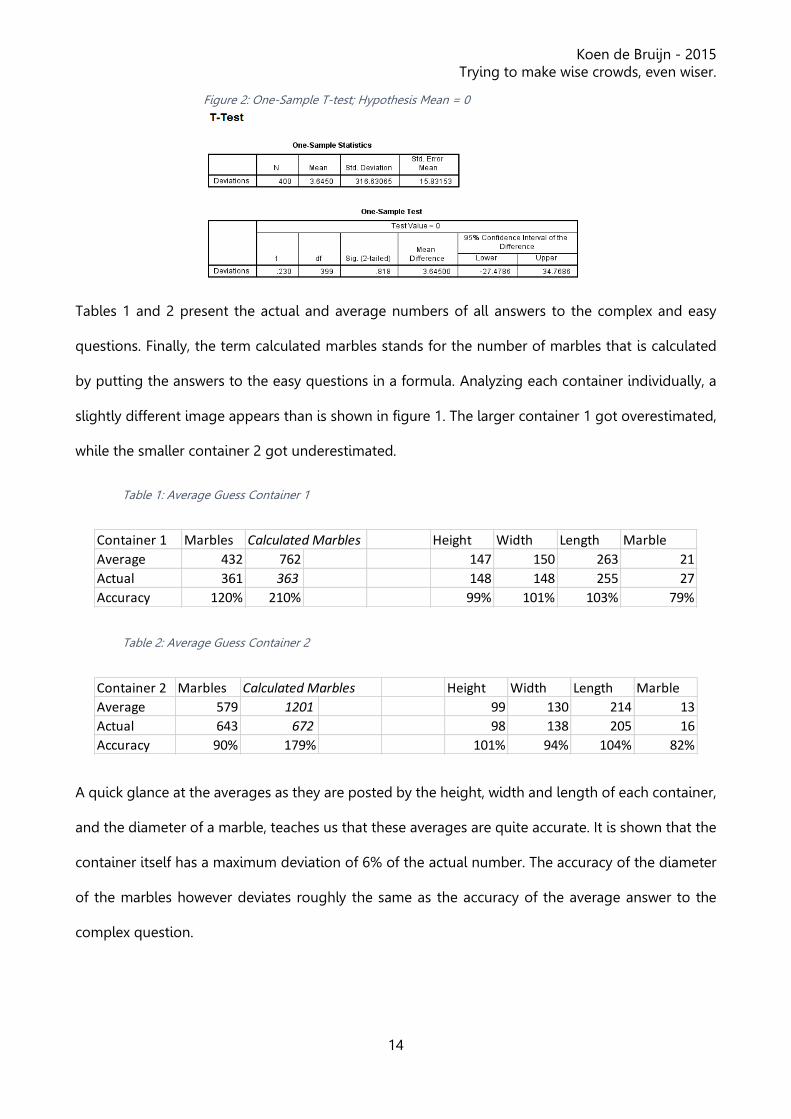
Figure 2 shows a one-sample t-test, with the hypothesis that the average is equal to zero. This one-
sample t-test, with a significance level of 5%, cannot be rejected. This test proves that my first
preliminary can be confirmed. Confirming the first preliminary means that the phenomenon of the
wisdom of crowds is present. The crowd’s average estimate is better than 98% of all individual
estimates. So, in the complex task at hand, the crowd appears to be wise.
Figure 1: Total Deviations of Actual Number of Marbles.
Deviations
Koen de Bruijn - 2015 Trying to make wise crowds, even wiser.
14
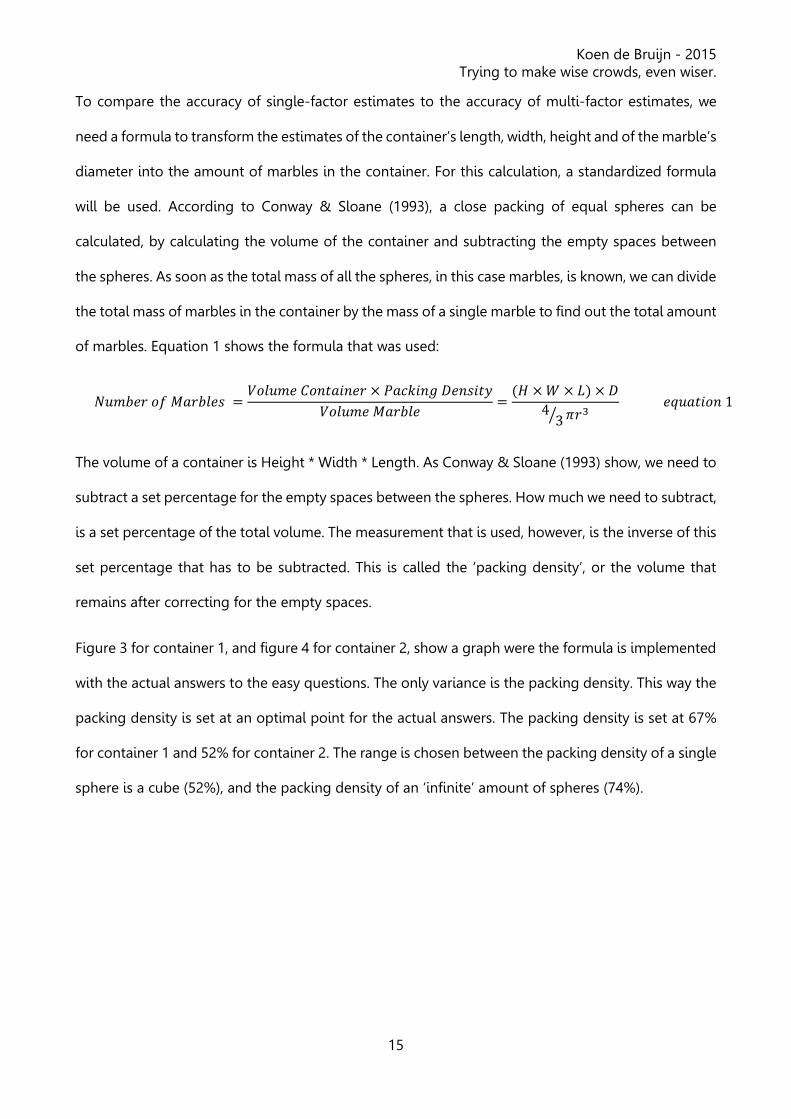
Tables 1 and 2 present the actual and average numbers of all answers to the complex and easy
questions. Finally, the term calculated marbles stands for the number of marbles that is calculated
by putting the answers to the easy questions in a formula. Analyzing each container individually, a
slightly different image appears than is shown in figure 1. The larger container 1 got overestimated,
while the smaller container 2 got underestimated.
Table 1: Average Guess Container 1
Table 2: Average Guess Container 2
A quick glance at the averages as they are posted by the height, width and length of each container,
and the diameter of a marble, teaches us that these averages are quite accurate. It is shown that the
container itself has a maximum deviation of 6% of the actual number. The accuracy of the diameter
of the marbles however deviates roughly the same as the accuracy of the average answer to the
complex question.
Container 1 Marbles Calculated Marbles Height Width Length Marble
Average 432 762 147 150 263 21
Actual 361 363 148 148 255 27
Accuracy 120% 210% 99% 101% 103% 79%
Container 2 Marbles Calculated Marbles Height Width Length Marble
Average 579 1201 99 130 214 13
Actual 643 672 98 138 205 16
Accuracy 90% 179% 101% 94% 104% 82%
Figure 2: One-Sample T-test; Hypothesis Mean = 0
Koen de Bruijn - 2015 Trying to make wise crowds, even wiser.
15
To compare the accuracy of single-factor estimates to the accuracy of multi-factor estimates, we
need a formula to transform the estimates of the container’s length, width, height and of the marble’s
diameter into the amount of marbles in the container. For this calculation, a standardized formula
will be used. According to Conway & Sloane (1993), a close packing of equal spheres can be
calculated, by calculating the volume of the container and subtracting the empty spaces between
the spheres. As soon as the total mass of all the spheres, in this case marbles, is known, we can divide
the total mass of marbles in the container by the mass of a single marble to find out the total amount
of marbles. Equation 1 shows the formula that was used:
𝑁𝑢𝑚𝑏𝑒𝑟 𝑜𝑓 𝑀𝑎𝑟𝑏𝑙𝑒𝑠 =𝑉𝑜𝑙𝑢𝑚𝑒 𝐶𝑜𝑛𝑡𝑎𝑖𝑛𝑒𝑟 × 𝑃𝑎𝑐𝑘𝑖𝑛𝑔 𝐷𝑒𝑛𝑠𝑖𝑡𝑦
𝑉𝑜𝑙𝑢𝑚𝑒 𝑀𝑎𝑟𝑏𝑙𝑒=
(𝐻 × 𝑊 × 𝐿) × 𝐷
43⁄ 𝜋𝑟3
𝑒𝑞𝑢𝑎𝑡𝑖𝑜𝑛 1
The volume of a container is Height * Width * Length. As Conway & Sloane (1993) show, we need to
subtract a set percentage for the empty spaces between the spheres. How much we need to subtract,
is a set percentage of the total volume. The measurement that is used, however, is the inverse of this
set percentage that has to be subtracted. This is called the ‘packing density’, or the volume that
remains after correcting for the empty spaces.
Figure 3 for container 1, and figure 4 for container 2, show a graph were the formula is implemented
with the actual answers to the easy questions. The only variance is the packing density. This way the
packing density is set at an optimal point for the actual answers. The packing density is set at 67%
for container 1 and 52% for container 2. The range is chosen between the packing density of a single
sphere is a cube (52%), and the packing density of an ‘infinite’ amount of spheres (74%).

Koen de Bruijn - 2015 Trying to make wise crowds, even wiser.
16
Figure 3: Setting the Packing Density of Container 1
Figure 4: Setting the Packing Density of Container 2
Tables 1 and 2 show the average estimates in both the easy and complex questions. In the complex
task, the accuracies of the averages are 120% and 90% for respectively containers 1 and 2. If we look
at the averages of the easy questions, the containers’ length, height, and width are indeed more
accurate. The fourth easy question, the diameter of a marble, is roughly the same as that of the
containers. If these averages are plugged into the formula, the accuracy drops rapidly. The 210%
accuracy for container 1, and 179% accuracy for container 2, leads to believe that the hypothesis has
to be rejected.
0
50
100
150
200
250
300
350
400
450
52
%
53
%
54
%
55
%
56
%
57
%
58
%
59
%
60
%
61
%
62
%
63
%
64
%
65
%
66
%
67
%
68
%
69
%
70
%
71
%
72
%
73
%
74
%
nu
mb
er o
f M
arb
les
Packing Density
Packing Density Container 1
Calculated Marbles
0
200
400
600
800
1000
1200
52
%
53
%
54
%
55
%
56
%
57
%
58
%
59
%
60
%
61
%
62
%
63
%
64
%
65
%
66
%
67
%
68
%
69
%
70
%
71
%
72
%
73
%
74
%
Mar
ble
s
Packing Density
Packing Density Container 2
Calculated Marbles
Koen de Bruijn - 2015 Trying to make wise crowds, even wiser.
17
Is it possible, however, to define this difference? One possible solution lies in the formula. It shows
that the diameter, or rather the radius, of each marble is multiplied by the third power. The deviation
from the actual number is therefore also multiplied by the third power. In both cases the marble is
underestimated. According to the formula this would lead to a smaller mass per marble, thereby
dividing by a smaller number. Dividing by a smaller number, leads to a larger output. This proves
why the average amount of ‘calculated marbles’ are nearly twice as high as the actual amount of
‘calculated marbles’.
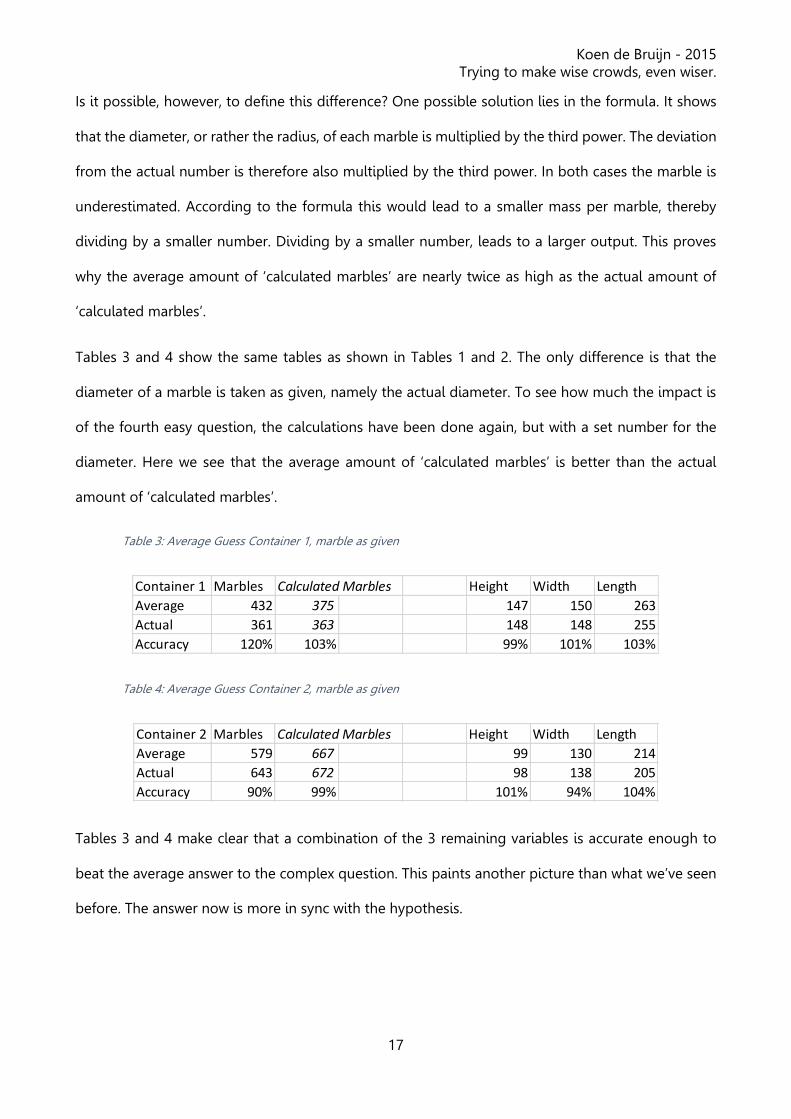
Tables 3 and 4 show the same tables as shown in Tables 1 and 2. The only difference is that the
diameter of a marble is taken as given, namely the actual diameter. To see how much the impact is
of the fourth easy question, the calculations have been done again, but with a set number for the
diameter. Here we see that the average amount of ‘calculated marbles’ is better than the actual
amount of ‘calculated marbles’.
Table 3: Average Guess Container 1, marble as given
Table 4: Average Guess Container 2, marble as given
Tables 3 and 4 make clear that a combination of the 3 remaining variables is accurate enough to
beat the average answer to the complex question. This paints another picture than what we’ve seen
before. The answer now is more in sync with the hypothesis.
Container 1 Marbles Calculated Marbles Height Width Length
Average 432 375 147 150 263
Actual 361 363 148 148 255
Accuracy 120% 103% 99% 101% 103%
Container 2 Marbles Calculated Marbles Height Width Length
Average 579 667 99 130 214
Actual 643 672 98 138 205
Accuracy 90% 99% 101% 94% 104%
Koen de Bruijn - 2015 Trying to make wise crowds, even wiser.
18
Additional Analysis 1: Can self-reported experts outperform the crowd?
Participants were asked if they were willing to pay one Euro for their answer to the complex question.
If participants paid one Euro, and their answer to the complex question was part of the best 10% of
all answers, they could earn 10 Euros. 78 participants decided to take a chance for container 1, and
75 participants for container 2. However, only 11 of these participants were in the top 10% of all
guesses, and got the reward that was promised.
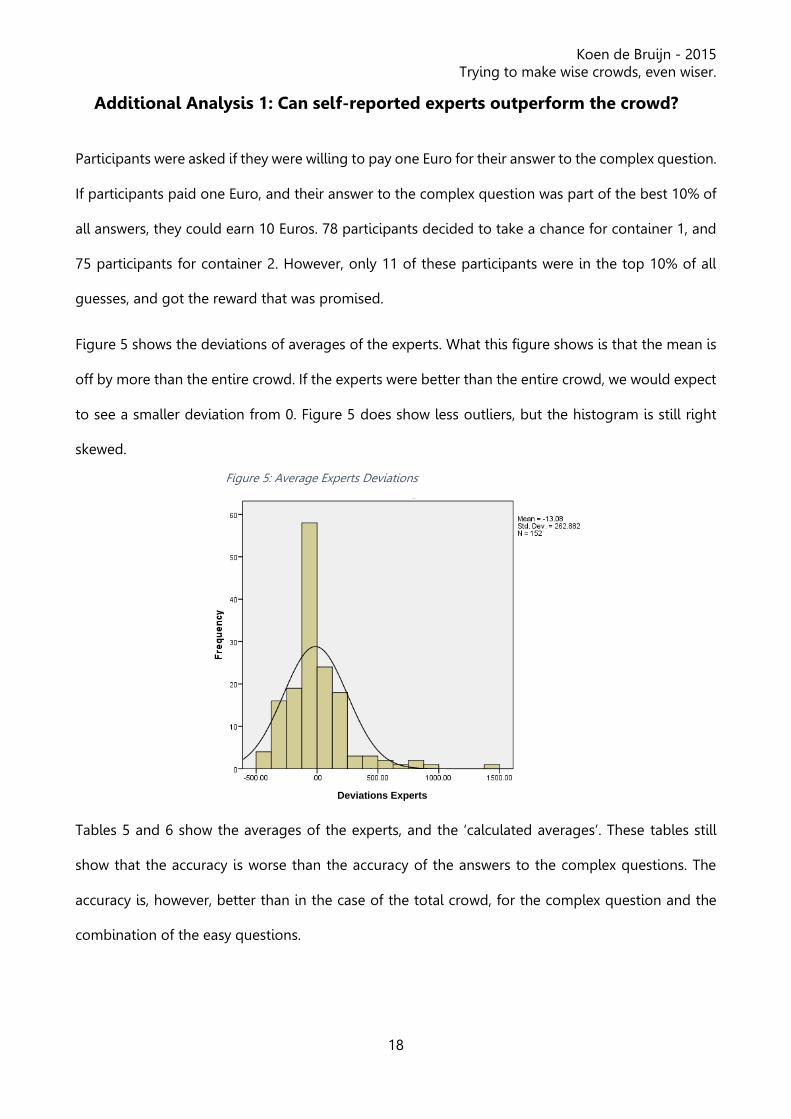
Figure 5 shows the deviations of averages of the experts. What this figure shows is that the mean is
off by more than the entire crowd. If the experts were better than the entire crowd, we would expect
to see a smaller deviation from 0. Figure 5 does show less outliers, but the histogram is still right
skewed.
Tables 5 and 6 show the averages of the experts, and the ‘calculated averages’. These tables still
show that the accuracy is worse than the accuracy of the answers to the complex questions. The
accuracy is, however, better than in the case of the total crowd, for the complex question and the
combination of the easy questions.
Figure 5: Average Experts Deviations
Deviations Experts
Koen de Bruijn - 2015 Trying to make wise crowds, even wiser.
19
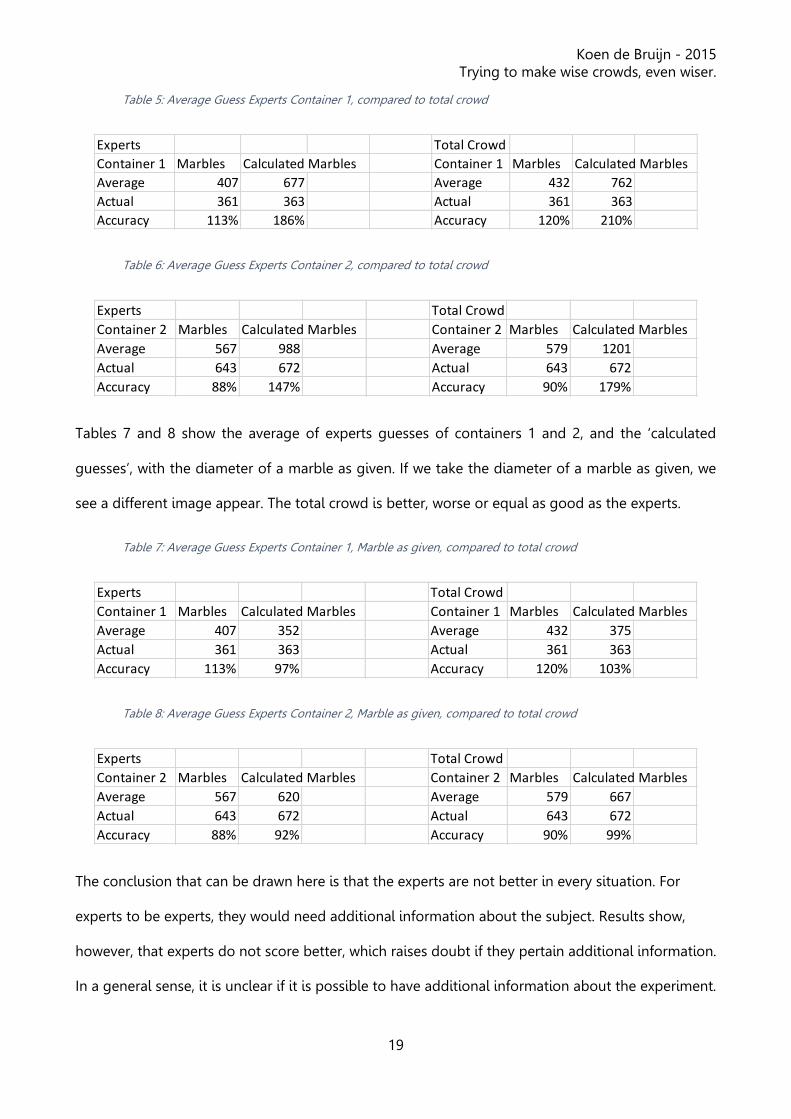
Table 5: Average Guess Experts Container 1, compared to total crowd
Table 6: Average Guess Experts Container 2, compared to total crowd
Tables 7 and 8 show the average of experts guesses of containers 1 and 2, and the ‘calculated
guesses’, with the diameter of a marble as given. If we take the diameter of a marble as given, we
see a different image appear. The total crowd is better, worse or equal as good as the experts.
Table 7: Average Guess Experts Container 1, Marble as given, compared to total crowd
Table 8: Average Guess Experts Container 2, Marble as given, compared to total crowd
The conclusion that can be drawn here is that the experts are not better in every situation. For
experts to be experts, they would need additional information about the subject. Results show,
however, that experts do not score better, which raises doubt if they pertain additional information.
In a general sense, it is unclear if it is possible to have additional information about the experiment.
Experts Total Crowd
Container 1 Marbles Calculated Marbles Container 1 Marbles Calculated Marbles
Average 407 677 Average 432 762
Actual 361 363 Actual 361 363
Accuracy 113% 186% Accuracy 120% 210%
Experts Total Crowd
Container 2 Marbles Calculated Marbles Container 2 Marbles Calculated Marbles
Average 567 988 Average 579 1201
Actual 643 672 Actual 643 672
Accuracy 88% 147% Accuracy 90% 179%
Experts Total Crowd
Container 1 Marbles Calculated Marbles Container 1 Marbles Calculated Marbles
Average 407 352 Average 432 375
Actual 361 363 Actual 361 363
Accuracy 113% 97% Accuracy 120% 103%
Experts Total Crowd
Container 2 Marbles Calculated Marbles Container 2 Marbles Calculated Marbles
Average 567 620 Average 579 667
Actual 643 672 Actual 643 672
Accuracy 88% 92% Accuracy 90% 99%
Koen de Bruijn - 2015 Trying to make wise crowds, even wiser.
20
Additional Analysis 2: Are smaller groups sufficient?
For a phenomenon like the wisdom of crowds to be optimally tested, one must create an
environment that improves decision quality. Yaniv (2004) looked for quantitative estimates,
judgments and forecasts from people possessing the relevant knowledge. The opinions were then
combined by the individual decision maker. Yaniv (2004) came to the conclusion that if personality
biases are small or zero, the average judgment is expected to converge about the truth. Three to six
judgments would suffice for an experiment to cancel out most of the errors. The benefits from adding
experts diminishes rapidly.
Mannes et al. (2013) continued on the work of Yaniv (2004). Instead of averaging great crowds, they
implemented an additional strategy: ‘the wisdom of small crowds’. As the name states, only a small
number of knowledgeable individuals are used for an experiment. According to the research done
by Mannes et al. (2013), averaging the whole crowd is preferred only when there are small differences
in expertise amongst participants. Additional Analysis 1 gave an unclear image of the level of
expertise. According to Mannes et al. (2013) the diversification of the level of expertise can be shown
by dividing the total group into smaller groups.
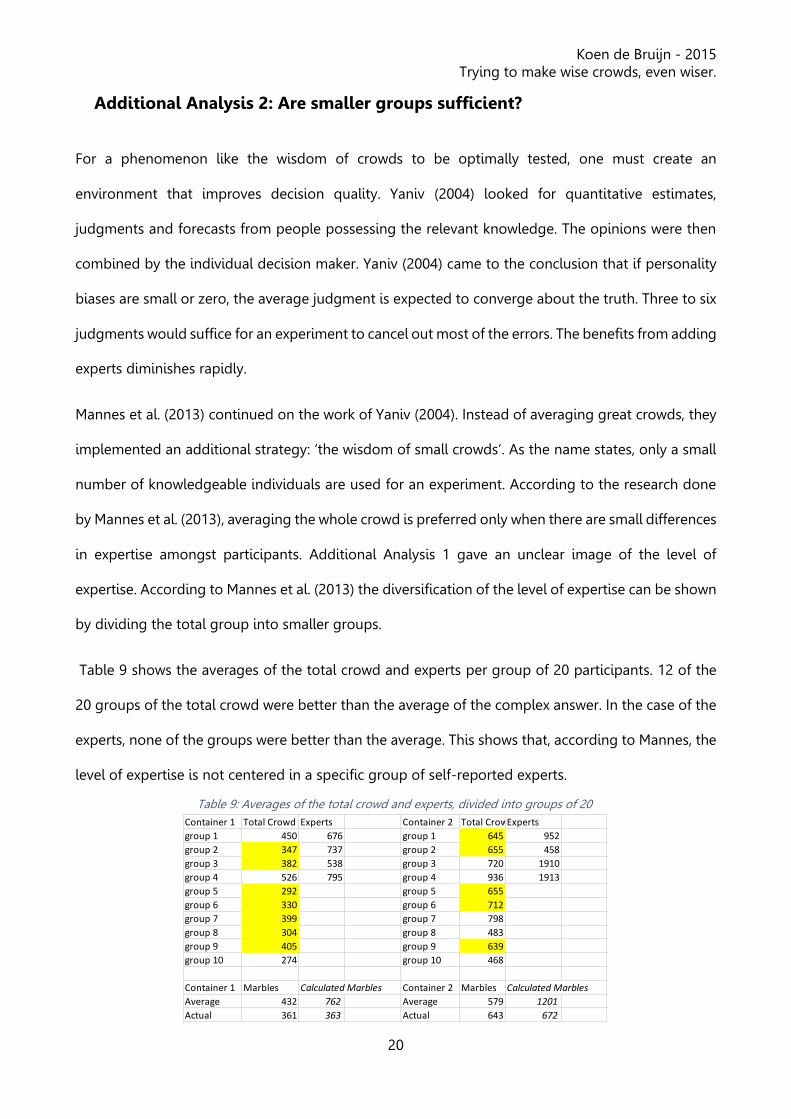
Table 9 shows the averages of the total crowd and experts per group of 20 participants. 12 of the
20 groups of the total crowd were better than the average of the complex answer. In the case of the
experts, none of the groups were better than the average. This shows that, according to Mannes, the
level of expertise is not centered in a specific group of self-reported experts.
Table 9: Averages of the total crowd and experts, divided into groups of 20 Container 1 Total Crowd Experts Container 2 Total CrowdExperts
group 1 450 676 group 1 645 952
group 2 347 737 group 2 655 458
group 3 382 538 group 3 720 1910
group 4 526 795 group 4 936 1913
group 5 292 group 5 655
group 6 330 group 6 712
group 7 399 group 7 798
group 8 304 group 8 483
group 9 405 group 9 639
group 10 274 group 10 468
Container 1 Marbles Calculated Marbles Container 2 Marbles Calculated Marbles
Average 432 762 Average 579 1201
Actual 361 363 Actual 643 672
Koen de Bruijn - 2015 Trying to make wise crowds, even wiser.
21
Concluding Discussion
Research done in the past, based on the wisdom of crowds, mainly focused on proving the theory,
or making additions to it. Several different factors could be looked in to. The main difference that is
made, is the difference between a single-factor, complex experiment, and multi-factor, easy
experiments.
Using the flexible “jellybeans-in-a-jar” paradigm, this paper has tried to compare the crowd’s
performance in the complex experiment with the performance in the easy experiments. Specifically,
my paper tested the following hypothesis: Given that the theory of ‘the Wisdom of Crowds’
holds, can we make the average guess of a crowd even better by posing the question as
multiple simple questions?
The experiment was a combination of the two types of problems. Asking the ‘main question’ of how
many marbles were in the jar, and breaking it down to smaller questions like asking the height of
the container. Analysis had to prove one over the other. In order for the hypothesis to be true,
however, several factors had to link up. The baseline was set by the main question, resulting in a
deviation of just 5.9 marbles off, of the actual number. Via a one-sample T-test, this proved to be
accurate enough for the theory of the wisdom of crowds to hold in this experiment.
Breaking it down to each container individually, there turned out to be room for improvement. The
averages of the complex questions had an accuracy of 120% for container 1 and 90% for container
2. Combining the averages of the simple questions turned out to be even further of the actual
number. The actual number of marbles turned out to be 361 for container 1 and 643 for container 2.
The accuracy of the combined easy answers was 210% and 179% for respectively container 1 and 2.
This lead to believe that the hypothesis would not hold.
A second preliminary might be the factor of this problem. In order for the hypothesis to possibly
hold up, the multiple easy questions, do have to be easy. One of the variables, estimating the
diameter of a marble, was not in line with the other three easy variables. The average of the diameter
Koen de Bruijn - 2015 Trying to make wise crowds, even wiser.
22
of a marble was underestimated by roughly 20% for both containers. In addition, equation 1 shows
that this variable is weight more than the other 3 as well. Question can be raised here, if estimating
the diameter of a marble is indeed an easy question. In other words, is it hard for participants to
estimate spheres?
If the assumption is made that it is indeed hard for participants to estimate spheres, a different image
appears. Taken the diameter of a marble as given, the accuracy of the calculated amount of marbles
via the easy questions improves rapidly. With 103% and 99% accuracy for respectively container 1
and 2, these estimates outperform the averages of the complex question. Taking the diameter of a
marble as given, results show it is impossible to reject the hypothesis.
A second type of analysis that has been done, is that in search for experts. Experts referring to those
that claim to have additional information about the situation. Experts could express this additional
information by betting one Euro on their answer to the complex question. If their answer was in the
top 10% of all guesses, they would win 10 Euros. Out of 153 guesses of a total of 400 were guesses
of self-reported experts. Results show that, although the hypothesis would have to be rejected as
well, the accuracy of the experts was closer to the actual number than that of the total crowd. Taking
the diameter of a marble as given, however, the accuracy is worse than that of the total crowd. This
results in an unclear image about the self-reported experts, making it unsure if it is possible for
someone to have additional information about the question at hand.
Questions can be raised about the participating experts in the experiment. In order to gather a large
amount of respondents, colleagues and friends were asked to fill out the ballots. Trying to convince
them to make an effort, several prices were promised to the winners. The problem that can be raised
here is that most participants are known to me, and might be in it for the wrong reasons. The wrong
reasons meaning that helping me get enough responses is more important than actually winning a
prize. The same goes for the self-reported experts. Several experts expressed themselves after taking
the questionnaire by saying they wanted to help me, by paying the one Euro, instead of hoping for
Koen de Bruijn - 2015 Trying to make wise crowds, even wiser.
23
the prize. This would correspond with the fact that it is impossible to have additional information
about the experiment at hand.
Finally, I looked at the sample size. Was it really necessary for the experiment to use 400
questionnaires, or would fewer participants suffice? Dividing the total group, as the self-reported
experts into groups of 20 participants, would have to show that smaller groups would be accurate,
or close to the same accuracy as the total group. Results show, that in 12 out of 20 cases for the total
group, and none of the groups of experts, performed better than the total crowd. This disproves that
there is any evidence that smaller groups perform as well as the total crowd. In the case of the
experts, this does show that there appears to be no further evidence for the self-reported experts to
have additional information.
For the hypothesis not to be rejected, the variable of the diameter of a marble has to be left out.
Defining this variable is mainly the reason in doing so. The hypothesis clearly states that the
comparison has to be made between a complex question and multiple easy questions. This paper
doesn’t explain what the definitions are of each type of question, which in its own defense is not the
point this paper is trying to make. Results, however, do show promising signs that multiple, easy
questions could outperform a single, complex question, but further research has to be done to prove
or disprove this hypothesis.
Koen de Bruijn - 2015 Trying to make wise crowds, even wiser.
24
Bibliography Allport, F. H. (1920). The influence of the group upon association and thought. Journal of Experimental Psychology, 159-182.
Clemen, R. T. (1989). Combining Forecasts: A review and annotated bibliography. International Journal of Forecasting, 559-583.
Conway, J. H., & Sloane, N. J. (1993). Sphere Packings, Lattices and Groups. New York: Springer-Verslag.
Dashiell, J. F. (1935). Experimental studies of the influence of social situations on the behavior of individual human adults. In J. F. Dashiell, Handbook of social psychology (pp. 1097-1158). Worchester: Clark University Press.
Einhorn, H. J., & Hogarth, R. M. (1977). Quality of group judgment. Psychological Bulletin, 158-172.
Galton, F. (1907). Vox Populi. Nature, 75: 450-451.
Gigone, D., & Hastie, R. (1997). Proper Analysis of the Accuracy of Group Judgments. Psychological Bulletin, 149-167.
Gordon, K. (1924). Group judgments in the field of lifted weights.
Hastie, R., & Kameda, T. (2005). The robust beauty of majority rules in group decisions. Psychological Review, 494-508.
Hill, G. W. (1982). Group versus individual performance: Are N+1 heads better than one? Psychological Bulletin, 517-539.
Hogarth, R. M. (1978). A note on aggregating opinions. Organizational behavior and human performance, 40-46.
Kahneman, D., & Tversky, A. (1979). Prospect Theory: An analysis of decision under risk. Econometrica, 263-292.
Kelley, T. L. (1925). The applicability of the Spearman-Brown formula for the measurement of reliabilit. Journal of Educational Psychology, 300-303.
Kerr, N. L., & Tindale, R. S. (2004). Group performance and decision making. Annual Review Psychology, 623-655.
Kerr, N. L., & Tindale, R. S. (2011). Group-based forecasting?: A social psychological analysis. International Journal of Forecasting, 14-40.
Kerr, N. L., MacCoun, R. J., & Kramer, G. P. (1996). Bias in judgment: comparing individuals and groups. Psychology Review, 687.
Larrick, R. P., Mannes, A. E., & Soll, J. B. (2011). The social psychology of the wisdom of crowds. In Frontiers in social psychology: Social judgment and decision making. New York: Psychology Press.
Lorge, I., Fox, D., Davitz, J., & Brenner, M. (1958). A survey of studies contrasting the quality of group performance and individual performance. Psychological Bulletin, 337-372.

Koen de Bruijn - 2015 Trying to make wise crowds, even wiser.
25
Mannes, A. E., Soll, J. B., & Larrick, R. P. (2013). The wisdom of small crowds.
Prelec, D., Seung, S. H., & McCoy, J. (2013). Finding truth even if the crowd is wrong. 1-12.
Rohrbaugh, J. (1979). Improving the quality of group judgment: Social judgment analysis and the delphi technique. Organizational behavior and human performance, 73-92.
Simon, H. A. (1972). Theories of bounded rationality. In H. A. Simon, Decision and Organization (p. Chapter 8). North-Holland Publishing Company.
Sjöberg, L. (2009). Are all crowds equally wise? A comparison of political election forecasts by experts and the public. Journal of forecasting, 1-18.
Smith, M. (1930). Group judments in the field of personal traits. 562-565.
Sontag, S., & Drew, C. (2000). Blind Man's Bluff: The Untold Story of Cold War Submarine Espionage. Random House.
South, E. B. (1927). Some psychological aspects of committee work. Journal of Applied Psychology, 437-464.
Steiner, I. D. (1972). Group processes and productivity. Academic Press.
Stroop, J. R. (1932). Is the judgment of the group better than that of the average member of the group? 550-562.
Surowiecki, J. (2005). The Wisdom of Crowds. New York: Anchor Books.
Thie, T. M. (1925). Testing the efficiency of the group method. The English Journal, 134-137.
Vul, E., & Pashler, H. (2008). Measuring the crowd within: Probabilistic representations within individuals. Phychological Science, 645-647.
Wallsten, T. S., Budescu, D. V., Erev, I., & Diederich, A. (1997). Evaluating and combining subjective probability estimates. Journal of Behavioral Decision Making, 243-268.
Watson, G. B. (1928). Do groups think more efficiently than individuals? The Journal of Abnormal and Social Psychology, 328-336.
Yaniv, I. (2004). The benefit of additional opinions. Current Directions in Psychological Science, 75-78.
Yi, S. K., Steyvers, M., Lee, M. D., & Dry, M. J. (2012). The wisdom of the crowd in combinatorial problems. Cognitive Science, 1-19.
Zajonc, R. B. (1962). The effect of feedback and probability of group success on individuals and group performance. Human Relations, 149-161.
Koen de Bruijn - 2015 Trying to make wise crowds, even wiser.
26
List of Figures
Figure 1: Total Deviations of Actual Number of Marbles…………………………………………………….…………….13
Figure 2: One-Sample T-test; Hypothesis Mean = 0……………………………………………………………….………..14
Figure 3: Setting the Packing Density of Container 1……………………………………………………………...……….16
Figure 4: Setting the Packing Density of Container 2…………...……………………………………….………..………..16
Figure 5: Average Experts Deviations……………………………………………………..………………………….…..…………18
List of Tables
Table 1: Average Guess Container 1……………………………………………………..…………………………………………...14
Table 2: Average Guess Container 2……………………………………………………..…………………………………………...14
Table 3: Average Guess Container 1, marble as given………………...……………………………………………………..17
Table 4: Average Guess Container 2, marble as given…..…………………………………………………………………...17
Table 5: Average Guess Experts Container 1, compared to total crowd……………………………………………..19
Table 6: Average Guess Experts Container 2, compared to total crowd……………………………………………19
Table 7: Average Guess Experts Container 1, Marble as given, compared to total crowd…………………..19
Table 8: Average Guess Experts Container 2, Marble as given, compared to total crowd…………………..19
Table 9: Averages of the total crowd and experts, divided into groups of 20…………………………………….20
Koen de Bruijn - 2015 Trying to make wise crowds, even wiser.
27
Appendix
Appendix 1: Container 1
Appendix 2: Container 2

Koen de Bruijn - 2015 Trying to make wise crowds, even wiser.
28
Appendix 3: Standard questionnaire for containers 1 and 2
Container 1 Name:
1. How many marbles are there in Container 1? Mar.
2. Do you think you are in the top 10% of all guesses? Yes No
3. If yes at Q2: Are you willing to bet 1 Euro on this, with a chance to win 10 Euros?
Yes No
4. How high is the Container? mm5. How wide is the Container? mm6. How long is the Container? mm7. What is the diameter of a marble? mm
Container 2 Name:
1. How many marbles are there in Container 2? Mar.
2. Do you think you are in the top 10% of all guesses? Yes No
3. If yes at Q2: Are you willing to bet 1 Euro on this, with a chance to win 10 Euros?
Yes No
4. How high is the Container? mm5. How wide is the Container? mm6. How long is the Container? mm7. What is the diameter of a marble? mm