Embed Size (px)
Citation preview

TRWD Quarterly Financial Staff Update

General FundQuarterly Status Update

FY2021 General Fund RevenuesBudget vs Actual - 6/30/21
$0
$2,000,000
$4,000,000
$6,000,000
$8,000,000
$10,000,000
$12,000,000
$14,000,000
$16,000,000
$18,000,000
$20,000,000
$22,000,000
$24,000,000
Taxes TIF Interest Income Reimbursable projectrevenues
FY21 Budget FY21 Actuals 6/30/21 FY21 Projected Revenues

FY2021 General Fund ExpendituresBudget vs Actual - 6/30/21
$0
$2,000,000
$4,000,000
$6,000,000
$8,000,000
$10,000,000
$12,000,000
$14,000,000
$16,000,000
$18,000,000
Debt Service Capital Maintenance EnvironmentalStewardship
SystemImprovements
SupportServices
FY21 Budget FY21 Actuals 6/30/21 FY21 Projected Expenditures
Special Projects/ Contingency Fund
Quarterly Status Update

FY2021 Special Projects/Contingency FundRevenues Budget vs Actual - 6/30/21
$-
$1,000,000
$2,000,000
$3,000,000
$4,000,000
$5,000,000
$6,000,000
$7,000,000
Oil and Gas Revenues Interest Income Revenues Other Income Revenues
FY21 Budget FY21 Actuals 6/30/21 FY21 Projected Revenues

$(200,000)
$(150,000)
$(100,000)
$(50,000)
$-
$50,000
$100,000
Oktoberfest &Fort Wurst
Rockin' theRiver
Fort WorthFourth
Trash Bashes Panther IslandIce Rink
Flyfest TroutStockings
MiscellaneousEvents
ProgramSupport
Budget Profit/ (Loss) Actual Profit/ (Loss) 6/30/21
FY2021 Special Projects/Contingency FundRecreation Events & Programming
Budget vs Actual - 6/30/21
Total FY21 Budgeted Loss – ($392,550) Total Actual Loss at 6/30/21 – ($44,289)
Events occurring after 6/30/21 Events occurring before 6/30/21

FY2021 Special Projects/Contingency FundRecreation InfrastructureBudget vs Actual - 6/30/21
Total FY21 Budgeted Profit – $541,935 Total FY21 Projected Profit– $493,776
$(300,000)
$(200,000)
$(100,000)
$-
$100,000
$200,000
$300,000
$400,000
WoodshedRestaurant
Coyote Drive-In Theatre
Twin PointsPark
EagleMountain Park
Panther IslandFacilities
Other Leases& Permits
Public Art &Signs
Trailheadmaintenance
LaGraveStadium
Budget Profit/ (Loss) Actual Profit/ (Loss) 6/30/21 Projected Profit/(Loss)

Revenue FundQuarterly Status Update
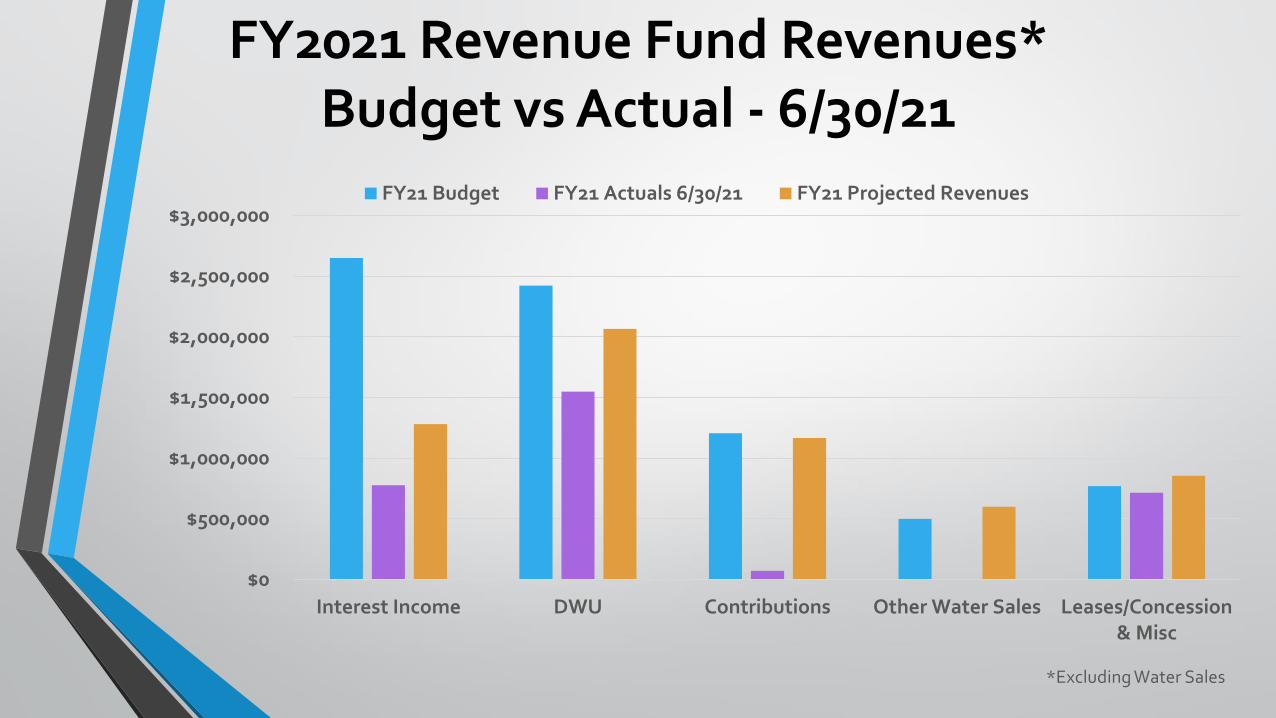
FY2021 Revenue Fund Revenues*Budget vs Actual - 6/30/21
$0
$500,000
$1,000,000
$1,500,000
$2,000,000
$2,500,000
$3,000,000
Interest Income DWU Contributions Other Water Sales Leases/Concession& Misc
*Excluding Water Sales
FY21 Budget FY21 Actuals 6/30/21 FY21 Projected Revenues

FY2021 Revenue Fund Expenditures*Budget vs Actual - 6/30/21
$0
$5,000,000
$10,000,000
$15,000,000
$20,000,000
$25,000,000
$30,000,000
$35,000,000
$40,000,000
$45,000,000
Pumping Power Maintenance SystemImprovements
WatershedProtection andEnvironmental
Capital Support Services
*Excluding Debt Service
FY21 Budget FY21 Actuals 6/30/21 FY21 Projected Expenditures

Enterprise Fund Projects to be funded through Bond Funds Projects FY 2022 FY 2023 FY 2024 FY 2025 FY 2026Pump Room Cooling $2,075,000 $355,000
Acquifer Storage and Recovery $4,575,000 $1,000,000 $1,600,000
Chemical Feed Improvements $5,765,000 $5,700,000 $6,000,000 $2,000,000
Kennedale Balancing Reservoir Improvements $17,000,000 $16,000,000 $11,400,000 $4,100,000 $30,000,000
Eagle Mountain Spillway Seepage Cutoff $2,285,400
RC Embankment Phase 2 $1,500,000 $2,000,000 $1,000,000
CC Pipeline Replacements $500,000 $100,000 $10,000,000 $35,850,000 $31,400,000
Operations Facility $7,000,000 $2,000,000 $5,000,000 $2,000,000
Section 1D $500,000 $8,500,000 $9,500,000 $8,000,000
Section 1E (Rolling Hills Pipeline Parallel) $500,000 $2,500,000 $2,500,000
Cedar Creek Wetlands $22,000,000 $7,900,000 $10,500,000 $103,000,000 $86,000,000
Potential Future Reservoir $2,200,000 $3,500,000Total - Estimated Needs $62,200,400 $44,055,000 $58,000,000 $159,150,000 $151,900,000Remaining Bond Funds Available -$1,773,321Total Bond Need $60,427,079 $44,055,000 $58,000,000 $159,150,000 $151,900,000Estimated Bond Issues Needed $50,000,000 $50,000,000 $60,000,000 $180,000,000 $125,000,000Overage/Surplus $10,427,079 -$5,945,000 -$2,000,000 -$20,850,000 $26,900,000
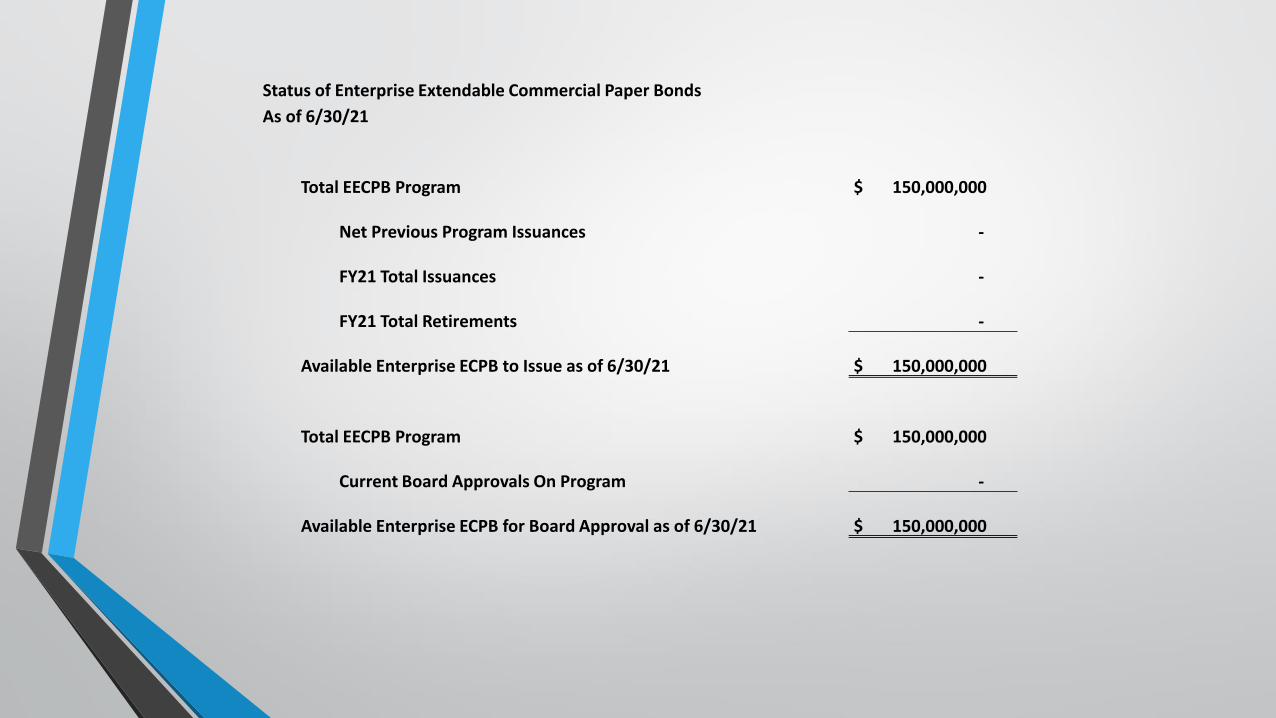
Status of Enterprise Extendable Commercial Paper Bonds
As of 6/30/21
Total EECPB Program $ 150,000,000
Net Previous Program Issuances -
FY21 Total Issuances -
FY21 Total Retirements -
Available Enterprise ECPB to Issue as of 6/30/21 $ 150,000,000
Total EECPB Program $ 150,000,000
Current Board Approvals On Program -
Available Enterprise ECPB for Board Approval as of 6/30/21 $ 150,000,000

Large ProjectsQuarterly Project
Update

Integrated Pipeline

Integrated Pipeline Project Status Phase 1&2 as of 6/30/21
$-
$100,000,000
$200,000,000
$300,000,000
$400,000,000
$500,000,000
$600,000,000
$700,000,000
$800,000,000
$900,000,000
Phase 1&2 Actuals as of6/30/21
Phase 1&2 RemainingCosts
Phase 1&2 Total ExpectedCosts
TRWD Dallas Water Utilities
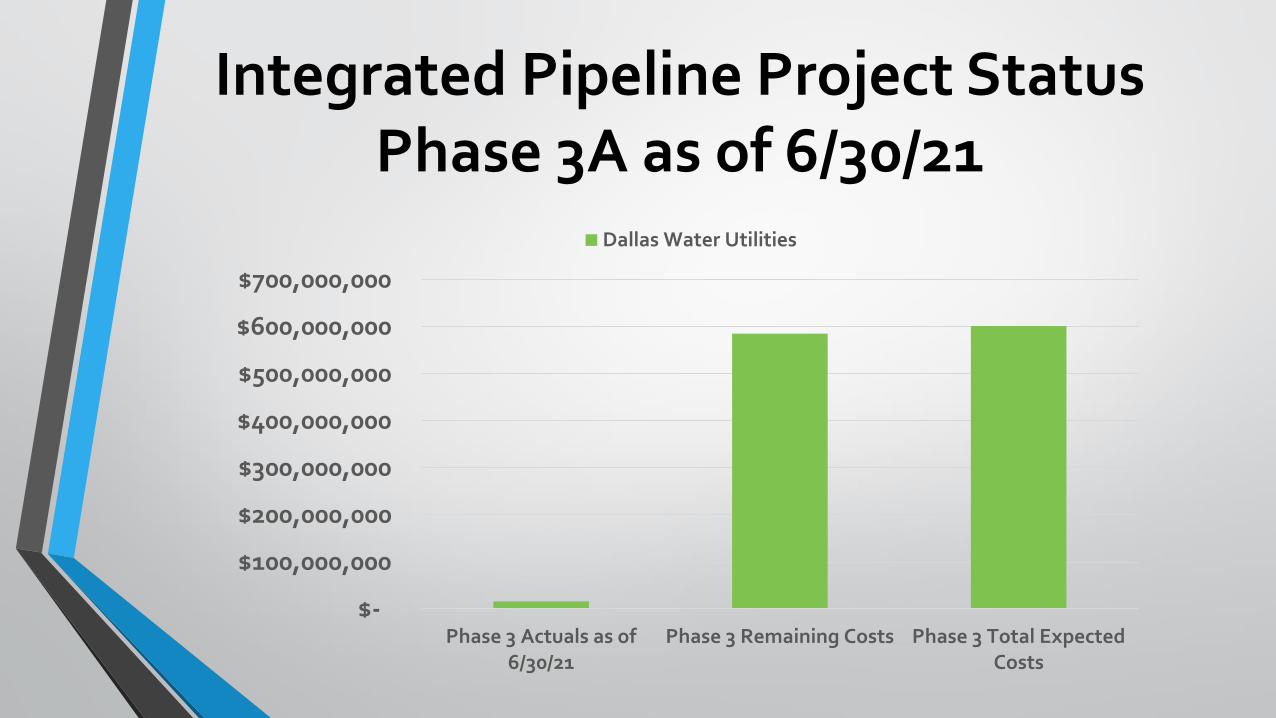
Integrated Pipeline Project Status Phase 3A as of 6/30/21
$-
$100,000,000
$200,000,000
$300,000,000
$400,000,000
$500,000,000
$600,000,000
$700,000,000
Phase 3 Actuals as of6/30/21
Phase 3 Remaining Costs Phase 3 Total ExpectedCosts
Dallas Water Utilities
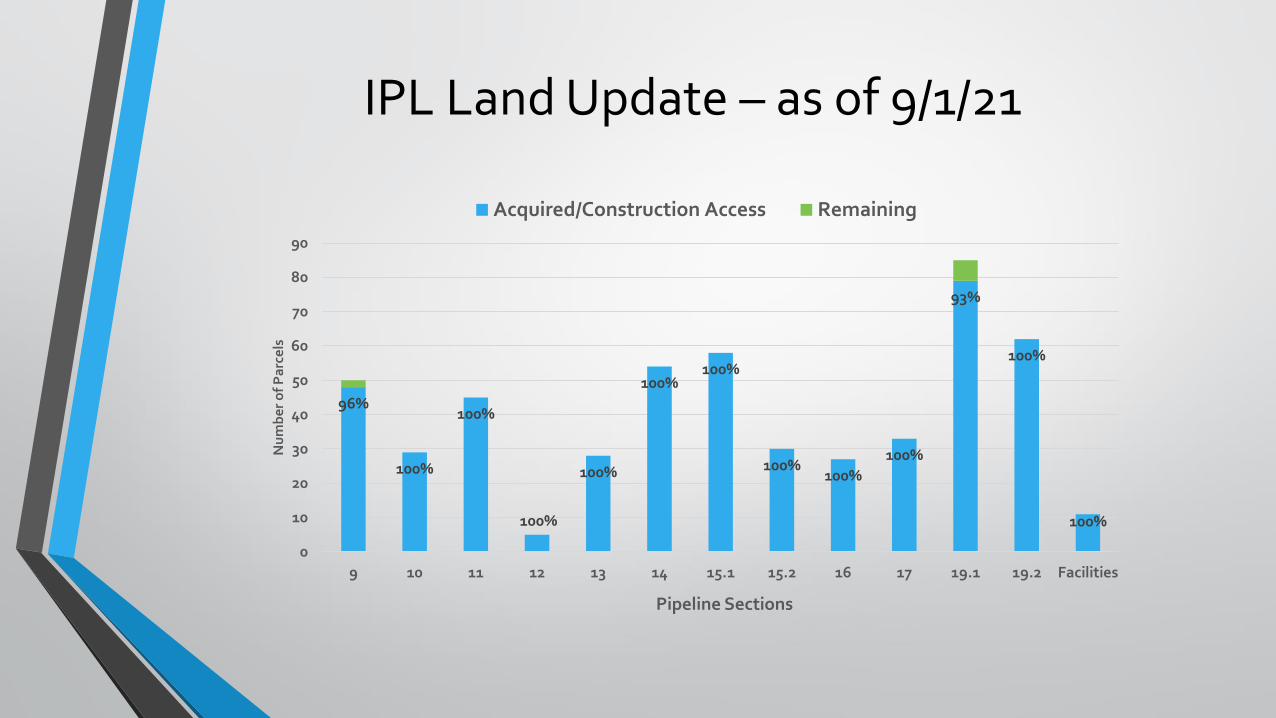
IPL Land Update – as of 9/1/21
96%
100%
100%
100%
100%
100%100%
100%100%
100%
93%
100%
100%
0
10
20
30
40
50
60
70
80
90
9 10 11 12 13 14 15.1 15.2 16 17 19.1 19.2 Facilities
Nu
mb
er
of
Pa
rce
ls
Pipeline Sections
Acquired/Construction Access Remaining
Panther Island/Central City Project
Update
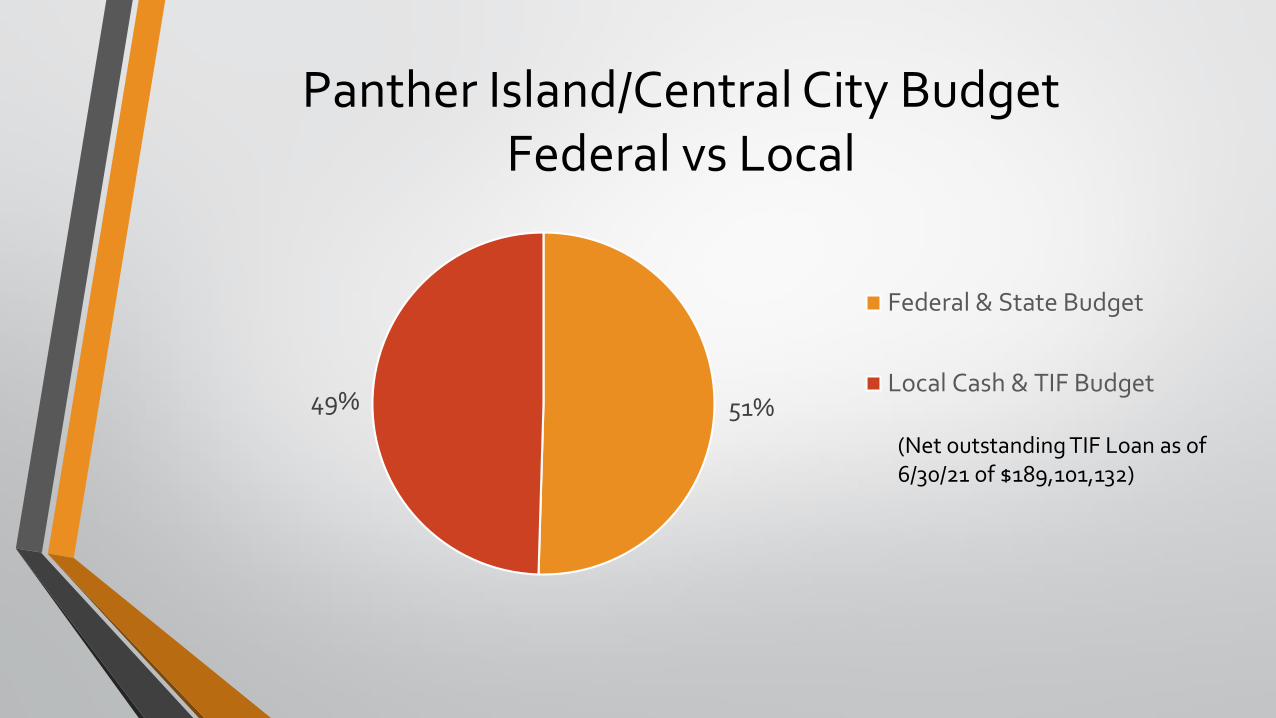
Panther Island/Central City BudgetFederal vs Local
51%49%
Federal & State Budget
Local Cash & TIF Budget
(Net outstanding TIF Loan as of 6/30/21 of $189,101,132)

$0
$100,000,000
$200,000,000
$300,000,000
$400,000,000
$500,000,000
$600,000,000
United States Army Corp of Engineers(USACE)
Federal Budget vs Actual as of 3/31/21
Budget Actuals through 3/31/21
Panther Island/Central City - Flood Control ProjectBudget vs Actual as of 6/30/21
$0
$50,000,000
$100,000,000
$150,000,000
$200,000,000
$250,000,000
$300,000,000
TRWD City of Fort Worth
Local Budget vs Actual as of 6/30/21
Budget Actuals through 6/30/21
Note: USACE latest report as of 3/31/21
Remaining TRWD Budget - $45.9M Remaining City of FW Budget - $88.4M
Remaining USACE Budget - $478.7M
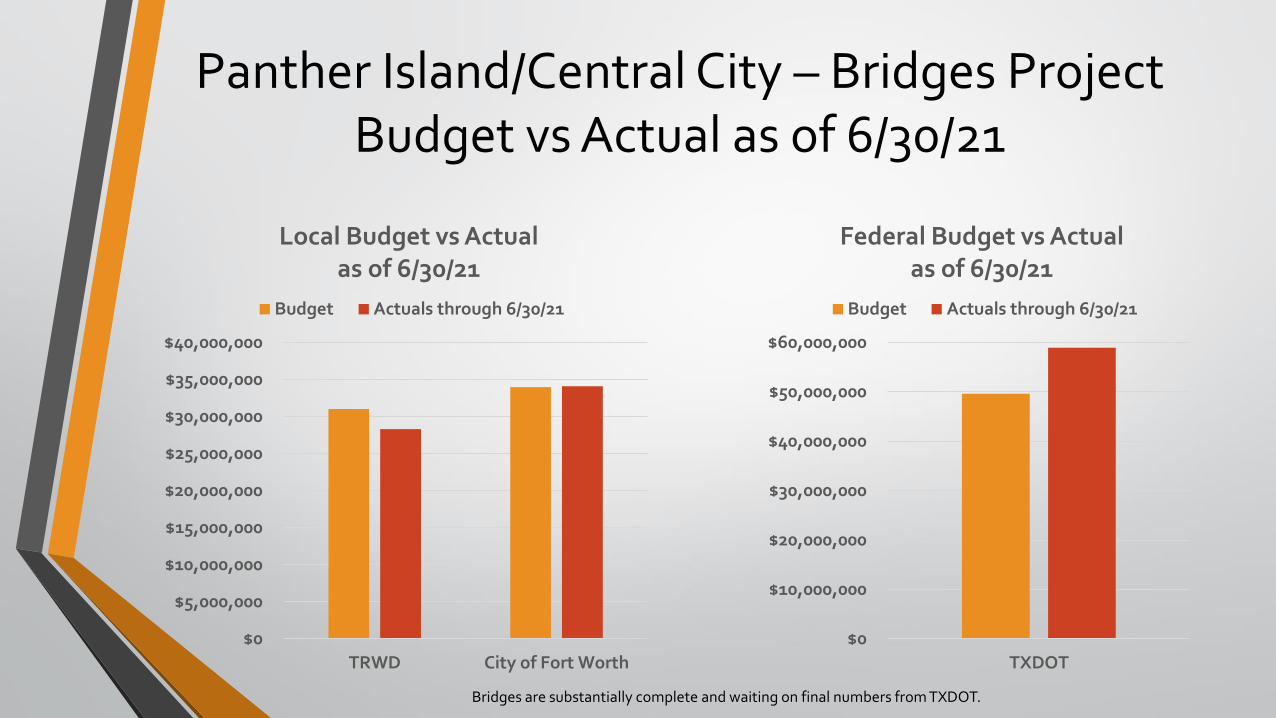
Panther Island/Central City – Bridges ProjectBudget vs Actual as of 6/30/21
$0
$5,000,000
$10,000,000
$15,000,000
$20,000,000
$25,000,000
$30,000,000
$35,000,000
$40,000,000
TRWD City of Fort Worth
Local Budget vs Actual as of 6/30/21
Budget Actuals through 6/30/21
$0
$10,000,000
$20,000,000
$30,000,000
$40,000,000
$50,000,000
$60,000,000
TXDOT
Federal Budget vs Actual as of 6/30/21
Budget Actuals through 6/30/21
Bridges are substantially complete and waiting on final numbers from TXDOT.
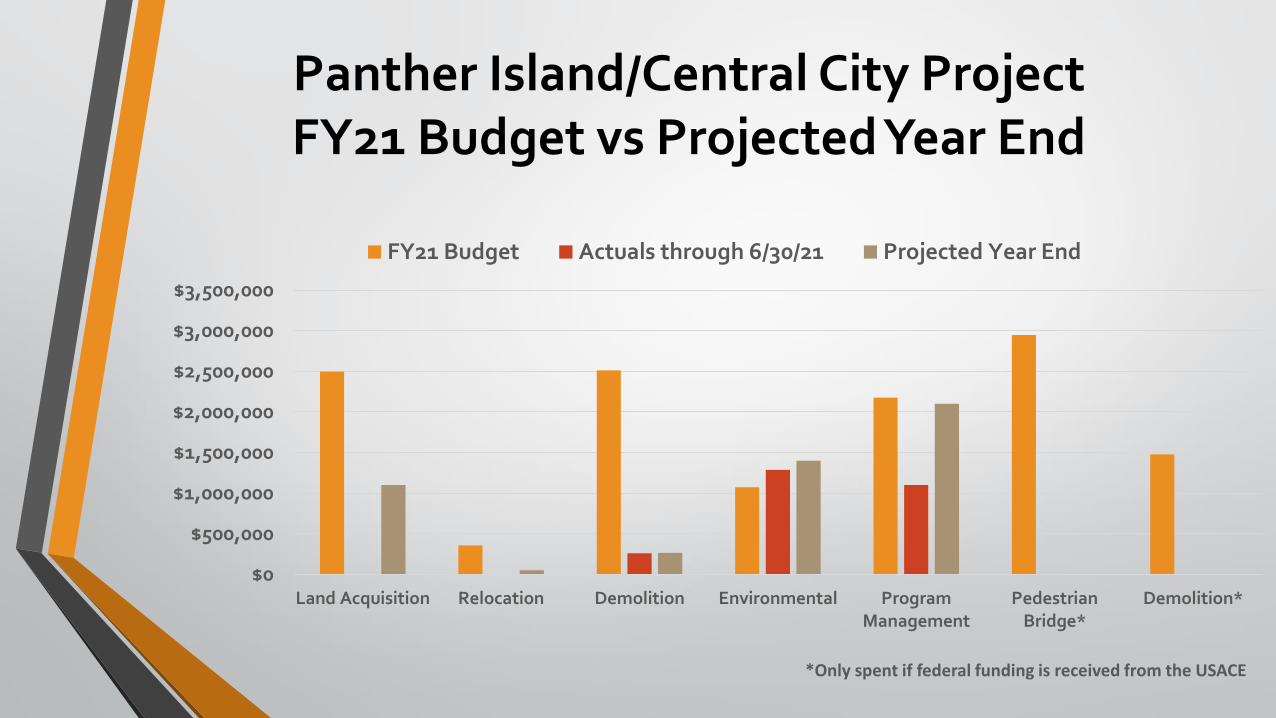
Panther Island/Central City ProjectFY21 Budget vs Projected Year End
*Only spent if federal funding is received from the USACE
$0
$500,000
$1,000,000
$1,500,000
$2,000,000
$2,500,000
$3,000,000
$3,500,000
Land Acquisition Relocation Demolition Environmental ProgramManagement
PedestrianBridge*
Demolition*
FY21 Budget Actuals through 6/30/21 Projected Year End

Status of Governmental Extendable Commercial Paper Bonds
As of 6/30/21
Total GECPB Program $ 150,000,000
Net Previous Program Issuances -
FY21 Total Issuances -
FY21 Total Retirements -
Available Governmental ECPB to Issue as of 6/30/21 $ 150,000,000
Total GECPB Program $ 150,000,000
Current Board Approvals On Program -
Available Governmental ECPB for Board Approval as of 6/30/21 $ 150,000,000

TIF 9 & 9a Collection ReportTotal projected through FY21
$0
$1,000,000
$2,000,000
$3,000,000
$4,000,000
$5,000,000
$6,000,000
$7,000,000
$8,000,00020
05
200
6
200
7
200
8
200
9
2010
2011
2012
2013
2014
2015
2016
2017
2018
2019
202
0
202
1*
TIF 9 Collections by Year
TXP Model (updated 2018) Actuals
$0
$10,000,000
$20,000,000
$30,000,000
$40,000,000
$50,000,000
$60,000,000
200
5
200
6
200
7
200
8
200
9
2010
2011
2012
2013
2014
2015
2016
2017
2018
2019
202
0
202
1*
TIF 9 Total Cumulative Collections by Year
TXP Cumulative Actuals Cumulative
*N
ote
: 20
21 is
ex
pe
cte
d c
oll
ect
ion
s
TIF 9&9A have collected $48 million through FY21 and are expected to collect an additional $375 million through FY44.
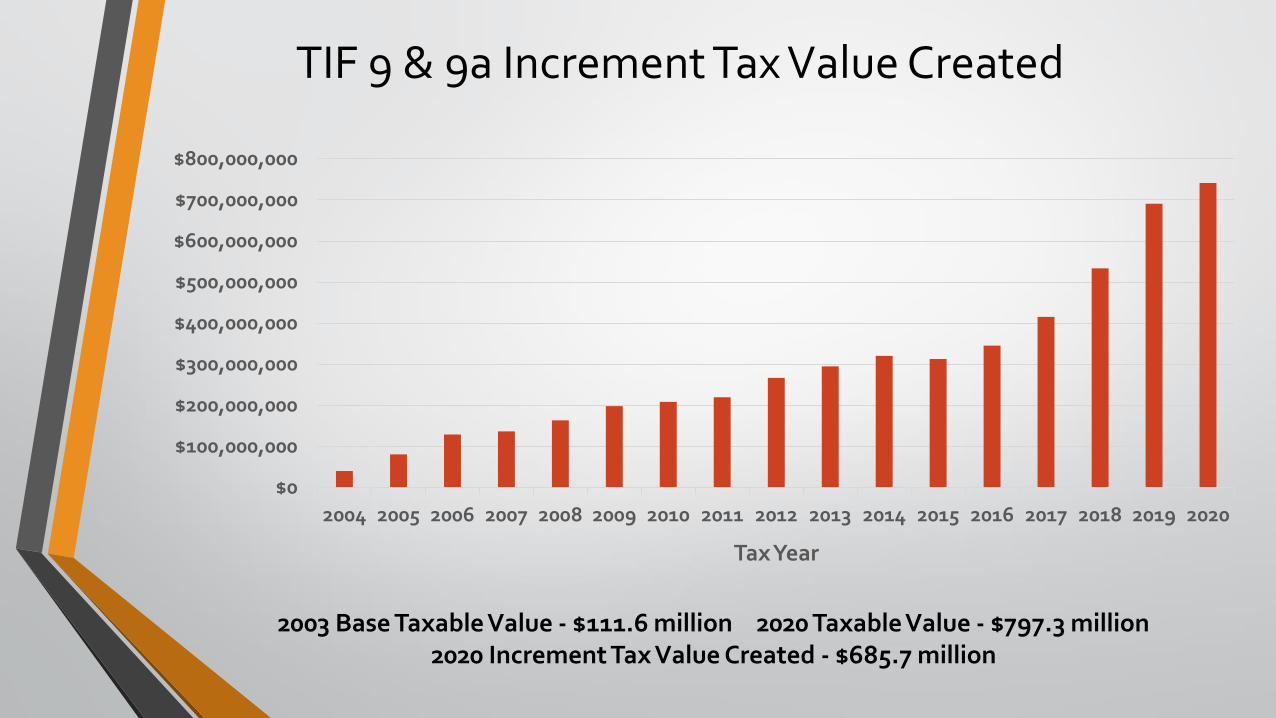
TIF 9 & 9a Increment Tax Value Created
$0
$100,000,000
$200,000,000
$300,000,000
$400,000,000
$500,000,000
$600,000,000
$700,000,000
$800,000,000
2004 2005 2006 2007 2008 2009 2010 2011 2012 2013 2014 2015 2016 2017 2018 2019 2020
Tax Year
2003 Base Taxable Value - $111.6 million 2020 Taxable Value - $797.3 million2020 Increment Tax Value Created - $685.7 million
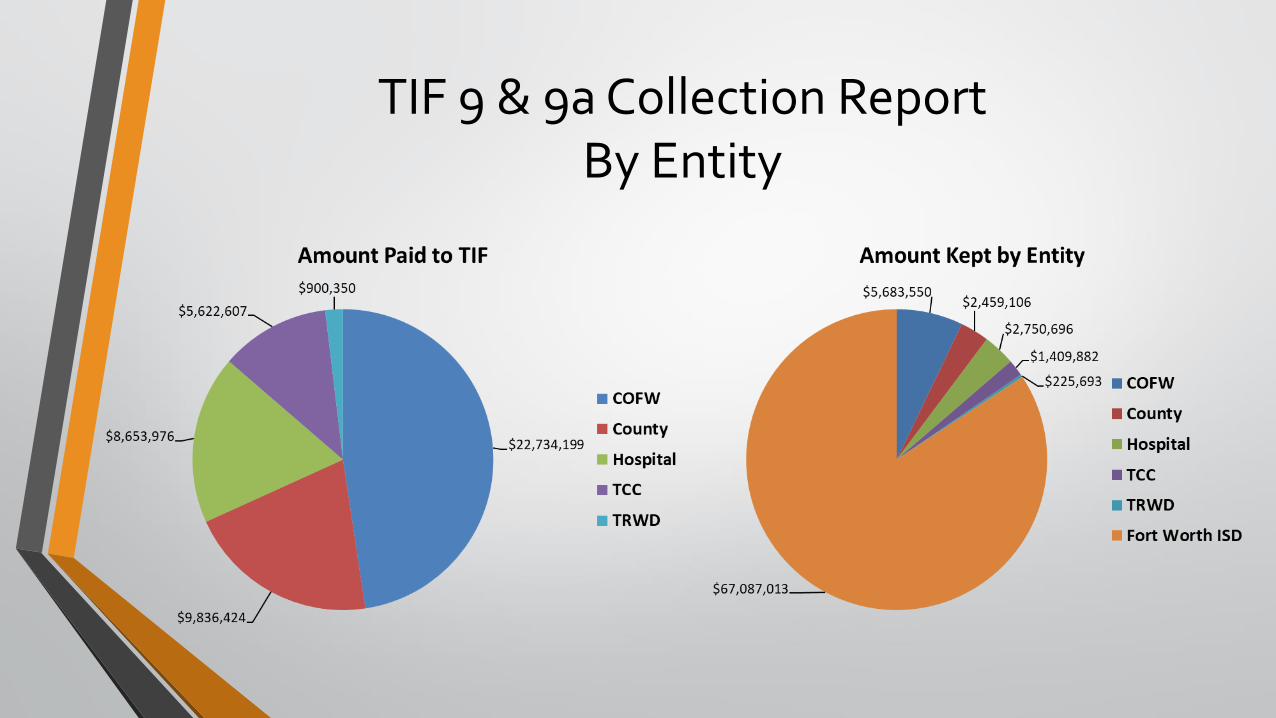
TIF 9 & 9a Collection ReportBy Entity

Investment Update
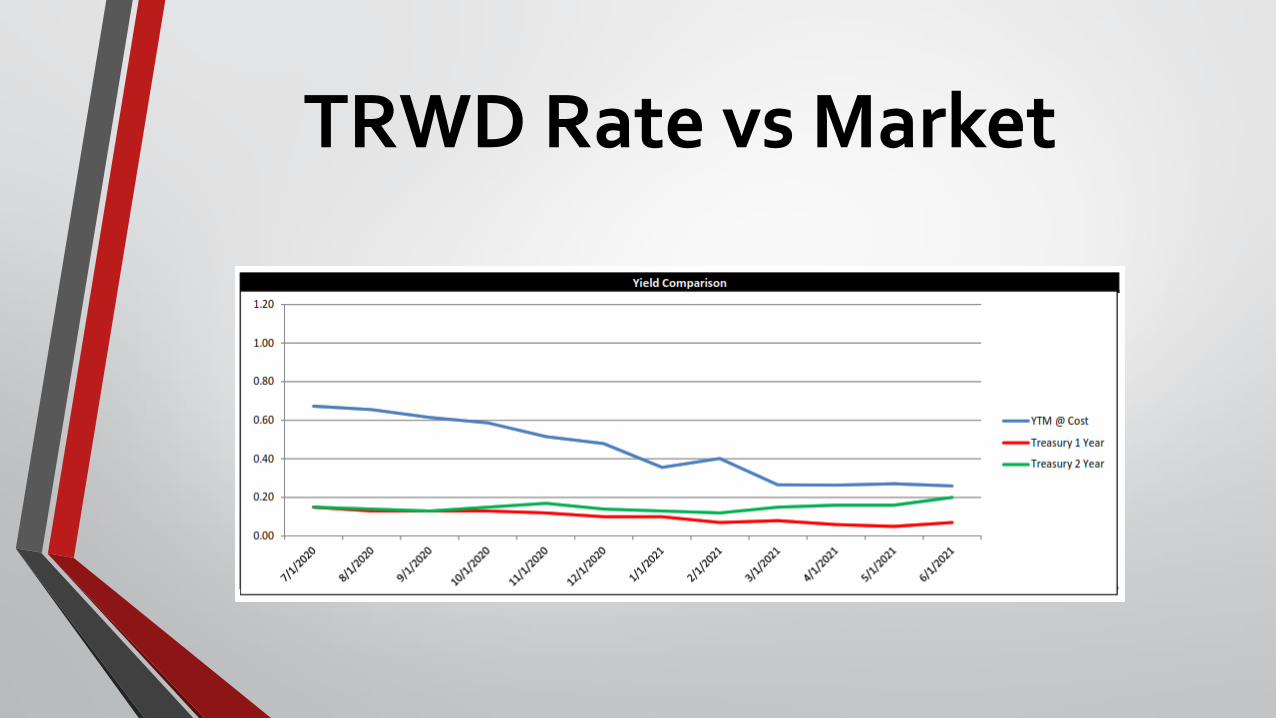
TRWD Rate vs Market

TRWD Days to Maturity

TRWD Holdings by Issuer


![Quarterly Updates [Company Update]](https://img.pdfslide.us/doc/110x75/577c7caa1a28abe0549b84ea/quarterly-updates-company-update.jpg)