Embed Size (px)
Citation preview

Data driven insights into what makes school districts successful.
A report commissioned by the Children’s Defense Fund-Southern Regional Office .
A 21st CENTURY CALL TO ACTION
TTRUTHFUL RUTHFUL EEYESYESA LOOK AT MISSISSIPPI SCHOOLS
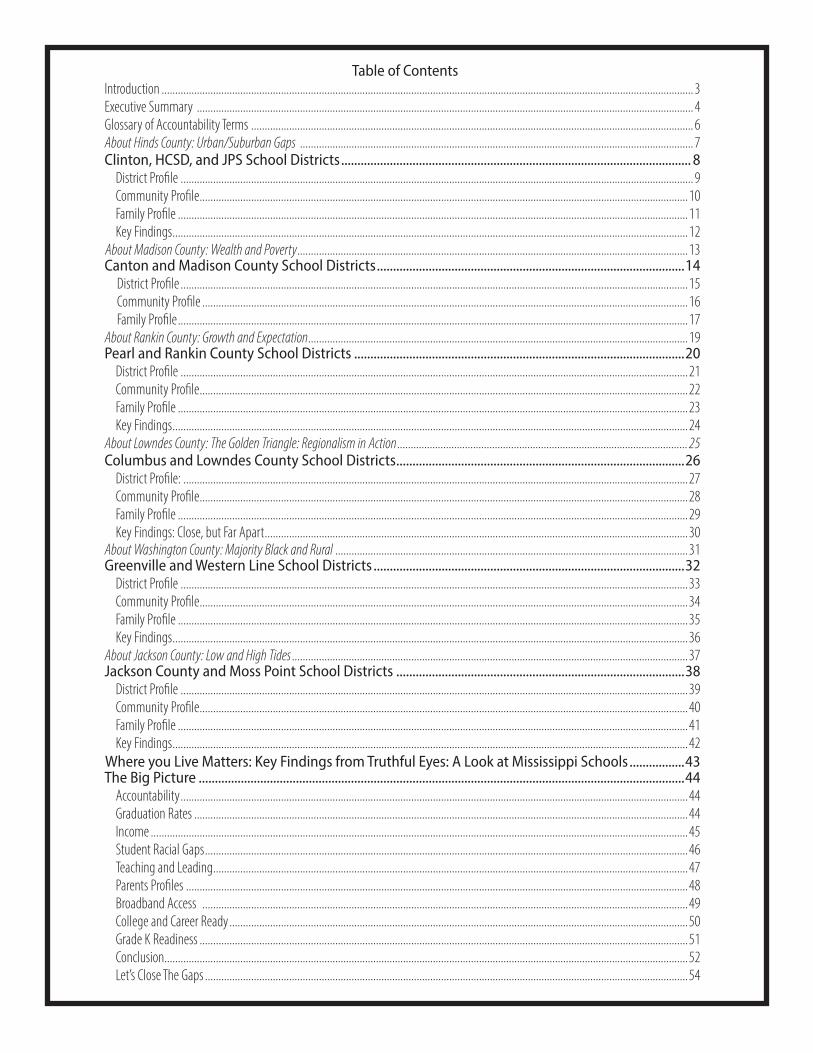
Table of ContentsIntroduction..................................................................................................................................................................................................... 3Executive.Summary......................................................................................................................................................................................... 4Glossary.of.Accountability.Terms..................................................................................................................................................................... 6About Hinds County: Urban/Suburban Gaps................................................................................................................................................... 7Clinton, HCSD, and JPS School Districts ............................................................................................................ 8District.Profile.............................................................................................................................................................................................. 9Community.Profile.....................................................................................................................................................................................10Family.Profile.............................................................................................................................................................................................11Key.Findings...............................................................................................................................................................................................12
About Madison County: Wealth and Poverty.................................................................................................................................................13Canton and Madison County School Districts ...............................................................................................14.....District.Profile............................................................................................................................................................................................15.....Community.Profile....................................................................................................................................................................................16.....Family.Profile.............................................................................................................................................................................................17About Rankin County: Growth and Expectation.............................................................................................................................................19Pearl and Rankin County School Districts ......................................................................................................20District.Profile............................................................................................................................................................................................21Community.Profile.....................................................................................................................................................................................22Family.Profile.............................................................................................................................................................................................23Key.Findings...............................................................................................................................................................................................24
About Lowndes County: The Golden Triangle: Regionalism in Action ...........................................................................................................25Columbus and Lowndes County School Districts .........................................................................................26District.Profile:...........................................................................................................................................................................................27Community.Profile.....................................................................................................................................................................................28Family.Profile.............................................................................................................................................................................................29Key.Findings:.Close,.but.Far.Apart.............................................................................................................................................................30
About Washington County: Majority Black and Rural...................................................................................................................................31Greenville and Western Line School Districts ................................................................................................32District.Profile............................................................................................................................................................................................33.Community.Profile.....................................................................................................................................................................................34Family.Profile.............................................................................................................................................................................................35Key.Findings...............................................................................................................................................................................................36
About Jackson County: Low and High Tides...................................................................................................................................................37Jackson County and Moss Point School Districts .........................................................................................38 District.Profile............................................................................................................................................................................................39Community.Profile.....................................................................................................................................................................................40Family.Profile.............................................................................................................................................................................................41Key.Findings...............................................................................................................................................................................................42
Where you Live Matters: Key Findings from Truthful Eyes: A Look at Mississippi Schools .................43The Big Picture ......................................................................................................................................................44Accountability............................................................................................................................................................................................44Graduation.Rates.......................................................................................................................................................................................44Income.......................................................................................................................................................................................................45Student.Racial.Gaps...................................................................................................................................................................................46Teaching.and.Leading................................................................................................................................................................................47Parents.Profiles..........................................................................................................................................................................................48Broadband.Access......................................................................................................................................................................................49College.and.Career.Ready..........................................................................................................................................................................50Grade.K.Readiness.....................................................................................................................................................................................51Conclusion..................................................................................................................................................................................................52Let’s.Close.The.Gaps...................................................................................................................................................................................54.
3
NTRODUCTIONI440,000Students
140Public.schooldistricts
31A.districts
35B.districts
35C.districts.
42D.or.F districts
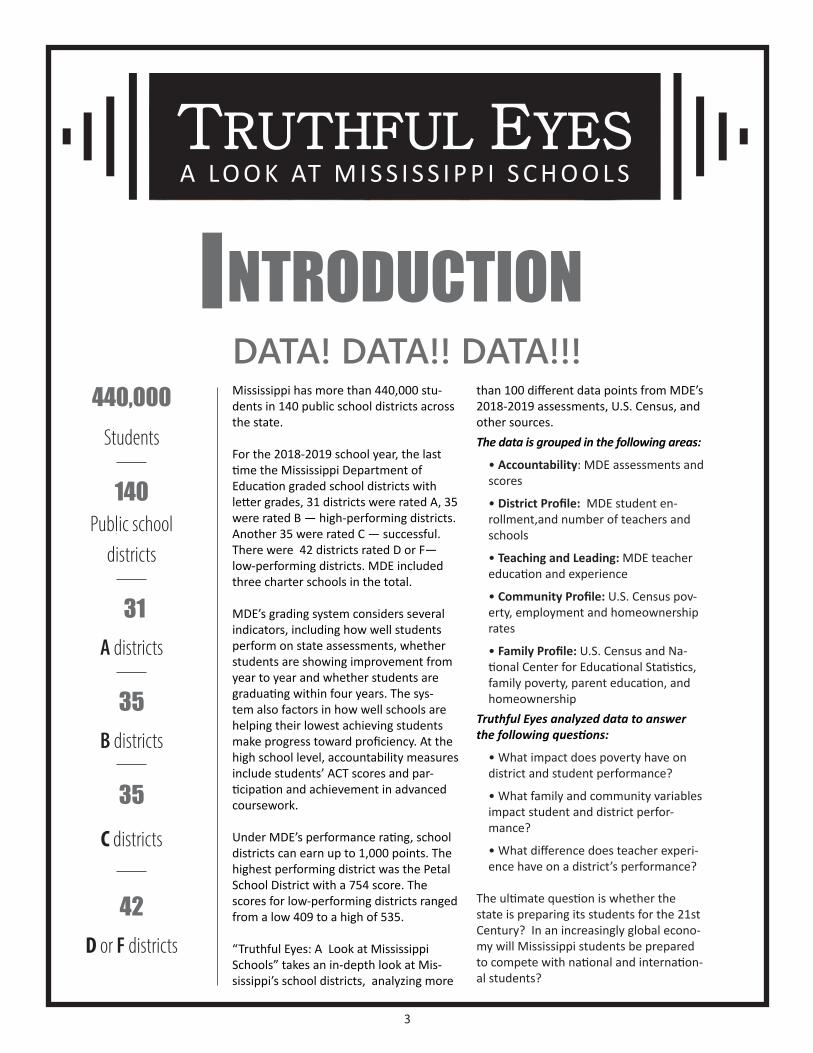
Mississippi has more than 440,000 stu-dents in 140 public school districts across the state.
For the 2018-2019 school year, the last time the Mississippi Department of Education graded school districts with letter grades, 31 districts were rated A, 35 were rated B — high-performing districts. Another 35 were rated C — successful. There were 42 districts rated D or F— low-performing districts. MDE included three charter schools in the total.
MDE’s grading system considers several indicators, including how well students perform on state assessments, whether students are showing improvement from year to year and whether students are graduating within four years. The sys-tem also factors in how well schools are helping their lowest achieving students make progress toward proficiency. At the high school level, accountability measures include students’ ACT scores and par-ticipation and achievement in advanced coursework.
Under MDE’s performance rating, school districts can earn up to 1,000 points. The highest performing district was the Petal School District with a 754 score. The scores for low-performing districts ranged from a low 409 to a high of 535.
“Truthful Eyes: A Look at Mississippi Schools” takes an in-depth look at Mis-sissippi’s school districts, analyzing more
than 100 different data points from MDE’s 2018-2019 assessments, U.S. Census, and other sources. The data is grouped in the following areas:
• Accountability: MDE assessments and scores
• District Profile: MDE student en-rollment,and number of teachers and schools
• Teaching and Leading: MDE teacher education and experience
• Community Profile: U.S. Census pov-erty, employment and homeownership rates
• Family Profile: U.S. Census and Na-tional Center for Educational Statistics, family poverty, parent education, and homeownership
Truthful Eyes analyzed data to answer the following questions:
• What impact does poverty have on district and student performance?
• What family and community variables impact student and district perfor-mance?
• What difference does teacher experi-ence have on a district’s performance?
The ultimate question is whether the state is preparing its students for the 21st Century? In an increasingly global econo-my will Mississippi students be prepared to compete with national and internation-al students?
DATA! DATA!! DATA!!!
TTRUTHFUL RUTHFUL EEYESYESA LO O K AT M I S S I S S I P P I S C H O O L S
4
xecutive ummaryE S13
School.districts.examined
6Counties.chosen.as.
microcosm.across.state:
HINDSMADISON
RANKINLOWNDES
WASHINGTONJACKSON
DEMOGRAPHICSBlack.districts
Majority.white.districtsDiverse.districtsGeographically.dispersed.districtsacross.the.state
Districts: Who is successful and why?And is it enough?
Mississippi’s public schools are under-funded. Mississippi ranks 47th in the nation in per-pupil spending. Mississippi is losing population. Mississippi is one of only three states that lost population in the most recent census. Three of the six counties we analyzed lost population.
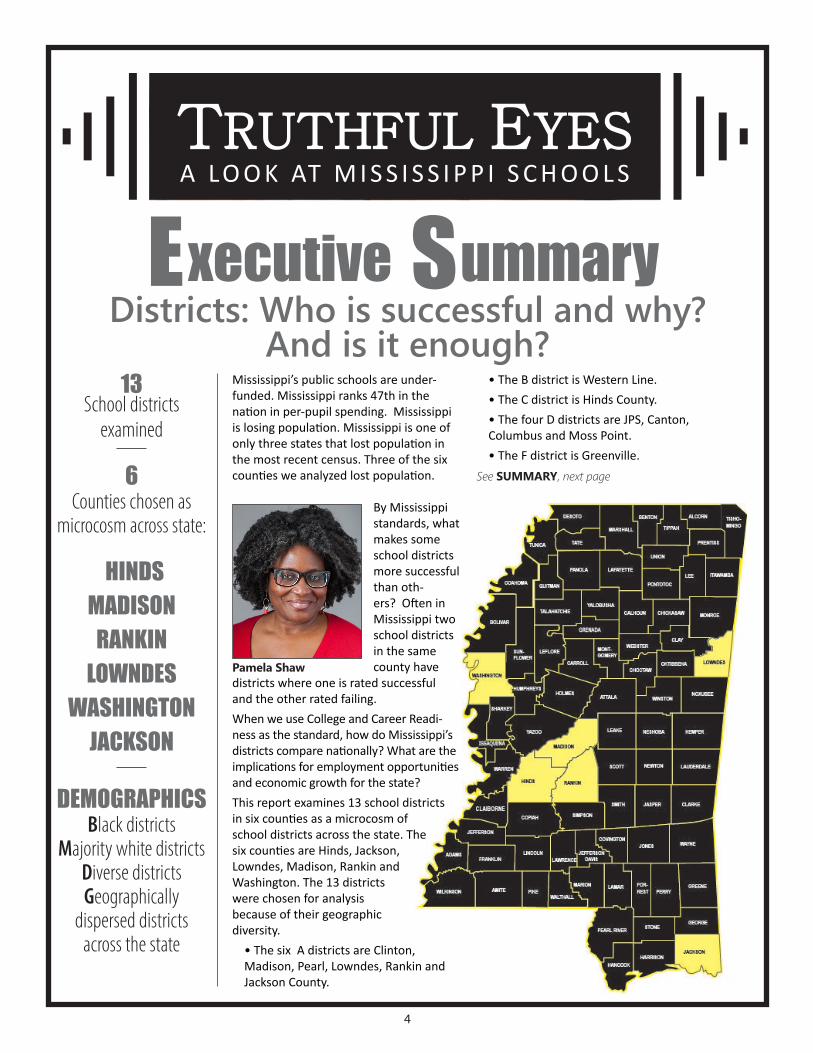
By Mississippi standards, what makes some school districts more successful than oth-ers? Often in Mississippi two school districts in the same county have
districts where one is rated successful and the other rated failing.When we use College and Career Readi-ness as the standard, how do Mississippi’s districts compare nationally? What are the implications for employment opportunities and economic growth for the state?This report examines 13 school districts in six counties as a microcosm of school districts across the state. The six counties are Hinds, Jackson, Lowndes, Madison, Rankin and Washington. The 13 districts were chosen for analysis because of their geographic diversity.
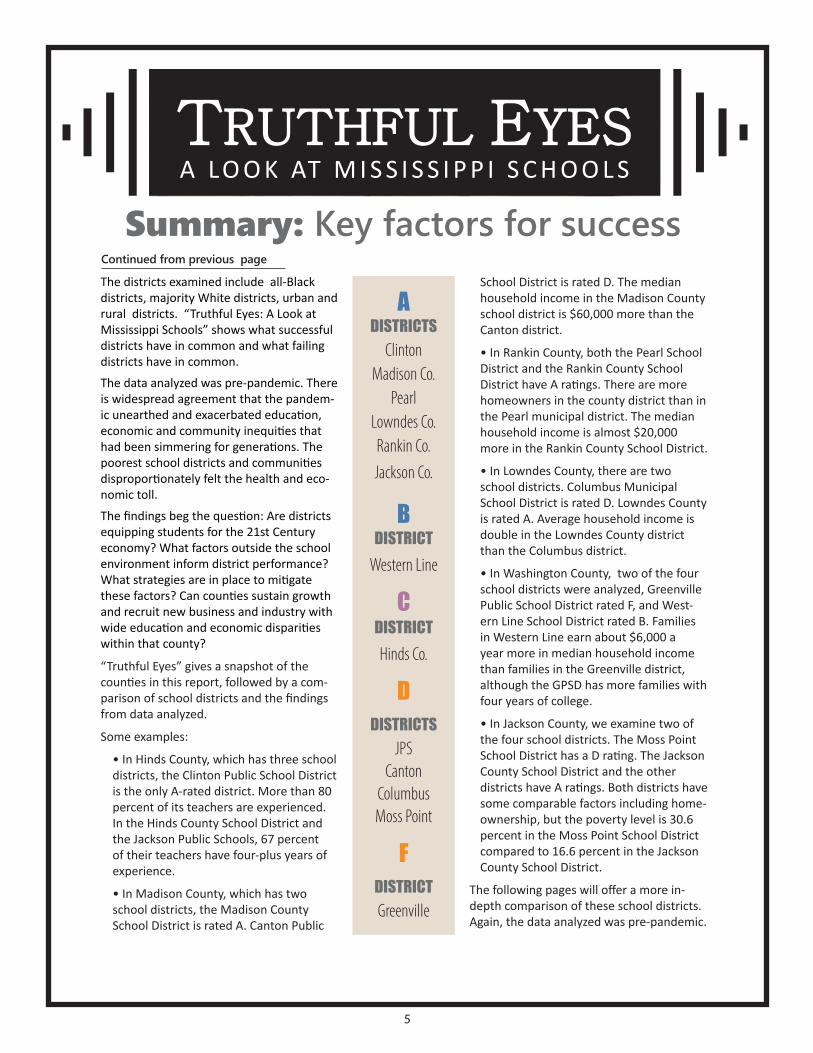
• The six A districts are Clinton, Madison, Pearl, Lowndes, Rankin and Jackson County.
• The B district is Western Line.• The C district is Hinds County.• The four D districts are JPS, Canton, Columbus and Moss Point.• The F district is Greenville.
Pamela Shaw
See SUMMARY, next page
TTRUTHFUL RUTHFUL EEYESYESA LO O K AT M I S S I S S I P P I S C H O O L S
5
TTRUTHFUL RUTHFUL EEYESYESA LO O K AT M I S S I S S I P P I S C H O O L S
Summary: Key factors for successContinued from previous page
School District is rated D. The median household income in the Madison County school district is $60,000 more than the Canton district.
• In Rankin County, both the Pearl School District and the Rankin County School District have A ratings. There are more homeowners in the county district than in the Pearl municipal district. The median household income is almost $20,000 more in the Rankin County School District.
• In Lowndes County, there are two school districts. Columbus Municipal School District is rated D. Lowndes County is rated A. Average household income is double in the Lowndes County district than the Columbus district.
• In Washington County, two of the four school districts were analyzed, Greenville Public School District rated F, and West-ern Line School District rated B. Families in Western Line earn about $6,000 a year more in median household income than families in the Greenville district, although the GPSD has more families with four years of college.
• In Jackson County, we examine two of the four school districts. The Moss Point School District has a D rating. The Jackson County School District and the other districts have A ratings. Both districts have some comparable factors including home-ownership, but the poverty level is 30.6 percent in the Moss Point School District compared to 16.6 percent in the Jackson County School District.
The following pages will offer a more in-depth comparison of these school districts. Again, the data analyzed was pre-pandemic.
A DISTRICTSClinton
Madison.Co.Pearl
Lowndes.Co.Rankin.Co.Jackson.Co.
B DISTRICTWestern.Line
CDISTRICTHinds.Co.
DDISTRICTS
JPSCantonColumbusMoss.Point
FDISTRICTGreenville
The districts examined include all-Black districts, majority White districts, urban and rural districts. “Truthful Eyes: A Look at Mississippi Schools” shows what successful districts have in common and what failing districts have in common.
The data analyzed was pre-pandemic. There is widespread agreement that the pandem-ic unearthed and exacerbated education, economic and community inequities that had been simmering for generations. The poorest school districts and communities disproportionately felt the health and eco-nomic toll.
The findings beg the question: Are districts equipping students for the 21st Century economy? What factors outside the school environment inform district performance? What strategies are in place to mitigate these factors? Can counties sustain growth and recruit new business and industry with wide education and economic disparities within that county?
“Truthful Eyes” gives a snapshot of the counties in this report, followed by a com-parison of school districts and the findings from data analyzed.
Some examples:
• In Hinds County, which has three school districts, the Clinton Public School District is the only A-rated district. More than 80 percent of its teachers are experienced. In the Hinds County School District and the Jackson Public Schools, 67 percent of their teachers have four-plus years of experience.
• In Madison County, which has two school districts, the Madison County School District is rated A. Canton Public
6
TTRUTHFUL RUTHFUL EEYESYESA LO O K AT M I S S I S S I P P I S C H O O L S
Glossary of Accountability Terms: **
1......Reading (English) Proficiency -..Percent.of.students.scoring.Proficient.or.Advanced.(Levels.4.or.5).on.the.statewide.MAAP.ELA.or.English.II.assessment.
2.......Reading (English) Growth -..Points.awarded.to.students.making.adequate.progress.in.performance.on.the.statewide.English.assessment.from.one.year.to.the.next.
3...... Reading (English) Low Growth - .Points.earned.for.growth.for.students.in.the.lowest.25%.of.performance.on.the.statewide.English.assessment.
4.......History Proficiency - Percent.of.school.students.scoring.Proficient.or.Advanced.(Levels.3.or4).on.the.statewide.U.S..History.assessment.
5.......Math Proficiency - Percent.of.students.scoring.Proficient.or.Advanced.(Levels.4.or.5).on.the.statewide.MAAP.math.or.Algebra.I.assessment.
6.......Math Growth - Points.awarded.to.students.making.adequate.progress.in.performance.on.the.statewide.math.assessment.from.one.year.to.the.next.
7.......Math Low Growth - Points.earned.for.growth.of.students.in.the.lowest.25%.of.performance.on.the.statewide.math.assessment.
8...... Science Proficiency - Percent.of.students.scoring.Proficient.or.Advanced.(Levels.4.or.5).on.the.statewide.Science.or.Biology.I.assessment.
9...... Acceleration - The.number.of.points.earned.for.a.combination.of.student.participation.and.performance.in.accelerated.courses.(Advanced.Placement,.Dual.Credit/Dual.Enrollment,.Internation-al.Baccalaureate,.Cambridge.and.Industry.Certification).
10....College & Career Readiness - Percentage.of.high.school.students.who.met.the.ACT.bench-marks.for.English.(18).or.reading.(22).and.for.math.(22).
11....Graduation Rate - Percentage.of.students.who.graduated.within.four.years.
12....*18-19 Experienced Teachers - Percentage.of.teachers.with.four.or.more.years.of.teaching.experience.
13....*.18-19 In-Field Teachers - The.percentage.of.teachers.with.a.valid.certificate.and.teaching.a.course.for.which.they.are.properly.endorsed.
14.....*.18-19 Provisional Teachers - .Percent.of.teachers.that.hold.an.emergency.or.provisional.license,.a.valid.license.to.teach.in.Mississippi.
.........*.2018-2019.School.year. . **.As.defined.by.MDE.
7
indsABOUTH DESOTO
ITAWAMBA
MARSHALL
BENTON
TIPPAH
PRENTISS
ALCORN TISHO-MINGO
TUNICA
PANOLA LAFAYETTE
UNION
LEEPONTOTOCCOAHOMA
BOLIVAR
WASHINGTON
SHARKEY
YAZOO
MADISON
LEAKE NESHOBA KEMPER
LAUDERDALENEWTONSCOTT
RANKINHINDS
CLAIBORNE
JEFFERSON
ADAMSFRANKLIN
LINCOLNLAWRENCE
JEFFERSONDAVIS
COPIAH SIMPSON
SMITH
COVINGTON
JASPER
JONES WAYNE
WILKINSON AMITE PIKEWALTHALL
MARION LAMAR
PEARL RIVER
FOR-REST PERRY
STONE
HANCOCKHARRISON
JACKSON
GEORGE
GREENE
CLARKE
WARREN
ISSAQUENA
SUN-FLOWER
HUMPHREYSHOLMES
CARROLL
LEFLORE
ATTALA WINSTONNOXUBEE
QUITMAN
TALAHATCHIEYALOBUSHA
GRENADA
CALHOUN CHICKASAW MONROE
CLAY
OKTIBBEHACHOCTAW
WEBSTERMONT-GOMERY
LOWNDES
TATE
COUNTY
Population245,364
African Americans71.3.Percent
White25.1.Percent
Hispanic/Latino1.6.Percent
Asians0.7.Percent
Per Capita Income$23,734
Major Employers: Mississippi.state.government..|. University.of.Mississippi.Medical.Center..|..City.of.Jackson.....Baptist.Health.Systems..|..St..Dominic.Health.Services..|..Continental.Tire
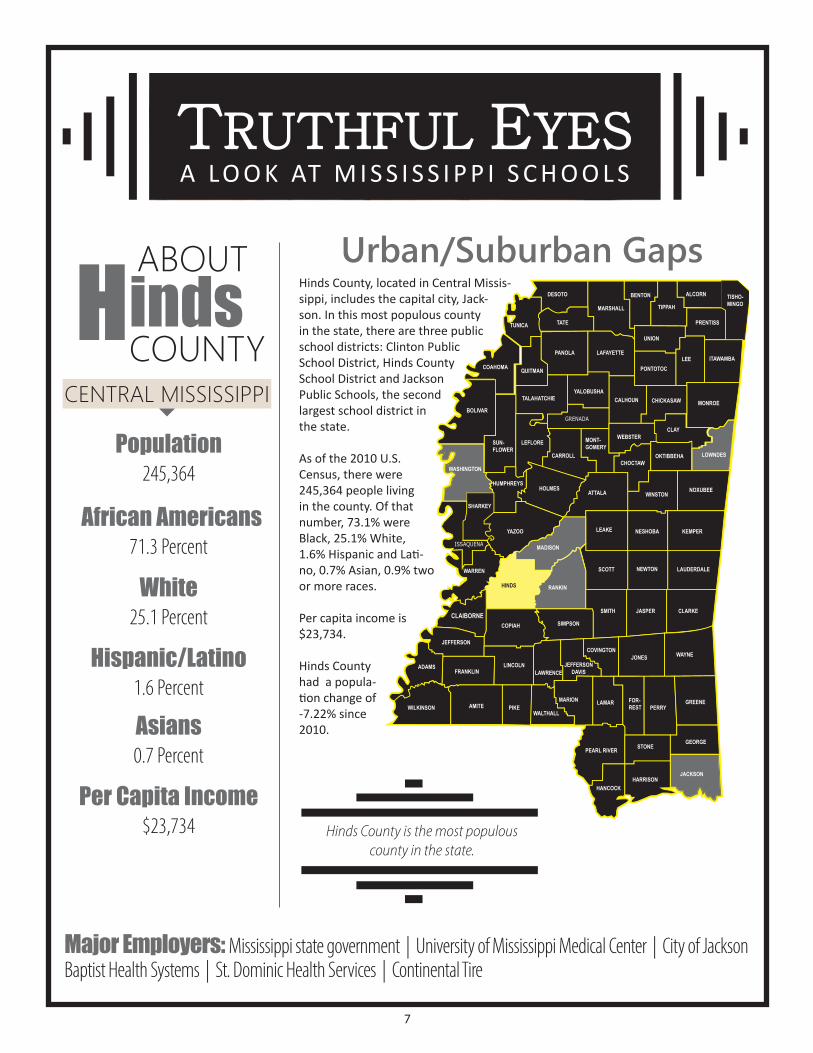
Hinds County is the most populous county in the state.
Urban/Suburban Gaps Hinds County, located in Central Missis-sippi, includes the capital city, Jack-son. In this most populous county in the state, there are three public school districts: Clinton Public School District, Hinds County School District and Jackson Public Schools, the second largest school district in the state.
As of the 2010 U.S. Census, there were 245,364 people living in the county. Of that number, 73.1% were Black, 25.1% White, 1.6% Hispanic and Lati-no, 0.7% Asian, 0.9% two or more races.
Per capita income is $23,734.
Hinds County had a popula-tion change of -7.22% since 2010.
CENTRAL MISSISSIPPI
TTRUTHFUL RUTHFUL EEYESYESA LO O K AT M I S S I S S I P P I S C H O O L S

8
Clinton 729 A
Hinds County 585 C
JPS 504 D
Clinton 19.70
HCSD 16.50
JPS 15.00
BY THE NUMBERS
ACCOUNTABILITY
ACT SCORES
TRUTHFUL EYES: TRUTHFUL EYES: A LOOK AT MISSISSIPPI SCHOOLSHINDS COUNTY
FINDINGSClinton outperforms Hinds County and JPS on math proficiency by 27% and 45% and read-ing proficiency by 26%
and 34%.
There is less than a 2 percentage point differ-ence in the graduation rates in Clinton and
Hinds County, however, there is an almost 20 percentage point dif-ference in college and
career readiness.
ASSESSMENTS: GRADUATION
ASSESSMENTS: MATH AND SCIENCE
ASSESSMENTS: READING AND HISTORY
9
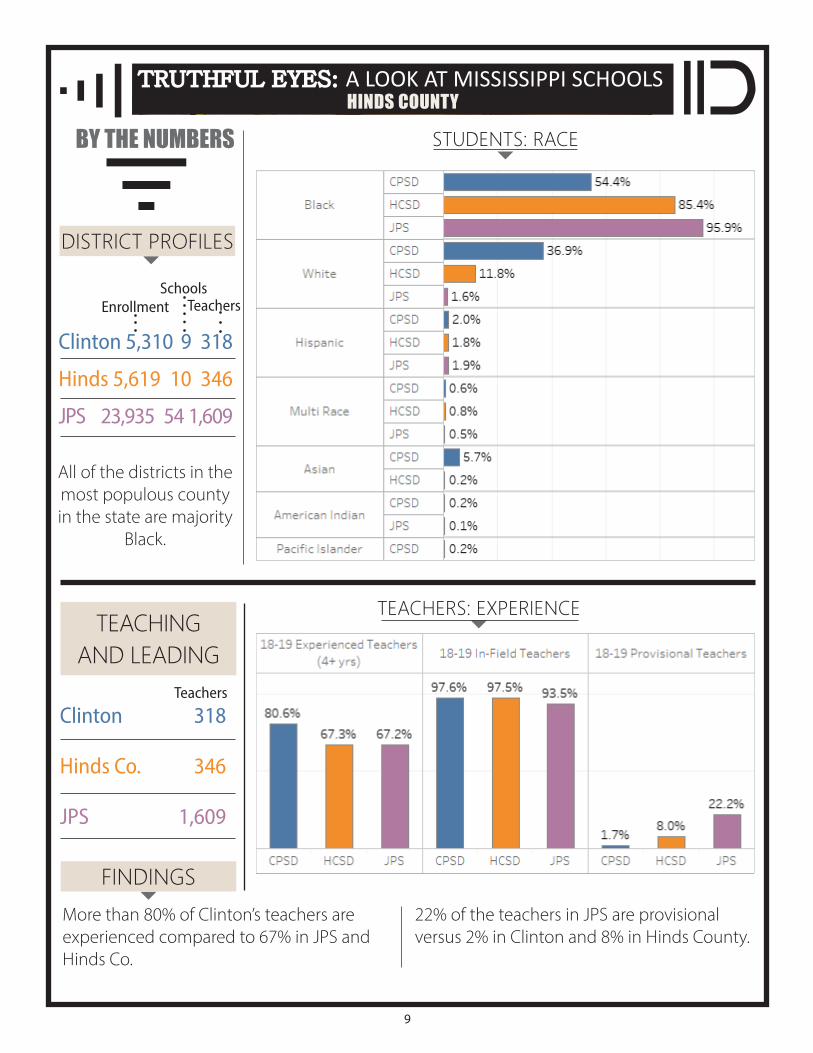
Clinton 5,310 9 318
Hinds 5,619 10 346
JPS 23,935 54 1,609
Clinton 318
Hinds Co. 346
JPS 1,609
BY THE NUMBERS
TRUTHFUL EYES: TRUTHFUL EYES: A LOOK AT MISSISSIPPI SCHOOLSHINDS COUNTY
TEACHING AND LEADING
DISTRICT PROFILES
EnrollmentSchools
Teachers
Teachers
All of the districts in the most populous county in the state are majority
Black.
More than 80% of Clinton’s teachers are experienced compared to 67% in JPS and Hinds Co.
22% of the teachers in JPS are provisional versus 2% in Clinton and 8% in Hinds County.
TEACHERS: EXPERIENCE
STUDENTS: RACE
FINDINGS
10
TRUTHFUL EYES: TRUTHFUL EYES: A LOOK AT MISSISSIPPI SCHOOLSHINDS COUNTY
BY THE NUMBERS
COMMUNITYPROFILES
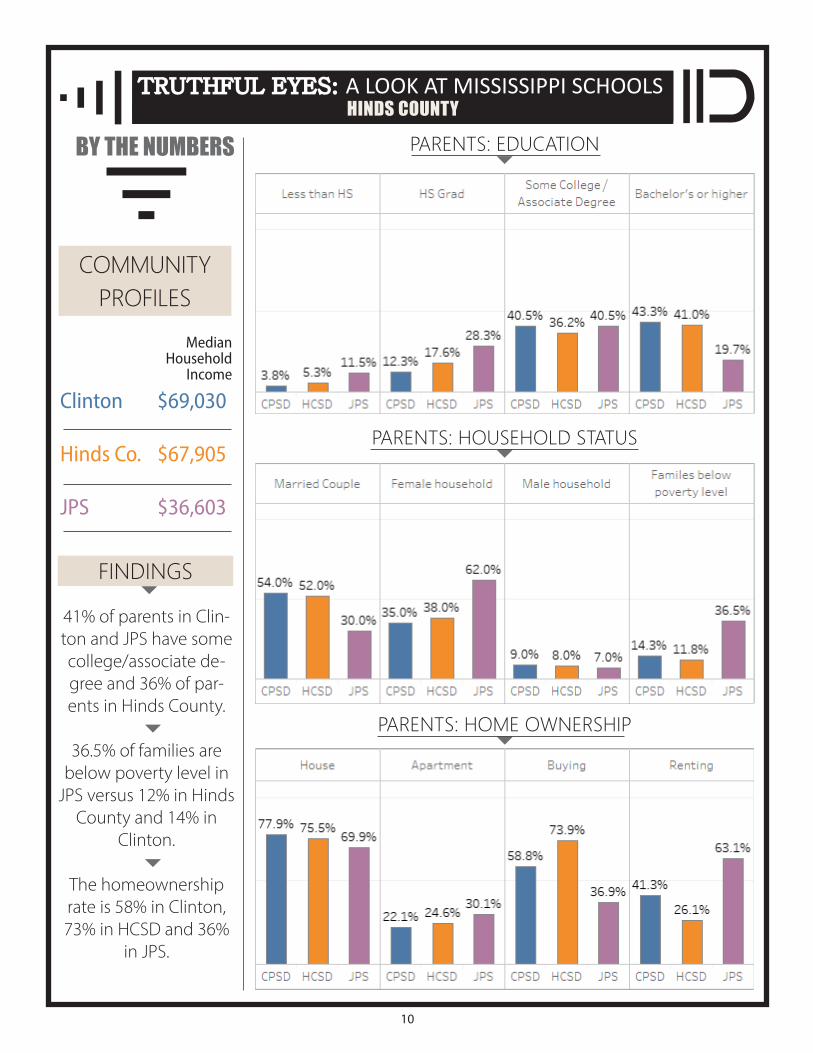
Clinton $69,030
Hinds Co. $67,905
JPS $36,603
Median Household
Income
FINDINGS
41% of parents in Clin-ton and JPS have some college/associate de-gree and 36% of par-ents in Hinds County.
36.5% of families are below poverty level in JPS versus 12% in Hinds County and 14% in
Clinton.
The homeownership rate is 58% in Clinton, 73% in HCSD and 36%
in JPS.
PARENTS: HOUSEHOLD STATUS
PARENTS: HOME OWNERSHIP
PARENTS: EDUCATION
11
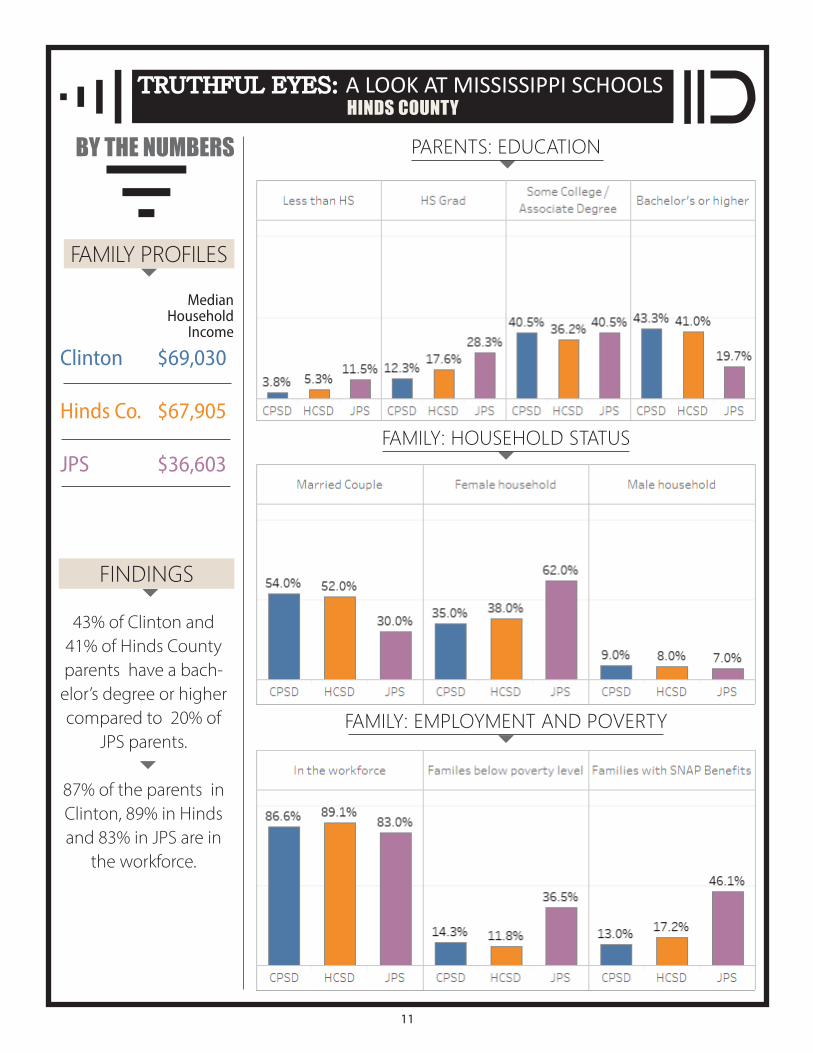
43% of Clinton and 41% of Hinds County parents have a bach-elor’s degree or higher compared to 20% of
JPS parents.
87% of the parents in Clinton, 89% in Hinds and 83% in JPS are in
the workforce.
TRUTHFUL EYES: TRUTHFUL EYES: A LOOK AT MISSISSIPPI SCHOOLSHINDS COUNTY
BY THE NUMBERS
Clinton $69,030
Hinds Co. $67,905
JPS $36,603
FINDINGS
PARENTS: EDUCATION
FAMILY: HOUSEHOLD STATUS
FAMILY: EMPLOYMENT AND POVERTY
FAMILY PROFILES
Median Household
Income
12
EY FINDINGSK
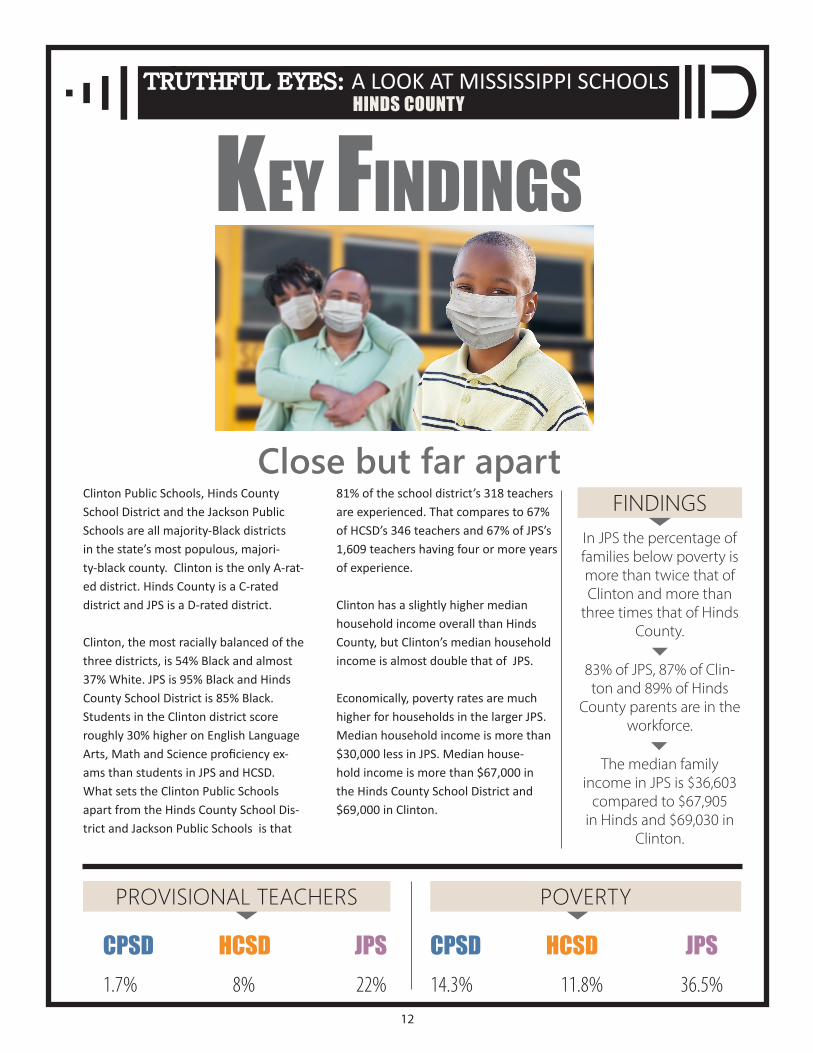
Clinton Public Schools, Hinds County School District and the Jackson Public Schools are all majority-Black districts in the state’s most populous, majori-ty-black county. Clinton is the only A-rat-ed district. Hinds County is a C-rated district and JPS is a D-rated district.
Clinton, the most racially balanced of the three districts, is 54% Black and almost 37% White. JPS is 95% Black and Hinds County School District is 85% Black. Students in the Clinton district score roughly 30% higher on English Language Arts, Math and Science proficiency ex-ams than students in JPS and HCSD. What sets the Clinton Public Schools apart from the Hinds County School Dis-trict and Jackson Public Schools is that
81% of the school district’s 318 teachers are experienced. That compares to 67% of HCSD’s 346 teachers and 67% of JPS’s 1,609 teachers having four or more years of experience. Clinton has a slightly higher median household income overall than Hinds County, but Clinton’s median household income is almost double that of JPS. Economically, poverty rates are much higher for households in the larger JPS. Median household income is more than $30,000 less in JPS. Median house-hold income is more than $67,000 in the Hinds County School District and $69,000 in Clinton.
Close but far apart
TRUTHFUL EYES: TRUTHFUL EYES: A LOOK AT MISSISSIPPI SCHOOLSHINDS COUNTY
CPSD HCSD JPS1.7%......... 8%. 22%
CPSD HCSD JPS14.3%......... 11.8%. 36.5%
PROVISIONAL TEACHERS POVERTY
In JPS the percentage of families below poverty is more than twice that of Clinton and more than three times that of Hinds
County.
83% of JPS, 87% of Clin-ton and 89% of Hinds
County parents are in the workforce.
The median family income in JPS is $36,603 compared to $67,905 in Hinds and $69,030 in
Clinton.
FINDINGS
13
ADISONABOUTM DESOTO
ITAWAMBA
MARSHALL
BENTON
TIPPAH
PRENTISS
ALCORN TISHO-MINGO
TUNICA
PANOLA LAFAYETTE
UNION
LEEPONTOTOCCOAHOMA
BOLIVAR
WASHINGTON
SHARKEY
YAZOO
MADISON
LEAKE NESHOBA KEMPER
LAUDERDALENEWTONSCOTT
RANKINHINDS
CLAIBORNE
JEFFERSON
ADAMSFRANKLIN
LINCOLNLAWRENCE
JEFFERSONDAVIS
COPIAH SIMPSON
SMITH
COVINGTON
JASPER
JONES WAYNE
WILKINSON AMITE PIKEWALTHALL
MARION LAMAR
PEARL RIVER
FOR-REST PERRY
STONE
HANCOCKHARRISON
JACKSON
GEORGE
GREENE
CLARKE
WARREN
ISSAQUENA
SUN-FLOWER
HUMPHREYSHOLMES
CARROLL
LEFLORE
ATTALA WINSTONNOXUBEE
QUITMAN
TALAHATCHIEYALOBUSHA
GRENADA
CALHOUN CHICKASAW MONROE
CLAY
OKTIBBEHACHOCTAW
WEBSTERMONT-GOMERY
LOWNDES
TATECOUNTY
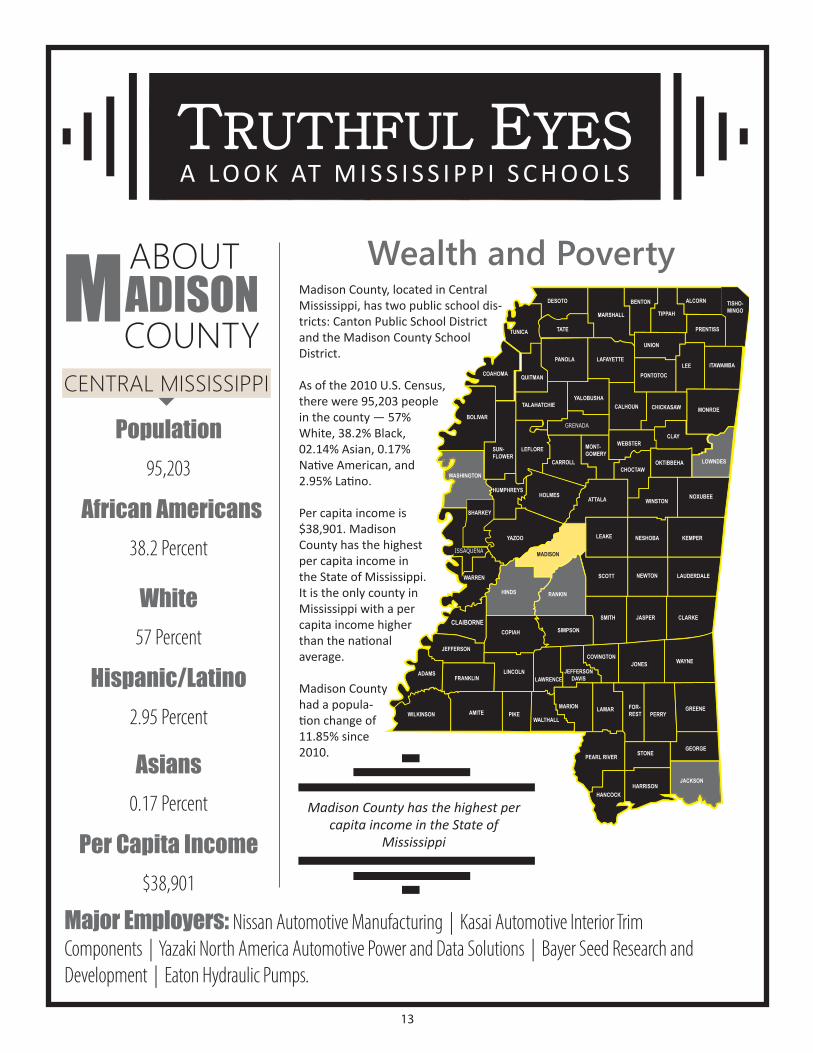
Population95,203
African Americans38.2.Percent
White57.Percent
Hispanic/Latino2.95.Percent
Asians0.17.Percent
Per Capita Income$38,901
Major Employers: Nissan.Automotive.Manufacturing..|..Kasai.Automotive.Interior.Trim.Components..|..Yazaki.North.America.Automotive.Power.and.Data.Solutions..|..Bayer.Seed.Research.and.Development..|..Eaton.Hydraulic.Pumps.
Wealth and PovertyMadison County, located in Central Mississippi, has two public school dis-tricts: Canton Public School District and the Madison County School District. As of the 2010 U.S. Census, there were 95,203 people in the county — 57% White, 38.2% Black, 02.14% Asian, 0.17% Native American, and 2.95% Latino.
Per capita income is $38,901. Madison County has the highest per capita income in the State of Mississippi. It is the only county in Mississippi with a per capita income higher than the national average.
Madison County had a popula-tion change of 11.85% since 2010.
Madison County has the highest per capita income in the State of
Mississippi
CENTRAL MISSISSIPPI
TTRUTHFUL RUTHFUL EEYESYESA LO O K AT M I S S I S S I P P I S C H O O L S
14
TRUTHFUL EYES: TRUTHFUL EYES: A LOOK AT MISSISSIPPI SCHOOLSMADISON COUNTY
BY THE NUMBERS
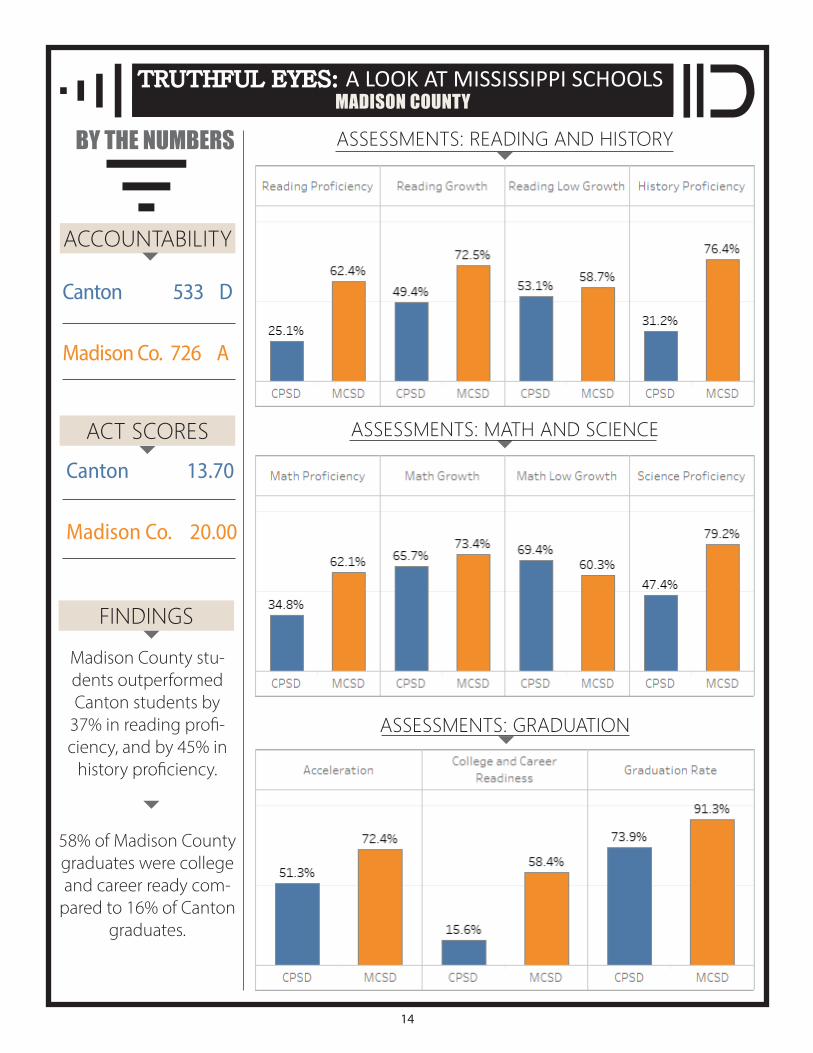
Canton 533 D
Madison Co. 726 A
Canton 13.70
Madison Co. 20.00
ACT SCORES
FINDINGS
Madison County stu-dents outperformed Canton students by 37% in reading profi-ciency, and by 45% in history proficiency.
58% of Madison County graduates were college and career ready com-pared to 16% of Canton
graduates.
ACCOUNTABILITY
ASSESSMENTS: GRADUATION
ASSESSMENTS: MATH AND SCIENCE
ASSESSMENTS: READING AND HISTORY
15
BY THE NUMBERS
TRUTHFUL EYES: TRUTHFUL EYES: A LOOK AT MISSISSIPPI SCHOOLSMADISON COUNTY
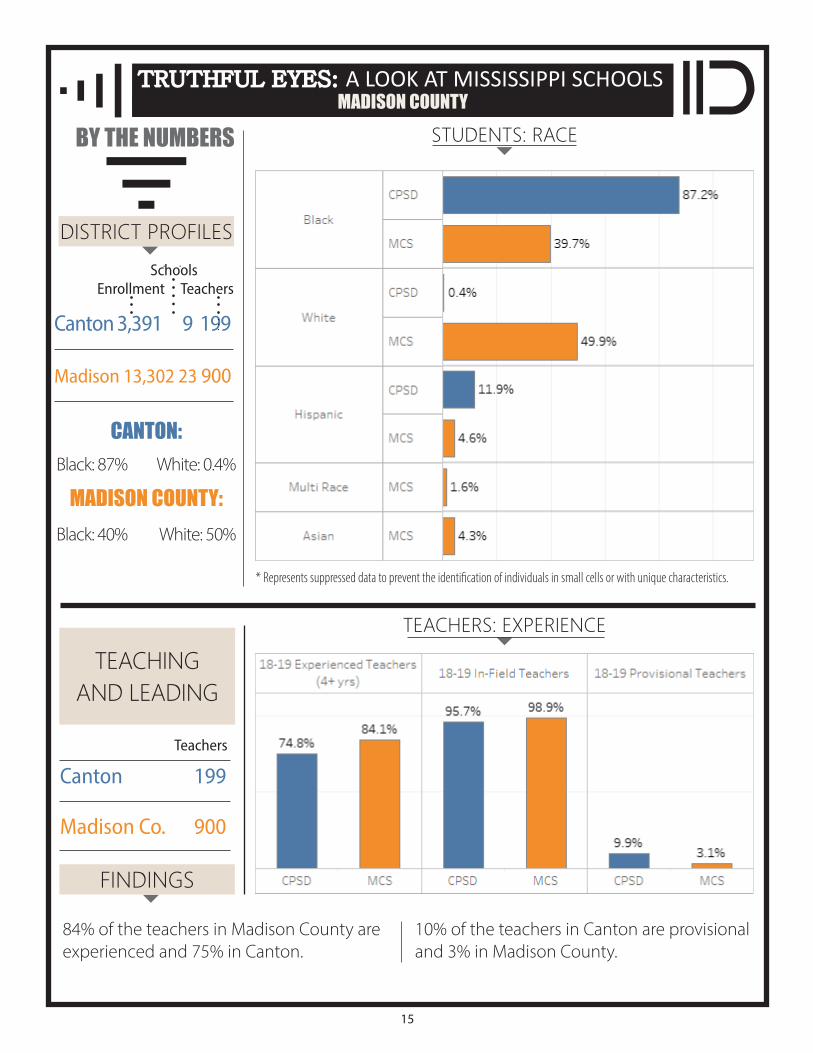
Canton 3,391 9 199
Madison 13,302 23 900
EnrollmentSchools
Teachers
DISTRICT PROFILES
Canton 199
Madison Co. 900
TEACHING AND LEADING
Teachers
*.Represents.suppressed.data.to.prevent.the.identification.of.individuals.in.small.cells.or.with.unique.characteristics.
TEACHERS: EXPERIENCE
STUDENTS: RACE
84% of the teachers in Madison County are experienced and 75% in Canton.
10% of the teachers in Canton are provisional and 3% in Madison County.
CANTON: Black: 87% White: 0.4%
MADISON COUNTY:Black: 40% White: 50%
FINDINGS
16
TRUTHFUL EYES: TRUTHFUL EYES: A LOOK AT MISSISSIPPI SCHOOLSMADISON COUNTY
BY THE NUMBERS
COMMUNITYPROFILES
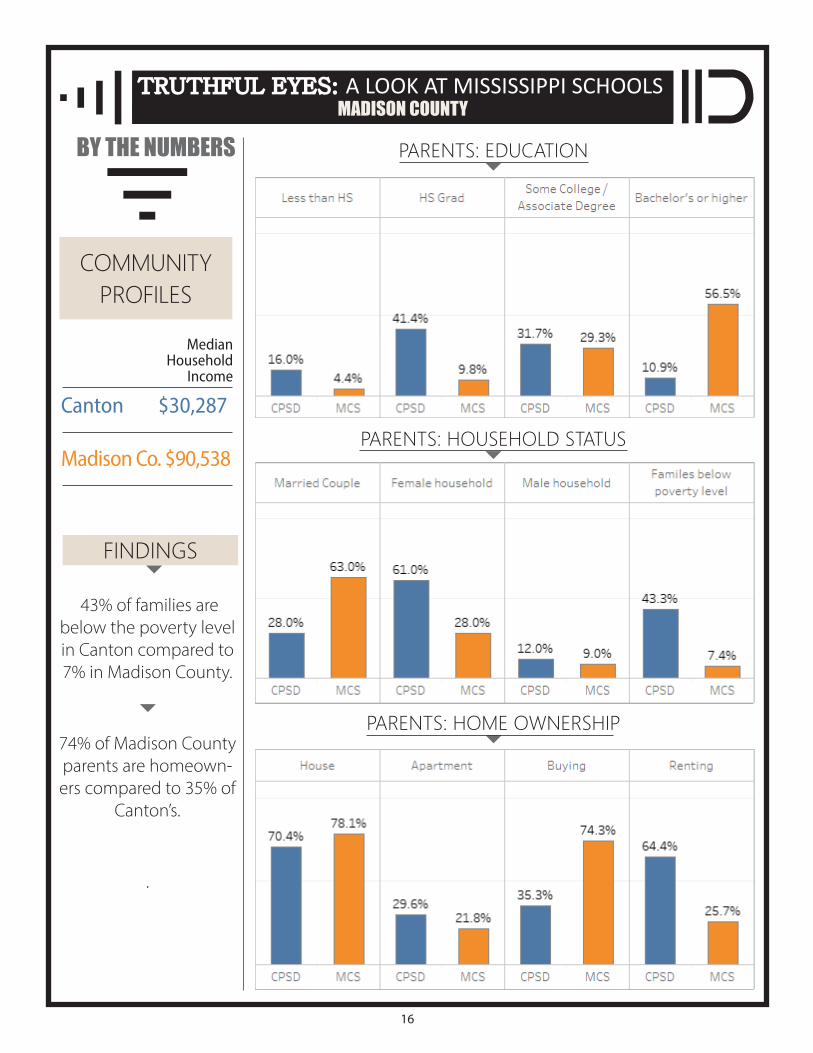
Canton $30,287
Madison Co. $90,538
Median Household
Income
FINDINGS
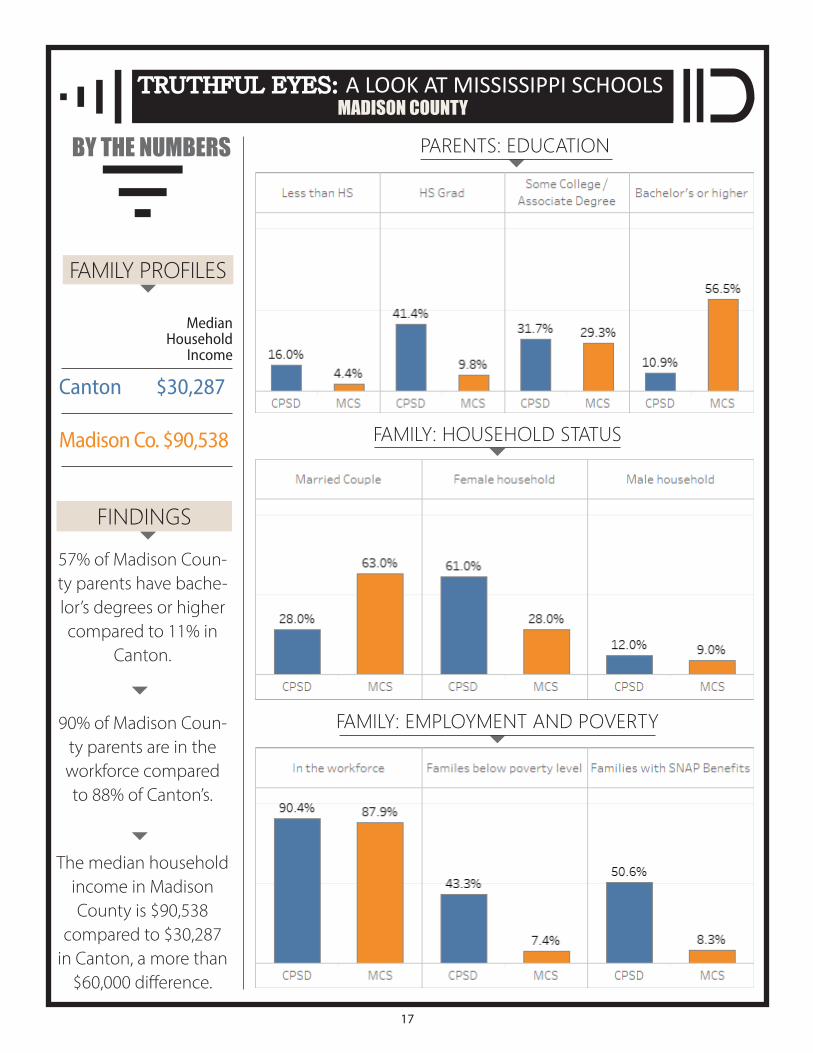
43% of families are below the poverty level in Canton compared to 7% in Madison County.
74% of Madison County parents are homeown-ers compared to 35% of
Canton’s.
.
PARENTS: HOUSEHOLD STATUS
PARENTS: HOME OWNERSHIP
PARENTS: EDUCATION
17
TRUTHFUL EYES: TRUTHFUL EYES: A LOOK AT MISSISSIPPI SCHOOLSMADISON COUNTY
57% of Madison Coun-ty parents have bache-lor’s degrees or higher compared to 11% in
Canton.
90% of Madison Coun-ty parents are in the workforce compared to 88% of Canton’s.
The median household income in Madison County is $90,538
compared to $30,287 in Canton, a more than $60,000 difference.
BY THE NUMBERS
FINDINGS
Canton $30,287
Madison Co. $90,538
Median Household
Income
FAMILY PROFILES
PARENTS: EDUCATION
FAMILY: HOUSEHOLD STATUS
FAMILY: EMPLOYMENT AND POVERTY
18
EY FINDINGSK
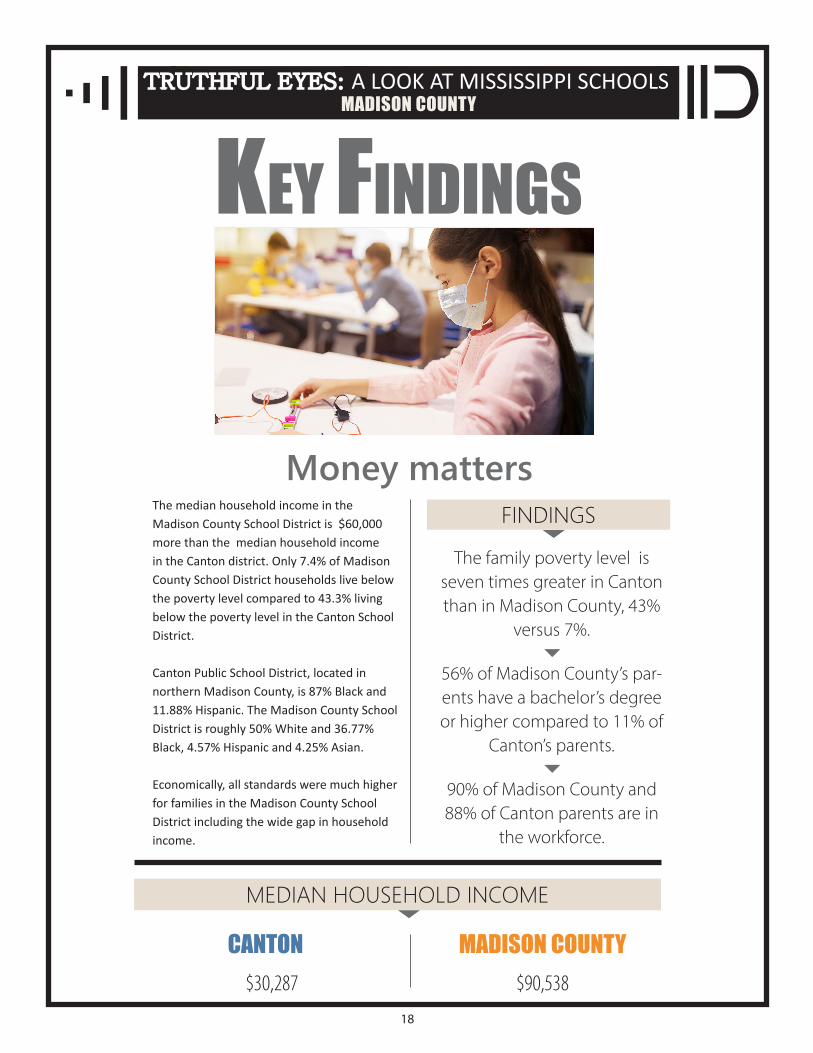
The median household income in the Madison County School District is $60,000 more than the median household income in the Canton district. Only 7.4% of Madison County School District households live below the poverty level compared to 43.3% living below the poverty level in the Canton School District.
Canton Public School District, located in northern Madison County, is 87% Black and 11.88% Hispanic. The Madison County School District is roughly 50% White and 36.77% Black, 4.57% Hispanic and 4.25% Asian.
Economically, all standards were much higher for families in the Madison County School District including the wide gap in household income.
Money matters
TRUTHFUL EYES: TRUTHFUL EYES: A LOOK AT MISSISSIPPI SCHOOLSMADISON COUNTY
The family poverty level is seven times greater in Canton than in Madison County, 43%
versus 7%.
56% of Madison County’s par-ents have a bachelor’s degree or higher compared to 11% of
Canton’s parents.
90% of Madison County and 88% of Canton parents are in
the workforce.
FINDINGS
CANTON. .$30,287
MADISON COUNTY$90,538
MEDIAN HOUSEHOLD INCOME

19
ANKINABOUTR DESOTO
ITAWAMBA
MARSHALL
BENTON
TIPPAH
PRENTISS
ALCORN TISHO-MINGO
TUNICA
PANOLA LAFAYETTE
UNION
LEEPONTOTOCCOAHOMA
BOLIVAR
WASHINGTON
SHARKEY
YAZOO
MADISON
LEAKE NESHOBA KEMPER
LAUDERDALENEWTONSCOTT
RANKINHINDS
CLAIBORNE
JEFFERSON
ADAMSFRANKLIN
LINCOLNLAWRENCE
JEFFERSONDAVIS
COPIAH SIMPSON
SMITH
COVINGTON
JASPER
JONES WAYNE
WILKINSON AMITE PIKEWALTHALL
MARION LAMAR
PEARL RIVER
FOR-REST PERRY
STONE
HANCOCKHARRISON
JACKSON
GEORGE
GREENE
CLARKE
WARREN
ISSAQUENA
SUN-FLOWER
HUMPHREYSHOLMES
CARROLL
LEFLORE
ATTALA WINSTONNOXUBEE
QUITMAN
TALAHATCHIEYALOBUSHA
GRENADA
CALHOUN CHICKASAW MONROE
CLAY
OKTIBBEHACHOCTAW
WEBSTERMONT-GOMERY
LOWNDES
TATECOUNTY
Population141,617
African Americans18.1.Percent
White77.Percent
Hispanic/Latino2.68.Percent
Asians1.2.Percent
Native Americans0.18.Percent
Per Capita Income$30,835
Major Employers: KLLM.Transport.Services..|..US.Foods..|..Sanderson.Farms..I..SiemensNucor..|..Ergon,.Inc.
Growth and Expectations Rankin County is located in Central Mis-sissippi. There are two public school districts in the county: Pearl School District and Rankin County School District.
As of the 2010 U.S. Census, there were 141,617 people in the county — 77.0% were White, 18.1% Black or African Ameri-can, 1.2% Asian, 0.18% Native American, and 2.68% were Latino.
The per capita income is $30,835.
Rankin County had a pop-ulation change of 9.44% since 2010.
Rankin County had a population change of 9.3% since 2010.
CENTRAL MISSISSIPPI
TTRUTHFUL RUTHFUL EEYESYESA LO O K AT M I S S I S S I P P I S C H O O L S
20
TRUTHFUL EYES: TRUTHFUL EYES: A LOOK AT MISSISSIPPI SCHOOLSRANKIN COUNTY
BY THE NUMBERS
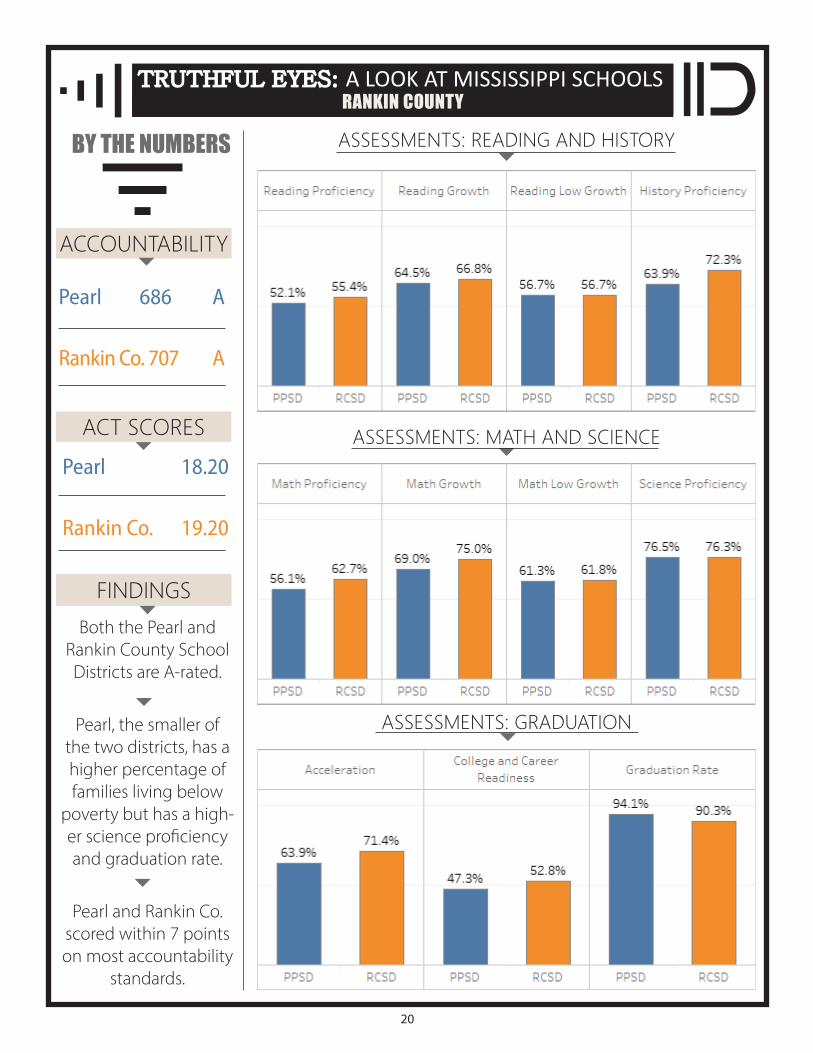
Pearl 686 A
Rankin Co. 707 A
Pearl 18.20
Rankin Co. 19.20
ACCOUNTABILITY
ACT SCORES
FINDINGSBoth the Pearl and
Rankin County School Districts are A-rated.
Pearl, the smaller of the two districts, has a higher percentage of families living below
poverty but has a high-er science proficiency and graduation rate.
Pearl and Rankin Co. scored within 7 points on most accountability
standards.
ASSESSMENTS: GRADUATION
ASSESSMENTS: MATH AND SCIENCE
ASSESSMENTS: READING AND HISTORY

21
TRUTHFUL EYES: TRUTHFUL EYES: A LOOK AT MISSISSIPPI SCHOOLSRANKIN COUNTY
BY THE NUMBERS
Pearl 4,257 5 271
Rankin 19,206 28 1,283
EnrollmentSchools
Teachers
DISTRICT PROFILES
FINDINGS
Pearl 271
Rankin Co. 1,283
TEACHING AND LEADING
Teachers
85% of teachers in Pearl are experienced. Rankin County is the only A-rated district with less than 81% of experienced teachers.
Pearl and Rankin County both have 90% in-field teachers and 2% provisional teachers.
*.Represents.suppressed.data.to.prevent.the.identification.of.individuals.in.small.cells.or.with.unique.characteristics.
TEACHERS: EXPERIENCE
STUDENTS: RACE
PEARL:White: 51% Black: 36%
RANKIN COUNTY: White: 69% Black: 24%
22
TRUTHFUL EYES: TRUTHFUL EYES: A LOOK AT MISSISSIPPI SCHOOLSRANKIN COUNTY
BY THE NUMBERS
COMMUNITYPROFILES
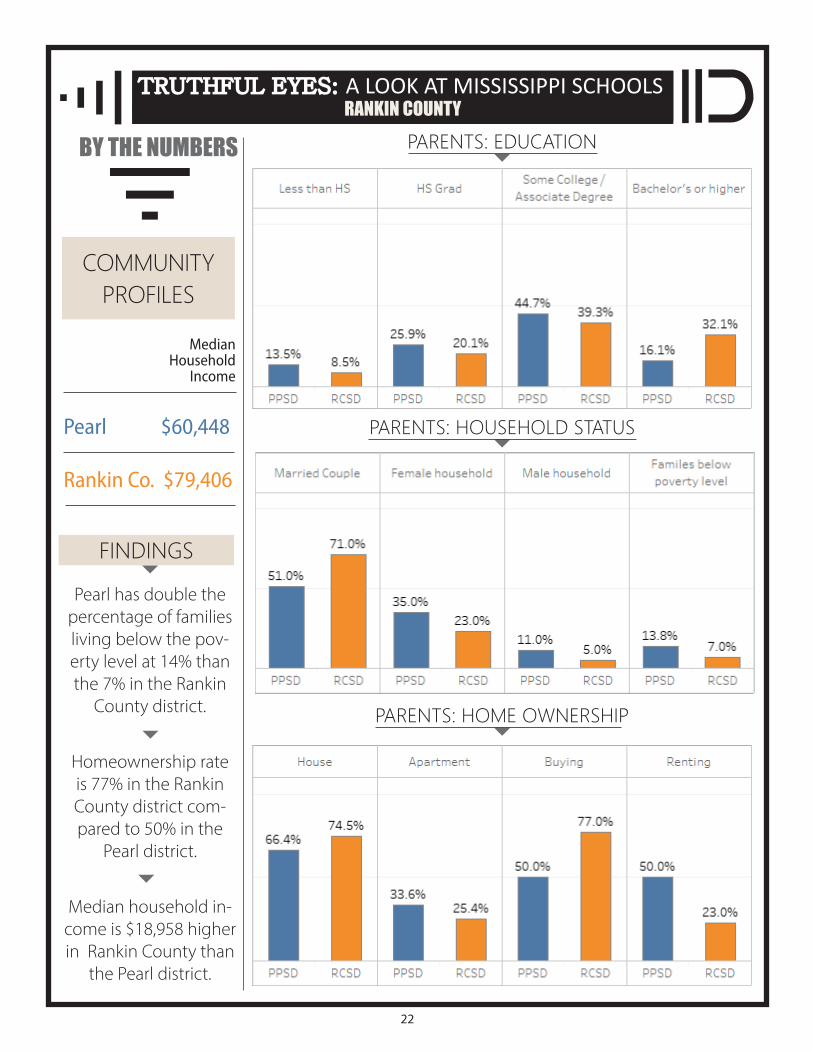
Pearl $60,448
Rankin Co. $79,406
Median Household
Income
FINDINGS
Pearl has double the percentage of families living below the pov-erty level at 14% than the 7% in the Rankin
County district.
Homeownership rate is 77% in the Rankin County district com-pared to 50% in the
Pearl district.
Median household in-come is $18,958 higher in Rankin County than
the Pearl district.
PARENTS: HOUSEHOLD STATUS
PARENTS: HOME OWNERSHIP
PARENTS: EDUCATION

23
TRUTHFUL EYES: TRUTHFUL EYES: A LOOK AT MISSISSIPPI SCHOOLSRANKIN COUNTY
The percentage of parents who are high school graduates is 26% in Pearl and 20% in Rankin County.
Rankin: 32% of families have a bachelor’s de-gree or higher versus
16% in Pearl.
87% of Pearl and 88% of Rankin Coun-ty parents are in the
workforce.
BY THE NUMBERS
FINDINGS
Pearl $60,448
Rankin Co. $79,406
Median Household
Income
FAMILY PROFILES
PARENTS: EDUCATION
FAMILY: HOUSEHOLD STATUS
FAMILY: EMPLOYMENT AND POVERTY

24
EY FINDINGSK
Stability and Consistency
TRUTHFUL EYES: TRUTHFUL EYES: A LOOK AT MISSISSIPPI SCHOOLSRANKIN COUNTY
Pearl overperforms academically when com-pared to other districts with similar family pov-erty levels, family homeownership and parent education rates.
Both have low poverty rates, but Pearl has dou-ble the percentage of families living below the poverty level at 14% than the 7% in the Rankin County district.
Economically, homeownership is 77% in the Rankin County district compared to 50% in the Pearl district. Median household income is $18,958 higher in the county district than the Pearl district. The Rankin County and Pearl school districts are 70% and 51% white and 24% and 36% Black respectively.
Pearl School district overperforms in the state accountability system.
32% of the families in Rankin County have a bachelor’s degree or higher compared with
16% in Pearl.
There is almost a $20,000 difference in median family income.
There is more than a 25% difference in homeownership in Pearl and Rankin County.
FINDINGS
Pearl Rankin. $60,448.. $79,406
Pearl Rankin. 14%.. 7%
Pearl Rankin. 50%.. 77%
POVERTY HOMEOWNERSHIPMEDIAN HOUSEHOLD INCOME
25
OWNDESABOUTL
DESOTO
ITAWAMBA
MARSHALL
BENTON
TIPPAH
PRENTISS
ALCORN TISHO-MINGO
TUNICA
PANOLA LAFAYETTE
UNION
LEEPONTOTOCCOAHOMA
BOLIVAR
WASHINGTON
SHARKEY
YAZOO
MADISON
LEAKE NESHOBA KEMPER
LAUDERDALENEWTONSCOTT
RANKINHINDS
CLAIBORNE
JEFFERSON
ADAMSFRANKLIN
LINCOLNLAWRENCE
JEFFERSONDAVIS
COPIAH SIMPSON
SMITH
COVINGTON
JASPER
JONES WAYNE
WILKINSON AMITE PIKEWALTHALL
MARION LAMAR
PEARL RIVER
FOR-REST PERRY
STONE
HANCOCKHARRISON
JACKSON
GEORGE
GREENE
CLARKE
WARREN
ISSAQUENA
SUN-FLOWER
HUMPHREYSHOLMES
CARROLL
LEFLORE
ATTALA WINSTONNOXUBEE
QUITMAN
TALAHATCHIEYALOBUSHA
GRENADA
CALHOUN CHICKASAW MONROE
CLAY
OKTIBBEHACHOCTAW
WEBSTERMONT-GOMERY
LOWNDES
TATE
COUNTY
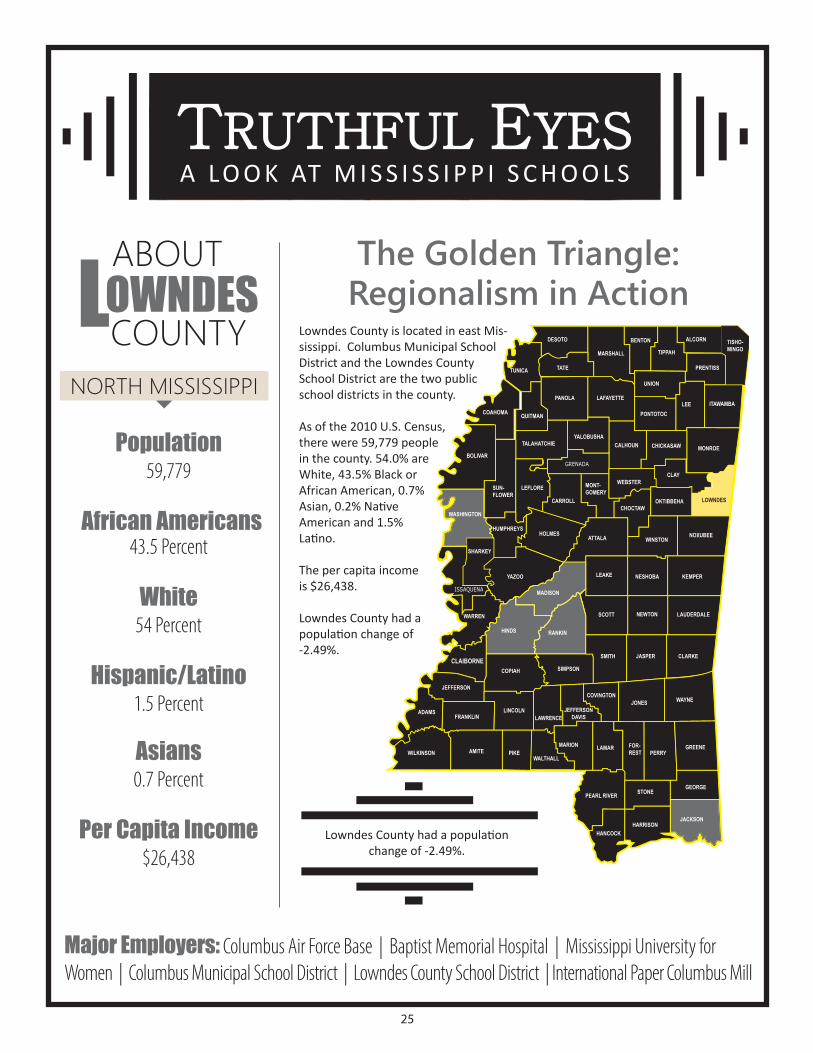
Population59,779
African Americans43.5.Percent
White54.Percent
Hispanic/Latino1.5.Percent
Asians0.7.Percent
Per Capita Income$26,438
Major Employers:.Columbus.Air.Force.Base..|..Baptist.Memorial.Hospital..|..Mississippi.University.for.Women..|..Columbus.Municipal.School.District..|..Lowndes.County.School.District..|.International.Paper.Columbus.Mill
The Golden Triangle:Regionalism in Action
Lowndes County is located in east Mis-sissippi. Columbus Municipal School District and the Lowndes County School District are the two public school districts in the county.
As of the 2010 U.S. Census, there were 59,779 people in the county. 54.0% are White, 43.5% Black or African American, 0.7% Asian, 0.2% Native American and 1.5% Latino.
The per capita income is $26,438.
Lowndes County had a population change of -2.49%.
Lowndes County had a population change of -2.49%.
NORTH MISSISSIPPI
TTRUTHFUL RUTHFUL EEYESYESA LO O K AT M I S S I S S I P P I S C H O O L S
26
TRUTHFUL EYES: TRUTHFUL EYES: A LOOK AT MISSISSIPPI SCHOOLSLOWNDES COUNTY
BY THE NUMBERS
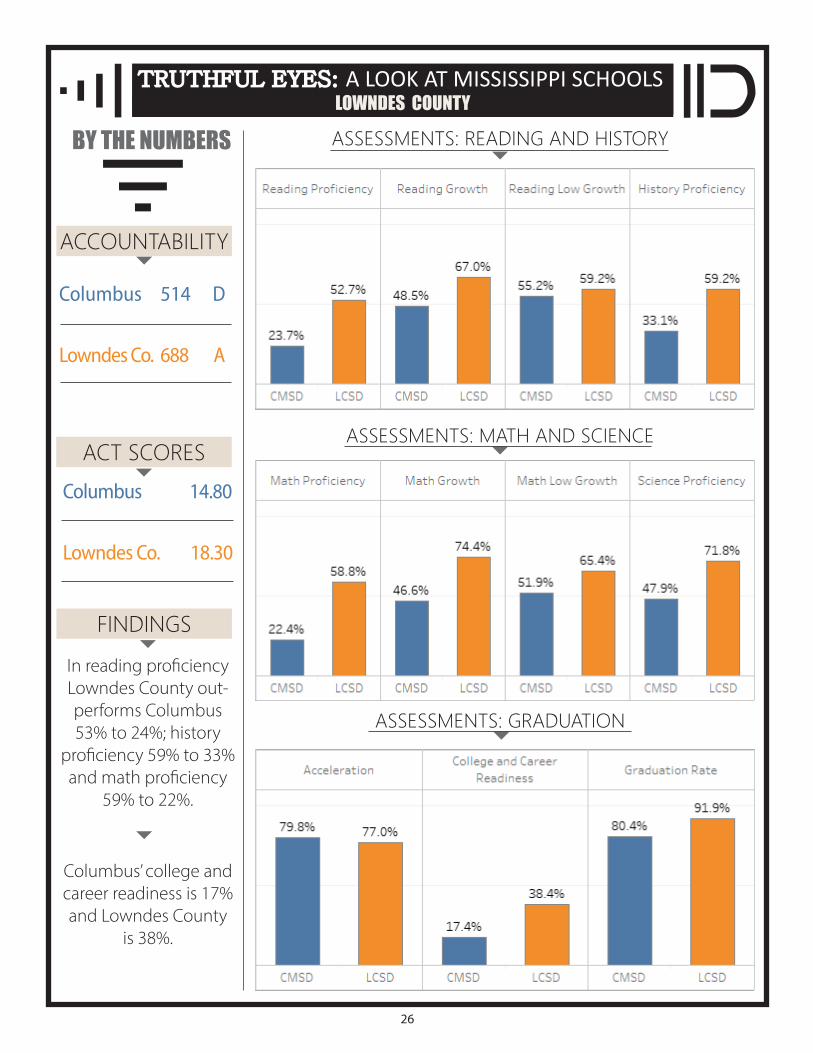
Columbus 514 D
Lowndes Co. 688 A
Columbus 14.80
Lowndes Co. 18.30
ACT SCORES
FINDINGS
In reading proficiency Lowndes County out-performs Columbus 53% to 24%; history
proficiency 59% to 33% and math proficiency
59% to 22%.
Columbus’ college and career readiness is 17% and Lowndes County
is 38%.
ACCOUNTABILITY
ASSESSMENTS: GRADUATION
ASSESSMENTS: MATH AND SCIENCE
ASSESSMENTS: READING AND HISTORY

27
TRUTHFUL EYES: TRUTHFUL EYES: A LOOK AT MISSISSIPPI SCHOOLSLOWNDES COUNTY
BY THE NUMBERS
Columbus 3,654 9 257
Lowndes 5,452 12 390
EnrollmentSchools
Teachers
DISTRICT PROFILES
Columbus 257
Lowndes Co. 390
TEACHING AND LEADING
Teachers
*.Represents.suppressed.data.to.prevent.the.identification.of.individuals.in.small.cells.or.with.unique.characteristics.
TEACHERS: EXPERIENCE
STUDENTS: RACE
76% of the teachers in Columbus are experi-enced compared to 85% in Lowndes County.
5% of the teachers in Columbus are provi-sional compared to 1% in Lowndes County.
COLUMBUS:Black: 93% White 4%
LOWNDES COUNTY: Black: 37% White: 59%
FINDINGS
28
TRUTHFUL EYES: TRUTHFUL EYES: A LOOK AT MISSISSIPPI SCHOOLSLOWNDES COUNTY
BY THE NUMBERS
COMMUNITYPROFILES
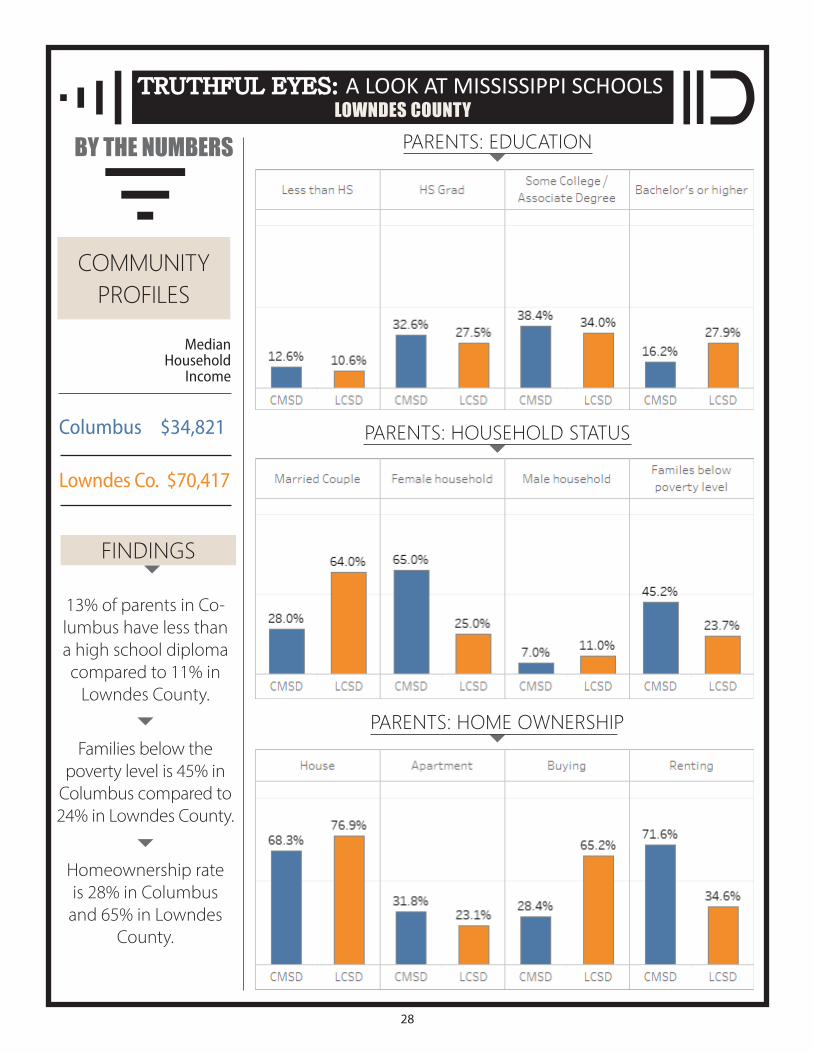
Columbus $34,821
Lowndes Co. $70,417
Median Household
Income
FINDINGS
13% of parents in Co-lumbus have less than a high school diploma compared to 11% in Lowndes County.
Families below the poverty level is 45% in Columbus compared to 24% in Lowndes County.
Homeownership rate is 28% in Columbus and 65% in Lowndes
County.
PARENTS: HOUSEHOLD STATUS
PARENTS: HOME OWNERSHIP
PARENTS: EDUCATION

29
TRUTHFUL EYES: TRUTHFUL EYES: A LOOK AT MISSISSIPPI SCHOOLSLOWNDES COUNTY
38% of Columbus’ parents and 34% of
Lowndes’ parents have some college/associ-
ate degree.
16% of Columbus’ par-ents have bachelor’s degrees or higher and
30% of Lowndes.
82% of the parents in both Columbus and Lowndes work. However, there is a $40,000 difference in median family income — $34,821 in Colum-bus versus $70,417 in Lowndes County.
BY THE NUMBERS
FINDINGS
Columbus $34,821
Lowndes Co. $70,417
Median Household
Income
FAMILY PROFILES
PARENTS: EDUCATION
FAMILY: HOUSEHOLD STATUS
FAMILY: EMPLOYMENT AND POVERTY

30
EY FINDINGSK
Working is not Enough
TRUTHFUL EYES: TRUTHFUL EYES: A LOOK AT MISSISSIPPI SCHOOLSLOWNDES COUNTY
Simply working is not enough when you compare the economics of the majority-Black Columbus Municipal School District and the majority-white Lowndes Coun-ty School District. The statistics speak for themselves: 82% of parents in both the Columbus Municipal School District and the Lowndes County School Dis-trict are employed, but median household income in Lowndes County is $35,000 higher.
In Columbus, 45.2% of families are below the poverty level compared to 23.7% in Lowndes County. 52% of families receive SNAP benefits in Columbus as do 25% of families in Lowndes.
65% of families in Lowndes own their home and 28% in Columbus. 30% of parents in Lowndes and 16% in Columbus have a bachelor’s degree or higher.
Columbus Lowndes Co.. $34,812.. $70,417
Columbus Lowndes Co.. 82%.. 82%
IN THE WORKPLACE MEDIAN FAMILY INCOME
85% of teachers in Lowndes are experienced teachers versus 76% in Columbus.
1% of the teachers in Lowndes are provisional versus 5% in Columbus.
82% of parents in both Lowndes County and Columbus are in the workforce, however, the median family income in Lowndes County is
double that of Columbus.
FINDINGS
31
ashingtonABOUTW DESOTO
ITAWAMBA
MARSHALL
BENTON
TIPPAH
PRENTISS
ALCORN TISHO-MINGO
TUNICA
PANOLA LAFAYETTE
UNION
LEEPONTOTOCCOAHOMA
BOLIVAR
WASHINGTON
SHARKEY
YAZOO
MADISON
LEAKE NESHOBA KEMPER
LAUDERDALENEWTONSCOTT
RANKINHINDS
CLAIBORNE
JEFFERSON
ADAMSFRANKLIN
LINCOLNLAWRENCE
JEFFERSONDAVIS
COPIAH SIMPSON
SMITH
COVINGTON
JASPER
JONES WAYNE
WILKINSON AMITE PIKEWALTHALL
MARION LAMAR
PEARL RIVER
FOR-REST PERRY
STONE
HANCOCKHARRISON
JACKSON
GEORGE
GREENE
CLARKE
WARREN
ISSAQUENA
SUN-FLOWER
HUMPHREYSHOLMES
CARROLL
LEFLORE
ATTALA WINSTONNOXUBEE
QUITMAN
TALAHATCHIEYALOBUSHA
GRENADA
CALHOUN CHICKASAW MONROE
CLAY
OKTIBBEHACHOCTAW
WEBSTERMONT-GOMERY
LOWNDES
TATECOUNTY
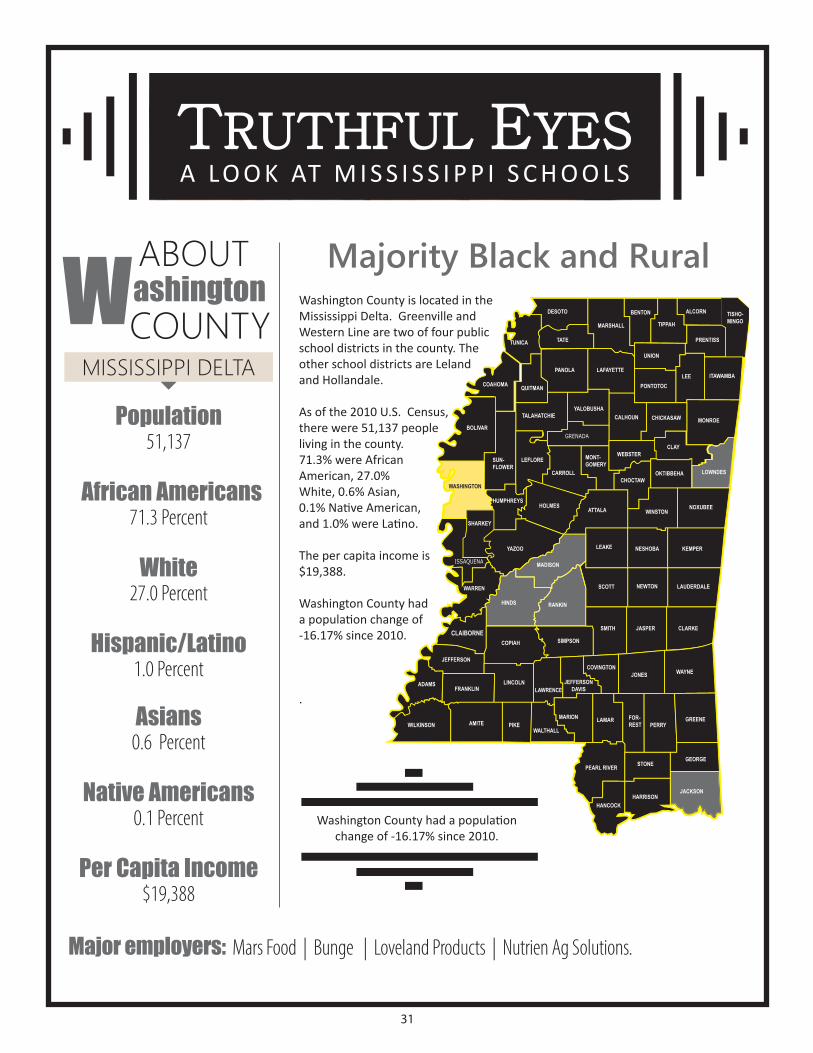
Population51,137
African Americans71.3.Percent
White27.0.Percent
Hispanic/Latino1.0.Percent
Asians0.6..Percent
Native Americans0.1.Percent
Per Capita Income$19,388
Major employers:..Mars.Food..|..Bunge...|..Loveland.Products..|..Nutrien.Ag.Solutions.
Majority Black and RuralWashington County is located in the Mississippi Delta. Greenville and Western Line are two of four public school districts in the county. The other school districts are Leland and Hollandale.
As of the 2010 U.S. Census, there were 51,137 people living in the county. 71.3% were African American, 27.0% White, 0.6% Asian, 0.1% Native American, and 1.0% were Latino.
The per capita income is $19,388.
Washington County had a population change of -16.17% since 2010.
.
Washington County had a population change of -16.17% since 2010.
MISSISSIPPI DELTA
TTRUTHFUL RUTHFUL EEYESYESA LO O K AT M I S S I S S I P P I S C H O O L S

32
TRUTHFUL EYES: TRUTHFUL EYES: A LOOK AT MISSISSIPPI SCHOOLSWASHINGTON COUNTY
BY THE NUMBERS
Greenville 480 F
Western Line 606 B
Greenville 14.90
Western Line 15.90
ACCOUNTABILITY
ACT SCORES
FINDINGS
Reading Proficiency: 23% Greenville and 38% Western Line; Math Pro-ficiency: 26% Greenville and 42% Western Line.
15% of Greenville and 22% of Western Line’s graduates are college and career ready.
ASSESSMENTS: GRADUATION
ASSESSMENTS: MATH AND SCIENCE
ASSESSMENTS: READING AND HISTORY
33
TRUTHFUL EYES: TRUTHFUL EYES: A LOOK AT MISSISSIPPI SCHOOLSWASHINGTON COUNTY
BY THE NUMBERS
Greenville 4,480 12 259
Western Line 1,965 5 137
EnrollmentSchools
Teachers
DISTRICT PROFILES
*.Represents.suppressed.data.to.prevent.the.identification.of.individuals.in.small.cells.or.with.unique.characteristics.
Greenville 259
Western Line 137
TEACHING AND LEADING
Teachers
TEACHERS: EXPERIENCE
STUDENTS: RACE
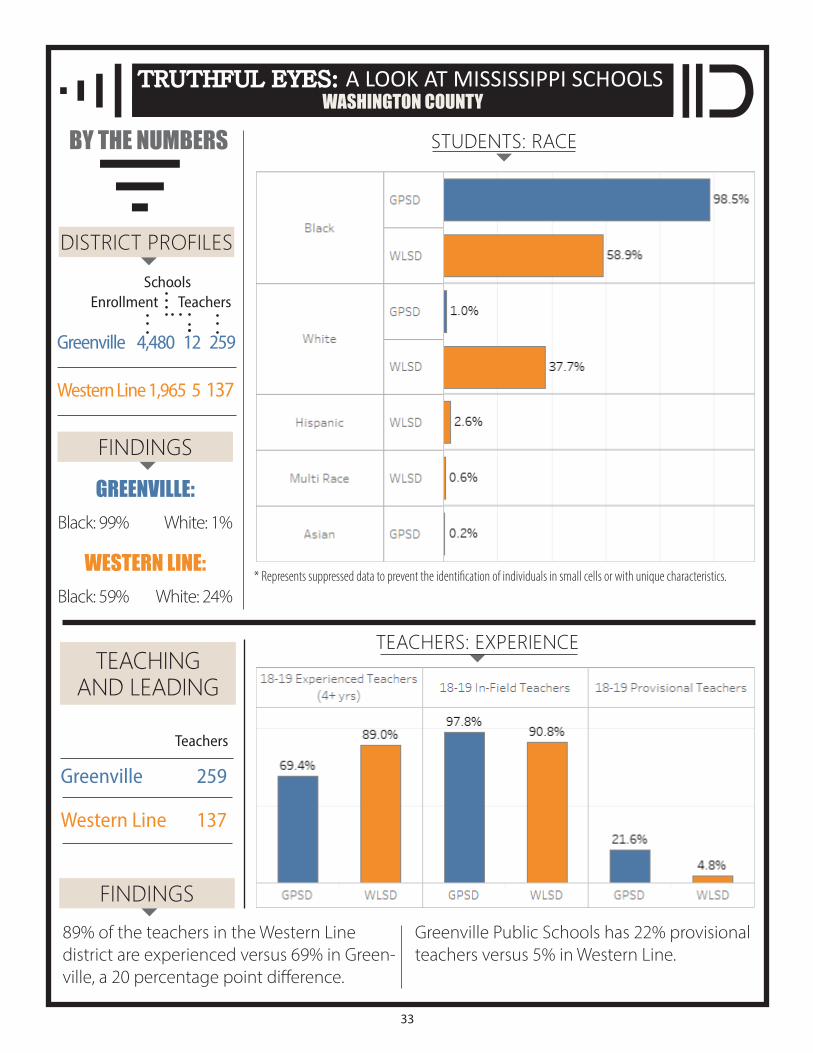
89% of the teachers in the Western Line district are experienced versus 69% in Green-ville, a 20 percentage point difference.
Greenville Public Schools has 22% provisional teachers versus 5% in Western Line.
GREENVILLE:Black: 99% White: 1%
WESTERN LINE: Black: 59% White: 24%
FINDINGS
FINDINGS
34
TRUTHFUL EYES: TRUTHFUL EYES: A LOOK AT MISSISSIPPI SCHOOLSWASHINGTON COUNTY
BY THE NUMBERS
COMMUNITYPROFILES
Greenville $26,448
Western Line $32,121
Median Household
Income
FINDINGS
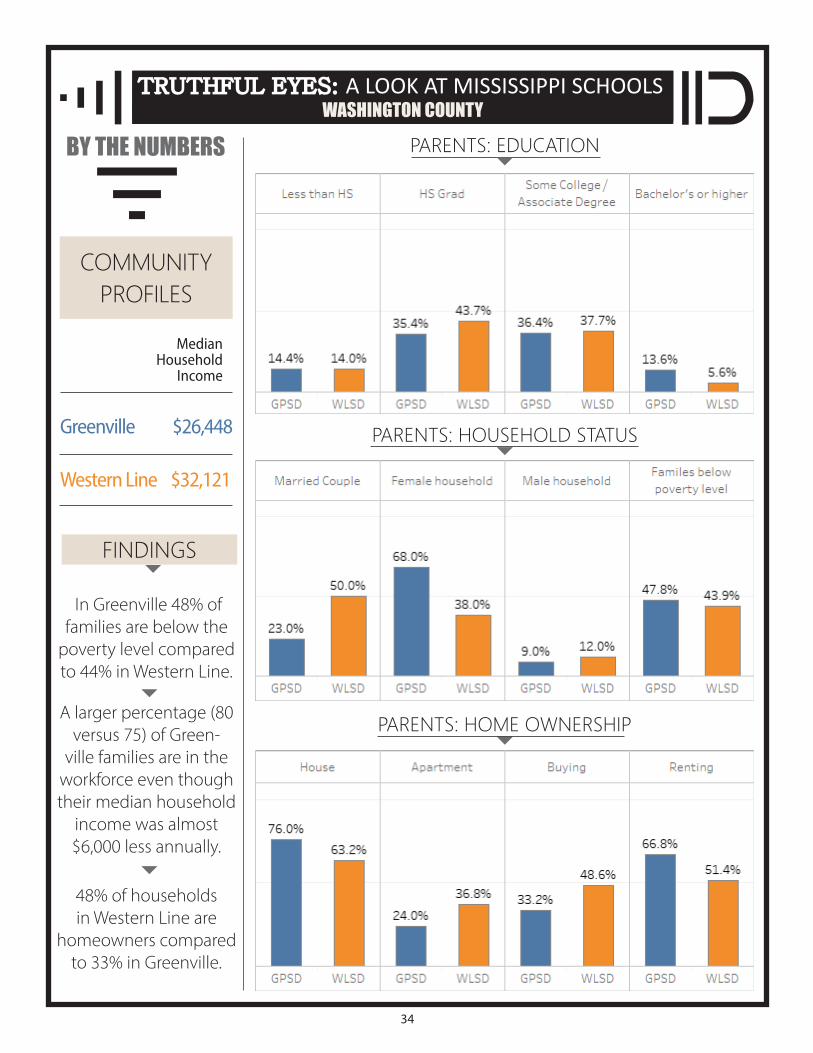
In Greenville 48% of families are below the poverty level compared to 44% in Western Line.
A larger percentage (80 versus 75) of Green-ville families are in the workforce even though their median household income was almost $6,000 less annually.
48% of households in Western Line are
homeowners compared to 33% in Greenville.
PARENTS: HOUSEHOLD STATUS
PARENTS: HOME OWNERSHIP
PARENTS: EDUCATION
35
TRUTHFUL EYES: TRUTHFUL EYES: A LOOK AT MISSISSIPPI SCHOOLSWASHINGTON COUNTY
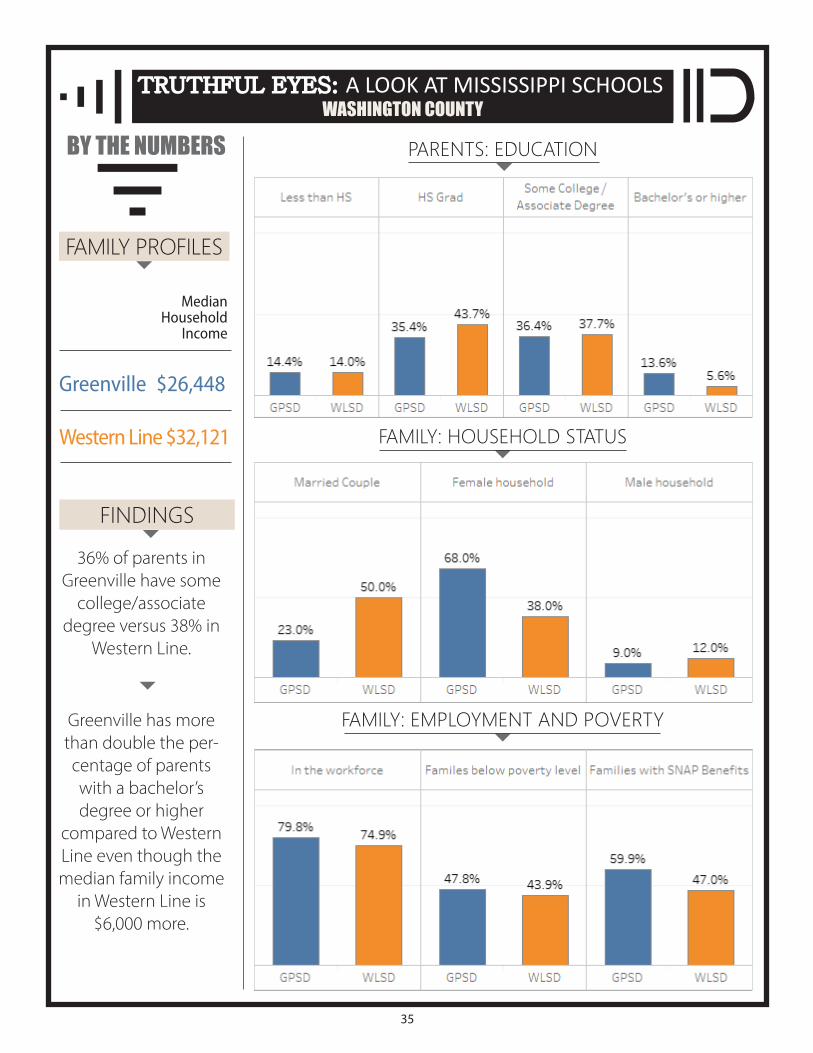
36% of parents in Greenville have some college/associate
degree versus 38% in Western Line.
Greenville has more than double the per-centage of parents with a bachelor’s degree or higher
compared to Western Line even though the median family income
in Western Line is $6,000 more.
BY THE NUMBERS
FINDINGS
Greenville $26,448
Western Line $32,121
Median Household
Income
FAMILY PROFILES
PARENTS: EDUCATION
FAMILY: HOUSEHOLD STATUS
FAMILY: EMPLOYMENT AND POVERTY
36
EY FINDINGSK
Teacher Experience Counts
TRUTHFUL EYES: TRUTHFUL EYES: A LOOK AT MISSISSIPPI SCHOOLSWASHINGTON COUNTY
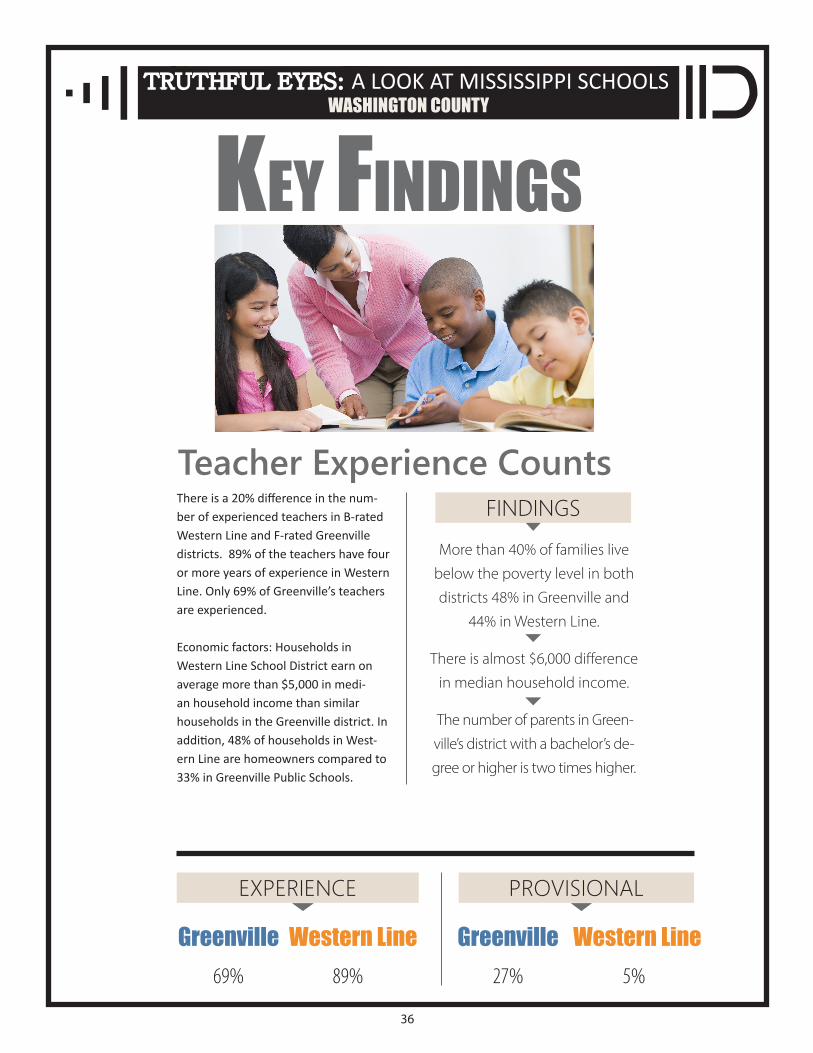
There is a 20% difference in the num-ber of experienced teachers in B-rated Western Line and F-rated Greenville districts. 89% of the teachers have four or more years of experience in Western Line. Only 69% of Greenville’s teachers are experienced.
Economic factors: Households in Western Line School District earn on average more than $5,000 in medi-an household income than similar households in the Greenville district. In addition, 48% of households in West-ern Line are homeowners compared to 33% in Greenville Public Schools.
More than 40% of families live
below the poverty level in both
districts 48% in Greenville and
44% in Western Line.
There is almost $6,000 difference
in median household income.
The number of parents in Green-
ville’s district with a bachelor’s de-
gree or higher is two times higher.
FINDINGS
Greenville Western Line. 69%.. 89%
Greenville Western Line. 27%.. 5%
EXPERIENCE PROVISIONAL

37
acksonABOUTJ DESOTO
ITAWAMBA
MARSHALL
BENTON
TIPPAH
PRENTISS
ALCORN TISHO-MINGO
TUNICA
PANOLA LAFAYETTE
UNION
LEEPONTOTOCCOAHOMA
BOLIVAR
WASHINGTON
SHARKEY
YAZOO
MADISON
LEAKE NESHOBA KEMPER
LAUDERDALENEWTONSCOTT
RANKINHINDS
CLAIBORNE
JEFFERSON
ADAMSFRANKLIN
LINCOLNLAWRENCE
JEFFERSONDAVIS
COPIAH SIMPSON
SMITH
COVINGTON
JASPER
JONES WAYNE
WILKINSON AMITE PIKEWALTHALL
MARION LAMAR
PEARL RIVER
FOR-REST PERRY
STONE
HANCOCKHARRISON
JACKSON
GEORGE
GREENE
CLARKE
WARREN
ISSAQUENA
SUN-FLOWER
HUMPHREYSHOLMES
CARROLL
LEFLORE
ATTALA WINSTONNOXUBEE
QUITMAN
TALAHATCHIEYALOBUSHA
GRENADA
CALHOUN CHICKASAW MONROE
CLAY
OKTIBBEHACHOCTAW
WEBSTERMONT-GOMERY
LOWNDES
TATECOUNTY
Population139,668
African Americans11.Percent
White80.Percent
Hispanic/Latino6.8.Percent
Asians2.4..Percent
Per Capita Income$27,141
Major Employers:..Ingalls.Shipbuilding.(the.state’s.largest.industrial.employer)..|..Singing.River.Health.System..|..VT.Halter.Marine,.Inc...|..Pascagoula.School.System..|...Jackson.County.School.District..Ocean.Springs.School.District.
Low and High TidesJackson County is located on the Mis-sissippi Gulf Coast. There are four school districts in Jackson County: Moss Point School District, the smallest; Jackson County School District, the largest; Ocean Springs School District; and Pascagoula Gautier School District. We will compare Moss Point and Jackson County. Moss Point is rated D, while Jackson County is rated A.
As of the 2010 U.S. Census, there were 139,668 people living in the county. Of that num-ber, 21.7% were Black, 73.3% White, 6.8% Hispanic and Latino, 2.4 % Asian, 2.1% two or more races. Per capita income is $27,141.
Jackson County had a popula-tion change of 3.1% since 2010.
Home of the state’s largest industrial employer.
MISSISSIPPI GULF COAST
TTRUTHFUL RUTHFUL EEYESYESA LO O K AT M I S S I S S I P P I S C H O O L S

38
TRUTHFUL EYES: TRUTHFUL EYES: A LOOK AT MISSISSIPPI SCHOOLSJACKSON COUNTY
BY THE NUMBERS
Jackson County 685 A
Moss Point 521 D
Jackson County 19.50
Moss Point 15.60
ACCOUNTABILITY
ACT SCORES
FINDINGS
Jackson County, the larger of the two dis-
tricts, outperforms Moss Point in reading profi-ciency: 55% versus 24%; history proficiency 70% versus 55%; math profi-ciency 59% versus 20% and science proficiency
78% versus 47%.
ASSESSMENTS: GRADUATION
ASSESSMENTS: MATH AND SCIENCE
ASSESSMENTS: READING AND HISTORY
39
TRUTHFUL EYES: TRUTHFUL EYES: A LOOK AT MISSISSIPPI SCHOOLSJACKSON COUNTY
BY THE NUMBERS
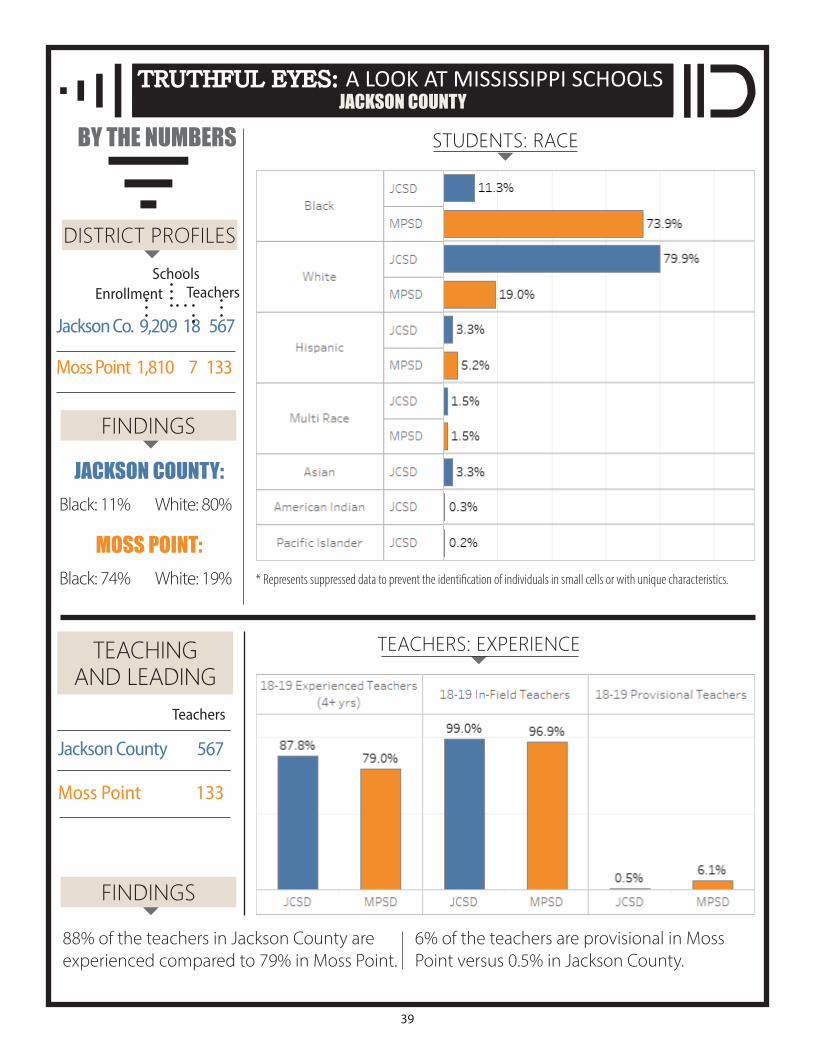
Jackson Co. 9,209 18 567
Moss Point 1,810 7 133
EnrollmentSchools
Teachers
DISTRICT PROFILES
JACKSON COUNTY:Black: 11% White: 80%
MOSS POINT: Black: 74% White: 19%
Jackson County 567
Moss Point 133
TEACHING AND LEADING
Teachers
*.Represents.suppressed.data.to.prevent.the.identification.of.individuals.in.small.cells.or.with.unique.characteristics.
TEACHERS: EXPERIENCE
STUDENTS: RACE
88% of the teachers in Jackson County are experienced compared to 79% in Moss Point.
6% of the teachers are provisional in Moss Point versus 0.5% in Jackson County.
FINDINGS
FINDINGS

40
TRUTHFUL EYES: TRUTHFUL EYES: A LOOK AT MISSISSIPPI SCHOOLSJACKSON COUNTY
BY THE NUMBERS
COMMUNITYPROFILES
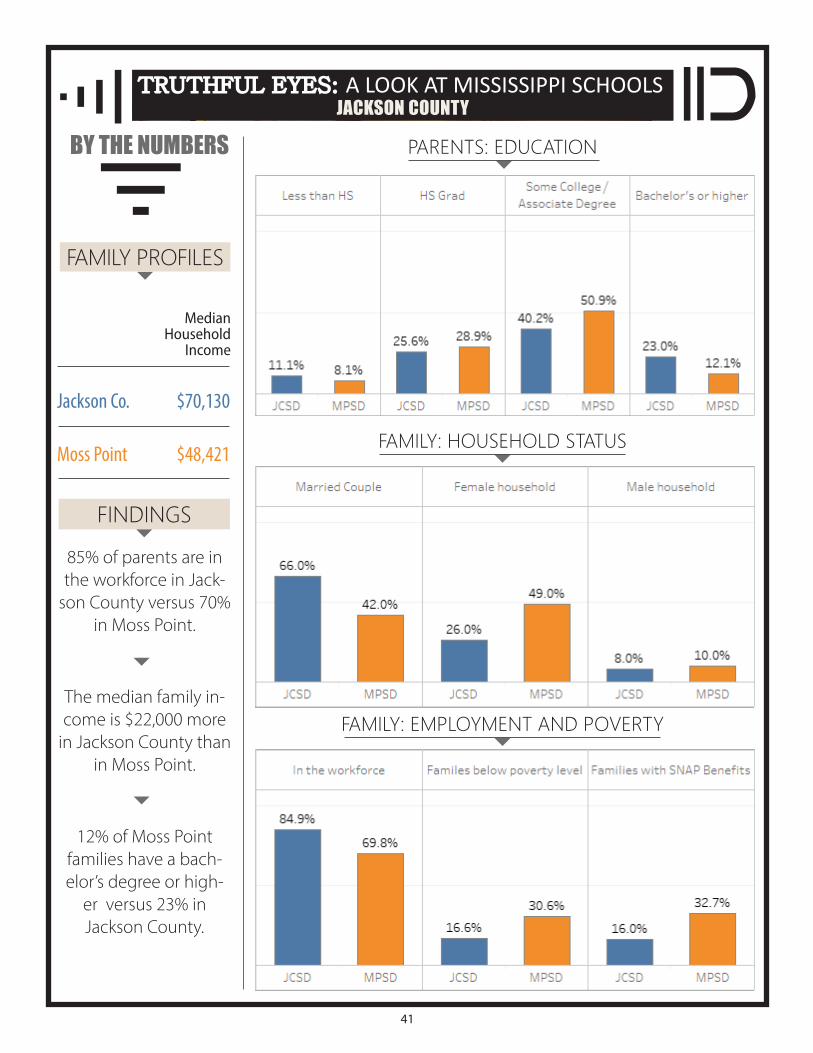
Jackson Co. $70,130
Moss Point $48,421
Median Household
Income
FINDINGSThe poverty level is
30.6% in the Moss Point School District com-pared to 16.6% in the Jackson County School
District.
Homeownership is high in both districts, 79.6% in Jackson County and 70.5% in Moss Point.
PARENTS: HOUSEHOLD STATUS
PARENTS: HOME OWNERSHIP
PARENTS: EDUCATION
41
TRUTHFUL EYES: TRUTHFUL EYES: A LOOK AT MISSISSIPPI SCHOOLSJACKSON COUNTY
85% of parents are in the workforce in Jack-son County versus 70%
in Moss Point.
The median family in-come is $22,000 more in Jackson County than
in Moss Point.
12% of Moss Point families have a bach-elor’s degree or high-er versus 23% in Jackson County.
BY THE NUMBERS
FINDINGS
Jackson Co. $70,130
Moss Point $48,421
Median Household
Income
FAMILY PROFILES
PARENTS: EDUCATION
FAMILY: HOUSEHOLD STATUS
FAMILY: EMPLOYMENT AND POVERTY
42
EY FINDINGSK
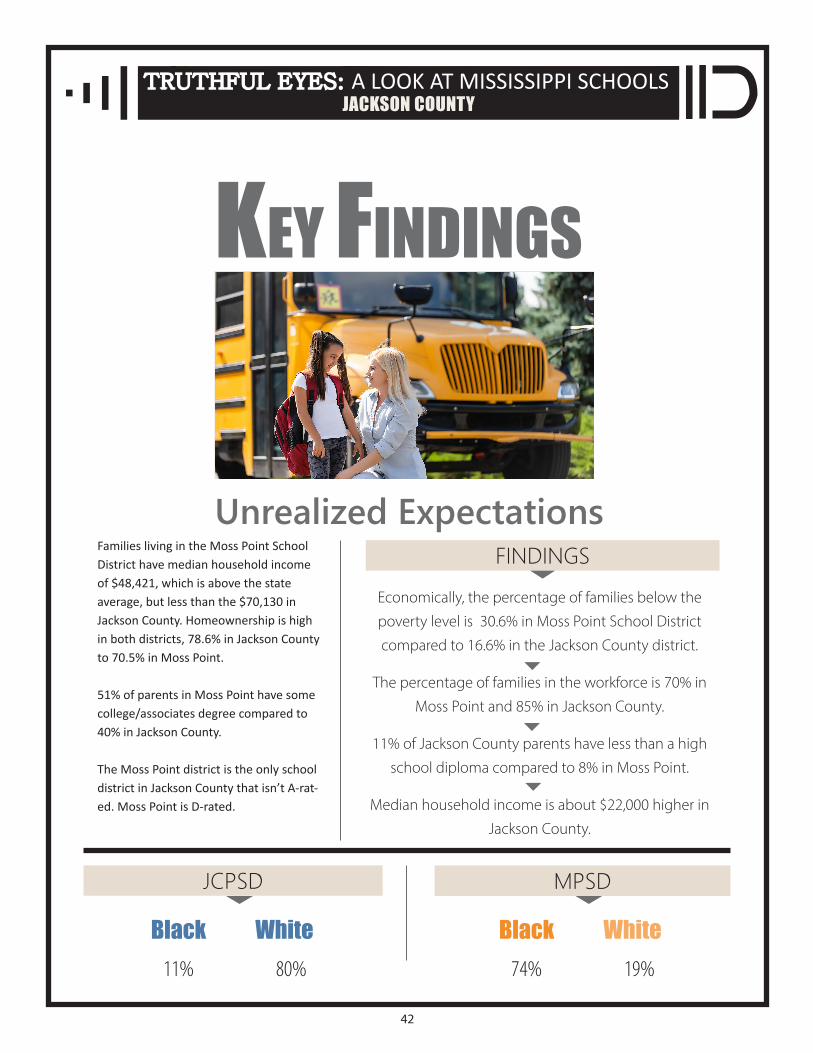
Unrealized Expectations
TRUTHFUL EYES: TRUTHFUL EYES: A LOOK AT MISSISSIPPI SCHOOLSJACKSON COUNTY
Families living in the Moss Point School District have median household income of $48,421, which is above the state average, but less than the $70,130 in Jackson County. Homeownership is high in both districts, 78.6% in Jackson County to 70.5% in Moss Point.
51% of parents in Moss Point have some college/associates degree compared to 40% in Jackson County.
The Moss Point district is the only school district in Jackson County that isn’t A-rat-ed. Moss Point is D-rated.
Economically, the percentage of families below the
poverty level is 30.6% in Moss Point School District
compared to 16.6% in the Jackson County district.
The percentage of families in the workforce is 70% in
Moss Point and 85% in Jackson County.
11% of Jackson County parents have less than a high
school diploma compared to 8% in Moss Point.
Median household income is about $22,000 higher in
Jackson County.
FINDINGS
Black White. 11%.. 80%
Black White. 74%.. 19%
MPSDJCPSD
43
TRUTHFUL EYES: TRUTHFUL EYES: A LOOK AT MISSISSIPPI SCHOOLSTHE BIG PICTURE
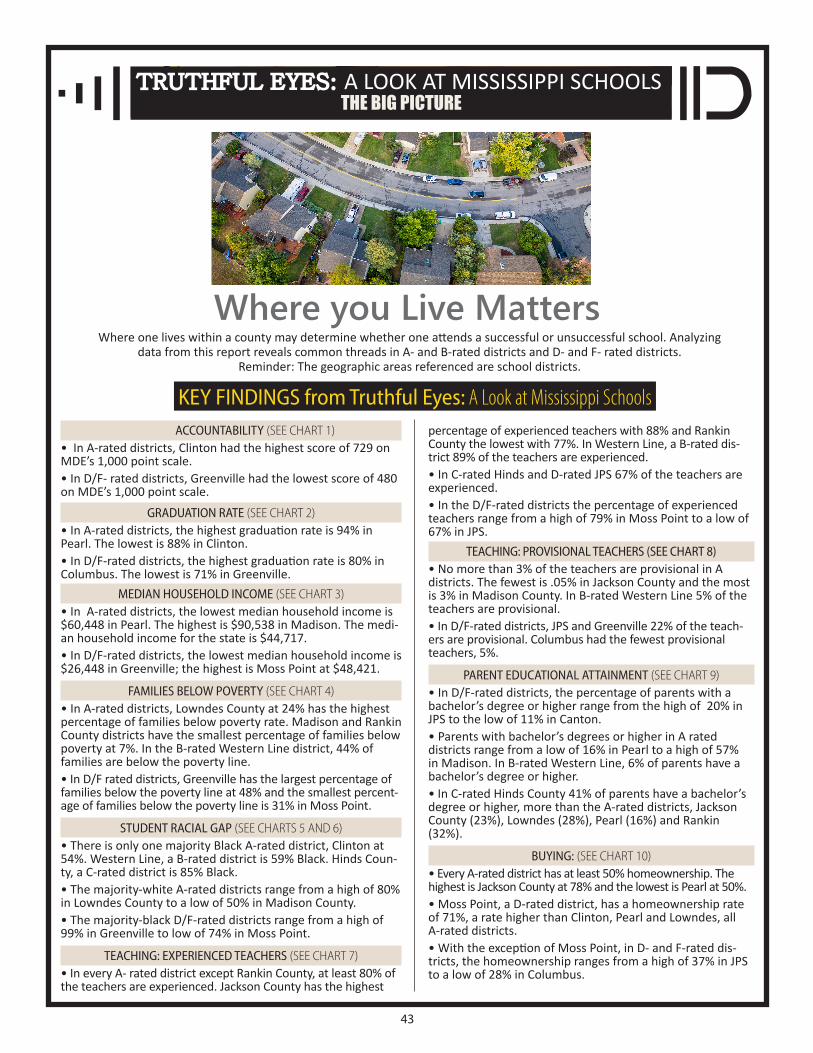
Where you Live MattersWhere one lives within a county may determine whether one attends a successful or unsuccessful school. Analyzing
data from this report reveals common threads in A- and B-rated districts and D- and F- rated districts. Reminder: The geographic areas referenced are school districts.
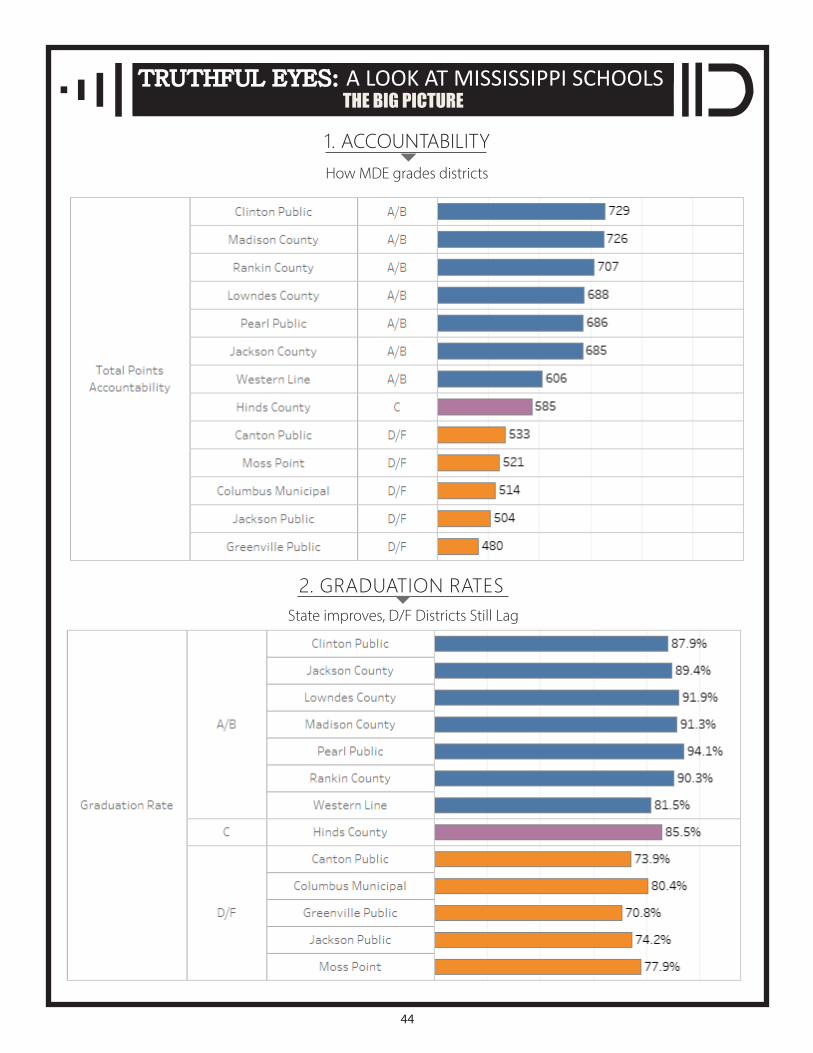
ACCOUNTABILITY (SEE CHART 1)• In A-rated districts, Clinton had the highest score of 729 on MDE’s 1,000 point scale.• In D/F- rated districts, Greenville had the lowest score of 480 on MDE’s 1,000 point scale.
GRADUATION RATE (SEE CHART 2)• In A-rated districts, the highest graduation rate is 94% in Pearl. The lowest is 88% in Clinton.• In D/F-rated districts, the highest graduation rate is 80% in Columbus. The lowest is 71% in Greenville.
MEDIAN HOUSEHOLD INCOME (SEE CHART 3)• In A-rated districts, the lowest median household income is $60,448 in Pearl. The highest is $90,538 in Madison. The medi-an household income for the state is $44,717.• In D/F-rated districts, the lowest median household income is $26,448 in Greenville; the highest is Moss Point at $48,421.
FAMILIES BELOW POVERTY (SEE CHART 4)• In A-rated districts, Lowndes County at 24% has the highest percentage of families below poverty rate. Madison and Rankin County districts have the smallest percentage of families below poverty at 7%. In the B-rated Western Line district, 44% of families are below the poverty line.• In D/F rated districts, Greenville has the largest percentage of families below the poverty line at 48% and the smallest percent-age of families below the poverty line is 31% in Moss Point.
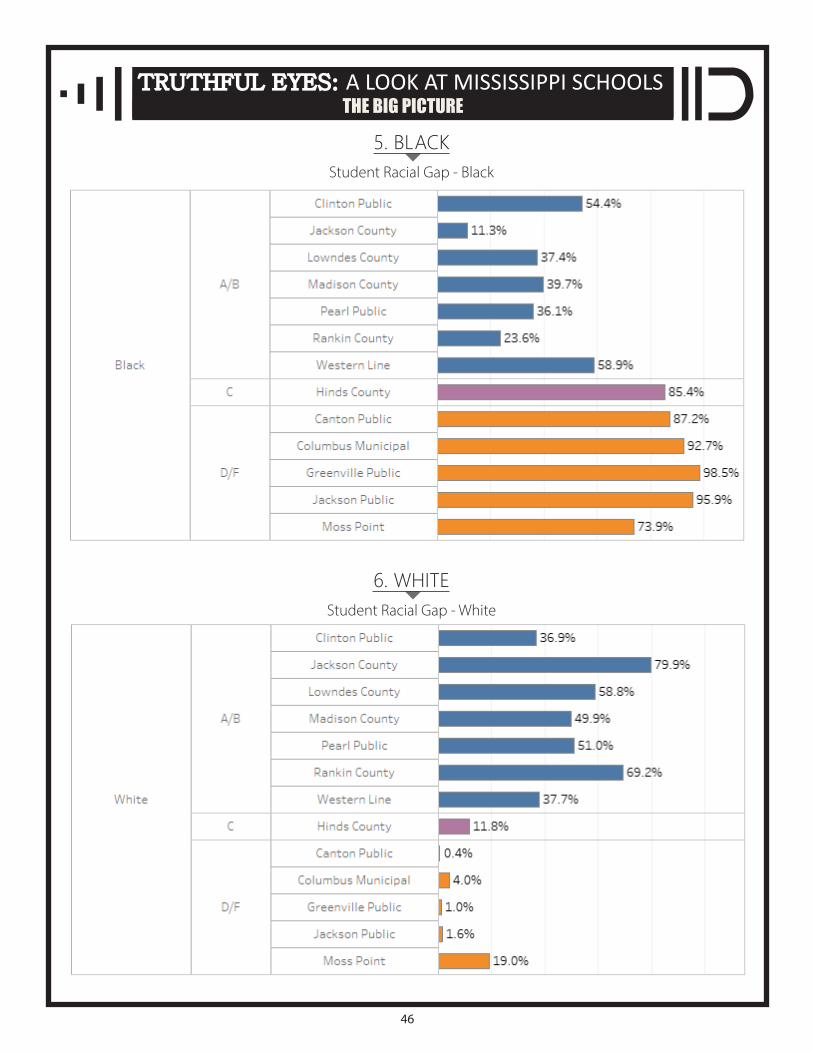
STUDENT RACIAL GAP (SEE CHARTS 5 AND 6)• There is only one majority Black A-rated district, Clinton at 54%. Western Line, a B-rated district is 59% Black. Hinds Coun-ty, a C-rated district is 85% Black.• The majority-white A-rated districts range from a high of 80% in Lowndes County to a low of 50% in Madison County.• The majority-black D/F-rated districts range from a high of 99% in Greenville to low of 74% in Moss Point.
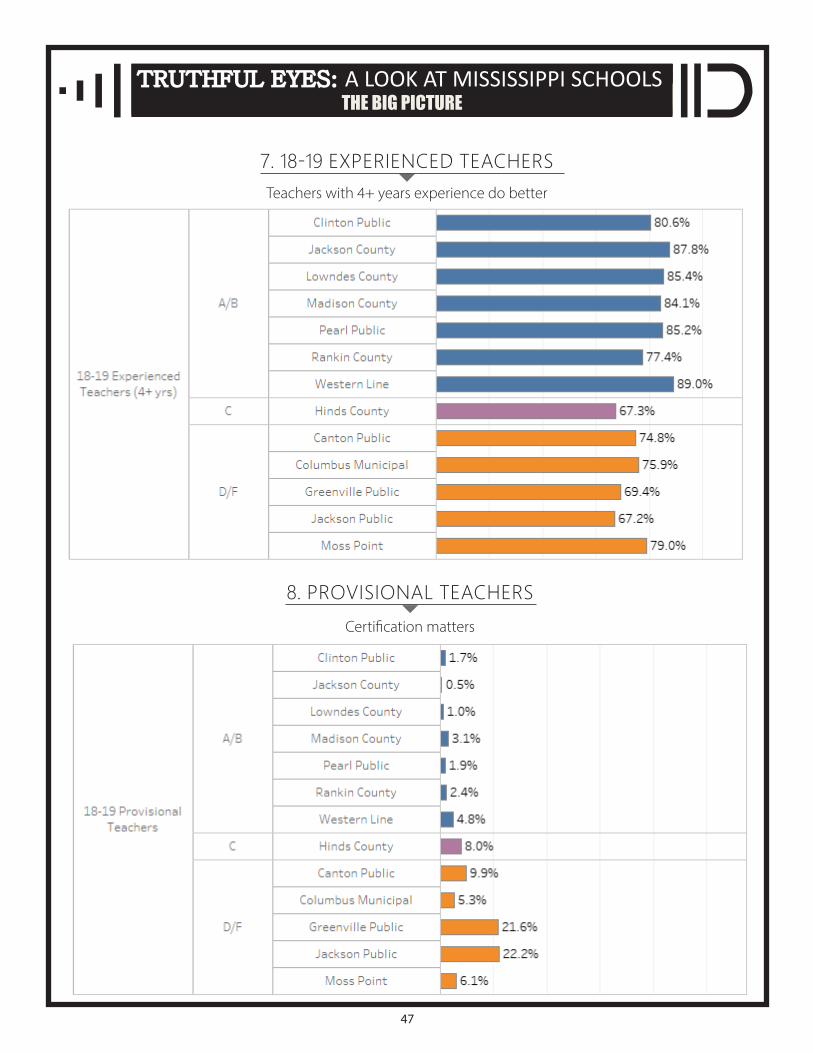
TEACHING: EXPERIENCED TEACHERS (SEE CHART 7)• In every A- rated district except Rankin County, at least 80% of the teachers are experienced. Jackson County has the highest
percentage of experienced teachers with 88% and Rankin County the lowest with 77%. In Western Line, a B-rated dis-trict 89% of the teachers are experienced. • In C-rated Hinds and D-rated JPS 67% of the teachers are experienced.• In the D/F-rated districts the percentage of experienced teachers range from a high of 79% in Moss Point to a low of 67% in JPS.
TEACHING: PROVISIONAL TEACHERS (SEE CHART 8)• No more than 3% of the teachers are provisional in A districts. The fewest is .05% in Jackson County and the most is 3% in Madison County. In B-rated Western Line 5% of the teachers are provisional. • In D/F-rated districts, JPS and Greenville 22% of the teach-ers are provisional. Columbus had the fewest provisional teachers, 5%.
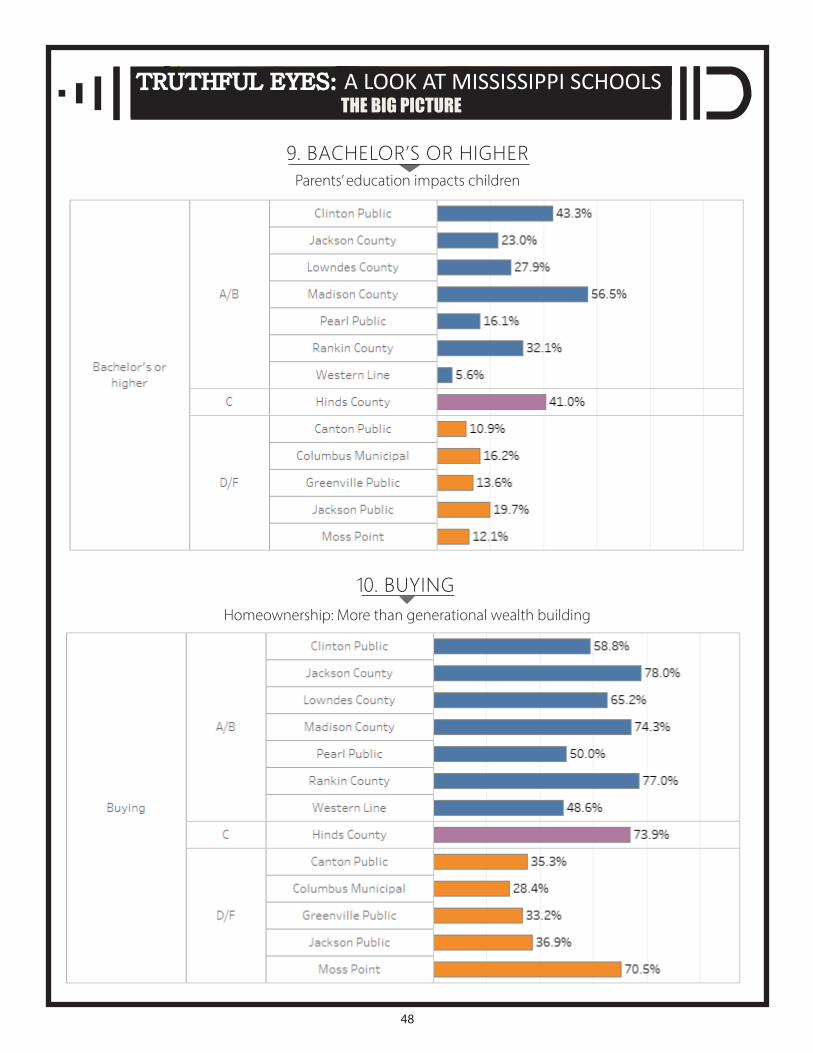
PARENT EDUCATIONAL ATTAINMENT (SEE CHART 9)• In D/F-rated districts, the percentage of parents with a bachelor’s degree or higher range from the high of 20% in JPS to the low of 11% in Canton. • Parents with bachelor’s degrees or higher in A rated districts range from a low of 16% in Pearl to a high of 57% in Madison. In B-rated Western Line, 6% of parents have a bachelor’s degree or higher.• In C-rated Hinds County 41% of parents have a bachelor’s degree or higher, more than the A-rated districts, Jackson County (23%), Lowndes (28%), Pearl (16%) and Rankin (32%).
BUYING: (SEE CHART 10)• Every A-rated district has at least 50% homeownership. The highest is Jackson County at 78% and the lowest is Pearl at 50%. • Moss Point, a D-rated district, has a homeownership rate of 71%, a rate higher than Clinton, Pearl and Lowndes, all A-rated districts. • With the exception of Moss Point, in D- and F-rated dis-tricts, the homeownership ranges from a high of 37% in JPS to a low of 28% in Columbus.
KEY FINDINGS from Truthful Eyes:.A.Look.at.Mississippi.Schools
44
TRUTHFUL EYES: TRUTHFUL EYES: A LOOK AT MISSISSIPPI SCHOOLSTHE BIG PICTURE
1. ACCOUNTABILITYHow MDE grades districts
2. GRADUATION RATES State improves, D/F Districts Still Lag

45
TRUTHFUL EYES: TRUTHFUL EYES: A LOOK AT MISSISSIPPI SCHOOLSTHE BIG PICTURE
4. FAMILIES BELOW POVERTYPoverty impacts performance
3. MEDIAN HOUSEHOLD INCOMEThe wealth gap
46
5. BLACK
6. WHITE
Student Racial Gap - Black
Student Racial Gap - White
TRUTHFUL EYES: TRUTHFUL EYES: A LOOK AT MISSISSIPPI SCHOOLSTHE BIG PICTURE
47
TRUTHFUL EYES: TRUTHFUL EYES: A LOOK AT MISSISSIPPI SCHOOLSTHE BIG PICTURE
7. 18-19 EXPERIENCED TEACHERSTeachers with 4+ years experience do better
8. PROVISIONAL TEACHERSCertification matters
48
TRUTHFUL EYES: TRUTHFUL EYES: A LOOK AT MISSISSIPPI SCHOOLSTHE BIG PICTURE
9. BACHELOR’S OR HIGHERParents’ education impacts children
10. BUYING Homeownership: More than generational wealth building
49
TRUTHFUL EYES: TRUTHFUL EYES: A LOOK AT MISSISSIPPI SCHOOLSTHE BIG PICTURE
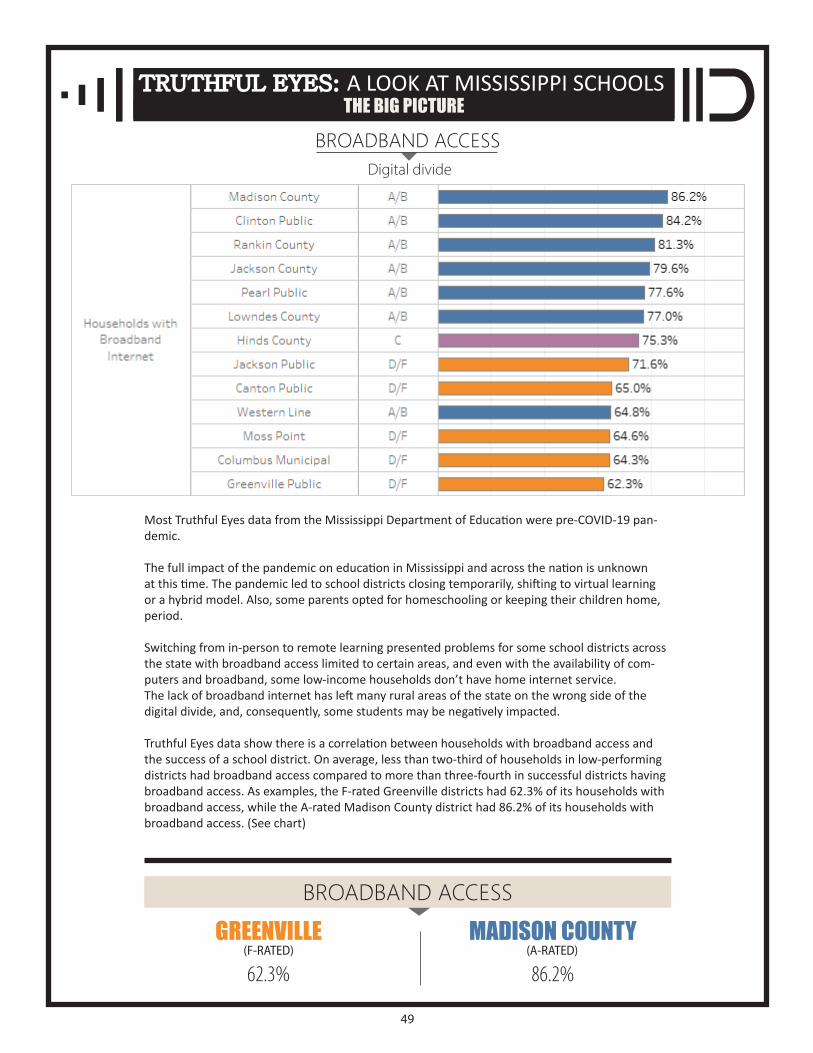
BROADBAND ACCESS
Most Truthful Eyes data from the Mississippi Department of Education were pre-COVID-19 pan-demic.
The full impact of the pandemic on education in Mississippi and across the nation is unknown at this time. The pandemic led to school districts closing temporarily, shifting to virtual learning or a hybrid model. Also, some parents opted for homeschooling or keeping their children home, period.
Switching from in-person to remote learning presented problems for some school districts across the state with broadband access limited to certain areas, and even with the availability of com-puters and broadband, some low-income households don’t have home internet service.The lack of broadband internet has left many rural areas of the state on the wrong side of the digital divide, and, consequently, some students may be negatively impacted.
Truthful Eyes data show there is a correlation between households with broadband access and the success of a school district. On average, less than two-third of households in low-performing districts had broadband access compared to more than three-fourth in successful districts having broadband access. As examples, the F-rated Greenville districts had 62.3% of its households with broadband access, while the A-rated Madison County district had 86.2% of its households with broadband access. (See chart)
GREENVILLE62.3%
MADISON COUNTY 86.2%
BROADBAND ACCESS
(F-RATED) (A-RATED)
Digital divide
50
TRUTHFUL EYES: TRUTHFUL EYES: A LOOK AT MISSISSIPPI SCHOOLSTHE BIG PICTURE
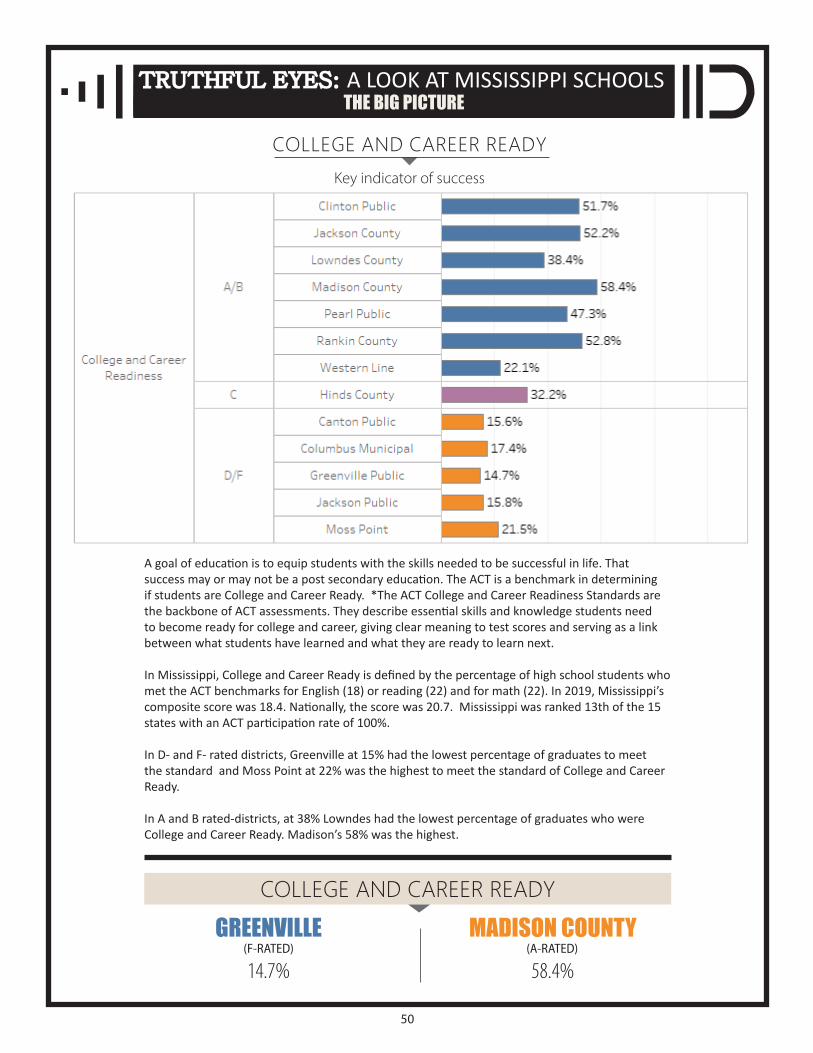
A goal of education is to equip students with the skills needed to be successful in life. That success may or may not be a post secondary education. The ACT is a benchmark in determining if students are College and Career Ready. *The ACT College and Career Readiness Standards are the backbone of ACT assessments. They describe essential skills and knowledge students need to become ready for college and career, giving clear meaning to test scores and serving as a link between what students have learned and what they are ready to learn next.
In Mississippi, College and Career Ready is defined by the percentage of high school students who met the ACT benchmarks for English (18) or reading (22) and for math (22). In 2019, Mississippi’s composite score was 18.4. Nationally, the score was 20.7. Mississippi was ranked 13th of the 15 states with an ACT participation rate of 100%.
In D- and F- rated districts, Greenville at 15% had the lowest percentage of graduates to meet the standard and Moss Point at 22% was the highest to meet the standard of College and Career Ready.
In A and B rated-districts, at 38% Lowndes had the lowest percentage of graduates who were College and Career Ready. Madison’s 58% was the highest.
GREENVILLE14.7%
MADISON COUNTY 58.4%
COLLEGE AND CAREER READY
(F-RATED) (A-RATED)
COLLEGE AND CAREER READYKey indicator of success
51
WESTERN LINE559
MOSS POINT454
TRUTHFUL EYES: TRUTHFUL EYES: A LOOK AT MISSISSIPPI SCHOOLSTHE BIG PICTURE
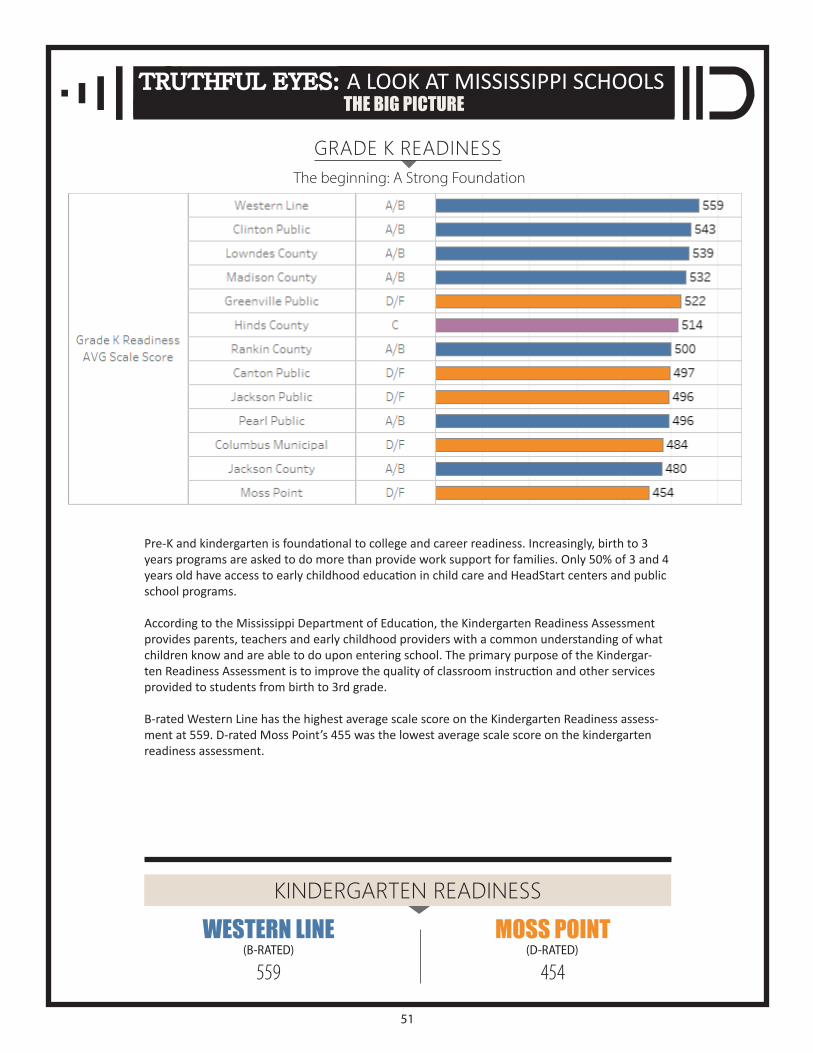
GRADE K READINESS
Pre-K and kindergarten is foundational to college and career readiness. Increasingly, birth to 3 years programs are asked to do more than provide work support for families. Only 50% of 3 and 4 years old have access to early childhood education in child care and HeadStart centers and public school programs.
According to the Mississippi Department of Education, the Kindergarten Readiness Assessment provides parents, teachers and early childhood providers with a common understanding of what children know and are able to do upon entering school. The primary purpose of the Kindergar-ten Readiness Assessment is to improve the quality of classroom instruction and other services provided to students from birth to 3rd grade.
B-rated Western Line has the highest average scale score on the Kindergarten Readiness assess-ment at 559. D-rated Moss Point’s 455 was the lowest average scale score on the kindergarten readiness assessment.
KINDERGARTEN READINESS
(B-RATED) (D-RATED)
The beginning: A Strong Foundation
52
TRUTHFUL EYES: TRUTHFUL EYES: A LOOK AT MISSISSIPPI SCHOOLSTHE BIG PICTURE
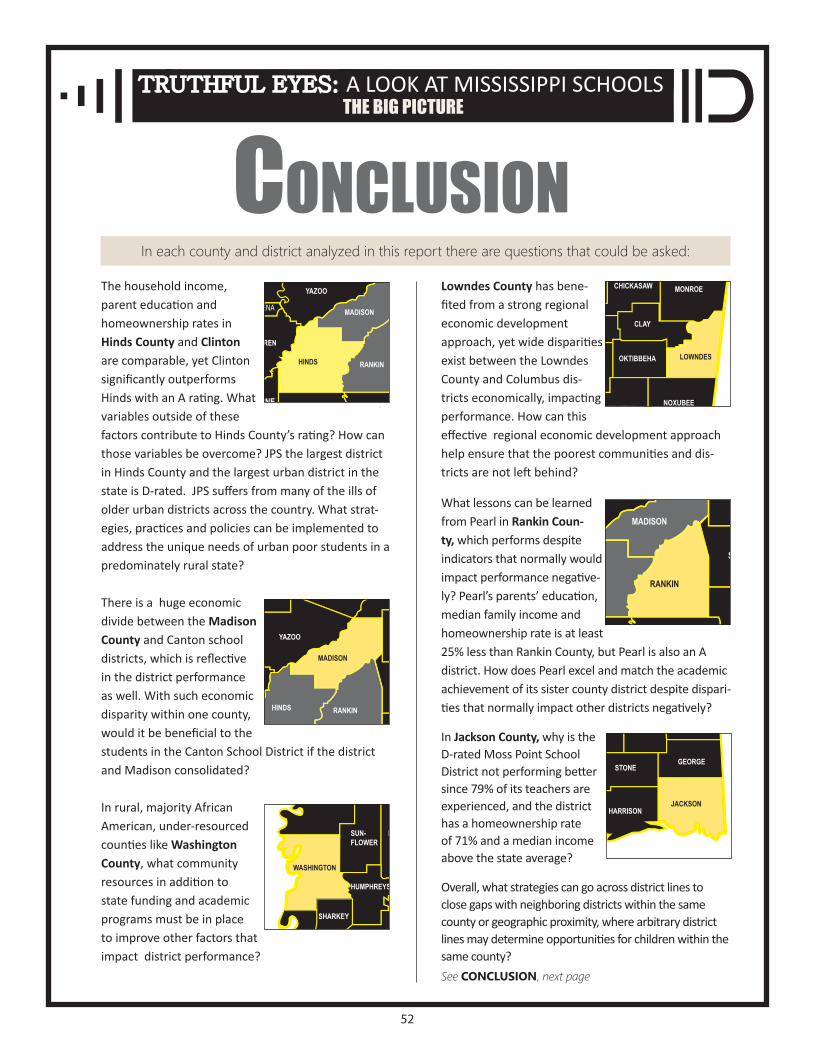
ONCLUSIONCThe household income, parent education and homeownership rates in Hinds County and Clinton are comparable, yet Clinton significantly outperforms Hinds with an A rating. What variables outside of these factors contribute to Hinds County’s rating? How can those variables be overcome? JPS the largest district in Hinds County and the largest urban district in the state is D-rated. JPS suffers from many of the ills of older urban districts across the country. What strat-egies, practices and policies can be implemented to address the unique needs of urban poor students in a predominately rural state?
There is a huge economic divide between the Madison County and Canton school districts, which is reflective in the district performance as well. With such economic disparity within one county, would it be beneficial to the students in the Canton School District if the district and Madison consolidated? In rural, majority African American, under-resourced counties like Washington County, what community resources in addition to state funding and academic programs must be in place to improve other factors that impact district performance?
Lowndes County has bene-fited from a strong regional economic development approach, yet wide disparities exist between the Lowndes County and Columbus dis-tricts economically, impacting performance. How can this effective regional economic development approach help ensure that the poorest communities and dis-tricts are not left behind?
What lessons can be learned from Pearl in Rankin Coun-ty, which performs despite indicators that normally would impact performance negative-ly? Pearl’s parents’ education, median family income and homeownership rate is at least 25% less than Rankin County, but Pearl is also an A district. How does Pearl excel and match the academic achievement of its sister county district despite dispari-ties that normally impact other districts negatively?
In Jackson County, why is the D-rated Moss Point School District not performing better since 79% of its teachers are experienced, and the district has a homeownership rate of 71% and a median income above the state average?
Overall, what strategies can go across district lines to close gaps with neighboring districts within the same county or geographic proximity, where arbitrary district lines may determine opportunities for children within the same county?
In each county and district analyzed in this report there are questions that could be asked:
DESOTO
ITAWAMBA
MARSHALL
BENTON
TIPPAH
PRENTISS
ALCORN TISHO-MINGO
TUNICA
PANOLA LAFAYETTE
UNION
LEEPONTOTOCCOAHOMA
BOLIVAR
WASHINGTON
SHARKEY
YAZOO
MADISON
LEAKE NESHOBA KEMPER
LAUDERDALENEWTONSCOTT
RANKINHINDS
CLAIBORNE
JEFFERSON
ADAMSFRANKLIN
LINCOLNLAWRENCE
JEFFERSONDAVIS
COPIAH SIMPSON
SMITH
COVINGTON
JASPER
JONES WAYNE
WILKINSON AMITE PIKEWALTHALL
MARION LAMAR
PEARL RIVER
FOR-REST PERRY
STONE
HANCOCKHARRISON
JACKSON
GEORGE
GREENE
CLARKE
WARREN
ISSAQUENA
SUN-FLOWER
HUMPHREYSHOLMES
CARROLL
LEFLORE
ATTALA WINSTONNOXUBEE
QUITMAN
TALAHATCHIEYALOBUSHA
GRENADA
CALHOUN CHICKASAW MONROE
CLAY
OKTIBBEHACHOCTAW
WEBSTERMONT-GOMERY
LOWNDES
TATE
DESOTO
ITAWAMBA
MARSHALL
BENTON
TIPPAH
PRENTISS
ALCORN TISHO-MINGO
TUNICA
PANOLA LAFAYETTE
UNION
LEEPONTOTOCCOAHOMA
BOLIVAR
WASHINGTON
SHARKEY
YAZOO
MADISON
LEAKE NESHOBA KEMPER
LAUDERDALENEWTONSCOTT
RANKINHINDS
CLAIBORNE
JEFFERSON
ADAMSFRANKLIN
LINCOLNLAWRENCE
JEFFERSONDAVIS
COPIAH SIMPSON
SMITH
COVINGTON
JASPER
JONES WAYNE
WILKINSON AMITE PIKEWALTHALL
MARION LAMAR
PEARL RIVER
FOR-REST PERRY
STONE
HANCOCKHARRISON
JACKSON
GEORGE
GREENE
CLARKE
WARREN
ISSAQUENA
SUN-FLOWER
HUMPHREYSHOLMES
CARROLL
LEFLORE
ATTALA WINSTONNOXUBEE
QUITMAN
TALAHATCHIEYALOBUSHA
GRENADA
CALHOUN CHICKASAW MONROE
CLAY
OKTIBBEHACHOCTAW
WEBSTERMONT-GOMERY
LOWNDES
TATEDESOTO
ITAWAMBA
MARSHALL
BENTON
TIPPAH
PRENTISS
ALCORN TISHO-MINGO
TUNICA
PANOLA LAFAYETTE
UNION
LEEPONTOTOCCOAHOMA
BOLIVAR
WASHINGTON
SHARKEY
YAZOO
MADISON
LEAKE NESHOBA KEMPER
LAUDERDALENEWTONSCOTT
RANKINHINDS
CLAIBORNE
JEFFERSON
ADAMSFRANKLIN
LINCOLNLAWRENCE
JEFFERSONDAVIS
COPIAH SIMPSON
SMITH
COVINGTON
JASPER
JONES WAYNE
WILKINSON AMITE PIKEWALTHALL
MARION LAMAR
PEARL RIVER
FOR-REST PERRY
STONE
HANCOCKHARRISON
JACKSON
GEORGE
GREENE
CLARKE
WARREN
ISSAQUENA
SUN-FLOWER
HUMPHREYSHOLMES
CARROLL
LEFLORE
ATTALA WINSTONNOXUBEE
QUITMAN
TALAHATCHIEYALOBUSHA
GRENADA
CALHOUN CHICKASAW MONROE
CLAY
OKTIBBEHACHOCTAW
WEBSTERMONT-GOMERY
LOWNDES
TATE
DESOTO
ITAWAMBA
MARSHALL
BENTON
TIPPAH
PRENTISS
ALCORN TISHO-MINGO
TUNICA
PANOLA LAFAYETTE
UNION
LEEPONTOTOCCOAHOMA
BOLIVAR
WASHINGTON
SHARKEY
YAZOO
MADISON
LEAKE NESHOBA KEMPER
LAUDERDALENEWTONSCOTT
RANKINHINDS
CLAIBORNE
JEFFERSON
ADAMSFRANKLIN
LINCOLNLAWRENCE
JEFFERSONDAVIS
COPIAH SIMPSON
SMITH
COVINGTON
JASPER
JONES WAYNE
WILKINSON AMITE PIKEWALTHALL
MARION LAMAR
PEARL RIVER
FOR-REST PERRY
STONE
HANCOCKHARRISON
JACKSON
GEORGE
GREENE
CLARKE
WARREN
ISSAQUENA
SUN-FLOWER
HUMPHREYSHOLMES
CARROLL
LEFLORE
ATTALA WINSTONNOXUBEE
QUITMAN
TALAHATCHIEYALOBUSHA
GRENADA
CALHOUN CHICKASAW MONROE
CLAY
OKTIBBEHACHOCTAW
WEBSTERMONT-GOMERY
LOWNDES
TATE
See CONCLUSION, next page
53
TRUTHFUL EYES: TRUTHFUL EYES: A LOOK AT MISSISSIPPI SCHOOLSTHE BIG PICTURE
Data from this report show that community factors — including experienced teachers, family homeownership, median household income — play a part in successful school districts.
The direct impact of such community factors, such as in-come and housing, underlines the need for more formal action and coordination between education, business and community leaders in strategic planning and policy development for local schools.
Just as a teacher cannot educate a student in a vacuum without support of administrators and parents, a school district cannot operate and set policy without support of community, business and political leadership. Formal and informal planning and cooperation outside of traditional government structures would benefit schools and con-tribute to success of students.
Communities cannot be successful without successful schools and vice versa. Education is and always has been a family function. That family includes students, parents, teachers, administrators, school board mem-bers, local government officials, economic develop-ers, business and community leaders.
The hard data in this report show how very much they are intertwined and dependent on one another for suc-cess. Looking at these facts through the truthful eyes of hard data shows the pathway to more successful schools and healthier communities.
Continued from previous page
54
TRUTHFUL EYES: TRUTHFUL EYES: A LOOK AT MISSISSIPPI SCHOOLSTHE BIG PICTURE
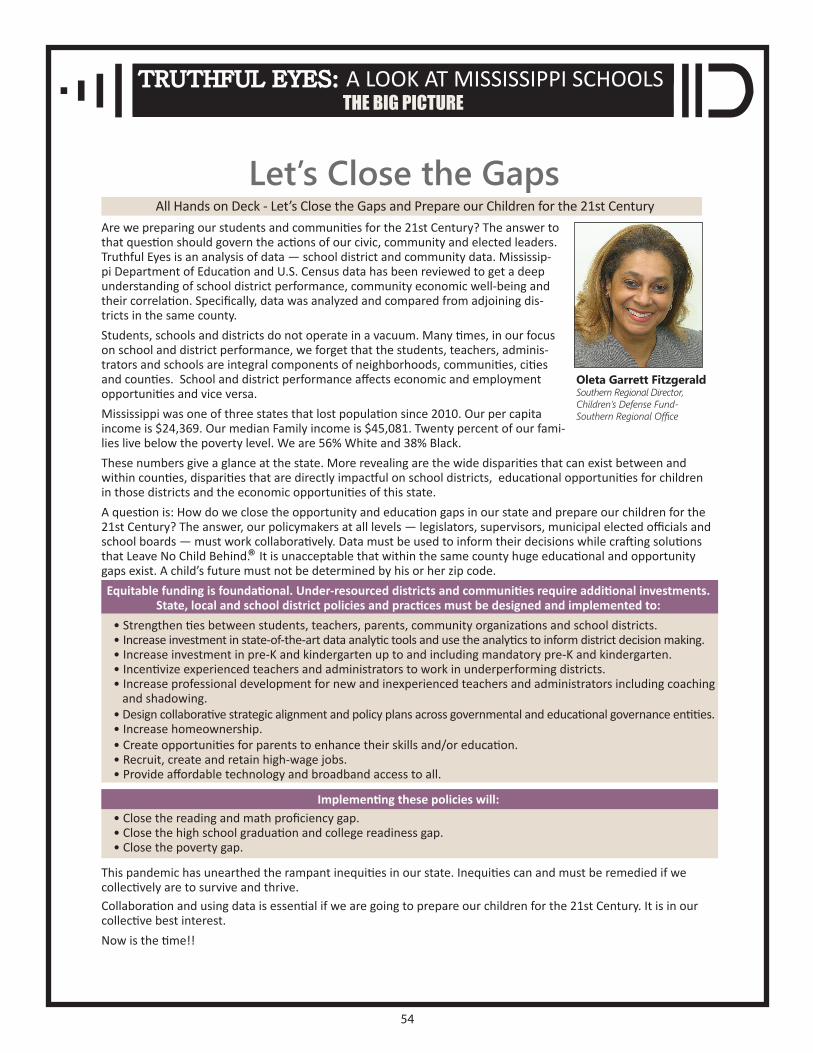
Are we preparing our students and communities for the 21st Century? The answer to that question should govern the actions of our civic, community and elected leaders.Truthful Eyes is an analysis of data — school district and community data. Mississip-pi Department of Education and U.S. Census data has been reviewed to get a deep understanding of school district performance, community economic well-being and their correlation. Specifically, data was analyzed and compared from adjoining dis-tricts in the same county.Students, schools and districts do not operate in a vacuum. Many times, in our focus on school and district performance, we forget that the students, teachers, adminis-trators and schools are integral components of neighborhoods, communities, cities and counties. School and district performance affects economic and employment opportunities and vice versa.Mississippi was one of three states that lost population since 2010. Our per capita income is $24,369. Our median Family income is $45,081. Twenty percent of our fami-lies live below the poverty level. We are 56% White and 38% Black. These numbers give a glance at the state. More revealing are the wide disparities that can exist between and within counties, disparities that are directly impactful on school districts, educational opportunities for children in those districts and the economic opportunities of this state. A question is: How do we close the opportunity and education gaps in our state and prepare our children for the 21st Century? The answer, our policymakers at all levels — legislators, supervisors, municipal elected officials and school boards — must work collaboratively. Data must be used to inform their decisions while crafting solutions that Leave No Child Behind.® It is unacceptable that within the same county huge educational and opportunity gaps exist. A child’s future must not be determined by his or her zip code.Equitable funding is foundational. Under-resourced districts and communities require additional investments.
State, local and school district policies and practices must be designed and implemented to: • Strengthen ties between students, teachers, parents, community organizations and school districts.• Increase investment in state-of-the-art data analytic tools and use the analytics to inform district decision making. • Increase investment in pre-K and kindergarten up to and including mandatory pre-K and kindergarten.• Incentivize experienced teachers and administrators to work in underperforming districts. • Increase professional development for new and inexperienced teachers and administrators including coaching and shadowing.• Design collaborative strategic alignment and policy plans across governmental and educational governance entities.• Increase homeownership.• Create opportunities for parents to enhance their skills and/or education.• Recruit, create and retain high-wage jobs.• Provide affordable technology and broadband access to all.
Implementing these policies will:• Close the reading and math proficiency gap.• Close the high school graduation and college readiness gap.• Close the poverty gap.
This pandemic has unearthed the rampant inequities in our state. Inequities can and must be remedied if we collectively are to survive and thrive. Collaboration and using data is essential if we are going to prepare our children for the 21st Century. It is in our collective best interest. Now is the time!!
Let’s Close the Gaps
Oleta Garrett FitzgeraldSouthern Regional Director,Children’s Defense Fund-Southern Regional Office
All Hands on Deck - Let’s Close the Gaps and Prepare our Children for the 21st Century

55
P3 STRATEGIES, LLCThe mission of P3 Strategies, LLC is to enhance the quality of life for all children and their communities. We partner with schools and districts, non-profits, for-profits, business and government to accelerate achievement for students and schools. We advocate for policies and programs that advance health, education and the well-being of all children. We communicate information to multiple constituents.
And, we assist our clients integrate real-time data into their programs and services. A devotion to social justice and civil society undergirds all of our work.
TRUTHFUL EYES: TRUTHFUL EYES: A LOOK AT MISSISSIPPI SCHOOLSABOUT THE TEAM
PAMELA SHAW
JIMMIE GATES
DAVID HAMPTON
GUS VARGAS
A senior manager, entrepreneur, and public policy analyst, Pamela Shaw is a seasoned leader, tacti-cian, organizer and devotee to social justice. She has more than 20 years of experience focused on the health, education and management training
and development of children, families and service providers in vulnerable communities and organi-zations. She is a native Mississippian with degrees from Southern University and the University of Maryland.
Jimmie E. Gates is a retired legal and political writ-er as well as former columnist for the Mississippi Clarion Ledger. Jimmie is a veteran journalist who has covered the people, places and things that make Mississippi special for almost four decades.Jimmie has won numerous awards, including the Sigma Delta Chi award, the Best of Gannett, the Mis-sissippi Press Association reporting award and the Na-tional Association of Black Journalists award. Jimmie
is a member of the regional Hall of Fame of the National Association of Black Journalists. He has appeared on True Crime national shows, includ-ing TV One’s “Fatal Attraction” and “For My Man,” “Snapped, and Redrum,” which is murder spelled backward. Jimmie also served as a researcher and
consultant for the television show CourtTV. A graduate of Jackson State University, Jimmie and his wife, Pattie, are parents of one child.
David Hampton is a veteran journalist who spent 37 years as a writer and editor at Mississippi newspapers. Hampton, 68, is a native of Tennes-see and graduate of the University of Memphis. He joined the Jackson newspapers in 1976 as a government and political writer. He served a stint at The Clarion-Ledger/Jackson Daily News Washington, D.C., bureau in 1982 and came back to Mississippi as
metro editor for the newspapers. He became editorial director in 1986 and oversaw The Clari-on-Ledger’s opinion pages for 26 years before his retirement in 2012. He now is a freelance writer and teaches journalism. He has won numerous writing awards and in 2012, was inducted into
the Mississippi Press Association Hall of Fame for his contributions to Mississippi journalism.
A senior K12 technology architect and reformist, business intelligence consultant, Gus Vargas de-signs and implements technology solutions that fundamentally change data practices and analy-sis in public education. He maximizes the poten-tial of technology solutions and designs training programs that produce lasting results. He designs web applications for national education firms and state asso-
ciations, business intelligence solutions for public education systems, online training for state agen-cies and has developed k12 education tools that are used to help thousands of educators in their daily work. A native of Northern California, Var-gas holds degrees from California State University,
Sacramento and California State University, East Bay.

TTRUTHFUL RUTHFUL EEYESYESA LOOK AT MISSISSIPPI SCHOOLS
This.report.is.commissioned.by.the.Children’s.Defense.Fund-Southern.Regional.Office..
with.support.from.Better.Schools,.Better.Jobs.
A 21st CENTURY CALL TO ACTION