Embed Size (px)
Citation preview

The author(s) shown below used Federal funds provided by the U.S.Department of Justice and prepared the following final report:
Document Title: Truth-in-Sentencing in Virginia
Author(s): Brian J. Ostrom, Fred Cheesman, Ann M. Jones,Meredith Peterson, Neal B. Kauder
Document No.: 187677
Date Received: April 5, 2001
Award Number: 96-CE-VX-0005
This report has not been published by the U.S. Department of Justice.To provide better customer service, NCJRS has made this Federally-funded grant final report available electronically in addition totraditional paper copies.
Opinions or points of view expressed are thoseof the author(s) and do not necessarily reflect
the official position or policies of the U.S.Department of Justice.

This document is a research report submitted to the U.S. Department of Justice. This reporthas not been published by the Department. Opinions or points of view expressed are thoseof the author(s) and do not necessarily reflect the official position or policies of the U.S.Department of Justice.
Prepared for the National Institute of Justice
Authored by
Brian J. Ostrom, Project Director Fred Cheesman
Ann M. Jones .
Meredith Peterson
Nationd Center for State Courts
This document is a research report submitted to the U.S. Department of Justice. This reporthas not been published by the Department. Opinions or points of view expressed are thoseof the author(s) and do not necessarily reflect the official position or policies of the U.S.Department of Justice.

Funded by the National Institute of Justice
Copyright 1999 National Center for State Courts N]
- m a NCSC ISBN 0-89656-2034 ,t+
This report was developed under a grant from the National Institute of Justice (Grant 96-CE-VX-0005). The opinions and points ofview in chis report are those of the authors and do not necessarily represent the official position or policies of the National Institute of Justice or the Virginia Criminal Sentencing Commission.
This document is a research report submitted to the U.S. Department of Justice. This reporthas not been published by the Department. Opinions or points of view expressed are thoseof the author(s) and do not necessarily reflect the official position or policies of the U.S.Department of Justice.

Table of Contents
.-
Executive Summary ............................................................................................................... 1
Chapter 1 Introduction ..................................................................................................................... 4
Chapter 2 T h e Path to Reform ......................................................................................................... 10
Chapter 3 The Design 0fTI.S Guidelines in Virginia ........................................................................ 21
Chapter 4 The Impact ofTIS on Prison Population in Virginia ........................................................ 37
Chapter S The Impact ofTIS on Judicial Compliance ...................................................................... 44
Chapter 6 Estimating Preventable Crime Under TIS ........................................................................ 52
Chapter 7 Assessing the Impact ofTIS on Recidivism ...................................................................... 61
Chapter 8 Conclusion ...................................................................................................................... 79
Bibliography ........................................................................................................................ 83
This document is a research report submitted to the U.S. Department of Justice. This reporthas not been published by the Department. Opinions or points of view expressed are thoseof the author(s) and do not necessarily reflect the official position or policies of the U.S.Department of Justice.

Acknowledgements
This project benefited greatly from the advice and guidance of many individuals.
First and foremost, we wish to thank everyone associated with the Virginia Criminal Sentencing Commission (VCSC). Their cooperation and participation enabled us
to gather the data and information required to complete this study. In particular, we gratefully acknowledge the support of the Honorable Ernest I? Gates, Chairman of the VCSC, and Richard I? Kern, VCSC Executive Director. This project drew heavily on the insight and knowledge of the VCSC staK Meredith Farrar-Owens helped immensely with the design and interpretation of the recidivism study. National Cen- ter for State Courts project staff also thank Carolyn Williamson, James C. Creech, Jody T Fridley, and Ann A. Jones for their willingness to meet and assist the evalua- tors throughout the life of the study.
George Allen (Governor 1994-1998), Frank Atkinson (General Counsel to the Gov- ernor), and Richard Cuflen (Attorney General) all graciously made time to partici- pate in project interviews. Their candor and willingness to answer detailed questions were important for documenting how and why sentencing reform occurred in Vir- ginia. In addition, several officials from the Department of Corrections helped staff during the study of the Offender Notification Release Program (ONRP). Patrick Gurney, Classification and Records Manager, was instrumental in helping project staff reach representatives from throughout Virginia's correctional field units.
We also wish to acknowledge the considerable contribution of our National Center for State Courts colleagues Neil LaFountain and Margaret Fonner for their assistance with data analysis and project administration. This publication also benefited from the careful editing of David Morrill. The graphic design and report publishing was provided by Lorraine HOE
Finally, the support of the National Institute of Justice must be recognized. In par- ticular, the encouragement and monitoring provided by Jordan k i te r and Janice Munsterman brought the project to a happy conclusion. The National Center for State Courts and the Virginia Criminal Sentencing Commission thank NIJ for rec- ognizing the need to document and evaluate the major shifts in sentencing practice and policy that have occurred in Virginia.
This document is a research report submitted to the U.S. Department of Justice. This reporthas not been published by the Department. Opinions or points of view expressed are thoseof the author(s) and do not necessarily reflect the official position or policies of the U.S.Department of Justice.

EXECUTIVE SUMMARY
Reform and Sentencing
Truth-in- in Virginia
Truth-in-sentencing (TIS) is the most prominent sentencing reform movement of the 1990s. The primary objective ofTIS is to more closely align the sentence im- posed by the judge with the actual amount of time served in prison by restricting or eliminating parole eligibility and good time. In many instances, these reforms are accompanied by significant increases in the penalties for violent offenders. TIS is based on a “just deserts” philosophy in which sentence length varies directly in pro- portion to the severity of the offense and allocates penalties as a deserved punish- ment rather than as a means for rehabilitation and treatment.
This report is the result of an 18-month partnership project funded by the Na- tional Institute of Justice to evaluate the development and impact ofTIS in Virginia. The successful completion of this project required both intimate knowledge of the process underlying the changes to Virginia sentencing law and the capacity to con- duct the evaluation in an appropriate and impartial manner. For this reason, a part- nership was developed to bring together the historic and institutional knowledge of rhe Virginia Criminal Sentencing Commission (VCSC) and an objective, third-party evaluation team from the National Center for State Courts (NCSC).
The evaluators view the purposes and features of sentencing reform in Virginia as given, and no value judgments are made about the goals of TIS. No effort is made to advocate specific sentencing structures and strategies. As such, the pur- pose of this evaluation is to (1) analyze the approach used in Virginia to develop and implement one of the nation’s pioneering efforts in TIS, inchding the aboli- tion of parole and the iniriative to increase prison sentences for violent offenders; (2) critically evaluate the analyses conducted to forecast the impact of TIS on sen- tencing outcomes and prison population; and (3) begin the process of conducting an evaluation of the impact of Virginia’s sentencing reforms on recidivism among violent offenders. With the exception of the recidivism analysis, all analyses re- ferred to in this report were conducted by the VCSC. The role of the NCSC was to evaluate the work of the VCSC.
-
Central findings Include: a TIS became effective in Virginia on January 1, 1995. Virginia’s sentencing reforms
abolished parole, reduced good time allowances to ensure that inmates serve a minimum of 85% of their imposed sentence, and increased prison sentences for violent and repeat offenders.
m Virginia, a long-time proponent of structured sentencing, implementedTiS through a revision of the state’s existing voluntary system of sentencing guidelines. The benefit of the sentencing guideline approach is that it allows for a more accurate assessment of the likely impact of changes in sentencing and/or parole policy.
This document is a research report submitted to the U.S. Department of Justice. This reporthas not been published by the Department. Opinions or points of view expressed are thoseof the author(s) and do not necessarily reflect the official position or policies of the U.S.Department of Justice.

Guidelines systems are arguably the most cost-effective means of providing racio- nal structure, relevant data, and the ability m accurately monitor and forecast
sentencing outcomes. D Along with the federal government, Virginia is one of eight stares that have abol-
ished parole and implemented TIS legislation that requires almost all violent and nonviolent offenders to serve 85% of the imposed sentence. Under TIS, violent and repeat offenders receive sentences two to six times longer than previously. The amount of time served by nonviolent offenders was not changed by the move to TIS. Judge-imposed sentences for nonviolent offenders are lower under TIS, but the time served in prison remains the same because sentences are no longer re-
duced dramatically by parole and good time allowances. D Under TIS, offenders are expected to serve an average of 89.7% of the judicially
imposed sentence. Although parole was abolished for all offenders convicted after January 1, 1995, parole remains in effect for individuals incarcerated prior to TIS reform. The parole grant rate (for eligible offenders) has dropped from 46% in 1991 to 5% in 1998. The judicial sentencing recommendations under Virginia‘s TIS guidelines remain
voluntary, but are usually followed by judges. Currendy, judicial compliance rates are equal to or exceed overall pre-TIS guideline compliance rates of 78%. Jury trial rates, predicted by some to rise as a result ofTIS, have fallen steadily over the past 12 years. The most significant drop came at the time when bifurcated
trials and TIS were implemented. Jury trials currently make up less than 3% of felony dispositions.
m Analysts in Virginia forecast that more than 26,000 violent and 94,000 nonvio- lent felonies are expected to be averted between 1995 and 2005 by the passage of TIS-a proposition that was important for building institutional support for sen- tencing reform, Evaluators found that while analytically complex, the methods employed for determining preventable crime were conceptually sound and conser-
vative in their estimates. Prison population under TIS has been lower than originally forecasted. Evaluators cite several possible reasons for these overestimates, including lower-than-expected crime rates and inaccurate estimates of new admissions to prison.
n A deterrence effect is one way for TIS to reduce recidivism in Virginia. The Of- fender Notification Release Program (ONRP) is designed to educate inmates leav- ing Virginia prisons specifically about TIS reforms. AI1 inmates leaving the prison system are given a type of “exit interview” during which they are informed about the abolition of parole and the old good conduct credit system. Each departing inmate receives a wallet-sized “notification card” that contains the possible sen- tencing consequences of being arrested and convicted of a new felony offense.
/
2 Tntb-in-Smtencing in Wrginia
This document is a research report submitted to the U.S. Department of Justice. This reporthas not been published by the Department. Opinions or points of view expressed are thoseof the author(s) and do not necessarily reflect the official position or policies of the U.S.Department of Justice.

As part of a long-term recidivism analysis, project d h a v e establiihed baseline recidi- vism races for the offender population rdeased from prison prior to the introduction ofTIS. Half (49.3%) ofall offenders released from prison in 1993 were re-arrested for any new crime within three years. The number of persons who recidivate drops quickly as the measure of recidivism becomes more conservative (e.g., of rhose released from prison, 22% were reconvicted of a new felony). Recidivism, if it does occur, is likely to happen sooner rather than later. For those who recidivate, the average time until first re-arrest for any crime was about 12 months, and 75% recidivate within 19 monrhs.
rn Property offenders have the highed rates of recidivism, followed by drug offend-
ers, then violent offenders. There is some evidence of offense specialization for property and drug offenders: 75% of those re-arrested for a property offense were originally incarcerated for a property crime and 59% of those re-arresred for a
drug offense were originally in prison for a drug crime.
Executive Summary 3
This document is a research report submitted to the U.S. Department of Justice. This reporthas not been published by the Department. Opinions or points of view expressed are thoseof the author(s) and do not necessarily reflect the official position or policies of the U.S.Department of Justice.

CHAPTER ONE
Introduction
.-
Reform and Truth-in-Sentencing in Virginia Strategies for reducing violent crime dominated Virginia politics during the 1993
gubernatorial race. George Men, the republican candidate, made the elimination of parole and the institution of harsher punishment for violent offenders the center- piece of his campaign. After winning the election, Allen established the Sentencing and Parole Abolition Commission, which moved quickly to recommend that Vir- ginia establish Truth-in-Sentencing (TIS) through a major restructuring of the state’s existing system of sentencing and parole. Determining the exact dimensions of sen- tencing reform occupied the political process throughout the first nine months of the Allen administration, and at a special session of the General Assembly in Septem- ber, 1994, Virginia’s legislature passed the most significant and comprehensive sen- tencing reforms in the state’s history.
These reforms, which became effictive on January I, 1995, were designed to achieve three objectives:
m Increase prison terms for violent and repeat offenders; Abolish parole;
rn Reduce aHowances of “good time” to ensure that inmates serve 85% of their im- posed sentence. The abolition of parole and the restructuring of good time were accomplished by
statute. In addition, the legislature created the Virginia Criminal Sentencing Com- mission (VCSC) to oversee the development, implementation, and maintenance of TIS guidelines. It became the responsibility of the VCSC to “retool” Virginia’s exist- ing guidelines so that violent. and repeat offenders would now receive significantly harsher penalties. But the purse strings were not completely loosed. The legislative mandate to the VCSC also required that the demand for prison space under the new “hard time for hard crime” sentencing strategy be fiscally responsible. The VCSC used a reasoned and innovative approach to both increase incarceration periods for violent offenders and keep control over prison expenses under the new TIS guidelines.
What is Truth-in-Sentencing? Truth-in-sentencing policies are designed to ensure that the amount of time an
offender actually serves in prison is closely aligned with the original judicially im- posed sentence.’ Many states seek to achieve this goal by significantly iestricting or
Although the term truth-in-sentmcingcame to prominence in the 1990s, jurisdictions began moving in that direction in the early 1980s. The first TIS law was passed in Washington State in 1984. Congress mandatedTIS at the federal level with the Sentencing Reform Act of 1984, which established a sentencing commission as an independent agency to recommend pre- scriptive sentencing guidelines, to eliminate parole, and to require that inmates serve at leasr 85% of their sentence (good time would be limited to 54 days per year). Discretionary parole’
4 Titb-in-Sentencing in Virginia
This document is a research report submitted to the U.S. Department of Justice. This reporthas not been published by the Department. Opinions or points of view expressed are thoseof the author(s) and do not necessarily reflect the official position or policies of the U.S.Department of Justice.

eliminating parole eligibility and good-time credits. The precise definition of “sig- nificant restrictions” has been strongly influenced by rhe federal government. Under the 1994 crime bill,’ Congress authorized incentive grants to states for construction or improvement of correctional facilities to “free conventional prison space for the confinement of violent offenders, LO ensure that prison cell space is available for the confinement of violent offenders, and to implement truth-in-sentencing laws for sentencing violent offenders.” To qualify for the TIS grants, states must require that violent offenders will serve at least 85% of the imposed prison sentence.
The 85% rule has become so commonplace that in 1998 27 stares (including
Virginia) qualified for the federal grant program.j-Though eligible for TIS Incentive Grants, many of rhese states have indeterminate sentencing systems; serving 85% of the minimum term in a sentence of 5 to 20 years would satisfy the TIS requirements of the federal legislation. A more conservative definition of TIS calls for sentences imposed in a guidelines or determinate sentencing structure where the 85% calcula- tion can be made on a definite or “fixed sentence. States also differ in the scope of TIS legislation. In many states TIS applies only to violent offenders. The federal government and eight states, including Virginia, apply an 85% TIS requirement to all felony offenders. This definition reflects the philosophy of TIS that all offenders serve a prison term that is closely aligned with the original sentence.
Proponents argue that TIS policies restore public confidence in the criminal jus-
tice system and further such concepts as predictability, proportionality, deterrence, victims’ rights, and consistency in the sentencing process. TIS is deeply rooted in the determinate sentencing philosophy that dominated the 1980s. Generally, the deter- minate model holds that the authority to set sentence length resides with the court and that sentences should be served in full. Only modest reductions in sentence length based on satisfactory behavior while incarcerated (good time) are acceptable. The determinate model is based on a “just deserts” philosophy in which sentence length varies directly in proportion to the severity of the offense and, to a lesser extent, prior criminal history. The “just deserts” model emphasizes allocating scaled pendries as a deserved punishment rather than as a means for rehabilitation and treatment.4 This philosophy contrasts with indeterminate models that split author- ity over final sentence length between the court and the department of corrections. Under an indeterminate system, the court typically sets a minimum sentence in con- junction with a statutorily determined maximum sentence, with the actual release date determined by the parole board.’
Opponents claim that TIS reforms are simply the latest in a long line of ill-con-
I
release was first abolished in Maine in 1975 (inmates in Maine currently serve 50 to 67% of their sentences based on good-time accrual). For more on stare and federal reform efforts, see Ostrom, Kauder, Rottman, and Peterson (1998) and Greenfeld, Beck, and Gilliard (199G). *Violent Crime Control and Law Enforcement Act of 1994. )Ditron and Wilson (1999). 4 V ~ n Hirsch (1976). Wilkins, Newton, and Steer (1 993).
Introduction 5
This document is a research report submitted to the U.S. Department of Justice. This reporthas not been published by the Department. Opinions or points of view expressed are thoseof the author(s) and do not necessarily reflect the official position or policies of the U.S.Department of Justice.

ceived “get tough on crime“ policies. This camp argues that some discretionary re- lease mechanism should be retained by a paroling authority and that, in the long term, incarcerating offenders for longer periods of time simply wastes resources and will have little positive effect on public safety, The National Council on Crime and Delinquency (NCCD), for example, holds that the main factor for deciding release
time should be an updated assessment of the inmate’s risk to the community-deter- mined once a specified fraction of the custodial term has been served. NCCD also supports retaining the possibiliry of parole for serious offenders given maximum terms or life sentences! Critics also contend that TIS leads to creative, if not decep- tive, charging and sentencing practices. Disparity may result from selective prosecutorial charging practices, or if pleas in certain jurisdictions are obtained by threatening to charge a particularly harsh statutory provision?
The optimal design of a just and equitable sentencing system that also makes efficient use of public resources will long be argued. People will continue to disagree as to whether particular sentencing policies are good or bad. What can’t be argued is that the implementation ofTIS in Virginia has had a substantial impact on judicial
sentencing practices and corrections policies.
Evaluating the Wrginia Experience with Wuth-in-Sentencing
Early in 1997, the Virginia Criminal Sentencing Commission (VCSC) agreed to
participate in a systematic evaluation ofVirginia‘s new TIS reforms to be conducted by the National Center for State Courts (NCSC). To answer the fundamental ques- tion, “What impact did the implementation ofTIS have on sentencing in Virginia?” the evaluators examine sentencing in Virginia from 1980 through the first three years ofTIS reform (January, 1995, to January, 1997). The evaluation findings cover three distinct aspects of sentencing reform in Virginia and incorporate both a process and outcome orientation.
First, the evaluation focuses on the process by which the new TIS system was
developed. In so doing, we define TIS and clarif) precisely what TIS was meant to
accomplish in Virginia. For the judiciary, the cornerstone of the 1993 sentencing reforms was a major redesign of the existing sentencing guidelines. Prior to reform, Virginia employed a set of voluntary, descriptive guidelines that, in combination with existing parole policies, ensured that the sentence imposed would be very differ- ent from the sentence actually served. Under TIS, parole was abolished and new guidelines were configured to more closely align imposed sentences with actual time served. This section examines the deliberations of the Governor’s Commission and the legislative committees responsible for implementing the ultimate design of sen- tencing reform in Virginia. Specific questions addressed in Chapters 2 and 3 include:
‘National Council on Crime and Delinquency (1992). ‘Tonry (1 996).
6 Truth-in-Sentmcing in Krgznia
This document is a research report submitted to the U.S. Department of Justice. This reporthas not been published by the Department. Opinions or points of view expressed are thoseof the author(s) and do not necessarily reflect the official position or policies of the U.S.Department of Justice.

rn How has sentencing reform evolved in Virginia since 1980? Where doesTIS fit within the historical antext of sentencing reform in Virginia? What features characterized
Virginia’s sentencing guideline system prior to TIS? What operational and politi- cal factors contributed to the adoption or rejection of specific reform components and policies?
m What is the precise design of Tis in Virginia? What is the current status of parole and good time in Virginia? How are violent and nonviolent offenders created under Virginia‘s TIS? How were the new guidelines and sentencing ranges developed? Second, the evaluation analyzes the effect of the TIS reforms against a set of ex-
plicit and implicit standards. The Governor and the Virginia legislature believed that judicial compliance with the new TIS guidelines would have two specific results: I) relatively little change in the actual time served by nonviolent offenders; and 2) a need for more prison space due to significant increases in prison sentences for violent offenders. Also, they hoped that longer prison sentences for violent and re- peat offenders under TIS would reduce violent crime and lead to fewer victims and lower costs of crime. VCSC staff conducted numerous analyses to estimate the costs associated with the implementation ofTIS as well as the benefits of crime prevented under the new system. This stage of the evaluation assesses the outcomes of TIS against the expectations of the system designers. In addition, the methods used by the VCSC to forecast the potential impact ofTIS on sentencing practices and correc- tions resources are reviewed and critiqued. Specific questions addressed in chapters 5 4 , and 5 include:
What is the impact of TIS on prison population? What techniques were used to
forecast prison popularion under TIS? What was the estimated impact of TIS? How accurate was the forecast?
.
m What is the impact ofTIS on judicial compliance? How is judicial compliance mea- sured? Has judicial compiiance changed with the introduction of TIS? How does compliance in jury sentencing compare with compliance in nonjury sentencing?
m How much new crime is prevented by the harsher penalties under TIS? How did Virginia estimate the level of preventable crime under TIS? What is rhe estimated “cost of crime” avoided through extended incarceration of violent offenders? IS there a beneficial “incarceration effect?” Third, this evaluation includes the first half (or baseline) of a recidivism analysis
for use in assessing the impact of TIS. The full recidivism study will be designed to compare recidivism of inmates released one year prior to the inception of the new sentencing laws with that of inmates released under TIS. However, because it is still too early to conduct an effective evaluation of the impact of TIS on the rate of recidivism of violent offenders, only the first haffwill be completed during this evalu- ation. At this stage, the NCSC, in close collaboration with the VCSC, has examined the background characteristics and prior conviction hisrories of offenders released from Virginia prisons in 1993. Records were then examined to determine whether offenders had been re-arrested or re-convicted wirhin three years of their release from
Inwoduction 7
This document is a research report submitted to the U.S. Department of Justice. This reporthas not been published by the Department. Opinions or points of view expressed are thoseof the author(s) and do not necessarily reflect the official position or policies of the U.S.Department of Justice.

prison. Multiple measures of recidivism are calculated and discussed. In addition, this stage of the evaluation also examines the creation and implemen-
tation of a recent VCSC innovation, the Offender Notification Release Program (ONRP), which was implemented early in 1997. The ONRP is intended to enhance the specific deterrent effect of the tougher sentencing laws by informing inmates
what their likely sentence will be if they commit other crimes after their release. Specific questions addressed in chapters G and 7 include: m What were the patterns of recidivism prior to the implementation ofTIS? How is
recidivism calculated and measured? How was the necessary data gathered? What is the rate of recidivism for offenders released prior to the 1994 reforms?
a What is the design and purpose of the ONRP? How does Virginia attempt to
educate inmates about to exit state correctional facilities about TIS reforms? How has the ONRP been implemented by the Department of Corrections? In summary, the purpose of this evaluation is (1) to analyze the approach used in
Virginia to develop and implement one of the nation’s pioneering efforts in TIS, including rhe abolition of parole and the initiative to increase prison sentences for violent offenders; (2) to critically evaluate the analyses conducted by rhe VCSC to forecast the impact ofTIS on sentencing outcomes and prison population; and (3) to begin evaluating the impact of Virginia’s sentencing reforms and Offender Notifica- tion Release Program (ONRP) on recidivism among violent offenders.
Who Benefits from this Evaluation? The evaluators view the purposes and features of sentencing reform in Virginia as
given, and no value judgments are made about the goals ofTIS. No effort is made to advocate specific sentencing structures and strategies. As such, the general objectives of this evaluation are (1) to increase our knowledge about the various sentencing policy alternatives considered in Virginia and (2) to ciarifjr the outcome of particular
choices. The knowledge gained from this approach is primarily designed to benefit Virginia policymakers and practitioners interested in an objective analysis of the development and implementation of the new sentencing reforms in their state. How- ever, given the ongoing interest in sentencing reform elsewhere, especially in TIS and abolition of parole, there is considerable nariond interest in Virginia’s experience. Additionally, an understanding of how sentencing reform operates in practice may help others advocate policies in sync with their objectives. Hence, this evaluation has been designed and written to clarify how sentencing reform efforts could be im- proved if initiated in other states.
Because many policymakers agree with the objectives ofTIS, it is easy to overlook how outcomes might differ from intent. Desired objectives are not the same as work- able solutions. For example, other states contemplating TIS reforms may benefit from
a description and analysis of how Virginia (I) determined its new sentencing ranges under TIS, preserving historical time-served amounts for nonviolent offenders while increasing time served for violent offenders; (2) estimated the probable impact of its
8 Titb-in-Sentenring in V;:rgipzia
This document is a research report submitted to the U.S. Department of Justice. This reporthas not been published by the Department. Opinions or points of view expressed are thoseof the author(s) and do not necessarily reflect the official position or policies of the U.S.Department of Justice.

--
sentencing reforms on avertable crime and the need for additional prison space; and (3) is measuring the impact ofTIS on recidivism. Sound analysis will help policymakers evaluate more accurately whether a sentencing policy alternative will, in fact, accom- plish the desired outcome.
VCSC/NCSC Evaluation Partnership The evaluation focuses on the process of sentencing reform in Virginia and criti-
cally examines the primary analyses and impact assessments conducted on behalf of
the Governor’s Commission as well as the legislative committees involved in sentenc- ing reform. The majority of these analyses were conducted by the Criminal Justice Research Center (CJRC) within the Department of Criminal Jusrice Services. Sev- eral key staff of the CJRC, including the director Richard Kern, accepted permanent positions at the VCSC when it was established officially on January 1 , 1935.’ The studies referenced and reviewed in this evaluation were collected from the files held at the current VCSC and were found in their original formats as printouts, graphical presentations, and various types of information and report packets (sometimes termed “fugitive” research and analysis).
The successful completion of this project required both intimate knowledge of the
process underlying the changes to Virginia sentencing law and the capacity to con- duct the evaluation in an appropriate and impartial manner. For this reason, a part- nership was developed to bring together the historic and institutional knowledge of the VCSC with an objective, third-party evaluation team ftom the NCSC. The part- ners believe that the best (and arguably only) way to ensure that this evaluation had
access to the necessary data and program documentation underlying Virginia‘s imple- mentation process was to involve the VCSC and its staff throughout the evaluation process. VCSC involvement included identifying the fundamental issues that drove sentencing reform; assisting in gaining access to and preparing databases; claritjling
any data problems, details, and nuances; and providing evaluators with other rel- evant information that affected Virginia’s sentencing reform egorts. Ongoing com- munication between the NCSC and the VCSC helped close important gaps in the evaluation. At the same time, while cooperation between the VCSC and the evalua- tors was critical during certain stages, the evaluation team also acted independently. The NCSC evaluation team was given a free hand to design and conduct the evalu- ation and, as a consequence, bears responsibility for the evaluarion results.
8Given the considerable overlap of key staff at the CJRC (prior to 1995) and at the VCSC (after 1995), this evaluation uses the shorthand of VCSC to refer to research and analysis conducted by both the CJRC and the VCSC.
Introduction 9
This document is a research report submitted to the U.S. Department of Justice. This reporthas not been published by the Department. Opinions or points of view expressed are thoseof the author(s) and do not necessarily reflect the official position or policies of the U.S.Department of Justice.

CHAPTER T W O
The Path to Reform
Virginia has been actively involved in sentencing research and reform since the
early 1980s. Initially driven by concern over sentencing disparity, Virginia has been a consistent innovator and strong proponent of the sentencing guideline concept. The new TIS guideline structure is better understood when presented in the context of earlier reform efforts. In reviewing sentencing reform in Virginia over the past two
decades,’ this chapter also underscores the critical importance of relevant data and effective staff to explain how decisionmaking during the 1994 reform process could be both informed and fast. One fundamental, though often under-appreciated, com- ponent of rational sentencing reform is rhe creation and maintenance ofa sentencing database. Virginia policymakers recognized that detailed and accurate information on past sentencing practices greatly enhances a state’s ability co design and imple- ment a specific set of sentencing reforms-and accurately estimate the possible im- pacts and associated cost. In addition, staff must have the capacity to knowledgeably assess and explain the expected differences between alternative reform packages. The rapidity with which the new TIS system was developed and approved by the legisla- ture (as compared to many other states adoptingTIS policies) was directly related to the extensive VCSC staff experience with sentencing-relared research prior to 1994.
Early 1980s-Beginnings of Reform in Wrginia In 1982, Governor Charles S. Robb appointed the Task Force on Sentencing to
study current sentencing policies and to recommend changes if appropriate. This study followed a series of newspaper articles and reports claiming the inconsistency and disparity of sentencing decisions in Virginia. The Task Force issued a final report in 1983, concluding that variation in the use of incarceration and length of prison terms for similarly situated offenders did exist across Virginia.’ These differences were found to be partially attributable to such factors as offender race, socioeco- nomic status, and location of the court. Based on these conclusions, the task force recommended that the Supreme Court of Virginia take steps to improve statewide consistency in sentencing through the development of historically based (or “de- scriptive”) sentencing guidelines.” The guideline concept did not have unequivocal support among the Virginia judiciary. In the absence of judicial oversight of the study methods and procedures, many judges were reluctant to accept earlier findings of unwarranted sentencing disparity. Concern centered on the belief rhat disparity studies conducted by the Governor’s Task Force and the Richmond Times-Dispatch
’ Governor’s Task Force on Senrencing (1 983). l o Similar findings/condusions had been reached in several other stares (Minnesota, Pennsyl- vania, Washington, Michigan), all of which established sentencing guidelines as a possible remedy for disparate sentencing decisions.
9 0 Tmtb-in-Sentencing in Wgiaiu
This document is a research report submitted to the U.S. Department of Justice. This reporthas not been published by the Department. Opinions or points of view expressed are thoseof the author(s) and do not necessarily reflect the official position or policies of the U.S.Department of Justice.

--
were based on a nonrepresentative sample of cases and that not enough factors were used to develop a rigorous statistical analysis of sentencing practices.” At this point the Executive Committee of the Judicial Conference of Virginia decided that a more comprehensive profile of sentencing in Virginia was necessary before appropriate sentencing guidelines could be developed.
1984-1985 Building a Database In 1984, the Secretary of Public Safety authorized the development of a fdly auto-
mated Pre-sentence Investigation (PSI) system for collecting detailed information on almost all felony convictions. At that time, no database existed in Virginia to capture the offense and prior record information needed to conduct a comprehensive analysis of sentencing. Initially, this database would provide information for a statewide dispar-
ity study and, if required and appropriate, would serve as the basis for descriptive sen- tencing guidelines. Descriptive guidelines are based on actual past sentencing practices of judges. Suggested sentences under this style of guideline reflect a careful analysis of the sentences actually imposed by judges for particular combinations of offense and offender characteristics. The goal is to eliminate the atypical or unusual sentence (e.g., the high and low extremes at both ends of the sentencing spectrum).
A key to understanding statewide sentencing practice is having valid and reliable data on past sentencing outcomes. VCSC staffindicate that the lack ofsuch data made many judges
wary of previous sentencing disparity studies as well as the process of guideline development
in other states. Since Virginia’s guidelines were to be purely descriptive, their quality and appropriateness would be tied directly to the data that underlie their development.
Pre-and post-sentence investigation (PSI) reporting formats were redesigned to
measure 212 objectively coded offense and offender variables.” Critical to the suc-
cess ofVirginia’s PSI database was the adoption of standard codes for probation and parole officers to record offense-specific information. These Virginia Crime Codes (VCCs) are a nine-digit alpha-numeric offense identification system based on the Code ofVirginia and include approximately 1,300 misdemeanor and felony crimes. This new system replaced the use of “free format” descriptions (i.e., unstructured, longhand attempts to describe the nature of past and current convictions). The VCC database is maintained by the sentencing commission and is updated annually to
reflect changes in statute or the addition of new laws. The VCC database includes the following information on each crime in the Code o f Virginia:
a unique Virginia Crime Code (VCC); m a concise offense description, guided by the elements of the offense; rn the Code of Krginia section corresponding to the VCC;
the statutory penalty range; the State Police and Department of Corrections NCIC code corresponding to the VCC.
” “Justice For All,” (1983). This study examined sentences handed down for robbery cases and found the existence of unwarranted sentsncing disparity. ”Roughly 20,000 new cases have been added to the PSI database each year since 1985; the current system contains about 200,000 cases.
The Path to RefDnn 11
This document is a research report submitted to the U.S. Department of Justice. This reporthas not been published by the Department. Opinions or points of view expressed are thoseof the author(s) and do not necessarily reflect the official position or policies of the U.S.Department of Justice.
--
12 Tnctb-in-Sentencing in Virginiz
The PSI system and the establishment of the VCC coding system is particularly noteworthy for this evaluation because this rich source of information underlies al-
most all sentencing guidelines data analysis, research, and monitoring from 1983 to the present. Given the importance of the VCC system and PSI database, the state should be cognizant of at least two related issues. First, consideration should be given to developing a unique offender identifier to be used consistently across Virginia's numerous criminal-justice-related data systems. Such an identifier would ease sig- nificantly the effort and cost associated with merging the PSI database with addi-
tional sources of data. For example, without a unique identifier, ie is currently difi-
cult to supplement PSI data with criminal history information for analysis related to recidivism, juvenile justice, or risk assessment. Second, the VCSC must be diligent and clear in communicating their rationale for maintaining the PSI database. One method of preserving the PSI database is by initiating and supporting efforts to im- prove efficiency through automation and quality control. Otherwise, efforts to scale down or even eliminate the PSI data collection citing the ongoing expense required to collect, edit, and sustain the system may surface. As compared to nonguideline states, an advantage for Virginia (and other states that have developed and main- tained guidelines) is the substantial collection of reliable data sources. The lesson
learned is that any meaningful attempt at structured guidelines development must be accompanied by improvements in existing data systems.
19864987 Statewide Disparity Study In April of 1986, the Chief Justice of the Virginia Supreme Court appointed the
Judicial Sentencing Oversight Committee to oversee a statewide study of judicial sentencing practices within the Commonwealth. The study uncovered evidence of unwarranted sentencing disparity: statistical analysis showed that a variety of extra- legal factors influenced sentencing outcomes, including offender race and gender, type of criminal defense attorney, jury vs. bench trial, and level of oflender educa- tion." The influence of these factors was also found to vary according to offense type, sanction (i.e., probation, jail, prison), and geographical area of che state. Ac- cording to VCSC staff, these findings would later be the primary impetus for moving forward in sentencing guidelines development.
During 1987, the Executive Committee of the Judicial Conference of Virginia voted to present the results of the disparity study to all circuit court judges during a series of regional meetings. The outcome in each region was a vote by the circuit judges recommending the implementation of voluntary sentencing guidelines. Un- like other states considering guidelines as a way to curtail rising prison populations or as means for implementing non-incarcerative sentences, Virginia's sole purpose for guidelines developmenr. was to reduce unwarranted sentencing disparity.
On the basis of the findings from the disparity study, the Chief Justice appointed a new committee to oversee the development of sentencing guidelines. Although a
l 3 Judicial Sentencing Guidelines Oversight Committee (1987).
This document is a research report submitted to the U.S. Department of Justice. This reporthas not been published by the Department. Opinions or points of view expressed are thoseof the author(s) and do not necessarily reflect the official position or policies of the U.S.Department of Justice.

departure from the practice in most other states where sentencing commissions include representation from each branch of government, this committee was com- prised solely of judges.14 The general belief of the Virginia committee was that sen- tencing is a judicial function; and since the guidelines were to be voluntary, only the judiciary needed to be involved in their development.
1987-1988 Guidelines Developed The Judicial Sentencing Guidelines Committee USGC) was responsible for all
policy decisions regarding sentencing guidelines development and operation. The first step was to operationally define “appropriate sentence length” so that the effec- tiveness of the guidelines could be measured. The JSGC determined that the sen-
tencing guidelines ranges would encompass the middle 50% of historical sentence lengths and that a judicially imposed sentence was defined as appropriate if it fell within this range and “inconsistent” (and possibly disparate) if it fell below or above this mid-range. Therefore, the highest 25% and the lowest 25% of all historical sentences fell outside rhe guidelines ranges. The basic characteristics ofVirginia’s first set of descriptive sentencing guidelines included:
m Use of a judicial sentencing worksheet as opposed to a sentencing grid; rn Presentation of eight specific offense groups (i.e., assault, burglary, drugs, fraud,
homicide, larceny, robbery, sexual assault) with individual sets of scoring factors and worksheets;
m A bifurcated worksheet design beginning with an intout decision (prison v. no prison), followed by length of incarceration, if appropriate;
m Presence on the worksheets ofonly legally reievant offense- and offender-related factors found to be statistically significant in the analysis of historical sentencing practices;
m Recommendation of “effective time sentences” defined as the length of the judi-
-
cially imposed sentence minus any suspended time; a Strictly voluntary sentencing guidelines where judicial compliance would not be
mandated and there would be no opportunity for appellate review based on a challenge to the guidelines. Because Virginia’s guidelines were to be descriptive of historical patterns across the
commonwealth and based on legally defensible criteria, VCSC staff analyzed the PSI database to determine normal sentencing practice as well as the specific offense and offender-related factors significant in predicting judicial sentences. Thus, no “nor- mative” adjustments were made to the observed sentencing patterns to enhance (or reduce) the recommended punishment for specific crimes and only statistically sig- nificant offense- and offender-related factors were used to create the guidelines. In this manner, the influence of extralegaI factors (e.g., race, gender, identity of the judge or judicial circuit, method of adjudication) was reduced so that those factors would no longer exert a systematic influence in sentencing decision^.'^
- -- l4 Kauder and Ostrorn (1398). I s Judicial Sentencing Guidelines Oversight (1 989).
The Path to Rejam 9 3
This document is a research report submitted to the U.S. Department of Justice. This reporthas not been published by the Department. Opinions or points of view expressed are thoseof the author(s) and do not necessarily reflect the official position or policies of the U.S.Department of Justice.

.-
In developing the pilot guidelines, VCSC st& used three statistical procedures to analyze PSI data on 33,573 felony cases sentenced between February, 1985, and June, 1987. All felony convictions resulting in probation and/or a suspended sen- tence, a jail term, or a prison term were examined. The results of this comprehensive andysis were used to design a sentencing guidelines framework consisting of three worksheets:
worksheet A: used to determine whether a person would receive a prison or a
Worksheet B: used to determine whether a person would receive probation or jail
WOrLbeet C: used to determine the length of a prison sentence (ifprison sentence
Eight sets of offense-specific guideline worksheets were formulated and a manual
Worksheets A and B were designed using multiple discriminate function analysis. In keeping wich a bifurcated design, this analysis was used to determine the factors
influential in judicial decisions of whether or not an offender was to be incarcerated. A second statistical technique called “probit” was used in the initial pilot guideline development to refine the proportional weights of the factors for Worksheets A and B. This technique aIlows one to compare each specific factor’s importance in the sentencing decision. For example, assume that the coefficient (i.e., the numerical representation of a factor‘s “imporrance” in a sentencing decision) for “use of a fire- arm” was the same as that for “serious injury of a victim.” This indicates that judges have historically given about the same weight (sentence outcomes have been equally influenced by these two offense factors) for firearm use as they have for serious victim injury when considering whether or not someone should go to prison.
The offense- and offender-related characteristics linked to the length of prison sentence (Worksheet C) were uncovered using ordinary least squares mdtiple regres- sion (OLS). Coescients associated with each factor in &e analysis translate roughly into months of incarceration. For example, a drug offender who scored “6l”on Worksheet C under the fictor “Counts of Primary Offense” implies that the historic sentence for a drug offender convicted of four counts of selling drugs was about 61 months (five years) longer than a person convicted of one count of selling drugs, all other factors being equal.”The factors found to be statistically significant, and their relative impact, were critical elements for future guidelines development, and, even- tually, the establishment of the current TIS guidelines.
Interviews with VCSC st& and a review of published and unpublished source materials document t h e analytical process for guideline worksheet development. The
nonprison sentence;
(if nonprison sentence indicated on Worksheet A);
indicated on Worksheer A).
was created to explain their application.1G
-
I6The most recent version ofVirginia Sentencim Guidelines still emdovs these three worksheets. I
but now apply them to 12 categories of offenses. See, Virginia Criminal Sentencing Commis- sion 61998b). I’JudiciaI Senrencing Guidelines Oversight Committee (1989).
14 Truth-in-Sentencing in Virgtnia
This document is a research report submitted to the U.S. Department of Justice. This reporthas not been published by the Department. Opinions or points of view expressed are thoseof the author(s) and do not necessarily reflect the official position or policies of the U.S.Department of Justice.

research staff responsible for conducting the disparity analysis and pilot guidelines development operated in a team environment supervised by a project director with previous experience in sentencing guidelines development and other criminological research. Individual researchers were responsible for different segments of the guide- line development, while results were checked independently through blind repeat analyses using the same data. This process verified findings across analysts with the
results and any inconsistencies being reported during regularly scheduled staff meet- ings. Researchers were well qualified to conduct the analyses, possessing advanced degrees in social science and criminal justice research and statistics, while also having various levels of previous applied resear4 experience. Evaluators note that guideline development in Virginia benefited greatly from comprehensive data sources, adequate resources, and staff expertise.
-
1988-1990 Sentencing Guidelines Pilot Study Virginia's judiciary voted to pilot test the voluntary guidelines before recommend-
ing statewide implementation. Six judicial circuits (out of a possible 3 1) representing a mix of rural and urban courts were selected as pilot sites. A judge from each of these six circuits sat on the Judicial Sentencing Guidelines Committee (JSGC), which provided policy oversight during the process. After a series of regional training semi- nars, guidelines went into effect in July, 1988, with a plan to pilot the system for one year. Judges in the pilot sites were asked to consider the guidelines in almost all felony cases, explain any reasons for departure, and return the completed forms for monitoring and evaluation.
Because the purpose of the first set of guidelines was to reduce disparity, the JSGC directed staff to evaluate the effects of guidelines on sentencing consistency and neu- trality. Consistency was defined as the extent to which similarly situated offenders who committed similar crimes received similar sentences. The JSGC chose to mea- sure rhe effect of the guidelines on consistency by judicial compliance: the percent- age of sentences that were within sentencing guidelines ranges before and after guide- lines were implemented. Compliance races were examined in pilot and nonpilot sites to provide a comparative control group. As shown in the bar chart, compliance rates (percentage of judicial sentences that fell within recommended ranges) during the pilot program ranged from 74% to 88% depending on the offense group, and ranged from 70% to 82% depending on the pilot site. Overall, the average compliance rare was 78%, with departures more likely to be mitigated (1 5%) than aggravated (7%).
Neutrality, or impartiality, was assessed by examining whether variation in sen- tence length was explained by differences in Iegally relevant factors (e.g., offense severity, prior record) and not by extrdegal factors such as race or gender. Neutrality was measured by applying the same statistical techniques used for guidelines devel- opmenc to determine which extralegal factors, if any, exerted influence in sentencing decisions in both pilot and nonpilot sites. Using consistency and neutrality as a frame- work for evaluating the existence of sentencing disparity has been documented in
Voluntary Sentencing Guidelines Compliance Rates January to September, 1989
By Circuit Circuit12 1- 70%
Circuli9 \- 76%
Circuit19 '- 78%
Circuit 21 f- 78%
Circul4 '-! 80% C i i t 16 ~-182%
Total -78%
The Pa& to Refirm 15
This document is a research report submitted to the U.S. Department of Justice. This reporthas not been published by the Department. Opinions or points of view expressed are thoseof the author(s) and do not necessarily reflect the official position or policies of the U.S.Department of Justice.

--
Voluntary Sentencing Guidelines Percentage of Sentences within Guidelines Ranges, January to September, 198g
E!!!&!Y
61%
il II Before After Before Aft%
Guiddnes Wlii Guidefines Guidehnes
Proportion of Sentence Decision Accounted for by Legal and -Legal Facto& Burglary Cases Sentenced to Prison
I Legal tactocs a Extra-legal Moa
10% i Gudelines After 1
Non-Pilot Sites
past sentencing literature, and both terms still appear as meaningful performance indicators in this area.'s
A year-long pilot study revealed that judges were using the guidelines, complying with guideline recommendations, and that the guidelines effectively reduced unwar- ranted disparity. As an example, the top bar chart shows the percentage of sentences for assault and burglary within the guidelines ranges in the pilot and nonpilot sites both before and after guidelines were introduced. For both offenses shown, the com- pliance percentage is notably higher in pilot sites than nonpilot sites. An illustration of the extent to which neutrality was achieved is depicted in the bottom bar chart. Following the introduction of guidelines, the influence of extralegal factors in ex- plaining variation in sentence length for prison-bound burglary offenders was re- duced substantially in the pilot sites (10% of explained variance was accounted for by extralegal factors in pilot sites as compared to 54% in nonpilot sites after guide- lines implementation).
The evaluation also attempted to measure judicial perception and attitudes toward the pilot guidelines. A survey conducted during the pilot program found strong ac- ceptance of the voluntary guidelines among participating judges.'!'The survey showed 90% of judges believed the guidelines had increased consistency in sentencing, while affecring judicial discretion minimally or not at all. Almost all judges (31 of32 judges surveyed) felt that having the guidelines available as a reference tool was preferable to not having guidelines. The same number said that the guidelines should be expanded statewide. The one judge who did not want to see guidelines expanded also indicated he did not believe in the existence oEunwarranted sentencing disparity.20
1991-1993 Statewide Voluntary Guidelines After viewing the results of the pilot study, the JSGC, with the approval of the
Chief Justice, recommended that the sentencing guidelines be implemented state- wide: Virginia's circuit judges voted to adopt the sentencing guidelines statewide effective January, 1991 I The sentencing guidelines were monitored and adjusted an-
54% nually over the next three years to reflect current judicial practice. Interviews with commission members and staff reveal that a key to program acceptance by the judi- ciary was the descriptive and voluntary nature of the guidelines. In addition, the comprehensive and yearly re-analysis of felony conviction and sentencing data to ensure that the guidelines were based on current trends in judicial sentencing was unique to Virginia. Although many states make adjustments (largely normative ones) to their sentencing guideline grids and/or worksheets to reflect the changing purposes
'ROstrom and Kauder (1 998), pp. 22-23; Westing (1982); BureauofJustice Assistance (2996). Interviews with VCSC staff indicate that some judges in nonpiiot sites requested and re-
ceived guideline manuals and worksheet copies during the pilot study period. Judges were provided manuals at the direction of the Oversight Cornmitree and the chief justice, since the system was viewed as a valuable decision aid that was only voluntary in nature. The existence and use of these manuals may have had contaminating effects on the study results, although staff conversations with several judges indicate that there was no reason to believe guidelines were being used sysremacically in nonpilot sites. 2o Judicial Sentencing Guidelines Oversight Committee (1 989).
Eelare ARar &idallnes G,,,delmes
16 Truth-in-Sentencing in Virginia
This document is a research report submitted to the U.S. Department of Justice. This reporthas not been published by the Department. Opinions or points of view expressed are thoseof the author(s) and do not necessarily reflect the official position or policies of the U.S.Department of Justice.

or goals of sentencing, no state has kept and maintained such an exhaustive andyti- cal approach to the guideline revision process as Virginia.”
The earliest years of guidelines development in Virginia (1985-1988) were sup- ported almost entirely by Bureau of Justice Assistance grants that were later replaced by state general fund monies. Late in 1990, Virginia‘s legislature passed House Joint Resolution 46 encouraging the use of sentencing guidelines statewide and appropri-
ated money for a full-time sentencing committee staff. Over the last ten years, staff size has ranged from five to ten full-time employees (in addition to occasional grant- funded or temporary staff designated for special projects). Although other states have seen staff size grow in more recent years, this level cf staff commitment was unusual during the mid- and late-1980s. States currently have, on average, five to six employ- ees assigned to staff a sentencing commission and to maintain a guidelines system, although several states also use those positions for nonguideline-related Virginia provides one instance where federal seed or start-up money was used to initiate a long-term project, later supported by state revenue based on a proven need
and commitment to the program.
1994: Introducing Tk-uth-ln-Sentencing and Parole Abolition
At the time of Governor Allen’s election in November, 1993, judges in Virginia were using judicially controlled voluntary sentencing guidelines with an average compliance rate of 76%? Though the judiciary was satisfied that the guidelines were accomplish- ing their intended purpose (to reduce unwarranted disparity) and with the design of the guidelines (voluntary and descriptive), there was rising concern about large differ- ences between judicially imposed sentences and the amount of time an offender actu- ally served in prison. Public opinion in Virginia was strongly negative toward the per- ceived leniency of the parole board’s release decisions during the early 1 9 9 0 ~ ~ ~ Fear of
crime was heightened by media coverage showing violent crime rates at record highs. As the gubernatorial race was heating up in late 1993, both candidates increasingly stressed specific crime and public safety issues in their respective platforms. Mary Sue Terry, the Democratic candidate, focused on gun control, specifically, a five-day wait- ing period for handgun purchases. The Republican candidate, George Allen, made parole abolition and TIS his primary public safety, if not his overall, campaign theme. When the campaign season began, Allen was well behind in pre-election polls, but he won the race by a wide margin. One of his first major actions after taking ofice was the signing in January, 1994, of an anticrime package and the creation of the Commission on Parole Abolition and Sentencing Reform.25
-
Part of this commitment can be attributed to sufkienr funding levels during different phases of guidelines development. This also allowed guidelines staff to conduct numerous training seminars and to provide ongoing presentations and technical assistance for judges, probation officers, and attorneys. 22 Kauder, Ostrom, Peterson, and Rottman (1997). Z3Virginia Criminal Sentencing Commission (1995). 24 Survey Research Laboratory (1993). 25 “Governor Allen Signs Sweeping Anticrime Package,” (1994).
The Path to Reform 17
This document is a research report submitted to the U.S. Department of Justice. This reporthas not been published by the Department. Opinions or points of view expressed are thoseof the author(s) and do not necessarily reflect the official position or policies of the U.S.Department of Justice.

Allen charged this commission with “developing a plan to abolish parole, establish truth-in-sentencing, and ensure that violent and repeat criminals stay in prison for much longer periods of time.”2GThe commission had 32 political appointments, and was cochaired by former U.S. Attorney General William P. Barr and Former U.S. Atrorney of the Eastern District of Virginia, Richard Cullen. The commission was staffed administratively by an additional 18 persons representing the executive branch, the attorney general’s otfice, and several private consultants. This administrative body provided general policy direction for the Criminal Justice Research Center (CJRC) within the Department of Crimina! Justice Services, the group responsible for the research and impact analyses associated with commission recommendations. The Research Center was headed by Richard E Kern, who was aIso serving simultaneously as executive director for the existing JSGC.
At about this same time, the democratically controlled general assembly created their own study group called the Sentencing and Parole Reform Commission. The legislative commission, which was also receiving analytical and staff support from the CJRC, was exploring a broad menu of potential reforms. What distinguished the two commissions earPy on was the predetermined decision by the Governor‘s com-
mission to implement TIS and abolish parole. In the summer of 1994, the Governor announced a special session of the General
Assembly to be convened in the fill for the sole purpose of considering sentencing reform legislation. As the legislative session neared, the Governor’s commission and the
legislative commission solidified their respective reform packages. The Governor‘s pack- age became known as Proposal X, while the legislative package was referred to as Pro- posal A. Policy stances formed and split along party lines, between the executive and legislative branches, and by other competing special interest groups (including prisoner advocacy groups, the NRA, victims groups, the NAACP, etc.). The political wrangling was intense as all seats of both General Assembly houses were up for election within a
year of the special sentencing and parole reform legislative session. Despite the rhetoric, the final recommendations from each commission were ofien quite similar. Both agreed to retain certain elements of Virginia’s pre-reform sentencing system, including: D A Sentencing Commission and the use of voluntary sentencing guidelines;
No appellate review of sentencing guidelines departures; m Jury sentencing.
While there was also substantial agreement about the basic structure of sentencing reform (e.g., abolishing discretionary parole release, curtailing good time, the pro- portion of imposed sentence to be served, and increasing time served for violent offenders), there were important differences in the detaikZ7The following table de- picts the main features Qf Proposals X and A and compares those features to the system that was operating in 1994. The differences and similarities of the proposals are analyzed and discussed in the next chapter.
26 Governor’s Commission on Parole Abolition and Sentencing Reform (1 934). ”“Parole Abolition Sentencing Reform Pmposali’ (1994).
1 8 Truth-in-Sentencing in Erginia
This document is a research report submitted to the U.S. Department of Justice. This reporthas not been published by the Department. Opinions or points of view expressed are thoseof the author(s) and do not necessarily reflect the official position or policies of the U.S.Department of Justice.

Proposals for Sentencing Reform, 1994
Commission Structwe
Sentencing Guidelines
Worksheets
Average Time Served -
Departures/appeals
Jury sentencing
Good Time
Parole
Parole Supervision
Prison bed space
Existing System
Seven-member-, judsesonly
Voluntary descriptive, based on historicaljudge "effective time" sentencing
.ReqUeStd
21% - 47% of sentence
No written reasonsMo appeal
Bifurcated sentencing, jury receives no sentencing guidelines
Muk@e levets/300 days per year average
Discretionary & mandatory
Au on parde supervision upon exiting prison
Forecast variable
Proposal X (Executive)
Executive Branch, membersfrwnallbranches
Voluntary, based on historical time-served, normative imeases part of original reform
Required
85%-100Y0 of sentence
Written reasonsMo appeal
Bifurcated sentencing, jury receives no sentencing guidelrnes
Flat rate upto 54 davs per year
Abolished
Mandatay supervision for 6 months to 3 years
Forecast more predictable
Sentencing Guidelines Framework for Truth-in-Sentencing The NCSC evaluation team believes that one of the best design decisions made by
policymakers in Virginia was the retention of sentencing guidelines. The benefit of the sentencing guideline approach is that it allows for a more accurate assessment of the likely impact of a change in sentencing and/or parole policy. Guidelines systems are arguably the most cost-effective means of providing rational structure, relevant data, and the ability to accurately monitor and forecast sentencing outcomes.
Eight states (Ohio, Virginia, Arizona, North Carolina, Delaware, Kansas, Minne- sota, and Mississippi) and the federal government have abolished parole and impie- mented TIS legislation that requires almost all violent and nonviolent offenders to serve 85% (75% in Delaware) of the imposed sentence. All but two states (Arizona and Mississippi) introduced TIS into a sentencing guidelines system or developed guidelines in conjunction with TIS reform. For example: rn North Carolina's sentencing reforms received considerable attention in 1994, when
parole was abolished, good time restricted, and a comprehensive community cor- rections plan developed. The North Carolina Sentencing Commission implemented grid-based presumptive sentencing guidelines, increased sentences for violent of- fenders, and developed a structured system to divert nonviolent and most drug offenders into alternative or intermediate sanction programs.
Proposal A (Legislative)
Legislative Branch, members from all branches
Voluntary, normative adjustments (increases) to be recomended by commission package and legislation
Required
lCf.)% of sentence, plus extended time for dangerous offenders
Written reasons/No appeal
Sentencing guidelines also provided to jury
NMle; epplicatiwl to extendad term W b l e
Abolished
Long-termoomnunity supervision to blow
Forecast more predictable
The Path to Refom 19
This document is a research report submitted to the U.S. Department of Justice. This reporthas not been published by the Department. Opinions or points of view expressed are thoseof the author(s) and do not necessarily reflect the official position or policies of the U.S.Department of Justice.

Oklahoma established aTruth-in-Sentencing Policy Advisory Commission in 1995 and proposed sentencing matrices (guidelines) and an 85% time-served minimum. In conjunction with TIS, Oklahoma proposed two other major reform compo- nenrs, which could free the prison space needed to accommodate the prisoners who would now serve virtually the entire imposed sentence. The Pre-Adjudication Atx provides services to substance-abusing offenders at the “front end” of the sys- tem, and the Communiry Correction Act increases and enhances a continuum of
sentencing options at the community level. The Oklahoma commission also rec- ommended abolishing jury sentencing as part of its overall TIS reform package.
B Kansas established mandatory guidelines in 1993 and abolished parole releases replacing post-supervision periods with a set 24- or 36-month supervision period. Good time can be earned by participating in programs, but cannot reduce a sen- tence by more than 15%. Good time earned is further added to any period of post- release. The Kansas grids contain border boxes that allow presumptive prison sen- tences to be replaced by explicit correctional/treatment programs only if readily available to the offender.
However, the creation of a sentencing commission and the enactment of structured
sentencing guidelines is not a requirement for TIS. For example: B Mississippi enacted legislation in 1995 that abolished hiscrerionary parole and
requires inmates to serve 85% of rheir imposed sentences without the introduc- tion of sentencing guidelines. No adjustments were made to existing sentencing ranges--judges still set a fixed term within the existing statutory ranges for par- ticular felony classes.
m In Arizona, TIS requires offenders to serve 85.7% of their imposed “presumptive” sentence. For most offenses, sentence lengths were “rolled back” to reflect the his- torical time served. However, offenders deemed to be “dangerous and repetitive” did not have their sentence ranges adjusted. These offenders will serve longer peri- ods of incarceration as a result of delayed release eligibility.28 The major problem for states without guidelines is the reduced ability to estimate
future prison bed space needs. The ability to forecast is particularly important in the context of a major reform like TIS. Many commentators argue that the 85% rule (with or without sentencing guidelines) will have greater impact on punishment and the use of prison resources than other sentencing reform measures, including man- datory minimums and three-strikes legislation, because 85% policies are usually ap- plied to all eligible offenders, regardless of prior criminal hi~tory.~’
The following timeline begins in 1385 and provides an overuiew ofthe major policy initiatives &ding up to the initiation of TIS in 1995.
”National Institute of Corrections (1995a). 29 National Council on Crime and Delinquency (1 995).
20 Truth-in-Sentencing in Etginia
This document is a research report submitted to the U.S. Department of Justice. This reporthas not been published by the Department. Opinions or points of view expressed are thoseof the author(s) and do not necessarily reflect the official position or policies of the U.S.Department of Justice.

CHAPTER THREE
The Design of TIS Guideline3 in Virginia
This chapter reviews the major policy issues and sentencing guideline design con-
siderations raised during deliberations over sentencing reform. Numerous data analyses were conducted on behalf of the Governor’s Commission as well as the legislative committees responsible for modifying statutes to codify the’ intended reforms?’ The primary targets of reform were (I) abolishing parole and (2) establishing TIS (in- cluding lengthier incarceration for violent felons). In addition, many other topics were examined including the expanded role of alternative sanctions, the relationship between age and recidivism, and mandatory minimum sentencing. The most perti-
nent studies are reviewed in the following three sections. 1)Abolition of Parole
The Structure ofparole Prior to TIS: Virginia’s system of parole came under fire in the early 1990s. A commission was appointed by the General Assembly in 1990 to “determine specific reasons for Virginia’s low parole rate,” and make suggestions for ref~rrn.~’ This move was motivated at least in part by severe overcrowding in Virginia’s prisons. Just three years later, the parole board was being closely scru- tinized on charges of undue leniency.
Optionsfor Parole and Good Time Reform: This debare focused on three basic issues: (1) Should Virginia modify or completely eliminate discretionary release?; (2) Should parole and good time reform apply to both violent and nonviolent offenders?; and (3) Should post-release supervision be maintained?
m Sentence Time Served us. Sentence Time Imposed A necessary first step was to determine the average difference between the judicially imposed sentence and the actual time served in prison for violent and nonviolent offenders.
2) Truth-in-Sentencing (Incorporating Longer Sentences for Violent Offenders)
Sbifingfom ‘Effective Time”to “Time ServeXSentencingfor Nonviolent Offend- ers: To accommodate TIS and ensure that nonviolent offenders would serve the same amount of time post-reform as pre-reform, the guideline recommendations for nonviolent offenders were modified to reflect historical time served. m Normative Sentence Enhancemenfifir Kolent Ofenhn: Violent offenders were tar-
geted to receive and serve substantially longer sentences under TIS. The definition of
-
3” The Criminal Justice Research Center performed the majority of these analyses, most of which have not been published orher than for the inrended audience. These studies were col- lected from the files held at the current VCSC and were found in their original formats as printouts, graphical presentations, and various types of information and report packets (some- times termed “fugitive” research and analysis). 31 “Report of the Joint Legislative Audit and Review Commission on Review of Virginia’s Pa- role Process to the Governor and General Assembly of Virginia” (1 992).
The Design of TIS Guidelines in Virginia 21
This document is a research report submitted to the U.S. Department of Justice. This reporthas not been published by the Department. Opinions or points of view expressed are thoseof the author(s) and do not necessarily reflect the official position or policies of the U.S.Department of Justice.

Yiginia Parole Grant Rate, 19911998
eligible for mandatory parole Si months prior to the expiration of their sentence. The
50%
45%
40%.
.............
(1) “violent offense” was expanded to include some burglary crimes and (2) “vio- lent offender” to include the entire criminal history including juvenile delinquency
adjudications. 3) Related Analyses
m The Relationship Between Offender Age and Crime: Considerable debate took place over whether the incapacitation ofyoung violent offenders during their “crime prone years” would end a Iikefy cycle of recidivism and as such should be an ex- plicit purpose of TIS reform. m Mandatory Minimum Sentences under TIS: Issues of incorporating mandatory minimum sentences within the rational framework of TIS guidelines were ex- plored. m Exp~ndAltPrnative PunisbmentlTreatment Options: Included in the comprehen- sive reform package was the legislative goal of using a risk assessment instrument to identify and divert at least 25% of incarceration-bound drug and property of- fenders into alternative sanction programs. Because of the analytical complexity and evaluation techniques applied, review of the projected and actual impact of TIS on ( I ) correctional population and prison
bed space needs (Chapter 4), judicial compliance (Chapter 5 ) , and preventable crime (Chapter 6) are discussed separately,
The Structure of Parole Prior to TIS Changing public perception about Virginia’s discretionary release policies is linked to the 1994 gubernatorial campaign where the parole system was blamed for in- creased crime and waning public confidence in the criminal justice system.32 One of George Allen’s first actions as governor was to appoint a new parole board. As can be seen in the adjacent trend chart, the impact was immediate: the parole grant rate fell sharply from about 20% in 1993 to 10% in 1994. Although parole was abofished by Virginia’s General Assembly in 1994, the parole system continues to govern release
32 Survey Research Laboratory (1 993). 33 In 1998, chree years after parole was abolished for new offenders, the parole grant rate for offenders convicted prior to 1995 again dropped OK With only a few months of data, it is difEcult to assign a reason for h e steep decline in the grant rare, except to point out that many less serious offenders from the pre-1995 period have already been paroled, leaving a higher proponion of serious offenders in the parole-eligible pool.
22 Truth-in-Smtencing in Krgniu
This document is a research report submitted to the U.S. Department of Justice. This reporthas not been published by the Department. Opinions or points of view expressed are thoseof the author(s) and do not necessarily reflect the official position or policies of the U.S.Department of Justice.
prior to the 1994 reforms continue to earn good conduct allowance according to the good time system in effect before parole reform. Each prisoner is assigned a good conduct allowance class, which determines the accrual rate for good conduct credit (i.e., Class I earns 30 days for 30 served; CIass II earns 20 for 30; Class I11 earns 10
for 30; Class IV earns 0 for 30). Full good conduct allowance is counted toward the mandatory release dare and half of the good conduct allowance is credited toward discretionary parole eligibility.
Once the Department of Corrections determines that an offender is eligible for parole, the case is reviewed by the Parole Board. The parole review process consists of an interview and recommendation by a parole examiner, after which each of the board’s five members reviews the case individually. A consensus of three members (four in first degree murder cases) is required to grant parole. If the offender is re- leased, the board sets the conditions of parole, which may include residence in a halfway house, day reporting, intensive supervision, electronic monitoring, and/or drug testing. For offenders released on mandatory parole, a minimum of six months’ post-release supervision is required.
Criticism of the inconsistencies in parole decisionmaking led the Parole Board to
introduce a system ofparole guidelines in 1992.34 These guidelines were an attempt to structure parole decisions and base them on objective factors (e.g., present offense, prior criminal record, personal and social history, community resources) as well as subjective factors (e.g,, changes in motivation and behavior, impressions gained dur- ing interview^).^^ The guidelines were intended to increase consistency and account- ability, give guidance to staff, make systematic use of experience , i ncrease openness,
handle the increasing number of decisions, and make better prediction^.^^ Virginia’s parole guidelines considered four factors: felony risk, time served, institu- tional behavior, and “auxiliary” information. To determine felony risk, the guidelines incorporate a risk assessment tool based on prior record, prison conduct, and of- fender characteristics (e.g., age, substance abuse, education). Each of these felony risk factors is scored and the sum of all factors provides an indicator of felony risk, which places the offender in one of four risk categories: low, medium low, medium high, or high. To ensure appropriate punishment, consistency, and Cairness, the guide- lines compare time served by the offender to the average for the governing offense. The wide range of “average” time served for offenses is divided into four time-served categories: low, medium low, medium high, and high. Also, the guidelines take into account any disciplinary infractions that have occurred in the last year. Finally, aux- iliary information such as special needs of the offender and input from the victim and the inmate’s family is considered. These voluntary parole guidelines continue to be used to assess parole-eligible offenders.
-
34 Joint Legislative Audit and Review Commission (1992)’ p. 88. 35 Ibid. ’‘ Center for Effective Public Policy, quoted in Virginia Parole Board presentation materials.
The Design of TIS Guidelines in Virginia 23
This document is a research report submitted to the U.S. Department of Justice. This reporthas not been published by the Department. Opinions or points of view expressed are thoseof the author(s) and do not necessarily reflect the official position or policies of the U.S.Department of Justice.

.-
Options for Parole and Good Ylme Reform Options for sentencing and parole reform were considered and introduced by both
the legislative commission and the Governor’s Commission. Each group confronted three basic issues: (1) Should Virginia modify or completely eliminate discretionary parole release?; (2) Should parole and good-time reform apply to both violent and nonviolent offenders?; and (3) Should post-release supervision be maintained?
Decision I: Shorrld Virginia mod$ or completely eIiminate dircrerionuy parole release?
Many states have enacted legislation requiring offenders to serve a fiat percentage
(usually 85%) as part of a TIS reform package. Other states require a variable per- 9 centage based on characteristics of the offense or offender, such as prior record. For ‘ example, in Arkansas, the percentage of time that offenders must serve ranges from
33% to 70% according to the seriousness of the offense and whether the offender is a habitual offender,” Another option used by some states was to modify release policy by requiring offenders to serve a clearly articulated minimum Sentence before becoming eligible for parole. New Hampshire, for example, has retained an indeter- minate sentencing structure, but requires offenders to serve 100% of the minimum sentence imposed before becoming eligible for parole.38 The legislative commission considering parole and sentencing reform met several times to consider these issues. The final recommendation was to abolish parole entirely.
The Governor‘s Commission reached the same conclusion at its first meeting in
February 1994. The Governor asked the commission to remember that “parole must be replaced by a system rhat deters crime by making punishment certain and predictable.” Thus, it was a foregone conclusion that the Governor’s Commission on Parole Abolition and Sentence Reform would recommend the elimination of discretionary release.
Reform of good-time policies presented a similar set of options. All good conduct
dlowance could be eliminated, or the current system could be modified. Virginia‘s good time credit allowance system was a complicated four-level structure, making it difficult to reliably calculate release eligibility. Moreover, the system was considered overly generous, allowing the average inmate to receive, on average, 300 days for 365 ~erved.~’Modification of the good rime system could mean simply reducing the num- ber of good time levels or restricting offenders to a flat number of days per year. Another option was to retain good time but not apply it to parole eligibility. Finally, good time allowance could be incorporated up front by the judge, thereby reducing the upper range of a sentence.
The two commissions reached different conclusions on good time reform. After
testimony and input from prison officials, “awareness of the dificuk task corrections officials face on a daily basis, coupled with the responsibility to maintain discipline
37 Kauder, Ostrom, Peterson, and Rottman, (1997). 38 National Institute of Corrections (1995b), p. 4.
Governor’s Commission on Parole Abolition and Sentencing Reform (1994), p. 41.
24 Truth-in-Sentencing in Wginia
This document is a research report submitted to the U.S. Department of Justice. This reporthas not been published by the Department. Opinions or points of view expressed are thoseof the author(s) and do not necessarily reflect the official position or policies of the U.S.Department of Justice.

--
and order'' led the Governor's commission to recommend replacement of the good conduct allowance system with a flat rate of54 days a year that must be earned by the offender.'"' The legislative commission chose to eliminate good time altogether, stat- ing that "the beneficial effect of good time credits on correctional management ap- pears to be arg~able."~'
Decision 2: Should Paroh and Good Time R@mt Apply to both Violent and Nonvioht oflmders?
According to a 1995 survey by the National Institute of Corrections, 16 states have eliminated discretionary parole release for all ~ E e n d e r s . ~ ~ However, several states have opted to eliminate discretionary P l e only for targeted offender^.^^ In Vir- ginia, both commissions recommended that parole and good time reform policies should apply to all offenders. The governor's commission considered retaining the current parole system for nonviolent offenders, but ultimately rejected it for three reasons. First, the commission considered TIS an important reform in and of itself, and as such, equally useful to judges and juries whether incarcerating violent or non- violent offenders. Second, because most nonviolent offenders sentenced to prison in Virginia face incarceration after several previous convictions, the commission felt that they should be required to serve the full sentence imposed. Third, the commis- sion questioned the efficacy of a system that combined real-timc sentences and pa- role-eligible sentences for different offenders. Such a new two-tiered system-much like the existing system it was replacing-would be both difficult to administer and confusing to che public. Decision 3: Should post-release supervision be maintained?
In recommending the elimination of parole, Virginia joined a number of states that have eliminated or limited parole release. Of the states that have abolished pa- role, only Maine has eliminated post-release supervision entirely.44 Most states recog- nize the role a period of supervised release serves in helping the offender reintegrate into the community successfully. For example, Minnesota incorporates a supervised release period into the guidelines sentence where two-thirds of the sentence must be served in prison and one-third is served on supervised relea~e."~ North Carolina re- quires all violent offenders to serve a nine-month period of post-release supervision, with a five-year period required for sex offendersd6
___-
4" Ibid.
42 Arkansas, Arizona, Delaware, Florida, Illinois, Indiana, Kansas, Maine, Minnesota, Missis- sippi, New Mexico, North Carolina, Ohio, Oregon, Virginia, and Washington (National In- stitute of Corrections, Status of Parole, 1995a, p. 6). I' South Carolina has abolished parole eligibility for violent offenders. In Georgia, a consritu- tional amendment eliminates parole eligibility for offenders convicted of certain violent crimes. New York has eliminated parole for second-time felons convicted of a violent felony (as de- fined by the legislature). " Bureau ofJustice Assistance (199G). 'I Kauder, Ostrom, Peterson, and Rottman (1997), p. 19. 46 Ibid., p. 23.
Commission on Sentencing and Parole Reform f 1999, p. 9.
The Design of TIS GuiaWms in Virginia 25
This document is a research report submitted to the U.S. Department of Justice. This reporthas not been published by the Department. Opinions or points of view expressed are thoseof the author(s) and do not necessarily reflect the official position or policies of the U.S.Department of Justice.

--
In Virginia, both commissions recommended that some type of post-release su- pervision be retained. The Governor’s Commission called for a mandatory period of supervision for six months to three years following release, the exact length of which would be determined by the sentencing judge. The legislative commission’s plan suggested that offenders receive an extended maximum term beyond the minimum term imposed by the sentencing judge. Once the offender has served the mandatory term, “clearly prescribed release criteria or other risk assessment tools” wouid be used to evaluate the offender’s fitness to return to society. The legislative commission sug- gested that a judicial entity (i.e., a public safety commission) determine whether the offender must serve the extended term.47 In addition to this extended term, the legislative commission recommended a period of post-release supervision for all re-
leased inmates. In addition, the Governor’s Commission recommended that transitional policies
be developed for inmates as they approach their release dates. These programs would provide for a “gradual step-down‘’ within the correctional facilities, including work centers or drug treatment facilities. This recommendation was similar to legislation in effect in other stares that provides transitional periods for inmates prior to release. For example, in Ohio, offenders can be transferred from incarceration to community sanctions. Ohio felons serving ten years or less are eligible for judicial release and, if release is granted, the court can place the offender in any community-control sanc- tion for up to five years. The percentage of time served before becoming eligible for
judicial release is determined on a sliding scale according to the original sentence lengd~.~’In Delaware, judges may sentence offenders to more than one level of pun- ishment, allowing offenders to “flow down” from more to less severe sanctions.4’
lSS4 Special Sesslon legisiafion The finalTIS legislation incorporated thc recommendations of the Governor‘s Com-
mission regarding three major issues: parole, good time, and release supervision. Parole was abolished and replaced with a period of post-release supervision similar to super- vised probation. Good time accrual was bounded by a maximum of 4.5 sentence cred- its (54 days per year) to be earned through program participation and adherence to applicable rules and requirements. TIS legislation allows judges to impose a suspended term of six months to three years for each felony count in addition to the term of incarceration. This additional suspended term is imposed in conjunction with a six- month ro three-year period of post-release supervision (the length of the additional term and the post-release supervision need not be the same). The additional term is imposed if the offender does not adhere to the conditions of post-release supervision (essentially the same as traditional pr~bation).~” Judges can continue to suspend a por- tion of the imposed sentence and place the offender on probation after incarceration.
47 Commission on Sentencing and Parole Reform (1995), p. 10. 48 Kauder, Ostrom, Peterson, and Rortman (1997), p. 25. 49 Ibid., p. 6. 50 Virginia Criminal Sentencing Commission (1 995a).
26 Tmth-in-Sentencing in Et-ginia
This document is a research report submitted to the U.S. Department of Justice. This reporthas not been published by the Department. Opinions or points of view expressed are thoseof the author(s) and do not necessarily reflect the official position or policies of the U.S.Department of Justice.

As a result of the TIS reforms, the caseload of the parole board has declined steadily since 1996. The parole board decisions are now limited to those offenders whose crimes were committed prior to January 1, 1995, and certain conditional release decisions. Geriatric prisoners sentenced after January 1, 1995, can be considered for
conditional release by the parole board after serving a minimum of five years (offend- ers over 65) or ten years (offenders over 60) of the sentence imp~sed .~’ As in other states that have abolished discretionary parole, the parole board no longer retains any role in supervising offenders after release, either on post-release supervision or pa- role. In mid-1996, the parole board support staff was reorganized under the Com- munity Corrections division of the Department of Corrections, which supervises all offenders released from Virginia prisons.
--
Truth-in-Sentencing (Incorporating Longer Sentences for Violent Offenders)
All structured sentencing systems provide judges with guidance concerning the appropriate sanctioning ranges for a particular set of case circumstances. Some sys- tems provide only minimal guidance whereas others set rigid criteria for determining a sentence. Since 1986, Virginia has used a very detailed set of factors (which are
different for each major offense group) to score a sentencing guidelines case. When determining sentence length, the score serves as the midpoint for a sentencing range that sets parameters for judicial compliance. Outlining how the ranges evolved from the previous guidelines system is important for understanding the current TIS guide- lines system.52
Prison Tsme Served vs. Sentence Imposed
The basic tenet ofTIS legislation is to more closely align imposed sentences with time served. Felony offenders in Virginia are now required to serve at least 85% of their prison sentence behind bars. Prior to the 1994 sentencing reforms, many ar- gued that the combination of parole eligibility and good time credits meant that time served was typically much less than the judicially imposed sentence. However, the exact amount of time served by offense and offender type was not generally known. One reason for this lack of information was that an acceptable time served percentage had not been established in Virginia. The main reason, though, was the inherent complexity of the calculation to determine eligibility for discretionary re- lease. As discussed earlier in this chapter, multiple good-time accrual rates, parole guidelines and risk assessment, and subjective impressions of rehabilitation made it dificult to determine consistently, and with confidence, the amount of time offend-
s’ “Sentencing and Parole Reform”, p. 33. ’’ Individuals interested in the precise structure and content of the guideline scoring system and the ranges of senrence recommendations should see the Virginia Sentencing Guidelines Manual ( 1 998). The Virginia sentencing guidelines incorporate individual case circumstances that vary widely in terms of the nature of the offense, victim injury, extent and seriousness of prior record, and prior terms of incarceration or legal restraint. All of these factors are used on the guideline worksheets when determining a sentence recommendarion.
The Design of TIS Guidelines in Krginia 27
This document is a research report submitted to the U.S. Department of Justice. This reporthas not been published by the Department. Opinions or points of view expressed are thoseof the author(s) and do not necessarily reflect the official position or policies of the U.S.Department of Justice.

ers would serve in prison. It was simply very difficult, if not impossible, to articulate the entire release eligibility process. Both democrats and republicans acknowledged the inadequacy of a system in which actual time served could not be more easily determined or predicted.
Despite the inherent difficulties, a necessary first step was to determine rhe actual relationship between judge-imposed sentences and time served. A database was thus created from the Offender Based Stare Correctional Information System (OBSCIS) maintained by the Department of Corrections. Controlling for offense and prior prison commitments, the average sentence and time served for offenders released fiomprison between 1988 and 1992 was The table below estimates the average percent of sentence served under TIS (1 995- 1997) compared to the actual time served for selected offense groups prior to TIS (1 988- 1992).% During the years prior to TIS, offenders in Virginia prisons typically served between 20% and 48% of their imposed sentencedl
1988-1992
Average Percentof mpased Average Sentence Sentence TmeServed SBrVed
Estimated lime Served (in years) in Prison by Virginia Felons, Before and After TIS
1995-1997 Estinated
Average Average Percentof Imposed Estimated Sentence Sentence Timeserved Served
Violent Offenses I ~s,ciegree murder
2M degree murder 16.7 5.7 34.1 [ 21 19.0 90.3
Robbery 13.8 . 4.4 31.9 I 9.8 8.9 90.8
Voluntary manslaughter 6.6 2.2 33.3 1 6.1 5.5 89.4
Aggravate
PropertyIDrug Offenses I
Involuntary manslaughter 6.2 1.9 30.6 1 4.1 3.7 89.4
edule 1/11 tini -2.6 2.3 $93
Possession schedule VI1 drugs 5.4 1.4 25.9 I 1.6 1.4 88.9
Larceny 1 1.6 1.4 9.4
Sale marijuana 4.4 0.9 20.5 I 1.8 1.6 88.3
Fraud 6
s3 The number of prior prison commitments is the only recidivism measure that statutorily affects parole eligibility. OBSCIS contains a variable called “felon term indicator” or “FTL” The FTI number equates to the number of times a person has received a prison commitment. ’’ Although offenders in Virginia prisons were serving significantly less than their imposed sentence, the proportions were not f i r from the national average: felons sentenced in 1994 served between 32% and 55% of their sentences. See U.S. Department of Justice (1994). 5s Joint Subcommittees on Public Safety of the House Appropriations and Senate Finance Committees (1 994).
28 Truth-in-Sentencing in Erginiiz
This document is a research report submitted to the U.S. Department of Justice. This reporthas not been published by the Department. Opinions or points of view expressed are thoseof the author(s) and do not necessarily reflect the official position or policies of the U.S.Department of Justice.

The results of this analysis were fundamental to the Governor’s Commission’s efforts to garner support for TIS.
Among all f e l o s rebared @om state prisons, those who had been convicted offirst degree murder served an average of only 29% of their terms.. . those convicted of Pd degree murder actually served slightly m o ~ , averaging 34% of their terms.. . . Of all ofense categories, no group served, on average, as much as half of the sentence the circuit court judge thought he or she was imposing.. . .56
The commission interpreted these findings as evidence of “across-the-board leniency:” What is apparent is the absence of truth-in-sentencing in Virginia at any h e l . Early release is not confined toparticular types of crime for which one may suppose of iders to be more amenable to treatment or less prone to recidivate. Ifanything, the across-the- board bniency indicates a pervasive philusophy favoring rehabilitation of criminalr rather than incapacitation.. .57
The right half of the table shows the expected average time served and the ex- pected proportion of prison sentence served for felons sentenced between 1995 and 1997, the first three years ofTIS. It is estimated that compliance with the “85% rule” now in place in Virginia will translate into offenders serving between 88% and 92% of their imposed sentence^.^' The actual length of imposed prison sentence reflects two crucial TIS guideline design considerations. First, the guideline ranges for non- violent crimes were reduced from “effective time” to historical “time served.” Sec-
ond, the guideline ranges for violent offenses were targeted for significant normative increases from past “effective time.”
Shiiting From llEffecfive TimeN to “7lrne Served” Sentencing tor Nonviolent Offenders
As discussed in Chapter 2, specific sentence recommendations on the pre-TIS guideline worksheets were chosen based on careful analysis of past sentencing prac- tices. The sentence ranges captured the middle 50% of past-time-served amounts for groups ofsimilarly situated offenders. The highest 25% and lowest 25% ofsentences being deemed “inconsistent” (and possibly disparate) were excluded. Hence, the sen- tencing worksheet recommendations reflected historical “effective sentences” (Le., the typical judicially imposed sentence for different groups of similarly situated of- fenders). Most importantly, these effective sentences under the pre-TIS guidelines would be reduced by parole and good time policies.
In conjunction with parole abolition, the Governor’s Commission decided to trans- form the sentencing recommendations of the guidelines from historical “effective sentencing” to historical “time-served” sentencing (Worksheet C).59 No change was
IG Governor‘s Commission on Parole Abolition and Sentencing Reform (1 994), pp. 21-22. 57 Ibid., p. 22.
Actual time served figures reflect variation in average good time accrual ram by offense. s9 The design and purpose of each worksheet is discussed in more detail in Chapter 2. See the Virginia Sentencing Guidelines Manual (1998) for the most current version of the worksheets used to determine the sentencing recommendation for all crimes covered by the guidelines.
The Des& of TIS Guidelines in Virginia 29
This document is a research report submitted to the U.S. Department of Justice. This reporthas not been published by the Department. Opinions or points of view expressed are thoseof the author(s) and do not necessarily reflect the official position or policies of the U.S.Department of Justice.

made to the guidelines with<respect to the determination of the historical prisonho prison decision (Worksheets B and C): the rate at which offenders received a prison versus a nonprison sentence would remain consistent with past practice.@ In addition, the number of guideline worksheet offense groups was expanded from 8 to 12.'j1
The move from effective sentences (pre-TIS) to time-served sentences (post-TIS) did not greatly change the amount of time nonviolent offenders would actually serve
in prison. The difference rested on the proportion of the imposed sentence that would actually be served in prison (is., 85% under TIS). Public acceptance of the Governor's plan hinged on clarifying why recommended sentences for nonviolent offenders under TIS would sometimes appear substantially lower than in the past: under the previous system, prison sentences were often reduced dramatically by pa- role and good conduct allowance credits, while under the new system, the judge's imposed sentence will be served in full (with the offender eligible for only 54 days or
1.5% good time credit). Therefore, judicial-imposed sentences for nonviolent of- fenders tend to be lower under TIS, bur the amount of time actually served in prison remains about the same.
The following table compares the guideline sentence ranges recommended under
the previous parole system to those recommended under rhe TIS time-served guide- lines for two typical nonviolent sentencing scenarios. Guideline sentence recommen- dations are calculated with great specificity depending on a variety of offense and of- fender factors. The TIS sentencing guidelines recommend a midpoint sentence (in months) with an accompanying range that encompasses 50% of past-time-served amounts for a group of inmates that were situated similarly in terms of offense and offender characteristics. This normative decision mirrors practice under the previous guideline system where the guideline ranges covered 509/0 of past effective sencences.
Sentencing Recomrnendations-Comparing TIS to Previous Guidelines
"Efkctive" Sentence "he Served"Sentence Rscwnmended Under TIS Offense or Recmmended UndernS
Offense Scenario Prim Guidelines @ewe 1rVa5)~ Offender Enhancement Guidelines (after i/ss)
Sell Schedule I or II Drug: 4 yr, 11 m. No enhancement 1 y. 1 count, no addiwlal offenses, no prior record
Grand Larceny from Person:. 5 yr: No enhancement 1 yr. 8 m. 2 counts, prior record fw grand hrceny, on probation at time of offense
(3 yr. - 7 yr. 2 mo.) (7 mo. - 1 yr. 4 mo.)
(2 yr. 9 mo. - 7 yr, 3 mo.) (11 mo.- 2 yr. 6 mo.)
@ During a September 1998, interview, former Governor George Allen, Sentencing and Pa- role Abolition Chairman Richard Cullen, and Former Allen Chief Legal Counsel Frank B. Atkinson stressed that having a system of sentencing guidelines in place meant ithat policymakers and researchers would not have to start from scratch when devising the sentencing ranges under TIS. In addition, circuit court (felony) judges were accepting of the use and purpose of sentencing guidelines.
The 12 guideline offenses include murder/homicide, sexual assault, rape, robbery, assault, larceny, burglary dwelling, burglary structure, kidnapping, drugs, fraud, and miscellaneous. 62 Judicial Sentencing Guidelines Committee (1 994).
30 Truth-in-Sentencing in Virpnia
This document is a research report submitted to the U.S. Department of Justice. This reporthas not been published by the Department. Opinions or points of view expressed are thoseof the author(s) and do not necessarily reflect the official position or policies of the U.S.Department of Justice.

Similarly, in the case of violent offenses, some recommended sentences may ap- pear lower under the new system, but, if followed, the resulting length of stay in prison will be significantly longer under the new system (as the previous table shows, for example, in the cases of robbery and malicious wounding).
Violent Offenders: Normative Sentence Enhancements
During the September, 1994, Special Session, the General Assembly acted to enhance sentence recommendations for certain categories of crimes beyond the level of historical time served. These “normative” adjustments were made for violent crimes or in cases
involving a prior violent adjudication or conviction. The process began with VCSC staff determining sentences imposed and actual time-served ainounts for violent offenders who entered or left the system between 1988 and 1992. Historical time-served amounts formed the basis for normative sentencing adjustments. However, prior to enhancement, these hiscorical sentences were increased by 13.4% to incorporate the projected award of sentence credits that might be earned under the new system.
I
For the crimes of first degree murder, second degree murder, rape in violation of code 18.2-61, forcible sodomy, object sexual penetration and aggravated sexual bat- tery, the recommended prison sentence was enhanced by: m 125% for offenders without prior convictions for violent crimes;
300% for those with a criminal record that has at least one violent prior felony conviction or juvenile adjudication with a statutory maximum penalty of less than 40 years, hereafter referred to as a Category I1 criminal record; and
rn 500% for those with a criminal record that has at least one violent prior felony conviction or juvenile adjudication with a statutory maximum penalty of40 years or more, hereafter referred to as a Category I criminal record. For the crimes of voluntary manslaughter, robbery, aggravated malicious wound-
ing, malicious wounding, any burglary of a dwelling house or statutory burglary of a dwelling house or any burglary committed while armed wirh a deadlyweapon or any statutory burglary committed while armed with a deadly weapon, the recommended prison sentence was enhanced by: rn 100% for offenders with no prior violent convictions;
300% for Category I1 records; and 500% for Category I records. For the crimes of manufacturing, selling, giving or distributing, or possessing with the
intent to do any ofthe former, of a Schedule I or I1 controlled substance, the recommended prison sentence was not enhanced for those without a prior violent crime, but was increased by 200% for Caregory I1 and 400% for Category I records. For any guidelines o&nse not listed above, the recommended prison sentence was not enhanced for those without a prior violent crime, but enhanced 100% for Category I1 and 300% for Category I rec~rds.“~
Although the percentage enhancemenrs mentioned here are based on normative policy de- cisions, there was also empirical support for increasing time served for certain groups of vio- lent and repeat violent offenders. This research is discussed in Chapter 3.
The Design of TIS Guidelines in Virginia 3 1
This document is a research report submitted to the U.S. Department of Justice. This reporthas not been published by the Department. Opinions or points of view expressed are thoseof the author(s) and do not necessarily reflect the official position or policies of the U.S.Department of Justice.

T i Sewed m Virginia Prisons and the Effect of TIS Enhancements
Rrst Degree Murder
7he Impact of Enhancements on Quidellne Reoommendations and Actual 79me Senred
Legislation that codified the enhancements to historical time-served amounts speci- fied which offenses (both current and prior record) were to trigger increases. How- ever, individual case circumstances vary widely in terms of the nature of the offense,
victim injury, extent and seriousness of prior record, and prior terms of incarceration
or legal restraint. All of these factors are used on the guideline worksheets when
determining asentence recommendation. The table below illustrates the recommended a
Basic Case
Category II Prior Record 49.6
.4
Category I Prior Record Me guideline ranges for two violent sentencing scenarios.
bb
Sentencing Recommendations - Compahng TIS to Previous Guidelines .-
Second Degree Murder
Rape
Basic Case
category II Prior Record
Category I Prior Record 44 a
.3
Forcible Sodomy
36
Robbery wilh Firearm
Basic Case Es.4 :i::472
Category I1 138 Prior Record i. -~
- . . S i & 1 0 8
1988-1992 lime Served I Pmpcteci under ns Expected Actual UndwTlS
‘Eflectiw?” sentence 71me S e w ’ Sentence Recommended Under TIS Offense or
Offense Scenario RiorGuidelines Lbecaa wesp Offender Enhancement Eluldellnes (after m 5 ) RemmmendedUlderTlS
Robbery of residence: 11 y. 8 mo. Vident offense 5yr.5mo. Firearm use, no bljury, no prior record
Rape: 30 yr. 6 mo. violent offense 27 yr. Rem use, prior record, Mcerlt r i l t i e s and prior record
(5 yr 3 mo. - 15 yr. 10 rno.) erhancement (3 yr. 5 mo. - 6 yr. 7 mo.)
( 1 5 ~ ~ ~ 1 ma.- 3 2 ~ . 5m0.) enhancwnent
enhancement
(14 yr. - 41 yr.)
While it is dilticult to summarize how the normative enhancements afFect each individual case, it is possible to examine past historical time-served amounts before TIS with projectedand expectedactualtime-served amounts following TIS. The pro- jected time-served amounts reflect the estimates used by policymakers during the 1994 reform process of what average judicially imposed sentences would be under
TIS. Expected actual time-served amounts are based on sentences actually imposed by judges between 1995 and 1997. These figures are illustrated in the adjacent bars for both a basic case and for cases involving Category I or I1 prior records.G5
As the bars show, both the projected and expected actual time-served amounts under TIS are greater than past practice (1988-1 992). However, the original projec- tions of time served under TIS that informed the 1994 Special Session do not fully track with expected actual time served based on sentencing practice during the first three years ofTIS (1995-1 9971.‘‘ Offenders convicted of first degree murder, second degree murder, and robbery with a firearm are all expected to serve more time than was originally projected by the governor‘s commission. On the other hand, offenders convicted of rape are expected to serve slightly less time while an offender with a
forcible sodomy conviction is expected to serve the projected time. The results also
vary by Category I or I1 prior record enhancements, with some offense groups ex- pected to serve less time than anticipated (Category I1 prior record for first degree
64 Judicial Sentencing Guidelines Commirtee (1 994). 65 A basic case is a case with no aggravating circumstances - no multiple counts, no additional offenses, no weapon use, and no prior record. Category I and I1 case definitions are explained earlier in this section. a The divergence b e m a projections and expected a d time served amounts are due primarily to differences in the rate at which judges were expected to comply with guideline recommendations and the rate at which they actually comply. See Chapter 5 for an analysis of judicial compliance.
32 Tnrtb-in-Sentencing in f i r - n i a
This document is a research report submitted to the U.S. Department of Justice. This reporthas not been published by the Department. Opinions or points of view expressed are thoseof the author(s) and do not necessarily reflect the official position or policies of the U.S.Department of Justice.

murder and Category I for Robbery with a Firearm) and some serving more than projected (Category I1 for Second Degree Murder). Rape offenders are expected to serve slightly less time for a basic and Category I case and about GO% less for a
Category I1 case as compared to the projected time served. Despite these differences, rapists are still expected to serve more than double the time under TIS as compared to the old system.G7
Rela ted Analyses The Relatlonahp Between Offender Age and Reoidivlsm
A major concern of the Governor‘s Commission on Parole Abolition and Sentence Reform was the increase of young violent offenders. According to studies provided by the Department of Criminal Justice Services, most <‘criminal careers” begin around age 14 and peak by age 21, with “retirement” by the late 20s or early 30s. The most prevalent age of arrest for violent crime (e+, murder/manslaughter, robbery) was 18. This was particularly trohbling to the commission given that recent increases in violent crime were occurring at a time when the most crime-prone age group (14 to
21) was at a ten-year low. Staff also conducted analyses to show the connection be- tween age and time served and the likelihood of being recommitted to prison. As shown on the right, young offenders convicted of violent crime who spend less than three years in prison are more likely to be recommitted to prison as compared to older offenders or young offenders who spend more than three years incarcerated.
The VCSC discussed specific straregies to target and “incapacitate” young violent offenders through their most crime-prone years. Although the commission elected not to use offender age as an explicit scoring factor within the guidelines structure, they felt that much the same effect could be achieved by adding the number of prior juvenile adjudications into the calcularion of prior record. Hence, sentence enhance- ments tied to prior record would apply more quickly to younger offenders with any history of serious criminal activity. Prior to TIS reform, an offender’s juvenile record was not scored on a guidelines worksheet.
--
Mandatory Minimum Sentences Under TIS
Mandatory minimum sentencing laws have existed in Virginia for almost 30 years and are currently in effect for 45 discrete felony offenses. TheTIS sentencing guide- lines make recommendations for almost 95% of Virginia’s felony offenders, includ-
Percent of offenders Recommitted to Prison by Age and Length ofOriima1 Prison Stay
Age admitted to prison
18-19 32.1%
20-21 -%24.*%
22-24 -g;% 25-29 -2,;’ 30-34
Length of original prison stay
35-39 LW than 3 p r s
mM~ethan3years
40t u::\ t 1
0% 10% 20% 3096 40%
% ot oflenders recommitted to prison
G7 The reasons for these time-served variations may well be a function of data limitations and noncomparable sample sizes for the different subgroups of offenders. For example, projected time-served amounts were estimated on larger, more general, groups of offenders. The current time-served figures are calculated on individualized offender groups that have actually been sentenced under the new TIS system. Combining the more serious offender groups with spe- cific offense and offender factors reduces the size of the samples that can be analyzed in a comparable way. Judicial compliance with the guidelines may also impact time-served figures. This can be seen with the rape category, where compliance is lower than all other offense groups (most departures in rape cases ate mitigated sentences). This compliance issue has been addressed in an ongoing fashion by the VCSC, with revised worksheets attempting to better model the specific circumstances (e.g., victim age, relationship, etc) in rape cases.
The Design of TIS Guidelines in Krginiu 33
This document is a research report submitted to the U.S. Department of Justice. This reporthas not been published by the Department. Opinions or points of view expressed are thoseof the author(s) and do not necessarily reflect the official position or policies of the U.S.Department of Justice.

--
ing offenses for which mandatory minimum terms apply.@' In these cases, the man- datory minimum pendty supersedes the guideline recommendation.69 An offender convicted of a crime that carries a mandatory minimum penalty. must receive at least the specified minimum sentence, which cannot be suspended in whole or in part. However, prosecutors often avoid charging offenders with offenses that carry man-
datory minimums. An offender who has cooperated in the prosecution of other cases may not be charged with the mandatory minimum offense or a lengthy mandatory minimum may be used as a bargaining chip in plea negotiations. For example, sex offenses are among the hardest of cases to successfully prosecute, and certain conces- sions are sometimes made to ensure a felony conviction with accompanying prison time. The VCSC estimates that applicable mandatory minimums are charged in only about 50% of sex offense cases.70
In 1996, the General Assembly requested that the VCSC study the effects of man- datory minimum felony sentences on the use of prison beds and to identify devia- tions from the guidelines necessitated by the existence of mandatory minimum laws. The commission developed a computer program to estimate the sentence expected under the new TIS guidelines for all offenders affected by provisions of mandatory minimums. Six categories of mandatory minimum offenses were analyzed by the commission: injury to law enforcement officer, sale of drugs to minors, firearm use in felonies, sexual assault (subsequent conviction), violent sexual assault (subsequent conviction), and habitual traffic offender. The six categories of offenses cover 99% of the total number of convictions which carry a mandatory minimum. The VCSC determined that in most cases, the guidelines sentence must be adjusted upward to
satisfy mandatory minimum requirements.
Mandatory Minimum Penalties impact Analysis Results, 1995
Offense
Average QuWlines Sentence Increase Under Mandatory Estimated percentage of Minimum (months) new prbn sdmisstons
Injury to Law Enforcement Officer 1.9 Saie of Drugs to Minor Three Years Junior 27.8 Use of Firearm in the Commission of Certain Felonies 3.1 Sexual Assault, Subsequent Conviction 19.7 Subsequent Violent Felony Sexual Assault 0 Habitual Traffic Offender 3.9
.2%
.1 5.1 .3 .2 3.9
With respect to required prison space, the VCSC determined that the impact of mandatory minimums needed to be evaluated in terms of the application of the law as well as the severity of the penalty. For example, while the presumptive sentence increase (relative to the guideline recommendation) is much greater for sexual assault than habitual traffic, the VCSC study determined that the widely used habitual
Virginia Criminal Sentencing Commission (1996), p. 46. h9 Oklahoma and Utah have repealed mandatory minimum penalties as part of sentencing reform. See Ostrom, Kauder, Rottman, and Peterson (1998).
Virginia Criminal Sentencing Commission (1996), p. 54.
34 Tmth-in-Sentencing in Virginia
This document is a research report submitted to the U.S. Department of Justice. This reporthas not been published by the Department. Opinions or points of view expressed are thoseof the author(s) and do not necessarily reflect the official position or policies of the U.S.Department of Justice.

traffic offender mandatory minimum had far greater impact on prison use than sexual assault mandatory penalties. The total number of mandatory minimum convictions for 1995 is shown below.
Of 21,756 Felony Convictions-l,605 Carried a Mandatory Minimum Penalty
Offense
Third Convktion for a Violent Felony Violent Sexual Assault, subsequent coMljction D n g Kingpins Sexual Assault, subsequent conviction Fkearm Use During Felony Drug Crimes wfiirearm Assault Law Enforcement Officer Homicide (vehicular) Traffic (habitual offender) All other Offense
-
Mandatofy M i P E n r d t y
Life 10 years to life 20 years 5 to 20 years 3 to 5 years 2 to 5 years 6 mos. to 2 years 1 Year 1 year
Nunber of 1995 Convictions
0 0 5 0
61 3 22 56 9
886 14
Most of Virginia’s mandatory minimums were enacted when parole was in effect. When the General Assembly abolished parole and the earlier system of good time, felons who formerly served between 20 and 50% of their sentences will now serve at least 85% of their imposed prison term. The General Assembly has chosen not to
amend the general criminal statutes that delineate mandatory minimum penalties. As a result, the actual penalty, as measured by time served, for felonies with manda- tory minimum provisions occurring after January 1,1995, has increased significantly.
Use of Alternative PunishmenW7Peatment Optton8
One of the legislative requirements included in the comprehensive reform package of 1994 was the goal of diverting 25% of prison-bound offenders to alternative sanc- tions. At the time sentencing reforms were being debated, policymakers were con- cerned about the rising prison population and that a significant share of the state budget was being spent on corrections. In Virginia, as elsewhere, there was a great deal of interest in identifying effective ways to punish nonviolent felons in a more cost-efficient fashion. Alternative sanctions or so-called intermediate punishments have been developed to address this need. However, many have raised the concern that alternative punishments may be applied to the unintended offender popula- tion-those who otherwise would receive probation (i.e., net widening). Also, there
is the issue of whether the use of intermediate sanctions, in lieu of traditional incar- ceration, is effective in protecting public safety, Given these issues and concerns law- makers drafted language (Cod ofVirginia 417-235) that charges the VCSC to ac- complish the following:
Prepare guidelines for sentencing courts to use in determining appropriate candi-
Develop an offender risk assessment instrument for use in all felony cases, based on a study ofVirginia felons, that will be predictive of the relative risk that a felon will become a threat to public safety;
dates for alternative sanctions;
The Design of TIS Guidelines in ErgiEia 35
This document is a research report submitted to the U.S. Department of Justice. This reporthas not been published by the Department. Opinions or points of view expressed are thoseof the author(s) and do not necessarily reflect the official position or policies of the U.S.Department of Justice.
‘i
Apply the risk assessment instrument to nonviolent felony offenders and, with due regard for public safety needs, examine the feasibility of achieving the god of placing 25% of such offenders into alternative sanction programs. The VCSC has interpreted its directive from the legislature as the diversion of
25% of nonviolent offenders into other means of punishment than incarceration. Decisions about diversion are to be guided by the score obtained from a risk assess- ment instrument, prepared at the time of the pre-sentence investigation report for use by the sentencing judge.
The VCSC has developed and is currently pilot testing a risk assessment tool to be used by judges at the time of sentencing to identify the best candidates for diversion based on past recidivism. The use of the risk assessment instrument is expected to
remain voluntary. Over the next 18 months, the NCSC and VCSC will expand their partnership to indude a comprehensive evaluation of risk assessment and diversionary policies that are now being implemented. The evaluation will have three goals: 1) to evaluate the methods used to develop the risk assessment instrument; 2) ro evaluate the use, workload implications, and effectiveness of the instrument: and 3) to establish a methodology and baseline database to conduct a complete impact evaluation.
The intended goals of risk assessment can only be accomplished if adequate resources and programs exist for offender diversion. Virginia currently uses boot camp, deten- tion center, intensive supervision, day reporting, and electronic monitoring as alterna- tive sanction options. On July 1, 1998, roughly 500 persons were in the detention, diversion, and boot camp programs, up from 300 persons the same month in 1997. In 1998, however, there were more than 700 offenders on facility waiting lists.
36 Truth-in-Sentencing in Wrginiu
This document is a research report submitted to the U.S. Department of Justice. This reporthas not been published by the Department. Opinions or points of view expressed are thoseof the author(s) and do not necessarily reflect the official position or policies of the U.S.Department of Justice.
CHAPTER FOUR
The Impact of TIS on Population in Virginia
The impact of TIS legislation on Virginia‘s correctional resources was a source of early concern to lawmakers. During the 1994 Special Session, the Virginia General Assembly passed legislation requirii the VCSC to estimate the impact of all proposed sentencing legislation on correctional resource needs?’ The comprehensive sentencing reform package included the following features with the v e s t potential to affect correctional populations:
All felony offenders must serve at least 85% of their prison sentence; a Violent offenders will serve substantially longer prison sentences (two to six times
--
longer in many cases); Juvenile adjudications of delinquency for felony-level crimes are now scored as part of an offender’s prior criminal record; Local jails will now house offenders receiving sentences of six months or less rather than 24 months or less;
The VCSC was charged by statute” to develop for judges’ use a risk assessment instru- ment that would be predictive ofthe relative risk that an offender poses to public safety. The goal was to use this instrument to identify and divert to community corrections up to 25% of nonviolent felons who would otherwise be incarcerared. This chapter describes the specific techniques used by the VCSC to estimate the impact
of TIS on hture correctional populations in Virginia and compares the forecasted impact to actual impa~c.7~ It is worth noting that the Virginia General Assembly went on to adopt a very sensible constraint when TIS was implemented in 1995: All proposed sentencing legislation in Virginia must be accompanied by a “Commission Prison Impact Statement.” A bill will die in the legislature unless the necessary hnds are ap~ropriated.7~
71 §30-19.1:5 ofthe Codeof Virginia. 72 417-235, paragraphs 4, 5 , and 6 ofthe Codeof Virginia. 73 Following the 1994 reforms, Virginia joined the ranks of other states (e.g., Kansas, Minnesota, North Carolina, Oregon, and Washingron) where enabling legislation required explicit consider- ation by the sentencing commission of the impact of sentencing guidelines on correctional re- sources, Tonry (1 997). When reviewing state sentencing commission performance through the early nineties, Tonry (1991, 1993) maintained that a necessary condition for success was the legislative requirement that “sentencing policy be meaninghlly related to correctional resources.” Tonry asserted that the ability of Minnesota, Oregon, and Washington to hold their prison populations within capacity for extended periods after guidelines implementation was attribuc- able to their “resource constraint” policies, Tonry (1 997). Success, though, has not necessarily been long-lived. Prison populations in Minnesota and Washington rose rapidly following 1993- legislated increases in penalties provoked by sensational crimes in each state. 74 Similarly, the sentencing commission in North Carolina has made skillhl use of “impact statements” on a number of occasions to dissuade legislators from enacting punitive legislation that would have taxed correctional resources well beyond their current capacities. North Caro- lina has successfully managed to constrain the growth of its state prison system by expanding the use of intermediate sanctions and community corrections for less serious offenders and still increasing sentences for the most serious offenders, Wright (1 998). Effective management was possible in North Carolina because t h e sentencing structure is effectively predicting the cor- rectional resources that the State will need and is directing serious felons and misdemeanants to longer prison terms while sending less serious felons to non-prison punishments” (p. 13).
Prison
The Impact of TIS on Prison Population in Virginia 37
This document is a research report submitted to the U.S. Department of Justice. This reporthas not been published by the Department. Opinions or points of view expressed are thoseof the author(s) and do not necessarily reflect the official position or policies of the U.S.Department of Justice.

Estimating the Impact of Truth-in-Sentencing on Correctional Populations
Farecasting basics Estimating the effect of TIS on the need for prison space in Virginia required fore-
casts of the correctional population incorporating different sets ofassumptions. In gen- eral, forecasts may be qualitative, qwntitative, or a blend of both approaches.” Quali- tative forecasting methods generally use the opinions ofexperts to predict future events subjectively. Such methods are used when historical data are either not available or of questionable validity. Quantitative forecasting techniques analyze historical data to pre- dict future values for a variable of interest (e.g., prison population).
Quantitative forecasting models can be grouped into two varieties-univariatemodels and cawdmodels. Univariate models predict future values based solely on past values of the time When a univariate model (e.g., exponential smoothing, decompo- sition methods, Box-Jenkins models) is used, historical data are analyzed to identify and extrapolate patterns in the data to produce forecasts. For example, past levels of prison population are used to forecast future levels of prison population. Univariate forecasting models are most useful and accurate when conditions are expected to re- main relatively constant or the time frame of the forecast is short. However, these models are less useful when it comes to forecasting the impact of changes in poliyn
Causal forecasting involves identifying variables that are related to the variable being forecast. Once these causal variables are identified, a model is developed that describes the relationship between all the variables. For example, information on the number of new admissions to prison, expected sentence length, and parole grant rates could be used to forecast future levels of prison population. Causal models are better suited than univariate models for assessing the impact of policy alternatives on
the future values of the variable of interest. This approach to modeling is often em- ployed to produce forecasts with longer time horizons because it can incorporate theoretical or other assumptions about future events.
One type of causal model that has seen extensive application to court and correc- tional policy modeling and alternatives forecasting is the simulation m ~ d e l . ~ ~ Stochas- tic-process simulation (also called discrete everzt or Monte-Carlo simulation) refers to the use of mathematical models to study systems that are characterized by the occurrence of discrete, random events. These individual events are represented by random vari-
’’ Bowerman and O’Connell (1 993). 76 A time series is a chronologically ordered sequence of observations on a particular variable. ” Bowerman and OConnell(1993). 78 Simulation is an activity whereby one can draw conclusions about the behavior of a given system by studying the behavior of a corresponding model whose cause-and-effect relationships are the same as (or similar to) those of the original sysrem, Gottfried (1 984). Sofmre to dwelop simulation models has become increasingly available and progressively easier to use. Simulation models historically were often developed from scratch using a programming language such as FORTRAN or C++, though these were generally eclipsed by programming languages designed specifically for simulation such as SLAM and SYMSCRIM: Increasing15 PC-based software such as @Risk and rhe PGversion of SLAM are becoming available to develop simulation mod- els. See, e.g., Kramer, Lubitz, and Kernpinen (1989); Flango and Osrrom (1996).
38 Truth-in-Sentencing in Virginia
This document is a research report submitted to the U.S. Department of Justice. This reporthas not been published by the Department. Opinions or points of view expressed are thoseof the author(s) and do not necessarily reflect the official position or policies of the U.S.Department of Justice.

ables whose values are generated by a computer. This approach synthesizes the ran- domness that is present in a real system, allowing the behavior of the original system to be reproduced artificially.
Given the VCSC's need to examine numerous alternatives to implementing TIS, the commission opted to develop a stochastic-process computer simulation forecast model (Criminal Justice Research Center @Risk). The model was developed to simu- late judicial decisionmaking and the demand for prison beds specifically within the context of the new TIS guidelines. The program has the flexibility to model a wide variety of alternative sentence ranges and recommendations. There are numerous interrelated components of the simulation program:. Criminal justice system admis- - sions, guidelines emulation, judicial compliance, rates of earned sentence credirs, recidivism rates, and the offender-mix distribution. In addition, the model can ac- commodate anticipated changes in the crime prone "at-risk" age groups within the admissions module of the program. The simulation model is programmed using the Excel spreadsheet and the @Risk software package.BO
CJRC @Rfsk Simulation Model
There are two central elements to simulating state prison population: stock popu- lation (Le., the number of inmates imprisoned at the beginning of the simulation) and new admissions. The stock population was defined as the number of inmates in Virginia prisons just prior to sentencing reform and the abolition of parole in Janu- ary, 1995. It was assumed that the stock population ofprisoners sentenced prior to the 1994 reforms would gradually decline over time at a rate largely determined by the Parole Grant Rate (PGR). The higher the PGR, the faster the rate at which the stock population will decline.
The @Risk model begins to estimate the number of new admissions by generating a Length-of-Stay (LOS) for different categories of hypothetical offenders during each month of the forecast period.*' This step differentiates the pool of new admissions into offender groups and assigns an average sentence to the offenders in each group.
The generated LOS is then used to determine how many months each specific group of offenders will remain in prison. The LOS generated for each hypothetical of- fender group (sentenced before and after reform) was then used to model the LOS for all offenders admitted during a particular month. Admissions during a particular month are described as a monthly admissions cohort.
The model uses special counting cells called queuing celh to keep track of the contribution that each category of offender from each monthly admissions cohort makes to the prison population for all subsequent months in the forecast time hori- zon. For all months after the hypothetical offender has exited the system (because of parole release or sentence completion), the offender's monthly admissions cohort
'' Microsoft Excel Version 4.0.
*' Creech (1 777). @Risk Version 3.0.
The Impact of TIS on Prison Population in Virginia 39
This document is a research report submitted to the U.S. Department of Justice. This reporthas not been published by the Department. Opinions or points of view expressed are thoseof the author(s) and do not necessarily reflect the official position or policies of the U.S.Department of Justice.

adds nothing to the queuing cells. This process is repeated for every monthly admis- sions cohort. After the last month in the forecast time horizon is reached, the contri- butions of each admissions cohort to the prison population of each month are summed and a forecast of prison population for each month is produced. A variety of sum- mary statistical measures (e.g., mean, standard deviation, percentiles, minimum, maximum, etc.) are produced as part of the process.
Initial validdon. A prerequisite to using simulation to model policy alternatives is that the simulation model be valia!zted82 This is typically accomplished by inputting historical data for the model parameters, using the model to generate forecasts for a time-period that has already passed, and then comparing the accuracy of the post- hoc forecasts to the actual numbers. If the forecasts of historid data are accurate according to pre-established criteria, the model is considered valid.
The historical approach to validation was not used because the type ofhistorical data needed for the simulation were not available (e.g., compliance with theTIS guidelines, rate of attrition of the stock population, etc.). Instead, the-model was validated by comparing the forecasts produced by the CJRC @Risk model with forecasts derived from a second model. This alternative model, the NCCD Pmphet simulation model, was being used by the DOC to forecast how the stock population (on hand when TIS reform was expected to be implemented in January, 1995) could be expected to e~i t .8~ In this “prospective” validation, the two models were found to produce similar results when they incorporated similar assumptions. While validation with historical data would have provided a less assailable assessment, the prospective method employed repre- sented an informed attempt to address the essential step in model building of model validation, especially given the limitations of their data.
Estimating the Effect of TIS on Correctional Populations Using Slmulatlon
To prospectively assess the possible impact of TIS on the state-responsible prison population, it was necessary to produce two different types of forecasts. The first as- sumed that the sentencing status quo would continue throughout the forecast time horizon (called a baseline forecast). This assumption implies that the “effective time” sentencing guidelines in use prior to reform in 1994 would continue to be used during the entire forecast time horizon. The second forecast was based on the assumption that sentencing reform and abolition of parole would occur as articulated by the Governor’s Commission. The difference between the baseline (no reform) and Governor’s Com- mission (Proposal X reform) forecasts of prison population represents the expected impact of sentencing reform and parole abolition on prison population,
Baseline forecasts were produced by the DOC using the NCCD Prophet Model. The @Risk model was used to produce the forecasts of prison population under
*’ Gottfried (1984). The NCCD model used a truncated exponential distribution to determine LOSS for the
stock population. This is a common assumption in queuing models and has empirical support in a variety of situations, Greenberg (1979).
40 Truth-in-Sentencing in Virginia
This document is a research report submitted to the U.S. Department of Justice. This reporthas not been published by the Department. Opinions or points of view expressed are thoseof the author(s) and do not necessarily reflect the official position or policies of the U.S.Department of Justice.

Proposal X. Stock prison population for both models was assumed to decline at a rate that was determined by the parole grant rate incorporated in the forecast. Further, both models used the same new commitment admissions forecasts developed by the DOC (using Box-Jenkins models). Parole violators in both models were included
with other new commitments using the 1994 levels of parole revocation. The Proposal X forecasts incorporated the normative adjustments in LOS for speci-
fied violent offenses as well as other changes in LOS for nonviolent offenders brought on by the move to time-served guidelines. It was assumed that inmates under Pro- posal X would serve, on average, 88.2% of their total sentence. In addition, the Proposal X forecasts reflected the change in the definition of state responsible in- mates from any prisoner sentenced to more than two years to any prisoner sentenced to more’than six months. It was also assumed that Proposal X would cake effect in
January, 1995. The need for prison beds was forecast using two different assumptions about the
parole grant race: 41.6 % and 15%. The 41.G% parole grant rate is the five-year average over the period 1988 to 1992. The 15% figure was a “best-guess” estimate of the future PGR made by the Parole Commission. This estimate was requested when officials observed the PGR declining sharply following Governor Allen’s election in
1993. The trend lines here show the state-responsible prison population forecasts for both PGR assumptions. The baseline and Proposal X forecasts under both scenarios indicate that between June, 1995, and June, 2005, prison population in Virginia will approximately double.84 Not surprisingly, the relationship between the expected im-
pact of the baseline and the Proposal X forecasts on correctional population is con- tingent upon the assumptions made about the PGR.
Assuming a 41.6% PGR, the Proposal X forecast for June, 2005, exceeds the baseline forecast by 2,929. On the other hand, assuming a 15% PGR, the baseline forecast exceeds the Proposal X forecast by 3,733. The reason that the baseline forecast is higher under the 15% PGR is that the model assumes all inmates will serve 85% of their historical “effective time” sentence. Under these PGR assumprions, both sce-
narios show the expected impact of Proposal X on prison population to be relatively
modest, resulting in either a 5% increase over the baseline forecast if one assumed a PGR of 41.6%, or a 6.7% decrease assuming a PGR of 15%. Therefore, the ultimate impact of Proposal X was shown to be largely dependent on the PGR.
One point of agreement between the forecasts is the rapid, almost explosive growth in prison population expected between 1995 and 2005. Both forecasts clearly im- plied that prison capacity would need to expand greatly over the next decade. A non- obvious result, assuming that the sharp dedine in the PGR following Governor Allen’s election would continue indefinitely, is that the adoption of all TIS reforms would actually reduce expected prison population relative to the status quo.
-
Prison Population Forecast - Comparison of The Commission’s Plan with Forecast Based on a 15% Parole Grant Rate Amended Bll(1993 - 2005)
Confined Population
60,OM) - 50,000.
40,OM) .
30,000.
20,oOo.
0 1 1993 1995 1991 1999 2001 2003 2005
Forecast Based on 41.6% Parole Grant Rate (1993 - 2005) Confined Population
60,000 1
50,000.
Baseline 41.6% PGR
lor mi 0 1993 1595 1997 1999 2001 2003 2005
PreW by: Chinal Justice Resaarch Center, DGJS
84 Criminal Justice Research Center (1994).
The Impact of TIS on Prison Popuhtion in Virginia 41
This document is a research report submitted to the U.S. Department of Justice. This reporthas not been published by the Department. Opinions or points of view expressed are thoseof the author(s) and do not necessarily reflect the official position or policies of the U.S.Department of Justice.

Actual B Forecasted Prison Population, 19951997
Actual & Forecasted Plison Admissions, 1995-1997
The Impact of TIS on Corrections, 1995-1997 Forecat zz A m , ! Both the baseline and Proposal X forecasts predicted that prison
population would expand rapidly and significantly between 1995 and 2005. The bars to the left compare actual and forecasted prison population for 1995-1997: the forecasts exceed the actual population each year. The difference was marginal for 1995 (2.2%) but for 1996 (10.3%) and 1997 (20.8%), it was quite large. Contrary to expectations, the net increase in prison population between 1995 and 1997 was only 5% (compared to a forecasted increase of 24%). Indeed, there was no growth at all in prison population between 1996 and 1997.85Clearly the forecasts were in error. The sourre of’recat emop. Errors in simulation typically result from three sources:86 (1) &e data, (2 ) an invalid model (resulting from improper specification or changes in the system being modeled), and (3) implementation of the model (especially pro- gramming errors). The second and third sources of error were minimized, if not eliminated, by the pre-implementation validation of the model (at least initially). In this case, it appears that an inaccurate estimate of the admissions stream was the
source of error. The bar charts here compare the actual and forecasted admissions (new commitments plus parole violators) and show that the forecasts substantially exceeded the actual admissions for every year (by 22% for 1995,24% for 1996, and 33% for 1997). Contrary to expectations, the net increase in prison admissions be- tween 1995 and 1997 was only 14% (compared to a forecasted increase of 24%).
At least two reasons can be identified for the inaccurate admissions forecasts: (1) declining arrests for violent crime and (2) slower than expected growth in total ar- rest~.~’ As seen in the trend lines on the next page, the violent crime rate for selected offenses declined for each crime type over the last five years. From 1993 to 1997, murder and robbery rates decreased by 13%, rape by 18%, and assaults by 3%. These unforeseen drops followed increases for each offense group during the late 1980s and early 1990s and contributed significantly to an overestimate of prison admissions.88
In addition to the inaccurate admissions forecast, avo other potential sources of error could come from invalid specification of the model. First, if the stock prison population (not afEected by TIS) is actually declining at a rate different than the assumed PGR, then the prison population forecast will be inaccurate. As seen in the following table, data on parole rates Since the implementation ofTIS suggest that theVCSC estimate of a post- implementation PGR of 15% was reasonably accurate. However, with respect to che baseline forecast, it is questionable whether a PGR of 15% would have been sustained indefinitely for all offenders sentenced under “effective time” guidelines.
85 Department of Public Safety (1997). Gottfried (1984).
87 Department of Public Safety (1997). One might also speculate that the drop in violent crime rates is in part the result of the
extended incapacitation of violent offenders incarcerated since the implementation of TIS (Marvel1 and Moody, 1994; Spelman, 1994; Levitt, 1996), though it is certainly controversial and difficult to prove this hypothesis (Austin and Irwin, 1993).
42 Truth-in-Sentencing in Virginia
This document is a research report submitted to the U.S. Department of Justice. This reporthas not been published by the Department. Opinions or points of view expressed are thoseof the author(s) and do not necessarily reflect the official position or policies of the U.S.Department of Justice.

Discretionary Parole Decisions, 1995-1998
Fiscal Year Caseload Granted Grant rate 1995 19,643 2.810 14.3% 1996 21,589 3,853 17.8% 1997 16,461 3,208 19.5% 1998 14,031 2,373 16.9%
Second, while the simulation approach employed by the VCSC was appropriate given the types of policy alternatives it was required to evaluate, the method used by the original @Risk model to estimate the LOS of each admission cohort incorporates an assumption that is unrealistic at face value. Specifically, the assumption in ques- tion is that the LOS of all admissions of the same category admitted during the same
--
totally eliminate such variability. The initial @Risk model has been revised several
Violent Crime Rates in Virginia, 1985-1997 (per 100,000 population)
curred independently for each admission. The larest version of @Risk avoids prob- lems of sampling strategy by using actual sentences for all admissions in a queuing model framework.
20-
10.
Murder 61
Rape
2 41
150 - 125-
100 - 75.
50 - 25.
0 1 1985 1987 1989 1991 1993 1995 1997
Robbery ’
sponsible inmates being held at local jails. However, the CJRC model accomplished its primary objective in that it effectively demonstrated that TIS Sentencing Guidelines
could be implemented without causing unmanageable pressure on the state-respon- sible prison population. In sum, the methodology employed by the CJRC to accom- plish this fairly complex demonstration was comprehensive and conceptually sound.
150.
100-
50.
Prison expansion. The forecasts produced by the VCSC were not used by the DOC for planning in general and for facilities expansion in particular. Since 1987, Virginia
,/pi 1985 1987 1989 1991 1993 1995 1997
Assault
has projected the size of its future prison and jail populations through a process known as “consensus f~recast ing,”~~ which combines technical forecasting expertise with the judgment and experience of professionals working in all areas of the crimi- nal justice system. Based on forecasts produced in this manner, Virginia expanded its prison capacity throughout the latter half of the 1980s and early 1990s. The recent downturn in admissions has resulted in these forecasts missing their mark by a wide margin. As a consequence, the amount by which inmate population exceeds the design capacity of the prison system declined from 52% to 37% between 1997 and 1998. Although prison population still exceeds technical capacity, Virginia currently plans to lease as many as 3,290 prison beds to other states.
Both estimares (i.e., by CJRC and by DOC) clearly overestimated the expected
0 1 1985 1987 1989 1991 1993 1995 1997
89 Virginia Criminal Sentencing Commission ( I 397). 0- 1985 1987 1989 1991 1993 1995 1997
The Impact of TIS on Prison Population in Virginia 43
This document is a research report submitted to the U.S. Department of Justice. This reporthas not been published by the Department. Opinions or points of view expressed are thoseof the author(s) and do not necessarily reflect the official position or policies of the U.S.Department of Justice.
CHAPTER FIVE
The Impact of TIS on Judicial Compliance
The primary goal of Virginia’s sentencing guidelines is to establish rational and
consistent sentencing standards subject to the state’s TIS laws.” A common measure of sentencing guideline system performance is the extent to which sentences adhere’ to or are in compliance with, the guideline recommendations. High levels of state- wide judicial compliance indicate that sentences are being meted out consistently. Likewise, concern with unwarranted sentencing disparity is reduced when compli- ance is high. In addition, compliance and departure analyses provide an empirical look at judicial satisfaction with the effect of guidelines on judicial discretion. One interpretation is that high compliance rates, especially in a voluntary setting like Virginia, indicate judicial acceptance and approval of the sentencing recommenda- tions. In contrast, low compliance rates may indicate that judges are dissatisfied with the limits being placed on their discretion. Departures become the way judges in- form policymakers that the guidelines place undue constraint on discretion and do not allow for appropriate or flexible sentencing decisions.
This chapter examines the effect on judicial compliance following the implementation ofTIS legislation in Virginia. Judicial compliance with theTIS guidelines is judges may depart fiom the guidelines and impose a sentence that is either more or less severe than recommended. When a judge elects to sentence outside the guideline range, the judge must submit a reason why to the commission. The first step in our assessment of judicial satisfiction with the sentencing guidelines is to define judicial compliance. Next, guideline compliance in the years just prior to reform (1991-1994) is compared with compliance folowhg the passage ofTIS legislation (1 995- 1998). The chapter con- cludes with a review of the most frequently cited reasons for departure.92
Defining Compliance The VCSC examines compliance with Virginia’s guidelines using three general
measures: dispositional, durational and overall compliance. These alternative mea- sures allow the commission to gain perspective on which elements of the guidelines are functioning well and which have gained less acceptance among the judiciary.
”This statement reflects the stated goals ofthe Commission throughout the Commonwealth’s experience with guidelines. See, for example, Report of the Ad Hoc Committee on Sentencing Guidelines (1985), p. 1 and Virginia Criminal Sentencing Commission (1998). ” Judges use the guidelines as a reference but may choose to sentence outside them in particu- lar cases. While compliance with guideline recommendations is voluntary, completion of guide- lines worksheets is now mandatory as stipulated in Q 19.2-298.01 ofThe Code of Virginia. Also, in cases when judges choose to sentence outside the guidelines recommendations, judges must, pursuant to 5 19.2-298.01(B), provide written explanations for the departures (Vir- ginia Criminal Sentencing Commission, I995 Annual Report, p. 6). 92 All compliance analysis reviewed in this chapter was originally conducted by VCSC. See Virginia Criminal Sentencing Commission (1998).
44 Truth-in-Sentencing in Virginia
This document is a research report submitted to the U.S. Department of Justice. This reporthas not been published by the Department. Opinions or points of view expressed are thoseof the author(s) and do not necessarily reflect the official position or policies of the U.S.Department of Justice.

Dispositionalcompliance is defined as the rate at which judges sentence offenders to the same type of disposition recommended by the guidelines as follows: 1) proba- tion/no incarceration, 2) incarceration up to six months, or 3) incarceration over six months. Because the recommendation as to the type of disposition is the foundation of the sentencing guideline system, the commission believes dispositional compli- ance is an important measure. The rate of dispositional compliance in FYI998 was 83% and has remained largely stable since the introduction of TIS in 1995.
Durationalcompliance is defined as the rate at which judges sentence offenders to terms of incarceration that fall exactly within the recommended guideline range. In Virginia, the measure of durational compliance considers only those cases for which the guidelines recommend an active term of incarceration and the offender receives an incarceration sanction of at least one day in jail. Durarional compliance among -1998 cases was 76% and has varied by specific type of offense since the imple- mentation ofTIS. This result indicates that judges more often agree with the recom- mended type ofsanction (dispositional compliance) than they do with the recom- mended sentence length in incarceration cases.
Overall compliance measures the extent to which Virginia’s judges concur with recommended type of disposition and length of incarceration. Overall compliance is the combination of sentences found to be in strictand generalcompliance. For a case to be in strict compliance, the sentence must meet both dispositional and durational criteria. General compliance is less exacting and “results from the commission’s attempt to understand judicial thinking in the sentencing process, and is also meant to accommodate special sentencing ~ i r ~ ~ m ~ t a n ~ e ~ . ” ~ ~ For a case to be in general compliance with the sentencing guidelines, it must meet one of the following chree criteria: m Compliance by rounding provides an allowance in instances when the active sen-
tence handed down by a judge or jury is “very close” to the sentencing guideline recommended range. For example, a judge is considered in general compliance with the guidelines if he sentenced an offender to a two-year sentence based on a guideline recommended range that goes up to one year eleven months.
rn Time served compliance is intended to accommodate judicial discretion when a judge sentences an offender to pre-sentence time served in a local jail when the guidelines call for a short jail sentence. Even though the judge does not sentence an offender to post-sentence incarceration time, the commission typically consid- ers this type of case to be in general compliance. Compliance due to alternative sanctioning arises most often in habitual traffic of- fender cases as the result of amendments to the law effective July 1, 1997. The change allows judges, at their discretion, to suspend the mandatory minimum 12- month incarceration term in habitual traffk felonies and sentence these offenders to a Boot Camp, Detention Center, or Diversion Center Incarceration program.
--
93 Virginia Criminal Sentencing Commission (1998). p. 23.
The Impact of TIS on judicial Compliance 48
This document is a research report submitted to the U.S. Department of Justice. This reporthas not been published by the Department. Opinions or points of view expressed are thoseof the author(s) and do not necessarily reflect the official position or policies of the U.S.Department of Justice.

Sentencing Guidelines Compliance Rates, Before and After TIS
Compliance
For cases sentenced since the e&ctive date of legislation, the commission considers
either mode of sanctioning to be in general compliance with the sentencing guidelines.
75.4%
25%
Jun Feb Mar Nov Cki Mar 1992 1593 1994 19% 1996 1998
Mitigation
2ow 1
10%
Jun Feb Mar Nov Oct Mar 1992 1993 1994 1995 1996 1998
Aggravation
20% 1
0% 1- Jun Feb Mar Nov Oct Mar 1992 1993 1994 1995 1996 1998
46 Truth-in-Sentencing in Krginia
This document is a research report submitted to the U.S. Department of Justice. This reporthas not been published by the Department. Opinions or points of view expressed are thoseof the author(s) and do not necessarily reflect the official position or policies of the U.S.Department of Justice.

Overall Compliance and Departure Overall compliance has remained relatively high since the inception of sentencing
guidelines in 1991. The overall compliance rate has ranged from 72 to 76% and
currentlysits at 75% (between 1/95 and 3130198 for 42,269 cases). BecauseVirginia’s sentencing guidelines are designed to accommodate judicial discretion (they remain voluntary and there is no mandate to adhere to the guideline recommendations), the commission does not view the attainment of 100% compliance as an ultimate goal.
The rate at which judges sentence offenders more severely than the sentencingguide- line recommendation, known as the ‘‘aggravation’’ rate, has ranged from a low of 9% (just prior to the implementation ofTIS) to the current level of 13%. The rate at which judges sentence offenders to sanctions below the guideline recommendation, or the “mitigation” rate, has dropped slightly since the introduction of TIS, declining from a high of 17% to a current level of 11%. Isolating the departure cases between 1995 and 1998, 53% of the departures are cases of aggravation of the sentencing guideline rec- ommendation, while 47% are cases of mitigation. These patterns of compliance and departure have been stable since the TIS guidelines were instituted.
-
Examining sentencing guidelines compliance rates by the 12 primary offense groups reveals that compliance is neither consistent, nor the departure pattern uniform, across the offense groups. The bars to the right show post-TIS compli- ance rates range from a high of 82% for larceny cases to a low of 62% for sexual assault cases. In general, higher races of compliance were found for property crimes
than the person offense categories-larceny, fraud, drugs, burglary (other than dwellings) all had compliance above 70%. The sentences for person offense groups (assault, burglary of a dwelling, homicide, rape, robbery, kidnapping, and sexual assault) all had compliance rates below 70%.
Overall compliance within offense groups has not changed much as a result ofTIS legislation, although the changes that have occurred are more pronounced in the crimes against the person categories. Under TIS, the person offense groups (includ- ing burglary of a dwelling and burglaries with weapons) receive statutorily mandated midpoint enhancements that increase the guideline recommendation by a minimum of 100-125%.74 Further midpoint enhancements are applied in cases where theoffender has a violent prior record, resulting in a sentence recommendation up to six times longer than historical time served by violent offenders convicted of similar crimes under the old parole laws. Undoubtedly, midpoint enhancements affect compliance rates, and the im- pact is likely not uniform across guideline offense groups. However, it is currently impos- sible to disentangle the role played by differential midpoint enhancements in overall compliance.
Departures under TIS guidelines (measured by mitigation and aggravation rates) differ significantly across offense groups. The table below shows that property crimes, fraud, and burglaries of other structures (nondwellings) exhibit a marked mitigation pattern among the departures, while drug and larceny offenses reveal patterns of aggravation.
TIS Sentencing Guidelines Compliance Rates January 1995 - March 1998
Larceny
Fraud
Dws @urglary Structure
Assault
Burglary Dwellmg
Homicide
Robbery
Kidnapping
Sexual Assault
Rape
1- 82%
- 67% Pre-TIS Sentencing Guidelines Compliance Rates January 1991 - March 1994
Fraud - 80%
Drugs ’-177%
Larceny 0 7 5 %
Burglary 72%
Robbery 1- 68%
Murder/Homickie :- 68% Assault -~ 68%
Sexual Assault 1-1 66%
Rape - 58%
517.1-805 ofCodeofVireinia.
The Impact of TIS an Judicial Compliance 47
This document is a research report submitted to the U.S. Department of Justice. This reporthas not been published by the Department. Opinions or points of view expressed are thoseof the author(s) and do not necessarily reflect the official position or policies of the U.S.Department of Justice.

Departures from the burglary of dwelling guidelines resulted in a mitigation rate . much higher than the other property offenses and similar to the rates of mitigation among several of the person crime categories. The violent offenses of rape and rob- bery, and to a lesser extent assault and kidnapping, demonstrated strong mitigation patterns. In fact, in more than one-fourth of the rape cases and over one-fifth of the robberies, judges sentenced below the guideline recommendation. Despite the mid- point enhancement for violent current offenses and violent prior records, the guide- lines offense groups of homicide and sexual assault showed stronger aggravation pat- terns from the guidelines than any other crime categories. To a certain degree, the aggravation patterns for homicide and sexual assault offenses may reflect judicial sentencing for “true” offense behavior in cases where a plea agreement resulted in a less serious charge at conv ic t i~n .~~
TIS Guidelines Departure Rates by Offense, 1995-1998
Assault BurglaryDwelling Burglary/Other Structure
FmUd Kidnapping Larceny Murder/Homicide Rape Robbery Sexual Assauk
Dm9
Mitigation Rate Aggravation Rate
17.7% 19.8 15.5 10.2 15.4 19.5 7.1 12.6 29.0 21.9 11.4
14.0% 13.5 12.2 15.1 5.9
17.7 10.5 22.3 8.8
14.5 26.8
Total Cases Examined
2,001 2,313 1,585 17,415 5,903
215 10,864 610 468
1,928 938
With some notable exceptions, the implementation of TIS has not had a pro-
nounced effect on compliance or departure rates (mitigations or aggravations). Fur- thermore, a majority of sentences fall within the guideline recommendations (i.e., for the case types listed, between 62% and 82% of the sentences complied with the sentencing guidelines). The fairly high compliance rates may be, in part, an artifact of the evolving nature of the sentencing guidelines. The VCSC updates the sentenc- ing guidelines annually and continually fine-tunes the sentencing worksheets.% This occurs by continually analyzing PSI data, completed guideline worksheet data, and other information that comes before the commission. Some decisions to modifl guideline worksheets are strictly data driven (as is the case with setting the ranges),
95 Offense scoring under Virginia’s sentencing guidelines is based solely on the conviction offense, and unlike the United States Sentencing Guidelines, does not score the real offense behavior in instances where a charge reduction occurs. Virginia’s guidelines do, however, ac- count for elements of the crime such as victim injury and use of a weapon. Aggravation rate for violent offenses, then, may reflect the desire on the part of judges to impose sentences more closely in line with the actual offense committed rather than the offense to which the offender plead guilty. ’K, Virginia’s sentencing guidelines are based on a continuing analysis of judicial sentencing deci- sions in the Commonwealth. This i s done to ensure that judges are provided with guidelines that reflect both historical sentencing decisions and changes in more recent sentencing decisions (Judicial Sentencing Guidelines Committee, 1993, p. 7).
48 Tmth-in-Sentencing in Virginia
This document is a research report submitted to the U.S. Department of Justice. This reporthas not been published by the Department. Opinions or points of view expressed are thoseof the author(s) and do not necessarily reflect the official position or policies of the U.S.Department of Justice.

and some are more qualitative (as is the case with increasing time-served amounts for
targeted offenders). However, most changes are a combination of quantitative and qualitative input. For example, a relatively high departure for sexual assault cases caused the commission to conduct a more in-depth study of convicted sex offend- ers.” As a result of this study, age of the victim was added to the sentencing worksheet for sexual assault cases as a sentence enhancement.”’
Judicial Departure Reasons Compliance with the TIS guidelines, as with its predecessor (the guidelines in place
under the parole system) is voluntary. Hoyever, following the 1994 reforms, judges were reguired to articulate and submit redons for sentencing outside the guideline recommendations. “The opinions of the judiciary, as reflected in their departure rea- sons, are highly relevant to the Sentencing Commission as it deliberates on revision recommendations. Unlike their counterparts in many other states using sentencing guidelines, Virginia’s judges are not limited by any prescribed or standardized reasons for departure set forth by the commission; they are free to depart for any reason they find compelling and must only communicate that reason to the commission.”99
VCSC staff state that recommendations for revisions to the guidelines, submitted to the General Assembly each December in the commission’s annual report, draw on the opinions of the judiciary reflected in departure reasons. As a consequence, the commission is active in encouraging judges to provide specific reasons for departure. One important result is that, over time, judges are now more likely to give a reason for their mitigated or aggravated sentences. “No reason ci ted went from being the most common departure reason for both mitigation and aggravation (ranked num- ber 1) at the end of 1995 to one of the least (ranked 9 of 10 for mitigation and
ranked 10 of 10 for aggravation) during the period 1995-1998.
-
During the first three years of TIS, mitigation cases reveal that the most com- monly cited reasons for departure were that an alternative sanction or community punishment’00 was imposed (21.2%) and that the offender had good rehabilitation potentialioi (16.7%). For aggravated sentences, the most commonly cited reasons
97 The “Convicted Sex Offender” study found that three-founhs of all convictions in the sample involved a sexual assault on a child under 18 years old, and almost half ofthe victims were under 13. ‘)I Recommendation 4: The sentencing guidelines for sexual assault offenses should be amended by adding a factor to sections A and B to increase the total worksheet score in cases involving victims who are under the age of 13 at the time of the offense. This modification significantly increases the likelihood that sexual assault offenses involving victims under 13 will be recom- mended for prison, and, in rhe cases that will not result in a prison recommendation, this modification ensures these offenders will receive a jail term. These recommendations do not apply to rape, forcible sodomy and object penetration (Virginia Criminal Sentencing Com- mission (1 996), p. 79). ‘’ Virginia’s Sentencing Commission Annual Report (1996), p. 20. l W Detention Center Incarceration, Diversion Center Incarceration, Boot Camp Incarcera- tion, intensive supervised probation, day reporting, and the drug court programs are examples of alternative sanctions available to judges in Virginia. Io‘ For instance, judges may cite the offender‘s general rehabilitation potential or they may cite more specific reasons such as the offender‘s progress in drug rehabilitation, a strong work record, the offender’s remorse, a strong family background, or restitution made by the offender.
-
TIS Guidelines Reasons For Departure JanUary 1995 - March 1998
10 Most Frequent Mitigating Reasons
Alternativesanction -1 212%
Good rehabiiiion potential -16.7%
Plea agreement - 10.3% Caoperative with authwiti - 10.3%
Weak case/evidence - 7.3%
Age of offender m 5.5%
Sentenced by another court - 5%
Minimal priw record = 4.8%
No reason cited = 4.7%
Facts of the case = 4.4%
10 Most Frequent Aggravating Reasons
Criminal Iifestyldorientation - 13.8%
Previous same offense 1-1 12.4%
Plea agreement - 12.2%
Facts of the case - 11 5% Recommendation too low - 7.9%
Jurylcommunily s e n t i i t -7%
Trudreal offense behavior = 5.4%
Drug amounVpurily m 4.6%
Sentencing consistency .I 4.2%
No reason cited = 3.5%
The Impact of TIS on/udicid Compliance 49
This document is a research report submitted to the U.S. Department of Justice. This reporthas not been published by the Department. Opinions or points of view expressed are thoseof the author(s) and do not necessarily reflect the official position or policies of the U.S.Department of Justice.
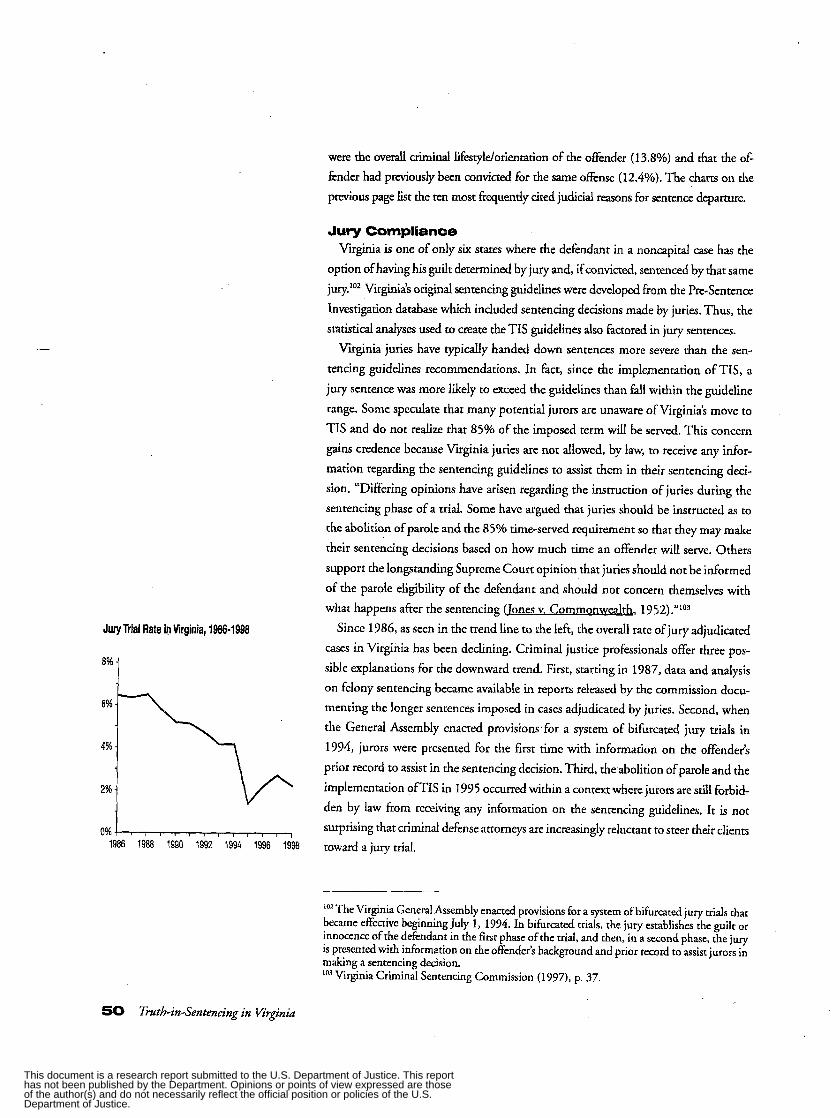
were the overall criminal liktyldorientation of the offender (13.8%) and that the of- fender had previously been convicted for the same offitnse (12.4%). The charts on the previous page list the ten most frequently cited judicial reasons for sentence departure.
8%- sible explanations for the downward trend. First, starting in 1987, data and analysis
The Virginia General Assembly enacted provisions for a system of bifurcated jury trials that became effective beginning July 1, 1994. In bifurcated trials, the jury establishes the guilt or innocence of the defendant in the first phase of the trial, and then, in a second phase, the jury is presented with information on the offender’s background and prior record to assist jurors in making a sentencing decision.
Virginia Criminal Sentencing Commission (1 997), p. 37.
surprising that criminal defense attorneys are increasingly reluctant to steer their clients
50 Truth-in-Sentencing in Virginia
This document is a research report submitted to the U.S. Department of Justice. This reporthas not been published by the Department. Opinions or points of view expressed are thoseof the author(s) and do not necessarily reflect the official position or policies of the U.S.Department of Justice.

Since the implementation of TIS, the overall compliance rate of jury sentences with the sentencing guidelines has been 43% compared to 76% in nonjury trials. The majority of the departures have been aggravations (i.e., 45% aggravations for jury trials and 12% aggravations for nonjury trials). There has been virtually no difference in the rate of mitigated sentences for jury and nonjury trials since the implementation ofTIS.
In Virginia, judges are permitted by law to reduce a jury sentence they feel is inappropriate. More often than not, however, they do not amend the sanction. For example, just after the implementation ofTIS, judges modified about 29% of jury sentencing cases. In cases modified when the jury was outside the guideline range, nearly half (45%) were cases where the find sentence was still outside the guidelines recommendation. Judges brought a high jury sentence into compliance with the guide- line recommendation in 0 n h f . w out of ten modijcations. Unlike overall compliance and departure rates, judicial modification patterns appear to have changed since the implementation of TIS. Specifically, 86% of judicial modifications after TIS were made to jury sentences outside the guideline recommendation compared to 69% of judicial modifications in the last year of the old parole system.
--
Compliance rates in states with sentencing guidelines range from 75-100%. Com- paring compliance rates across states is only useful for portraying differences in how guideline systems have been developed or modeled. A 100% compliance rate (in North Carolina) simply means judges are bound statutorily to adhere to guideline recommendations. States with lower compliance rates may have drawn narrower sen-
tencing ranges, or may measure compliance differently depending on the purposes of monitoring.
To the extent that the goal of sentencing guidelines is to structure judicial discre- tion, not to eliminate it, then some level of departure is to be expected-if not en- couraged-in order to account for atypical cases. This perspective differentiates sen- tencing guidelines from mandatory sentencing. In Virginia, the majoriry (between 72-76%) of prison sentences handed down by judges pre- and post-TIS have com- plied with sentencing guidelines. The consistently high level of overall compliance indicates that guidelines were developed and statistically modeled in a fashion con- sistent with past sentencing practices. In addition, a compliance rate in the 70-80% range shows that judges are reasonably satisfied with guidelines recommendations. The most recent figures (updated June 1999) show overall compliance at a high of 78%. Commission staff speculate that the recent increase in compliance may be related to media reporting of compliance rates by name of judge.
It is important to note that patterns of judicial compliance vary when examined for individual case types. Thus, it would appear that targeting adjustments to the sentencing guidelines for specific case types and circumstances (eg., rape sexual as- sault, robbery) would be a reasonable way for the VCSC to maintain or increase compliance rates. In fact, it is an ongoing strategy of the VCSC to target individual offenses or specific scoring factors for revision on the worksheets.
Guideline Compliance Rates Comparing Judge and Jury Sentences
(January 1995 -March 1998)
hgravation 1129( 45%
I Jury
I Judge
0% 20% 40% 60% 80%
The Impact of TIS on Judicial Compliance 51
This document is a research report submitted to the U.S. Department of Justice. This reporthas not been published by the Department. Opinions or points of view expressed are thoseof the author(s) and do not necessarily reflect the official position or policies of the U.S.Department of Justice.

CHAPTER S I X
Estimating Preventable Crime Under TIS
Virginia, legislators wanted to know how the extended incapacitation of violent offenders under TIS would effect crime rates. Specifically, they asked for information on how Virginians would benefit from locking up violent offenders for longer peri- ods of time. Implementing the governor‘s proposed sentencing reforms would re-
quire spending a larger share of the public treasury on housing violent offenders. Under normal circumstances, imprisoned offenders do not pose a threat to the gen- eral public. But is the cost associated with giving certain offenders lengthier sen- tence~ justified through a reduction in the amount of crime they might otherwise commit if they had been released earlier? Is there a beneficial “incapacitation effect” associated with TIS?
This chapter reviews two VCSC studies that estimate the “benefits of incarcera- tion” in terms of the amount and value of crime prevented by sentencing reform. n Estimate of preventable crime and recidivism under TIS: How much new crime is
prevented when certain offenders serve longer sentences? m Estimate of the cost of crime prevented under TIS: What is the benefit (or cost
savings) to society from having fewer victims of crime? There is no generally accepted method for determining the amount of crime pre-
vented through longer prison sentences.’” Much of the literature on this subjectto5 focuses on ways to measure and calculate a theoretical criminal career parameter lambda (A), which is the frequency (average annual rate) of offending by active of- fenders (sometimes referred to as an individual offending frequency). Given knowl- edge of 3L for a particular category of inmate (based on offense seriousness, prior record, and other offender characteristics) and the expected Length-of-Stay, Ti, for that inmate, the number of offenses prevented by incarceration of that inmate would be equal to h(Ti). The total number of preventable crimes (C) for N offenders of a parricular category could be estimated as
N
C=Cax i
A fUndamental unresolved issue wirh this approach to estimating the number of crimes prevented by incapacitation is how to measure rates of offending.lW For ex- ample, controversy remains as to whether offending patterns vary with the age of the
offender’07 or remain relatively constant over the offender’s active criminal career.’O*
lM See, e.g., Gottfredson, and Hirschi (1986); Blumstein, Cohen, and Farrington (1988); Zimring and Hawkins (1988). ’‘’See, e.g., &hen (1978); Horneyand Marshall (1991).
IO7 Gottfredson and Hirschi (1986). ’” Blumstein, Cohen, and Farringon (1988).
Cohen (1986); Visher (198G); HorneyandMarshall(l991); Marvel1 and Moody (1994).
52 Truth-in-Sentencing in Krgz’nia
This document is a research report submitted to the U.S. Department of Justice. This reporthas not been published by the Department. Opinions or points of view expressed are thoseof the author(s) and do not necessarily reflect the official position or policies of the U.S.Department of Justice.

Moreover, the information required to determine rates of offending for various classes
of offenders would likely be significant. Indeed, given these basic concerns, some reject
h. entirely as a useful The staff of the VCSC opted to develop a methodology for counting “prevent-
able” offenses that avoided the uncertainties associated with the measurement of ?L by actually counting the number of offenses that occurred between the inmates’ actual release date and the later release date proscribed by Proposal X.”’ The VCSC study was designed to identify preventable convictions based on an analysis of of- fenders released from prison between 1986 and 1991 who recidivated with a new felony (nondrug) conviction between 1986 and 1993. Crimes committed by offend- ers released prior to 1986 were excluded from the study.
The study of preventable crime produced by the VCSC included: (1) developing a framework to estimate “preventable” recidivism, (2) compiling a comprehensive da- tabase to study preventable recidivism (1 986-1 993), (3) developing a projection of preventable recidivism for 1995-2005, and (4) forecasting preventable crime from 1995 through 2005. For purposes of this analysis, recidivism was measured by a new felony (nondrug) conviction. Measuring recidivism in this way provides a conserva- tive estimate of preventable crime because felony convictions are only a fraction of the number of crimes actually committed.“l
-
Step One: Developing a Framework to Estimate Preventable Recidivism
The study began by estimating recidivism that would have been prevented be- tween 1986 and 1993 by the extended incapacitation of violent offenders. A sample was drawn consisting of offenders who would have been subject to normative sen- tence adjustments (due to the nature of their current offense and/or prior criminal record) under the Governor’s plan (Proposal X) and who were released from prison during the period 1986 to 1991. Because the last release dates for this offender group occurred at the end of 1991, and subsequent criminal activity was tracked through 1993, all offenders in the sample were monitored for a minimum of two years fol- lowing release.
To identify any felony convictions that occurred after the offender’s release, each case in the sample was tracked using the Pre/Post-Sentence Investigation (PSI) data- base. First, a revised release date was calculated to approximate the date the offender would have been released had Proposal X been in effect at the time of the offender’s original conviction. The new release date was calculated using the midpoint value of the recommended sentence range under the Proposal X sentencing guidelines for
each offense type. “Preventable” offenses were identified based on whether they occurred after the
offender’s actual release and prior to the Proposal X release date. These offenses were
IO9 See, e.g., Gottfredson and Hirschi (1986). ‘lo Criminal Justice Research Center (1994). ‘ I ‘ For a more complete discussion of measuring recidivism, see Chapter 7.
Ertimating Preventable Crime Under TIS 53
This document is a research report submitted to the U.S. Department of Justice. This reporthas not been published by the Department. Opinions or points of view expressed are thoseof the author(s) and do not necessarily reflect the official position or policies of the U.S.Department of Justice.

--
considered preventable because they presumably would not have occurred if the of- fender was still incarcerated. New felony convictions occurring after the Proposal X release date were not considered preventable. Felony drug offenses were not consid- ered preventable because the nature of the drug trade is such that “replacement” effects would have almost certainly occurred.
Step 2: Compiling a Comprehensive Database to Study Preventable Recidivism (1986-1993)
In this step, the necessary data were identified and assembled. This included: Producing a distribution of historical time-served amounts under the pre-TIS guide- lines (by offense type) for offenders who would be affected by the normative sen- tence adjustments. Calculating a recidivism rate for this affected group of offenders by determining the percentage of offenders in this category released from prison or jail who subse- quently were convicred of a new felony (nondrug) offense (r). Calculating the average number of preventable felony convictions (using the PSI database) per recidivist offender in the affected sample (0. Deriving two additional distributions showing the time across all recidivist of- fenders from (1) release date to a new violent felony offense and (2) release date to a new nonviolent (nondrug) felony offense resulting in conviction.
Step 3: Forecast of Preventable Felony Convictions (1995-2005) VCSC s t a f f began by forecasting the number of offenders who would be convicted
of offenses subject to the normative sentence adjustments under Proposal X. The forecasts were produced by an ARIMA (Auto-Regressive Integrated Moving Aver- age) model using monthly data on convictions for the targeted offenses from 1985 through 1993. Monthly forecasts were produced for the period from January 1995 through December 2005.
A release date for each offender in the forecast was determined using the average historical time served for the offender’s offense class (derived from the distribution of historical time served assembled in Step Two). An estimate of the total number of offenders released each month in the forecast horizon was produced (Rj, where j represents the month of release) by summing (across offense type) the forecasted number of offenders (xij, where i represents the offense type and j represents the month) convicted of offenses subject to the normative sentence adjustments under Proposal X who were expected to be released during month j
Rj=& xij,
The recidivism rate (r, derived in Step Two) was applied to the forecast of offend- ers expected to be released during each month of the forecast horizon. The product is an estimate of the number of offenders released for normatively adjusted offenses
54 Truth-in-Sentenring in Krginia
This document is a research report submitted to the U.S. Department of Justice. This reporthas not been published by the Department. Opinions or points of view expressed are thoseof the author(s) and do not necessarily reflect the official position or policies of the U.S.Department of Justice.
.-
who will recidivate with a new felony (nondrug) conviction (Dj), for every month in
the forecast horizon, where
Dj=rRj
The number of preventable felony convictions per month (produced by the recidi- vist offenders affected by Proposal X) was estimated (Cj). The estimate was produced by taking the product of the number of preventable felony convictions per recidivist offender (f, calculated in Step 2) and the forecast of the number of recidivist offend- ers released each month of the forecast horizon (Dj) as follows
Cj=fDj
At this stage, the forecast of these preventable felony convictions must be distrib- uted across the months after the offenders’ release to simulate the pattern in which these offenders actually’recidivate following their release horn prison. To this end, preventable convictions were first disaggregated into violent and nonviolent prevent- able offenses and then by new offense type. This was accomplished by applying the proportion of preventable violent convictions (pv) to the forecast of preventable total felony convictions per month (Cj). Thus, the number of preventable violent felony offenses that resulted in conviction per month (Vi) was equal to
Vj= pv(Cj)
while the number of preventable nonviolent felony convictions per month (Pj ) was equal to
Pj=(l-pv)( Cj)
Once the number ofviolent and nonviolent preventable convictions for each month between 1795 and 2005 was estimated, the next step was to distribute these convic- tions across time using the two distributions calculated in Step 2 (the time from release date to either (1) a new violent felony offense or (2) a new nonviolent (nondrug) offense that resulted in conviction). This step produced estimates of both the number ofviolent [Nv(j)] and nonvioleiit [Np(j)] preventable offenses (resulting in conviction) expected to occur each month between 1995 and 2005.
In summary, the specific types of iolent and nonviolent offenses expected to be committed by recidivist offenders were estimated using proportions derived from historical data (Step Two). The result was a forecast of the number of preventable felony offenses (by offense type) expected to result in conviction during each month between 1975 to 2005.’12 These offenses were then distributed across future months
r
‘ I 2 If the (hiscorically derived) proportion of prevenrable violent felony offenses accounced for by murder was represented by p(l), for rape by ~(21, for robbery by p(3), and for assault by p(4), then the number of preventable murders occurring during m o n t h j would be equal to p(I ) NuQ), the number of preventable rapes would be equal to p(2) NJ), the number of preventable robberies would be equal to p(3) Nnfi), and the number of prevenrable assaults would be equal to p(4) 4.0). Similarly, if the (historically derived) proportion of preventable
Estimating Preventable Crime Under TIS 55
This document is a research report submitted to the U.S. Department of Justice. This reporthas not been published by the Department. Opinions or points of view expressed are thoseof the author(s) and do not necessarily reflect the official position or policies of the U.S.Department of Justice.

--
Forecast of Preventable Felony Crimes Under the Commission's Plan (1995 - 20051
Fmm 1995-2005 an estimated 119,969 fehy crimes would be prevented under the CommissiOn's h.
based on historical recidivism patterns. The final result was the number of both violent and nonviolent preventable offenses (resulting in conviction) expected to occur each month between 1995 and 2005.
Step 4: Forecast of Preventable Crime (1995-2005) The number of reported crimes always exceeds the number of criminal convic-
tions. During this step, the estimated number of preventable felony convictions was used to estimate the overall reduction in reported felony offenses attributable to TIS. ' The ratio of the number of index crimes'" reported to the police to the number of convictions for index crimes between 1991 and 1993 was calculated. For example, during this period, there were 6.7 rapes reported to the police for every rape convic- tion. These ratios were then applied to the forecast of the number of preventable convictions for each index offense category to produce estimates of future prevent- able index crime reported to the police. For example, if the ratio of the number of rapes reported to the police to the number of convictions for rape is designated as rp,
then number of preventable rapes in month j [Pr (j)] is estimated to be equal to
Pr (j) = rp p(2) Nv(j), where p(2) = proportion of preventable violent felony offenses accounted for by rape Nv(j) = the number of preventable offenses (resulting in conviction) in month j,
Using this methodology, the CJRC estimated that there was an average of 12 felony offenses reported for each felony conviction (across all index offense categories, re- ported over a multiyear period). This average reported offense-to-conviction ratio implies that for every future preventable felony conviction there would be an addi- tional 12 index crimes prevented (and thus not reported) due to the extended incar- ceration of offenders under Proposal X.
The trend lines here show the forecast (1995-2005) of preventable reported felony crimes under Proposal X. More than 26,000 violent and 93,891 nonviolent felonies were expected to be prevented by the implementation of Proposal X between 1995 and 2005.'14
Conclusions The methodology for estimating preventable crime just described is analytically com-
plex and makes numerous interrelated behavioral assumptions. As a consequence, the
nonviolent felony offenses accounted for by burglary was represented by p(5), for arson by p(@, and for motor vehicle theft byp(7), then the number of preventable burglaries occurring during month j would be equal to p(5) Npfi), the number of preventable arsons would be equal top(@ N,fi), and the number of preventable robberies would be equal top(3 Npfi);).
'I4 Note that the Criminal Justice Research Center also developed a more comprehensive esti- mate of the cost of recidivism in Virginia (Criminal Justice Research Center, 1994a) which also included law enforcement, correctional and judicial, as well as victim, costs of d (i.e., not just preventable) felony recidivism in 1993. These were estimated to total $670 million in 1994.
Murder, rape, robbery, assault, burglary, arson, and motor vehicle theft.
56 Truth-in-Sentencing in V&h'a
This document is a research report submitted to the U.S. Department of Justice. This reporthas not been published by the Department. Opinions or points of view expressed are thoseof the author(s) and do not necessarily reflect the official position or policies of the U.S.Department of Justice.

accuracy of the estimates may be affected by potential sources of statistical error and possible challenges to the assumptions. First, whiie not a criticism, the choice of study period constrains the results. Forecasted recidivism for theyears 1995-2005 is based on the patterns and experience of an earlier period of time (1986-1993) that may no longer be representative. Falling crime rates and record employment b e l s after 1993 may indicate a change in many criminal careers. Second, primary results, such as the number of violent felony convictions prevented by Proposal X are calculated by com- bining many separate estimates. Each estimate contains potential measurement error’15 that is exacerbated when the individual estimates are combined. Third, the manner in which repeat crimes were distributed across time (i.e., using average time to recidivism) could be challenged as unrealistic.
On the other hand, the estimates were produced-quickly using a carefully con- ceived method designed to make the most out ofavailable data. The approach avoided attempts to measure complex, theoretically challenging quantities such as h through expensive and time-consuming longitudinal research. In addition, there are several reasons to believe that these estimates met a basic goal of producing conservative estimates of preventable crime. Several other studies on this subject use much higher ratios to estimate the actual number of crimes committed by an offender compared to each felony conviction. Zedlewski (1987), in his analysis of the costs and benefits of confinement, cited a Rand Corporation survey of inmates in California, Michi- gan, and Texas that found the average number of crimes committed per year by an
offender was 187, with a median of 15 crimes per year. DiIulio (1990), in a survey of 425 Wisconsin inmates, found the average number of crimes committed per year to
be 141, with a median of 12 crimes per year.
.-
Estimated Cost Savings Resulting from Preventable Crime
The primary benefit of prevented crime under TIS is that there are fewer victims of crime. The legislature asked the VCSC to estimate the “costs of crime” avoided by individuals who did not become crime victims due to the extended incapacitation of violent offenders under Proposal X. As in the case of preventable crime, there is no widely accepted method to make such a determination.”’ Miller, Cohen, and Wiersema contend that the costs of crime to victims are mainly (1) out-of-pocket expenses such as medical bills and property losses; (2) reduced producrivity at work, home, and school; and (3) nonmonetary losses-such as fear, pain, suffering, and lost quality of life. While some of these losses are tangible and easily quantified, the
‘I5 For example, the ratio of reported felonies to convictions for each offense type ignores the lag relationship between reported offenses and convictions (i.e., convictions must follow the reported crime though not necessarily during the same year) which obviously causes some measurement error. ‘I6 See, e.g., Haynes and Larson (1984); Zedlewski (1987); Zimring and Hawkins (1988); Baird (1993); Levitt (1996); Miller, Cohen, and Wiersma (1996); Block (1997).
fitimating Preventable Crime Under TIS 57
This document is a research report submitted to the U.S. Department of Justice. This reporthas not been published by the Department. Opinions or points of view expressed are thoseof the author(s) and do not necessarily reflect the official position or policies of the U.S.Department of Justice.

intangible losses (such as quality oflife) may also be valued in dollar t e r rn~ ,”~ though there is less agreement on the best method for accomplishing this. The CJRC drew on data provided by the Federal Bureau of Investigation (FBI), the Virginia State Police, National Council on Compensation Information, Jury Verdict Research, Inc., and the National Fire Incident Reporting System, to develop “a very conservative” estimate of the costs of crime (to victims) that would be prevented (or avoided) under TIS.
The CJRC’s approach drew extensively on the methods used by Miller and Cohen, and their associates, in a series of studies designed to measure the cost of crime.L18 CJRC identified and measured victim cost of crime by focusing on the following victim “cost centers:’’”9
Medical Costs were derived from the Detailed Claims Information (DCI) data- base of the National Council on Compensation Insurance. This database longitu- dinally tracks medical costs for injured persons. The injury distribution from Na- tional Crime Viccims Survey {NCVS) was then applied to the cost figures. Mental Health Costs associated with psychological injury were computed using a
study of 39 1 South Carolina victims (women) of violent crimes. The rate of injury
was then applied to “won” jury verdicts for emotional distress and severely dis- abling psychological injury. The rate that “psychological injury” occurs (as mea- sured by the PSI database) is roughly the same for both men and women - 33.5%. Emergency Response Costs were estimated at $144.00 per injury based on the National Medical Care Utilization and Expenditure Survey, 1980. This figure likely understates considerably the current costs of emergency response. Productivity Losses were estimated in the short and long terms. Short-term esri- mates were based on lost work days reported in the NCVS, combined with data on average daily earnings for those who work. For students (victims under age 1’3, the estimated value of lost school days (daily cost per pupil) was used. For long- term estimates, injury codes (ICDs) for victims of violent crimes were used in conjunction with reported hospital status times. Program Administration Costs were defined as the administrative costs of health and disability insurance. These were estimated by multiplying the costs of health and disability insurance by the percent reimbursed. Lost Quality of Life was estimated using rwo approaches: willingness-to-pay and jury awards for pain and suffering. Willingness-to-pay, typically assessed by means of a survey insuument,lZ0 measures the amount that people are willing to pay for day-to-day safety and to maintain their existing quality of life (defined across such dimensions as cognitive, mobility, sen- sory, and cosmetic that may be diminished by crime).
‘I7 Cohen (1988). ’I8 Miller (1990); Miller, Cohen, and Rossman, (1994); Miller, Cohen, and Wiersema (1996). ‘I9 Chabotar (1987). 12’ Mitchell and Carson (1989).
58 Tnth-in-Sentencing in Krp’nia
This document is a research report submitted to the U.S. Department of Justice. This reporthas not been published by the Department. Opinions or points of view expressed are thoseof the author(s) and do not necessarily reflect the official position or policies of the U.S.Department of Justice.

a Jury awards for pain and suffering are also used to estimate the lost quality of life resulting from crime. These are a function of medical care, productivity costs, category of injury, and mental health care related to emotional distress. Jury awards
are based on a standard of compensation that has been defined by the courts as “one which permits the jury to award a “fair” and “reasonable” amount that com- pensates for pain and suffering. This was measured by examining actual amounts awarded by juries. Data were taken from Jury Verdict Research, Inc., which col- lects award information on virtually all personal injury cases in civil proceedings. The company claims that it can predict court awards within + or - 7%.
-- Results of Cost Analysis The study of preventable crime under Proposal X forecasted compensatory dam-
ages by crime type based on the relationship between medical cost and productivity losses and jury awards. For example, the estimated cost (or value of a statistical life) for a murder was calculated as follows:
Medical ................................................... $6,467 Emergency Service ........................................ $520 Productivity ........................................... $656,192 Total Monetary ................................... $663,179 Mental Health ..................................................... 0
QualiryofLife ..................................... $1,715,918
Total Cost ........................................ $2,379,097
Based on the preventable crime and victim cost analyses, the commission estimated that the value of crime prevented by the implementation of Proposal X between 1995 and 2005 would yield a cumulative savings to victims and society of $2.7 billion. The trend line here shows the estimated victim costs (1989 dollars adjusted for inflation) associated with forecasted preventable violent and nonviolent crime, respectively, under Proposal X, 1995-2005.
Conclusions The cost analysis, based on a highly regarded methodology developed by Miller,
Cohen, and their associates, incorporated a number of elements designed to keep the estimates conservative. First, the cost estimates did not include a number of prevent- able crimes because cost data were not available. In addition, certain cost centers sug- gested by Miller, Cohen, and Wiersema’2’ were absent from the CJRCg estimates (e.g., sociallvictim services) due to a lack of data, while others (e.g., mental health cost esti- mates) are based on estimates that likely understate the true costs. Finally, lost quality of life is the largest cost component in the estimates and also the most difficult to measure. The use of both willingness to pay and jury awards are conservative and
Estimated Victim Costs’ Associated With Preventable Crime Under The Commission’s Plan, 1995-2005
Violent Crime $ Millions
2500
2000
1500
1000
500
0 L 1995 1997 1999 2001 2003 2005
Non-Violent Crime $ Millions
500 - - - - - - . - - - - - - - -
cnme is esiimated al$4400 mdkon
1995 1997 1999 2001 2003 2005
‘ 1989 dollars adpsted fcr inilati,
Miller, Cohen, and Wiersema (1996).
Ertimating Preventable Crime Under TIS 59
This document is a research report submitted to the U.S. Department of Justice. This reporthas not been published by the Department. Opinions or points of view expressed are thoseof the author(s) and do not necessarily reflect the official position or policies of the U.S.Department of Justice.

reduce concern over this source of measurement error. As a consequence, it appears that the CJRC approach produced an estimate that can be viewed as a lower-limit to
the costs of crime to victims avoidable by the implementation of TIS in Virginia. Additional analyses using the cost-savings estimates may have been useful to
policymakers. While a comprehensive benefit-cost analysis of preventable crime would be extremely difficult, a more limited comparison of the costs associated with ex- tended incarceration of offenders with the cost savings to victims and society could have been attempted. Extended incarceration, while increasing correctional costs, reduces court and law enforcement expenditures associated with arrests for prevent- able crimes. These additional savings to government, along with the savings to vic- tims and society, could be compared to the costs of extended incarceration and used, for example, to justifv new prison construction. While officials laid the groundwork for such a comparison, it was never actually conducted.
60 Truth-in-Sentencing in Virginia
This document is a research report submitted to the U.S. Department of Justice. This reporthas not been published by the Department. Opinions or points of view expressed are thoseof the author(s) and do not necessarily reflect the official position or policies of the U.S.Department of Justice.

CHAPTER SEVEN
A fundamental issue in evaluating Virginia‘s new TIS policies is their impact on the amount of new crime being committed in the Commonwealth. Although the major objective of TIS reform was to ensure more certain punishment and longer prison terms for violent offenders, policymakers also raised the difficult issue of “what impact the new sentencing system may be having Qn Virginia’s crime rate.”’** Have the new laws helped to deter some persons from committing new crime because of the knowl- edge of tougher penalties under TIS? Does incarcerating violent offenders for longer periods of time under TIS help reduce the chances that they will commit new crimes when they are eventually released from prison? This chapter examines one critical as- pect of the relationship between sentencing reform and the crime rate in Virginia: Has TIS helped reduce the level of offender recidivism in Virginia? Criminological research shows that a relatively large share of crime is committed by a small pool of known and repeat offenders. IfTIS policies are successful in reducing offender recidivism, then it is
likely that these policies will help reduce the crime rate generally. As a first step in assessing what, if any, impact TIS is having on the level of offender
recidivism, this chapter establishes the recent historical baseline of crime in Virginia. The second section discusses a new initiative-the Offender Notification Release Program-designed to inform offenders being released from prison about Virginia’s new sentencing laws. The final part of this chapter reviews the design of a long-range recidivism study and analyzes the pattern of recidivism for offenders released from prison prior to the implementation ofTIS.
-- k
The Current Level of Crime in Virginla Benveen 1993 and 1997, reported crime in Virginia declined. The overall rate of
“index crime”’23 in Virginia (per 100,000 population) dropped by over 8% from 4,210 in 1993 to 3,870 in 1977. While there was a slight increase in four of the index crimes berween 1976 and 1997, the rates of ail eight index crimes have de- clined over the past five years.
index Crlmes In Vlrghla, 1993-1997
1993 1994 1995 1996 1997
3,Qn 3,870
’” Virginia Criminal Sentencing Commission (1997), p. 73.
aggravared assault, burglary, larceny, motor vehicle theft, and arson. Index crimes are defined as murderhon-negligent manslaughter, forcible rape, robbery,
Assessing the lmpact of TIS on Recidivism el
This document is a research report submitted to the U.S. Department of Justice. This reporthas not been published by the Department. Opinions or points of view expressed are thoseof the author(s) and do not necessarily reflect the official position or policies of the U.S.Department of Justice.

Index Crime in Virglnia by Crime Type, 1993-1997 Percent Change
1993 1994 1995 1996 1997 1993-1997
-14 7 Forcible Rape 33 29 27 26 26 -19.2
133 122 124 -14.1
Aggravatd Assault 193 192 197 183 185 -4.0
602 582 562 ’ -17,O -. 2,832 2,785 2,767 2,744 2,657 -6.2
-4.4
Arson 33 34 33 29 31 -4.8
The cause of this dedine is dificult to interpret. On one hand, the dedine in the rate of violent crime in Virginia is in line with a pattern observed nationally. The rate of index crime in the United States has fallen from 5,483 in 1993 to 4,923 in 1997 sparking a debate over why and how long this trend will last. On the other hand, the implementation ofTIS in Virginia and a drop in the state crime rate raises the possi-
bility that the two events are related. The.issue of whether the drop in Virginia2 crime rate can be attributed to sentencing reform or some other combination of initiatives is complex and requires considerable longitudinal data that are simply unavailable at this time. The following sections of this chapter take important first steps in addressing this issue by examining an innovative new approach to reducing hture offender recidivism and establishing baseline recidivism measures for offend- ers released from prison prior to the TIS reforms.
Offender Notification Release Program A deterrence effect is one way for TIS to reduce recidivism in Virginia. It may be
that knowledge of the tough new penalties deters some previous offenders who would otherwise have broken the law again from committing new crimes, or at least certain types of crime. The criminological literature refers to this concept as specific deter- rence: the degree to which the threat or actual application of punishment will deter an individual who has committed a crime from engaging in crime again.”* The Offender Notification Release Program (ONRP) was developed in 1996 as a joint effort of the VCSC and the Department of Corrections (DOC) to educate inmates leaving Virginia prisons specifically about the TIS reforms. The program provides exiting inmates an overview of the sentencing system since the abolition of parole and the institution of tougher sentencing laws for violent and repeat offenders. On average, a returning violent offender sentenced under the new guidelines should expect to serve two to six times longer than under the state’s old law.
This concept is distinct from generaldeterrence, which is the degree to which knowledge of criminal penalties deters members ofthe general population, not just those convicted of crimes, from engaging in criminal behavior. General deterrence effects are very hard to measure be- cause of the difficulty of assessing the depth of knowledge people have of criminal punish- ments and what, if any, impact this knowledge has in preventing them from committing crime. At this time, the VCSC is not undertaking any study of general deterrence under TIS.
62 Twth-in-Sentencing in Krginia
This document is a research report submitted to the U.S. Department of Justice. This reporthas not been published by the Department. Opinions or points of view expressed are thoseof the author(s) and do not necessarily reflect the official position or policies of the U.S.Department of Justice.

The program has two purposes: 1) to inform inmates about to re-enter society of the changes in Virginia’s sentencing and parole laws, and 2) to reduce the likelihood of recidi- vism. A number of criminological studies of the deterrent value of new punishment initiatives have produced mixed results, with some researchers concluding that many offenders were unaware of the change in sanctions designed to influence their behavior. From a theoretical perspective, the VCSC and the DOC believe that the deterrent value of specific punishments under TIS might be increased if the targeted population (released inmates) is adequately informed of the new sanctions for hture misconduct.
As part of the offender notification program, all inmates leaving the prison system are given a cype of “exit interview” where they are informed about the abolition of parole and the old good conduct credit system. Each departing inmate receives a wd- let-sized “notification card” that contains the possible sentencing consequences of be- ing arrested and convicted of a new felony offense. The program became operational statewide in January, 1997. Virginia’s ONRP is the first of its kind in the nation.
The ONRP Process Each correctional facility in Virginia has a supply of white and yellow cards that
indicate the amount of time an offender can expect to serve if convicted of a new murder, rape, robbery, or aggravated assault after release from prison. White cards are given to inmates with a nonviolent record and the yellow cards are given to
inmates with a violent record. The two cards show different expected time-served amounts because sentences are increased for offenders with violent prior records. The time is compared with the average time served under the previous sentencing laws that allowed for early release on parole. The next page shows the front and back of the ONRP cards (redrawn from the originals).
The Community Release Unit located within the DOC Division of Operations determines which card the inmate will receive based on a review of the inmate’s record. This review is triggered in part on a form obtained from the Court and Legal Services Unit that predicts a release date based on good rime and parole eligibility (for those offenders serving sentences under the old parole system). The record re- view helps to determine if the inmate has any outstanding charges to answer, other . sentences to serve, or whether the inmate will be transferred out-of-state for similar reasons. In addition, the review identifies whether the inmate has a history of vio-
lence and therefore should receive a yellow card. All correctional facilities have been provided with a comprehensive list of all violent offenses. A “Notification of Release Post/Probation Supervision” form is then fixed to the facility indicating which card is to be assigned.
After the institution receives the DOC release information, correctional staff re- view the inmate’s on-site records to make sure the correct card is assigned. OEicials are required to give the card to the inmate as close to the day of release as possible, ONRP cards are handed out to inmates convicted of felonies who are classified as state responsible (rhose given state prison sentences of six months or more). This
Assessing the Impact of TIS on Recidivism 63
This document is a research report submitted to the U.S. Department of Justice. This reporthas not been published by the Department. Opinions or points of view expressed are thoseof the author(s) and do not necessarily reflect the official position or policies of the U.S.Department of Justice.

ONRP White Cad - Front
WARNING: Viiinia has abolished parole and inposed mudl longer prison sentences on crbrj-
m Virginia has made big changes in the way we sentence convicted criminals. Put Simply, IF YOU COMMIT A VIOLENT CRIME IN VIRGINIA IN THE FUTURE, YOU WILL LIKELY BE SENT BACK TO PRISON FOR A VERY LONG PERIOD OF TIME.
nalswithpastrecords.
I There is no more parole. The entire sentence bnposed by the judge or jury wili be served, with good time credits limited to five weeks per year at most.
I Most importantly of all, should you commit a burglary or any other vident crime you will serve FAR MORE HARD TIME than under the dd system. The back of this card shows some ex-
-amp& of the ACTUAL PRISON TIME you Wa face if you are convicted in Virginia.
I We expect you to obey the hws and build a productive life after release. But we want you to understand the very serious consequences if you commit future violent crimes in Virginia.
ONRP White Card - Eack
Actual Prison Tme to Serve Under Virginia’s Guidelines
These recommendations can be increased based on your prior record and the facts of the case.
of Conviction
First Degree Murder
serious Assault
Robbery
Rape
old System
11 Years
1,SYears
2 Years
5 Years
New No Parole System
28 Years - Life
3 Years - 9 years
5 Years - 14 Years
13 Years - 33 Years
ONRP Yellow Card - Back
Actual Prison Time to Serve Under Virginia’s Guidelines
These recommendations can be increased based on your priir record and the facts of the case.
Type of Conviction
First Degree Murder
Serious Assauk Robbery
Rape
Old System New No Parole W e m
11 Years
1.5 Years
2 Years
5 Years
50 Years - Life
6 Years- 9 years
9 Y e m - 14 Years
22 Years - 33 Years
64 Truth-in-Sentencing in Virginia
This document is a research report submitted to the U.S. Department of Justice. This reporthas not been published by the Department. Opinions or points of view expressed are thoseof the author(s) and do not necessarily reflect the official position or policies of the U.S.Department of Justice.

includes persons at work release centers but excludes those in local jails and the state boot camp (boot camp is considered a probation sentence).
DOC Response The Director of DOC informed all regional directors, wardens, and superinten-
dents of the ONRP implementation, stating:
“Issuing warning cards is a serious matter for all Department of Corrections em- ployees. The cards are designed to inform all inmates of the consequences of com- mitting future violent crime in Virginia. Inmates must be aware that in Virginia, they are likely to serve a much longer sentence fbr committing a violent crime. S& responsible for issuing the cards need to explain the card to the inmate. Counseling staffshould also spend time explaining the consequences of change in the sentencing guidelines prior to the inmate being released. When issued prop- erly the warning card can act as a deterrent to committing a future violent crime.” (DOC memorandum porn Ron Angebne, Director, December 3, 1936)
The director assigned the manager of DOC Classification and Records to oversee implementation and training for the ONRP program. Each institution, field unit, and work release center was required to send at least one representative to a training session conducted by officials from the VCSC. Training occurred at four regional locations with an average attendance of 30 people. Training sessions were short, with attendees being given general program information and working through some hy- pothetical release scenarios.
The NCSC evaluation team interviewed a number of individuals who work for DOC about the implementation of the ONRl? Support for the offender notification
concept was strong, with several recommendations made to enhance the overall ef- fectiveness of this program:
Provide a video tape explaining the ONRP to inmates. Several DOC managers at local facilities suggested a video tape to ensure a consistent and accurate explanation of the system. Inmates currently view videos on other matters, and those interviewed feel that an ONRP video could be easily integrated into existing release procedures. Provide ongoing training. Managers indicate the need for ongoing training on program goals and how best to administer the card. In particular, a process should be developed to inform new correctional officers of the program. Make it easier to get ONRP cards. Oficials at one institution have found it diffi- cult to keep an adequate supply of ONRP cards. They mentioned having to ask for cards from a nearby institution when their own supply ran out. Review the card more than once with exiting inmates. Oficials at several institu- tions stated that inmates were busy thinking of other things upon release, includ- ing living arrangements, transporcation from the facility, personal finances, etc. The ONRP card was seldom a high priority as offenders prepared to leave prison. Officials mentioned a strategy of reviewing the card several days prior to release and again at release to increase awareness of Virginia’s new sentencing laws.
Assessing the Impact of TIS on Recidivism 65
This document is a research report submitted to the U.S. Department of Justice. This reporthas not been published by the Department. Opinions or points of view expressed are thoseof the author(s) and do not necessarily reflect the official position or policies of the U.S.Department of Justice.

The VCSC and other’ policymakers are interested in determining whether the ONRP increases the potential deterrent effect ofVirginia’s sentencing reforms among offenders being released from prison. This issue will be examined as part of a broader two-phase study ofoffender recidivism in Virginia. The first phase establishes a baseline recidivism rate for a cohort of offenders who were released from prison before TIS and the ONRP went into effect (the cohort is composed of oflenders released in FY 1994). The second phase of the study (funds permitting) will begin at a yet-to-be- determined date and examine recidivism rates for offenders released after the imple- mentation of sentencing reform.
Recidivism in Virginia To determine whether TIS and ONW policies have affected offender recidivism,
project staff have established baseline recidivism rates for the offender population released from prison prior to the introduction of reform in January, 1995. The long- range plan is to compare the recidivism rate of offenders released pre-TIS (phase one) with the recidivism rate of offenders released post-TIS (phase two). The VCSC is now deliberating on when the second phase, measuring recidivism for those re- leased after exposure to TIS and the ONRP, should begin.
Sampling Methodology The baseline recidivism rate was developed by examining recidivism among a sample
of offenders released from the Virginia Department of Corrections in FY1993. The sampling frame was prepared as follows:
Offenders appearing on the release file who died in prison or were executed during FY1993 were excluded (53 cases).
Offenders who had previously been released from prison for the current incarcera- tion term (parole violators) were excluded (1,722 cases). The results of the analy- sis, therefore, reflect recidivism among offenders after their first release from prison for the current term of incarceration. Offenders imprisoned for offenses other than completed or attempted person, prop- erty or drug crimes (offenses such as habitual traffic, weapons, arson, gambling, conspiracy to commit a felony) were excluded (1,742 cases). Over half (54%) of the offenders excluded in this step were convicted of habitual t&c offenses and were imprisoned under Virginia’s 1 &month mandatory minimum penalty law. Offenders admitted prior to January 1, 1985, were excluded, since these cases predated the statewide standardization of the Pre-/Post-Sentence Investigation (PSI) report (243 cases). The PSI system will serve as the source of extensive prior record and socio-demographic data for the offenders included in the study sample. The offenders excluded in this step comprise less than 3% of released offenders remain- ing at this stage. Their exclusion affects a larger portion of the violent offense groups than the property and drug groups: 42% of the remaining murderers an2 26% of the remaining kidnappers were admitted to prison prior to 1985, com- pared to less than 1% of drug offenders.
66 Truth-in-Sentencing in Virgiinia
This document is a research report submitted to the U.S. Department of Justice. This reporthas not been published by the Department. Opinions or points of view expressed are thoseof the author(s) and do not necessarily reflect the official position or policies of the U.S.Department of Justice.

A disproportionate stratified random sample of 1,400 cases was drawn from the sampling frame (N= 8,089).
Offenders convicted of crimes against the person (murder, manslaughter, kidnap- ping, forcible rape/sodomy, robbery, assault, sexual assault offenses) were oversampled relative to their proportion in the sampling frame to comprise 50% of the sample cases (as seen in the table below). Within the person crime category, sampling was performed using proportionate stratification by offense group to ensure that the per- son offense groups are represented in the sample in the same proportions as they appear in the sampling frame. Offenders convicted of property offenses (burglary, larceny and fraud/forgery) and drug crimes have been undersampled relative to their proportion in the sampling frame to comprise the remaining 50% of the sample. As
with the person offenses, property and drug cases were sampled using proportionate stratification by offense group, such that the offense groups are represented in the sample in the same relative proportions as in the sampling frame.
Sampling Design
._
0.81 0.172
0.306 0.086
0.436
PERSON Murder/Homicide Manslaughter Kidnapping Forcible RapeiSodomy
Robbery
Assault Sex Offenses
0.172 0.306 0.086 0,436
PROPERTY AND DRUGS Burglary
-nY Fraud/Forgery
Drugs
Cases
98
74 66 114
480 526 202
1,123 1,997 564
2,845
ACTUAL whin Category Proportion
0.063 0.047 0.042 0.073 0.308 0.337 (3.129
Poplation Proportion
0.19
WtMn Category Proportion
0.063 0.047 0.042 0.073 0.308 0.337 0.129
SAMPLE Total Sample Pmpoei
0.500
0.500
Sample cases
700 44
33 30 51
216 236 90
700 121
214' 60
305
Once the sample was drawn, matching the sample cases to the automated PSI report data base was attempted, first by social security number (SSN) and offense, and, for cases unmatched by SSN, by CCRE (Central Criminal Records Exchange) number and 0f fen~e . I~~ Overall, 69.5% of the sample cases were matched success- fully, resulting in the ability to track 973 released inmates for evidence of recidivism.
''I Comparison of the matched and unmatched sample cases reveals no significant differences by offender race, gender, age at release, and number of prior prison terms served. However, five significant differences between matched and unmatched cases (p<.05) exist by offense group, judicial circuit, year of admission and number of prior Virginia felonies served. Post: sampling weighring was applied to ensure that the data set of matched cases accurately reflects the same distributions for offense.
Assessing the Impact of TIS on Recidivism 67
This document is a research report submitted to the U.S. Department of Justice. This reporthas not been published by the Department. Opinions or points of view expressed are thoseof the author(s) and do not necessarily reflect the official position or policies of the U.S.Department of Justice.

Due to incompatibility of data systems, the Virginia State P’olice agreed to provide hard copies of criminal history rap sheets from the Virginia Central Criminal His- tory information system for each of the 973 offenders in the sample. Next, a trained coder examined each rap sheet and recorded the recidivism data elements over a three-year period that began with their release from prison. Data collection forms were optically scanned, errors were detected and corrected, and a data file was pre- pared by VCSC s&.
Definlng Recidivism Numerous definitions of offender recidivism have been employed to measure the
fiequency and extent of repeated contact with the criminal justice system. There is no single or “correct” definition of recidivism; the choice depends on the issue of interest. Potential definitions include rearrest for any new crime, re-arrest for a specific type of new crime (e.g., identical offenses, felony offenses) re-convictions for any or for specific types of new crime, re-incarcerations, time to new arrest, etc. In addition, recidivism measures are used to analyze deterrence and incapacitation effects generally as well as to assess the risk posed by individual offenders. For example, sentencing guideline sys-
tems always include prior criminal record in the sentencing calculation and will typi- cally impose a harsher sanction on offenders who have recidivated. Project staff gath- ered the following information on 30 kctors relevant to measuring different aspects of recidivism.
Re-Arrest Measures Any new arrest - yeslno Date of 1st non-felony arrest Date of 2nd non-felony arrest Dace of 1st felony arrest Date of 2nd felony arrest Number of misdemeanor arrests Number of felony arrest events Number of felony arrests - person Number of felony arrests - property Number of felony arrests - drug Number of felony arrests - other Arrests outside Vi4 - yeslno All arrests outside VA- yeslno
Re-Conviction Measures ,
Any conviction - yeslno Date of 1st non-felony conviction Sentence for 1st non-felony conviction Date of 2nd non-felony conviction Sentence for 2nd non-felony conviction Date of 1st felony conviction Sentence for 1st felony conviction Date of 2nd felony conviction Sentence for 2nd felony conviction Number of misdemeanor convictions Number of felony conviction wents Number of felony convictions - person Number of felony convictions - property Number of felony convictions - drug Number of felony convictions - other VCC code of conviction offense Returned as technical violator
From this extensive set of information, four different measures of the frequency of offender recidivism and the extent of penetration of a new criminal act into the justice system were calculated: rn Any new arrest rn Any new felony arrest rn Any new conviccion
Any new felony conviction
68 Truth-in-Sentencing in Virginia
This document is a research report submitted to the U.S. Department of Justice. This reporthas not been published by the Department. Opinions or points of view expressed are thoseof the author(s) and do not necessarily reflect the official position or policies of the U.S.Department of Justice.

Basic ''quality of dad issues are assodated with both re-mest and reanviaion measures. D The most inclusive measure-"any new arrest"-is commonly used by researchers to
gauge recidivism and includes apprehensions for most crimes including misdemeanors and felonies. In Virginia, however, not every arrest will show up in the Virginia Central Criminal History (CCH) information system. For example, arrests for drunk in pub- lic, vagrancy, and other local ordinance violations that are not usually subject to jail time will not be included on the rap sheet. Consequently, recidivism as measured by any new arrest will result in some undercounting. On the other hand, the use of arrest may also overcount recidivism because some people who are arrested are released with- out being chacged or ultimately found to be innocent by the court.
a Recidivism measurement that relies on conviction is also subject to questions of interpretation. One issue emerges due to plea bargaining: How does one count a criminal event that is originally charged as a felony but is subsequently reduced to a misdemeanor or even dropped entirely? Moreover, conviction measures often result in some undercounting because case dispositions are not always reliably and fully documented in case records. Project staff believe these potential concerns only minimally affect the results of
the analysis.
Measuring Recldivism in Virginia: A Multivariate Statistical Approach
A two-stage approach is used to conduct a preliminary analysis of recidivism for offenders released from prison prior to the implementation of TIS. In this section, the statistical technique of logistic regression is used to analyze the extensive set of defendant-related variables in the recidivism database discussed above. The goal is to determine which of the many potentially important factors do the best job of "ex- plaining" the likelihood of recidivism. Once the most influential factors are identi- fied, the next section employs a graphical analysis to illustrate the association among many of the most significant factors and the various measures of recidivism.
The Statistical Model.
Whether an individual released from prison will recidivate with a new arrest or a new conviction is very difficult to predict with any degree of certainty. However, it is
possible to reasonably estimate the probability of recidivism by examining the statis- tical relationship between the characteristics of the person being released and their observed pattern of recidivism. The likelihood of recidivism is known to be influ- enced by factors such as age, race, gender, type of offense, and offense history (Gendreau, Little and Goggin, 1996).'" The following table shows the eleven vari- ables that were included in the current study because of their strong potential to predict recidivism.
Iz6The Gendreau, Little, and Goggin study provides a convenient distillation of much of our cumulative knowledge of the factors associated with adult recidivism and provides juscifica- tion for many of our choices of predictor variables. They used meta-analytic techniques to
Assessing tbe Impact of TIS on Recidivism 69
This document is a research report submitted to the U.S. Department of Justice. This reporthas not been published by the Department. Opinions or points of view expressed are thoseof the author(s) and do not necessarily reflect the official position or policies of the U.S.Department of Justice.

Predictors of Recidivism Measurement Meansor Standard
Variable Name Levels Explanation Percentages Deviation
Race 0 = Non-Whie Race of released 0=34.7% 1 = Whiie inmate 1=65.3%
IncarFration Offense 1 = Perm Type of off erne 1=19.3% 2 = Property for which inmate 2=45.2% 3 = Druas was institutionalized 3=35.2%
Legal Satus 0 = No legal status Whether inmate 0=56.5% I = Legal Status had an official 1=43.5%
legal status with the court (e.g., probation or parole) at the time of the incarceration offense
Felony Events Number of felony Number of prior 1.22 1.65 sentencing events (to incarceration offense)
sentenchas for felonies
misdemeanors misdemeanor convictions
determine which variables were the best predictors of adult offender recidivism. One hundred and thirty-one studies produced 1,141 correlations with recidivism. They found significant ‘’mean effect sizes” for age, race, gender, and adult criminal history (in this study measured by criminal specialization, number of prior felony sentencing events, number of prior felony convictions resulting in incarceration, and number of misdemeanor convictions). Their meta-analysis also provides hrther confirmation of prior narrative reviews (e+ Gottfredson, 1987) which identi- fied these variables as significant and potent predictors of recidivism. Gabor (1 986), Gottfredson and Gottfredson (19851, Gottfredson (1987), and Wilbanks (1987) review studies that found juvenile record, type of incarceration offense, length of the prison term, and legal status at the time of the incarceration offense to be imporrant predictors of adult recidivism. 12’ Means are reported for variables measured with continuous scales while percentages are reported for nominal scale variables. ”* Standard deviations are reported for variables measured with continuous scales.
70 Tmth-in-Sentencing in Wrginia
This document is a research report submitted to the U.S. Department of Justice. This reporthas not been published by the Department. Opinions or points of view expressed are thoseof the author(s) and do not necessarily reflect the official position or policies of the U.S.Department of Justice.
A statistical model is developed to compare and conttast how these multiple de- fendant-related characteristics interact to explain recidivism. Such an analysis is nec- essary to control simultaneously for the influence of this set of factors (called inde- pendent or predictor variables) on the likelihood of recidivism. This statistical tech- nique enables one to discern the unique contribution of each of the individual inde- pendent variables in explaining variation in recidivism rates (called the dependent variable). The multivariate analysis technique used in the present study is logistic regression, appropriate for use with dichotomous dependent variables. All four mea- sures of recidivism, the four dependent variables, are dichotomous because they each have only two values: “one” if the inmate recidivated in the manner described or ‘‘zero” if they did not.
.-
The results of the regression analysis and the variables that are statistically signifi- cant in explaining each type of recidivism are displayed in the table on the next: page. The entries in the table are the regression coeficients (called logits in logistic regres-
sion) for each independent variable. The coefficients indicate the relative influence of each independent variable on rhe probability that an inmate will recidivate in the manner prescribed. A positive coeficient indicates that larger values of the indepen- dent variable are associated with an increased probability of recidivism, while a nega- tive coefficient indicates a diminished probability of recidivism.
Overall Significance.
The last row of the table shows the overall success of each model in correctly distinguishing whether an offender will recidivate (ie., the percentage of cases cor- rectly predicted by the This percentage is compared to the “null hypoth- esis“, defined as the most frequent outcome within each measure of recidivism.I3’ Notice chat the regression model predicting new arrests (within three years of release)
considerably improves on our ability to identify the offenders most likely to recidi- vate over chance alone (66% vs. 51%). In addition, the ability of the regression models to improve on chance when classifying inmates as recidivists or nonrecidivists diminishes as criteria for recidivism becomes more stringent. While the models im- proved on the probability of correctly classifying inmates (relative to chance) by 15 percentage points when the criteria was simply a new arrest, improvement declined to seven percentage points when the criteria was stiffened to a new felony arrest. Our ability to improve on chance when classifying inmates as having a new conviction
129The primary measures of ‘goodness of fit’ are displayed at the bottom of the table.The most frequently used indicator in logit is called the ‘-2 log likelihood.’ Based on this measure, the models are significant. In this case, the -2 log likelihoods are Chi-square variates with 16 degrees of freedom (because there are 16 explanatory variables in this model). It is the analog of the F-statistic in linear regression and tests the hypothesis that all of the coefficients are equal to zero. The table shows that each model meets the standard of significance, thereby leading to a rejection of the null hypothesis, indicating that each model fits their particular measure of recidivism well. I3’That is, in about 39% ofthe cases in our sample, the offender wasarrested for a new felony offense, meaning that in about 61 % of the cases there was no new felony arrest. Therefore, the null hypothesis or best guess would be to predict no new felony arrest and be right about 61% of the time.
Asmsing the Impact of TIS on Recidivism 71
This document is a research report submitted to the U.S. Department of Justice. This reporthas not been published by the Department. Opinions or points of view expressed are thoseof the author(s) and do not necessarily reflect the official position or policies of the U.S.Department of Justice.

between 3-4 Yo, while the model provided no improvement on the ability to predict new Felony convictions. These results are not unexpected since the ability to predict can
be expected to decrease as the probability of the phenomenon being predicted decreases.
The kdivldual Factors.
Essentially the same independent variables are significant in explaining recidivism for a "new arrest," "new felony arrest," and "new conviction." These defendant char- acteristics indude Age,13' Race, Gender, Incarceration Offen~e,'~' Number of Prior Felonies Served,'33 Number of Prior Misdemeanors, and whether the inmate had a
Juvenile Record. The model describing "new felony convictions" varied from the other three in that
Gender, Juvenile Record, and Prior Misdemeanors are not significant, but the Num- ber of Prior Felony Sentencing Events is significant. In predicting the likelihood of a
'new felony conviction," measures related to offense seriousness and prior felony sentencing history emerge as most significant. The independent variables LOS, Le- gal Status, and Specialization were not related to probability ofrecidivism for any of the measures, nor was there ever a difference in the probability of recidivism for drug offenders relative to person offenders.
Logistic Regression Results
Variable Name New Arrest New Felony New New Felony
Age :13s
Measures of Recidivism134
Arrest Conviction Conviction
22-24 -0.675** -0.619" -0.423 -0.431 25 - 29 -0.782*'* -0.878''' -0.424 -0.648" 30 - 34 -0.903*** -0,763"' -0.289 -0.482 35 - 39 -1.361'** -1.342'" -0.689" 1.1 51 '" 40 + -1.450*** -1.490'" -1.199- 1.658"'
Race -0.876"' -0.958'" -0.711*** -0.65?**' Gender 0.866*** 0.598'' 0.821tW 0.390 Incarceration Offense :I3
Property 0.382' 0.462** 0.375' 0.529'' Drugs 0.311 0.221 -0.054 0.228
LOS -0.001 -0.001 -0.005 -0.001 Legal Status -0.019 -0.004 0.151 -0.004 Specialization -0.009 0.006 -0.014 -0.020 Felony Events 0.011 0.024 0.022 0.129*' Felonies Served 0.526'** 0.328"' 0.313" 0,234' Misdemeanors 0.050"' 0.037'" 0.055 0.020 Juvenile Record 0.324" 0.308'' 0.335** 0.231 Constant -0.405 -0.547 -1.297*** -1.478*'* -2x LLR 1112.468*'* 1092.489"' 1054.122*" 885.607"' % C O ~ T ~ C ~ (% Null) 66% (51%) 68% (61%) 69% (65%) 77% (77%) * Significant at the .10 level (p.10) ** Sign%car?t at the .05 level (pc.05) "*Significant at the .Oi level (pc.Ol)
Inmates aged (35-39) and (40 +) were dwap less likely to reddivare than inmates aged (14-21); inmates aged (25-29) wem less likely to recidivate than inmates aged (1621) f$r all the measures except "new canvictions;" and inmates aged (22-24) and aged (30-34) were less likely to be a r d or d bra felony offense than inmates aged (14-21), but not to be wnvicted or wnvicped ofa felony o h .
Pmperty Offenders were ahnays more likely to recidivate than Person O&nden. The more times an inmate had been incarcerated fbr Wony ofknses, the more lWy they were to
recidivate. ''' Within three years after release.
Compared to Age 14-21. Compared to Current Offense: Person.
72 . Truth-in-Sentencing in Viq+nia
This document is a research report submitted to the U.S. Department of Justice. This reporthas not been published by the Department. Opinions or points of view expressed are thoseof the author(s) and do not necessarily reflect the official position or policies of the U.S.Department of Justice.

As another means of interpretation, this section graphically summarizes the results of an analysis that examined the bivariate relationships between many of the of- fender characteristics found to be significant in the preceding multivariate analysis.
Half (49.3%) of all inmates released from Virginia prisons in 1993 were re-arrested for any new crime within three years. The number of persons who recidivate drops quickly as the measure of recidivism becomes more conservative (e.g., of those re- leased from prison, 22.4% were reconvicted of a new felony).
Overall Recidivism Rates Across Four Measures The analysis covers 962 offenders released from prison in 1993, recidivism was tracked for a period of three years. -- $
Re-arrested - 49.3%
Reconvicted 1- 35.4%
Rearrested - Felony - 39.6%
Reconvicted - Felony - 22.4%
D In general, males are more likely to be re-arrested and more likely to be recon- victed than females, and nonwhites have higher rates of recidivism than whites.
Recidivism Rates by Gender
Re-arrested
Re-arrested - Felony
Reconvicted
Reconvicted -Felony
Recidivism Rates by Race
Re-airested
Re-arrested - Felony
Reconvicted
Reconvicted - Felony
56%
1 whner - 26% I mks
Assessing tbe lmpact of TIS on Recidivism 73
This document is a research report submitted to the U.S. Department of Justice. This reporthas not been published by the Department. Opinions or points of view expressed are thoseof the author(s) and do not necessarily reflect the official position or policies of the U.S.Department of Justice.

Recidivism, if it does occur, is likely to happen sooner rather than later. For those who recidivate, the average time until first re-arrest for any crime was 12.6 months, with 750/0 recidivating within 19 months. As shown in the bottom area chart, for those inmates re-arrested for a felony, 56% come back within one year.
For Those Who Recidivated, Average Time From Release to Re-Amst
75% Mean Recidivated within: -
Time to first re-arrest 12.6mo 9.9mo 19.1 mo Time to first felony rearrest 13.6 mo 10.2 mo 21.5 mo
(
For Those Who Recidivated, T i e to Re-Arrest
Re-arrested for any Crime
60% within 12 months -...__.
3 6 9 12 15 18 21 24 27 30 33 36
Months
Re-arrested for Felony
56% wthin 12 months ___-....__..._..__._.~~..~.~~~~......
15%
10%
5%
0% . . . . . . 3 6 . 9 12 15 18 21 24 27 30 & 36
Months
74 Truth-in-Sentencing in Vi'rginia
This document is a research report submitted to the U.S. Department of Justice. This reporthas not been published by the Department. Opinions or points of view expressed are thoseof the author(s) and do not necessarily reflect the official position or policies of the U.S.Department of Justice.

a Inmates released for property and drug offenses are more likely to recidivate as compared to violent (person crimes) offenders. However, regardless of the original offense, the percent of inmates recidivating stair-steps downward based on the re- cidivism measure used (re-arrest, felony re-arrest, reconviction, or felony reconvic- tion). For example, the bar chart shows that 42% of inmates originally incarcerated for a violent crime were re-arrested for any crime, 32% were re-arrested for a felony, 28% were reconvicted, and 16% were reconvicted of a felony.
Four Measures of Recidivism
Originally Incarcerated for
New arrest ~- 42%
New conviction -28% New felony arrest - 32% Person
New felony conviction =16%
New arrest -152% Property New felony arrest ,- 44%
New conviction - 41% New felony conviction - 27%
New anest - 50% mug New felony arest - 38%
New conviction - 32% New felony conviction -20%
I I I I
0% 20% 40% 60%
Assessing the impact of TIS on Recidivism 75
This document is a research report submitted to the U.S. Department of Justice. This reporthas not been published by the Department. Opinions or points of view expressed are thoseof the author(s) and do not necessarily reflect the official position or policies of the U.S.Department of Justice.

n One issue raised during the debate over TIS reform was whether offenders who recidivate tend to follow a consistent criminal path (Le., do violent offenders who recidivate tend to commit additional violent crime?). The analysis shows that while violent offenders had lower recidivism rates overall, those who were re-arrested were most likely arrested for a violent crime (32% were re-arrested for a violent crime com- pared to 13% for property crime, 14% for drug crime). Likewise, persons released for property crime were most likely to be re-arrested for another property crime (74%) and drug offenders were most likely re-arrested for another drug crime (59%).
Are prsons released from prison likely to be re-arrested for the same type of felony offense for which they were wiginally incarcerated?
Originally Incarcerated for
New Person - 32%
New Drug - 14% New Other - 16%
I person New Property = 13%
New Person - 44% Property New P r o m 74%
New Drug 28% New Other 57%
New Person 25% Dnrg New Property 13%
New Drug - 59% New Other - 27%
r I I T
0% 20% 40% 60% 80%
76 Tntb-in-Sentencing in Virginia
This document is a research report submitted to the U.S. Department of Justice. This reporthas not been published by the Department. Opinions or points of view expressed are thoseof the author(s) and do not necessarily reflect the official position or policies of the U.S.Department of Justice.

Examining the release cohort by offense, those originally incarcerated for larceny had the highest recidivism rates, -both in terms of re-arrest (47%) and reconviction (30%). Larceny was followed by burglary, fraud, assault, and drugs. Released in- mates least likely to be re-arrested or reconvicted were those incarcerated for kidnap- ping, sex offenses (not including serious sexual assaults), manslaughter, and murder.
Two Measures of Recidivism
Originally Incarcerated for 4 ~ e w fdmy arrest
New felony convicton I .-
Murder .s% 22%
Manslaughter 22%
Kidnapping 14%
Rape
Robbery
Assault 39%
Sex menses 17%
Burglary
Larceny 47%
Fraud
Drugs
I I I I I v 0% 10% 20% 30% 40% 50%
Assessing the impact of TIS on Recidivism 77
This document is a research report submitted to the U.S. Department of Justice. This reporthas not been published by the Department. Opinions or points of view expressed are thoseof the author(s) and do not necessarily reflect the official position or policies of the U.S.Department of Justice.

Re-Amled for a New Crime
Age upan pnson release
14-21 -64% 22-24 -50% 25-29 - 51 %
30-34 -50% 35-39 -43%
40t -:42% -
Reconvicted for a New Crime
14-21 -42%
22-24 - 32%
25-29 -37%
30-34 -40% 35-39 -36%
4C-t -26%
fenders recidivate at higher rates than old offenders. Released offenders less than 21
years of age had a 64% recidivism rate for any new crime, roughly 14 percentage points higher than those ages 22-34. Offknders who were less than 21 years of age at
time of release were three times more likely to be reconvicted of a new felony crime when compared to older offenders (those over the age of 40). rn The frequency of past criminal behavior is a good indicator of hture criminal behavior. Data were examined that measured the number of prior felony sentencing events an offender had before their incarceration for the released offense. Offenders with a history of felony convictions were much more likely to recidivate across all
four measures. The relationship between criminal history and recidivism was even more pronounced when examining the seriousness of past criminal behavior. Seri- ousness was defined as the number of prior felony convictions that resulted in a period of incarceration. For those who had served no prior periods of incarceration, 44% were re-arrested for any new crime. O n the other hand, eight out of ten (79%) of those with three prior terms of incarceration were re-arrested for a new crime. The bars show a clear stair-step when examining the number of prior incarcerations for each recidivism measure.
Re-Arrested for a New Felony Crime
14-21 -55%
22-24 1-41% Recidivism Rates Across Four Measures: Examining Prior Felony Sentences Resulting in incarceration
Number of prior felony sentenc6s result ig in
25-29 -39%
30-34 1- 42%
35-39 - 33%
40t 0 32% incarceration: I None lone Two @Three
Reconvicted for a New Felony Crime
14-21 -31%
22-24 - 23%
25-29 - 22%
30-34 - 28%
35-39 - 19%
40t =12%
Re-arrested for a New Felony Crime
I? 25 68%
Rmnvicted for a New Felony Crme
42%
The pre-TIS data collected as part of the recidivism analysis will now serve as tht baseline for measuring recidivism for those released during TIS.
78 Truth-in-Sentencing in Vi?p'nia
This document is a research report submitted to the U.S. Department of Justice. This reporthas not been published by the Department. Opinions or points of view expressed are thoseof the author(s) and do not necessarily reflect the official position or policies of the U.S.Department of Justice.

CHAPTER EIGHT
Conclusion
Virginia embarked on a major program of sentencing reform early in 1994. These reforms, collectively called “Truth-in-Sentencing” (TIS), became effective on Janu- ary 1, 1995, and substantially increased prison terms for violent and repeat offend- ers, abolished parole (except for chose already under sentence), and reduced good timeallowances so that newly sentenced offenders would be required to serve at least 85% of their imposed sentence. Virginia was not alone in this regard. The 1994
federal Violent Crime Control and Law Enforcement Act authorized incentive grants to the states in part for implementation of TIS laws, and by 1999, 27 states had adopted the 85% rule. However, Virginia is one of just eight states and the federal government that apply TIS to both violent and nonviolent offenders.
This evaluation traces the evolution of sentencing reform in Virginia since 1980, describes how TIS has been designed, discusses its impact on prison population and prevention of crime in the state, and begins an analysis of recidivism before and after TIS. The knowledge gained through this study is primarily designed to benefit Vir- ginia policymakers and practitioners interested in an objective analysis of the new sentencing reforms in their state. However, given the ongoing interest nationally in TIS and the abolition of parole, this evaluation has been designed and written to
clarify how sentencing reform efforts could be improved if iniriated in other states.
-
Lessons Learned Five primary policy implications emerge from this evaluation. The first concerns
the comprehensive, inclusive, and ultimately effective process of reform used in Vir- ginia. The remaining four implications focus on the rigorous, empirically-based strat- egy used in Virginia to assess the impact of sentencing reform. 1. Manuging the process of reform. What is most striking to the NCSC evaluation
team is that since the early 1980s, even in a highly charged political environment, sentencing reform has occurred in Virginia through a‘reasonably well-planned pro- cess influenced heavily by data analysis. The initial impetus for reform was based on the belief that judicial sentences were widely disparate, resulting in perceived injus- tices. A I982 task force recommended the development of historically based de- scriptive sentencing guidelines. As a result, a statewide database of felony sentencing was created, a study of sentencing disparity was commissioned by the Chief Justice of the Supreme Court, and, in 1987-88, sentencing guidelines (entirely voluntary, with no appellate review allowed) were developed. These guidelines were pilot tested in six judicial circuits between 1988 and 1990. An evaluation of the pilot project showed that implementation of the voluntary guidelines had reduced sentencing disparity, and that the judges involved believed that consistency and neutrality had been improved while sentencing discretion had not been adversely affected. Accord-
Conclusion 79
This document is a research report submitted to the U.S. Department of Justice. This reporthas not been published by the Department. Opinions or points of view expressed are thoseof the author(s) and do not necessarily reflect the official position or policies of the U.S.Department of Justice.

in& the guidelines weie adopted statewide beginning in 1391, and were revised on an annual basis to continue to reflect the most current sentencing decisions handed down by judges and juries. By the 1993 election, guidelines were being used in Virginia under judicial control with an average compliance rate of 76%.
Newly elected Governor Allen moved quickly to convene a Commission on Parole Abolition and Sentencing Reform, and the recommendations of that com- mission, as well as those of a competing legislative commission, were considered at a special session of the Virginia legislature in 1994. The result was the enactment of TIS legislation that abolished parole, reduced good time credits to a maximum of 54 days per year, provided for a period of supervision following release, and required felony offenders to serve at least 85% of their imposed prison terms. In fact, it is currently estimated that offenders will serve between 88% and 92% of the imposed term. The structuring of the guidelines and the 85% requirement have achieved the dual legislative and executive goals of dramatically increasing prison time for violent offenders while virtually guaranteeing predictability of imposed sentences compared to actual time served.
The Virginia experience highlights the importance of ongoing planning and analysis when confronting reform of an emotional and politically charged issue such as sen- tencing. Sentencing reform did not just happen in Virginia. Reform occurred through a ten to twelve year process that included all three branches of government and was supported by periodic analyses and evaluations. Regardless of one's philosophical belief about the purposes and goals of sentencing, the process worked in that it achieved a significant measure of predictability in sentencing, reduced disparity in large measure, and, responding to public demand, increased prison t i e for violent and repeat offenders.
2. Intpact of TIS on *on population. The impact of TIS legislation on Virginia's correctional resources was a source of early concern to state lawmakers. The VCSC took seriously its charge by the Virginia General Assembly to examine the impact of numerous alternatives to implementing TIS by developing a sophisticated simulation forecast model (Criminal Justice Research Center @Risk model). The model was de- signed to simulate judicial decisionmaking and the demand for prison beds specifically within the context of the new TIS guidelines. The program has the flexibility to model a wide variety of alternative sentence ranges and recommendations.
The original forecasts proved to be inaccurate because of errors in two basic assumptions: (1) declining arrests for violent crime and (2) slower than expected growth in total arrests. However, because the simulation model itselfwas compre- hensive and conceptually sound, the basic assumptions could be altered and the forecasts re-estimated. The bottom line is that Virginia made the investment in a
valid simulation model to estimate the impact of sentencing reform on the expen- sive resource of prison space.
3. j k a & M c o t i z p k e with g@ktm. Mrginia uses compliance rates as a key measure of sentencing guideline performance and makes the results public on a regular
80 Tmtb-in-Sentencing in Krginia
This document is a research report submitted to the U.S. Department of Justice. This reporthas not been published by the Department. Opinions or points of view expressed are thoseof the author(s) and do not necessarily reflect the official position or policies of the U.S.Department of Justice.

basis. High levels of statewide Compliance indicate that sentences are being meted out consistently and, as a consequence, reduces concern over unwarranted sentencing dis- parity. In addition, high mmpliance rates, especially in a volunrary setting like Virginia, indicate judicial acceptance and approval of &e sentencing recommendations. In 1998, compliance rates were 83% in terms ofdispositional compliance (type of sentence), and 76% in terms of durational compliance (length of sentence). The overall compliance rate is 75% for over 42,000 cases sentenced between January, 1995 and March 30, 1998. The aggravation rate (sentences more severe than the guidelines) is currently 13% (generally homicide and sexual assault cases) and the mitigation rate (sentences less severe than the guidelines) is 11% (generally rape and burglary cases). Since 1994, judges have been requited to articulate their rea- sons for departure from the guidelines. The most common mitigation reasons have been the availability of an alternative sanction or community punishment; for aggravation reasons, judges most often cite historic criminal lifestyle and previ-
ous conviction for the same offense.
--
4. Preventable crime estimates under TIS. Virginia’s General Assembly wanted to
know how the extended incapacitation of violent offenders under TIS would af- fect crime rates. Specifically, they asked for information on how Virginians would benefit from locking up violent offenders for longer periods of time. Is the cost associated with giving certain offenders lengthier sentences justified through a re-
duction in the amount of crime they might otherwise commit if they had been released earlier? Is there a beneficial “incapacitation effect” associated with TIS? Certainly attempting to answer such questions is speculative because there is no generally accepted method for determining the amount of crime prevented through
longer prison sentences. Moreover the analytic techniques are complex and can be rather mysterious to the layman. However, the VCSC deserves credit for taking on the challenge and attempting to quantify an important aspect of the impact of sentencing reform. Other states may wish to build on the thoughtfully conceived approach employed by Virginia. The approach benefits from making the most out of available data and producing estimates that are conservative in nature.
5 . Impact on recidivism. A critical issue confronting Virginia’s move to TIS was whether the reform would reduce the level of offender recidivism in Virginia. Criminological research shows that a relatively large share of crime is committed by a small pool of
known and repeat offenders. If TIS policies are successful in reducing offender re-
cidivism, then it is likely that these policies will help reduce the crime rate generally. Other states may wish to consider both Virginia’s efforts to inform inmates exiting the prison system about changes in the state’s sentencing laws and the long-term strategy for measuring offender recidivism. First, the Offender Notification Re- lease Program (ONRP) was developed in 1996 as a joint effort of the VCSC and the Department of Corrections (DOC) to educate inmates leaving Virginia pris- ons specifically about the TIS reforms. The program provides exiting inmates an overview of the new sentencing system that abolishes parole and increases time
Conclusion 81
This document is a research report submitted to the U.S. Department of Justice. This reporthas not been published by the Department. Opinions or points of view expressed are thoseof the author(s) and do not necessarily reflect the official position or policies of the U.S.Department of Justice.

served for violent and repeat offenders. On average, a returning violent offender sentenced under the new guidelines should expect to serve two to six times longer than under the state’s previous guidelines system.
Second, to determine whether TIS and ONRP policies have afFected offender recidivism, baseline recidivism rates have been calculated for the offender popula- tion released from prison prior to the TIS reforms. The long-range plan is to compare the recidivism rate of offenders released pre-TIS (phase one) with the recidivism rate of offenders released post-TIS (phase two). The VCSC is now de- liberating on when the second phase, measuring recidivism for those released afier
..exposure to TIS and the ONRP, should begin.
The NCSC evaluation team believes that one of the best design decisions made by policymakers in Virginia was the retention of sentencing guidelines. The benefit of the sentencing guideline approach is that it allows for a more accurate assessment of the likely impact of a change in sentencing and/or parole policy. Guidelines systems are arguably the most cost-effective means of providing rational structure, relevant data, and the ability to accurately monitor and forecast sentencing outcomes.
f
82 Tmth-in-Sentencing in Virginia
This document is a research report submitted to the U.S. Department of Justice. This reporthas not been published by the Department. Opinions or points of view expressed are thoseof the author(s) and do not necessarily reflect the official position or policies of the U.S.Department of Justice.

Bibliography
@Risk Version 3.0. Palisade, Inc., Newfield, NY.
Austin, J., S. Cuvelier, and A. McVey. 1992. “Projecting the Future of Corrections.” Crime and Delinquenry 38 (3): 285-308.
Austin, J., and J. Irwin. 1993. Does Imprisonment Reduce Crime? A Critique of “Eo- doo” Criminoloa. San Francisco: National Council on Crime and Delinquency.
Baird, C. 1993. “The ‘Prison Paf Studies: Research or Ideology.” NCCD Focus (March): 1-7.
--
Block, M. 1997. “Supply Side Imprisonment Policy.” In F. Zimring and M. Block, Two Views on Imprisonment Policies. Research report. Washington: National Institute of Justice.
Blumstein, A,, J. Cohen, and D. Farrington. 1988. “Criminal Career Research: Its Value for Criminology.” Criminology 26 (1): 1-36.
Bowerman, B., and R O’Connell. 1993. Forecasting and Time Series: An Applied Approach. Belmont, Calif: Duxbury Press.
Bureau o f J u s t i c e P . 1996. “National Assessment of S d Sentend& (February).
Chabotar, K. 1987. “Analyzing Costs in Courts.” Washington: National Institute of Justice Issues and Practices.
Cohen, J. 1986. ‘‘Research on Criminal Careers: Individual Frequency Rates and Of- fense Seriousness.” In A. Blumstein, J. Cohen, J. A. Roth, and C. A. Visher, eds., Criminal Careers and “Career” Criminah: El. 1. Washington: National Academy Press.
Cohen, J. 1978. “The Incapacitative Effect of Imprisonment: A Critical Review of the Literature.” In A. Blumstein, J. Cohen, and D. Nagin, eds., Deterrenceand Inca- pacitation: Estimating the Effects of Criminal Sanctions on Crime Rates.
Cohen, M. 1988. “Pain, Suffering, and Jury Awards: A Study of the Cost of Crime to Victims.” Law and Society Review 22: 537-55.
Commission on Sentencing and Parole Reform. 1995. “Report of the Commission on Sentencing and Parole Reform.” Richmond, VA.
Creech, J. 1997. “Summary of Inmate Simulations in Virginia.” Working paper, Virginia Sentencing Commission, Richmond, VA.
Criminal Justice Research Center. 1994a. Ertimated Costs OfRecidivism in Virgnia. Richmond, VA.
Criminal Justice Research Center. 1994b. State Responsible inmate Population Fore- cats 1995-2005. Richmond, VA.
Criminal Justice Research Center. 1994~. Study of Preventable Crime Under the Commission> Plan: Review ofkfethohjoo. Richmond, VA.
Department of Public Safety. 1997. Inmate Population Forecats: FY 1998 to FY2007. Richmond, VA.
DiJulio, J. 1990. Crime and Punishment in Wisconsin: A Survey of Prisoners. Milwau- kee, WI: Wisconsin Policy Research Institute.
Bibliography 83
This document is a research report submitted to the U.S. Department of Justice. This reporthas not been published by the Department. Opinions or points of view expressed are thoseof the author(s) and do not necessarily reflect the official position or policies of the U.S.Department of Justice.

Ditton, Paula, and Doris Wilson. 1999. Truth in Sentencing in State Prisons. BJS Special Report (January).
Flango, V., and B. Ostrom. 1996. Assessing the Needfir Judges and Court Support Stafl Williamsburg, VA National Center for State Courts.
Gabor, T. (1986). Theprediction ofm’minalbehauior Statrkticaiapproachtx Toronto: University ofToronto Press.
Gottfried, B. 1984. Elements ofStochasticSirnuhtion. Englewood Cliffs, NJ: Prentice- Hall, Inc.
Gottfredson, M., andT. Hirschi. 1986. “The True Value of Lambda Would Appear to Be Zero: An Essay on Career Criminals, Criminal Careers, Selective Incapacita- tion, Cohort Studies and Related Topics, Criminology 24 (2): 213-34.
Gottfredson, S . (1 987). Prediction: An overview of selected methodological issues. In D. M. Gottfredson and M. Tonry (Eds.), Prediction and chsijGcation: Criminal justice decision making. Chicago: The University of Chicago Press.
Gottfredson, S. and Gottfredson, D. (1987). Screening for risk among parolees: Policy, practice, and method. In D. P. Farrington and R. Tarling (Eds.), Predictiun in Criminology. Albany, Ny: State University of New York Press.
“Governor Allen Signs Sweeping Anticrime Package.” 1994. News Release, April 6.
Governor’s Commission on Parole Abolition and Sentencing Reform. 1994. “Final Report” (August).
Governor’s Commission on Parole Reform. 1994. “Parole Abolition Sentencing Re- form Proposals.” Unpublished working papers.
Governor’s Task Force on Sentencing. 1983. “A Report to the Governor ofVirginia” (December).
Green, E 1998. “For Lease: 3,290 Prison Beds in Virginia.” Richmond Emes-Dis- patch, July 6, Al, A5.
Greenberg, D. 1979. Mathematical Crz’minolou. New Brunswick, N.J.: Rutgers Uni- versity Press.
Greenfeld, Lawrence A, Allen Beck, and Darrell Gilliard. “Prisons: Population Trends and Key Issues for Management.” Criminal Justice Review 21 (Spring 1996).
Gupta, D. 1994. Decisions ly the Number. Englewood Cliffs, NJ: Prentice Hall.
Haynes, P., and C. Larson. 1984. “Financial Consequences of Incarceration and Al- ternatives: Burglary.” Crime and Delinquency 30: 529-50.
Horney, J,, and I. Marshall. 1991. “Measuring LambdaThrough Self Reports.” Cn’rni- nobgy29 (3): 471-95.
Joint Legislative Audit and Review Commission, “Review of Virginia’s Parole Pro- cess,” Commonwealth of Virginia, 1992.
Joint Subcommittees on Public Safety of the House Appropriations and Senate Fi- nance Committees. 1994. “Felony Sentencing Practice and Time Served.” Unpub- lished analysis, Virginia Criminal Justice Research Center (May 10).
Joyce, N. 1992. “A View of the Future: The Effect of Policy on Prison Population Growth.” Crime and Delinquency 38 (3): 357-68.
Judicial Sentencing Guidelines Committee. 1994. “Viinia Sentencing Guidelines Manual”.
84 Twth-in-Sentencing in Virginia
This document is a research report submitted to the U.S. Department of Justice. This reporthas not been published by the Department. Opinions or points of view expressed are thoseof the author(s) and do not necessarily reflect the official position or policies of the U.S.Department of Justice.

Judicial Sentencing Guidelines Committee. 1993. “Voluntary Sentencing Guide- lines: Report to the Judicial Conference of Virginia.”
Judicial Sentencing Guidelines Oversight Committee. 1989. %luntary Sentencing Guidelines, Pilot Program Evaluation.
Judicial Sentencing Guidelines Oversight Committee. 1987. Working papers pre- sented to committee (October).
“Justice For All.” 1983. Richmond Times-Dispatch
Kauder, Neal B., Brian J. Ostrom, Meredith Peterson, and David Rottman. 1997. Sentencing Commission R.ofiles. Williamsburg, VA: National Center for State Courts.
Gamer, J., R. Lubitz, and C. Kempinen. 1 9. “Sentencing Guidelines: A Quanti- tative Comparison of Sentencing Policies in. E innesota, Pennsylvania, and Washing- ton.” Justice Qwrterh 6 (4): 565-87.
Levitt, S’. 1996. “The Effect of Prison Population Size on Crime Rates: Evidence from Prison Overcrowding Litigation.” QuarterlyjournJofEconomics 11 1: 319-5 1.
Marvell, T., and C. Moody. 1996. “Determinate Sentencing and Abolishing Parole: The Long-Term Impacts on Prisons and Crime.” Criminology34 (1): 107-28.
Marvell, T, and 6. Moody. 1994. “Prison Population Growth and Crime Reduc- tion.” Journal ofQuantitatiue Criminohgy 10 (2): 109-40.
Microsoft Excel Version 4.0. Microsoft Corporation, Redmond, CA. Miller, T. 1990. “The Plausible Range for the Value of Life: Red Herrings Among the Mackerel.” Journal of Forensic Economics 3 (3): 75-89.
Miller, T., M. Cohen, and S. Rossman. 1993. “Victim Costs ofviolent Crime and Resulting Injuries. Health Afairs 12 (4): 186-97.
Miller T., M. Cohen, and B. Wiersema. 1996. Victim Costs and Consequences: A New Look. Research report. Washington: National Institute of Justice.
Mitchell, R., and R. Carson. 1989. Using Survqs to W u e Public Good: The Contin- gent Valuation Method. Washington: Resources for the Future.
--
<
National Council on Crime and Delinquency. 1995. “The 1995 NCCD Prison Popu- lation Forecast: The Cost of Truth-in-Sentencing Laws.” NCCD FOCUS (July).
National Council on Crime and Delinquency. 1992. Criminal /Elstice SenmcingPolicy Statement. San Francisco.
National Institute of Corrections. 1995a. State Legiskztiue Actions on Truth in Sen- tencing: A h i e w of Luw and Legislation in the Context of the ViolPnt Crime Control and Law En$rcement Act of 1994. Longmont, CO.
National Institute of Corrections. 1995b. TIS Law and Indeterminate Sentencing in Eighteen States: A Review in the Context of I935 Congressional Decisions. Longmont, CO.
Ostrom, Brian J., Neal B. Kauder, David Rottman, and Meredith Peterson. 1998. Sentencing Digest: Examining Current Sentencing Issues and Policies. Williamsburg, VA: National Center for State Courts.
“Report of the Ad Hoc committee on Sentencing Guidelines.” 1985. (August 15).
‘Report of the Joint Legislative Audit and Review Commission on Review ofVirginia’s Parole Process to the Governor and General Assembly of Virginia.” 1992. Senate Document No. 4.
Bibliography 85
This document is a research report submitted to the U.S. Department of Justice. This reporthas not been published by the Department. Opinions or points of view expressed are thoseof the author(s) and do not necessarily reflect the official position or policies of the U.S.Department of Justice.

“Sentencing and Parole Reform.” 1997. House Document No. 19.
Spelman, W. 1994. Criminal Incapacitation. New York: Plenum Press.
Survey Research Laboratory, Center for Public Service, Virginia Commonwealth University. 1993. “A Survey of Virginia Citizens Concerning Violent Crime Issues, January 8, 1993.”
Tonry, M. 1997. Intermediate Sanctions in Sentencing Gudelines. Washington: Bureau of Justice Assistance.
Tonry, M. 1993. “Sentencing Commissions.” In M. Tonry, ed., Crime andJustice: A Review of Research. Chicago: University of Chicago Press.
Tonry, M. 1991. “The Politics and Processes of Sentencing Commissions.” Crime and Delinquency 37 (3): 307-29.
Tonry, Michael. 1996. Sentencing Matters. New York: Oxford University Press.
U.S. Department of Justice, Office of Justice Programs, Bureau of Justice Statistics. 1994. Felony Sentences in the United States. Washington.
Virginia Criminal Sentencing Commission. 1998a. 1998AnnualReport. Richmond, VA.
Virginia Criminal Sentencing Commission. 1997.1397 AnnualReport Richmond, VA.
Virginia Criminal Sentencing Commission. 1996.199G AnnualRport. Richmond, VA
Virginia Criminal Sentencing Commission. 1995a. 1995AnnualRPport. Richmond, VA.
Virginia Criminal Sentencing Commission. 1995b. “Sentencing Guidelines Com- pliance Results, 7/ 1193-3/3 1/94.” Unpublished compliance analysis.
VirginiaCriminal Sentencing Commission. 1998b. “Viiginia Sentencing Guidelines Manual”
Visher, C. 1986. “The Rand Inmate Survey: A Reanalysis.” In A. Blumstein, J. Cohen, J. A. Roth, and C. A. Visher, eds., Criminal Careers and “Cmeer” Criminalr: EL 2. Washington: National Academy Press.
Von Hirsch, Andrew. 1976. Doing Jurtice: The Choice ofPllnishments, New York: Hill and Wang.
Westing, Peter. 1982. “The Empty Idea of Equality.” Harvard Law Review 95: 537.
Wilbanks, W (1987). Predicting failure on parole. . In D. I? Farrington and R Tarling (E&.), Prediction in Criminohgp Albany, NY: State University of New York Press.
Wilkins, William W. Jr., Phyllis J. Newton, and John R. Steer. “Competing Sentenc- ing Policies in a ‘War on Drugs’ Era.” Wake Forest Law Review.28 (Summer 1993).
Wooldredge, J. 1996. “Research Note: A State-Level Analysis of Sentencing Policies and Inmate Crowding in State Prisons.” Crime and Delinquency42 (3): 456-66.
Wright, R. 1998. Managing Prison Growth in North Carolina Through Structured Sentencing. Washington: National Institute of Justice.
Zedlewski, E. 1987. Making Conjhement Decisions. Washington: U.S. Department of Justice.
Zimring, E, and G. Hawkins. 1988. “The New Mathematics of Imprisonment.” Crime and Delinquency 34 (3): 425-36.
2
.. . .. . - ’ . -.I .
,. ,
I
86 Truth-in-Sentencing in Virginia
This document is a research report submitted to the U.S. Department of Justice. This reporthas not been published by the Department. Opinions or points of view expressed are thoseof the author(s) and do not necessarily reflect the official position or policies of the U.S.Department of Justice.