Embed Size (px)
Citation preview

Trusted to performAnnual Report and Accounts 2013/14

About National GridConnecting you to your energy today, trusted to help you meet your energy needs tomorrow. National Grid’s job is to connect people to the energy they use, safely. We are at the heart of one of the greatest challenges facing our society – delivering clean energy to support our world long into the future. We work with all our stakeholders to promote the development and implementation of sustainable, innovative and affordable energy solutions. And we are proud that our work, and our people, underpin the prosperity and wellbeing of our customers, communities and investors.
National Grid took delivery of a new Bell 429 helicopter in 2013. We use two helicopters to inspect pylons in England and Wales and to undertake critical maintenance. Shown here with Chris Land, a live-line engineer, helicopters have proved a cost-effective way of keeping an accurate and documented record of the state of the network. It takes three on-the-ground linesmen one day to inspect three pylons, while an airborne observer can inspect six pylons in one hour.
Cover imageNational Grid’s Ken Kujawa stands alongside Ford’s Darrell Rowser at Ford’s Buffalo Stamping Plant in upstate New York. National Grid has helped Ford replace its standard light fittings with 1,740 energy-efficient LED fixtures, delivering predicted annual energy savings for Ford of 10.7 million kilowatt hours for up to 10 years. National Grid is investing over $50 million to rebuild the Gardenville power station, connected to the Stamping Plant via National Grid’s 115 kV electricity lines. The investment will improve the electricity reliability for Ford and other customers when the project is completed.
For a full search facility, please goto the pdf of our Annual Report andAccounts 2013/14 in the investorrelations section of our websiteand use a word search.
Additional InformationCorporate Governance Financial StatementsStrategic Report
Highlights
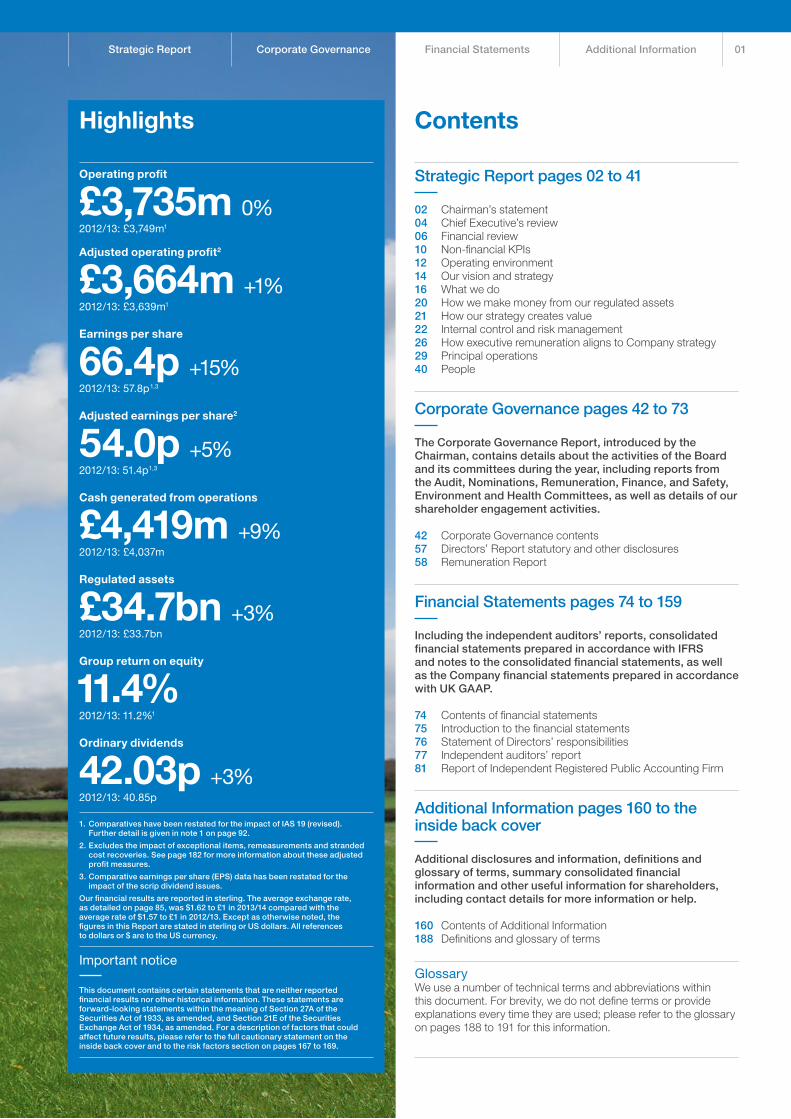
Operating profit
£3,735m 0%2012/13: £3,749m1
Adjusted operating profit2
£3,664m +1%2012/13: £3,639m1
Earnings per share
66.4p +15%2012/13: 57.8p1,3
Adjusted earnings per share2
54.0p +5%2012/13: 51.4p1,3
Cash generated from operations
£4,419m +9%2012/13: £4,037m
Regulated assets
£34.7bn +3%2012/13: £33.7bn
Group return on equity
11.4%2012/13: 11.2%1
Ordinary dividends
42.03p +3%2012/13: 40.85p
1. Comparatives have been restated for the impact of IAS 19 (revised). Further detail is given in note 1 on page 92.
2. Excludes the impact of exceptional items, remeasurements and stranded cost recoveries. See page 182 for more information about these adjusted profit measures.
3. Comparative earnings per share (EPS) data has been restated for the impact of the scrip dividend issues.
Our financial results are reported in sterling. The average exchange rate, as detailed on page 85, was $1.62 to £1 in 2013/14 compared with the average rate of $1.57 to £1 in 2012/13. Except as otherwise noted, the figures in this Report are stated in sterling or US dollars. All references to dollars or $ are to the US currency.
Important notice
This document contains certain statements that are neither reported financial results nor other historical information. These statements are forward-looking statements within the meaning of Section 27A of the Securities Act of 1933, as amended, and Section 21E of the Securities Exchange Act of 1934, as amended. For a description of factors that could affect future results, please refer to the full cautionary statement on the inside back cover and to the risk factors section on pages 167 to 169.
Contents
Strategic Report pages 02 to 41
02 Chairman’s statement04 Chief Executive’s review06 Financial review10 Non-financial KPIs12 Operating environment14 Our vision and strategy16 What we do20 How we make money from our regulated assets21 How our strategy creates value22 Internal control and risk management26 How executive remuneration aligns to Company strategy29 Principal operations40 People
Corporate Governance pages 42 to 73
The Corporate Governance Report, introduced by the Chairman, contains details about the activities of the Board and its committees during the year, including reports from the Audit, Nominations, Remuneration, Finance, and Safety, Environment and Health Committees, as well as details of our shareholder engagement activities.
42 Corporate Governance contents57 Directors’ Report statutory and other disclosures58 Remuneration Report
Financial Statements pages 74 to 159
Including the independent auditors’ reports, consolidated financial statements prepared in accordance with IFRS and notes to the consolidated financial statements, as well as the Company financial statements prepared in accordance with UK GAAP.
74 Contents of financial statements75 Introduction to the financial statements76 Statement of Directors’ responsibilities77 Independent auditors’ report81 Report of Independent Registered Public Accounting Firm
Additional Information pages 160 to the inside back cover
Additional disclosures and information, definitions and glossary of terms, summary consolidated financial information and other useful information for shareholders, including contact details for more information or help.
160 Contents of Additional Information188 Definitions and glossary of terms
GlossaryWe use a number of technical terms and abbreviations within this document. For brevity, we do not define terms or provide explanations every time they are used; please refer to the glossary on pages 188 to 191 for this information.
01

Chairman’s statement
Our vision statement ‘Connecting you to your energy today, trusted to help you meet your energy needs tomorrow’ emphasises the importance of trust, which we earn not just by meeting our commitments, but by making sure that we do so in the right way.
It has been an important and challenging year for National Grid – and the energy sector in general – on both sides of the Atlantic.
Although we did not experience any major storm-related outages in our service areas during 2013/14, severe winter weather conditions – the polar vortex in the US and serious flooding in the UK – continued to test the resilience of our networks. I am pleased to report these have performed well as a result of prudent investments in past years, as well as the commitment of our people.
Energy policies in both the UK and US strive to find an acceptable balance between affordability to the ultimate consumers, security of supply and sustainability considerations. Particularly since last September, the focus of UK media and political attention has been moving between each of these three factors, with no enduring consensus of what constitutes the optimum position.
In the UK, the eight year RIIO settlement we accepted in February 2013 incentivises us to be as efficient as possible while ensuring that savings we achieve can be shared with consumers. Through these incentives we can maximise our efforts to help hard-pressed consumers and deliver good returns to our shareholders.
TransparencyIn our continuing efforts to be fair, balanced and understandable in our reporting we are including additional information this year and explaining some technical matters in greater detail, so that we are as transparent as we can be.
In particular, I draw your attention to one aspect of our results. There have always been differences between IFRS reported results and underlying economic performance; however, one of the benefits of the RIIO price control regime is that it provides greater transparency of regulatory adjustments to
revenue in our principal UK businesses. The commentary on ‘timing differences and regulated revenue adjustments’ contained in the Financial review on page 08 aims to help understanding of this matter.
The Board has recommended an increase in the final dividend to 27.54p per ordinary share ($2.3107 per American Depositary Share). If approved, this will bring the full-year dividend to 42.03p per ordinary share ($3.4801 per American Depositary Share), an increase of 2.9% over the 40.85p per ordinary share in respect of the financial year ending 31 March 2013.
Effective governance We have developed a new remuneration policy to align more closely with RIIO, the continued evolution of our US business and shareholder value creation. The policy will be subject to shareholder approval at the AGM in July – a requirement of recent legislation. You can read our full Remuneration Report, introduced by Jonathan Dawson, our new Remuneration Committee Chairman, on page 58.
As we describe on page 07, the high level of take-up of the scrip dividend in the last couple of years led to concerns about the potential dilutive effect of this option. This meant that we decided not to offer the scrip element for the 2013/14 interim dividend paid in January this year, as our forecast capital investment programme was already fully funded. I do appreciate, from the letters sent to me, that this caused some dissatisfaction. We have now identified a way of offering the scrip option for both the full-year and interim dividend, which balances shareholders’ appetite for the scrip dividend option with our cash requirements. At the AGM we are seeking approval for the allotment and buy-back authorities we need to do this. The scrip dividend option has been offered for the 2013/14 final dividend subject to shareholder approval of the relevant resolutions at the AGM.
The Board is proposing a recommended final dividend of
27.54p(2012/13: 26.36p)
02 National Grid Annual Report and Accounts 2013/14

Strategic Report Corporate Governance Financial Statements Additional Information
Nick Winser, Executive Director UK, will step down from the Board in July 2014 at the AGM. He will continue with his roles as President of the European Network of Transmission System Operators for Electricity (ENTSO-E) and as Chairman of National Grid Electricity Transmission (NGET) and National Grid Gas (NGG) through to July 2015 before leaving the Company. After July 2015, the role of President of ENTSO-E will no longer be undertaken within the Company, and arrangements for a smooth handover of Nick’s other responsibilities will be announced in due course.
This year we have welcomed Therese Esperdy and John Pettigrew to our Board and we will be saying goodbye to Maria Richter following the AGM.
During Maria’s 10 years with the Company she has made a significant contribution to the Board and Finance Committee in particular and I would like to thank her for her commitment and wish her all the best in her future endeavours.
Therese, who will be taking over as chairman of the Finance Committee from Maria, brings a wealth of corporate finance and debt market experience to our Board. We have also appointed a new Executive Director, John Pettigrew. John joined National Grid as a graduate entrant in 1991 and has been a member of the Executive Committee for nearly two years.
The appointments of Therese and John have been part of a significant transition of the Board over the last three years through which we have secured a broad range of skills, experience, perspectives and challenge. Together with strong teamwork, I believe these qualities are contributing towards an effective Board, which will continue to set the right tone from the top, helping to meet the challenges ahead.
Being a responsible businessOur vision statement ‘Connecting you to your energy today, trusted to help you meet your energy needs tomorrow’ emphasises the importance of trust, which we earn not just by meeting our commitments, but by making sure that we do so in the right way. That is why how we work is as important as what we do, and why doing the right thing is at the core of everything we do.
During 2013/14 we spent time reinforcing the standards we expect of our employees in terms of ethical behaviour. As part of this, we have sent our employees a refreshed copy of ‘Doing the Right Thing’, which is our guide to ethical business conduct.
We contribute to the communities in which we operate directly and indirectly in many ways. We maintain and operate the critical infrastructure needed to keep the lights on and the heating working across the UK and northeastern US; we employ more than 23,000 people; and in 2013/14
contributed £1.4 billion in taxes in the UK alone. Additionally, we estimate we support more than 28,500 jobs in the first tier of our supply chain – companies that are our suppliers across the globe.
We aim to develop and operate our business with an inclusive and diverse culture. You can read more about our approach to diversity on page 41, as well as our Board diversity policy on page 56.
Looking aheadOver the next 12 months the UK and US will see a dynamic political environment. In the UK, the Scottish independence referendum later this year and the general election in 2015 are likely to increase the focus on issues such as the affordability and security of energy supply, as will the proposed review of the energy industry by the Competition and Markets Authority.
In the US, the mid-term US Congressional elections are on the horizon, together with the gubernatorial elections (election of the state governor) in New York, Rhode Island and Massachusetts. We expect debate to continue on essential infrastructure, resilience and sustainability, including our Connect21 dialogue with stakeholders. You can read more about Connect21 on page 35.
Our people have a crucial role to play in meeting the opportunities ahead. I would like to thank our employees for their hard work and dedication over the past year. Rising to the challenges brought by severe weather and changes within the industry, they have continued to make National Grid a company we can be proud of.
Sir Peter Gershon
Governance pages 42 – 57
Across our operations, our employees volunteer for causes that matter to them, and to the communities we serve. In the UK alone, 1,730 employees devoted 8,178 hours to good causes.
03

Chief Executive’s review
We need to be even more flexible and agile as customer needs change, so we can respond faster and more efficiently.
It has been a year of solid performance for National Grid against a backdrop of intense public focus on energy prices, as well as new regulatory frameworks in both the UK and US.
Safety is, as always, at the heart of the way we operate. In the UK we achieved an employee lost time injury frequency rate (IFR) of below 0.1. This is a world-class performance and I am incredibly proud of our teams who have worked so hard to get us to this significant milestone. You can read more about this achievement on page 10. The challenge now is to replicate this performance in the US, where we have more work to do. We will never let up on our relentless focus on safety.
Despite the freezing and protracted winter in the US and the wettest winter on record in the UK, we achieved one of our best years in terms of reliability, keeping the lights on and the gas flowing. The investment we made in bolstering our flood defences in the UK protected potentially vulnerable assets such as substations, even though in some cases the surrounding areas suffered considerable flooding.
In the US, our reliability performance was excellent as a result of continued targeted resiliency investment and management of our networks.
The introduction of RIIO in the UK has been an appropriate development for our industry. If we can outperform against the incentives it offers and find ways to reduce our costs, the benefits are shared with our customers. Getting ready for RIIO has been a significant challenge for the UK business, but I am delighted to say that we have made a good start.
There have also been significant Government and regulatory policy changes affecting our business in the UK, including the introduction of Electricity Market Reform (EMR) and the evolution of the system operator role in the long-term planning of the network.
We have adapted our ways of working so we can meet the needs of our customers and stakeholders and deliver value under RIIO. For example, we used innovative techniques to protect a section of the pipeline that carries gas from the liquefied natural gas (LNG) importation terminal in west Wales, prior to the construction of a new road. This meant we were able to meet the timescales of the local authority building the road without disrupting gas supply to consumers.
In the US, it has been the first year of working under the new upstate New York and Rhode Island regulatory contracts and I am pleased that we have performed well in both cases. You can read more about developments in our US rate filings and regulatory environment on page 164.
We have introduced Connect21, our thinking on advancing the USA’s natural gas and electricity infrastructure beyond its 20th century limitations (see page 35). Another priority in the US was the transition of the operation and maintenance of the Long Island Power Authority’s (LIPA) electric transmission and distribution system on Long Island to Public Service Electric and Gas Company – Long Island (PSEG-LI). We successfully handed over the contract on 31 December 2013 and have entered into a transition services agreement with LIPA/PSEG-LI.
US enterprise resource planning system stabilisation continued, remedying the errors of poor implementation from the prior year. Over the course of the year, the US business made significant progress in the activities required to upgrade the system, with implementation expected in mid-2014. The focus is now on reducing the ongoing costs associated with the complex manual processes that are required to compensate for identified weaknesses in internal controls over financial reporting in the US. While these control weaknesses have not reduced the quality of financial statements
04 National Grid Annual Report and Accounts 2013/14

Strategic Report Corporate Governance Financial Statements Additional Information
produced, they have necessitated significant additional cost.
Overall, the business remains on track to successfully conclude the programme during 2014, with expected costs unchanged from the guidance provided last year.
We have focused on improving our end-to-end operating processes throughout the year. This has involved using hard facts and data to identify and prioritise areas for improvement, as well as harnessing ideas to help find more efficient ways of working to meet our stakeholders’ needs.
An area we know we can improve is customer service. We saw some good results such as reduced complaints in the UK and our scores for UK Gas Transmission, as well as increases in three out of our four US customer satisfaction scores. However, we know that we are not fully meeting our customers’ expectations for our gas connections process in the UK and US. We will stay focused on getting this right.
In the US, we supply gas and electricity to customers who have chosen us as their supplier. Our regulatory agreements allow us to recover the costs we incur when we buy gas and electricity. During 2013/14 we saw an increase in complaints about higher energy bills – a consequence of the colder weather affecting commodity costs during the winter.
Energy prices have been the subject of a continued high-profile debate in the UK. At National Grid, we believe transparency is crucial, explaining to customers the breakdown of the bill they receive. In the UK, we are investing significantly in our UK networks, but the impact of network costs on bills will remain flat in real terms over the RIIO period (2013/14 – 2020/21), based on the forecast revenues derived from Ofgem’s Final Proposals for RIIO.
In terms of our UK network upgrade plans, we are pleased with progress on the London Power Tunnels project and have now started site works on the HVDC link connecting Scotland and England. This joint venture with SP Transmission will support the export of low carbon Scottish generation.
In the US, our Brooklyn/Queens Interconnect project will connect our existing natural gas distribution systems in Brooklyn and Queens, which will ensure greater reliability and safety, provide additional capacity and meet future energy needs for customers. This is the first new gas pipeline to be installed in the area in 50 years.
We are determined to embed sustainability by seeking to combine innovation, engagement and efficiency – an example of which was a trial in the UK, working with manufacturers, construction partners and our procurement teams to re-manufacture aluminium overhead line conductors.
PeopleI was really pleased to see that the results of our 2014 employee opinion survey, completed by 78% of our employees, included an engagement score of 71% – an increase of eight percentage points over the previous survey and our highest engagement score since we started conducting Group-wide employee opinion surveys.
I was also pleased to attend a series of celebrations to mark 40 years’ service for more than 300 of our employees in both the UK and US. I am delighted that so many of our people have forged productive and committed careers at National Grid that have spanned such a long time. Yet at the same time, it serves as a reminder about the scale of the challenge we have in our industry to make sure we have enough people with the skills and experience we need in the future.
It is a significant challenge on both sides of the Atlantic. In the UK, for example, around 89,000 people are needed annually to meet demand in the UK’s engineering sector over the next decade. Yet only around 51,000 are joining the profession each year. In the US, by 2018, STEM occupations will account for about 1.1 million new jobs and 1.3 million replacement positions due to STEM workers leaving the workforce.
To help address this shortage, National Grid is running, or is involved with, a number of programmes and initiatives in the UK and US aimed at encouraging young people to study STEM subjects – you can read more about these initiatives on page 40.
Our priorities for next year• Safety – build on our strong UK performance
and focus our efforts on delivering consistent world-class safety performance across the organisation;
• Customer-focused execution – in the UK, continue our strong start to RIIO; underpin energy security through our interconnector and infrastructure investment strategy. In the US, complete stabilisation of our enterprise resource system; perform strongly against our current regulatory rate plans while shaping the future; and
• Stakeholders – continue to engage with our stakeholders in the US, UK and EU to understand their changing energy needs and to shape energy policy.
Steve Holliday
Principal operations pages 29 – 39
People pages 40 – 41
05

Financial review
We have delivered another year of solid financial performance with a good start under RIIO in the UK and consolidation of underlying improvements in the US.
Our financial KPIsAdjusted earnings per shareAdjusted operating profitOur adjusted operating profit has increased by £25 million (1%) to £3,664 million. Across our three UK businesses operating under the new RIIO framework, adjusted operating profit was up £34 million. Allowed revenues increased in Electricity Transmission and Gas Distribution and fell in Gas Transmission. The resultant increase in revenue was offset by higher controllable costs, higher depreciation as a result of continued investment and adverse movements in timing year on year.
Our US Regulated business was £129 million lower, reflecting a weaker dollar, the end of Niagara Mohawk deferral recoveries at March 2013, higher controllable costs due to inflation, and increased insurance costs following major storms last year. These were partially offset by the non-recurrence of the major storm costs incurred last year.
Other activities adjusted operating profit was £120 million higher, driven by higher profits in the French interconnector, non-recurrence of Superstorm Sandy costs in our insurance captive, and improved performance in our Metering business. These were partially offset by increased spend on the stabilisation of new US information systems.
Adjusted earningsOur adjusted net interest charge was slightly lower than 2012/13 at £1,108 million, reflecting the weaker dollar.
Our adjusted tax charge was £38 million lower at £581 million. This was mainly due to a 1% decrease in the UK statutory corporation tax rate in the year, a change in the UK/US profit mix and changes in tax provisions in respect of prior years. As a result of this, our effective tax rate for 2013/14 was 22.5% (2012/13: 24.4%).
The earnings performance described above has translated into adjusted EPS growth in 2013/14 of 2.6p (5%) (2012/13: 5.4p, 12%).
Adjusted EPS1
pence
2009/10 2010/11 2011/12 2012/13 2013/14
47.1 45.4 46.051.4 54.0
1. All comparatives restated for IAS 19 (revised). See note 1 on page 92.
In accordance with IAS 33, all EPS and adjusted EPS amounts for comparative periods have been restated as a result of shares issued via scrip dividends and the bonus element of the 2010 rights issue.
Measurement of financial performanceWe describe our results principally on an adjusted basis and explain the rationale for this on page 182. We present results on an adjusted basis before exceptional items, remeasurements and stranded cost recoveries. See page 182 for further details and reconciliations from the adjusted profit measures to IFRS, under which we report our financial results and position. The comparative numbers have been restated for the adoption of IAS 19 (revised) ‘Employee benefits’. See further detail in note 1 on page 92.
A reconciliation between reported operating profit and adjusted operating profit is provided below. Further commentary on movements in the income statement is provided on page 85.
Year ended 31 March
£m 2014 2013 2012
Total operating profit 3,735 3,749 3,535Exceptional items (55) 84 122Remeasurements – commodity contracts (16) (180) 94Stranded cost recoveries – (14) (260)
Adjusted operating profit 3,664 3,639 3,491Adjusted net finance costs (1,108) (1,124) (1,090)Share of post-tax results of joint ventures 28 18 7Adjusted taxation (581) (619) (697)Attributable to non- controlling interests 12 (1) (2)
Adjusted earnings 2,015 1,913 1,709
Adjusted EPS 54.0p 51.4p 46.0p
Group return on equity (RoE)We measure our performance in generating value for our shareholders by dividing our annual return by our equity base.
Group RoE has increased during the year to 11.4%, due to the impact of major storms in the prior year. Excluding major storms, Group RoE has decreased by 30bps reflecting the end of Niagara Mohawk deferral recoveries, together with higher controllable costs and system costs in the US. These negative impacts were partially offset by French interconnector performance and the lower UK tax rate.
Group return on equity%
2009/10 2010/11 2011/12 2012/13 2013/1410
11
13
12
10.9
11.3
10.8
12.6
11.2
11.711.4
Including major storms Excluding major storms
Our revised financial KPIs page 09
Exchange rates page 85
Use of adjusted profit measures page 182
Reconciliations of adjusted profit measures page 182
06 National Grid Annual Report and Accounts 2013/14

Strategic Report Corporate Governance Financial Statements Additional Information
Regulated asset growthOur regulated assets have increased by 3% (£1 billion) to £34.7 billion, reflecting the continued high levels of investment in our networks in both the UK and US. Maintaining efficient growth in our regulated assets ensures we are well positioned to continue providing consistently high levels of service to our customers and increases our revenue allowances in future years.
The UK regulatory asset value (RAV) increased by £1.1 billion, reflecting inflation and significant capital expenditure in our UK Electricity Transmission business in particular. The US rate base decreased by £0.1 billion. Foreign exchange movements decreased the rate base reported in sterling by £0.9 billion. Offsetting this, investment in the networks and working capital movements increased rate base by £0.8 billion.
Total regulated assets and regulated asset growth£bn
28.61 29.91 31.233.7 34.72
2010 2011 2012 2013 2014
5%
4%
8%
3%3%
Regulated asset growth
1. US rate base calculated as at 31 December for these years.
2. Estimated figure until the conclusion of the regulatory reporting cycle.
Value addedOur dividend is an important part of our returns to shareholders along with growth in the value of the asset base attributable to equity investors. These are reflected in the value added metric that will underpin our approach to sustainable decision making and long-term incentive arrangements.
Overall value added in the year was £2.1 billion or 57.2p per share as set out below:
Year ended 31 March Change
£bn at constant currency 2014 2013 £bn
UK regulated assets1 25.2 24.3 +0.9US regulated assets2 11.2 10.3 +0.9Other invested capital 1.7 1.5 +0.2
Total assets 38.1 36.1 +2.0Dividend paid +1.1Movement in goodwill –Net debt (21.2) (20.2) -1.0
Value added +2.1
Value added per share 57.2p
1. Consists of regulated asset values and other regulatory assets and liabilities of the UK businesses regulated under RIIO price controls.
2. US regulated assets increased from $17.2 billion to $18.7 billion in the year. These represent rate base plus assets outside of rate base, including working capital.
The Board is confident that growth in assets, earnings and cash flows, supported by improving cash efficiency and an exposure to attractive regulatory markets, should help the Group to maintain strong, stable credit ratings and a consistent prudent level of gearing, while delivering attractive returns for shareholders.
Other performance measuresDividend growthDuring the year we generated £1.3 billion of sustainable business net cash flow after our capital expenditure programmes. This has enabled the growth of the dividend in line with RPI, being 2.9% (2012/13: dividend growth of 4%), taking into account the recommended final dividend of 27.54p.
The high level of take-up of this scrip option in the last couple of years has led to concerns about the potential dilutive effect on value of this option. This meant that we decided not to offer the scrip element for the 2013/14 interim dividend paid in January this year, as our forecast capital programme was already fully funded. We continue to offer the scrip option for the year-end dividend.
Year ended 31 March
% 2014 2013 2012
Dividend growth 3 4 8
Cash generated from operationsCash generated from operations was £4,419 million (2012/13: £4,037 million). Adjusted operating profit before depreciation, amortisation and impairment was £81 million higher year on year. Changes in working capital improved by £351 million over the prior year, principally in the US due to the timing of receivables from LIPA relating to Superstorm Sandy, higher commodity costs and weather differences year on year. Partially offsetting these improvements, cash outflows relating to exceptional items were £38 million higher due to reorganisation in the UK and LIPA MSA transition costs in the US.
UK regulated return on equityThe UK RoE has decreased 90bps to 12.7%, reflecting the new regulatory arrangements under the RIIO framework in place from this year. This performance represents 260bps outperformance over allowed returns.
UK return on equity%
12
14
16
2009/10 2010/11 2011/12 2012/13 2013/14
14.8
13.613.0
13.6
12.7
We have changed the way we present our financial information in the Strategic Report to remove duplication. As a result, the analysis here focuses on our KPIs and other performance measures we use to monitor our business performance. Analysis of our financial performance and position at 31 March 2014, including the performance of our principal operations, has been relocated to the financial statements, however this analysis still forms part of our Strategic Report financial review. See page 75 for further information. See pages 183 to 185 for commentary on our financial performance and position for the year ended 31 March 2013 compared with 2012.
How we make money from our regulated assets page 20
UK regulation pages 160 – 162
US regulation pages 162 – 165
07

Financial review continued
US regulated return on equityThe US RoE has decreased 20bps to 9.0%, mainly driven by lower allowed rates in our KEDNY and Long Island Generation businesses following the introduction of new rate plans during the year.
US return on equity%
6
8
10
6.9
8.38.8
9.2 9.0
Dec 2009 Dec 2010 Dec 2011 Dec 2012 Dec 2013
Return on capital employedRoCE provides a performance comparison between our regulated UK and US businesses and is one of the measures that we use to make strategic and investment decisions about our portfolio of businesses. The table below shows the RoCE for our businesses over the last five years:
Return on capital employed%
7.18.5
6.8
8.6
7.1
8.6
6.4
8.0
5.5
9.6
2009/10 2010/11 2011/12 2012/13 2013/14
US UK
The UK RoCE has decreased from 8.6% to 8.0% in 2013/14, reflecting the new RIIO regulatory allowances, including lower cost of debt allowance, higher gearing assumption in the gas businesses, and the inclusion of our share of exceptional costs. The decrease in the US RoCE from 7.1% to 6.4% is primarily due to the end of Niagara Mohawk deferral recoveries and controllable cost increases. Excluding the impact of major storm costs, the US RoCE would have been 7.7% in 2012/13.
Net debtWe expect our net debt to continue to grow for the next few years as we fund our capital investment programmes and enhance our networks. We continue to borrow at attractive rates when needed and believe that the level of net debt remains appropriate for our business. Our five year net debt trend is shown on page 91.
Interest coverThe principal measure we use to monitor financial discipline is interest cover, which is a measure of the cash flows we generate compared with the net interest cost of servicing our borrowings. The table below shows our interest cover for the last three years.
Year ended 31 March
Times 2014 2013 2012
Interest cover 4.1 3.9 3.9
The increase in interest cover in 2013/14 reflects flat finance costs year on year. Our target long-term range for interest cover is in excess of 3 times. Further details on our capital management and credit ratings can be found in note 30 (f) and on the debt investors’ section of our website.
Timing and regulated revenue adjustmentsAs described on page 20, our allowed revenues are set in accordance with our regulatory price controls or rate plans. We calculate the tariffs we charge our customers based on the estimated volume of energy we expect will be delivered during the coming period. The actual volumes delivered will differ from this estimate. Therefore, our total actual revenue will be different from our total allowed revenue. These differences are commonly referred to as timing differences.
If we collect more than the allowed level of revenue, the balance must be returned to customers in subsequent periods, and if we collect less than the allowed level of revenue we may recover the balance from customers in subsequent periods. In the US, a substantial portion of our costs are pass-through costs (including commodity and energy efficiency costs) and are fully recoverable from our customers. Timing differences between costs of this type being incurred and their recovery through revenue are also included in timing.
The amounts calculated as timing differences are estimates and subject to change until the variables that determine allowed revenue are final.
Our operating profit for the year includes a total estimated in-year under-collection of £42 million (2012/13: £16 million over-collection). Our closing balance at 31 March 2014 was £60 million over-recovered.
In the UK, there was a cumulative under-recovery of £57 million at 31 March 2014 (2013: under-recovery of £5 million). All other things being equal, the majority of that balance will normally be recoverable from customers starting in the year ending 31 March 2016.
Our operations – performance at a glance Business analysis 2013/14%
30
3
31
25
11
UK Electricity TransmissionUK Gas TransmissionUK Gas DistributionUS RegulatedOther activities
Adjusted operating profit
08 National Grid Annual Report and Accounts 2013/14

Strategic Report Corporate Governance Financial Statements Additional Information
Non-financial KPIs pages 10 – 11
Our vision and strategy pages 14 – 15
Our revised financial KPIs
KPI Definition 2013/14 result
Adjusted EPS Adjusted earnings divided by the weighted average number of shares. 54.0p
Group RoE Adjusted earnings with certain regulatory-based adjustments divided by equity. 11.4%
Regulated asset growth Growth in the total UK RAV and US rate base versus the prior year. 3%
Value added Annual growth in our assets after deducting dividends, goodwill and net debt. £2.1bn
We measure the achievement of our objectives, make operational and investment decisions and reward our employees using both qualitative assessments and quantitative indicators. To provide a full and rounded view of our business, we use non-financial as well as financial measures. Although all these measures are important, some are considered to be more significant than others, and these are designated as KPIs.
KPIs are used to measure our progress on strategic priorities, aligning with those activities that combine to deliver our strategy. Financial KPIs are trailing indicators of the success of past initiatives and specific programmes. They also highlight areas for further improvement and allow us to make sure our actions culminate in sustainable long-term growth in shareholder value.
We have changed our financial KPIs during 2013/14 to reflect the changing metrics used to monitor the Group following RIIO. We have included ‘value added’, a new metric that we use to
monitor the value delivered to shareholders through dividends and growth in the value of National Grid’s assets net of the growth in net debt. A derivative of this metric, value growth, is also used to incentivise our Executive Directors. See page 58 for further detail on our remuneration policy.
We have included regulated asset growth, as this is a measure of the ability of the business to generate revenue in the future. While we continue to focus on efficient capital expenditure, the value of our regulated assets drives our revenue allowances in future years.
We have stopped reporting our regulated controllable operating costs metric. This was included to monitor cost control, but following the introduction of RIIO, all our businesses’ activities are focused on costs, through innovative and efficient delivery of high-quality services. Our ability to control costs is also reflected in the adjusted EPS and Group RoE metrics, which are based on our adjusted earnings.
In the US, cumulative timing over-recoveries at 31 March 2014 were £117 million (2013: £110 million). The majority of that balance will be returned to customers next year.
In addition to the timing adjustments described above, following the start of the RIIO price controls in the UK, outperformance against allowances as a result of the totex incentive mechanism, together with changes in output-related allowances included in the original price control, will almost always be adjusted in future revenue recoveries, typically starting in two years’ time.
Our current IFRS revenues and earnings include the amounts that will need to be repaid but exclude amounts that will be recovered in future periods. Such adjustments will form an important part of the continuing difference between reported IFRS results and underlying economic performance based on our regulatory obligations.
For our UK regulated businesses as a whole, regulated revenue adjustments totalled £106 million in the year. This is based on our estimates of: work carried out in line with allowances; in expectation of future allowances; or work avoided altogether – either as a result of us finding innovative solutions or of the need being permanently removed.
In the US, accumulated regulatory entitlements to future revenue net of over- or under-recoveries amounted to £1,027 million at 31 March 2014 (2013: £1,311 million). These entitlements cover a range of different areas, with the most significant being environmental remediation and pension assets, as well as deferred storm costs.
All regulatory entitlements are recoverable (or repayable) over different periods, which are agreed with the regulators to match the expected payment profile for the liabilities. As at 31 March 2014, these extend until 2059.
Major stormsDespite the very cold winter across much of the US, there were no major storms in 2013/14. In 2012/13, two major storms in the US, Superstorm Sandy and Storm Nemo, as well as a number of smaller storms, had a material effect on the results of National Grid, reducing operating profit by £136 million.
The table below shows adjusted operating profit and operating profit for the past three years, excluding the impact of timing differences and major storms.
Year ended 31 March
Excluding the impact of timing differences and major storms
2014£m
2013£m
2012£m
Adjusted operating profit 3,706 3,759 3,589Operating profit 3,777 3,869 3,633
09

Non-financial KPIs
Employee lost time injury frequency rate (IFR)per 100,000 hours worked
Strategic elementDeliver operational excellence
UK Principal operations pages 29 – 33 US Principal operations pages 35 – 37
Definition Number of employee lost time injuries per 100,000 hours worked in a 12 month period.
GoalZero
2009/10 2010/11 2011/12 2012/13 2013/14
0.15
0.18 0.18 0.17
0.14
Our ambition is to achieve a world-class safety performance by 2015, featuring an IFR of below 0.1, with a target for 2013/14 of 0.15. We intend to achieve this through a relentless leadership focus, robust safety management systems and tactical actions focused on our main risks, which may vary between regions and business areas.
Our IFR for 2013/14 was 0.14, better than our target for the year. This is compared with 0.17 in 2012/13, illustrating positive progress towards our world-class target. Our IFR for the UK was 0.06 and for the US it was 0.19.
Network reliability
Strategic elementDeliver operational excellence
UK Principal operations pages 29 – 33 US Principal operations pages 35 – 37
Definition Various definitions appropriate to the relevant business area.
We aim to deliver reliability by: planning our capital investments to meet challenging demand and supply patterns; designing and building robust networks; risk-based maintenance and replacement programmes; and detailed and tested incident response plans.
Performance Measure Target
2009/10 2010/11 2011/12 2012/13 2013/14 2013/14
UK Electricity Transmission 99.9999 99.9999 99.999999 99.99999 99.99999 % 99.9999
UK Gas Transmission 100 100 100 100 100 % 100
UK Gas Distribution 99.999 99.999 99.999 99.999 99.999 % 99.999
Electricity transmission – US 147 414 5181 346 118 MWh losses 308
Electricity – US: Commercial 114 123 121 1052 107 Minutes of outage *
* Targets are set jurisdictionally by operating company.
1. 2011/12 result restated to reflect final data.
2. 2012/13 result excludes New Hampshire, which was sold during the year.
Customer satisfaction
Strategic elementDeliver operational excellence
UK Principal operations pages 29 – 33 US Principal operations pages 35 – 37
Definition We measure customer satisfaction through our position in customer satisfaction surveys.
Performance Measure Target
2009/10 2010/11 2011/12 2012/13 2013/14 2013/14
UK Electricity Transmission n/a n/a n/a n/a 7.4 Score out of 10 6.91
UK Gas Transmission n/a n/a n/a n/a 7.2 Score out of 10 6.91
UK Gas Distribution 4th 4th 3rd 3rd * Quartile ranking Improve
Gas distribution – US: Residential 3rd 2nd 3rd 3rd 2nd Quartile ranking Improve
Gas distribution – US: Commercial 2nd 4th 3rd 4th 4th Quartile ranking Improve
Electricity – US: Residential 4th 3rd 3rd 3rd 2nd Quartile ranking Improve
Electricity – US: Commercial 3rd 2nd 2nd 3rd 2nd Quartile ranking Improve
* Under RIIO-GD1, our customer satisfaction results are now reported on an annual basis, rather than quarterly, which was how we reported them under our previous price control. We will publish the results on our website in the summer as part of our commitment to our stakeholders, and in our Annual Report and Accounts for 2014/15.
1. 6.9 represents our baseline target, set by Ofgem, for reward or penalty under RIIO.
Non-financial KPIs are often leading indicators of future financial performance. Improvements in these measures build our competitive advantage.
10 National Grid Annual Report and Accounts 2013/14

For more information about our strategy and strategic elements see pages 14 – 15
Strategic Report Corporate Governance Financial Statements Additional Information
Employee engagement index%
Strategic elementEngage our people
People pages 40 – 41
Definition Employee engagement index calculated using responses to our employee survey.
TargetTo increase
2009/10 2010/11 2011/12 2012/13 2013/14
68
Not measured
66 6371
We measure employee engagement through our employee opinion survey. The results of our 2014 survey, which was completed by 78% of our employees, have helped us identify specific areas where we are performing well and those areas we need to improve.
Our engagement index has risen by eight points to 71%, our highest engagement score since we started conducting Group-wide employee opinion surveys.
Managers receive a scorecard that aims to create greater leadership accountability and we produce survey reports and action plans at Company, regional, business unit, function and team levels.
Greenhouse gas emissions % reduction against 1990 baseline
Strategic elementEmbed sustainability
Definition Percentage reduction in greenhouse gas emissions against our 1990 baseline.
Target45% reduction by 2020 and 80% reduction by 2050
2009/10 2010/11 2011/12 2012/13 2013/14
5551
55 5862
Our total Scope 1 and Scope 2 greenhouse gas emissions (excluding electricity transmission and distribution line losses) for 2013/14 were around 7.4 million tonnes carbon dioxide equivalent (Scope 1 was 7.2 and Scope 2 was 0.2). This is equivalent to an intensity of 501 tonnes carbon dioxide equivalent per £million of revenue for 2013/14.
The 2013/14 emissions quantity represents a 62% reduction from our 1990 baseline and a 9% reduction from our 2012/13 emissions. Although our outturn is better than our 2020 target, we will need to innovate if we are to meet the target for 2050.
We have remained focused on greenhouse gas emissions reduction programmes to achieve our corporate commitment targets of 45% and 80% reduction in Scope 1 and 2 emissions by 2020 and 2050 respectively from our 1990 baseline.
We continue to look for innovations and efficiencies that will help us achieve these targets. In 2013 we significantly improved our scores in the CDP Global 500 ratings and were admitted for the first time to the Global Leaders Index for carbon disclosure.
We measure and report our greenhouse gas emissions in accordance with the WRI/WBCSD Greenhouse Gas Protocol: Corporate Accounting and Reporting Standard (Revised Edition) for all six Kyoto gases, using the operational control approach for emissions accounting.
These Scope 1 and 2 emissions are independently assured against the international standard ISO 14064-3 Greenhouse Gas assurance protocol. A copy of this statement of assurance is available on our website.
In the UK we have experienced a mild year, which has been beneficial to the overall emissions of many of our business units. In the UK activities at Grain LNG have led to a 60% reduction of energy consumption of on-site nitrogen production. Our Electricity Transmission business has reduced SF6 leak rates to 1.2% in 2013/14 compared with 1.7% in the previous year and our Property function has delivered a 2% year-on-year reduction in electricity-related emissions across occupied sites.
In the US we have completed power plant turbine efficiency upgrades in Long Island and continued to focus on efficiency-related maintenance programmes. This has contributed towards outperforming our LIPA contractual efficiency target. Our US and UK Gas Distribution businesses have continued to deliver significant reductions in emissions in line with forecasts.
11

Operating environment
Recent signs of economic growth have had a positive effect on consumer confidence, but the long downturn and its impact on wages have led to widespread concerns over energy bills. Affordability remains a primary concern of consumers and regulators.
Economic environmentOur UK price controls and US rate plans are agreed against the backdrop of the broader macroeconomic environment.
In the UK, economic growth is projected to continue to increase at a moderate pace in 2014, while the RPI measure of inflation is expected to remain subdued. Monetary policymakers have indicated that interest rates are expected to remain low during 2014, despite significant reductions in unemployment.
In the US, employment and GDP growth continue to improve steadily. The US Congress has reached a two year budget deal, which should ease some concerns in market conditions. Market indicators in areas such as housing and construction are returning to pre-2008 levels.
Market driver Impact
Changing energy mix
Cost and environmental pressures affecting traditional electricity generation
Older gas-fired power stations in the UK and many coal-fired power stations in the US are closing or being mothballed due to changes in environmental regulations.
In the UK, fuel prices are affecting the economic viability of fossil fuel-fired electricity generation. Further decline in traditional electricity generation is likely if the UK’s carbon reduction targets are to be met. The US is seeing renewed demand for gas, as the increasing availability of shale gas has lowered prices.
Long-term certainty needed to secure investment
Current uncertainty in the UK market has led some developers to delay investing in new generation capacity. An agreement on long-term prices for low carbon generation under Electricity Market Reform (EMR) could provide additional certainty for these developers.
Changing UK energy sources
The locations where gas comes into the UK are changing, with forecast reductions in North Sea production and increased reliance on imported gas. New low carbon generation may not be located in the same place or have the same characteristics as existing plant.
This means changes to our network will be needed
Changes to the energy mix and location of supply and demand centres will create pressures on our networks, potentially requiring further investment.
Shale gas production is transforming supply and demand
In the US, shale gas production will mean lower-priced gas over the long term, changing supply and demand patterns.
We may need to invest in additional network capacity
As more generation plants convert to lower priced natural gas, we may need to invest in additional gas network capacity. Changes in generation could also mean modifications to the electricity transmission network.
Energy policy
Sustainability, security of supply and affordability underpin EU policy
In a difficult economic and financial context, the EU’s energy policy is underpinned by the three cornerstones of sustainability, security of supply and affordability. The European Commission published its 2030 Climate Change and Energy framework in 2014, featuring a continued ambition in terms of greenhouse gas reduction targets and energy policy objectives.
Negotiations for a new international agreement on climate change continued at the nineteenth session of the Conference of the Parties (COP19) in 2013, and nations are looking to the Paris worldwide conference in 2015 as the next opportunity to work out a new climate change deal.
Policy decisions can affect our investment needs and compliance obligations
Energy policy decisions by governments, government authorities and others have a direct impact on our business, influencing the emerging challenges and opportunities. They can affect the amount and location of investment required in our networks and the way we operate. They can also change our compliance obligations.
This requires more market integration, interconnection and renewable generation
Greater levels of market integration, interconnection and renewable generation are fundamental to achieving the EU’s policy objectives. While European developments present challenges, the significant level of investment required may create opportunities for growth. For example, potential future interconnector opportunities include connections between the UK and Belgium, Norway, France, Ireland, Denmark and Iceland.
12 National Grid Annual Report and Accounts 2013/14

Strategic Report Corporate Governance Financial Statements Additional Information
Market driver Impact
UK policy changes are in place to attract investment
In the UK, energy policy continues to evolve from the Climate Change Act 2008, which commits the UK Government to reducing UK greenhouse gas emissions to at least 80% lower than a 1990 baseline by 2050. The Energy Act 2013 implements the main aspects of Electricity Market Reform (EMR), and puts in place measures to attract the investment needed to replace current generating capacity and upgrade the grid by 2020, and to cope with a rising demand for electricity.
National Grid has been asked to play a key delivery role
In the UK, National Grid has been asked to play a major role as the delivery body for EMR, to be conferred on National Grid by Government in secondary legislation.
US policy is evolving to meet environmental and energy diversity goals
In the US, many federal level developments have been through federal agency regulations and Presidential executive orders. At a state level, energy policy continues to evolve in the northeastern US, driven by interest in promoting energy efficiency, maintaining reliability and deploying renewable technologies that help meet environmental and energy diversity goals.
Options for increased renewable and distributed generation are being explored
In the US, the impact on natural gas dependency has resulted in an evaluation of the best way of increasing fuel diversity through renewable and distributed generation resources. We continue to support movement towards a clean energy economy; and support additional measures to increase America’s energy productivity.
Regulation
Infrastructure investment needs must be balanced with affordability
Regulators acknowledge that there is a significant need for infrastructure investment. However, affordability continues to be a primary concern.
Cast iron gas mains still in use can be more than 100 years old, becoming riskier to use and contributing to greenhouse gas emissions through leaks. Severe weather in recent years has also highlighted the potential need for additional investment in network resilience. Regulators and policymakers are beginning to ask utilities to put plans in place to strengthen their networks’ ability to withstand the effects of severe weather.
We must accommodate customers’ cost concerns and also provide safe, up-to-date systems
We must accommodate our customers’ affordability concerns while fulfilling our obligations to provide safe and reliable services and upgrading our systems. Investment is required for new connections, to meet the challenges of changing supply and demand patterns, and to replace ageing infrastructure in the UK and US.
UK regulators want greater efficiency and innovation
In the UK, the regulatory focus during the year has been on the new RIIO price controls which give greater focus to incentives and innovation than the previous regulatory regime.
The projected increase in offshore wind generation and interconnection has created a debate on the regulatory approach to electricity transmission investment – a debate we continue to be fully engaged in.
This is driving them to favour more market competition
In the UK, competition is already in place for offshore development and Ofgem has stated its intent to retain the option of using greater competition for certain large onshore projects.
For more information about network efficiency and innovation, see pages 30, 31 and 33.
US policymakers are focused on grid modernisation
In the US, we are actively involved in the New York Energy Highway initiative to examine new ways of delivering infrastructure in the state. In Massachusetts, we are working with regulators and policymakers on a new grid modernisation policy. This is ongoing but is likely to affect our investments in smart grid and metering, and cost recovery of electric infrastructure investments.
This will present opportunities to address customers’ needs more effectively
In the US, developments like the New York Energy Highway initiative, the Reforming Energy Vision initiative announced by the Governor of New York, the Massachusetts Grid Modernization regulatory proceeding and our Connect21 dialogue with stakeholders, will help present new opportunities to respond to customers’ needs and build the necessary infrastructure to address them.
Innovation and technology
Technology developments have the potential to reshape our market
There is continued significant technological development in the energy sector as new technologies take shape and approach commercial viability.
HVDC technology could play an important part in the development of a more integrated electricity grid, particularly the extension of offshore links.
This influences demand and helps us to manage supply
While carbon-based generation is likely to remain a significant part of the global energy mix, carbon capture and storage technologies may become critical to governments achieving their climate change targets. Technologies such as energy storage, electric transportation and distributed generation all have the potential to affect our networks significantly. New consumer products, such as alternative fuelled vehicles and distributed generation, will increase demand and require new infrastructure.
Smart grids will change the way loads are balanced across the distribution network, allowing our customers to make smarter energy choices and increasing network flexibility. Our infrastructure needs the flexibility to respond innovatively to emerging developments, potentially by being managed differently rather than by creating new infrastructure to meet supply and demand changes.
13

Our vision and strategy
Our vision describes our intentions and aspirations at the highest level. Our strategic objectives set out what we believe we need to achieve to deliver our vision and be recognised as a leader in the development and operation of safe, reliable and resilient energy infrastructure.
Deliver operational excellence
Achieve world-class levels of safety, reliability, security and customer service.Our customers, communities and other stakeholders demand safe, reliable and secure supply of their energy. This is reflected in our regulatory contracts where we are measured and rewarded on the basis of meeting our commitments to customers and other stakeholders.
Excellence in our operational processes will allow us to manage our assets efficiently, deliver network improvements quickly and provide services that meet the changing demands of our customers.
Engagement with our customers and communities will make sure what we do reflects their needs and priorities, and that they get the maximum possible value from what we deliver.
Engage our people
Create an inclusive, high-performance culture by developing all our employees.It is through the hard work of our employees that we will achieve our vision, respond to the needs of our stakeholders and create a competitive advantage. Encouraging engaged and talented teams that are in step with our strategic objectives is vital to our success.
Our presence within the communities we serve, the people we work with and our opportunities to grow both individually and as a business are all important to making National Grid a great place to work.
Our visionConnecting you to your energy today, trusted to help you meet your energy needs tomorrow.
Our strategy To be a recognised leader in the development and operation of safe, reliable and sustainable energy infrastructure, to meet the needs of our customers and communities and to generate value for our investors.
Our business modelWe are an international electricity and gas company based in the UK and northeastern US. We play a vital role in connecting millions of people safely, reliably and efficiently to the energy they use.
You can read more about elements of our business model on the following pages:
Operating environment: pages 12 – 13
What we do: pages 16 – 19
How we make money from our regulated assets: page 20
How our strategy creates value: page 21
How executive remuneration aligns to Company strategy: pages 26 – 27
Principal operations: pages 29 – 38
Our Board: page 43
Governance framework: pages 44 – 48
Where we operate: page 166
We have also included a diagram of our business model on page 21.
14 National Grid Annual Report and Accounts 2013/14
Strategic Report Corporate Governance Financial Statements Additional Information
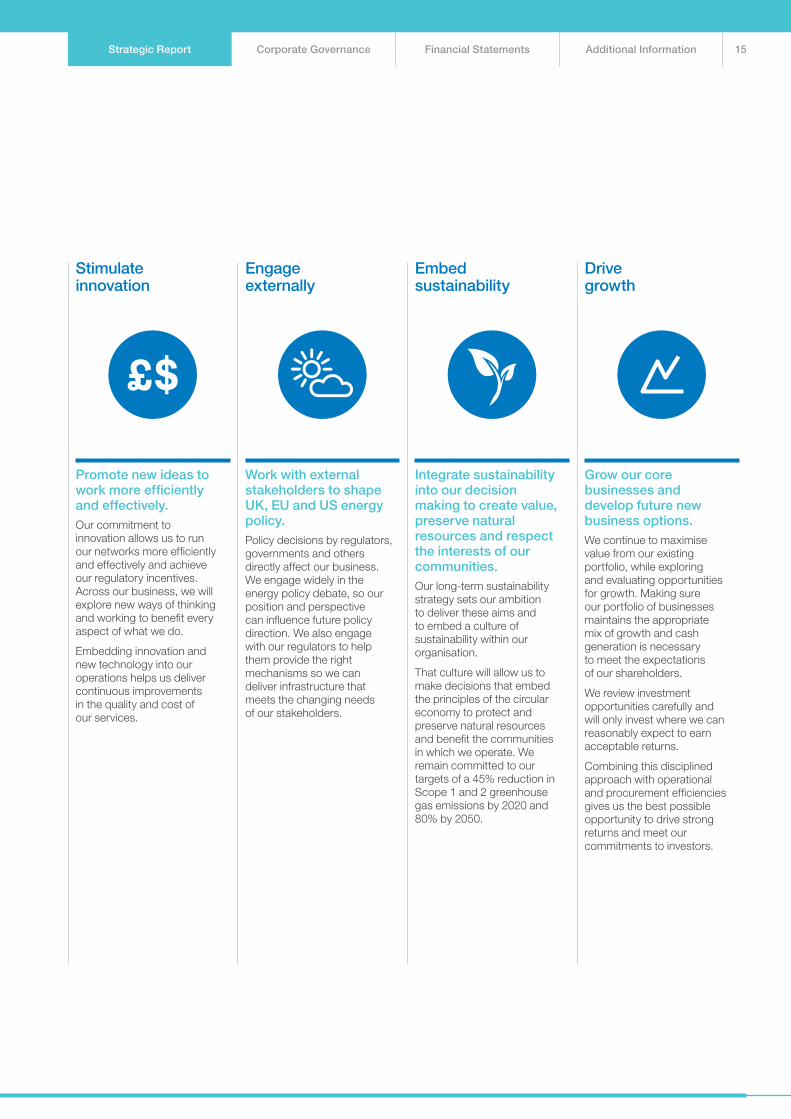
Stimulate innovation
Promote new ideas to work more efficiently and effectively.Our commitment to innovation allows us to run our networks more efficiently and effectively and achieve our regulatory incentives. Across our business, we will explore new ways of thinking and working to benefit every aspect of what we do.
Embedding innovation and new technology into our operations helps us deliver continuous improvements in the quality and cost of our services.
Embed sustainability
Integrate sustainability into our decision making to create value, preserve natural resources and respect the interests of our communities.Our long-term sustainability strategy sets our ambition to deliver these aims and to embed a culture of sustainability within our organisation.
That culture will allow us to make decisions that embed the principles of the circular economy to protect and preserve natural resources and benefit the communities in which we operate. We remain committed to our targets of a 45% reduction in Scope 1 and 2 greenhouse gas emissions by 2020 and 80% by 2050.
Engage externally
Work with external stakeholders to shape UK, EU and US energy policy.Policy decisions by regulators, governments and others directly affect our business. We engage widely in the energy policy debate, so our position and perspective can influence future policy direction. We also engage with our regulators to help them provide the right mechanisms so we can deliver infrastructure that meets the changing needs of our stakeholders.
Drive growth
Grow our core businesses and develop future new business options.We continue to maximise value from our existing portfolio, while exploring and evaluating opportunities for growth. Making sure our portfolio of businesses maintains the appropriate mix of growth and cash generation is necessary to meet the expectations of our shareholders.
We review investment opportunities carefully and will only invest where we can reasonably expect to earn acceptable returns.
Combining this disciplined approach with operational and procurement efficiencies gives us the best possible opportunity to drive strong returns and meet our commitments to investors.
15

ElECTRICITy
What we doElectricity
The electricity industry connects generation sources to homes and businesses through transmission and distribution networks. Electricity is sold to consumers by companies that have bought it from generators and that pay to use the networks across which it is transmitted.
260 kmApproximate length of BritNed interconnector
Transmission grids are often interconnected so that energy can flow from one country or region to another. This helps provide a safe, secure, reliable and affordable energy supply for citizens and society across the region. Interconnectors also allow power suppliers to sell their energy to customers in other countries.
Great Britain is linked via interconnectors with France, Ireland, Northern Ireland and the Netherlands. National Grid owns part of the interconnectors with France and the Netherlands.
We are working to develop additional interconnector projects, which we believe will deliver significant benefits to consumers. These include the development of an electrical interconnector between the British and Belgian transmission systems; as well as a proposal to construct an interconnector between the UK and Norway.
We also jointly own and operate a 224 kilometre interconnector between New England in the US and Canada.
We sell capacity on our UK interconnectors through auctions and on our US interconnectors through wholesale markets and bilateral contracts.
3.8 GWGeneration produced in the US
Generation is the production of electricity from fossil fuel and nuclear power stations, as well as renewable sources such as wind and solar. In the US, we own and operate 50 fossil fuel-powered stations on Long Island and 4.6 MW of solar generation in Massachusetts. We do not own or operate any electricity generation in the UK.
We sell the electricity generated by our plants on Long Island to LIPA under a long-term power supply agreement. The contract allows us to recover our efficient operating costs and provides a return on equity on our investment in the generation assets.
For solar generation, we recover our costs and a reasonable return from customers in Massachusetts through a solar cost adjustment factor. This is added to the electricity rate, net of revenues earned from the solar assets.
Generation Interconnectors
16 National Grid Annual Report and Accounts 2013/14
Strategic Report Corporate Governance Financial Statements Additional Information
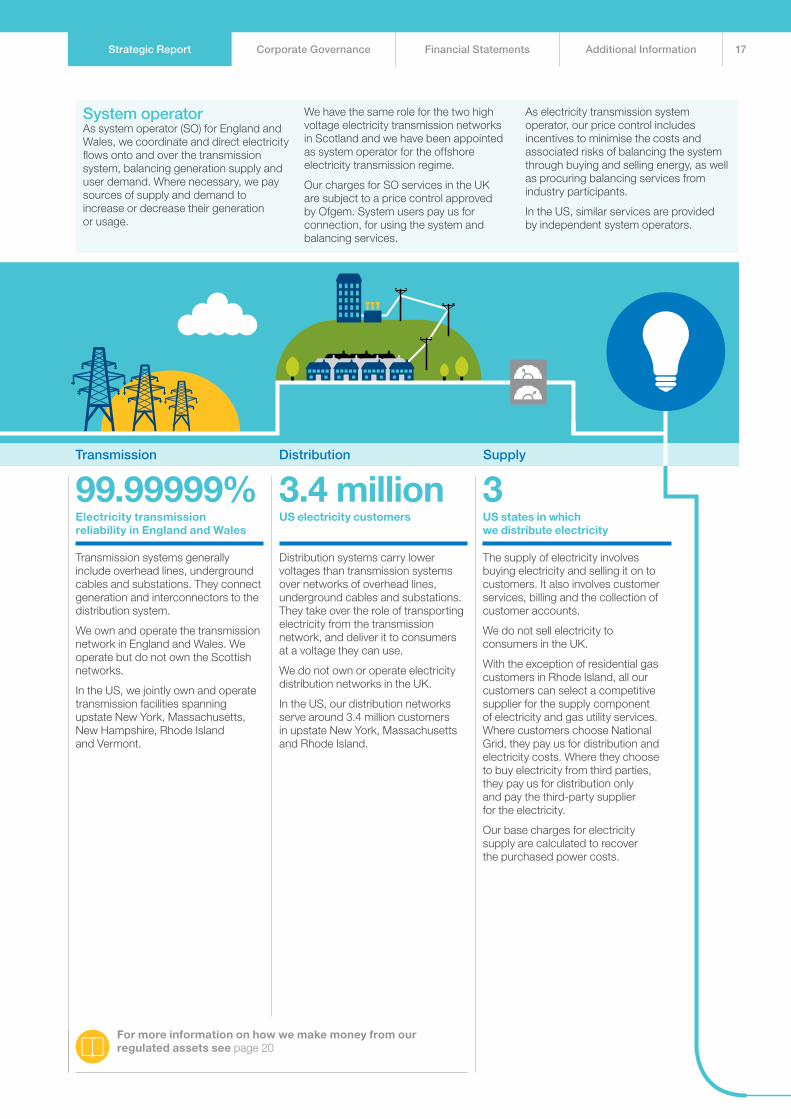
System operatorAs system operator (SO) for England and Wales, we coordinate and direct electricity flows onto and over the transmission system, balancing generation supply and user demand. Where necessary, we pay sources of supply and demand to increase or decrease their generation or usage.
We have the same role for the two high voltage electricity transmission networks in Scotland and we have been appointed as system operator for the offshore electricity transmission regime.
Our charges for SO services in the UK are subject to a price control approved by Ofgem. System users pay us for connection, for using the system and balancing services.
As electricity transmission system operator, our price control includes incentives to minimise the costs and associated risks of balancing the system through buying and selling energy, as well as procuring balancing services from industry participants.
In the US, similar services are provided by independent system operators.
99.99999%Electricity transmission reliability in England and Wales
Transmission systems generally include overhead lines, underground cables and substations. They connect generation and interconnectors to the distribution system.
We own and operate the transmission network in England and Wales. We operate but do not own the Scottish networks.
In the US, we jointly own and operate transmission facilities spanning upstate New York, Massachusetts, New Hampshire, Rhode Island and Vermont.
3US states in which we distribute electricity
The supply of electricity involves buying electricity and selling it on to customers. It also involves customer services, billing and the collection of customer accounts.
We do not sell electricity to consumers in the UK.
With the exception of residential gas customers in Rhode Island, all our customers can select a competitive supplier for the supply component of electricity and gas utility services. Where customers choose National Grid, they pay us for distribution and electricity costs. Where they choose to buy electricity from third parties, they pay us for distribution only and pay the third-party supplier for the electricity.
Our base charges for electricity supply are calculated to recover the purchased power costs.
3.4 millionUS electricity customers
Distribution systems carry lower voltages than transmission systems over networks of overhead lines, underground cables and substations. They take over the role of transporting electricity from the transmission network, and deliver it to consumers at a voltage they can use.
We do not own or operate electricity distribution networks in the UK.
In the US, our distribution networks serve around 3.4 million customers in upstate New York, Massachusetts and Rhode Island.
Interconnectors Transmission Distribution Supply
For more information on how we make money from our regulated assets see page 20
17

What we doGas
The gas industry connects producers, processors, storage, transmission and distribution network operators, as well as suppliers to industrial, commercial and domestic users.
7,660 kmof high pressure pipeline in the UK
The transmission systems generally include pipes, compressor stations and storage facilities, including LNG storage. They connect production through terminals to the distribution systems.
In the UK, gas enters the transmission system through importation and reception terminals and interconnectors and may include gas previously held in storage.
Compressor stations located along the network play a vital role in keeping large quantities of gas flowing through the system, particularly at times of high demand.
The gas transmission system has to be kept constantly in balance, which is achieved by buying, selling and using stored gas. This means that, under normal circumstances, demand can be met.
We are the sole owner and operator of gas transmission infrastructure in Great Britain.
In the US, we hold a minority interest in two interstate pipelines: Millennium Pipeline Company and Iroquois Gas Transmission System. Interstate pipelines are regulated by the Federal Energy Regulatory Commission (FERC).
For more information on how we make money from our regulated assets see page 20
9.7%Approximate percentage of UK gas from lNG imports
Gas used in the UK is mainly sourced from gas fields in the North and Irish seas, piped from Europe and imported as LNG.
There are seven gas reception terminals, three LNG importation terminals and three interconnectors connecting Great Britain via undersea pipes with Ireland, Belgium and the Netherlands. Importers bring LNG from the Middle East, the Americas and other places.
Gas used in the US is produced mainly in North America. We import LNG from a number of countries.
We do not produce gas in either the UK or US.
In the UK, we own and operate Grain LNG, an importation terminal and storage facility at the Isle of Grain in Kent, which charges customers under long-term contracts for various services. These include access to our importation terminal, storage facilities and capacity rights.
In the US, we own and operate LNG storage and vaporisation facilities, as well as an LNG storage facility in Providence, Rhode Island, where we store gas for third parties for a fee. We also buy gas directly from producers and LNG importers for resale to our customers.
Production and importation Transmission
18 National Grid Annual Report and Accounts 2013/14
Strategic Report Corporate Governance Financial Statements Additional Information
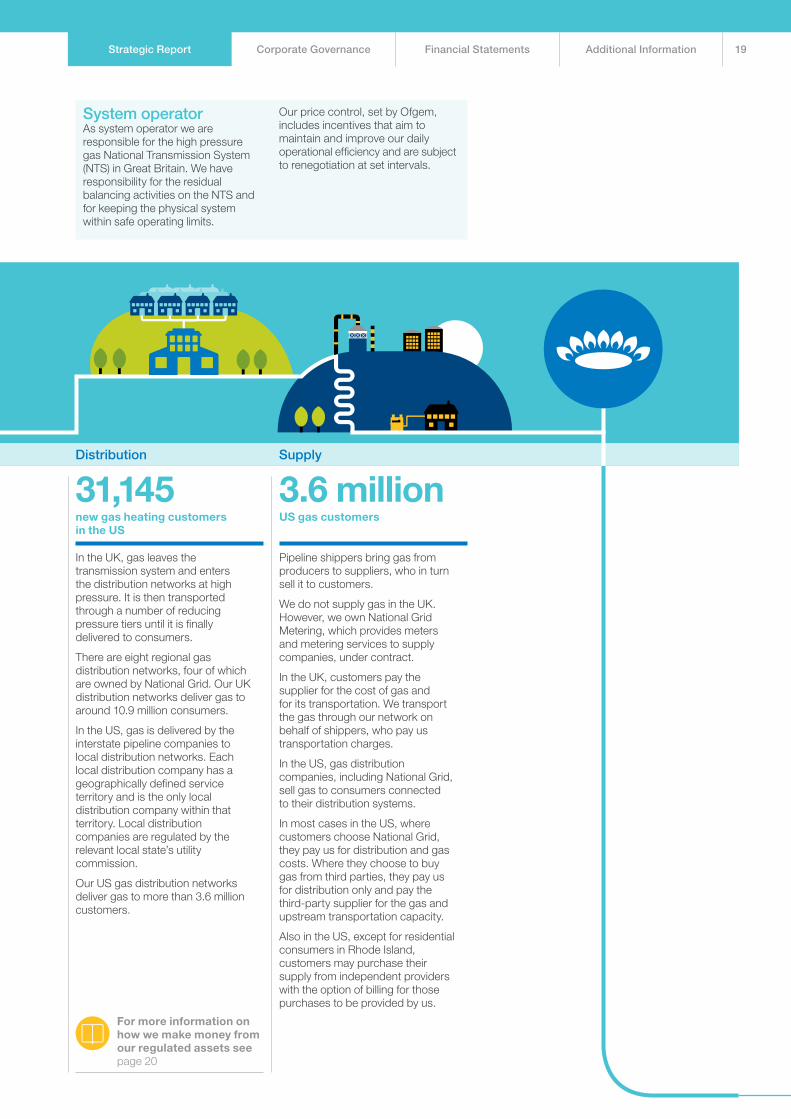
3.6 millionUS gas customers
Pipeline shippers bring gas from producers to suppliers, who in turn sell it to customers.
We do not supply gas in the UK. However, we own National Grid Metering, which provides meters and metering services to supply companies, under contract.
In the UK, customers pay the supplier for the cost of gas and for its transportation. We transport the gas through our network on behalf of shippers, who pay us transportation charges.
In the US, gas distribution companies, including National Grid, sell gas to consumers connected to their distribution systems.
In most cases in the US, where customers choose National Grid, they pay us for distribution and gas costs. Where they choose to buy gas from third parties, they pay us for distribution only and pay the third-party supplier for the gas and upstream transportation capacity.
Also in the US, except for residential consumers in Rhode Island, customers may purchase their supply from independent providers with the option of billing for those purchases to be provided by us.
31,145new gas heating customers in the US
In the UK, gas leaves the transmission system and enters the distribution networks at high pressure. It is then transported through a number of reducing pressure tiers until it is finally delivered to consumers.
There are eight regional gas distribution networks, four of which are owned by National Grid. Our UK distribution networks deliver gas to around 10.9 million consumers.
In the US, gas is delivered by the interstate pipeline companies to local distribution networks. Each local distribution company has a geographically defined service territory and is the only local distribution company within that territory. Local distribution companies are regulated by the relevant local state’s utility commission.
Our US gas distribution networks deliver gas to more than 3.6 million customers.
For more information on how we make money from our regulated assets see page 20
Transmission Distribution Supply
System operatorAs system operator we are responsible for the high pressure gas National Transmission System (NTS) in Great Britain. We have responsibility for the residual balancing activities on the NTS and for keeping the physical system within safe operating limits.
Our price control, set by Ofgem, includes incentives that aim to maintain and improve our daily operational efficiency and are subject to renegotiation at set intervals.
19

How we make money from our regulated assetsIn the UK we have one regulator for our businesses, Ofgem. In the US, different services and locations are regulated by different bodies. For the areas in which we operate, these are the relevant state regulators and FERC.
Each of our regulatory agreements can include differences in structure, terms and values, which we summarise below. You can find more details about regulatory agreements on pages 160 to 165.
The value of our regulated assets is calculated based on the terms of our regulatory agreements. In the UK, the value of regulated assets is also indexed for inflation.
Our regulatory agreements also determine the amount we are allowed to charge customers, commonly referred to as our allowed revenues. Allowed revenue is calculated based on a number of factors:
Depreciation of regulated assets – the value of regulated assets is depreciated over an anticipated lifespan. The amount of depreciation is included in our allowed revenue, which represents the repayment of the amount we have invested in the asset.
Return on equity and cost of debt – regulated assets are funded through debt or equity. Regulatory agreements set this ratio. The equity portion earns a ‘return on equity’. This represents the profit we can earn on our investment in regulated assets. The debt portion earns an allowance based on the cost of debt (interest costs).
Some regulatory agreements allow us to charge customers based on the interest we pay; others use an external benchmark interest rate to incentivise us to raise debt efficiently. The benchmark interest method also provides an opportunity to outperform our regulatory allowance.
Cost of service – in establishing our regulatory agreements, our regulators consider what costs an efficiently run company would incur to operate and maintain our networks. They vary and examples can include costs relating to employees, office rental, IT systems and taxes.
The regulators have different approaches to determining what is considered an efficient or prudent cost and this may be different to the actual costs we incur.
Investment in network assets – in the UK we are given a cost allowance to make necessary investments in the networks. These investment costs allowed by the regulator are linked to the outputs delivered by the networks.
Performance against incentives – our regulatory agreements, mainly in the UK, include incentives that are designed to encourage specific actions, such as reducing greenhouse gas emissions.
Outperforming against incentive targets can increase our allowed revenues in the current year or a future year. Failing to achieve certain minimum targets may lead to a reduction in our allowed revenue.
A further incentive mechanism enables customers and shareholders to share the difference between allowed and actual costs via adjustments to revenue.
Commodity costs – in the US, we supply gas and electricity to customers who have chosen us as their supplier. Most of our regulatory agreements include mechanisms known as trackers that allow us to recover the costs we incur when we buy gas and electricity.
Deferrals – the costs we incur may not be included in the calculation of allowed revenue in the same year. Instead, these are deferred for regulatory purposes and we can normally recover them in future years. See pages 08 and 09 of the Financial review.
For example, in the US we incur costs restoring power to customers immediately after a major storm. However, these costs will generally be included in allowed revenue over a number of years and may not start until the relevant regulator has approved a request. This can be some time after the storm and may not cover all the costs.
Timing – our regulated revenue entitlements are set based on our regulatory price controls. We use forecast energy volumes that we expect to deliver to set the billing tariff. Where there is a difference between the actual and estimated energy volumes, the amount of revenue we collect will be different. Differences arising from volume and revenue entitlement changes are typically collectable in the following year for the US. For information about timing in the UK, see pages 08 and 09.
Financial review pages 06 – 09
UK regulation pages 160 – 162
US regulation pages 162 – 165
Our transmission and distribution businesses operate as regulated monopolies. Regulators safeguard customers’ interests by setting the level of charges we are allowed to pass on, so that we provide value for money while maintaining safe and reliable networks, and deliver good customer service.
20 National Grid Annual Report and Accounts 2013/14

Strategic Report Corporate Governance Financial Statements Additional Information
How our strategy creates valueCustomer and community valueSafety and reliability – we aim to provide reliable networks safely, which is essential to safeguard our customers, employees and the communities in which we operate.
Affordability – we aim to provide services in a cost-efficient way, which helps to reduce the impact on customer bills.
Customer service – providing essential services that meet the needs of our customers and communities is a crucial part of the value they expect from us.
Sustainability – we aim to protect the environment and preserve resources for current and future generations.
Emergency services – we provide telephone call centres, coordinate the response to gas emergencies, and respond to severe weather events.
Community engagement – we listen to the communities we serve and work hard to address concerns about the development of our networks. Our employees volunteer for community-based projects and we support educational initiatives in schools.
Shareholder valueRegulatory frameworks – operating within sound regulatory frameworks provides stability. Ensuring these frameworks maintain a balance between risk and return underpins our investment proposition.
Reputation – our approach to safety and our reliability record underpin our reputation. These are important factors that enable positive participation in regulatory discussions and the pursuit of new business opportunities.
Efficient operations – efficient capital and operational expenditure allows us to deliver network services at a lower cost and reduces working capital requirements.
Maximising incentives – positive performance under incentive mechanisms, and delivery of the outputs our customers and regulatory stakeholders require, helps us to make the most of our allowed returns.
Funding and cash flow management – securing low cost funding and carefully managing our cash flows are essential to maintaining strong returns for our investors.
Disciplined investment – we can achieve future revenue and earnings growth by increasing our regulatory asset value and rate base in line with regulatory capital allowances. Investment in non-regulated assets helps us to use and enhance our core capabilities with the aim of delivering attractive returns.
Our business model – a virtuous circle of growth
CREATINGVALUE
Cash flow
Revenue
Customers andcommunities
Reinvestment inour business
Customers and communities – our focus on safety and reliability, as well as efficient investment in our networks, means that we are able to provide our customers and the communities in which we operate with the highest quality service we can. This makes sure they are able to access vital and reliable services whenever they need, wherever we operate.
Reinvestment in our business – to continue generating reasonable returns for our shareholders and revenue growth, we reinvest efficiently in our regulated assets. This is critical to the sustainability of our business. By challenging our investment decisions, we continue to deliver reliable, cost-effective networks that benefit our customers.
Revenue – the majority of our revenue is set in accordance with our regulatory agreements. This allows us a level of certainty over future revenues if we continue to meet safety and reliability targets, as well as the efficiency and innovation targets included in the new RIIO licence agreements in our UK regulated businesses.
Cash flow – our ability to convert revenue to cash is an important factor in the ongoing reinvestment in our business and our ability to provide sustainable value growth for our shareholders. Our focus on efficient development of our networks is important in maximising free cash flow.
Our vision and strategic objectives explain what is important to us, so we can meet our commitments and deliver value.
21

Internal control and risk management
National Grid is exposed to a variety of uncertainties that could have a material adverse effect on:
• the Company’s financial condition;• our operational results;• our reputation; and• the value and liquidity of our shares.
The Board is committed to protecting and enhancing our reputation and assets, while safeguarding the interests of our shareholders. It has overall responsibility for the Company’s system of risk management and internal control.
Below, we describe the main arrangements put in place so that the Board can carry out this responsibility and so that its members can be assured of the integrity of the Company’s risk management and internal control systems, financial information and financial controls.
Risk management approachOur Company-wide corporate risk management process provides a framework through which we can consistently identify, assess, prioritise, manage and report risks. It is designed to support delivery of our strategic and business objectives described on pages 14 and 15.
The risks we identify are collated in risk registers and are reported at functional and regional levels of the Company. These registers include an assessment of how likely it is that each risk will materialise.
They highlight the potential ‘worst case credible’ financial and reputational impact of the risk and details of mitigation activities. The risk registers also describe the adequacy of our existing risk controls. The main risks for our UK and US businesses are summarised and are reviewed, reported and discussed regularly by our senior leadership team.
In addition, we also record the main strategic risks for the Company which are developed through discussions with the Executive leadership team. These risks are reported and discussed with the Executive Committee and Audit Committee every six months and by the Chief Executive through quarterly performance reports.
During 2013/14 the Board reviewed the main elements of our risk management process. This included validating the risks included in our corporate risk profile and consideration of how we treat special categories of risks, such as potential extreme catastrophic events and emerging risks (uncertainties that are still developing). The results of the Board review are being incorporated into the ongoing work of the Corporate Risk team.
Our Board also sets and monitors risk appetite annually. We have a framework that differentiates our appetite for risk by categories. At the annual review meeting, the Board compares the decisions the Company has taken to the appetite level in each category. It then considers the appropriate appetite levels to set for the year ahead.
Our principal risksAccepting that it is not possible to identify, anticipate or eliminate every risk that may arise and that risk is an inherent part of doing business, our risk management process aims to provide reasonable assurance that we understand and manage the main uncertainties that we face in delivering our objectives.
This includes consideration of inherent risks, which exist because of the nature of day-to-day operations in our industry. An overview of the key inherent risks we face is provided on pages 167 to 169. Examples include:
• aspects of the work we do could potentially harm employees, contractors, members of the public or the environment;
• we may suffer a major network failure or interruption, or may not be able to carry out critical non-network operations due to the failure of technology supporting our business-critical processes;
• changes in foreign currency rates, interest rates or commodity prices could materially impact earnings or our financial condition;
• an inability to access capital markets at commercially acceptable interest rates could affect how we maintain and grow our businesses; and
• customers and counterparties may not perform their obligations.
22 National Grid Annual Report and Accounts 2013/14
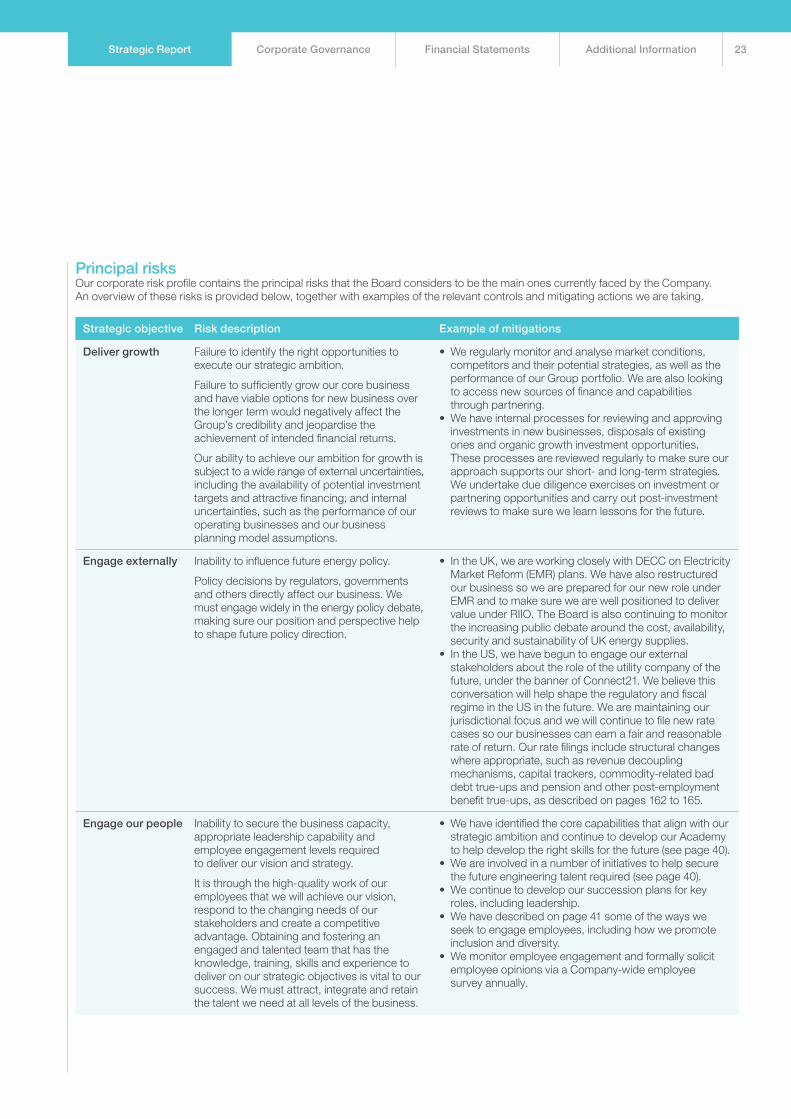
Strategic Report Corporate Governance Financial Statements Additional Information
Principal risksOur corporate risk profile contains the principal risks that the Board considers to be the main ones currently faced by the Company. An overview of these risks is provided below, together with examples of the relevant controls and mitigating actions we are taking.
Strategic objective Risk description Example of mitigations
Deliver growth Failure to identify the right opportunities to execute our strategic ambition.
Failure to sufficiently grow our core business and have viable options for new business over the longer term would negatively affect the Group’s credibility and jeopardise the achievement of intended financial returns.
Our ability to achieve our ambition for growth is subject to a wide range of external uncertainties, including the availability of potential investment targets and attractive financing; and internal uncertainties, such as the performance of our operating businesses and our business planning model assumptions.
• We regularly monitor and analyse market conditions, competitors and their potential strategies, as well as the performance of our Group portfolio. We are also looking to access new sources of finance and capabilities through partnering.
• We have internal processes for reviewing and approving investments in new businesses, disposals of existing ones and organic growth investment opportunities. These processes are reviewed regularly to make sure our approach supports our short- and long-term strategies. We undertake due diligence exercises on investment or partnering opportunities and carry out post-investment reviews to make sure we learn lessons for the future.
Engage externally Inability to influence future energy policy.
Policy decisions by regulators, governments and others directly affect our business. We must engage widely in the energy policy debate, making sure our position and perspective help to shape future policy direction.
• In the UK, we are working closely with DECC on Electricity Market Reform (EMR) plans. We have also restructured our business so we are prepared for our new role under EMR and to make sure we are well positioned to deliver value under RIIO. The Board is also continuing to monitor the increasing public debate around the cost, availability, security and sustainability of UK energy supplies.
• In the US, we have begun to engage our external stakeholders about the role of the utility company of the future, under the banner of Connect21. We believe this conversation will help shape the regulatory and fiscal regime in the US in the future. We are maintaining our jurisdictional focus and we will continue to file new rate cases so our businesses can earn a fair and reasonable rate of return. Our rate filings include structural changes where appropriate, such as revenue decoupling mechanisms, capital trackers, commodity-related bad debt true-ups and pension and other post-employment benefit true-ups, as described on pages 162 to 165.
Engage our people Inability to secure the business capacity, appropriate leadership capability and employee engagement levels required to deliver our vision and strategy.
It is through the high-quality work of our employees that we will achieve our vision, respond to the changing needs of our stakeholders and create a competitive advantage. Obtaining and fostering an engaged and talented team that has the knowledge, training, skills and experience to deliver on our strategic objectives is vital to our success. We must attract, integrate and retain the talent we need at all levels of the business.
• We have identified the core capabilities that align with our strategic ambition and continue to develop our Academy to help develop the right skills for the future (see page 40).
• We are involved in a number of initiatives to help secure the future engineering talent required (see page 40).
• We continue to develop our succession plans for key roles, including leadership.
• We have described on page 41 some of the ways we seek to engage employees, including how we promote inclusion and diversity.
• We monitor employee engagement and formally solicit employee opinions via a Company-wide employee survey annually.
23
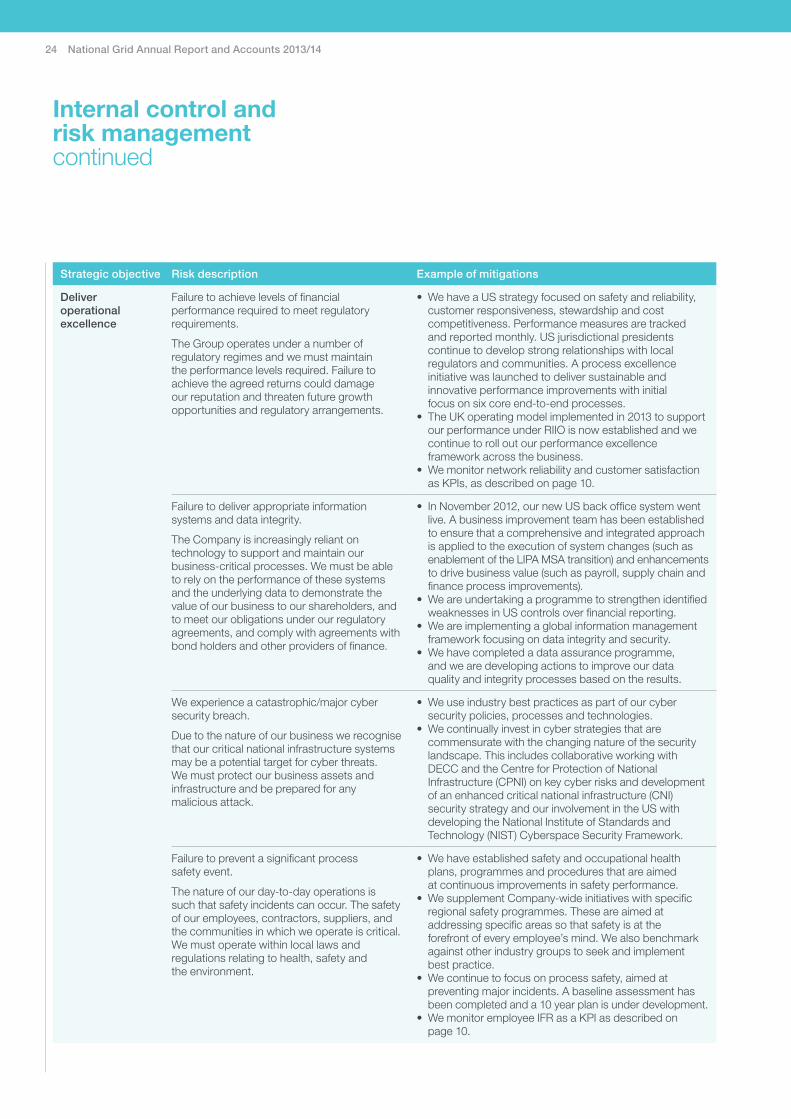
Internal control and risk management continued
Strategic objective Risk description Example of mitigations
Deliver operational excellence
Failure to achieve levels of financial performance required to meet regulatory requirements.
The Group operates under a number of regulatory regimes and we must maintain the performance levels required. Failure to achieve the agreed returns could damage our reputation and threaten future growth opportunities and regulatory arrangements.
• We have a US strategy focused on safety and reliability, customer responsiveness, stewardship and cost competitiveness. Performance measures are tracked and reported monthly. US jurisdictional presidents continue to develop strong relationships with local regulators and communities. A process excellence initiative was launched to deliver sustainable and innovative performance improvements with initial focus on six core end-to-end processes.
• The UK operating model implemented in 2013 to support our performance under RIIO is now established and we continue to roll out our performance excellence framework across the business.
• We monitor network reliability and customer satisfaction as KPIs, as described on page 10.
Failure to deliver appropriate information systems and data integrity.
The Company is increasingly reliant on technology to support and maintain our business-critical processes. We must be able to rely on the performance of these systems and the underlying data to demonstrate the value of our business to our shareholders, and to meet our obligations under our regulatory agreements, and comply with agreements with bond holders and other providers of finance.
• In November 2012, our new US back office system went live. A business improvement team has been established to ensure that a comprehensive and integrated approach is applied to the execution of system changes (such as enablement of the LIPA MSA transition) and enhancements to drive business value (such as payroll, supply chain and finance process improvements).
• We are undertaking a programme to strengthen identified weaknesses in US controls over financial reporting.
• We are implementing a global information management framework focusing on data integrity and security.
• We have completed a data assurance programme, and we are developing actions to improve our data quality and integrity processes based on the results.
We experience a catastrophic/major cyber security breach.
Due to the nature of our business we recognise that our critical national infrastructure systems may be a potential target for cyber threats. We must protect our business assets and infrastructure and be prepared for any malicious attack.
• We use industry best practices as part of our cyber security policies, processes and technologies.
• We continually invest in cyber strategies that are commensurate with the changing nature of the security landscape. This includes collaborative working with DECC and the Centre for Protection of National Infrastructure (CPNI) on key cyber risks and development of an enhanced critical national infrastructure (CNI) security strategy and our involvement in the US with developing the National Institute of Standards and Technology (NIST) Cyberspace Security Framework.
Failure to prevent a significant process safety event.
The nature of our day-to-day operations is such that safety incidents can occur. The safety of our employees, contractors, suppliers, and the communities in which we operate is critical. We must operate within local laws and regulations relating to health, safety and the environment.
• We have established safety and occupational health plans, programmes and procedures that are aimed at continuous improvements in safety performance.
• We supplement Company-wide initiatives with specific regional safety programmes. These are aimed at addressing specific areas so that safety is at the forefront of every employee’s mind. We also benchmark against other industry groups to seek and implement best practice.
• We continue to focus on process safety, aimed at preventing major incidents. A baseline assessment has been completed and a 10 year plan is under development.
• We monitor employee IFR as a KPI as described on page 10.
24 National Grid Annual Report and Accounts 2013/14

Strategic Report Corporate Governance Financial Statements Additional Information
Our internal control processWe have a number of processes to support our internal control environment. These processes are managed by dedicated specialist teams, as described in the box on the right. Oversight of these activities is provided through regular review and reporting to the appropriate Board committees as outlined in the Corporate Governance section on pages 44 to 57.
Reviewing the effectivenessof our internal controlEach year the Board reviews the effectiveness of our internal control process, including financial reporting, to make sure it remains robust. The latest review covered the financial year to 31 March 2014 and the period to the approval of this Annual Report and Accounts. It included:
• the Certificate of Assurance for noting following approval by the Audit Committee to provide overall assurance around the effectiveness of National Grid’s risk management and internal controls systems;
• where appropriate, assurance from our committees, with particular reference to the reports received from the Audit, and Safety, Environment and Health Committees on reviews undertaken at their meetings; and
• assurances about the certifications required under Sarbanes-Oxley as a result of our US reporting obligations.
Our risk management and internal control processes comply with the Turnbull guidance on internal control and the requirements of the UK Corporate Governance Code. They are also the basis of our compliance with obligations set by the Sarbanes-Oxley Act 2002 and other internal assurance activities.
Internal control over financial reportingWe have specific internal mechanisms to govern the financial reporting process and the preparation of the Annual Report and Accounts. Our financial controls guidance sets out the fundamentals of internal control over financial reporting, which are applied across the Company.
Our financial processes include a range of system, transactional and management oversight controls. In addition, our businesses prepare detailed monthly management reports that include analysis of their results along with comparisons to relevant budgets, forecasts and prior year results. These are presented to and reviewed by senior management within our Finance function.
These reviews are supplemented by quarterly performance reviews, attended by the Chief Executive and Finance Director which consider historical results and expected future performance and involve senior management from both operational and financial areas of the business.
Each month the Finance Director presents a consolidated financial report to the Board.
As part of our assessment of financial controls, we have identified a number of weaknesses in our US financial control framework. Plans are in place to remediate these. For more information, including our opinion on internal control over financial reporting, see page 170.
Our internal control environment
Our specialist teams that manage the processes supporting our internal control environment are described below.
Risk management:• works with the Board to determine risk appetite and establish and
implement risk management policies;• is responsible for the independent review and challenge of risk information
throughout the business, compilation and analysis of risk profiles and monitoring risk management processes within the Company; and
• regularly reports on risks to the regional level and Board level oversight committees.
Ethics and compliance management:• maintains our standards of ethical business conduct;• promotes ethical behaviour and monitors compliance with external
legal and regulatory requirements; and • operates our whistle-blower helplines and supports activities to prevent
and detect bribery.
Corporate audit:• develops and executes a risk-based audit plan; and• provides independent, objective assurance to the Audit Committee,
SEH Committee and the Executive Committee on the extent to which control and governance frameworks are operating effectively.
Safety, environment and health:• develops policy recommendations for the Board;• monitors safety, environment and health performance; and• works with process owners to deliver our safety, environment and
health objectives.
Internal controls:• works with process owners to identify, document and test the design
and operation of internal control over financial reporting; and • helps refine and improve controls where required.
25

How executive remuneration aligns to Company strategy
The Remuneration Committee determines remuneration policy and practices through which we aim to promote the success of the Company by attracting, motivating and retaining high-calibre Executive Directors and other senior employees to deliver value for our shareholders, customers and the communities in which we operate.
Our strategy To be a recognised leader in the development and operation of safe, reliable and sustainable energy infrastructure, to meet the needs of our customers and communities and to generate value for our investors.
Our strategic objectives
Deliver operational excellence
Engage our people
Stimulate innovation
Engage externally
Embed sustainability
Drive growth
The Remuneration Committee aligns the remuneration policy to our Company strategy and main business objectives. Performance-based incentives are earned through achieving demanding targets for short-term business and individual performance, as well as creating long-term value for our shareholders, customers and the communities in which we operate.
Remuneration Committee review of remunerationDuring the year, the Remuneration Committee undertook a detailed review of the remuneration arrangements for Executive Directors, with the aim of achieving further alignment between executive reward and long-term shareholder value.
As a result of this review, the Committee is proposing some significant changes to the arrangements for the 2014/15 financial year, and these are set out in detail on pages 58 to 73. Shareholders are being asked to approve these changes at the AGM on 28 July 2014.
The Committee believes that the changes will further enhance the long-term alignment between executive remuneration and the delivery of the corporate strategy.
The information set out below describes current rather than future policy.
Alignment to strategyAnnual Performance Plan (APP)Our APP aims to incentivise and reward the achievement of annual financial and strategic business measures, and the delivery of annual individual objectives. Performance metrics, including corporate financial measures and individual objectives, are agreed at the start of each performance year and are aligned with the strategic business priorities for that year.
The table below shows the financial measures and their relative weightings that were included within the APP for the Executive Directors for 2013/14:
Andrew Bonfield
andSteve
HollidayTom King
Nick Winser
Adjusted EPS 24% 24% 24%Cash flow (Group or regional) 38% 28% 43%UK RoE 14% n/a 33%US RoE 14% 24% n/aUS capital plan delivery 10% 24% n/a
Financial measures together represent 70% of the APP.
Individual performance objectives in the APP reflect 30% of the plan and are defined in terms of target and stretch performance requirements. The performance objectives change each year, depending upon business priorities. Examples of individual objectives include those relating to safety, stakeholder relations, employee engagement and capability, and the development of Group and financial strategy.
In order to provide balance for all our stakeholders, at the end of the year the Remuneration Committee has discretion to reduce APP awards to take account of any safety, customer, service-related, environmental or governance issues that may have occurred.
Our vision and strategy pages 14 – 15
Remuneration Report pages 58 – 73
26 National Grid Annual Report and Accounts 2013/14

Strategic Report Corporate Governance Financial Statements Additional Information
Long Term Performance Plan (LTPP)Our LTPP aims to drive long-term performance, aligning Executive Director incentives to key strategic objectives and shareholder interests. Performance measures set are considered to either drive or measure long-term value within the business, aligning executive reward with long-term sustainable performance.
The table below shows the performance measures and the relative weightings of these that were included within the LTPP awards made to the Executive Directors during 2013/14:
Performance measure Weighting Definitions and performance period
Adjusted earnings per share (EPS)
50% Threshold performance – where EPS growth exceeds RPI growth by three percentage points
Stretch performance – where EPS growth exceeds RPI growth by eight percentage points or more
Performance period – three years
Relative total shareholder return (TSR)
25% Threshold performance – where TSR is at the median of the FTSE 100
Stretch performance – where TSR performance is 7.5 percentage points or more above that of the median of the FTSE 100
Performance period – three years
UK and US RoE 25% Threshold performance – where allowed regulatory returns are achieved (UK) or under-performed by one percentage point (US)
Stretch performance – where allowed regulatory returns are out-performed by at least two percentage points (UK) or at least one percentage point (US)
Performance period – four years
If the Remuneration Committee considers the underlying performance of the Company does not justify the vesting of LTPP awards, even if some or all of the performance measures are satisfied in whole or in part, it can declare that some or all of the awards lapse.
For full details about our remuneration policy and how it is implemented, please see the Remuneration Report on pages 58 to 73.
27

Trusted to provide a reliable service for our customersNational Grid’s UK Gas Distribution networks serve thousands of businesses across a large central region of the UK, connected by over 130,000 kilometres of our gas distribution pipeline. Customers, like the cafe shown here in Shoreditch, London, rely on a safe and dependable service from us so that they can deliver the products and services that make their own businesses successful.
National Grid Annual Report and Accounts 2013/1428

Strategic Report Corporate Governance Financial Statements Additional Information
Principal operationsOverview of our UK RIIO-regulated businesses during 2013/14Over the past year there have been significant regulatory changes in the UK, most notably the introduction of RIIO and its associated incentives.
The RIIO regulatory framework, which began on 1 April 2013, incentivises us to operate efficiently. It also provides opportunities in terms of specific incentives to engage and serve our customers and stakeholders well.
There have been significant Government and regulatory policy changes affecting our business, including the introduction of EMR and the evolution of the system operator role in the long-term planning of the network. Also, with a likely tightening of the margin between electricity supply and demand in the mid to late part of the decade, additional tools have been developed to help us balance the electricity transmission system.
The planning process for obtaining consent for major infrastructure projects has also changed, requiring significant consultation before an application to the Planning Inspectorate. Our Kings Lynn B connection project was the first to go through the new process and was granted consent by the Secretary of State in December 2013.
Progress during 2013/14Our activities and achievements in the UK during 2013/14 have included:
• Achieving an employee injury frequency rate of 0.06, meeting our target of world-class performance. Initiatives during 2013/14 included a visible safety leadership programme with a renewed focus on behavioural safety and excellent role modelling, as well as introducing best practice incident analysis tools and systems from the US into our UK business so we can improve how we learn from incidents.
• Making significant progress on the implementation of our new UK operating model by concluding the managerial and staff appointment process in our Transmission business.
• Working with trade unions to agree revisions to pay and terms and conditions for employees. We have also agreed changes to our UK pension arrangements for all employees who have defined benefit (DB) or defined contribution (DC) schemes. These changes aim to make sure our total reward package remains both competitive in the market and sustainable under RIIO.
• Working on the 2013 triennial valuations of our two DB pension plans (for further information see note 29 under ‘Notes to the consolidated financial statements’).
• Maintaining resilient networks during the wettest winter on record. Our networks withstood the winter storms well, when some electricity distribution networks had significant issues. We have installed extra flood protection at critical UK sites, helping maintain reliability and reduce
costs. Following the severe wet weather over Christmas 2013 we have been working on future potential network resilience issues. For details about our reliability performance see page 10.
• Renegotiating our key contracts and introduced new contractor relationships so we can deliver our RIIO outputs efficiently and provide clarity on the accountability for safety between ourselves and our contractors.
• Continuing to focus on delivering excellent levels of service. 2013/14 has been the first year in which we have had incentives for customer and stakeholder satisfaction for our regulated businesses. Ofgem set a baseline target of 6.9 for customer and stakeholder satisfaction for our regulated transmission businesses with scoring ranging from 1 – very dissatisfied to 10 – very satisfied. We have performed well in our customer surveys, scoring 7.2 for our Gas Transmission business and 7.4 for our Electricity Transmission business. The stakeholder surveys are newly introduced but early indications are that both transmission businesses are in line to achieve good results for stakeholder satisfaction.
• Under RIIO our gas distribution customer satisfaction results are now reported on an annual basis, rather than quarterly, which was how we reported them under our previous price control. We will publish the results on our website in the summer as part of our commitment to our stakeholders, and in our Annual Report and Accounts for 2014/15.
• Extensive involvement in the development of new network codes to underpin the European internal energy market.
• Focusing on changing our ways of working – supporting the development of our global performance excellence framework with targeted roll-out in the UK. Our approach has been to build up the capability requirements through early adopters before starting the full-scale roll-out over the coming months.
Principal risksOur regional risk profile describes the main risks our UK business faces. Below, we provide an overview of some of the risk themes we are managing:
• the risk of changes to the complex political and regulatory agenda for UK and European energy policy development and their potential implications for our business;
• challenges associated with making sure the data required to deliver business processes and regulatory requirements is complete, accurate and consistent;
• the impact of changes in our business structure and processes on our ability to continue to perform under RIIO; and
• continued management of safety, security and network resilience.
29

What we doWe own the electricity transmission system in England and Wales. Our networks comprise approximately 7,200 kilometres (4,470 miles) of overhead line, 1,400 kilometres (870 miles) of underground cable and 335 substations.
We are also the national electricity transmission system operator, responsible for both the England and Wales transmission system, and the two high voltage transmission networks in Scotland, which we do not own.
Day-to-day operation of the system involves the continuous real-time matching of demand and generation output. We are also designated as system operator for the new offshore electricity transmission regime.
Where we are headingAlthough demand for electricity is generally increasing around the world, in the UK it is expected to remain broadly flat over the next five to 10 years.
Changes in the sources and characteristics of generation connecting to our network mean we need to develop the way we balance and operate our network to accommodate these sources, including wind, new and large-scale nuclear generation, and many embedded sources that are connected to local networks and not our transmission grid.
Industry forecasts indicate there will be a tightening of the margin between the available supply of electricity and the demand for it over the next few years. We have a central role in developing the reform of the electricity market, which is designed to incentivise new generation to be built. We have also developed two new balancing services allowing the market to provide us with additional tools to balance the network if required.
Over the last 12 months some generators have delayed their connection dates to the network and this means our future investment profile for electricity transmission is flatter than in previous years. But we are ready to respond to connection dates when we need to. We will continue to renew our network to deliver the network reliability our customers require as efficiently as possible.
What we’ve achieved during 2013/14• We made significant progress with our network
upgrade plans. We are pleased with our progress on the London Power Tunnels project and have now started site works on the first 600 kV subsea HVDC link in the world. Connecting Scotland and England, this link will support the export of low carbon Scottish generation.
• In March 2014, the new Transmission National Control Centre in Warwick became operational. This will help our focus on the future complexities of network security, energy management and streamlining our operational and safety switching
activities, increasing the potential for access to the transmission system.
• We improved our asset maintenance policy, which will provide greater efficiency for our maintenance programme. We are implementing the policy throughout 2014 to minimise disruption to customers and planned work.
• We worked closely with DECC and Ofgem to help inform and manage security of supply through a period of significant change in the UK energy market.
• We have carried out analysis to help inform the Government’s decisions on energy policy as well as administering key parts of the enduring regime.
• We have developed two new balancing services that could be used to provide additional reserves to support the operation of the electricity transmission system if margins continue to tighten towards the middle of this decade. These new services, known as the Demand Side Balancing Reserve and the Supplemental Balancing Reserve, were approved by Ofgem in December 2013, and the associated funding arrangements approved in April 2014. We will tender for these services if they are needed for the forthcoming winters.
Priorities for the year ahead• Work with our contract partners to continue
improving safety performance. • Engage with customers and stakeholders while
we progress our major infrastructure projects through the planning process.
• Continue the roll-out of our new performance excellence way of working across Electricity Transmission.
• Develop new, innovative ways to deliver the network reliability our customers require, at minimum cost.
• Build on the analysis results that informed the first EMR delivery plan and successfully implement and operate the Capacity Market and Contracts for Difference Feed-in Tariff regime, as part of the Government’s EMR project. This will support a sustainable, affordable and secure electricity market into the future, in addition to the procurement of balancing services to support mid-decade capacity margins.
• Shape development in the UK and EU energy industry by continuing the development of network codes to support the completion of a European Internal Energy Market in 2014.
30%UK Electricity Transmission adjusted operating profit of Group total
Principal operations continued
UK Electricity Transmission
Thanks to our installed extra flood protection at critical UK sites our networks withstood the winter storms well, helping maintain reliability and reduce costs.
30 National Grid Annual Report and Accounts 2013/14

Strategic Report Corporate Governance Financial Statements Additional Information
What we do We own and operate the gas national transmission system in Great Britain, with day-to-day responsibility for balancing demand. Our network comprises approximately 7,660 kilometres (4,760 miles) of high pressure pipe and 23 compressor stations.
Where we are heading The UK’s sources of gas are changing – as gas from the UK continental shelf is being depleted, we are becoming increasingly reliant on imports from Europe and elsewhere. This also means that the traditional flow of gas from the North to the South is changing.
To ensure we continue delivering a safe, reliable and secure gas supply as we develop our asset replacement programmes, we need to make sure we consider the future operational needs of the network.
We will continue to work closely with our customers and stakeholders to adapt our network and our services so we can meet their needs economically and efficiently.
What we’ve achieved in 2013/14• We delivered our strongest-ever safety
performance across all areas, achieving 12 months without a single lost time injury to either our employees or contractors and without experiencing any serious process safety incidents.
• We delivered multiple innovation projects using the Network Innovation Allowance funding mechanism, including 3D models that allow for more efficient and cost-effective construction.
• We have adapted our ways of working so we can meet the needs of our customers and stakeholders and deliver value under RIIO. For example, we used innovative techniques to protect a section of the pipeline that carries gas from the LNG importation terminal in west Wales, prior to the construction of a new road. This meant we were able to meet the timescales of the local authority building the road without disrupting gas supply to consumers.
• We have delivered record levels of compressor availability in our network, peaking at 98%, after investing in our fleet of compressors in the summer of 2013 and by introducing improvements to our maintenance and repair methods.
Priorities for the year ahead• Continue to improve safety performance by
completing the roll-out of the visual safety leadership culture programme to every employee in our Gas Transmission business and implementing new ‘safe control of operations’ working procedures.
• Work with our customers and stakeholders to develop an enduring compressor replacement strategy that makes sure we comply with environmental legislation and meets future system needs.
• Complete the deployment of our new performance excellence way of working across all teams in our Gas Transmission business after the successful implementation at two of our compressor sites in 2013/14.
• Support our customers in the transition to new commercial frameworks managing future capacity and connection arrangements to the gas transmission system.
• Shape developments in the UK and EU energy market by making sure that the new European codes governing the operation of the gas market in the UK are successfully introduced for our customers.
UK Gas Transmission
11%UK Gas Transmission adjusted operating profit of Group total
31

Trusted for 50 yearsDerek Hicks began working at National Grid in 1963 as an industrial and commercial Gas Fitter in the City of London. In August 2013 he celebrated his 50 year career milestone, having dedicated his entire working life to our Company.
32 National Grid Annual Report and Accounts 2013/14

Strategic Report Corporate Governance Financial Statements Additional Information
We own and operate four of the eight regional gas distribution networks in Great Britain. Our networks comprise approximately 131,000 kilometres (81,000 miles) of gas distribution pipeline and we transport gas from the gas national transmission system to around 10.9 million consumers on behalf of 32 gas shippers.
Gas consumption in our UK networks was 264 TWh in 2013/14 compared with 306 TWh in 2012/13. We manage the national gas emergency number (0800 111 999).
This service, along with the enquiries lines, appliance repair helpline and meter enquiry service, handled nearly 2.5 million calls during 2013/14.
Where we are headingWe have articulated an ambition for 2017 – to be the best gas distribution business in Britain. We are using modern technology and new, innovative techniques to develop gas networks that are fit for the future, safe and secure, keeping people warm.
Our regulator is able to make direct comparisons between the performance of our four gas distribution networks, and others. Customer expectations are increasing across all industries and we are responding by focusing more effort than ever before on providing a good-quality service at an affordable price to all our customers and stakeholders. We will do this by carrying out our works in the most efficient way possible.
What we’ve achieved during 2013/14 • We have improved our overall safety performance
(see page 10). We have focused on reducing cable strikes with programmes like ‘dial before you dig’ and seen a 14% reduction in cable strikes during 2013/14.
• The number of customer complaints we received during 2013/14 was 13.3% less than the previous year. However, we know our customers want more and we are focusing our attention on improving even further, particularly the experience customers have when they want to connect to our network.
• Last year we listened to what our stakeholders had to say through our consultation process and we made 29 commitments to improve in areas of stakeholder priority such as fuel poverty, vulnerability, gas safety – including carbon monoxide awareness – and new and innovative ways of working.
• We have been simplifying and improving the way we work so that our employees can be as effective as possible and our customers get a service they value. We are doing this by looking for ways to streamline, innovate and improve everyday working practices with our business and our strategic partners who help us reach our goals.
• A notable example of innovation during 2013/14 has been the use of a repair robot called CISBOT to fix a leaking 18 inch gas main in London. This was the first time in Great Britain that an 18 inch gas main has been fixed by robots. This kind of automation reduces traffic disruption and avoids the need to shut off the gas while doing the repair work, making life easier for people.
• Working with Future Biogas we successfully commissioned the first commercial biogas-to-grid project in Doncaster. The biomethane injection is produced from a maize feedstock and is the first of 20 similar projects that we are committed to connect during 2014/15. This kind of project promotes the future role of gas in the transition to a low carbon economy and is also the first of 80 connections we expect to complete over the RIIO period.
Priorities for the year aheadAll our priorities support our Gas Distribution ambition and are above and beyond meeting our standards.
• Achieve our safest year ever by improving the safety to members of the public, continuing to reduce cable strikes and making improvements that will help reduce the number of third-party encroachments.
• Improve the experience our customers have with us and the way in which we engage with our stakeholders, including reducing complaints and rejuvenating our customer connections process.
• Invest in our people to help them develop their skills and increase their capability, including a focus on the role of the supervisor and promoting accelerated development assignments.
• Engage with our people by embedding performance excellence in the remainder of our Gas Distribution business and delivering on our enhanced engagement strategy.
• Drive innovation so we can improve the services and value we provide to our customers by both maximising existing technology and identifying new opportunities for future development.
• Improve the quality and availability of our data and management information so we can operate more efficiently in the future.
UK Gas Distribution
Principal operations continued
25%UK Gas Distribution adjusted operating profit of Group total
33

Trusted to support education and skills in communities National Grid provides electricity delivery services to the City of Buffalo in upstate New York. The Beecher Clubhouse, shown in this photo, is one of a number of Boys & Girls Clubs of Buffalo. National Grid has partnered with the Boys & Girls Clubs to deliver an after school, hands-on STEM programme called Youth Exploring Science (YES!) education programme, to help support the long-term economic prosperity for the region.
34 National Grid Annual Report and Accounts 2013/14

Strategic Report Corporate Governance Financial Statements Additional Information
Principal operations continued
US Regulated business
What we doWe own and operate electricity distribution networks in upstate New York, Massachusetts, and Rhode Island. Through these networks we serve approximately 3.4 million electricity consumers in New England and upstate New York.
Our US gas distribution networks provide services to around 3.6 million consumers across the northeastern US, located in service territories in upstate New York, New York City, Long Island, Massachusetts and Rhode Island. We added 31,145 new gas heating customers in these areas in 2013/14.
We own and operate an electricity transmission system of approximately 14,328 kilometres (8,903 miles) spanning upstate New York, Massachusetts, Rhode Island, New Hampshire and Vermont, operating 169 kilometres (105 miles) of underground cable and 521 substations, with a further 12 planned.
We also own and operate 50 fossil fuel-powered units on Long Island that together provide approximately 3,800 MW of power under contract to LIPA. A 15 year Power Supply Agreement (PSA) with LIPA was renewed in May 2013 for 3,634 MW of capacity, comprising eight dual fuel (gas/oil-fired) steam units at three sites, 11 dual fuel combustion turbine units, and 27 oil-fired combustion turbine/diesel units. Under a separate contract with LIPA, four dual fuel combustion turbine units provide an additional 160 MW of capacity.
We are responsible for billing, customer service and supply services. We forecast, plan for and procure approximately 15 billion standard cubic metres of gas and 32 TWh of electricity annually across three states.
Where we are headingWe have introduced Connect21, our thinking on advancing America’s natural gas and electricity infrastructure beyond its 20th century limitations, and creating a more customer-centric, resilient, agile, efficient and environmentally sound energy network.
Our approach is threefold:
• Build a resilient backbone for our energy system that can provide reliable, flexible electric and gas service to all customers and integrate clean energy wherever it is located on the grid.
• Inform customers about choices available to them to meet their energy needs and educate them on how to manage their use in the most cost-effective way.
• Offer customised solutions to customers who want different levels of service.
Connect21 will help develop America’s economic and environmental health in three very important ways:
• Drive economic growth: invest in our networks in ways that enhance state and local economies and encourage innovation, while simultaneously reducing the stress currently being exerted on our environment and public health.
• Promote cleaner energy: work with the industry to find new ways to deliver cleaner energy, and more importantly encourage consumers to use energy more efficiently. We are already making progress on cleaner sources of energy, such as natural gas. The amount of energy generated by natural gas in the US is expected to double between 1990 and 2040, making gas the leading fuel for electricity generation.
• Advance innovative technologies: harness existing technologies to put energy information and usage control in the hands of customers, which will help drive improvements in our consumption behaviours. Leverage technology to build smarter, more resilient electric and natural gas networks that can withstand the extreme weather.
Principal risksOur regional risk profile describes the main risks our US business faces. The current risk themes for the US are:
• our ability to manage data and systems improvements required to deliver core business processes and regulatory requirements;
• our ability to recover costs through existing rate-making mechanisms and to influence the development of the future US utility business model; and
• safety performance and network reliability, security and resilience.
What we’ve achievedWithin each of our jurisdictions we have focused on Elevate 2015, our journey towards operational excellence. This focus has encompassed our end-to-end business processes, including:
• delivery;• maintenance and operation of electric and gas
assets;• supply chain management;• meter to cash; and• emergency response.
Four main principles govern our business improvement strategy: safety and reliability; stewardship; customer responsiveness; and cost competitiveness.
31%US Regulated business adjusted operating profit of Group total
35

All jurisdictions have benefited from emergency response improvements. This has been a focus for the US business in response to the major storms we have experienced in recent years, such as Superstorm Sandy in 2012. Our Emergency Management Policy reinforces our commitment to our customers and the communities we serve. We strive to use effective emergency management principles and protocols that enhance our ability to provide safe and reliable energy services.
We have continued to strengthen resilience by assessing vulnerabilities throughout our system, flood-proofing critical equipment, readying more restoration crews, repair equipment and fuel supplies, reducing the risk of downed power lines from fallen trees and branches, and enhancing communications with our customers and stakeholders. During 2013/14 we introduced some new tools and initiatives:
• Weather predictive tool: allows us to use data from past storm events to learn and predict future potential damage, which will help our storm response planning.
• Expanded contractor relationships: expanding contractor relationships that cover a wider geographic area to increase flexibility and responsiveness in any type of storm.
• Enhanced damage assessment: by using technology now available to us (mobile devices such as tablets) we have introduced an enhanced damage assessment process that helps us to gather information from the field more quickly. Coupled with data from existing outage reporting systems, this allows us to determine where to send crews more quickly and accurately. This, in turn, will help us to determine and execute restoration times faster for customers and communities.
US enterprise resource planning system stabilisation continued, remedying the errors of poor implementation from the prior year. Over the course of the year, the US business made significant progress in the activities required to upgrade the system, with implementation expected in mid-2014. The focus is now on reducing the ongoing costs associated with the complex manual processes that are required to compensate for identified weaknesses in internal controls over financial reporting in the US. While these control weaknesses have not reduced the quality of financial statements produced, they have necessitated significant additional cost.
Overall, the business remains on track to successfully conclude the programme during 2014, with expected costs unchanged from the guidance provided last year.
Safety: we continue to make improvements on last year, including decreases in OSHA recordable incidents, road traffic collisions and lost time incidents. Still, we have much to accomplish to
reach our goal of zero injuries every day. Some of our initiatives during 2013/14 include the development and implementation of a safe motor vehicle operation policy, Smith System driver training, a soft tissue injury prevention programme, and slippery surface simulator training. Also, in a continued effort to promote safety awareness and improvement, we have shared incident reports and lessons learned briefings with all employees, on a daily basis.
Network reliability: we met all our reliability targets in Rhode Island and New York. In Massachusetts, we missed two of our electricity circuit level metrics and avoided a financial penalty due to earned offsets for good performance on our system metrics.
Customer satisfaction: we use independent customer research studies and other measures to supplement the four J.D. Power and Associates customer satisfaction studies. We saw improvements in three of the four overall J.D. Power customer satisfaction quartile results – see page 10 for details.
In terms of our achievements during 2013/14, here are some highlights from each of our jurisdictions:
Massachusetts Infrastructure investment: we invested $510 million to enhance the resilience, efficiency and safety of our infrastructure – $212 million in electric and $298 million in natural gas.
Energy efficiency: we introduced ‘Smart Energy Solutions’, a programme rolled out to 15,000 customers. The programme uses grid modernisation solutions, including advanced meters and communications systems and offers our customers better data about their energy usage, which helps them to make more informed decisions.
Gas expansion: we installed 32 miles of new gas mains, replaced 162 miles of gas mains and added more than 9,700 new natural gas customers.
Principal operations continued
US Regulated business
National Grid teams maintain and repair the gas distribution networks across Rhode Island, where we deliver gas to 252,000 customers. The team in this picture is creating a solid base to reinstate the ground after some works on Rhode Island’s gas network.
36 National Grid Annual Report and Accounts 2013/14

Strategic Report Corporate Governance Financial Statements Additional Information
Economic development: we installed 15 miles of new electric circuit in Cape Ann, and reconfigured existing circuits to release additional capacity (more than $15 million investment).
New York Infrastructure investment: we invested $1,008 million to enhance the resilience, efficiency and safety of our infrastructure – $471 million in electric and $537 million in natural gas. In partnership with the New York City Department of Environmental Protection, we launched the Newtown Creek Renewable Gas Demonstration project in Brooklyn. As part of our commitment to sustainable energy solutions, Newtown Creek is the first project in the US that directly injects renewable gas into a local distribution system by converting effluent from a wastewater treatment plant into biogas.
Energy efficiency: we are working with 13 institutions and 50 public and private companies within the Buffalo Niagara Medical Campus to enhance power quality and reliability, as well as address other energy and transportation challenges related to the expansion and development of the campus.
Gas expansion: we completed the largest oil to natural gas conversion on Long Island, saving the Northport VA Hospital nearly $3 million a year, displacing 1.5 million gallons of oil annually, and reducing carbon emissions by more than 5,000 tonnes a year.
Economic development: we provided the State University of New York at Canton (SUNY Canton) with a $750,000 Renewable Energy and Economic Development incentive to help with the completion of an on-campus wind turbine project.
Rhode IslandInfrastructure investment: we are planning to build the underground infrastructure to provide electricity to newly created land parcels following relocation of route I-195 in Providence ($3 million investment).
Energy efficiency: Rhode Island energy efficiency programmes will result in savings of more than 1.6 million MWh of electricity and 4.37 million Dth of natural gas over the lifetime of installed measures. The resulting reduction in carbon emissions is equivalent to taking more than 186,700 motor vehicles off the road for one year.
Gas expansion: the Rhode Island Public Utilities Commission (RIPUC) approved a $3 million gas expansion pilot programme to be included in the FY2014 Gas Infrastructure, Safety and Reliability (ISR) Plan.
Economic development: energy efficiency programmes resulted in more than 540 full-time equivalent jobs and should generate economic benefits of more than $237 million over the life of the installed measures (with more than $190 million from
National Grid US field operations crew leader Mark Harris.
electricity efficiency and more than $44 million in benefits from natural gas efficiency).
FERCClean Line energy investment: Clean Line Energy Partners is developing several long-haul HVDC transmission lines to connect the best renewable energy resources to communities. Five projects are currently in development which span across states in the Midwest and Southwest US. We are an equity partner in these projects and the first utility to invest with Clean Line.
DeepWater Wind: the 30 MW DeepWater Offshore Wind Farm, located off the coast of Block Island, Rhode Island is in development and could become the first offshore wind farm in the US.
We are designing and constructing the approximately 20 mile submarine transmission cable from Narragansett, Rhode Island to Block Island, Rhode Island. The transmission cable will allow the energy generated by the wind farm to access the mainland Rhode Island customers and connect Block Island Power Company (BIPCo), which will become a new wholesale customer of National Grid, to the mainland electric system. While the wind farm will provide Rhode Island customers with a sustainable source of generation, the transmission cable will allow BIPCo to reduce its dependence on diesel generation which will result in significantly lower energy prices and emissions for the residents of Block Island.
Priorities for the year ahead• Deliver a step change in safety to ensure zero
injuries each day.• Develop our people and build their capabilities for
today and the future.• Put the customer first to meet all our obligations by
working towards process excellence and successfully completing our US Foundation Program (USFP).
• Drive regulatory performance through each jurisdiction and lead the delivery of future energy networks.
37

Grain LNG Grain LNG is one of three LNG importation facilities in the UK. It was constructed in three phases, becoming operational in 2005, 2008 and 2010 respectively. It operates under long-term contracts with customers and provides importation services, storage and send out capacity on to the national transmission system. We are exploring with customers a number of developments to the Grain site to enhance its revenue earning capability.
Interconnectors The England-France interconnector is a 2,000 MW HVDC link between the French and British transmission systems with ownership shared between National Grid and Réseau de Transport d’Electricité (RTE). The interconnector is approximately 70 kilometres (43 miles) in length, with 45 kilometres (27 miles) of subsea cable. Following a significant valve replacement programme, the availability of the interconnector continues to show marked improvement and the 2013/14 average was at 83.84%. A substantial proportion of the flow continues to be in the import direction, from France to Great Britain.
BritNed is a joint venture between National Grid and TenneT, the Dutch transmission system operator. It built, and now owns and operates a 1,000 MW subsea electricity link between the UK and the Netherlands, which is approximately 260 kilometres (162 miles) in length. BritNed, which entered commercial operations on 1 April 2011, is a merchant interconnector that sells its capacity via a range of explicit and implicit auction products.
MeteringNational Grid Metering (NGM) provides installation and maintenance services to energy suppliers in the regulated market in Great Britain. It maintains an asset base of around 15 million domestic, industrial and commercial meters.
Through Ofgem’s Review of Metering Arrangements, National Grid has been appointed National Metering Manager (NMM) to facilitate the transition to smart metering in the domestic sector. To support this, NGM has also undertaken a pricing consultation to define the tariff caps to apply to traditional domestic gas metering. This took effect on 1 April 2014 and will last until the end of the transition to smart metering.
In addition, NGM has been further developing its contracts and services in the industrial and commercial market.
NGM has achieved its highest customer satisfaction scores for the last six years for both its Domestic and Industrial & Commercial businesses.
UK Property National Grid Property is responsible in the UK for the management, clean-up and disposal of surplus sites, most of which are former gas works. During 2013/14 we have sold 45 sites, exchanged on several high-profile land disposal agreements with JV partners and embarked on a new programme of holder demolitions. We have been embedding our estate management outsourcing agreement with Capita and our new tender framework for the clean-up of contaminated land is progressing well.
Xoserve Xoserve delivers transactional services on behalf of all the major gas network transportation companies in Great Britain, including National Grid. Xoserve is jointly owned by National Grid, as majority shareholder, and the other gas distribution network companies.
US non-regulated businesses Some of our US businesses are not subject to state or federal rate-making authority. These include interests in some of our LNG road transportation, some gas transmission pipelines and certain commercial services relating to solar installations, fuel cells and other new technologies.
Corporate activitiesCorporate activities comprise central overheads, Group insurance and expenditure incurred on business development.
Across the UK, National Grid is bringing its redundant land back to life so it can be used in new ways. Our former gasholder site in Battersea, South West London, will make way for a large residential development, helping to meet London’s demand for new housing.
This wall chart in our European Business Development office shows current, planned and potential interconnectors between the UK, continental Europe and Scandinavia.
Principal operations continued
Other activities
3%Other activities adjusted operating profit of Group total
38 National Grid Annual Report and Accounts 2013/14

Strategic Report
Trusted to deliver critical infrastructure projectsNational Grid has completed 22 out of 32 kilometres of tunnels needed for London Power Tunnels, part of the £1 billion construction project to replace the high voltage ring main under London. We are already fitting the tunnels with the high voltage cable that will maintain the delivery of the 6 GW1 of electricity that London needs on an average weekday, long into the future.
1. Last year the average weekday electricity demand for Greater London was 6.087 GW.
39 Additional InformationFinancial StatementsCorporate Governance

People If we are to achieve our strategic goals, we need to make sure our employees have the right skills and capabilities.
During 2013/14 we have focused particularly on the areas that we believe can generate the most value for the Company through our people – both now and in the future.
This has involved a focus on future leaders, operational leaders, engineers and stakeholder relationship managers. In addition to increasing our capability across these groups we also need to make sure we have enough people in each group. We will also be developing plans to improve our succession planning for our operational leader, engineer and stakeholder relationship manager roles.
Building skills and expertiseAs we continue working under RIIO in the UK and become increasingly focused on driving performance on both sides of the Atlantic, we have identified three main business capabilities we need to develop among our workforce to support us in achieving our strategic objectives: performance excellence; customer and stakeholder management; and contract management.
We believe that by focusing on these capabilities we will make sure we meet our customers’ and stakeholders’ expectations while building a systematic approach to improving performance.
To help us do this, we have brought all our learning and development resources together under our Academy.
To date, 110 of our senior leaders in the UK have attended our performance excellence senior leadership programme through our Academy and similar programmes have started in the US.
Attracting the best peopleWe are involved in a number of initiatives to help attract new talent into our organisation and industry. In the UK, these include:
• working with the energy sector towards delivering 11,000 new apprenticeships and traineeships over the next three years through the Energy & Efficiency Industrial Partnership;
• developing our own people through Advanced Apprenticeships and engineer training;
• supporting power systems undergraduate bursaries through the Power Academy; and
• making sure our graduates continue their development throughout their career with us.
Initiatives in the US include:
• energy utility technology certificate programmes – partnerships with seven local community colleges to develop and prepare students to become future electric line workers;
• ‘Troops to Energy Jobs’ – a programme designed to help veterans determine how their military skills and experience translate into the skills we are looking for;
• real work experience and leadership training for qualified graduates in engineering and business disciplines; and
• summer internships – providing six to eight week opportunities for college students to gain work experience with us.
Safeguarding the future In the UK, around 89,000 people are needed annually to meet demand in the UK’s engineering sector over the next decade, yet only around 51,000 are joining the profession each year.
To address this shortage, we are running or are involved with a number of programmes and initiatives aimed at encouraging young people to study STEM subjects. These include:
• ‘School Power’, which provides classroom resources, including a dedicated website, to support the teaching of STEM subjects;
• work experience, offering year 10 students a week-long residential course at our Eakring Academy (totalling 100 each year); and
• open house visits to our sites to give students and teachers an insight into gas and electricity systems, as well as future energy challenges.
We are leading a consortium of businesses to create an exhibition called ‘That Could Be Me’ at the Science Museum in London, which will provide insight into engineering as a career. It is due to launch in December 2014.
A further initiative, called ‘Careers Lab’, aims to help establish a coordinated approach towards businesses taking responsibility for the skills agenda. The pilot scheme, which began in January 2014, involves businesses and schools in the Midlands working together to progress careers advice programmes for young people.
In the US, overall engineering employment is expected to grow by 11% through to 2018, varying by specialty. By 2018, STEM occupations will account for about 1.1 million new jobs and 1.3 million replacement positions due to STEM workers leaving the workforce.
We are working with high schools and community colleges to build a curriculum that meets future workforce needs – and supporting STEM education at K-12 levels. An example of this is the National Grid Engineering Pipeline Program – a six year developmental journey designed to inspire young people to pursue an education and career in engineering. To date 164 young people have entered into the programme.
We also work closely with the National Centre for Energy Workforce Development on its ‘energy industry fundamentals’ curriculum and competency models.
40 National Grid Annual Report and Accounts 2013/14

Strategic Report Corporate Governance Financial Statements Additional Information
Volunteering Our employees continue to support our local communities, sharing their time and expertise on a range of skills-based volunteering and fundraising activities. This year in the UK we continued supporting Special Olympics GB by sponsoring the National Summer Games, launched our first-ever employee chosen charity partnership with Macmillan Cancer Support and joined forces with two initiatives – Step up to Serve and TeachFirst.
In the US, our Power to Serve programme is evolving as we focus on volunteering efforts that make National Grid a great place to work, and our communities great places to live. Power to Serve supports our Elevate 2015 Stewardship principle and seeks to acknowledge existing community service, as well as to create new volunteer opportunities for employees.
Health and wellbeingOur health and wellbeing programmes for 2013/14 have included encouraging employees to improve their levels of activity and quality of nutrition, as well as supporting employees’ mental wellbeing and musculoskeletal conditions. With our major cancer charities (Macmillan Cancer Support in the UK and The American Cancer Society in the US) we have raised money and awareness. Our employee opinion survey results continue to show that employees have a growing awareness of our wellbeing programmes.
Promoting an inclusive and diverse workforceWe aim to develop and operate our business with an inclusive and diverse culture, with equal opportunity to all in recruitment, career development, training and reward. This applies to all employees regardless of race, gender, nationality, age, disability, sexual orientation, gender identity, religion and background. Where existing employees become disabled, our policy is to provide continued employment and training wherever practical. Our policies support the attraction and retention of the best people, improve effectiveness, deliver superior performance and enhance our success.
During 2013/14, Race for Opportunity and Opportunity Now each awarded us with their Gold standard and recognised us as one of the top 10 private sector employers in terms of their benchmark criteria. We were also once again selected as one of the Times Top 50 Employers for Women.
In the US, we have focused on boosting membership and awareness of our Employee Resource Groups, which have measurable goals that are in line with our vision and Elevate 2015 ambitions.
These groups aim to build awareness and understanding of inclusion and diversity throughout the organisation. Their activities include programmes designed to build skills that help manage differences.
The table below shows the breakdown by gender at different levels of the organisation. We have included information relating to subsidiary directors, as this is required by the Companies Act 2006 (Strategic Report and Directors’ Reports) Regulations 2013. We define ‘senior management’ as those managers who are at levels Executive −1 and Executive −2, as well as those who are directors of subsidiaries or who have responsibility for planning, directing or controlling the activities of the Company, or a strategically significant part of the Company, and are employees of the Company.
Financial year ended 31 March 2014
Male Female Total%
male%
female
Our Board 9 4 13 69.2 30.8Senior management 182 56 238 76.5 23.5Whole company 18,387 5,522 23,909 76.9 23.1
Human rightsNational Grid does not have a specific policy relating to human rights, but respect for human rights is incorporated into our employment practices and our values, which include respecting others and valuing diversity.
‘Doing the Right Thing’ is our guide to ethical business conduct. The way in which we conduct ourselves allows us to build trust with the people we work with. We earn this trust by doing things in the right way, building our reputation as an ethical company that our stakeholders want to do business with, and that our employees want to work for.
Our procurement policies integrate sustainability into the way we do business throughout our supply chain, so that we create value, preserve natural resources and respect the interests of the communities we serve and from which we procure goods and services. Additionally, through our supplier code of conduct, we expect our suppliers to keep to all laws relating to their business, as well as the principles of the United Nations Global Compact, the United Nations Declaration of Human Rights and the International Labour Organization (ILO).
Non-financial KPIs pages 10 – 11
Board diversity page 56
The Strategic Report was approved by the Board of Directors on 18 May 2014 and signed on its behalf by:
Alison KayGroup General Counsel & Company Secretary18 May 2014
41

Corporate Governance
Chairman’s forewordAn effective Board is vital to the sound foundations of good corporate governance. Our Board has undergone a significant change over the last three years to refresh membership and replace long-serving Non-executive Directors. As part of this planned transition, this year we have welcomed Therese Esperdy and John Pettigrew to our Board and, following the AGM, Maria Richter will be stepping down from the Board. We will also be saying goodbye to Nick Winser, who will not be standing for re-election to the Board at the AGM, but will continue in his role as President of ENTSO-E and Chairman of NGET and NGG until July 2015 when he will be leaving the Company.
Through the progressive refresh of the Board we have successfully renewed the membership and key roles to bring a diverse range of skills and experience to our Board. I am pleased to report that the results of the Board evaluation this year were positive, showing that our regenerated Board is functioning well, although there is always room for improvement. See page 46 for examples of the actions we have identified for the coming year.
All our new Board members undertake a thorough induction programme to get them up to speed on our businesses. The induction programme is tailored to the new Director to take account of previous experience and their specific role on the Board. I am confident that the programmes designed for Therese and John, which are detailed on page 45, will provide a good basis to enable them both to make a valuable early contribution to our Board.
As a Board we continue to support constructive challenge, encourage robust debate and recognise the value of different thinking styles. During the year we held a development session for the Board on ‘thinking styles’, see page 45 for details.
It is my strong belief that our ongoing emphasis on a positive and collegiate boardroom environment is helping the dynamics of the relationship between our Executive and Non-executive Directors. Because of this, we are able to increase the individual contribution of Directors and use their diverse backgrounds and expertise in enriching the quality of boardroom debates and discussions.
The behaviours and dynamics of the Board will be an ongoing focus for us as we strive to continually improve our effectiveness and performance.
Sir Peter GershonChairman
Contents
44 Governance framework44 Our Board44 Board composition45 Director induction and development45 Investor engagement 46 Board and committee evaluation 46 Non-executive Director independence46 Director performance48 How our Board operates48 Our Board and its committees49 Audit Committee53 Finance Committee54 Safety, Environment and Health Committee55 Nominations Committee56 Board diversity and the Davies Review56 Executive Committee57 Management committees58 Remuneration Report
National Grid Annual Report and Accounts 2013/1442

Strategic Report Corporate Governance Financial Statements Additional Information
Our Board
1. Sir Peter Gershon CBEFREng (67)ChairmanN (ch)2 years’ tenure
2. Steve Holliday FREng (57)Chief ExecutiveF13 years’ tenure^
3. Philip Aiken AM (65)Non-executive DirectorA, N, S (ch)5 years’ tenureIndependent
4. Andrew Bonfield (51)Finance DirectorF, S3 years’ tenure
5. Nora Mead Brownell (66)Non-executive DirectorN, R, S1 year’s tenureIndependent
6. Jonathan Dawson (62)Non-executive DirectorF, N, R (ch)1 year’s tenureIndependent
7. Therese Esperdy (53)Non-executive DirectorF, NUnder 1 year’s tenureIndependent
8. Paul Golby CBE FREng (63)Non-executive DirectorN, R, S2 years’ tenureIndependent
9. Ruth Kelly (46)Non-executive DirectorA, F, N2 years’ tenureIndependent
10. Tom King (52)Executive Director, US6 years’ tenure
11. John Pettigrew (45)Executive Director, UKUnder 1 year’s tenure
12. Maria Richter (59)Non-executive DirectorA, F (ch), N10 years’ tenureIndependent
13. Mark Williamson (56)Non-executive Director and Senior Independent DirectorA (ch), N, R1 year’s tenureIndependent
14. Nick Winser CBE FREng (53)Executive Director, UK10 years’ tenure
KeyA Audit CommitteeF Finance CommitteeN Nominations CommitteeR Remuneration CommitteeS Safety, Environment and
Health Committee(ch) Chairman of committee
^ Including National Grid Group plc
Tenure as at 31 March 2014
1
5
9
12
2
6
10
13
3
7
11
14
4
8
Board genderWomen Men
10
4
Executive and Non-executive Directors
ExecutiveNon-executive Directors
9
5
Non-executive Director tenure
0-3 years 3-6 years9+ years
11 7
The above charts and Board membership are as at 18 May 2014.
43

Governance framework
Compliance statementThe Board considers that it complied in full with the provisions of the UK Corporate Governance Code 2012 (the Code) during the financial year being reported, see page 51 for our explanation in relation to external audit tendering.
This report explains the main features of the Company’s governance structure to give a greater understanding of how the main principles of the Code have been applied. The report also includes items required by the Disclosure and Transparency Rules. The index on page 57 sets out where to find each of the disclosures required in the Directors’ Report together with the Board’s sign-off on the report.
Fair, balanced and understandableThe Board received a paper on the governance arrangements that have been put in place to make sure that the Annual Report and Accounts meet the requirements of the Code.
The coordination and review of the Annual Report and Accounts follows a well-established and documented process, which is conducted in parallel with the formal audit process undertaken by the external auditors. The Board considered and endorsed the arrangements in place to enable it to confirm (see page 76) that the Annual Report and Accounts, taken as a whole, is fair, balanced and understandable.
Our Board Our Board is set out on the previous page, along with the age, committee membership, independence, and tenure of all members. Their full biographical details are set out on pages 171 to 173.
The Directors who were in place during the year are shown on page 48, together with details of Board meeting attendance. Committee membership during the year and attendance at meetings is set out in each of the individual committee reports later in this report. For further details about the Directors’ service contracts and letters of appointment, see page 65 of the Remuneration Report.
Our Chairman is responsible for the leadership and management of the Board and its governance. By promoting a culture of openness and debate, he facilitates the effective contribution of all Directors and helps maintain constructive relations between Executive and Non-executive Directors.
Our Chief Executive is responsible for the executive leadership and day-to-day management of the Company, to ensure the delivery of the strategy agreed by the Board. Through his leadership of the Executive Committee, he demonstrates commitment to safety, operational and financial performance.
Our Senior Independent Director acts as a sounding board for the Chairman and serves as an intermediary for the other Directors, as well as shareholders as required.
Independent of management, our Non-executive Directors bring diverse skills and experience, vital to constructive challenge and debate. Exclusively, they form the Audit, Nominations and Remuneration Committees, and have an important role in developing proposals on strategy.
Role of our BoardOur Board is collectively responsible for the effective oversight of the Company and its businesses. It also determines the strategic direction and governance structure that will help achieve the
long-term success of the Company and deliver sustainable shareholder value.
The Board sets the risk appetite for the Company and takes the lead in areas such as safeguarding the reputation of the Company and financial policy, as well as making sure we maintain a sound system of internal control (see page 25).
The Board as a whole is responsible for making sure that there is satisfactory dialogue with shareholders. Further details of our investor engagement activities are set out opposite.
The Board’s full responsibilities are set out in the matters reserved for the Board, available on our website, together with other documentation relating to the Company’s governance.
Examples of Board focus during the year:• review of safety performance and initiatives following the
previously reported fatality in April 2013; • half-day strategy session including discussions on technology
developments and the differences between the UK, European and US markets, followed by further discussions about strategy at Board meetings;
• risk workshop in support of the Board’s oversight of corporate risk management;
• updates on RIIO delivery and the UK business change programme;
• US Foundation Program post systems implementation review and regular updates;
• UK regulatory update, including future energy scenarios and EMR delivery plan;
• update on the politics of UK energy, including the increased profile of the Company in the run-up to the next UK general election;
• in-depth US operational update on topics central to the delivery of the US business strategy;
• talent management update, including important elements of our strategy relating to people;
• the results from the 2013 employee opinion survey and the associated action plan; and
• progress against the actions arising from the 2012/13 Board and committee evaluation.
Examples of expected Board focus for next year: • annual review of safety activities;• continued detailed review of strategy and financing;• risk appetite discussions; • progress on the stabilisation of the new enterprise resource
system and updates on the US Foundation Program;• review of the business performance under RIIO;• outcome of the New York gas audit;• talent review and succession planning; • results and actions from the 2014 employee opinion survey; and• progress against the actions from the 2013/14 Board and
committee evaluation.
Board composition The successful delivery of our strategy depends upon attracting and retaining the right talent. This starts with having a high-quality Board. Balance is an important requirement for the composition of the Board, not only in terms of the number of Executive and Non-executive Directors, but also in terms of the range of expertise and backgrounds.
While traditional diversity criteria such as gender and ethnicity are important, we also value diversity of skills, experience and knowledge. You can read about our Board diversity policy in the Nominations Committee report on page 55.
Corporate Governance continued
44 National Grid Annual Report and Accounts 2013/14

Strategic Report Corporate Governance Financial Statements Additional Information
The planned transition of the Board has continued over the year; Therese Esperdy joined as a Non-executive Director on 18 March 2014, John Pettigrew joined as an Executive Director on 1 April 2014, and Maria Richter will step down from the Board following the conclusion of the AGM in July. Nick Winser will also step down from the Board at this time.
Director induction and developmentAs our internal and external business environment changes, it is important to make sure that Directors’ skills and knowledge are refreshed and updated regularly. Our Chairman is responsible for the ongoing development of all Directors.
To strengthen the Directors’ knowledge and understanding of the Company, Board meetings regularly include updates and briefings on specific aspects of the Company’s activities. In September, the Board received a presentation on accounting under RIIO and the introduction of new terminology in our external financial reporting.
Updates on corporate governance and regulatory matters are also provided at Board meetings, with details of development and training opportunities for Directors available in our online document library.
Additionally, the Non-executive Directors are expected to visit at least one operational site annually. This provides the opportunity to meet local management teams and discuss aspects of the business with employees.
With the agreement of the Board, Executive Directors gain experience of other companies’ operations, governance frameworks and boardroom dynamics through non-executive appointments. The fees for these positions are retained by the individual. See page 65 for more details.
In February we held a ‘thinking styles’ session supported by an external consultant. In advance of the session the Board completed questionnaires to assess its capability to think in diverse ways and the aggregated results were shared at the session. The session also covered the benefits of thinking styles for different types of discussion and ways in which the diverse capability that exists within the Board could be harnessed to maximise its effectiveness.
Directors’ induction programmeFollowing Therese and John’s appointment to the Board, the Chairman and Group General Counsel & Company Secretary have arranged a comprehensive induction programme. The programme has been tailored based on their experience and background and the requirements of their roles.
For both Therese and John a one-to-one meeting was arranged with our external legal advisors to discuss the duties and requirements of being a listed company director. Therese’s induction has also included one-to-one meetings with her fellow Directors and senior management in the UK. Over the coming months she will meet senior management in the US and undertake operational site visits.
Acknowledging John’s in-depth understanding of the UK and US businesses, his induction has focused primarily on his role as a Director and the role of the Board in general.
Investor engagementWe believe it is important to maintain effective channels of communication with our debt and equity institutional investors and individual shareholders. This helps us to understand their views about the Company and allows us to make sure they are provided
with timely and appropriate information on our strategy, performance, objectives, financing and other developments.
Institutional investorsWe carry out a comprehensive engagement programme for institutional investors and research analysts, including meetings, presentations, webinars and attendance at investor conferences. The programme provides the opportunity for our current and potential investors to meet with executive and operational management.
In the past year, our engagement programme has focused on educating investors on how we intend to perform under the new RIIO price controls in the UK. In August we held a seminar in London to set out the details of the new regulatory regime. We explained how we have changed the way we operate to position us to deliver outperformance in the new regulatory environment.
We have also attended investor conferences across the UK and US, and held road shows in major investor centres across Europe, the US and Asia Pacific.
In addition to these engagement activities, we held our first stewardship meeting in May last year. The event had a governance theme and provided major investors with an insight into our decision-making processes, the work of our committees and the workings of the new regulatory regimes in the UK and US. The event also provided the opportunity for attendees to ask questions and meet members of the Board and for our newer Non-executive Directors to understand our shareholders’ views and concerns. A copy of the presentation is available in the Investors section of our website.
As a result of its success last year, we are planning to hold a similar event this year.
Sir Peter also contacts our major shareholders following the release of our full-year results to offer them the opportunity to meet him, the Senior Independent Director, or any of our other Non-executive Directors, so they can discuss any issues they feel unable to raise with members of the executive team.
The Board receives regular feedback on investor perceptions and opinions about the Company. Specialist advisors, our brokers and the Director of Investor Relations provide updates on market sentiment. Each year, the Board also receives the results of an independent audit of investor perceptions.
Debt investors Over the last year representatives from our treasury team, together with other senior managers from across the business, have met with debt investors in Europe and the US to discuss topics such as the RIIO price controls.
Additionally this year, an independent review of debt investor perceptions of the Company was conducted and the results were presented to the Finance Committee.
With the total debt issued during the year at £1.1 billion, it is important for us to explain to debt investors why this money is required and what protections are in place to safeguard their potential investment.
We also communicate with our debt investors through regular Company announcements and the debt investor section of our website. This contains bond prospectuses, credit ratings, materials relating to the retail bond issued in 2011 and subsidiary year-end reports. The website also contains information about our long-term debt maturity profile, so investors can see our future refinancing needs.
45

Corporate Governance continued
Individual shareholdersEngagement with individual shareholders, who represent more than 95% of the total number of shareholders on our share register, is led by the Group General Counsel & Company Secretary. Shareholders are invited to learn more about the Company through the exhibits at our AGM and the shareholder networking programme.
The shareholder networking programme normally takes place twice a year and includes visits to UK operational sites and presentations by senior managers and employees over two days. If you are a UK resident shareholder and would like to take part, please apply online via the Investors section on our website.
Annual General MeetingOur AGM will be held on Monday 28 July 2014 at The International Convention Centre in Birmingham and broadcast via our website. The Notice of Meeting for the 2014 AGM, available on our website, sets out in full the resolutions for consideration by shareholders, together with explanatory notes and further information on the Directors standing for election and re-election.
Board and committee evaluationFollowing last year’s external review, this year the Board felt it was appropriate to conduct an internal Board and committee evaluation.
The review of the Board was led by Sir Peter. Rather than using structured questionnaires, he asked a number of open questions at one-to-one interviews with each of the Directors in December and January.
The questions were designed to encourage broad discussions on the performance and effectiveness of the Board rather than to assess its procedures. The questions covered areas such as decision making, the quality of Board discussions, the degree of challenge from the Board members, the top concerns of each member and any topics they felt needed additional focus. The discussions also covered the balance between the Board and its committees and the effectiveness of the Board.
The feedback from these meetings formed the basis of the evaluation report from Sir Peter. The findings were presented by Sir Peter to the Nominations Committee in February and then to the Board meeting in March, along with a proposed action plan. The balance between the Board and its committees was felt to be appropriate and no changes in this area were identified. The Board agreed a number of actions for the forthcoming year, as set out below. Progress against these actions will be monitored throughout the year by the Board.
• Decision making – all important matters requiring approval are to be brought to the Board for early input before a decision is needed. Responsibility: Chairman and Chief Executive
• Board discussions – greater clarity about the scope of Board discussions to be provided in advance and Board members to be encouraged to question if not clear. Responsibility: Chairman
• Degree of challenge – the Executive Directors to speak to the Chairman about what would make them feel more comfortable to challenge and debate, both with the Non-executive Directors and with their fellow Executive Directors at Board meetings. Responsibility: Executive Directors
• Board focus – a number of topics were identified that Directors felt needed additional focus by the Board at its meetings, for example cyber risk and the UK political landscape. Ways to improve the focus on each of these were discussed at the March Board meeting and specific actions were agreed and allocated to various Board members. Responsibility: various Board members
• Effectiveness of the Board – actions to improve Board effectiveness were proposed, for example: continue to improve the quality of Board papers; make sure in-depth items for Board consideration highlight the important issues to be discussed; and encourage reporting from management that incorporates more input from the Executive Directors. Responsibility: Chairman, Chief Executive and Group General Counsel & Company Secretary, as appropriate
The actions from last year’s externally conducted review were grouped into three themes – mechanics, dynamics and specifics. Progress against the actions agreed by the Board has been monitored through the year and a commentary against each action is set out opposite.
An evaluation of committee performance was also conducted by the chairman of each of the Board committees, as well as the Executive Committee. Each committee concluded that it had operated effectively throughout the year and agreed, where relevant, an action plan to further improve performance. Progress against the action plans will be monitored through the year by the respective committee and the Board.
Non-executive Director independenceThe independence of the Non-executive Directors is considered at least annually, along with their character, judgement, commitment and performance on the Board and relevant committees. The Board took into consideration the Code and indicators of potential non-independence, including length of service. A particularly rigorous review was conducted of Maria Richter as she has served for more than six years.
At year-end, all the Non-executive Directors, with the exception of the Chairman, have been determined by the Board to be independent. Tenure is just one indicator of potential non-independence and the experience and knowledge of Maria Richter, who has served on the Board for more than nine years, has been important in facilitating a structured handover and providing continuity during the search for Therese. Maria will not be standing for re-election at the 2014 AGM.
Director performance At a private meeting of the Non-executive Directors, Mark Williamson, as Senior Independent Director, led a review of Sir Peter’s performance. The review noted that Sir Peter’s commitments had changed during the year following his appointment as non-executive chairman of the Aircraft Carrier Alliance. The time commitment of the new role was carefully considered by the Board and was unanimously approved by the Board prior to Sir Peter accepting the position.
The Non-executive Directors, with input from the Executive Directors, assessed his ability to fulfil his role as Chairman and the arrangements he has in place to fulfil his role, given he is also chairman of a FTSE 250 company. They concluded that Sir Peter’s performance and contribution were first-class and that he demonstrated strong leadership.
The performance of each Director was raised by Sir Peter at his one-to-one meetings conducted for the Board and committee evaluation process.
Following recommendations from the Nominations Committee, the Board considers all Directors continue to be effective, committed to their roles and have sufficient time available to perform their duties. Therefore, in accordance with the Code, all Directors, with the exception of Maria Richter and Nick Winser who will be stepping down from the Board following the conclusion of the AGM, will seek election or re-election at the 2014 AGM as set out in the Notice of Meeting.
46 National Grid Annual Report and Accounts 2013/14

Strategic Report Corporate Governance Financial Statements Additional Information
Area Actions from last year’s review Commentary
Mechanics Chief Executive to meet with Executive Directors immediately after each Board meeting to discuss how the Board operated as a team and contributions from Directors, and reflect on any learning. Feedback from these meetings to be shared as appropriate with the Chairman.
Responsibility: Chief Executive
This was implemented from January 2013 and will be continued as it has proved helpful in making sure that the right discussions are had at Board meetings.
Review and build on the one page executive summary for non-standard papers introduced in July 2012 and consider its effectiveness in providing the Board with key information and clarity around requested contribution or action.
Responsibility: Chairman and Chief Executive
An updated template summary sheet was introduced in September 2013. The revised template includes details of links to the risk register, financial impact and additional information on the lead presenter.
All committees, except the Nominations Committee and Executive Committee, to get together immediately before or after their meetings to discuss papers, presenters’ contribution and any matters they wish to consider without management present.
Responsibility: Committee chairmen
This initiative has been implemented and meetings included on the forward business schedules as appropriate by each of the committees.
Thinking styles of candidates to the Board and Executive Committee to be taken into consideration once skills set and experience confirmed.
Responsibility: Nominations Committee
Diversity of thinking styles was a factor in the recruitment process for a successor to Maria Richter and in the appointment of John Pettigrew.
Dynamics Schedule a development session for the Board which may include thinking styles, inclusive leadership and exploring positive challenge through questioning techniques.
Responsibility: Chairman and Group General Counsel & Company Secretary
A thinking styles session for the Board was held in February 2014. See page 45 for more information.
Review the following month’s agenda and communicate to the Executive Directors the areas that presenters are to focus on.
Responsibility: Chairman and Chief Executive
The draft agenda for forthcoming Board meetings are noted by the Executive Committee. The Chairman also holds separate pre-Board meetings with the Chief Executive and the Group General Counsel & Company Secretary to discuss and review the business of the next meeting.
Specifics Facilitate increased interaction between Non-executive Directors and high-potential employees during site visits and presentations at Board meetings.
Responsibility: Executive Directors
High-potential employees have been invited to Board dinners in the UK and US. A schedule of proposed site visits has been provided to the Non-executive Directors.
Appoint a taskforce to review gender diversity and employee turnover.
Responsibility: Chief Executive
Following a detailed review in August 2013 by the Chairman and Chief Executive it was decided not to proceed with the taskforce at that time. Good progress continues to be made on gender diversity and employee turnover.
Implement an inclusion and diversity scorecard and review progress with the Board.
Responsibility: Executive Committee
The Executive Committee receives a quarterly inclusion and diversity scorecard and updates are provided to the Board. An inclusion and diversity session for the Board was held in April 2013.
47

Corporate Governance continued
Instances of non-attendance during the year at Board and committee meetings were determined to be reasonable due to the individual circumstances.
Should any Director not be able to attend a Board or committee meeting, the Chairman and committee chairman are informed and the absent Director is requested to communicate opinions and comments on the matters to be considered.
Our Board and its committeesThe Board delegates authority to its committees to carry out certain tasks on its behalf, so that it can operate efficiently and give the right level of attention and consideration to relevant matters.
The role and responsibilities of the committees are set out in their terms of reference, available on our website. The committee structure and delegation and reporting lines are set out in the diagram below.
In addition to the vertical lines of responsibility and reporting, the committees communicate and work together where required. For example, on some risk matters the Safety, Environment and Health (SEH) Committee collaborates with the Audit Committee. These lines of communication are shown in the diagram below.
Committee agendas and schedules of items to be discussed at future meetings are prepared in line with the terms of reference of each committee.
At committee meetings, items are discussed and, as appropriate, matters are endorsed, approved or recommended to the Board by the committee. The chairman of each committee provides the Board with a summary of the main decisions and discussion points so the non-committee members are kept up to date.
Below the Board committees are a number of management committees, including the Executive Committee.
The Executive Committee has responsibility for making management and operational decisions about the day-to-day running of the Company. Further information on some of the management committees, including the membership and operation of the Executive Committee, is set out on pages 56 and 57.
Reports from each of the Board committees together with details of their activities during the year, are set out on the following pages.
Board
Remuneration Committee
Executive Committee
Nominations Committee
Global Retirement Plan
Committee
Audit Committee
Finance Committee
Disclosure Committee
Board and committee interactions
Board committees
Management committees
Global Ethics and Compliance Committee
How our Board operatesThe Chairman sets the Board’s agenda in line with its responsibilities and role as set out in the matters reserved for the Board, and the main challenges and opportunities facing the Company, making sure adequate time is available to discuss all items, including strategic issues.
To support discussion and decision making, Board and committee members receive papers sufficiently in advance of meetings so that they can prepare for and consider agenda items. Additionally, the Chairman holds a short meeting with the Non-executive Directors before and after each Board meeting to discuss the focus of the upcoming meeting and afterwards to share feedback and discuss any outstanding matters.
A one-page executive summary for non-standard papers provides information and clarity around the contribution or action required. Where appropriate, subject matter experts give presentations and provide the opportunity for Directors to ask questions.
Board membership and attendanceBoard membership and attendance at meetings are set out below. Attendance is expressed as the number of meetings attended out of the number possible or applicable for the individual Director during the year to 31 March 2014. Committee membership during the year and attendance at meetings is set out in each of the individual committee reports later in this report.
Name Attendance
Sir Peter Gershon 11 of 11Steve Holliday 10 of 11Andrew Bonfield 11 of 11Tom King 11 of 11John Pettigrew1 0 of 0Nick Winser 10 of 11Phillip Aiken 11 of 11Nora Mead Brownell 10 of 11Jonathan Dawson 11 of 11Therese Esperdy2 1 of 1Paul Golby 11 of 11Ruth Kelly 11 of 11Maria Richter 11 of 11Mark Williamson 11 of 11
Ken Harvey3 3 of 4George Rose3 4 of 4
1. John Pettigrew was appointed to the Board with effect from 1 April 2014.
2. Therese Esperdy was appointed to the Board with effect from 18 March 2014.
3. George Rose and Ken Harvey stepped down from the Board with effect from 29 July 2013.
Safety, Environment and Health Committee
48 National Grid Annual Report and Accounts 2013/14

Strategic Report Corporate Governance Financial Statements Additional Information
Significant issuesSome of the significant issues the Audit Committee considered in relation to the financial statements during the year set out below are explained in more detail later in the report:
• US financial controls program;• LIPA MSA transition contract accounting;• presentation of exceptional items; and• fair, balanced and understandable assessment.
Other matters reviewedExamples of other matters the Audit Committee reviewed:
• accounting for RIIO;• the enhanced disclosures required by International Auditing
Standard (UK and Ireland) 700; • the Company’s refreshed approach to going concern following
the publication of the Sharman Report;• the increased work involved to support the LIPA MSA transition; • the revised Certificate of Assurance process; • Sarbanes-Oxley Act 2002 testing and attestations; • external reporting obligations and the programme to improve
the Company-wide framework; • a revised ethical business conduct process for Directors and
executive members; and• a proposed revised approach to risk reporting.
Committee membership and attendanceCommittee membership during the year and attendance at meetings is set out below. Attendance is expressed as the number of meetings attended out of the number possible or applicable for the individual Director during the year to 31 March 2014. Biographical details and experience of Committee members are set out on pages 171 to 173.
Name Attendance
Mark Williamson (chairman)1 6 of 6Philip Aiken 5 of 6Ruth Kelly 6 of 6Maria Richter 6 of 6
George Rose2 2 of 2
1. Chairman from July 2013.
2. George Rose stepped down from the Board with effect from 29 July 2013.
ExperienceMark Williamson took over as chairman of the Audit Committee following the 2013 AGM. The Board has determined that Mark:
• has recent and relevant financial experience;• is a suitably qualified audit committee financial expert within
the meaning of the SEC requirements; and• is independent within the meaning of the New York Stock
Exchange listing rules.
RoleOversees the Company’s financial reporting, and internal controls and their effectiveness, together with the procedures for identifying, assessing and reporting risks. It also oversees the services provided by the external auditors and their remuneration.
Review of the yearMy first eight months as chairman have been busy but enjoyable. Last July we said goodbye to George Rose and this July Maria Richter will be stepping down from the Board. I would like to thank them both for their contribution to the Committee. In particular to George for his guidance and support during his handover to me.
As a committee we have held six meetings during the year, two of which were held in the US, providing all members with the opportunity to meet our US teams. Following last year’s committee performance evaluation, we now also meet privately after some of our longer meetings. We use this time to review the meeting and discuss how we can evolve and make our meetings more effective.
The Committee’s main focus has been the US finance function and ongoing improvement of the new enterprise resource system. The Committee has received regular reports throughout the year from the Finance Director and US Chief Financial Officer.
The UK finance team has provided valuable support to the US team and I visited the US with the Finance Director and Group Financial Controller in January to review progress and priorities for 2014. The work on stabilisation of the systems also coincided with the LIPA MSA transition. This was an important milestone in the overall US financial control program.
With the start of RIIO, the Committee received a paper from the UK finance team on the accounting implications of this new arrangement and its impact on the financial control environment. We also reviewed the disclosures within this Annual Report to ensure they provide a fair, balanced and understandable view in the context of current accounting standards.
Next year is also looking busy with an ongoing focus on the enterprise resource system and continual improvement in processes and controls around these systems.
Mark WilliamsonCommittee chairman
Audit Committee
49

Corporate Governance continued
Financial reportingThe Committee monitors the integrity of the Company’s financial information and other formal documents relating to its financial performance. It makes appropriate recommendations to the Board before publication.
An important factor in the integrity of financial statements is making sure that suitable and compliant accounting policies are adopted and applied consistently on a year-on-year basis and across the Company. In this respect, the Committee also considered the estimates and judgements made by management when accounting for non-standard transactions, the treatment of exceptional items and in provision calculations.
These considerations are supported by input from other assurance providers such as the group controls, risk management and ethics and compliance teams, business separation compliance officer, internal (corporate) audit and the SEH Committee, as well as our external auditors. In addition, the Committee also considers reports of the Disclosure Committee. See page 57 for more information.
The Committee reviews and approves the external audit plan annually (see Audit quality below) and, as part of this, considers the significant risks upon which the external auditors will focus their year-end audit. The independent auditors’ report (pages 77 to 80) highlights these risks, some of which led to significant issues that the Committee discussed during the year. These were:
• US financial controls program (including quality of reconciliation process, US plant accounting and user access controls);
• LIPA MSA transition contract accounting; and• presentation of exceptional items.
Other risks, including the accuracy and valuation of treasury derivative transactions, and management override of internal control, were not considered in detail by the Committee during the year as nothing significant arose that warranted Committee attention.
Summarised below are the issues that attracted the most focus, and time, of the Committee in relation to the financial statements during the year.
US financial controls program: the primary focus of the Committee during the year has been the work to make sure of the integrity of the new financial system in the US. This included the measures taken to remediate US financial control deficiencies and those highlighted as a result of the implementation of the new enterprise resource system.
Over the course of the year, the Committee requested and reviewed a number of reports in order to understand the detail of the issues. These issues include the timeliness and quality of certain balance sheet account reconciliations, and the process and systems to ensure appropriate capitalisation of labour costs.
The Committee has also challenged and reviewed management’s remediation plans and the design of compensating controls, including enhanced analytical reviews to make sure the Company maintains an effective internal control environment over financial reporting.
Given the significance of this work, Mark Williamson visited the US and held detailed meetings with senior management in January 2014 to confirm remediation plans were progressing as expected.
LIPA MSA transition contract accounting: on 31 December 2013, our US business moved the MSA with LIPA to a third party. This transition was particularly complex. It involved many areas of our US business and required us to manage the transition of more than 2,000 employees, including more than 40 finance
professionals, as well as to provide a new enterprise resource system to LIPA.
The Committee reviewed the accounting treatment of costs incurred as part of the transition and agreed that the judgements made by management were reasonable.
Presentation of exceptional items: at the half year and year end, the Committee discussed and challenged a detailed analysis of items to be classified as exceptional to make sure the items did not include income or costs relating to the underlying business.
In particular, the Committee considered the treatment of the provision at the half year for gas holder demolition, as well as LIPA MSA transition and pension costs (described above). The Committee agreed that the classification of these items is appropriate.
Fair, balanced and understandable assessment: the Committee has considered the requirement of the Code to ensure that the Annual Report and Accounts, taken as a whole, is ‘fair, balanced and understandable’.
In reaching this conclusion the Committee reviewed, among other things, the impact of the introduction of the RIIO price control regime in the UK on the Group’s IFRS reported results, see pages 08 and 09 for more information.
Confidential reporting procedures and whistleblowing The integrity of the financial statements is further supported by the confidential reporting and whistleblowing procedures we have in place. The Committee reviews these procedures once a year to make sure that complaints are treated confidentially and that a proportionate, independent investigation is carried out in all cases.
Internal (Corporate) Audit The Corporate Audit function provides independent, objective assurance to the Audit, SEH and Executive Committees.
Audit work is delivered by a combination of internal resources – employees who typically have either a finance or operational business background – and external sources, where specific specialist skills are required.
The audit plan contains a mix of risk-based and cyclical reviews together with a small amount of work that is mandated, typically by US regulators. A number of focus areas are identified, such as financial, regulatory and asset management processes. Appropriate coverage is provided across each of these areas.
Inputs to the plan include risk registers, corporate priorities, external research of emerging risks and trends and discussions with senior management. A tool that captures all auditable areas, prior coverage and inherent process risk is also used to inform of audits that should be undertaken on a cyclical basis.
The plan is reviewed and approved by the Audit Committee in March each year, with focus given to not only the areas which are being covered but also those that are not, so we can make sure that the plan aligns with the Committee’s view of risk.
Corporate Audit provides a twice-yearly report to the Audit Committee. The report summarises common control themes arising and progress with implementing management action plans, and also presents information on specific audits as appropriate.
Where specific control issues are identified, senior leaders are invited to attend the Audit Committee to provide a commentary around the actions they are taking to improve the control environment within their area of responsibility.
50 National Grid Annual Report and Accounts 2013/14

Strategic Report Corporate Governance Financial Statements Additional Information
External auditThe Committee is responsible for overseeing relations with the external auditors, including the approval of fees, and makes recommendations to the Board on their appointment and reappointment. Details of total remuneration to auditors for the year, including audit services, audit-related services and other non-audit services, can be found in note 3 (e) of the consolidated financial statements on page 98.
Auditor independence and objectivityThe independence of the external auditors is essential to the provision of an objective opinion on the true and fair view presented in the financial statements.
Auditor independence and objectivity is safeguarded by a number of control measures, including limiting the nature and value of non-audit services performed by the external auditors, ensuring that employees of the external auditors who have worked on the audit in the past two years are not appointed to senior financial positions within the Company, and the rotation of the lead engagement partner at least every five years. The current lead engagement partner has held the position for four years.
Non-audit services provided by the external auditorsNon-audit services provided by the external auditors require approval by the Committee. Approval is given on the basis the service will not compromise independence and is a natural extension of the audit or if there are overriding business or efficiency reasons making the external auditors most suited to provide the service. Certain services are prohibited from being performed by the external auditors, as required under the SOX Act.
Total non-audit services provided by PwC during the year ended 31 March 2014 were £1.7 million (2013: £2.3 million), which comprised 15% (2013: 23%) of total audit and audit-related fees.
Total audit and audit-related fees include the statutory fee and fees paid to PwC for other services that the external auditors are required to perform, for example regulatory audits and SOX Act attestation. Non-audit fees represent all other services provided by PwC not included in the above.
Significant non-audit services provided by PwC in the year included the review of US pensions and other post-retirement benefits census data (£0.5 million) and tax compliance services in territories other than the US (£0.5 million).
PwC were engaged to review census data used in US pensions and other post-retirement benefit calculations and advise on enhancements to procedures and controls surrounding census data completeness and accuracy.
The Committee considered PwC best placed to provide this service given their in-depth understanding of our processes and control environment. In order to maintain the external auditors’ independence and objectivity, the work was performed by a team independent of the audit team, management reviewed and considered PwC’s findings and PwC did not make any decisions on behalf of management. Additionally, PwC had no input in respect of the production of financial information subsequently used by the audit team.
The Committee also considered that tax compliance services were most efficiently provided by the external auditors, as much of the information used in preparing computations and returns is derived from audited financial information. In order to maintain the external auditors’ independence and objectivity, management reviewed and considered PwC’s findings and PwC did not make any decisions on behalf of management.
Audit qualityTo maintain audit quality and provide comfort on the integrity of financial reporting, the Committee reviews and challenges the proposed external audit plan to make sure that PwC has identified all key risks and developed robust audit procedures.
The Committee also considers PwC’s response to accounting, financial control and audit issues as they arise, and meets with them at least annually without management present, providing the external auditors with the opportunity to raise any matters in confidence.
Auditor appointment An annual review is conducted by the Committee of the level and constitution of the external audit and non-audit fees and the effectiveness, independence and objectivity of the external auditors.
The annual review includes consideration of:
• the external audit process globally;• the auditors’ performance;• the expertise of the firm and our relationship with them; and• the results of questionnaires completed by National Grid
employees engaged with the audit and members of the Audit Committee.
Following this year’s annual review, the Committee is satisfied with the effectiveness, independence and objectivity of the external auditors, and recommends to the Board their reappointment for a further year. A resolution to reappoint PwC and giving authority to the Directors to determine their remuneration will be submitted to shareholders at the 2014 AGM.
Audit tender PwC have been the Company’s external auditors since the merger with Lattice Group plc in 2002, having been the incumbent external auditors of both the merging parties and the audit contract has not been put out to tender since then. Their performance has been reviewed annually by the Committee since that time.
During the year the Committee spent time discussing a potential tender for the external audit, following the new requirement on audit tendering and rotation of auditors.
The Committee has also discussed the implications of the proposals by both the UK Competition Commission (implementing its decision to mandate tendering every 10 years) and the EU (requiring audit firm rotation at least every 20 years), and will implement them when they become final. These proposals have effectively superceded the comply-or-explain provision that underpins the Code. The Financial Reporting Council has decided to defer consideration of whether to make any changes to these sections of the Code until its next review, currently scheduled for 2016.
The Committee considered the additional disruption that both an audit tender and any change in audit firm would involve in light of the ongoing US financial controls program, and the services we currently receive from other firms that may be considered in a tender process.
The Committee concluded that a tender is not in the Company’s interests at this time but agreed that this issue would be reviewed annually as part of the auditor appointment process. No representatives from PwC were present during the Committee’s discussion of the options for a tender of the external audit.
There are no contractual obligations restricting our choice of external auditors and we have not entered into any auditor liability agreement.
51

Corporate Governance continued
Audit information Having made the requisite enquiries, so far as the Directors in office at the date of the approval of this report are aware, there is no relevant audit information of which the auditors are unaware and each Director has taken all reasonable steps to make themselves aware of any relevant audit information and to establish that the auditors are aware of that information.
Internal control, risk and compliance We regularly consider the effectiveness of financial reporting, internal controls and compliance with applicable legal and internal requirements. We also review the procedures for the identification, assessment, mitigation and reporting of risks.
To continuously improve and remain at best practice levels, the risk management team reviews risk process standards, emerging trends and concepts being driven by the main consultancy firms and seeks to apply these as appropriate. The standards issued by the Committee of Sponsoring Organizations of the Treadway Commission (COSO) and the international risk standard ISO 31000 continue to inform the principles of our risk management process.
Specific improvements delivered during the year, and ongoing, were noted by the Committee at its meeting in September. These improvements include an enhanced approach for risk reporting to the Executive Committee, focusing on giving better visibility of mitigations and their impact on how risks are scored.
The scope of risk discussions has also been widened to incorporate specific consideration of our treatment of and preparedness for emerging risks (uncertainties on the horizon that are still developing and so may or may not evolve into threats or opportunities for us) and potential ‘black swan’ type events (catastrophic events of extremely high impact and extremely low likelihood).
The Board has participated in an interactive risk workshop to reinforce awareness of our key risks so its views can be captured and incorporated into our risk management activities. The output of this session formed part of the risk information reviewed at the March Audit Committee meeting.
Details of our internal control and risk management systems, including over the financial reporting process can be found on pages 22 and 25 and page 170. Our risk factors are described in full on pages 167 to 169.
Compliance managementThe Global Ethics and Compliance team has continued to focus on promoting improved consistency of reporting on control frameworks across the compliance reporting process. The aim of this activity is to make sure any problem areas are transparent and that all parts of the business are applying a similar standard.
The Committee asked for a review of the key compliance areas that are subject to the reporting process. Currently, reporting focuses on legal compliance obligations only, and consideration is being given to whether all key areas are covered and what, if any, other areas should be included. The Committee also received the annual reports on the Company’s anti-bribery procedures and whistleblowing procedures and reviewed their adequacy. It noted that no material instances of non-compliance had been identified.
Going concernHaving made enquiries and reviewed management’s assessment of the going concern assumption, the Directors have a reasonable expectation that the Group has adequate resources to continue in operational existence for the next financial year and the foreseeable future. For this reason, the Directors are satisfied that, at the time of approving the financial statements, it is appropriate to continue to adopt the going concern basis in preparing the consolidated and individual financial statements of the Company.
Management’s assessment processIn accordance with the draft recommendations of the updated Financial Reporting Council guidance on going concern and liquidity risk, we have reviewed and amended our going concern assessment process.
Our process is an extension of our business planning process, and is further supplemented by our annual budget and other liquidity risk management controls. Our five year business plan and one year budget were reviewed and approved by the Board at its meetings in September 2013 and March 2014 respectively. The Finance Committee provides ongoing oversight of our liquidity policy, which requires us to maintain sufficient liquidity for a rolling 12 month period.
In light of our refreshed approach, we have reconsidered what the most appropriate ‘foreseeable future’ period is. Given our business model, current regulatory clarity and other factors affecting our operating environment, and the robustness of our business planning process and scenario analysis, we have concluded the foreseeable future period is the five years ending 31 March 2018, in line with our business plan. This period is considered to be the ‘foreseeable future’ as required for this going concern assessment only, and is in accordance with company law, accounting standards and the Listing Rules. We will reassess this period annually in light of developments in our operating environment, business model and strategic priorities.
Our business plan considers the significant solvency and liquidity risks involved in delivering our business model in light of our strategic priorities. The business plan models a number of upside and downside scenarios, derived from the risks and opportunities identified, and determines the impact these would have on our results and financial position over the five year period. In addition, we have reviewed and challenged a number of worst case scenarios and their possible remediation.
Our business model calls for significant capital investment to maintain and expand our network infrastructure. To deliver this, our business plan highlights that we will need to access capital markets to raise additional funds from time to time. We have a long and successful history in this regard; however, our business plan also models various KPIs used by lenders and credit rating agencies in assessing a company’s credit worthiness. These models indicate that we should continue to have access to capital markets at commercially acceptable interest rates throughout the five year period. To monitor and control risks around access to capital markets we have policies and procedures in place to help mitigate, as far as possible, any risk of a change in our credit ratings and other credit metrics.
More detail on our financial risks, including liquidity and solvency, is provided in note 30 to the consolidated financial statements. There have been no major changes to the Group’s significant liquidity and solvency risks in the year.
52 National Grid Annual Report and Accounts 2013/14

Strategic Report Corporate Governance Financial Statements Additional Information
Finance Committee
RoleSets policy and grants authority for financing decisions, credit exposure, hedging and foreign exchange transactions, guarantees and indemnities subject to the risk appetite approved by the Board. It also approves other treasury, tax, pension funding and insurance strategies and, if appropriate, recommends them to the Board.
Review of the yearThe Finance Committee was established in 2002 to focus on the Company’s debt book to make sure these matters were given the necessary attention.
Following a number of new Non-executive Directors joining the Board in 2012/13, a presentation on the work and remit of the Committee was given to the Board in April 2013.
The presentation focused on the risks inherent in the areas the Finance Committee covers namely, treasury activities, insurance, pensions and tax. The presentation aimed to help all Directors understand the role and responsibilities of the Committee.
During the year, external advisors have given presentations to the Committee on matters such as capital markets, the results of a debt investor survey and the current state of banks. Additionally, information was circulated between meetings to make sure the Committee was kept fully briefed.
This year, we continued to focus on funding plans to take into account international debt market conditions. The Committee received regular reports on treasury, tax, insurance, pensions and commodity activities to keep us advised of progress and we approved recommendations where appropriate.
In July, after seven years as chair of this Committee, I will be stepping down from the Board. I have been working closely with Therese to ensure a smooth handover of responsibilities. I have no doubt the Committee will continue to perform effectively and evolve under Therese’s leadership.
Maria RichterCommittee chairman
Matters consideredExamples of matters the Committee considered during the year include:
• long-term funding requirements;• setting and reviewing treasury policies;• treasury performance updates provided at each meeting;• UK and US tax updates;• activities of the Energy Procurement Risk Management
Committee in the US;• activities of the Incentive Risk Management Committee in
the UK;• credit rating agencies’ views on the Company;• foreign exchange policy;• pensions updates, in particular funding of the Company’s
pension deficits; and• insurance renewal strategy.
Committee membership and attendanceCommittee membership during the year and attendance at meetings is set out below. Attendance is expressed as the number of meetings attended out of the number possible or applicable for the individual Director during the year to 31 March 2014.
Name Attendance
Maria Richter (chairman) 4 of 4Steve Holliday 4 of 4Andrew Bonfield 4 of 4Jonathan Dawson 4 of 4Therese Esperdy1 0 of 0Ruth Kelly 4 of 4Mark Williamson2 1 of 1
1. Therese Esperdy was appointed to the Committee with effect from 18 March 2014.
2. Mark Williamson stepped down following his appointment as chairman of the Audit Committee on 29 July 2013.
53

Corporate Governance continued
RoleIn relation to safety, environment and health, the Committee reviews the strategies, policies, initiatives, risk exposure, targets and performance of the Company and, where appropriate, of its suppliers and contractors. It monitors the resources we use for compliance and driving improvement in these areas. The Committee also reviews investigations into major incidents and subsequent measures taken.
Review of the yearIn terms of safety, our focus over the past year has again been on process safety. This includes the progress made, following the introduction of the new safety management system, in managing major hazard assets across our businesses, as well as the work required for the Company to become an industry leader in this area.
In particular, we have reviewed in depth the risks relating to our US LNG assets and the introduction of a new decision support tool for managing risks on gas transmission pipelines. We have also begun a review of the interfaces between our IT systems and safety processes.
Following a fatality and other incidents involving contractors in the US gas distribution business, we spent time with senior local management considering what measures needed to be put in place to promote a culture of safety among both employees and contractors and prevent a reoccurrence.
In relation to environmental matters, we have continued to monitor the Company’s strategy and approach to sustainability. In particular, we have looked at projects the Company is engaged in to reuse and recycle our resources such as overhead line conductors.
We have also reviewed the Company’s 2012 to 2016 Health and Wellbeing strategy. This includes a focus on mental wellbeing and how this affects not only employees’ absence, but also their levels of performance and engagement at work and in their home life. The Company is working to identify business areas most susceptible to workplace pressure that may impact employees’ mental wellbeing. We have started to provide training and information to reduce the stigma associated with mental illness as well as developing and promoting access to health and wellbeing support and treatment for affected employees.
Philip AikenCommittee chairman
Safety, Environment and Health Committee Matters consideredExamples of matters the SEH Committee reviewed during the year include:
• ongoing monitoring of safety performance and significant incidents in both the US and UK;
• lessons learnt and steps taken following a contractor fatality in the US in April 2013;
• update on the UK and US safety and environment strategy, leadership and governance processes, looking at work done to coordinate approaches in the two regions. This includes the establishment of a Group-level safety, environment and health management committee which meets monthly and reports to the Executive Committee;
• Group-wide employee process safety culture survey results;• audit of asbestos legislation compliance across the UK business;• review of procedures for detecting gas mains in the US;• consideration of the Company’s risk appetite in the context
of safety; and• climate change strategy, including performance against
emissions targets and carbon budgets.
Committee membership and attendanceCommittee membership during the year and attendance at meetings is set out below. Attendance is expressed as the number of meetings attended out of the number possible or applicable for the individual Director during the year to 31 March 2014.
Name Attendance
Philip Aiken (chairman) 5 of 5Andrew Bonfield1 0 of 0Nora Mead Brownell 5 of 5Paul Golby 5 of 5
Ken Harvey2 2 of 2
1. Andrew Bonfield was appointed to the Committee with effect from 27 March 2014.
2. Ken Harvey stepped down from the Board with effect from 29 July 2013.
54 National Grid Annual Report and Accounts 2013/14

Strategic Report Corporate Governance Financial Statements Additional Information
Matters consideredExamples of matters the Nominations Committee considered during the year include:
• Non-executive and Executive Director appointments, see page 56 for details of the processes;
• the successor as Senior Independent Director to Ken Harvey;• Board and committee membership following changes to the
composition of the Board;• the executive succession planning process focusing on the
identification, development and readiness of successors to the Executive Committee in particular; and
• review of the findings from the Board evaluation, see page 46 for more information, and discussion of the Committee’s performance.
Committee membership and attendanceCommittee membership during the year and attendance at meetings is set out below. Attendance is expressed as the number of meetings attended out of the number possible or applicable for the individual Director during the year to 31 March 2014.
Name Attendance
Sir Peter Gershon (chairman) 6 of 6Philip Aiken 6 of 6Nora Mead Brownell 6 of 6Jonathan Dawson 6 of 6Therese Esperdy1 1 of 1Paul Golby 6 of 6Ruth Kelly 6 of 6Maria Richter 6 of 6Mark Williamson 6 of 6
Ken Harvey2 1 of 1George Rose2 1 of 1
1. Therese Esperdy was appointed to the Committee with effect from 18 March 2014.
2. George Rose and Ken Harvey stepped down from the Board with effect from 29 July 2013.
Nominations Committee
RoleResponsible for considering the structure, size and composition of the Board and committees, and succession planning. It also identifies and proposes individuals to be Directors and executive management reporting directly to the Chief Executive, and establishes the criteria for any new position.
Review of the yearThe Board is now in the final stages of its phased transition that commenced in 2011. Most recently we have welcomed Therese Esperdy and John Pettigrew to our Board and, following the AGM, Maria Richter will be stepping down from the Board. Nick Winser will also step down from the Board at this time, but will continue in his role as President of ENTSO-E and Chairman of NGET and NGG until July 2015 when he will be leaving the Company.
Following the changes in Board membership, the composition of the committees was reviewed and updated to reflect the new balance of skills, knowledge and experience on the Board.
Diversity of background, thinking styles and expertise have been important criteria in the transition of the Board. During the year the Committee reviewed our Board diversity policy. Progress against the policy was discussed and objectives to support the implementation of the policy were agreed, see page 56 for more details.
The Committee agreed that the first objective should be to continue to meet, and aspire to exceed, the target of 25% of Board positions to be held by women by 2015. I look forward to reporting on our progress next year.
Succession planning below Board level is also important.
During the year the Committee with the Chief Executive reviewed the Executive Committee timeline and succession plans, rather than these being considered by the Board, to allow for a more open discussion. The presentation focused on succession cover to address the key risks and actions identified by an external assessment.
Sir Peter GershonCommittee chairman
55

Corporate Governance continued
Appointment processesNon-executive DirectorThe recruitment process undertaken for the appointment of Therese Esperdy was formal, rigorous and transparent. The Nominations Committee appointed Korn Ferry as the search consultancy, and the following process was undertaken:
• a role profile was prepared against which potential candidates were considered;
• Sir Peter Gershon interviewed an initial list of candidates, from which a shortlist of preferred candidates was selected;
• Maria Richter, Mark Williamson, Steve Holliday and Andrew Bonfield interviewed the shortlist of candidates and provided feedback to the Committee;
• the Committee considered these views in its deliberations before recommending a preferred candidate to the Board; and
• the Board approved the appointment as recommended.
In addition to providing external search consultancy services to the Company, a subsidiary of Korn Ferry provides external coaching to senior managers in the US.
Executive DirectorJohn Pettigrew’s appointment to the Board as an Executive Director had been envisaged for some time. His executive career with the Company has been guided to make sure that he has experience of multiple parts of the business. His readiness and suitability for appointment to the Board was assessed by an external consultant.
As part of the appointment process, John Pettigrew was interviewed individually by Sir Peter Gershon, Mark Williamson, Jonathan Dawson and Ruth Kelly. The feedback from these meetings was discussed by the Committee before agreeing to recommend John’s appointment to the Board. The Board approved the recommendation to appoint John as an Executive Director. John’s role has not changed following his appointment to the Board.
Board diversity and the Davies Review At National Grid, we believe that creating an inclusive and diverse culture supports the attraction and retention of talented people, improves effectiveness, delivers superior performance and enhances the success of the Company.
Our Board diversity policy promotes this and reaffirms our aspiration to meet and exceed the target of 25% of Board positions being held by women by 2015, as set out by Lord Davies.
We currently have 28% women on our Board, which will change to 25% on the departure of Maria Richter and Nick Winser, and 20% women on our Executive Committee.
The number of women in senior management positions and throughout the organisation is set out on page 41 along with examples of the initiatives to promote and support inclusion and diversity throughout our Company.
During the year the Committee reviewed the Board diversity policy and progress made. It also discussed and agreed the following objectives to support the implementation of the policy:
• the Board aspires to exceed the target of 25% of Board positions to be held by women by 2015;
• all Board appointments will be made on merit, in the context of the skills and experience that are needed for the Board to be effective;
• we will only engage executive search firms who have signed up to the voluntary code of conduct on gender diversity;
• where appropriate, we will assist with the development and support of initiatives that promote gender and other forms of diversity among our Board, executive and other senior management;
• where appropriate, we will continue to adopt best practice in response to the Davies Review;
• we will review our progress against the Board diversity policy annually;
• we will report on our progress against the policy and our objectives in the Annual Report and Accounts along with details of initiatives to promote gender and other forms of diversity among our Board, Executive Committee and other senior management; and
• we will continue to make key diversity data, both about the Board and our wider employee population, available in the Annual Report and Accounts.
Progress against the objectives and the policy will be reviewed annually and reported in the Annual Report and Accounts. The implementation of a successful diversity policy will need to be measured over a period of some years during which the size and shape of the Board may change to support the business.
Executive CommitteeLed by the Chief Executive, the Executive Committee oversees the safety, operational and financial performance of the Company. It is responsible for making day-to-day management and operational decisions it considers necessary to safeguard the interests of the Company and to further the strategy, business objectives and targets established by the Board. The Committee plays an important role in the development of our people and in driving a high-performance culture.
It approves expenditure and other financial commitments within its authority levels and discusses, formulates and approves proposals to be considered by the Board.
There are currently 10 members on the Committee. They have a broad range of skills and expertise, which are updated through training and development. Some members also hold external non-executive directorships, giving them valuable board experience.
On a quarterly basis the Committee receives an inclusion and diversity scorecard which sets out statistics from the business at all levels in the UK and US. Progress against our aspirational inclusion and diversity targets is reviewed on an annual basis.
The Committee officially met 12 times this year, but the members interact much more regularly. Those members of the Committee who are not Directors all regularly attend Board and committee meetings for specific agenda items with Alison Kay, Group General Counsel & Company Secretary, being secretary to the Board and Nominations Committee. This means that knowledge is shared and every member is kept up to date with business activities and developments.
56 National Grid Annual Report and Accounts 2013/14

Strategic Report Corporate Governance Financial Statements Additional Information
1 Steve Holliday, Committee chairman2 Andrew Bonfield, Finance Director3 Stephanie Hazell, Group Strategy & Corporate Development
Director (joined the Committee in June 2013 to replace Alison Wood)
4 Alison Kay, Group General Counsel & Company Secretary (see page 173 for her biography)
5 Tom King, Executive Director, US6 David Lister, Chief Information Officer7 George Mayhew, Corporate Affairs Director8 John Pettigrew, Executive Director, UK9 Mike Westcott, Group Human Resources Director10 Nick Winser, Executive Director, UK
Management committeesTo help make sure we allocate time and expertise in the right way, the Company has a number of management committees, which include the Disclosure Committee, Global Ethics and Compliance Committees and the Global Retirement Plan Committee. These management committees provide reports, where relevant, to the appointing committee in line with our governance framework on the responsibilities they have been delegated.
Disclosure CommitteeThe role of the Disclosure Committee is to assist the Chief Executive and the Finance Director in fulfilling their responsibility for overseeing the accuracy and timeliness of the disclosures made – whether in connection with our presentations to analysts, financial reporting obligations or other material stock exchange announcements.
This year the Committee met to consider the announcements of the full- and half-year results and the interim management statements. It reported on the matters arising to the Audit Committee. In doing so it spent time considering the Company’s disclosure obligations relating to RIIO, the implementation of the US financial systems and controls, the LIPA MSA transition and the Board’s approach to the offer of the scrip dividend option. The Committee also reports the results of its evaluation of the effectiveness of the Company’s disclosure controls to the Audit Committee.
The Committee is chaired by the Finance Director and its members are the Group General Counsel & Company Secretary, the Global Tax and Treasury Director, the Group Financial Controller, the Director of Investor Relations, the Director of Corporate Audit and the Deputy Group General Counsel, with other attendees as appropriate.
1
4
7
10
2
5
8
3
6
9
Directors’ Report statutory and other disclosures (starting on page indicated)
AGM page 46
Articles of Association page 176
Audit information page 52
Board of Directors page 43
Business model page 14
Change of control provisions page 173
Code of Ethics page 177
Conflicts of interest page 173
Contractual and other arrangements page 160
Directors’ indemnity page 173
Directors’ share interests page 70
Diversity page 41
Dividend page 02
Events after the reporting period page 173
Financial instruments page 83
Future developments page 12
Greenhouse gas emissions page 11
Human rights page 41
Important events affecting the Company during the year page 06
Internal control page 22
Material interests in shares page 174
People page 40
Political donations and expenditure page 174
Principal activities page 12
Research and development page 174
Risk management page 22
Share capital page 174
The Directors’ Report, prepared in accordance with the requirements of the Companies Act 2006 and the UK Listing Authority’s Listing, and Disclosure and Transparency rules, comprising pages 06 to 73 and 160 to 187, was approved by the Board and signed on its behalf by:
Alison KayGroup General Counsel & Company SecretaryCompany number 403115218 May 2014
57

Remuneration Report
Annual statement from the Remuneration Committee chairmanI am delighted to present my first Directors’ Remuneration Report.
Following the introduction of a new UK regulatory framework in 2013 and the continued evolution of our US business, last summer the Committee initiated an extensive review of our executive remuneration strategy. Our objective was to assess whether the principles on which the current remuneration strategy is based continued to reflect our business drivers given recent changes. Our review concluded that a number of significant changes were appropriate. They are presented in this report for our shareholders’ consideration and, I hope, approval at our 2014 AGM.
The key factor in our discussions was to enhance the alignment of interest between executives and shareholders over the longer term. National Grid is a long-term business, where decisions taken today can have significant impact on performance and profitability over several years. Therefore the Committee believes that the bulk of incentives to executives should be paid in shares and that it is essential for high levels of personal shareholdings to become mandatory, rather than simply guidelines.
Having reached provisional conclusions I wrote to a number of our larger shareholders to seek their views. In the light of the constructive responses we received, the Committee amended its proposals and these amendments are incorporated into the recommendations in this report.
The key components of our recommendations are:
• A rebalancing of variable pay from the Annual Performance Plan (APP) to the Long Term Performance Plan (LTPP). It is proposed:
– to reduce the APP maximum from 150% of salary to 125% of salary for the CEO and the other Executive Directors; and
– to increase the LTPP maximum from 225% to 350% of salary for the CEO and from 200% to 300% of salary for the other Executive Directors.
• Increased alignment with shareholders by requiring Executive Directors to retain a significantly higher number of shares earned. It is proposed:
– for the CEO, the new requirement is a shareholding of 500% of pre-tax salary, equivalent to over nine years’ post-tax salary; and
– for the other Executive Directors, the new requirement is a shareholding of 400% of pre-tax salary.
• Stronger alignment with our business model and the long-term value drivers around a dividend-led total return. It is proposed to move to two key LTPP metrics – RoE (50% weighting) and value growth (50% weighting):
– RoE is aimed at focusing management on driving profits within the business; and
– value growth is viewed as a clearer indicator than EPS of the long-term growth of the business and the creation of shareholder value.
• Extended holding periods for incentive awards. It is proposed that any APP award is paid half in cash and half in shares. The shares would be paid immediately and be subject to a minimum holding period of two years. LTPP performance metrics would be measured over a three year period and awards would then be subject to a minimum two year holding period.
The Company’s commitment to increasing the annual dividend by at least RPI for the foreseeable future would be reflected in LTPP awards. The Committee will have the explicit power to reduce LTPP vesting should the Company fail to honour the dividend commitment, irrespective of the level of vesting resulting from the performance against the LTPP targets set by the Committee.
The consequence of all these changes is to reduce near-term cash incentives (APP) and tilt the balance to longer-term awards and longer-term shareholding exposure, with a greater proportion of Executive Directors’ remuneration earned in shares. As a result, we are striking an important balance between long-term reward and increased financial risk to executives through very high levels of mandatory shareholdings. In setting the quantum of future LTPP awards we have taken account of the reduced APP opportunity and longer holding periods that we are proposing. However, I want to assure shareholders that the Committee’s intention is that any increase in remuneration should arise from commensurate increases in long-term performance. We will therefore seek to ensure that targets set for the LTPP metrics contain appropriately demanding levels of performance to justify any increase in executive reward.
For the 2014 LTPP award we are proposing that maximum payout would require an average annual Group RoE of 12.5% and an average annual value growth of 12% over the three year performance period. The Committee considers these stretch targets, in the light of the business plan and recent performance, to be more challenging to management than those for LTPP set in the recent past. To achieve such a performance would require incremental Group pre-tax profits of over £250 million per annum, which in turn would imply achieved customer savings in the region of £100 – £200 million.
We can also confirm that, had the proposed APP and LTPP targets been applicable for 2013/14, no higher level of incentive remuneration would have resulted than was actually achieved under the current arrangements.
58 National Grid Annual Report and Accounts 2013/14

Strategic Report Corporate Governance Financial Statements Additional Information
In addition to the incentive plans review, the Committee reviewed future pension policy and the Executive Directors’ salaries. Last year there were no salary increases for Executive Directors. For the year ahead the Committee has awarded a 2.5% salary increase to Andrew Bonfield, Steve Holliday and Tom King, in line with the wider Group salary review budget. Nick Winser will not receive a salary increase, due to the fact that he is to stand down from the Board at the AGM in July 2014.
John Pettigrew joined the Board on 1 April 2014 with a starting salary of £475,000 and will not receive a salary increase from 1 June 2014. His remuneration package is in line with the remuneration policy presented for approval in this report. In particular, his salary is below the Committee’s assessment of the market rate for equivalent roles. Subject to his performance, the Committee’s intention is to increase his salary towards market level by way of future phased increases in excess of those awarded to other Executive Directors.
Our 2013/14 performance is set out on page 68. Overall, against the APP performance metrics of adjusted EPS, operating profit, US capital delivery, UK and US RoE and individual objectives, performance was ahead of target. As a result, we have made awards to the Executive Directors of between 83% and 129% of salary.
Details of future targets and historical performance will be disclosed each year in respect of the LTPP, and details of historical performance will be disclosed each year in respect of the APP.
The Committee believes that our proposals to restructure incentive pay are appropriate for the Company and on behalf of the Committee I commend them to shareholders.
Jonathan Dawson Committee chairman
Directors’ remuneration policy The following tables provide details of the policy we intend to apply, subject to shareholder approval, for three years from the date of the 2014 AGM. Following approval it will be displayed on the Company’s website.
There may be circumstances from time to time when the Committee will consider it appropriate to apply some judgement and exercise discretion in respect of the approved policy. This ability to apply discretion is highlighted where relevant in the policy, detailed on pages 60 to 66, and the use of discretion will always be in the spirit of the approved policy.
The Committee will honour any commitments made to Directors before the policy outlined in this report comes into effect.
Our peer groupThe Committee benchmarks its remuneration policy against appropriate peer groups annually to ensure we remain competitive in the relevant markets. The primary focus for reward benchmarking is the FTSE 11-40 for UK-based Executive Directors and general industry and energy services companies with similar levels of revenue for US-based Executive Directors. These peer groups are considered appropriate for a large, complex, international and predominantly regulated business.
How executive remuneration aligns to Company strategy pages 26 – 27
Engage our peopleCreate an inclusive,high-performanceculture by developingall our employees.
59

Remuneration Report continued
Future policy table – Executive Directors
Salary Purpose and link to strategy: to attract, motivate and retain high-calibre individuals, while not overpaying.
Operation Maximum levelsPerformance metrics, weighting and time period applicable
Salaries are targeted broadly at mid-market level.
They are generally reviewed annually. Salary reviews take into account:
• business and individual contribution;• the individual’s skills and experience;• scope of the role, including any changes
in responsibility; and• market data in the relevant
comparator group.
No prescribed maximum annual increase.
Any increases are generally aligned to salary increases received by other Company employees and to market movement. Increases in excess of this may be made at the Committee’s discretion in circumstances such as a significant change in responsibility; progression in the role; and alignment to market level.
Not applicable.
Benefits Purpose and link to strategy: to provide competitive and cost-effective benefits to attract and retain high-calibre individuals.
Operation Maximum levelsPerformance metrics, weighting and time period applicable
Benefits provided include:
• company car or a cash alternative (UK only);• use of a driver when required;• private medical insurance;• life assurance;• personal accident insurance;• opportunity to purchase additional benefits
under flexible benefits schemes available to all employees; and
• opportunity to participate in the following HM Revenue & Customs (UK) or Internal Revenue Service (US) tax advantaged all-employee share plans:
Sharesave: UK employees may make monthly contributions from net salary for a period of 3 or 5 years. The savings can be used to purchase shares at a discounted price, set at the launch of each plan period.
Share Incentive Plan (SIP): UK employees may use gross salary to purchase shares. These shares are placed in trust.
Incentive Thrift Plans (401(k) plans): US employees may participate in these tax-advantaged savings plans. They are DC pension plans in which employees can invest their own and Company contributions.
Employee Stock Purchase Plan (ESPP) (423(b) plan): eligible US employees may purchase ADSs on a monthly basis at a discounted price.
Other benefits may be offered at the discretion of the Committee.
Benefits have no pre-determined maximum, as the cost of providing these varies from year to year.
Participation in tax approved all-employee share plans is subject to limits set by the relevant tax authorities from time to time.
Not applicable.
60 National Grid Annual Report and Accounts 2013/14

Strategic Report Corporate Governance Financial Statements Additional Information
Pension Purpose and link to strategy: to reward sustained contribution and assist attraction and retention.
Operation Maximum levelsPerformance metrics, weighting and time period applicable
Pension for a new Executive Director will reflect whether they are internally promoted or externally appointed.
If internally promoted:
• retention of existing DB benefits without enhancement, except for capping of pensionable pay increases following promotion to Board; or
• retention of existing UK DC benefits or equivalent cash in lieu; or
• retention of existing US DC benefits plus 401(k) plan match, provided through 401(k) plan and non-qualified plans.
If externally appointed:
• UK DC benefits or equivalent cash in lieu; or• US DC benefits plus 401(k) plan match.
Andrew Bonfield and John Pettigrew are treated in line with the above policy.
Steve Holliday and Nick Winser are provided with final salary pension benefits. For service prior to 1 April 2013, pensionable pay is normally the base salary in the 12 months prior to leaving the Company. For service from 1 April 2013 increases to pensionable pay are capped at the lower of 3% or the increase in inflation. Their pension scheme rules allow for indexed prior salaries to be used for all members. They both participate in the unfunded scheme in respect of benefits in excess of the Lifetime Allowance.
Tom King participates in a qualified pension plan and in an Executive Supplemental Retirement Plan. These plans are non-contributory, cash balance and final average pay plans. Tom’s benefits include compensation to buy out entitlements from his former employer that were lost on recruitment to National Grid. This includes a provision to allow an unreduced pension to be taken from age 55 if Tom is still in the employment of the Company at that time.
In line with market practice, pensionable pay for UK-based Executive Directors includes salary only and for US-based Executive Directors it includes salary and APP award.
UK DB: a maximum pension on retirement, at age 60, of two thirds final capped pensionable pay or up to one thirtieth accrual. On death in service, a lump sum of four times pensionable pay and a two thirds dependant’s pension is provided.
UK DC: annual contributions of 30% of salary. Life assurance provision of four times pensionable salary and a spouse’s pension equal to one third of the Director’s salary are provided on death in service.
US DB: an Executive Supplemental Retirement Plan provides for an unreduced pension benefit at age 62 (at age 55 in Tom King’s case). For retirements at age 62 with 35 years of service, the pension benefit would be approximately two thirds of pensionable pay. Upon death in service, the spouse would receive 50% of the pension benefit (100% if the participant died while an active employee after the age of 55).
US DC: 9% of base salary plus APP with additional 401(k) plan match of up to 4%.
Not applicable.
61

Remuneration Report continued
Annual Performance Plan
Purpose and link to strategy: to incentivise and reward the achievement of annual financial and strategic business targets and the delivery of annual individual objectives.
Operation Maximum levelsPerformance metrics, weighting and time period applicable
Performance metrics and targets are agreed at the start of each financial year. Performance metrics are aligned with strategic business priorities. Targets are set with reference to the budget. Awards are paid in June.
For APP awards made in 2013/14, 50% of any award was deferred into shares in the Deferred Share Plan (DSP). The DSP has no performance conditions and vests after three years, subject to continued employment. These shares are subject to forfeiture for leavers in certain circumstances.
For APP awards made in respect of years from 2014/15, it is proposed discontinuing the DSP. Instead 50% of awards will be paid in shares, which (after any sales to pay tax) must be retained until the shareholding requirement is met, and in any event for two years after receipt.
Awards are subject to clawback and malus provisions.
From 2014/15, it is proposed that the maximum award will reduce from 150% of salary to 125% of salary.
A significant majority of the APP is based on performance against corporate financial measures, with the remainder based on performance against individual objectives. Individual objectives are role specific.
The Committee may use its discretion to set measures that it considers appropriate in each financial year and reduce the amount payable, taking account of significant safety or customer service standard incidents, environmental and governance issues.
For 2013/14, the APP was structured so that payout at threshold, target and stretch performance levels were 6.67%, 40% and 100% respectively.
From 2014/15, it is proposed the payout levels will be amended so that payouts at threshold, target and stretch performance levels will be 0%, 50% and 100% respectively.
long Term Performance Plan
Purpose and link to strategy: to drive long-term performance, aligning Executive Director incentives to key strategic objectives and shareholder interests.
Operation Maximum levelsPerformance metrics, weighting and time period applicable
Awards of shares may be granted each year, with vesting subject to long-term performance conditions.
The performance metrics have been chosen as the Committee believes they reflect the creation of long-term value within the business. Targets are set each year with reference to the business plan.
Awards are subject to clawback and malus provisions. Notwithstanding the level of award achieved against the performance conditions, the Committee may use its discretion to reduce the amount vesting, and in particular will take account of compliance with the dividend policy.
From 2014, it is proposed that the maximum award for the CEO will increase from 225% of salary to 350% of salary and from 200% of salary to 300% of salary for the other Executive Directors.
For awards between 2011 and 2013 the performance measures and weightings were:
• adjusted EPS (50%) measured over three years;
• TSR relative to the FTSE 100 (25%) measured over three years; and
• UK or US RoE relative to allowed regulatory returns (25%) measured over four years.
From 2014, it is proposed that the performance measures will be:
• value growth and Group RoE (for the CEO and Finance Director); and
• value growth, Group RoE and UK or US RoE (for the UK and US Executive Directors respectively).
LTPP table continued opposite
62 National Grid Annual Report and Accounts 2013/14

Strategic Report Corporate Governance Financial Statements Additional Information
Long Term Performance Plan continued
Purpose and link to strategy: to drive long-term performance, aligning Executive Director incentives to key strategic objectives and shareholder interests.
Operation Maximum levelsPerformance metrics, weighting and time period applicable
For awards granted from 2014, it is proposed that participants must retain vested shares (after any sales to pay tax) until the shareholding requirement is met, and in any event for a further two years after vesting.
All will be measured over a three year period.
The weightings of these measures may vary year to year, but would always remain such that the value growth metric would never fall below a 25% weighting and never rise above a 75% weighting.
Between 2011 and 2013, 25% of the award vested at threshold and 100% at stretch, with straight-line vesting in between. From 2014, it is proposed that only 20% will vest at threshold.
Future policy table – Non-executive Directors (NEDs)
Fees for NEDs Purpose and link to strategy: to attract NEDs who have a broad range of experience and skills to oversee the implementation of our strategy.
Operation Maximum levelsPerformance metrics, weighting and time period applicable
NED fees (excluding those of the Chairman) are set by the Executive Committee in conjunction with the Chairman; the Chairman’s fees are set by the Committee.
Fee structure:
• Chairman fee;• basic fee, which differs for UK- and
US-based NEDs;• committee membership fee; • committee chair fee; and• Senior Independent Director fee.
Fees are reviewed every year and are benchmarked against those in companies of similar scale and complexity.
NEDs do not participate in incentive or pension plans and, with the exception of the Chairman, are not eligible to receive benefits. The Chairman is covered by the Company’s private medical and personal accident insurance plans and receives a fully expensed car or cash alternative to a car, with the use of a driver, when required.
There is no provision for termination payments.
There are no maximum fee levels.
The benefits provided to the Chairman are not subject to a predetermined maximum cost, as the cost of providing these varies from year to year.
Not applicable.
63
Remuneration Report continued
Shareholding requirement The requirement of Executive Directors to build up and hold a relatively high value of National Grid shares ensures they share a significant level of risk with shareholders and their interests are aligned.
From 2014/15 it is proposed that the existing shareholding guidelines for Executive Directors will be replaced by a firm requirement to build up and retain shares in the Company. The level of holding will increase from 200% of salary to 500% of salary for the CEO and from 125% of salary to 400% of salary for the other Executive Directors.
Unless the shareholding requirement is met, Executive Directors will not be permitted to sell shares, other than to pay tax or in exceptional circumstances.
Differences in remuneration policy for all employeesThe remuneration policy for the Executive Directors is designed with regard to the policy for employees across the Company as a whole. However, there are some differences in the structure of remuneration policy for the senior executives. In general, these differences arise from the development of remuneration arrangements that are market competitive for our various employee categories. They also reflect the fact that, in the case of the Executive Directors, a greater emphasis tends to be placed on performance-related pay in the market, in particular long-term performance-related pay.
All employees are entitled to base salary, benefits and pension. Many employees are eligible for an APP award based on Company and/or individual performance. Eligibility and the maximum opportunity available is based on market practice for the employee’s job band. In addition, around 350 senior management employees are eligible to participate in the LTPP.
The Company has a number of all-employee share plans that provide employees with the opportunity to become, and to think like, a shareholder. These plans include Sharesave and the SIP in the UK and the 401(k) and 423(b) plans in the US. Further information is provided on page 60.
Consideration of remuneration policy elsewhere in the CompanyIn setting the remuneration policy the Committee considers the remuneration packages offered to employees across the Company. As a point of principle, salaries, benefits, pensions and other elements of remuneration are benchmarked regularly to ensure they remain competitive in the markets in which we operate. In undertaking such benchmarking our aim is to be at mid-market level for all job bands, including those subject to union negotiation.
As would be expected, we have differences in pay and benefits across the business which reflect individual responsibility and there are elements of remuneration policy which apply to all, for example, flexible benefits and share plans.
When considering annual salary increases, the Committee reviews the proposals for salary increases for the employee population generally, as it does for any other changes to remuneration policy being considered. This will include a report on the status of negotiations with any trade union represented employees.
The Company includes in its annual employee opinion survey questions on the appropriateness of the pay arrangements within the Company. It does not specifically invite employees to comment on the Directors’ remuneration policy but any comments made by employees are noted.
Policy on recruitment remunerationSalaries for new Executive Directors appointed to the Board will be set in accordance with the terms of the approved remuneration policy in force at the time of appointment, and in particular will take account of the appointee’s skills and experience as well as the scope and market rate for the role.
Where appropriate, salaries may be set below market level initially, with the Committee retaining discretion to award increases in salary in excess of those of the wider workforce and inflation to bring salary to a market level over time, where this is justified by individual and Company performance.
Benefits consistent with those offered to other Executive Directors under the approved remuneration policy in force at the time of appointment will be offered, taking account of local market practice. The Committee may also agree that the Company will meet certain costs associated with the recruitment, for example legal fees, and the Committee may agree to meet certain relocation expenses or provide tax equalisation as appropriate.
Pensions for new Executive Directors appointed to the Board will be set in accordance with the terms of the approved remuneration policy in force at the time of appointment.
Ongoing incentive pay (APP and LTPP) for new Executive Directors will be in accordance with the approved remuneration policy in force at the time of appointment. This means the maximum APP award in any year would be 125% of salary and the maximum LTPP award would be 300% of salary (350% of salary for a new CEO).
For an externally appointed Executive Director, the Company may offer additional cash or share-based payments that it considers necessary to buy out current entitlements from the former employer that will be lost on recruitment to National Grid. Any such arrangements would reflect the delivery mechanisms, time horizons and levels of conditionality of the remuneration lost.
In order to facilitate buy out arrangements as described above, existing incentive arrangements will be used to the extent possible, although awards may also be granted outside of these shareholder-approved schemes if necessary and as permitted under the Listing Rules.
For an internally appointed Executive Director, any outstanding variable pay element awarded in respect of the prior role will continue on its original terms.
Fees for a new Chairman or Non-executive Director will be set in line with the approved policy in force at the time of appointment.
64 National Grid Annual Report and Accounts 2013/14

Strategic Report Corporate Governance Financial Statements Additional Information
Service contracts and policy on payment for loss of office In line with our policy, all Executive Directors have service contracts which are terminable by either party with 12 months’ notice.
The contracts contain provisions for payment in lieu of notice, at the sole and absolute discretion of the Company. Such payments are limited to payment of salary only for the remainder of the notice period with the exception of Nick Winser. In Nick’s case the value of benefits would also be paid. In the UK such payments would be phased on a monthly basis, over a period no greater than 12 months, and the Executive Director would be expected to mitigate any losses where employment is taken up during the notice period. In the US, for tax purposes the policy is to make any payment in lieu of notice as soon as reasonably practicable, and in any event within two and a half months of the later of 31 December and 31 March immediately following the notice date.
In the event of a UK Director being made redundant, statutory compensation would apply and the relevant pension plan rules may result in the early payment of an unreduced pension.
On termination of employment, no APP award would generally be payable and any DSP awards would generally lapse. However, the Committee has the discretion to deem an individual to be a ‘good leaver’, in which case an APP award would be payable on the termination date, based on performance during the financial year up to termination, and DSP awards would vest on the termination date. Examples of circumstances in which a Director would be treated as a ‘good leaver’ include redundancy, retirement, illness, injury, disability and death. Any APP award would be prorated and would be subject to performance achieved against the objectives for that year.
On termination of employment, outstanding awards under the share plans will be treated in accordance with the relevant plan rules approved by shareholders. Share awards would normally lapse. ‘Good leaver’ provisions apply at the Committee’s discretion and in specified circumstances, including redundancy, retirement, illness, injury, disability and death, where awards will be released to the departing Executive Director or, in the case of death, to their estate. Long-term share plan awards held by ‘good leavers’ may vest subject to performance measured at the normal vesting date and are prorated. Such awards would vest at the same time as for other participants.
The Chairman’s appointment is subject to six months’ notice by either party; for the other Non-executive Directors, notice is one month. No compensation is payable to Non-executive Directors if required to stand down.
Copies of Directors’ service contracts and letters of appointment are available to view at the Company’s registered office.
Dates of Directors’ service contracts/letters of appointment
Date of service contract/appointment
Executive DirectorsAndrew Bonfield 1 November 2010Steve Holliday 1 April 2006Tom King 11 July 2007John Pettigrew 1 April 2014Nick Winser 28 April 2003
Non-executive DirectorsPhilip Aiken 15 May 2008Nora Mead Brownell 1 June 2012Jonathan Dawson 4 March 2013Therese Esperdy 18 March 2014Sir Peter Gershon 1 August 2011Paul Golby 1 February 2012Ruth Kelly 1 October 2011Maria Richter 1 October 2003Mark Williamson 3 September 2012
External appointmentsThe Executive Directors may, with the approval of the Board, accept one external appointment as a non-executive director of another company and retain any fees received for the appointment. Experience as a board member of another company is considered to be beneficial personal development, that in turn is of value to the Company.
65

Remuneration Report continued
Total remuneration opportunityThe total remuneration for each of the Executive Directors that could result from the remuneration policy in 2014 under three different performance levels – below threshold (when only fixed pay is receivable), on target and maximum – is shown below.
Andrew Bonfield£’000
100%
43%
18%
39%
54%
£1,000
£2,549
£4,098
22%
24%
Fixed pay On target Maximum
Fixed pay APP LTPP
Tom King£’000
100%
32%
13%55%
44%
£1,865
£3,420
£4,975
18%
38%
Fixed pay On target Maximum
Fixed pay APP LTPP
Steve Holliday£’000
Fixed pay On target Maximum
100%
46%
16%
38%
57%
£1,474
£3,906
£6,337
20%
23%
Fixed pay APP LTPP
John Pettigrew£’000
100%
39%
16%45%
50%
£813
£1,823
£2,832
21%
29%
Fixed pay On target Maximum
Fixed pay APP LTPP
1. ‘Fixed pay’ consists of salary, pension and benefits in kind as provided under the remuneration policy.
2. Salary is that to be paid in 2014/15, taking account of the increases that will be effective from 1 June 2014 shown on page 72.
3. Benefits in kind and pension are as shown in the single total figure of remuneration table for 2013/14 on page 67, except for John Pettigrew. For John, benefits in kind are assumed to be £18,300 and pension is assumed to be £320,000.
4. APP calculations are based on 125% of salary for the period 1 April 2014 to 31 March 2015.
5. LTPP calculations are based on awards with a face value of 350% of 1 June 2014 salary for Steve Holliday and 300% of 1 June 2014 salary for all other Executive Directors.
6. LTPP and APP payout is 50% for on target performance and the maximum is 100% for achieving stretch performance.
7. Tom King’s remuneration opportunity has been converted at $1.62:£1.
Statement of consideration of shareholder viewsThe Committee considers all feedback received from shareholders throughout the year. While the Committee understands that not all shareholders’ views will be the same, we consult with our larger shareholders on a regular basis to understand their expectations with regard to executive remuneration issues and any changes in shareholder views in this regard. In 2013/14 larger shareholders were consulted on the proposed changes to remuneration policy. Shareholders were supportive of the direction of change proposed, particularly increasing holding periods for awards and retention thresholds. Several responses suggested a number of small changes and where possible the Committee has reflected these changes in the proposals.
66 National Grid Annual Report and Accounts 2013/14

Strategic Report Corporate Governance Financial Statements Additional Information
Annual report on remunerationStatement of implementation of remuneration policy in 2013/14Role of Remuneration CommitteeThe Committee is responsible for recommending to the Board the remuneration policy for Executive Directors and the other members of the Executive Committee and for setting the remuneration policy for the Chairman. The aim is to align remuneration policy to Company strategy and key business objectives and ensure it reflects our shareholders’, customers’ and regulators’ interests.
Members of the CommitteeAll members of the Committee are independent. Committee membership during the year and attendance at meetings is set out below:
Member
Number of possible meetings during
the yearNumber of
meetings attended
Jonathan Dawson – chairman from 29 July 2013 6 6Nora Mead Brownell 6 5Paul Golby 6 6Ken Harvey – chairman until 29 July 2013 2 2George Rose 2 2Mark Williamson – appointed on 29 July 2013 4 4
1. Ken Harvey and George Rose stepped down from the Board with effect from 29 July 2013.
The Committee’s activities during the yearMeeting Main areas of discussion
April Individual performance for the 2012/13 APPFramework for the 2013/14 APP2013 Directors’ Remuneration Report Terms of reference and code of conduct for advisors to the Committee
May Annual salary review for Executive Directors and Executive Committee 2012/13 APP outturns and confirmation of awards2013 LTPP awards
July 2010 Performance Share Plan (PSP, the predecessor to the LTPP) final performanceAppointment of new advisors to the Committee
November New incentive plans (APP and LTPP) designReview of outcome from AGM
January Shareholder consultation on new incentive plansFebruary Targets for LTPP and APP proposals
Remuneration policy changesNew format remuneration report
Single total figure of remuneration – Executive Directors (audited information)The following table shows a single total figure in respect of qualifying service for 2013/14, together with comparative figures for 2012/13:
Salary£’000
Benefits in kind£’000
APP£’000
PSP£’000
Pension£’000
Total£’000
2013/14 2012/13 2013/14 2012/13 2013/14 2012/13 2013/14 2012/13 2013/14 2012/13 2013/14 2012/13
Andrew Bonfield 712 709 55 54 790 677 1,418 – 214 213 3,189 1,653Steve Holliday 1,000 996 35 31 1,169 846 2,179 670 418 627 4,801 3,170 Tom King 715 734 23 24 595 526 1,732 466 1,111 980 4,176 2,730Nick Winser 546 543 12 11 704 500 1,177 335 212 148 2,651 1,537
Total 2,973 2,982 125 120 3,258 2,549 6,506 1,471 1,955 1,968 14,817 9,090
1. Base salaries were last increased on 1 June 2012. Tom King’s annual salary was $1,158,000 and was converted at $1.62:£1 in 2013/14 and $1.57:£1 in 2012/13.
2. Benefits in kind include private medical insurance, life assurance, either a fully expensed car or a cash alternative to a car and the use of a driver when required. For Andrew Bonfield, a cash allowance in lieu of additional pension contributions is included within pension rather than benefits in kind.
3. The APP value is the full award before the 50% mandatory deferral into the DSP.
4. During the year, the 2010 PSP award vested and entered a retention period, to be released in June 2014. The above value is based on the share price (744 pence) on the vesting date (1 July 2013). In the prior year the 2009 PSP award vested and entered a retention period, to be released in June 2013. The above valuation is based on the share price (681 pence) on the vesting date (2 July 2012).
5. The pension values for Steve Holliday and Nick Winser represent the additional benefit earned in the year (excluding inflation as measured by the consumer price index (CPI)), multiplied by a factor of 20, less the contributions they made.
6. The pension value for Tom King represents the additional benefit earned in the year multiplied by a factor of 20, plus the Company’s contributions (£7,854) to the 401(k) plan.
7. Andrew Bonfield was a member of the DC pension plan during the year. The pension value represents 30% of salary via a combination of cash allowance in lieu of pension £185,120 (2012/13: £184,385) and Company pension contributions £28,480 (2012/13: £28,367). He opted out of the pension plan from 1 April 2014 and now receives the full cash allowance in lieu of pension of 30% of salary.
8. Pension figures in last year’s report were based on the draft disclosure regulations. The 2012/13 figures in the above table are therefore amended from last year’s report to reflect the final regulations.
67

Remuneration Report continued
Performance against targets for APP 2013/14 (audited information)APP awards are earned by reference to the financial year and paid in June. The APP awards earned in 2013/14 were:
Proportionof max
achieved
Proportion of salary
Financial measures Target Actual
Andrew Bonfield Steve Holliday Tom King Nick Winser
Max Actual Max Actual Max Actual Max Actual
Adjusted EPS (p/share) 51.0 54.3 100% 25% 25.00% 25% 25.00% 25% 25.00% 25% 25.00%Group cash flow (£m) (188) 195 100% 40% 40.00% 40% 40.00% – – – –UK cash flow (£m) 1,077 1,543 100% – – – – – – 45% 45.00%US cash flow ($m) (62) (85) 29.5% – – – – 30% 8.85% – –UK RoE (%) 12.4 12.7 62.46% 15% 9.38% 15% 9.38% – – 35% 21.88%US RoE (%) 9.2 9.0 23.33% 15% 3.50% 15% 3.50% 25% 5.83% – –US capital plan delivery (£m) 1,192 1,219 90.3% 10% 9.03% 10% 9.03% 25% 22.58% – –
Individual objectives See below 45% 24.00% 45% 30.00% 45% 21.00% 45% 37.00%
Totals 150% 110.91% 150% 116.91% 150% 83.26% 150% 128.88%
APP awarded £789,679 £1,169,100 £595,155 £703,685
1. In relation to the financial measures, threshold, target and stretch performance pays out at 6.67%, 40% and 100% respectively and on a straight-line basis in between threshold and target performance and target and stretch performance.
2. Adjusted EPS is amended for the impact of timing and actuarial assumptions on pensions and OPEBs.
3. Group cash flow excludes working capital movements and dividends, and is also amended for the impact of timing and certain LIPA transition costs.
Individual objectivesThe following table indicates the primary areas of focus of the individual performance objectives that the Executive Directors had for 2013/14. Threshold, target and stretch performance pays out at 0%, 50% and 100% respectively overall. Overall performance against these objectives is shown in the table:
AndrewBonfield
SteveHolliday
TomKing
NickWinser
Safety • • •Stakeholder relations • •Employee engagement • • • •Capability development • Financial strategy • Operational excellence • UK Electricity Market Reform (EMR) •US foundation (system implementation) • • Group strategy • Proportion of maximum achieved 53.33% 66.67% 46.67% 82.22%
2013/14 PSP performance (audited information)The PSP value included in the 2013/14 single total figure relates to vesting of the conditional PSP award granted in 2010. Vesting was determined as at 30 June 2013 and was dependent on performance over the three years ending 31 March 2013 for the EPS measure and over the three years ending 30 June 2013 for the TSR measure. Transfer remains conditional upon continued service until 30 June 2014. The performance achieved against the performance targets was:
Performance measureThreshold – 25% vesting
Maximum – 100% vesting Actual
Proportion of maximum achieved
TSR ranking Ranked at median of the comparator group (FTSE 100)
7.5 percentage points or more above median
5.7 percentage points above median
83.3%
Adjusted EPS EPS growth exceeds RPI increase by 3 percentage points
EPS growth exceeds RPI increase by 8 percentage points or more
Exceeded RPI by 6.5 percentage points
77.9%
Total 80.6%
1. The total proportion of maximum achieved is the weighted average of the proportion of maximum achieved for each performance measure. Each of the two measures had a 50% weighting.
68 National Grid Annual Report and Accounts 2013/14

Strategic Report Corporate Governance Financial Statements Additional Information
Total pension entitlements (audited information)The table below provides details of the Executive Directors’ pension benefits:
Total contributions
to DC-typepension plan
£’000
Cash in lieu ofcontributions
to DC-typepension plan
£’000
Accrued pension at
31 March 2014 £’000 pa
Increasein accrued
pension overyear, net
of inflation£’000 pa
Transfer value of accrued
benefits as at 31 March 2014
£’000
Transfer value of increase in accrued
pension over year, net
of inflation£’000
Normal retirement
date
Andrew Bonfield 28 185 – – – – 17/08/2027Steve Holliday – – 506 17 13,013 379 26/10/2016Tom King 8 – 491 55 4,112 462 01/01/2027Nick Winser – – 284 10 6,341 173 06/09/2020
1. The UK-based Executive Directors participate in FPS, a salary sacrifice arrangement for pension contributions. Contributions paid via salary sacrifice have been deducted from the figures in the table above.
2. For Steve Holliday, in addition to the pension above, there is an accrued lump sum entitlement of £125,000 as at 31 March 2014. There was no increase to the accumulated lump sum including and excluding inflation in the year to 31 March 2014. The transfer value information above includes the value of the lump sum. Steve paid contributions of £44,000 via FPS.
3. For Nick Winser, in addition to the pension above, there is an accrued lump sum entitlement of £313,000 as at 31 March 2014. The increase to the accumulated lump sum including inflation was £7,000 and excluding inflation was £nil in the year to 31 March 2014. The transfer value information above includes the value of the lump sum. Nick paid contributions of £33,000 via FPS.
4. For Tom King, the exchange rate as at 31 March 2014 was $1.67:£1 and as at 31 March 2013 was $1.52:£1. In addition to the transfer value quoted above, through participation in a 401(k) plan in the US, the Company made contributions worth £7,854 to a DC arrangement.
5. The increase in accrued pension figures for Steve Holliday and Nick Winser are net of inflation based on RPI for September 2013. The figures in the single figure table on page 67 are based on inflation using CPI for September 2012. If the same inflation measure was used for this table the relevant figures would be an increase in pension of £23,100 for Steve and £12,250 for Nick. Multiplying these figures by a factor of 20 and deducting member contributions correlates to the values in the single figure table. Tom King’s pension figures do not allow for inflation as US pensions in payment or deferment do not increase in line with inflation. For Tom, multiplying the increase in accrued pension over the year, shown above (£55,150), by a factor of 20 and adding Company contributions to a DC-type pension plan, shown above, correlates to the value in the single figure table.
6. There are no additional benefits in the event of early retirement.
Single total figure of remuneration – Non-executive Directors (audited information)The following table shows a single total figure in respect of qualifying service for 2013/14, together with comparative figures for 2012/13:
Fees£’000
Other emoluments£’000
Total£’000
2013/14 2012/13 2013/14 2012/13 2013/14 2012/13
Philip Aiken 88 84 – – 88 84Nora Mead Brownell 88 73 – – 88 73Jonathan Dawson 84 6 – – 84 6Therese Esperdy 3 – – – 3 –Sir Peter Gershon 475 475 17 17 492 492Paul Golby 76 76 – – 76 76Ken Harvey 36 108 – – 36 108Ruth Kelly 76 76 – – 76 76Maria Richter 101 101 – – 101 101George Rose 30 91 – – 30 91Mark Williamson 99 44 – – 99 44
Total 1,156 1,134 17 17 1,173 1,151
1. Sir Peter Gershon’s other emoluments comprise private medical insurance, cash in lieu of a car and the use of a driver when required.
Payments for loss of office or to past Directors (audited information)No payments were made in 2013/14 for these circumstances.
69

Remuneration Report continued
LTPP and DSP (conditional awards) granted during the financial year (audited information)
LTPP Basis of awardFace value
’000
Proportionvesting atthreshold
performance Number of sharesPerformance
period end date
Andrew Bonfield 200% of salary £1,424 25% 194,798June 2016 and
June 2017
Steve Holliday 225% of salary £2,250 25% 307,793June 2016 and
June 2017
Tom King 200% of salary $2,316 25% 41,225 (ADSs)June 2016 and
June 2017
Nick Winser 200% of salary £1,092 25% 149,382June 2016 and
June 2017
1. The face value of the awards is calculated using the share price at the date of grant (27 June 2013) (£7.3101 per share and $56.1784 per ADS).
DSP Basis of awardFace value
’000 Number of shares Release date
Andrew Bonfield 50% of APP value £339 45,706 13 June 2016Steve Holliday 50% of APP value £423 57,118 13 June 2016Tom King 50% of APP value $413 7,119 (ADSs) 13 June 2016Nick Winser 50% of APP value £250 33,741 13 June 2016
1. The face value of the awards is calculated using the share price at the date of grant (13 June 2013) (£7.4092 per share and $57.9720 per ADS).
2. The award made in 2013/14 is 50% of the 2012/13 APP value.
Performance conditions for LTPP awards granted during the financial yearWeighting Conditional share awards granted – 2013
Performance measure Andrew Bonfield Steve Holliday Tom King Nick Winser Threshold – 25% vesting Maximum – 100% vesting
TSR ranking 25% 25% 25% 25% At median of comparator group (FTSE 100)
7.5 percentage points or more above median
Adjusted EPS 50% 50% 50% 50% EPS growth exceeds RPI increase by 3 percentage points
EPS growth exceeds RPI increase by 8 percentage points or more
UK RoE 12.5% 12.5% – 25% Equal to the average allowed regulatory return
2 percentage points or more above the allowed regulatory return
US RoE 12.5% 12.5% 25% – 1 percentage point below the allowed regulatory return
1 percentage point or more above the allowed regulatory return
Conditions for DSP awards granted during the financial yearDSP awards are subject only to continuous employment.
Shareholder dilutionWhere shares may be issued or treasury shares reissued to satisfy incentives, the aggregate dilution resulting from executive share-based incentives will not exceed 5% in any 10 year period. Dilution resulting from all incentives, including all-employee incentives, will not exceed 10% in any 10 year period. The Committee reviews dilution against these limits regularly and under these limits the Company, as at 31 March 2014, had headroom of 4.01% and 7.99% respectively.
Statement of Directors’ shareholdings and share interests (audited information)The Executive Directors are required to build up and hold a shareholding from vested share plan awards. Deferred share awards are not taken into account for these purposes until the end of the deferral period. Shares are valued for these purposes at the 31 March 2014 price, which was 822 pence per share ($68.74 per ADS).
The following table shows how each Executive Director complies with the shareholding requirement and also the number of shares owned by the Non-executive Directors, including connected persons. For Ken Harvey and George Rose, the shareholding is as at the date they stepped down from the Board. For all others it is 31 March 2014.
70 National Grid Annual Report and Accounts 2013/14

Strategic Report Corporate Governance Financial Statements Additional Information
Directors
Shareownership
requirements(multipleof salary)
Numberof sharesrequired
to hold
Numberof shares
ownedoutright
(includingconnected
persons)
Numberof sharesheld as a
multiple ofcurrent salary
Shareownership
requirements met
Vested butunreleased
share awardsubject to
continuousemployment
(PSP 2010)
Conditionalshare awards
subject toperformance
conditions(LTPP 2011,
2012 and 2013)
Conditionalshare awards
subject tocontinuous
employment(DSP 2011,
2012 and 2013)
Executive DirectorsAndrew Bonfield 125% 108,273 699 <1% No 190,589 637,356 130,040Steve Holliday 200% 243,309 752,031 618% Yes 292,880 1,006,643 230,410Tom King 125% 21,058 71,336 423% Yes 46,556 131,378 32,388Nick Winser 125% 83,029 355,413 535% Yes 158,262 487,780 121,777
Non-executive DirectorsPhilip Aiken – – 4,900 n/a n/a – – –Nora Mead Brownell – – 5,000 n/a n/a – – –Jonathan Dawson – – 24,000 n/a n/a – – –Therese Esperdy – – – n/a n/a – – –Sir Peter Gershon – – 75,771 n/a n/a – – –Paul Golby – – 2,500 n/a n/a – – –Ken Harvey – – 5,236 n/a n/a – – –Ruth Kelly – – 800 n/a n/a – – –Maria Richter – – 14,357 n/a n/a – – –George Rose – – 6,792 n/a n/a – – –Mark Williamson – – 4,726 n/a n/a – – –
1. The salary used to calculate the value of shareholding is the salary earned in the year.
2. Andrew Bonfield has not met the shareholding requirement as none of the share awards in the plans in which he has participated have been released yet.
3. Tom King’s holdings and awards are shown as ADSs and each ADS represents five ordinary shares.
4. The release date for the PSP 2010 is 29 June 2014.
5. On 31 March 2014 Andrew Bonfield held 3,421 options granted under the Sharesave plan. These options were granted at a value of 445 pence per share, and they can be exercised at 445 pence per share between April 2016 and September 2016.
6. On 12 June 2013 Steve Holliday exercised two Share Match awards, totalling 37,475 shares. This comprised (i) an award of 16,092 options, expiring in June 2013, exercised for 100 pence in total, and (ii) an award of 21,383 options, expiring in May 2014, exercised for nil value. These shares are included in the table above (‘Number of shares owned outright’). In addition, on 7 April 2014, he exercised a Sharesave option over 3,921 shares at the option price of 427.05 pence per share before expiration in September 2014.
7. For Andrew Bonfield, the number of conditional share awards subject to performance conditions is as follows: LTPP 2011: 229,463; LTPP 2012: 213,095; LTPP 2013: 194,798. The number of conditional share awards subject to continuous employment is as follows: DSP 2011: 29,184; DSP 2012: 55,150; DSP 2013: 45,706.
8. For Steve Holliday, the number of conditional share awards subject to performance conditions is as follows: LTPP 2011: 362,148; LTPP 2012: 336,702; LTPP 2013: 307,793. The number of conditional share awards subject to continuous employment is as follows: DSP 2011: 97,359; DSP 2012: 75,933; DSP 2013: 57,118.
9. For Tom King, the number of conditional awards over ADSs subject to performance conditions is as follows: LTPP 2011: 45,537; LTPP 2012: 44,616; LTPP 2013: 41,225. The number of conditional awards over ADSs subject to continuous employment is as follows: DSP 2011: 13,937; DSP 2012: 11,332; DSP 2013: 7,119.
10. For Nick Winser, the number of conditional share awards subject to performance conditions is as follows: LTPP 2011: 174,986; LTPP 2012: 163,412; LTPP 2013: 149,382. The number of conditional share awards subject to continuous employment is as follows: DSP 2011: 48,354; DSP 2012: 39,682; DSP 2013: 33,741.
11. The normal vesting dates for the conditional share awards subject to performance conditions are 1 July 2014 and 1 July 2015; 1 July 2015 and 1 July 2016; and 1 July 2016 and 1 July 2017 for the LTPP 2011, LTPP 2012 and LTPP 2013 respectively. The normal vesting dates for the conditional share awards subject to continuous employment are 15 June 2014; 14 June 2015; and 13 June 2016 for the DSP 2011, DSP 2012 and DSP 2013 respectively.
12. Non-executive Directors do not have a shareholding requirement.
13. In April and May 2014 a further 30 shares were purchased on behalf of both Steve Holliday and Andrew Bonfield via the Share Incentive Plan (an HMRC approved all-employee share plan), thereby increasing their beneficial interests. There have been no other changes in Directors’ shareholdings between 1 April 2014 and 18 May 2014.
External appointments and retention of feesThe table below details the Executive Directors who served as non-executive directors in other companies during the year ended 31 March 2014:
Company Retained fees (£)
Andrew Bonfield Kingfisher plc 81,200Steve Holliday Marks and Spencer Group plc 85,000Nick Winser Kier Group plc 53,700
Relative importance of spend on payThis chart shows the relative importance of spend on pay compared with other costs and disbursements (dividends, tax, net interest and capital expenditure). Given the capital-intensive nature of our business and the scale of our operations, these costs were chosen as the most relevant for comparison purposes. All amounts exclude exceptional items, remeasurements and stranded cost recoveries.
Payroll costs Dividends Tax Net interest Capital expenditure
1,3731,434 1,567
5816191,1081,124
3,4413,686
1,491-4.3% +5.1%
-6.1%-1.4%
-6.6%2012/13 £m 2013/14 £m
71

Remuneration Report continued
Performance graph and tableThis chart shows National Grid plc’s five year annual total shareholder return (TSR) performance against the FTSE 100 index, of which National Grid is a constituent. It assumes dividends are reinvested. The TSR level shown at 31 March each year is the average of the closing daily TSR levels for the 30 day period up to and including that date.
Total shareholder return
CEO’s pay in the last five financial yearsSteve Holliday was the CEO throughout this five year period.
2009/10 2010/11 2011/12 2012/13 2013/14
Total single figure £’000 3,931 3,738 3,539 3,170 4,801 APP (proportion of maximum awarded) 95.33% 81.33% 68.67% 56.65% 77.94%PSP (proportion of maximum vesting) 100.00% 65.15% 49.50% 25.15% 76.20%
Percentage change in CEO’s remunerationThe table below shows how the percentage change in the CEO’s salary, benefits and APP between 2013/14 and 2012/13 compares with the percentage change in the average of each of those components of remuneration for non-union employees in the UK. The Committee views this group as the most appropriate comparator group, as the CEO is UK-based and this group excludes employees represented by trade unions, whose pay and benefits are negotiated with each individual union.
Salary Taxable benefits APP
£’000 £’000 Increase £’000 £’000 Increase £’000 £’000 Increase
2013/14 2012/13 2013/14 2012/13 2013/14 2012/13
Steve Holliday 1,000 996 0.4% 35 31 12.9% 1,169 846 38.2%UK non-union employees
(increase per employee) 2.9% 0.7% 10.6%
Statement of implementation of remuneration policy in 2014/15The remuneration policy will be implemented with effect from the 2014 AGM as follows:
Salary’000
From1 June 2014
From1 June 2013 Increase
Andrew Bonfield £729.8 £712 2.5%Steve Holliday £1,025 £1,000 2.5%Tom King $1,186.95 $1,158 2.5%John Pettigrew £475 £475 0%
APP measures for 2014/15Weighting
Adjusted EPS 35%Group or UK or US RoE 35%Individual objectives 30%
The APP targets are considered commercially sensitive and consequently will be disclosed after the end of the financial year in the 2014/15 annual report on remuneration.
31/03/09 31/03/10 31/03/11 31/03/12 31/03/13 31/03/140
100
50
250
200
150155.42
173.94
131.11
167.17
123.65
155.79
100.00
190.98
197.94223.74
211.45
National Grid plc FTSE 100 Source: Thomson Reuters
72 National Grid Annual Report and Accounts 2013/14

Strategic Report Corporate Governance Financial Statements Additional Information
Performance measures for LTPP to be awarded in 2014Andrew
BonfieldSteve
HollidayTom King
John Pettigrew
Threshold –20% vesting
Maximum –100% vesting
Group RoE 50% 50% 25% 25% 11.0% 12.5%
UK RoE – – – 25%Allowed return plus1 percentage point
Allowed return plus3.5 percentage points
US RoE – – 25% –90% of
allowed return105% of
allowed return
Value growth 50% 50% 50% 50% 10.0% 12.0%
NEDs’ fees from 2014£’000
From1 June 2014
From1 June 2013 Increase
Chairman 490 475 3.2%Senior Independent Director 22 20 10.0%Board fee (UK-based) 62 60 3.3%Board fee (US-based) 74 72 2.8%Committee membership fee 9 8 12.5%Chair Audit Committee 17 15 13.3%Chair Remuneration Committee 17 12.5 36.0%Chair (other Board committees) 12.5 12.5 0%
1. Committee chair fees are in addition to the committee membership fee.
Advisors to the Remuneration CommitteeThe Committee received advice until 31 July 2013 from independent remuneration consultants Towers Watson. From 1 August 2013 the Committee received advice from independent remuneration consultants New Bridge Street (NBS), a trading name of Aon Hewitt Ltd (part of Aon plc). NBS were selected as advisors by the Committee following a competitive tendering process.
Work undertaken by these advisors included updating the Committee on trends in compensation and governance matters and advising the Committee in connection with benchmarking of the total reward packages for the Executive Directors and other senior employees. NBS and Towers Watson are members of the Remuneration Consultants Group and have signed up to that group’s Code of Conduct. Towers Watson also provides general remuneration, pension and benefits advice and services to the Company. The Committee is satisfied that any potential conflicts were appropriately managed. NBS does not provide any other advice or services to the Company. In the year to 31 March 2014 the Committee paid a total of £262,000 to NBS and Towers Watson, with fees being charged on a time incurred basis.
The Committee also received specialist advice from the following organisations:
• Alithos Limited: provision of TSR calculations for the PSP and LTPP (£25,000 paid in 2013/14);• Linklaters LLP: advice relating to share schemes and to Directors’ service contracts as well as providing other legal advice to the
Company (£26,000 paid in 2013/14); and• KPMG LLP: advice relating to pension matters (£72,000 paid in 2013/14).
The Committee reviews the objectivity and independence of the advice it receives from its advisors each year. It is satisfied that they all provided credible and professional advice.
The Committee considers the views of the Chairman on the performance and remuneration of the CEO; and of the CEO on the performance and remuneration of the other members of the Executive Committee. The Committee is also supported by the Group General Counsel & Company Secretary who acts as Secretary to the Committee, the Group HR Director, the Global Head of Reward and the Global Head of Pensions. No other advisors have provided significant services to the Committee in the year.
Voting on 2012/13 Remuneration Report at 2013 AGMFor Against
Number of votes 2,201m 20mProportion of votes 99.1% 0.9%
1. The voting figures shown above refer to votes cast at the 2013 AGM. In addition, shareholders holding 147m shares abstained.
The Remuneration Report has been approved by the Board and signed on its behalf by:
Jonathan DawsonChairman of the Remuneration Committee18 May 2014
73
Contents
Directors’ statement and independent auditors’ report76 Statement of Directors’ responsibilities77 Independent auditors’ report81 Report of Independent Registered Public Accounting Firm
Consolidated financial statements under IFRSBasis of preparation82 Basis of preparation83 Recent accounting developments
Primary statements84 Consolidated income statement86 Consolidated statement of comprehensive income87 Consolidated statement of changes in equity88 Consolidated statement of financial position90 Consolidated cash flow statement
Notes to the consolidated financial statements – analysis of items in the primary statements92 Note 1 – Adoption of IAS 19 (revised)
‘Employee benefits’93 Note 2 – Segmental analysis97 Note 3 – Operating costs99 Note 4 – Exceptional items, remeasurements
and stranded cost recoveries101 Note 5 – Finance income and costs102 Note 6 – Taxation107 Note 7 – Earnings per share108 Note 8 – Dividends109 Note 9 – Goodwill110 Note 10 – Other intangible assets111 Note 11 – Property, plant and equipment112 Note 12 – Other non-current assets113 Note 13 – Financial and other investments114 Note 14 – Investments in joint ventures and associates114 Note 15 – Derivative financial instruments117 Note 16 – Inventories and current intangible assets118 Note 17 – Trade and other receivables119 Note 18 – Cash and cash equivalents119 Note 19 – Borrowings122 Note 20 – Trade and other payables122 Note 21 – Other non-current liabilities122 Note 22 – Pensions and other post-retirement benefits126 Note 23 – Provisions128 Note 24 – Share capital129 Note 25 – Other equity reserves130 Note 26 – Net debt
Notes to the consolidated financial statements – supplementary information132 Note 27 – Commitments and contingencies133 Note 28 – Related party transactions133 Note 29 – Actuarial information on pensions
and other post-retirement benefits137 Note 30 – Financial risk management145 Note 31 – Borrowing facilities146 Note 32 – Subsidiary undertakings, joint
ventures and associates147 Note 33 – Sensitivities on areas of estimation
and uncertainty148 Note 34 – Additional disclosures in respect of
guaranteed securities
Company financial statements under UK GAAPBasis of preparation155 Company accounting policies
Primary statement156 Company balance sheet
Notes to the Company financial statements157 Note 1 – Fixed asset investments157 Note 2 – Debtors157 Note 3 – Creditors158 Note 4 – Derivative financial instruments158 Note 5 – Investments158 Note 6 – Borrowings158 Note 7 – Called up share capital159 Note 8 – Reserves159 Note 9 – Reconciliation of movements
in total shareholders’ funds159 Note 10 – Parent Company guarantees159 Note 11 – Audit fees
Financial Statements
National Grid Annual Report and Accounts 2013/1474

Strategic Report Corporate Governance Financial Statements Additional Information
We have continued to develop our presentational format to provide shareholders and users of these financial statements with additional information and guidance, and to make them easier to understand.
Throughout these financial statements we have included additional information boxes, providing helpful commentary on what the disclosures mean and why they are important to the understanding of our financial performance and position. Some of these boxes highlight ‘Our strategy in action’, drawing out the key elements of our business model (set out in the Strategic Report on pages 14 and 21), and showing how the disclosures reflect this strategy.
Audit opinionsWe have two audit opinions on our financial statements, reflecting our dual listing on the London Stock Exchange and the New York Stock Exchange. Due to the different reporting requirements for each listing, our auditors are required to confirm compliance with each set of standards in a prescribed format. The IFRS audit opinion has changed this year, reflecting the change to auditing standards, which requires the auditors to provide more detail as to how they have planned and completed their audit, as well as their views on significant matters they have noted and that were discussed by the Audit Committee. There are also additional specific disclosure requirements due to our US listing which are included in the notes.
NotesNotes to the financial statements provide additional information required by statute, accounting standards or other regulations to assist in a more detailed understanding of the primary financial statements. In many notes we have included an accounting policy that describes how the transactions or balance in that note have been measured, recognised and disclosed. The basis of preparation section provides details of accounting policies that apply to transactions and balances in general.
Unaudited commentaryWe have presented with the financial statements certain analysis previously included in the financial review section of the Strategic Report of our Annual Report. This approach provides a more understandable narrative, a logical flow of information and reduces duplication. We have created a combined financial review, including a commentary on items within the primary statements, on pages 84 to 91. Unless otherwise indicated, all analysis provided in the financial statements is on a statutory IFRS basis. All information in ruled boxes styled in the same manner as this one does not form part of the audited financial statements. This has been further highlighted by including the word ‘unaudited’ at the start of each box header. Unaudited commentary boxes appear on pages 85 to 87, 89, 91, 96, 106, 108 and 121.
Introduction to the financial statements
75
The Directors are responsible for preparing the Annual Report and Accounts, including the consolidated financial statements and the Company financial statements, the Directors’ Report, including the Remuneration Report and the Strategic Report, in accordance with applicable law and regulations.
Company law requires the Directors to prepare financial statements for each financial year. Under that law the Directors have prepared the consolidated financial statements in accordance with International Financial Reporting Standards (IFRS) as adopted by the EU, and the Company financial statements and the Remuneration Report in accordance with applicable law and United Kingdom Accounting Standards (United Kingdom generally accepted accounting practice, UK GAAP). In preparing the consolidated financial statements, the Directors have also elected to comply with IFRS, issued by the International Accounting Standards Board (IASB). Under company law the Directors must not approve the financial statements unless they are satisfied that they give a true and fair view of the state of affairs of the Company on a consolidated and individual basis and of the profit or loss of the Company on a consolidated basis for that period.
In preparing these financial statements, the Directors are required to:
• select suitable accounting policies and then apply them consistently;
• make judgements and estimates that are reasonable and prudent;
• state that the consolidated financial statements comply with IFRS as issued by the IASB and IFRS adopted by the EU and, with regard to the Company financial statements, that applicable UK Accounting Standards have been followed, subject to any material departures disclosed and explained in the financial statements; and
• prepare the consolidated financial statements and Company financial statements on a going concern basis unless it is inappropriate to presume that the Company, on a consolidated and individual basis, will continue in business, in which case there should be supporting assumptions or qualifications as necessary.
The Directors are responsible for keeping adequate accounting records that are sufficient to show and explain the Company’s transactions and disclose with reasonable accuracy at any time the financial position of the Company on a consolidated and individual basis, and to enable them to ensure that the consolidated financial statements comply with the Companies Act 2006 and Article 4 of the IAS Regulation and the Company financial statements and the Remuneration Report comply with the Companies Act 2006. They are also responsible for safeguarding the assets of the Company and its subsidiaries and hence for taking reasonable steps for the prevention and detection of fraud and other irregularities.
The Directors are responsible for the maintenance and integrity of the Company’s website. Legislation in the United Kingdom governing the preparation and dissemination of financial statements may differ from legislation in other jurisdictions.
Each of the Directors, whose names and functions are listed on page 43, confirms that:
• to the best of their knowledge, the consolidated financial statements and the Company financial statements, which have been prepared in accordance with IFRS as issued by the IASB and IFRS as adopted by the EU and UK GAAP respectively, give a true and fair view of the assets, liabilities, financial position and profit of the Company on a consolidated and individual basis;
• to the best of their knowledge, the Strategic Report contained in the Annual Report and Accounts includes a fair review of the development and performance of the business and the position of the Company on a consolidated and individual basis, together with a description of the principal risks and uncertainties that it faces; and
• they consider that the Annual Report and Accounts, taken as a whole, is fair, balanced and understandable and provides the information necessary for shareholders to assess the Company’s performance, business model and strategy.
By order of the Board
Alison Kay Group General Counsel & Company Secretary 18 May 2014 Company number: 4031152
Statement of Directors’ responsibilities
76 National Grid Annual Report and Accounts 2013/14

Strategic Report Corporate Governance Financial Statements Additional Information
Report on the financial statementsOur opinionIn our opinion:
• the financial statements, defined below, give a true and fair view of the state of the Group’s and of the Company’s affairs as at 31 March 2014 and of the Group’s profit and cash flows for the year then ended;
• the Group financial statements have been properly prepared in accordance with International Financial Reporting Standards (IFRSs) adopted by the EU;
• the Company financial statements have been properly prepared in accordance with United Kingdom Generally Accepted Accounting Practice (UK GAAP); and
• the financial statements have been prepared in accordance with the requirements of the Companies Act 2006 and, as regards the Group financial statements, Article 4 of the IAS Regulation.
This opinion is to be read in the context of what we say in the remainder of this report.
Separate opinion in relation to IFRSs as issued by the IASBAs explained in the Basis of preparation to the financial statements, the Group, in addition to applying IFRSs as adopted by the EU, has also applied IFRSs as issued by the IASB.
In our opinion the Group financial statements comply with IFRSs as issued by the IASB.
What we have auditedThe Group financial statements and Company financial statements (the financial statements), which are prepared by National Grid plc, comprise:
• the Consolidated income statement and Consolidated statement of comprehensive income for the year then ended;
• the Consolidated statement of changes in equity for the year then ended;
• the Consolidated statement of financial position and Company balance sheet as at 31 March 2014;
• the Consolidated statement of cash flows for the year then ended;
• the Consolidated and Company Basis of preparation; and• the notes to the Consolidated financial statements and the
notes to the Company financial statements, which include explanatory and supplementary information.
We have not audited the Unaudited commentary that is included with the financial statements.
The financial reporting framework that has been applied in the preparation of the Group financial statements comprises applicable law and IFRSs as adopted by the EU. The financial reporting framework that has been applied in the preparation of the Company financial statements comprises applicable law and UK GAAP.
Certain disclosures, including Directors’ Remuneration, required by the financial reporting framework have been presented elsewhere in the Annual Report and Accounts (the Annual Report), rather than in the notes to the financial statements. These are cross-referenced from the financial statements and are identified as audited.
What an audit of financial statements involves We conducted our audit in accordance with International Standards on Auditing (UK and Ireland) (ISAs (UK & Ireland)). An audit involves obtaining evidence about the amounts and disclosures in the financial statements sufficient to give reasonable assurance that the financial statements are free from material misstatement, whether caused by fraud or error. This includes an assessment of:
• whether the accounting policies are appropriate to the Group’s and Company’s circumstances and have been consistently applied and adequately disclosed;
• the reasonableness of significant accounting estimates made by the directors; and
• the overall presentation of the financial statements.
In addition, we read all the financial and non-financial information in the Annual Report to identify material inconsistencies with the audited financial statements and to identify any information that is apparently materially incorrect based on, or materially inconsistent with, the knowledge acquired by us in the course of performing the audit. If we become aware of any apparent material misstatements or inconsistencies we consider the implications for our report.
Overview of our audit approachMaterialityWe consider an item material if, in our judgement, it is likely to have an impact on the economic decisions of the Company members to whom this opinion is addressed.
We set certain thresholds for materiality. These helped us to determine the nature, timing and extent of our audit procedures and to evaluate the effect of potential misstatements, both individually and on the financial statements as a whole.
Based on our professional judgement, we determined materiality for the Group financial statements as a whole (overall materiality) to be £126m which represents approximately 5% of profit before tax, exceptional items, remeasurements and stranded cost recoveries, which we have determined to be the relevant measure of underlying business performance.
We reported all misstatements greater than £6m identified by our audit to the Audit Committee.
Overview of the scope of our auditThe Group is structured along four business segments being UK Electricity Transmission, UK Gas Transmission, UK Gas Distribution and US Regulated with activities falling outside these business segments included in Other activities.
In establishing the overall approach to the Group audit, we determined the type of work that needed to be performed at the reporting units, within these business segments, by us, as the Group engagement team, or component auditors within PwC UK and from other PwC network firms operating under our instruction. Where the work was performed by component auditors, we determined the level of involvement we needed to have in the audit work at those business segments to be able to conclude whether sufficient appropriate audit evidence had been obtained as a basis for our opinion on the Group financial statements as a whole.
Accordingly, we identified that UK Electricity Transmission, UK Gas Transmission, UK Gas Distribution and US Regulated required an audit of their complete financial information due to their size.
Independent auditors’ reportto the Members of National Grid plc
77

We set out below further details of each of the areas of focus along with how they were addressed by the scope of our audit.
Area of focus:Presentation of exceptional items and quality of earningsThe directors’ assessment of what is exceptional is judgemental and while National Grid has a policy, by its nature there is judgement included in applying this and deciding which items to include and exclude.
How the scope of our audit addressed the area of focus:We have tested the existence and completeness of amounts recorded as exceptional items and assessed management’s judgements that they are aligned to the underlying policy disclosed on page 99.
Area of focus:Accuracy and valuation of treasury derivative transactionsNational Grid has a significant treasury position with total borrowings as detailed in note 19. The valuation of derivatives is a complex and judgemental area and the strategies used by the directors for hedge accounting are varied.
How the scope of our audit addressed the area of focus:We tested the controls surrounding the treasury management systems and the data entry into these systems. We confirmed with external counterparties the accuracy of the derivative transactions recorded.
We obtained evidence to support the directors’ strategies and key inputs into the models, in particular price assumptions and agreed key contractual inputs back to underlying sources. We also tested the integrity of the valuation model, including the formulae applied in the model.
Area of focus:Management override of internal controlsISAs (UK & Ireland) require that we consider this.
How the scope of our audit addressed the area of focus:We tested the appropriateness of manual journal entries. We considered whether there was evidence of bias by the directors in the significant accounting estimates and judgements relevant to the financial statements. We also assessed the overall control environment of the Group, including the arrangements for employees to ‘whistle-blow’ inappropriate actions, and interviewed senior management and the Group’s internal audit function in respect of fraud.
Specific audit procedures on certain balances and transactions were also performed at four reporting units within Other activities. The procedures described above provide coverage of 86% of profit before tax before exceptional items, remeasurements and stranded cost recoveries. In addition, we performed specific procedures on exceptional items, remeasurements and stranded cost recoveries. This, together with the procedures performed at the Group level, gave us the evidence we needed for our opinion on the Group financial statements as a whole. The Group team retains overall responsibility for the audit of the financial statements.
Areas of audit focusIn preparing the financial statements, the directors made a number of subjective judgements, for example in respect of significant accounting estimates that involved making assumptions and considering future events that are inherently uncertain. We primarily focused our work in these areas by assessing the directors’ judgements against available evidence, forming our own judgements, and evaluating the disclosures in the financial statements.
In our audit, we tested and examined information, using sampling and other auditing techniques, to the extent we considered necessary to provide a reasonable basis for us to draw conclusions. We obtained audit evidence through testing the effectiveness of controls, substantive procedures or a combination of both.
We considered the following to be areas that required particular focus in the current year. This is not a complete list of all risks or areas of focus identified by our audit. We discussed these areas of focus with the Audit Committee. Their report on those matters that they considered to be significant issues in relation to the financial statements is set out on page 49.
The risks underlying the areas of focus can be categorised by their principal nature.
Principal nature of risk
Area of focus Fraud Error
Recurring risksPresentation of exceptional items
and quality of earnings • •Management override of internal controls •Accuracy and valuation of treasury
derivative transactions •Event-driven risksImpact of the US enterprise resource system
stabilisation on financial close process •LIPA contract accounting •
Independent auditors’ reportto the Members of National Grid plc continued
78 National Grid Annual Report and Accounts 2013/14

Strategic Report Corporate Governance Financial Statements Additional Information
Going concernUnder the Listing Rules we are required to review the directors’ statement, set out on page 52, in relation to going concern. We have nothing to report having performed our review.
As noted in the directors’ statement, the directors have concluded that it is appropriate to prepare the Group’s and Company’s financial statements using the going concern basis of accounting. The going concern basis presumes that the Group and Company have adequate resources to remain in operation, and that the directors intend them to do so, for at least one year from the date the financial statements were signed. As part of our audit we have concluded that the directors’ use of the going concern basis is appropriate.
However, because not all future events or conditions can be predicted, these statements are not a guarantee as to the Group’s and the Company’s ability to continue as a going concern.
Opinions on other matters prescribed by the Companies Act 2006In our opinion:
• the information given in the Strategic Report and the Directors’ Report for the financial year for which the financial statements are prepared is consistent with the financial statements;
• the part of the Directors’ Remuneration Report to be audited has been properly prepared in accordance with the Companies Act 2006; and
• the information given in the Strategic Report set out on pages 22 to 25 in the Annual Report with respect to internal control and risk management systems and about share capital structures on pages 174 and 175 are consistent with the financial statements.
Other matters on which we are required to report by exceptionAdequacy of accounting records and information and explanations receivedUnder the Companies Act 2006 we are required to report to you if, in our opinion:
• we have not received all the information and explanations we require for our audit; or
• adequate accounting records have not been kept by the Company, or returns adequate for our audit have not been received from branches not visited by us; or
• the Company financial statements and the part of the Directors’ Remuneration Report to be audited are not in agreement with the accounting records and returns.
We have no exceptions to report arising from this responsibility.
Area of focus:Impact of the US enterprise resource system stabilisation on financial close processThe continued implementation programme associated with the new US enterprise resource system in National Grid US has resulted in ongoing changes to key business processes and controls. These changes and the introduction of a number of temporary manual controls mean the financial information of National Grid US is subject to a higher risk of error, in particular in relation to potential issues with user access controls, the quality of account reconciliations and the capitalisation of labour and contractor costs into property, plant and equipment (PPE).
How the scope of our audit addressed the area of focus:We tested the design and operating effectiveness of key IT controls relating to segregation of duties and user access, including monitoring controls, to confirm appropriate use of system access.
We identified the critical reconciliations in place to support the Group financial statements and tested that these reconciliations were performed and reviewed, and that reconciling items were appropriately supported.
We tested the design and operating effectiveness of key controls in relation to the capitalisation of internal labour costs within PPE. We also tested costs incurred and the treatment of these costs as capitalised or expensed.
Area of focus:LIPA contract accountingNational Grid US’s 15 year PSA with LIPA was renewed in May 2013. This is a complex agreement and required significant judgement by the directors in respect of its accounting treatment under leasing accounting standards.
During the year National Grid US transitioned the operation of another significant contract, the LIPA Management Services Agreement (MSA), to a new contractor. This process was complex and involved the transition of a significant number of employees, and related accounting judgements. LIPA MSA transition costs have been treated by the directors as exceptional as set out on page 99, which was considered as part of the presentation of exceptional items and quality of earnings area of focus.
How the scope of our audit addressed the area of focus:For both the PSA and MSA contracts we considered the implications of the specific terms and conditions on the recognition and measurement of liabilities. In relation to the PSA we considered management’s judgements concerning the determination as to whether it should be recognised as an operating or finance lease based on the specific contractual terms and the requirements of IAS 17 ‘Leases’.
79

Responsibilities for the financial statements and the auditOur responsibilities and those of the directors As explained more fully in the Statement of Directors’ Responsibilities set out on page 76, the directors are responsible for the preparation of the Group and Company financial statements and for being satisfied that they give a true and fair view.
Our responsibility is to audit and express an opinion on the Group and Company financial statements in accordance with applicable law and ISAs (UK & Ireland). Those standards require us to comply with the Auditing Practices Board’s Ethical Standards for Auditors.
This report, including the opinions, has been prepared for and only for the Company’s members as a body in accordance with Chapter 3 of Part 16 of the Companies Act 2006 and for no other purpose. We do not, in giving these opinions, accept or assume responsibility for any other purpose or to any other person to whom this report is shown or into whose hands it may come save where expressly agreed by our prior consent in writing.
Nicholas Blackwood (Senior Statutory Auditor) for and on behalf of PricewaterhouseCoopers llP Chartered Accountants and Statutory Auditors London 21 May 2014
Directors’ remunerationUnder the Companies Act 2006 we are required to report to you if, in our opinion, certain disclosures of directors’ remuneration specified by law have not been made. We have no exceptions to report arising from this responsibility.
Corporate Governance statementUnder the Companies Act 2006, we are required to report to you if, in our opinion, a corporate governance statement has not been prepared by the Company. We have no exceptions to report arising from this responsibility.
Under the Listing Rules we are required to review the part of the Corporate Governance statement relating to the Company’s compliance with nine provisions of the UK Corporate Governance Code (the Code). We have nothing to report having performed our review.
On page 76 of the Annual Report, as required by the Code Provision C.1.1, the directors state that they consider the Annual Report taken as a whole to be fair, balanced and understandable and provides the information necessary for members to assess the Group’s performance, business model and strategy. On page 50, as required by C3.8 of the Code, the Audit Committee has set out the significant issues that it considered in relation to the financial statements, and how they were addressed. Under ISAs (UK & Ireland) we are required to report to you if, in our opinion:
• the statement given by the directors is materially inconsistent with our knowledge of the Group acquired in the course of performing our audit; or
• the section of the Annual Report describing the work of the Audit Committee does not appropriately address matters communicated by us to the Audit Committee.
We have no exceptions to report arising from this responsibility.
Other information in the Annual ReportUnder ISAs (UK & Ireland), we are required to report to you if, in our opinion, information in the Annual Report is:
• materially inconsistent with the information in the audited financial statements; or
• apparently materially incorrect based on, or materially inconsistent with, our knowledge of the Group and Company acquired in the course of performing our audit; or
• is otherwise misleading.
We have no exceptions to report arising from this responsibility.
Independent auditors’ reportto the Members of National Grid plc continued
80 National Grid Annual Report and Accounts 2013/14

Strategic Report Corporate Governance Financial Statements Additional Information
Audit opinion for Form 20-FIn our opinion, the accompanying consolidated statements of financial position and the related consolidated income statements, consolidated statements of comprehensive income, consolidated cash flow statements and consolidated statements of changes in equity, present fairly, in all material respects, the financial position of National Grid plc and its subsidiaries at 31 March 2014 and 31 March 2013, and the results of their operations and their cash flows for each of the three years in the period ended 31 March 2014 in conformity with International Financial Reporting Standards as issued by the International Accounting Standards Board and in conformity with International Financial Reporting Standards as adopted by the European Union.
Also in our opinion, the Company maintained, in all material respects, effective internal control over financial reporting as of 31 March 2014, based on criteria established in Internal Control – Integrated Framework (1992) issued by the Committee of Sponsoring Organizations of the Treadway Commission (COSO). The Company’s management is responsible for these financial statements, for maintaining effective internal control over financial reporting and for its assessment of the effectiveness of internal control over financial reporting, included in the Additional Information section appearing on page 170 of the 2014 Annual Report and Accounts. As discussed in note 1, the Group changed the manner in which it accounts for employee benefits.
Our responsibility is to express opinions on these financial statements and on the Company’s internal control over financial reporting based on our integrated audits. We conducted our audits in accordance with the standards of the Public Company Accounting Oversight Board (United States). Those standards require that we plan and perform the audits to obtain reasonable assurance about whether the financial statements are free of material misstatement and whether effective internal control over financial reporting was maintained in all material respects. Our audits of the financial statements included examining, on a test basis, evidence supporting the amounts and disclosures in the financial statements, assessing the accounting principles used and significant estimates made by management, and evaluating the overall financial statement presentation. Our audit of internal control over financial reporting included obtaining an understanding of internal control over financial reporting, assessing the risk that a material weakness exists, and testing and evaluating the design and operating effectiveness of internal control based on the assessed risk. Our audits also included performing such other procedures as we considered necessary in the circumstances. We believe that our audits provide a reasonable basis for our opinions.
A company’s internal control over financial reporting is a process designed to provide reasonable assurance regarding the reliability of financial reporting and the preparation of financial statements for external purposes in accordance with generally accepted accounting principles. A company’s internal control over financial reporting includes those policies and procedures that (i) pertain to the maintenance of records that, in reasonable detail, accurately and fairly reflect the transactions and dispositions of the assets of the company; (ii) provide reasonable assurance that transactions are recorded as necessary to permit preparation of financial statements in accordance with generally accepted accounting principles, and that receipts and expenditures of the company are being made only in accordance with authorisations of management and directors of the company; and (iii) provide reasonable assurance regarding prevention or timely detection of unauthorised acquisition, use, or disposition of the company’s assets that could have a material effect on the financial statements.
Because of its inherent limitations, internal control over financial reporting may not prevent or detect misstatements. Also, projections of any evaluation of effectiveness to future periods are subject to the risk that controls may become inadequate because of changes in conditions, or that the degree of compliance with the policies or procedures may deteriorate.
PricewaterhouseCoopers llP London United Kingdom 21 May 2014
Report of Independent Registered Public Accounting Firmto the Board of Directors and Shareholders of National Grid plc
81

Accounting policies describe our approach to recognising and measuring transactions and balances in the year. Accounting policies applicable across the financial statements are shown below. Accounting policies that are specific to a component of the financial statements have been incorporated into the relevant note.
This section also shows areas of judgement and key sources of estimation uncertainty in these financial statements. In addition, we summarise new EU endorsed accounting standards, amendments and interpretations and whether these are effective in 2014 or later years, explaining how significant changes are expected to affect our reported results.
National Grid’s principal activities involve the transmission and distribution of electricity and gas in Great Britain and northeastern US. The Company is a public limited liability company incorporated and domiciled in England, with its registered office at 1-3 Strand, London WC2N 5EH.
The Company has its primary listing on the London Stock Exchange and is also quoted on the New York Stock Exchange. These consolidated financial statements were approved for issue by the Board of Directors on 18 May 2014.
These consolidated financial statements have been prepared in accordance with International Accounting Standards (IAS) and International Financial Reporting Standards (IFRS) and related interpretations as issued by the International Accounting Standards Board (IASB) and IFRS as adopted by the EU. They are prepared on the basis of all IFRS accounting standards and interpretations that are mandatory for periods ending 31 March 2014 and in accordance with the Companies Act 2006 applicable to companies reporting under IFRS and Article 4 of the EU IAS Regulation. The 2013 and 2012 comparative financial information has also been prepared on this basis.
The consolidated financial statements have been prepared on an historical cost basis, except for the recording of pension assets and liabilities, the revaluation of derivative financial instruments and certain commodity contracts and investments classified as available-for-sale.
The consolidated financial statements have been prepared on a going concern basis following the assessment made by the Directors as set out on page 52.
These consolidated financial statements are presented in pounds sterling, which is also the functional currency of the Company.
The preparation of financial statements requires management to make estimates and assumptions that affect the reported amounts of assets and liabilities, disclosures of contingent assets and liabilities and the reported amounts of revenue and expenses during the reporting period (see accounting policy C).
A. Basis of consolidationThe consolidated financial statements incorporate the financial statements of the Company and its subsidiaries, together with a share of the results, assets and liabilities of jointly controlled entities (joint ventures) and associates using the equity method of accounting, where the investment is carried at cost plus post-acquisition changes in the share of net assets of the joint venture or associate, less any provision for impairment.
A subsidiary is defined as an entity controlled by the Company. Control is achieved where the Company has the power to affect the returns of an entity to which it is exposed or to which it has rights.
Losses in excess of the consolidated interest in joint ventures and associates are not recognised, except where the Company or its subsidiaries have made a commitment to make good those losses.
Where necessary, adjustments are made to bring the accounting policies used in the individual financial statements of the Company, subsidiaries, joint ventures and associates into line with those used by the Company in its consolidated financial statements under IFRS. Intercompany transactions are eliminated.
The results of subsidiaries, joint ventures and associates acquired or disposed of during the year are included in the consolidated income statement from the effective date of acquisition or up to the effective date of disposal, as appropriate.
Acquisitions are accounted for using the acquisition method, where the purchase price is allocated to the identifiable assets acquired and liabilities assumed on a fair value basis and the remainder recognised as goodwill.
B. Foreign currenciesTransactions in currencies other than the functional currency of the Company or subsidiary concerned are recorded at the rates of exchange prevailing on the dates of the transactions. At each reporting date, monetary assets and liabilities that are denominated in foreign currencies are retranslated at closing exchange rates. Non-monetary assets are not retranslated unless they are carried at fair value.
Gains and losses arising on the retranslation of monetary assets and liabilities are included in the income statement, except where the adoption of hedge accounting requires inclusion in other comprehensive income – note 15.
On consolidation, the assets and liabilities of operations that have a functional currency different from the Company’s functional currency of pounds sterling, principally our US operations that have a functional currency of dollars, are translated at exchange rates prevailing at the reporting date. Income and expense items are translated at the weighted average exchange rates for the period where these do not differ materially from rates at the date of the transaction. Exchange differences arising are classified as equity and transferred to the consolidated translation reserve.
Basis of preparation
82 National Grid Annual Report and Accounts 2013/14

Strategic Report Corporate Governance Financial Statements Additional Information
Recent accounting developments
New IFRS accounting standards and interpretations adopted in 2013/14During the year ended 31 March 2014, with the exception of IAS 19 (revised), and in respect of disclosures required by IFRS 13 ‘Fair value measurements’, the Company has not adopted any new IFRS, IAS or amendments issued by the IASB, or interpretations issued by the IFRS Interpretations Committee (IFRIC), which have had a material impact on the Company’s consolidated financial statements. The impact of IAS 19 (revised) is set out in note 1. The additional disclosures required by IFRS 13 are included in note 30.
Other standards, interpretations and amendments issued by the IASB and IFRIC that have not had a material impact on the Company’s consolidated results or assets and liabilities are:
• IFRS 10 ‘Consolidated financial statements’; • IFRS 11 ‘Joint arrangements’;• IFRS 12 ‘Disclosure of interests in other entities’;• amendments to IAS 27 ‘Separate financial statements’ and
IAS 28 ‘Investments in associates and joint ventures’ as a result of the adoption of the above standards;
• amendments to IAS 1 ‘Presentation of financial statements’; and
• amendments to IFRS 7 ‘Financial instruments: Disclosures’.
New IFRS accounting standards and interpretations not yet adoptedThe Company enters into a significant number of transactions that fall within the scope of IFRS 9 ‘Financial instruments’. The IASB is completing IFRS 9 in phases and the Company is evaluating the impact of the standard as it develops. It is currently expected that the standard will be required to be adopted by the Company on 1 April 2018. We are currently assessing the likely impact of this standard on the Company’s consolidated financial statements.
Other standards and interpretations or amendments thereto which have been issued, but are not yet effective, are not expected to have a material impact on the Company’s consolidated financial statements.
C. Areas of judgement and key sources of estimation uncertaintyThe preparation of financial statements requires management to make estimates and assumptions that affect the reported amounts of assets and liabilities, disclosures of contingent assets and liabilities and the reported amounts of revenue and expenses during the reporting period. Actual results could differ from these estimates. Information about such judgements and estimations is contained in the notes to the financial statements, and the key areas are summarised below.
Areas of judgement that have the most significant effect on the amounts recognised in the financial statements are as follows:
• the categorisation of certain items as exceptional items, remeasurements and stranded cost recoveries and the definition of adjusted earnings – notes 4 and 7; and
• energy purchase contracts classification as being for normal purchase, sale or usage – note 27.
IFRS provides certain options available within accounting standards. Choices we have made, and continue to make, include the following:
• Presentational formats: we use the nature of expense method for our income statement and aggregate our statement of financial position to net assets and total equity. In the income statement, we present subtotals of total operating profit, profit before tax and profit from continuing operations, together with additional subtotals excluding exceptional items, remeasurements and stranded cost recoveries. Exceptional items, remeasurements and stranded cost recoveries are presented separately on the face of the income statement.
• Customer contributions: contributions received prior to 1 July 2009 towards capital expenditure are recorded as deferred income and amortised in line with the depreciation on the associated asset.
• Financial instruments: we normally opt to apply hedge accounting in most circumstances where this is permitted. For net investment hedges, we have chosen to use the spot rate method, rather than the alternative forward rate method.
Key sources of estimation uncertainty that have significant risk of causing a material adjustment to the carrying amounts of assets and liabilities within the next financial year are as follows:
• impairment of goodwill – note 9;• review of residual lives, carrying values and impairment charges
for other intangible assets and property, plant and equipment – notes 10 and 11;
• estimation of liabilities for pensions and other post-retirement benefits – notes 22 and 29;
• valuation of financial instruments and derivatives – notes 15 and 30;
• revenue recognition and assessment of unbilled revenue – note 2;
• recoverability of deferred tax assets – note 6; and• environmental and decommissioning provisions – note 23.
In order to illustrate the impact that changes in assumptions could have on our results and financial position, we have included sensitivity analysis in note 33.
83

Notes2014
£m2014
£m
2013(restated)1
£m
2013(restated)1
£m
2012(restated)1
£m
2012(restated)1
£m
Revenue 2(a) 14,809 14,359 13,832Operating costs 3 (11,074) (10,610) (10,297)
Operating profitBefore exceptional items, remeasurements and stranded
cost recoveries 2(b) 3,664 3,639 3,491Exceptional items, remeasurements and stranded cost
recoveries 4 71 110 44
Total operating profit 2(b) 3,735 3,749 3,535
Finance income 5 36 30 28
Finance costsBefore exceptional items and remeasurements 5 (1,144) (1,154) (1,118)Exceptional items and remeasurements 4,5 93 68 (70)
Total finance costs 5 (1,051) (1,086) (1,188)Share of post-tax results of joint ventures and associates 14 28 18 7
Profit before taxBefore exceptional items, remeasurements and stranded
cost recoveries 2(b) 2,584 2,533 2,408Exceptional items, remeasurements and stranded cost
recoveries 4 164 178 (26)
Total profit before tax 2(b) 2,748 2,711 2,382TaxationBefore exceptional items, remeasurements and stranded
cost recoveries 6 (581) (619) (697)Exceptional items, remeasurements and stranded cost
recoveries 4,6 297 62 234
Total taxation 6 (284) (557) (463)
Profit after taxBefore exceptional items, remeasurements and stranded
cost recoveries 2,003 1,914 1,711Exceptional items, remeasurements and stranded cost
recoveries 4 461 240 208
Profit for the year 2,464 2,154 1,919
Attributable to:Equity shareholders of the parent 2,476 2,153 1,917Non-controlling interests (12) 1 2
2,464 2,154 1,919
Earnings per share2
Basic 7(a) 66.4p 57.8p 51.6pDiluted 7(b) 66.1p 57.5p 51.3p
1. See note 1 on page 92.
2. Comparative amounts have been restated to reflect the impact of additional shares issued as scrip dividends.
Consolidated income statementfor the years ended 31 March
84 National Grid Annual Report and Accounts 2013/14

Strategic Report Corporate Governance Financial Statements Additional Information
Unaudited commentary on the consolidated income statement
The consolidated income statement shows all revenue earned and costs incurred in the year, with the difference being the overall profit for the year.
RevenueRevenue for the year ended 31 March 2014 increased by £450m to £14,809m. This increase was driven by higher revenues in our UK Electricity Transmission and UK Gas Distribution businesses, principally as a result of the new RIIO regulatory arrangements. Revenue in our US Regulated businesses was also higher, reflecting higher pass-through costs such as gas and electricity commodity costs, partially offset by the end of the Niagara Mohawk deferral revenue recoveries at 31 March 2013 and the impact of the weaker dollar.
Operating costsOperating costs for the year ended 31 March 2014 of £11,074m were £464m higher than the prior year. This increase in costs was predominantly due to increases in pass-through costs in our UK and US Regulated businesses, together with higher depreciation and amortisation as a result of continued investment and increases in our controllable costs.
Exceptional items, remeasurements and stranded cost recoveries included in operating costs for the year ended 31 March 2014 were £39m lower than the prior year. Net exceptional gains included in 2013/14 of £55m primarily consisted of a net gain on the LIPA MSA transition in the US of £254m, a gain of £16m following the sale to a third party of a settlement award, restructuring costs of £136m and UK gas holder demolition costs of £79m. The 2013/14 results also included a gain of £16m on remeasurements of commodity contracts.
There were no major storms affecting our operations in the year ended 31 March 2014. In 2012/13, two major storms in the US, Superstorm Sandy and Storm Nemo, increased operating costs by £136m.
Net finance costsFor the year ended 31 March 2014, net finance costs before exceptional items and remeasurements were £16m lower than 2012/13 at £1,108m, mainly due to the impact of the weaker dollar (£17m).
Finance costs for the year ended 31 March 2014 also included a gain of £93m on financial remeasurements relating to net gains and losses on derivative financial instruments.
TaxationThe tax charge on profits before exceptional items, remeasurements and stranded cost recoveries was £38m lower than 2012/13. This was mainly due to a 1% decrease in the UK statutory corporation tax rate in the year and a change in the UK/US profit mix where higher UK profits were taxed at the lower UK tax rate. Our tax charge was also affected by changes in tax provisions in respect of prior years.
Exceptional tax for 2013/14 included an exceptional deferred tax credit of £398m arising from a reduction in the UK corporation tax rate from 23% to 21% applicable from 1 April 2014 and a further reduction to 20% from 1 April 2015.
Adjusted earnings and EPSThe following chart shows the five year trend in adjusted profit attributable to equity shareholders of the parent (adjusted earnings) and adjusted EPS.
£1,447m£1,627m £1,709m
2009/10 2010/11 2011/12 2012/13 2013/14
£1,913m £2,015m
47.1p 45.4p 46.0p
51.4p54.0p
Adjusted earnings and adjusted EPS1
Adjusted EPSAdjusted earnings
1. All comparatives restated for IAS 19 (revised). See note 1 on page 92. Adjusted earnings and adjusted EPS are attributable to equity shareholders of the parent.
The above earnings performance translated into adjusted EPS growth in 2013/14 of 2.6p (5%).
In accordance with IAS 33, all EPS and adjusted EPS amounts for comparative periods have been restated for shares issued via scrip dividends and the bonus element of the 2010 rights issue.
Exchange ratesOur financial results are reported in sterling. Transactions for our US operations are denominated in dollars, so the related amounts that are reported in sterling depend on the dollar to sterling exchange rate. The weighted average dollar rate weakened to $1.62:£1 in 2013/14 from $1.57:£1 in 2012/13. Consequently, if 2012/13 results had been translated at 2013/14 exchange rates, revenue, adjusted operating profit and operating profit reported in sterling would have been £242m, £34m and £39m lower respectively.
The statement of financial position has been translated at an exchange rate of $1.67:£1 at 31 March 2014 ($1.52 :£1 at 31 March 2013).
This unaudited commentary does not form part of the financial statements.
85

Notes2014
£m
2013(restated)1
£m
2012(restated)1
£m
Profit for the year 2,464 2,154 1,919
Other comprehensive income/(loss)Items that will never be reclassified to profit or loss
Remeasurements of net retirement benefit obligations 22 485 (714) (1,140)Tax on items that will never be reclassified to profit or loss 6 (172) 179 342
Total items that will never be reclassified to profit or loss 313 (535) (798)
Items that may be reclassified subsequently to profit or lossExchange adjustments (158) 117 27Net gains/(losses) in respect of cash flow hedges 63 (31) (18)Transferred to profit or loss in respect of cash flow hedges 27 73 19Net gains on available-for-sale investments 6 20 16Transferred to profit or loss on sale of available-for-sale investments (14) (10) (9)Tax on items that may be reclassified subsequently to profit or loss 6 (2) (15) –
Total items that may be reclassified subsequently to profit or loss (78) 154 35
Other comprehensive income/(loss) for the year, net of tax 235 (381) (763)
Total comprehensive income for the year 2,699 1,773 1,156
Attributable to:Equity shareholders of the parent 2,711 1,772 1,154Non-controlling interests (12) 1 2
2,699 1,773 1,156
1. See note 1 on page 92.
Unaudited commentary on consolidated statement of comprehensive income
The consolidated statement of comprehensive income records certain items as prescribed by the accounting rules. For us, the majority of the income or expense included here relates to movements in actuarial assumptions on pension schemes and the associated tax impact. These items are not part of profit for the year, yet are important to allow the reader to gain a more comprehensive picture of our performance as a whole.
Remeasurements of net retirement benefit obligationsWe had a net gain after tax of £313m (2012/13: net cost of £535m) on our pension and other post-employment benefit schemes which is due to changes in key assumptions made in the valuation calculation and differences to actual outcomes during the year.
Exchange adjustmentsAdjustments are made when we translate the results and net assets of our companies operating outside the UK, as well as debt we have issued in foreign currencies. The net movement for the year resulted in a loss of £158m (2012/13: £117m gain).
Net gains/(losses) in respect of cash flow hedgesThe value of derivatives held to hedge cash flows is impacted by changes in expected interest rates and exchange rates. The net gain for the year was £63m (2012/13: £31m loss).
Consolidated statement of comprehensive incomefor the years ended 31 March
This unaudited commentary does not form part of the financial statements.
86 National Grid Annual Report and Accounts 2013/14

Strategic Report Corporate Governance Financial Statements Additional Information
Called upshare
capital£m
Sharepremiumaccount
£m
Retainedearnings
£m
Otherequity
reserves1
£m
Totalshareholders’
equity£m
Non-controlling
interests£m
Totalequity
£m
Equity as at 1 April 2011 as previously reported 416 1,361 12,153 (4,870) 9,060 9 9,069Impact of change in accounting policy2 – – (8) – (8) – (8)
Equity as at 1 April 2011 (restated) 416 1,361 12,145 (4,870) 9,052 9 9,061Profit for the year2 – – 1,917 – 1,917 2 1,919Total other comprehensive (loss)/income for the year2 – – (798) 35 (763) – (763)
Total comprehensive income for the year2 – – 1,119 35 1,154 2 1,156Equity dividends – – (1,319) – (1,319) – (1,319)Scrip dividend related share issue3 6 (6) 313 – 313 – 313Issue of treasury shares – – 13 – 13 – 13Purchase of own shares – – (4) – (4) – (4)Other movements in non-controlling interests – – – – – (4) (4)Share-based payment – – 24 – 24 – 24Tax on share-based payment – – 3 – 3 – 3
At 31 March 2012 (restated) 422 1,355 12,294 (4,835) 9,236 7 9,243Profit for the year2 – – 2,153 – 2,153 1 2,154Total other comprehensive (loss)/income for the year2 – – (535) 154 (381) – (381)
Total comprehensive income for the year2 – – 1,618 154 1,772 1 1,773Equity dividends – – (1,433) – (1,433) – (1,433)Scrip dividend related share issue3 11 (11) 623 – 623 – 623Issue of treasury shares – – 19 – 19 – 19Purchase of own shares – – (6) – (6) – (6)Other movements in non-controlling interests – – – – – (3) (3)Share-based payment – – 20 – 20 – 20Tax on share-based payment – – (2) – (2) – (2)
At 31 March 2013 (restated) 433 1,344 13,133 (4,681) 10,229 5 10,234Profit for the year – – 2,476 – 2,476 (12) 2,464Total other comprehensive income/(loss) for the year – – 313 (78) 235 – 235
Total comprehensive income/(loss) for the year – – 2,789 (78) 2,711 (12) 2,699Equity dividends – – (1,503) – (1,503) – (1,503)Scrip dividend related share issue3 6 (8) 444 – 442 – 442Issue of treasury shares – – 14 – 14 – 14Purchase of own shares – – (5) – (5) – (5)Other movements in non-controlling interests – – (4) – (4) 15 11Share-based payment – – 20 – 20 – 20Tax on share-based payment – – 7 – 7 – 7
At 31 March 2014 439 1,336 14,895 (4,759) 11,911 8 11,919
1. For further details of other equity reserves, see note 25 on page 129.
2. See note 1 on page 92.
3. Included within share premium account are costs associated with scrip dividends.
Unaudited commentary on consolidated statement of changes in equity
The consolidated statement of changes in equity shows the additions (where it came from) and reductions (where it went) to equity. For us, the main items included here are the profit earned and dividends paid in the year.
DividendsWe paid a total of £1,503m dividends to shareholders in the year (2012/13: £1,433m) of which £444m (2012/13: £623m) was settled via scrip issues. The Directors are proposing a final dividend of 27.54p, bringing the total dividend for the year to 42.03p, a 2.9% increase on 2012/13. The Directors intend to continue the dividend policy announced last year of increasing the annual dividend by at least the rate of RPI inflation for the foreseeable future.
Consolidated statement of changes in equityfor the years ended 31 March
This unaudited commentary does not form part of the financial statements.
87
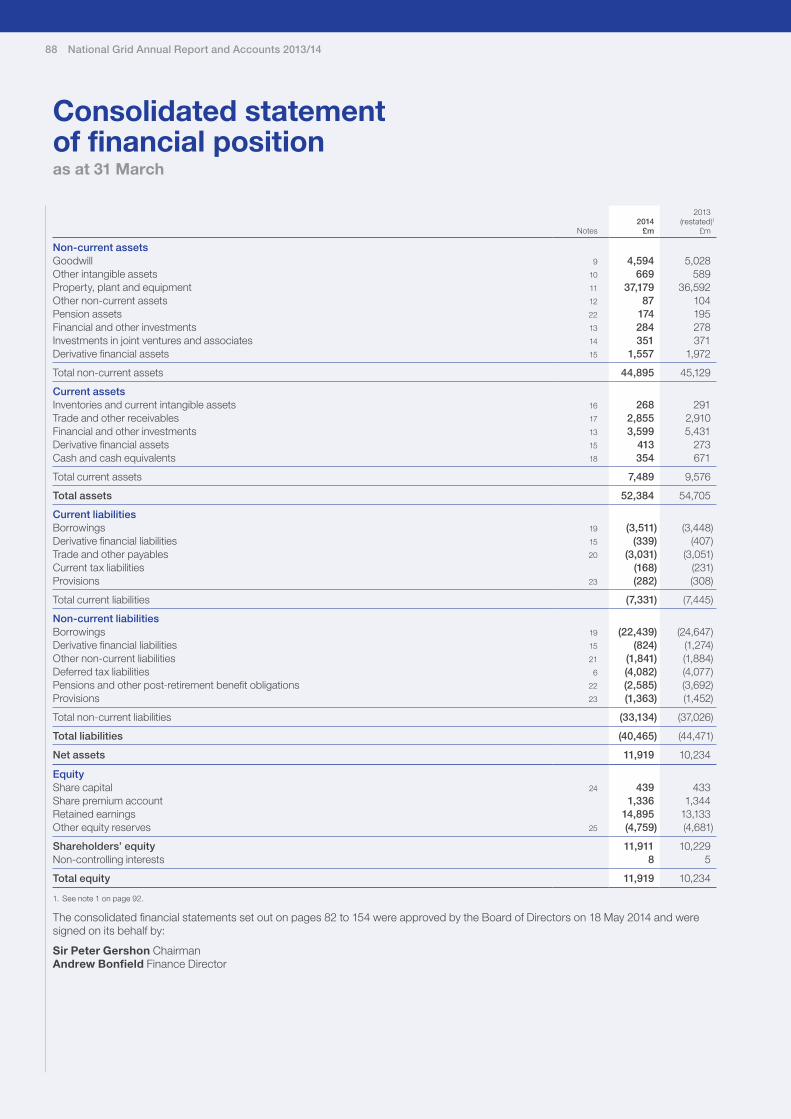
Notes2014
£m
2013(restated)1
£m
Non-current assetsGoodwill 9 4,594 5,028Other intangible assets 10 669 589Property, plant and equipment 11 37,179 36,592Other non-current assets 12 87 104Pension assets 22 174 195Financial and other investments 13 284 278Investments in joint ventures and associates 14 351 371Derivative financial assets 15 1,557 1,972
Total non-current assets 44,895 45,129
Current assetsInventories and current intangible assets 16 268 291Trade and other receivables 17 2,855 2,910Financial and other investments 13 3,599 5,431Derivative financial assets 15 413 273Cash and cash equivalents 18 354 671
Total current assets 7,489 9,576
Total assets 52,384 54,705
Current liabilitiesBorrowings 19 (3,511) (3,448)Derivative financial liabilities 15 (339) (407)Trade and other payables 20 (3,031) (3,051)Current tax liabilities (168) (231)Provisions 23 (282) (308)
Total current liabilities (7,331) (7,445)
Non-current liabilitiesBorrowings 19 (22,439) (24,647)Derivative financial liabilities 15 (824) (1,274)Other non-current liabilities 21 (1,841) (1,884)Deferred tax liabilities 6 (4,082) (4,077)Pensions and other post-retirement benefit obligations 22 (2,585) (3,692)Provisions 23 (1,363) (1,452)
Total non-current liabilities (33,134) (37,026)
Total liabilities (40,465) (44,471)
Net assets 11,919 10,234
EquityShare capital 24 439 433Share premium account 1,336 1,344Retained earnings 14,895 13,133Other equity reserves 25 (4,759) (4,681)
Shareholders’ equity 11,911 10,229Non-controlling interests 8 5
Total equity 11,919 10,234
1. See note 1 on page 92.
The consolidated financial statements set out on pages 82 to 154 were approved by the Board of Directors on 18 May 2014 and were signed on its behalf by:
Sir Peter Gershon Chairman Andrew Bonfield Finance Director
Consolidated statement of financial positionas at 31 March
88 National Grid Annual Report and Accounts 2013/14

Strategic Report Corporate Governance Financial Statements Additional Information
Unaudited commentary on consolidated statement of financial position
The consolidated statement of financial position sets out all the Group’s assets and liabilities at the year end. As a capital-intensive business, we have significant amounts of physical assets and corresponding borrowings.
Goodwill and other intangible assetsGoodwill and intangibles decreased by £354m to £5,263m as at 31 March 2014. This decrease primarily relates to foreign exchange movements of £472m and software amortisation of £127m, partially offset by software additions of £179m.
Property, plant and equipmentProperty, plant and equipment increased by £587m to £37,179m as at 31 March 2014. This was principally due to capital expenditure of £3,262m on the renewal and extension of our regulated networks, offset by foreign exchange movements of £1,244m, and £1,299m of depreciation in the year.
Investments and other non-current assetsInvestments in joint ventures and associates, financial and other investments and other non-current assets have decreased by £31m to £722m. This is principally due to changes in the fair value of our US commodity contract assets and available-for-sale investments.
Inventories and current intangible assets, and trade and other receivablesInventories and current intangible assets, and trade and other receivables have decreased by £78m to £3,123m at 31 March 2014. This decrease is principally due to foreign exchange movements of £195m, partially offset by an increase in trade and other receivables of £120m mostly due to colder weather in the US in February and March 2014 compared with 2013 resulting in increased billings for commodity costs and customer usage.
Trade and other payablesTrade and other payables have decreased by £20m to £3,031m due to favourable foreign exchange movements of £150m, partially offset by higher payables in the UK due in part to changes in payment terms with new Gas Distribution strategic partners and increased activity on the Western Link project.
Current tax liabilitiesCurrent tax liabilities have decreased by £63m to £168m as at 31 March 2014. This is primarily due to higher tax payments made in 2013/14 although these were partially offset by a larger current year tax charge.
Deferred tax liabilitiesDeferred tax liabilities have increased by £5m to £4,082m as at 31 March 2014. This was primarily due to the impact of the £172m deferred tax charge on actuarial gains (a £179m tax credit in 2012/13) being offset by the impact of the reduction in the UK statutory tax rate for future periods, foreign exchange movements and the reduction in prior year charges.
Provisions and other non-current liabilitiesProvisions (both current and non-current) and other non-current liabilities decreased by £158m to £3,486m as at 31 March 2014.
Total provisions decreased by £115m in the year. The underlying movements include additions of £230m primarily relating to a provision for the demolition of certain gas holders in the UK of £79m, restructuring provisions of £86m and other provisions
of £42m, more than offset by foreign exchange movements of £112m and utilisation of £288m in relation to all classes of provisions. Other non-current liabilities decreased by £43m principally due to foreign exchange movements of £47m.
Net debtNet debt is the aggregate of cash and cash equivalents, current financial and other investments, borrowings, and derivative financial assets and liabilities. See further analysis with the consolidated cash flow statement on page 90.
Net pension and other post-retirement obligationsA summary of the total UK and US assets and liabilities and the overall net IAS 19 (revised) accounting deficit is shown below:
Net plan liabilityUK£m
US£m
Total£m
As at 1 April 2013 (as restated) (1,169) (2,328) (3,497)Exchange movements – 186 186Current service cost (96) (129) (225)Net interest cost (47) (81) (128)Curtailments and settlements – LIPA – 214 214Curtailments and settlements – other (30) (12) (42)Actuarial (losses)/gains
– on plan assets (98) 283 185– on plan liabilities 452 (152) 300
Employer contributions 235 361 596
As at 31 March 2014 (753) (1,658) (2,411)
Represented by:Plan assets – 174 174Plan liabilities (753) (1,832) (2,585)
(753) (1,658) (2,411)
The principal movements in net obligations during the year include a curtailment gain of £214m following the LIPA MSA transition, net actuarial gains of £485m and employer contributions of £596m. Net actuarial gains include actuarial gains on plan liabilities of £542m arising as a consequence of an increase in the UK real discount rate and the nominal discount rate in the US. This is partially offset by actuarial losses of £283m arising from increases in life expectancy in the US. Actuarial (losses)/gains on plan assets reflects the asset allocations in the different plans. In both the UK and US, returns on equities were above the assumed rate; however, UK government securities had negative returns and corporate bonds were close to nil.
Further information on our pension and other post-retirement obligations can be found in notes 22 and 29 to the consolidated financial statements. Details of the restatements made for IAS 19 (revised) can be found in note 1.
Off balance sheet itemsThere were no significant off balance sheet items other than the contractual obligations shown in note 30 (b) to the consolidated financial statements, and the commitments and contingencies discussed in note 27.
Through the ordinary course of our operations, we are party to various litigation, claims and investigations. We do not expect the ultimate resolution of any of these proceedings to have a material adverse effect on our results of operations, cash flows or financial position.
This unaudited commentary does not form part of the financial statements.
89
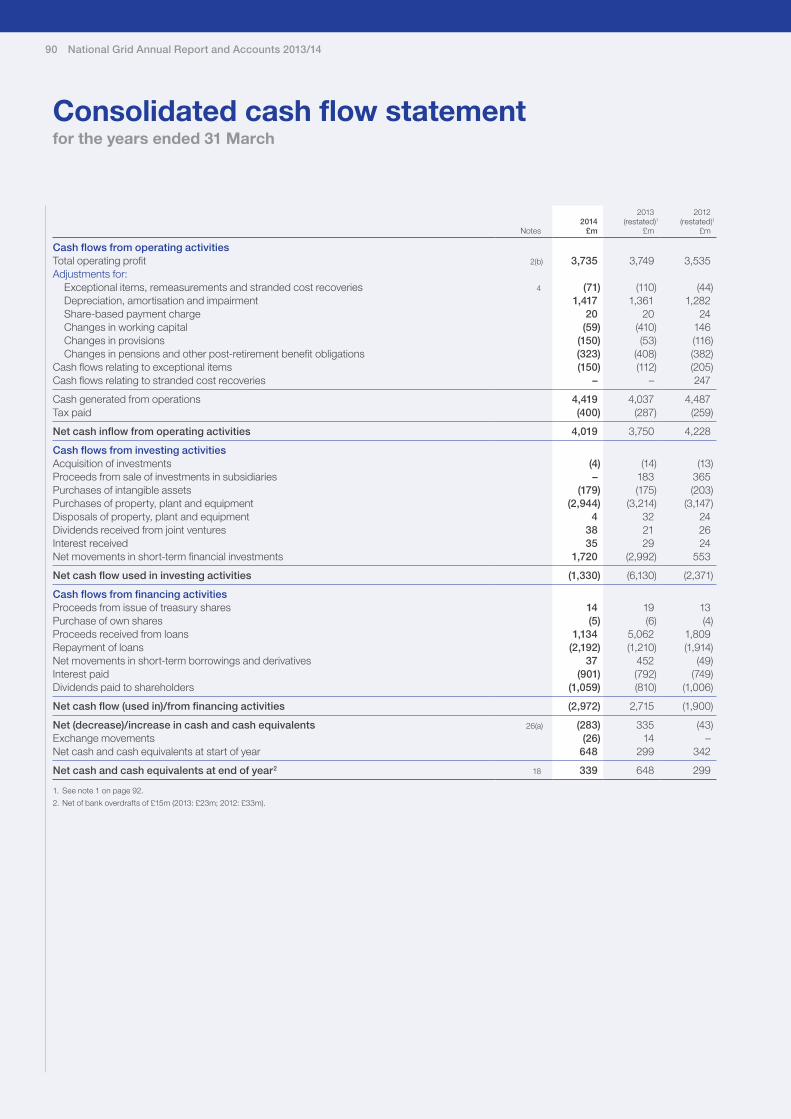
Notes2014
£m
2013(restated)1
£m
2012(restated)1
£m
Cash flows from operating activitiesTotal operating profit 2(b) 3,735 3,749 3,535Adjustments for:
Exceptional items, remeasurements and stranded cost recoveries 4 (71) (110) (44)Depreciation, amortisation and impairment 1,417 1,361 1,282Share-based payment charge 20 20 24Changes in working capital (59) (410) 146Changes in provisions (150) (53) (116)Changes in pensions and other post-retirement benefit obligations (323) (408) (382)
Cash flows relating to exceptional items (150) (112) (205)Cash flows relating to stranded cost recoveries – – 247
Cash generated from operations 4,419 4,037 4,487Tax paid (400) (287) (259)
Net cash inflow from operating activities 4,019 3,750 4,228
Cash flows from investing activitiesAcquisition of investments (4) (14) (13)Proceeds from sale of investments in subsidiaries – 183 365Purchases of intangible assets (179) (175) (203)Purchases of property, plant and equipment (2,944) (3,214) (3,147)Disposals of property, plant and equipment 4 32 24Dividends received from joint ventures 38 21 26Interest received 35 29 24Net movements in short-term financial investments 1,720 (2,992) 553
Net cash flow used in investing activities (1,330) (6,130) (2,371)
Cash flows from financing activitiesProceeds from issue of treasury shares 14 19 13Purchase of own shares (5) (6) (4)Proceeds received from loans 1,134 5,062 1,809Repayment of loans (2,192) (1,210) (1,914)Net movements in short-term borrowings and derivatives 37 452 (49)Interest paid (901) (792) (749)Dividends paid to shareholders (1,059) (810) (1,006)
Net cash flow (used in)/from financing activities (2,972) 2,715 (1,900)
Net (decrease)/increase in cash and cash equivalents 26(a) (283) 335 (43)Exchange movements (26) 14 –Net cash and cash equivalents at start of year 648 299 342
Net cash and cash equivalents at end of year2 18 339 648 299
1. See note 1 on page 92.
2. Net of bank overdrafts of £15m (2013: £23m; 2012: £33m).
Consolidated cash flow statementfor the years ended 31 March
90 National Grid Annual Report and Accounts 2013/14
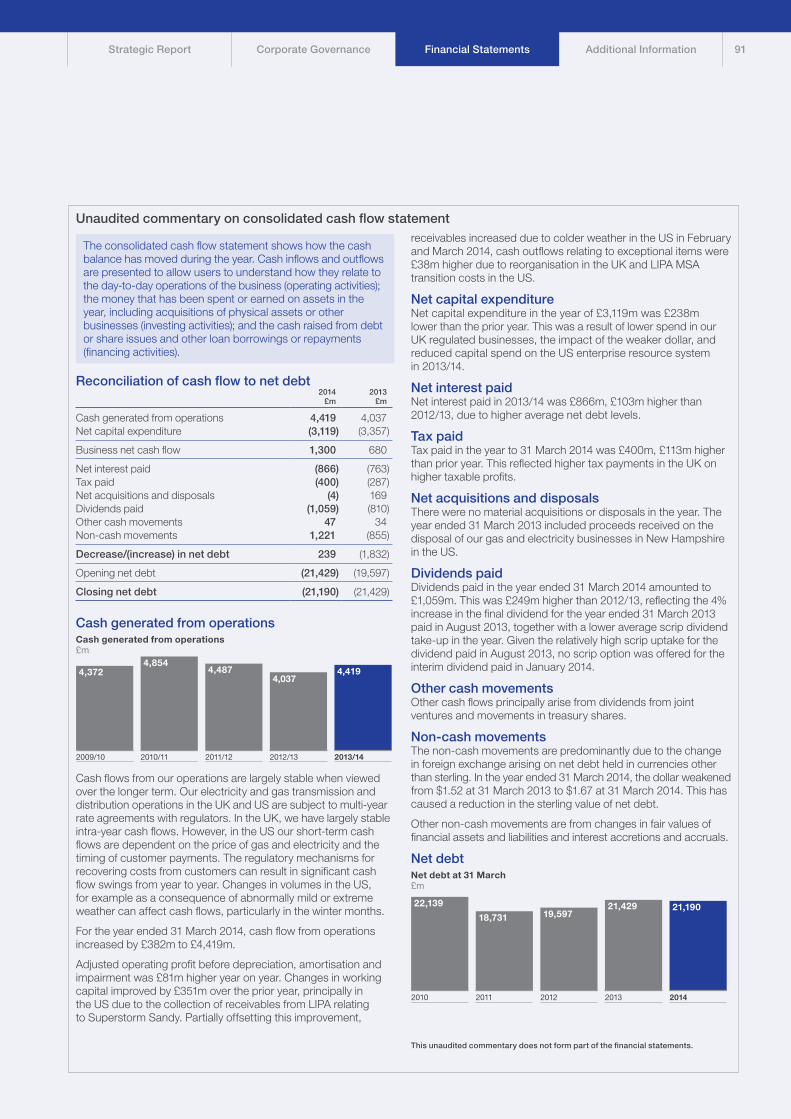
Strategic Report Corporate Governance Financial Statements Additional Information
Unaudited commentary on consolidated cash flow statement
The consolidated cash flow statement shows how the cash balance has moved during the year. Cash inflows and outflows are presented to allow users to understand how they relate to the day-to-day operations of the business (operating activities); the money that has been spent or earned on assets in the year, including acquisitions of physical assets or other businesses (investing activities); and the cash raised from debt or share issues and other loan borrowings or repayments (financing activities).
Reconciliation of cash flow to net debt2014
£m2013
£m
Cash generated from operations 4,419 4,037Net capital expenditure (3,119) (3,357)
Business net cash flow 1,300 680
Net interest paid (866) (763)Tax paid (400) (287)Net acquisitions and disposals (4) 169Dividends paid (1,059) (810)Other cash movements 47 34Non-cash movements 1,221 (855)
Decrease/(increase) in net debt 239 (1,832)
Opening net debt (21,429) (19,597)
Closing net debt (21,190) (21,429)
Cash generated from operations
4,3724,854
4,487
2009/10 2010/11 2011/12 2012/13 2013/14
4,0374,419
Cash generated from operations£m
Cash flows from our operations are largely stable when viewed over the longer term. Our electricity and gas transmission and distribution operations in the UK and US are subject to multi-year rate agreements with regulators. In the UK, we have largely stable intra-year cash flows. However, in the US our short-term cash flows are dependent on the price of gas and electricity and the timing of customer payments. The regulatory mechanisms for recovering costs from customers can result in significant cash flow swings from year to year. Changes in volumes in the US, for example as a consequence of abnormally mild or extreme weather can affect cash flows, particularly in the winter months.
For the year ended 31 March 2014, cash flow from operations increased by £382m to £4,419m.
Adjusted operating profit before depreciation, amortisation and impairment was £81m higher year on year. Changes in working capital improved by £351m over the prior year, principally in the US due to the collection of receivables from LIPA relating to Superstorm Sandy. Partially offsetting this improvement,
receivables increased due to colder weather in the US in February and March 2014, cash outflows relating to exceptional items were £38m higher due to reorganisation in the UK and LIPA MSA transition costs in the US.
Net capital expenditureNet capital expenditure in the year of £3,119m was £238m lower than the prior year. This was a result of lower spend in our UK regulated businesses, the impact of the weaker dollar, and reduced capital spend on the US enterprise resource system in 2013/14.
Net interest paidNet interest paid in 2013/14 was £866m, £103m higher than 2012/13, due to higher average net debt levels.
Tax paidTax paid in the year to 31 March 2014 was £400m, £113m higher than prior year. This reflected higher tax payments in the UK on higher taxable profits.
Net acquisitions and disposalsThere were no material acquisitions or disposals in the year. The year ended 31 March 2013 included proceeds received on the disposal of our gas and electricity businesses in New Hampshire in the US.
Dividends paidDividends paid in the year ended 31 March 2014 amounted to £1,059m. This was £249m higher than 2012/13, reflecting the 4% increase in the final dividend for the year ended 31 March 2013 paid in August 2013, together with a lower average scrip dividend take-up in the year. Given the relatively high scrip uptake for the dividend paid in August 2013, no scrip option was offered for the interim dividend paid in January 2014.
Other cash movementsOther cash flows principally arise from dividends from joint ventures and movements in treasury shares.
Non-cash movementsThe non-cash movements are predominantly due to the change in foreign exchange arising on net debt held in currencies other than sterling. In the year ended 31 March 2014, the dollar weakened from $1.52 at 31 March 2013 to $1.67 at 31 March 2014. This has caused a reduction in the sterling value of net debt.
Other non-cash movements are from changes in fair values of financial assets and liabilities and interest accretions and accruals.
Net debt
22,139
18,731 19,597
2010 2011 2012 2013 2014
21,429 21,190
Net debt at 31 March£m
This unaudited commentary does not form part of the financial statements.
91
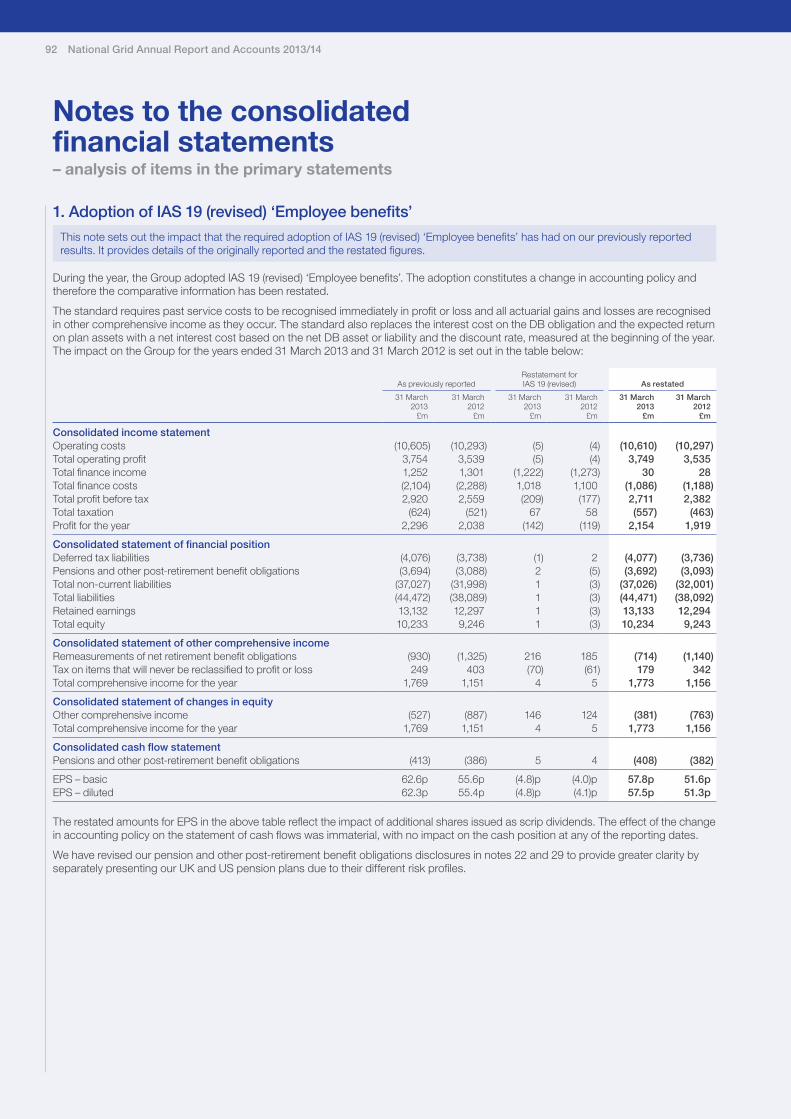
1. Adoption of IAS 19 (revised) ‘Employee benefits’
This note sets out the impact that the required adoption of IAS 19 (revised) ‘Employee benefits’ has had on our previously reported results. It provides details of the originally reported and the restated figures.
During the year, the Group adopted IAS 19 (revised) ‘Employee benefits’. The adoption constitutes a change in accounting policy and therefore the comparative information has been restated.
The standard requires past service costs to be recognised immediately in profit or loss and all actuarial gains and losses are recognised in other comprehensive income as they occur. The standard also replaces the interest cost on the DB obligation and the expected return on plan assets with a net interest cost based on the net DB asset or liability and the discount rate, measured at the beginning of the year. The impact on the Group for the years ended 31 March 2013 and 31 March 2012 is set out in the table below:
As previously reportedRestatement for IAS 19 (revised) As restated
31 March2013
£m
31 March2012
£m
31 March2013
£m
31 March2012
£m
31 March2013
£m
31 March2012
£m
Consolidated income statementOperating costs (10,605) (10,293) (5) (4) (10,610) (10,297)Total operating profit 3,754 3,539 (5) (4) 3,749 3,535Total finance income 1,252 1,301 (1,222) (1,273) 30 28Total finance costs (2,104) (2,288) 1,018 1,100 (1,086) (1,188)Total profit before tax 2,920 2,559 (209) (177) 2,711 2,382Total taxation (624) (521) 67 58 (557) (463)Profit for the year 2,296 2,038 (142) (119) 2,154 1,919
Consolidated statement of financial positionDeferred tax liabilities (4,076) (3,738) (1) 2 (4,077) (3,736)Pensions and other post-retirement benefit obligations (3,694) (3,088) 2 (5) (3,692) (3,093)Total non-current liabilities (37,027) (31,998) 1 (3) (37,026) (32,001)Total liabilities (44,472) (38,089) 1 (3) (44,471) (38,092)Retained earnings 13,132 12,297 1 (3) 13,133 12,294Total equity 10,233 9,246 1 (3) 10,234 9,243
Consolidated statement of other comprehensive incomeRemeasurements of net retirement benefit obligations (930) (1,325) 216 185 (714) (1,140)Tax on items that will never be reclassified to profit or loss 249 403 (70) (61) 179 342Total comprehensive income for the year 1,769 1,151 4 5 1,773 1,156
Consolidated statement of changes in equityOther comprehensive income (527) (887) 146 124 (381) (763)Total comprehensive income for the year 1,769 1,151 4 5 1,773 1,156
Consolidated cash flow statementPensions and other post-retirement benefit obligations (413) (386) 5 4 (408) (382)
EPS – basic 62.6p 55.6p (4.8)p (4.0)p 57.8p 51.6pEPS – diluted 62.3p 55.4p (4.8)p (4.1)p 57.5p 51.3p
The restated amounts for EPS in the above table reflect the impact of additional shares issued as scrip dividends. The effect of the change in accounting policy on the statement of cash flows was immaterial, with no impact on the cash position at any of the reporting dates.
We have revised our pension and other post-retirement benefit obligations disclosures in notes 22 and 29 to provide greater clarity by separately presenting our UK and US pension plans due to their different risk profiles.
Notes to the consolidated financial statements– analysis of items in the primary statements
92 National Grid Annual Report and Accounts 2013/14

Strategic Report Corporate Governance Financial Statements Additional Information
2. Segmental analysis
This note sets out the financial performance for the year split into the different parts of the business (operating segments). We monitor and manage the performance of these operating segments on a day-to-day basis.
Our strategy in actionWe own a portfolio of businesses that range from cash generative developed assets with minimal investment requirements (such as National Grid Metering, included within Other activities) to businesses with high levels of investment and growth (such as UK Electricity Transmission).
We generate 95% of our revenue from our regulated businesses in the UK and US. We work with our regulators to obtain agreements that balance the risks we face with the opportunity to deliver reasonable returns for our investors. When investing in non-regulated businesses we aim to leverage our core capabilities to deliver higher returns for investors.
Our regulated businesses earn revenue for the transmission, distribution and generation services they have provided during the year. In any one year, the revenue recognised may differ from that allowed under our regulatory agreements and any such timing differences are adjusted through future prices. Our non-regulated businesses earn revenue in line with their contractual terms.
Revenue primarily represents the sales value derived from the generation, transmission and distribution of energy, together with the sales value derived from the provision of other services to customers and, previously, recovery of US stranded costs during the year. It excludes value added (sales) tax and intra-group sales.
Revenue includes an assessment of unbilled energy and transportation services supplied to customers between the date of the last meter reading and the year end. This is estimated based on historical consumption and weather patterns.
Where revenue exceeds the maximum amount permitted by regulatory agreement and adjustments will be made to future prices to reflect this over-recovery, no liability is recognised, as such an adjustment relates to the provision of future services. Similarly no asset is recognised where a regulatory agreement permits adjustments to be made to future prices in respect of an under-recovery.
US stranded costs were various generation-related costs incurred prior to the divestiture of generation assets beginning in the late 1990s and costs of legacy contracts that are being recovered from customers. The recovery of stranded costs and other amounts allowed to be collected from customers under regulatory arrangements was recognised in the period in which these amounts were recoverable from customers. The recovery of stranded costs was substantially completed at 31 March 2012.
We present revenue and the results of the business analysed by operating segment, based on the information the Board of Directors uses internally for the purposes of evaluating the performance of operating segments and determining resource allocation between operating segments. The Board is National Grid’s chief operating decision-making body (as defined by IFRS 8 ‘Operating Segments’) and assesses the performance of operations principally on the basis of operating profit before exceptional items, remeasurements and stranded cost recoveries (see note 4).
Following the commencement of new RIIO regulatory arrangements in the UK, we have changed the way in which we report our operational and financial performance. We have reviewed our segmental disclosure for the year ended 31 March 2014 with the separation of our UK Transmission segment into two new segments: UK Electricity Transmission and UK Gas Transmission. We have also moved the Great Britain-France electricity interconnector from UK Electricity Transmission to Other activities. The information given in this note for the years ended 31 March 2013 and 2012 has been restated to provide a like-for-like comparison.
93

Notes to the consolidated financial statements continued
2. Segmental analysis continuedThe following table describes the main activities for each operating segment:
UK Electricity Transmission High voltage electricity transmission networks in Great Britain.
UK Gas Transmission The gas transmission network in Great Britain and UK LNG storage activities.
UK Gas Distribution Four of the eight regional networks of Great Britain’s gas distribution system.
US Regulated Gas distribution networks, electricity distribution networks and high voltage electricity transmission networks in New York and New England (including EnergyNorth and Granite State up to the date they were sold on 3 July 2012) and electricity generation facilities in New York and Massachusetts.
Other activities primarily relate to non-regulated businesses and other commercial operations not included within the above segments, including: the Great Britain-France electricity interconnector; UK-based gas metering activities; UK property management; a UK LNG import terminal; US LNG operations; US unregulated transmission pipelines; together with corporate activities.
Sales between operating segments are priced considering the regulatory and legal requirements to which the businesses are subject. The analysis of revenue by geographical area is on the basis of destination. There are no material sales between the UK and US geographical areas.
(a) Revenue2014 2013 2012
Totalsales
£m
Salesbetween
segments£m
Salesto thirdparties
£m
Totalsales
(restated)1
£m
Salesbetween
segments(restated)1
£m
Salesto thirdparties
(restated)1
£m
Totalsales
(restated)1
£m
Salesbetween
segments(restated)1
£m
Salesto thirdparties
(restated)1
£m
Operating segmentsUK Electricity Transmission 3,387 (14) 3,373 3,110 (15) 3,095 2,811 (16) 2,795UK Gas Transmission 941 (104) 837 1,118 (89) 1,029 983 (8) 975UK Gas Distribution 1,898 (49) 1,849 1,714 (47) 1,667 1,605 (52) 1,553US Regulated 8,040 – 8,040 7,918 – 7,918 7,795 – 7,795
Other activities 736 (26) 710 678 (28) 650 744 (30) 714
15,002 (193) 14,809 14,538 (179) 14,359 13,938 (106) 13,832
Total excluding stranded cost recoveries 14,809 14,359 13,553
Stranded cost recoveries – – 279
14,809 14,359 13,832
Geographical areasUK 6,759 6,421 6,000US 8,050 7,938 7,832
14,809 14,359 13,832
1. Restated to reflect the changes in operating segment presentation as described on page 93.
94 National Grid Annual Report and Accounts 2013/14

Strategic Report Corporate Governance Financial Statements Additional Information
2. Segmental analysis continued(b) Operating profitA reconciliation of the operating segments’ measure of profit to total profit before tax is provided below. Further details of the exceptional items, remeasurements and stranded cost recoveries are provided in note 4.
Before exceptional items, remeasurements and stranded
cost recoveries
After exceptional items, remeasurements and stranded
cost recoveries
2014£m
2013(restated)1
£m
2012(restated)1
£m2014
£m
2013(restated)1
£m
2012(restated)1
£m
Operating segmentsUK Electricity Transmission 1,087 1,049 876 1,027 1,020 876UK Gas Transmission 417 531 453 406 517 453UK Gas Distribution 904 794 763 780 763 739US Regulated 1,125 1,254 1,192 1,388 1,438 1,156
Other activities 131 11 207 134 11 311
3,664 3,639 3,491 3,735 3,749 3,535
Geographical areasUK 2,723 2,530 2,347 2,531 2,456 2,351US 941 1,109 1,144 1,204 1,293 1,184
3,664 3,639 3,491 3,735 3,749 3,535
Reconciliation to profit before taxOperating profit 3,664 3,639 3,491 3,735 3,749 3,535Finance income 36 30 28 36 30 28Finance costs (1,144) (1,154) (1,118) (1,051) (1,086) (1,188)Share of post-tax results of joint ventures and associates 28 18 7 28 18 7
Profit before tax 2,584 2,533 2,408 2,748 2,711 2,382
1. See note 1 on page 92. Also restated to reflect the changes in operating segment presentation as described on page 93.
(c) Capital expenditure, depreciation and amortisationCapital expenditure Depreciation and amortisation
2014£m
2013(restated)1
£m
2012(restated)1
£m2014
£m
2013(restated)1
£m
2012(restated)1
£m
Operating segmentsUK Electricity Transmission 1,381 1,430 1,153 (343) (323) (281)UK Gas Transmission 181 249 235 (172) (162) (146)UK Gas Distribution 480 666 645 (271) (261) (251)US Regulated 1,219 1,124 1,052 (419) (430) (411)
Other activities 180 217 290 (211) (185) (183)
3,441 3,686 3,375 (1,416) (1,361) (1,272)
Geographical areasUK 2,155 2,471 2,217 (938) (902) (849)US 1,286 1,215 1,158 (478) (459) (423)
3,441 3,686 3,375 (1,416) (1,361) (1,272)
By asset typeProperty, plant and equipment 3,262 3,511 3,172 (1,289) (1,260) (1,193)Non-current intangible assets 179 175 203 (127) (101) (79)
3,441 3,686 3,375 (1,416) (1,361) (1,272)
1. Restated to reflect the changes in operating segment presentation as described on page 93.
Total non-current assets other than derivative financial assets, financial and other investments, deferred tax assets and pension assets located in the UK and US were £24,531m and £18,349m respectively as at 31 March 2014 (31 March 2013: UK £23,344m, US £19,340m; 31 March 2012: UK £21,793m, US £17,666m).
95

Notes to the consolidated financial statements continued
Unaudited commentary on the results of our principal operations by segment
We have summarised the results of our principal operating segments here by segment to provide direct reference to the results as disclosed in note 2. This analysis has been performed based on operating profit before exceptional items, remeasurements and stranded cost recoveries as set out in note 2 (b).
UK Electricity TransmissionFor the year ended 31 March 2014, revenue in the UK Electricity Transmission segment increased by £277m, and adjusted operating profit increased by £38m.
Net regulated income after pass-through costs was £170m higher, reflecting increases in allowed revenues under the new RIIO regulatory framework. This was partially offset by under-recoveries of revenue in the year of £60m compared with over-recoveries of £29m in the prior year. Regulated controllable costs were £27m higher due to inflation, legal fees and one-off credits in the prior year. Depreciation and amortisation was £20m higher reflecting the continued capital investment programme (investment in the year was £1,381m). Other costs were £4m lower than prior year.
UK Gas TransmissionRevenue in the UK Gas Transmission segment decreased by £177m in 2013/14 to £941m and adjusted operating profit fell by £114m to £417m.
Net regulated income after pass-through costs was £80m lower, with lower permit income than prior year under the new RIIO arrangements. In addition, under-recoveries in the year of £21m compared with over-recoveries last year of £17m, gave rise to an adverse timing movement of £38m. Depreciation and amortisation was £10m higher due to investment, with £181m invested in the year. Partially offsetting these, other operating costs were £14m lower.
UK Gas DistributionUK Gas Distribution revenue increased by £184m in the year to £1,898m, and adjusted operating profit increased to £904m from £794m in 2012/13.
Net regulated income after pass-through costs was £96m higher, reflecting increases in allowed revenues under the new RIIO regulatory framework. Timing differences added another £39m, with £29m over-recoveries in 2013/14, compared with a £10m under-recovery in the prior year. Partially offsetting these, regulated controllable costs were £14m higher primarily due to inflation. Depreciation and amortisation was £10m higher reflecting the continued capital investment programme (investment in the year was £480m). Other costs were £1m higher than prior year.
US RegulatedRevenue in our US Regulated businesses was £122m higher at £8,040m, and adjusted operating profit fell by £129m to £1,125m.
The weaker dollar reduced operating profit in the year by £38m. Excluding the impact of foreign exchange, net regulated income fell by £52m, principally due to the end of deferral income recoveries for Niagara Mohawk at 31 March 2013. Timing differences added another £29m profit compared with prior year. Regulated controllable costs increased by £89m at constant currency as a result of inflation and wage increases, higher insurance costs post Superstorm Sandy, and cost true-ups identified during the implementation of new financial systems. Other operating costs (excluding major storms) increased by £61m at constant currency due to the higher cost of non-major storm remediation, higher property taxes and depreciation of the new US enterprise resource system.
There were no major storms affecting our operations in the year ended 31 March 2014. In 2012/13, two major storms in the US, Superstorm Sandy and Storm Nemo, reduced operating profit within US Regulated by £82m at constant currency.
Our capital investment programme continues in the US, with a further £1,219m invested in 2013/14, including gas leak reduction programmes and gas growth and connection spend.
Other activitiesRevenue in Other activities increased by £58m to £736m in the year ended 31 March 2014. Adjusted operating profit was £120m higher at £131m.
There was no repeat of the major storm cost of £51m incurred in our insurance captive in the prior year due to Superstorm Sandy. Operating profit in the French interconnector was £62m higher as a result of strong auction revenues this year. In our other non-regulated businesses, adjusted operating profit was £7m higher due to improved results in our UK metering business and insurance captive, partially offset by higher costs associated with the stabilisation of the new US enterprise resource system.
Capital expenditure in our Other activities was £37m lower at £180m, principally reflecting reduced capital spend on the new US enterprise resource system.
This unaudited commentary does not form part of the financial statements.
96 National Grid Annual Report and Accounts 2013/14

Strategic Report Corporate Governance Financial Statements Additional Information
3. Operating costs
Below we have presented separately certain items included in our operating costs. These include a breakdown of payroll costs (including disclosure of amounts paid to key management personnel) and fees paid to our auditors.
Rentals under operating leases are charged to the income statement on a straight-line basis over the term of the relevant lease.
Before exceptional items,remeasurements and stranded
cost recoveries
Exceptional items,remeasurements and stranded
cost recoveries Total
2014£m
2013(restated)1
£m
2012(restated)1
£m2014
£m
2013(restated)1
£m
2012(restated)1
£m2014
£m
2013(restated)1
£m
2012(restated)1
£m
Depreciation and amortisation 1,416 1,361 1,267 – – 5 1,416 1,361 1,272Payroll costs 1,373 1,434 1,381 59 22 82 1,432 1,456 1,463Purchases of electricity 1,513 1,251 1,356 (49) (111) 89 1,464 1,140 1,445Purchases of gas 1,722 1,384 1,518 33 (69) 5 1,755 1,315 1,523Rates and property taxes 963 969 955 – – – 963 969 955Balancing Services Incentive
Scheme 872 805 818 – – – 872 805 818Payments to other UK network
owners 630 487 407 – – – 630 487 407Other 2,656 3,029 2,360 (114) 48 54 2,542 3,077 2,414
11,145 10,720 10,062 (71) (110) 235 11,074 10,610 10,297
Operating costs include:Inventory consumed 422 389 360Operating leases 115 109 97Research and development expenditure 12 15 15
1. See note 1 on page 92.
(a) Payroll costs
2014£m
2013(restated)1
£m
2012(restated)1
£m
Wages and salaries2 1,575 1,596 1,566Social security costs 126 120 116Pension costs (note 22) 245 231 231Share-based payment 20 20 24Severance costs (excluding pension costs) 30 16 35
1,996 1,983 1,972Less: payroll costs capitalised (564) (527) (509)
1,432 1,456 1,463
1. See note 1 on page 92.
2. Included within wages and salaries are US other post-retirement benefit costs of £44m (2013: £43m; 2012: £60m). For further information refer to note 22 on page 122.
(b) Number of employees
31 March2014
Number
Monthlyaverage
2014Number
31 March2013
Number1
Monthlyaverage
2013Number1
31 March2012
Number1
Monthlyaverage
2012Number1
UK 9,693 9,641 9,990 9,816 9,696 9,769US 14,216 15,094 15,438 15,555 15,843 16,080
23,909 24,735 25,428 25,371 25,539 25,849
1. Comparatives have been re-presented on a basis consistent with the current year classification.
The vast majority of employees in the US are either directly or indirectly employed in the transmission, distribution and generation of electricity or the distribution of gas, while those in the UK are either directly or indirectly employed in the transmission and distribution of gas or the transmission of electricity. At 31 March 2014, there were 2,044 (2013: 2,151; 2012: 2,357) employees in other operations, excluding shared services.
97

3. Operating costs continued(c) Key management compensation
2014£m
2013£m
2012£m
Short-term employee benefits 9 8 10Post-employment benefits 1 3 6Share-based payment 5 5 5
15 16 21
Key management compensation relates to the Board of Directors, including the Executive Directors and Non-executive Directors for the years presented.
(d) Directors’ emolumentsDetails of Directors’ emoluments are contained in the audited part of the Remuneration Report, which forms part of these financial statements.
(e) Auditors’ remunerationAuditors’ remuneration is presented below in accordance with the requirements of the UK Companies Act 2006 and the principal accountant fees and services disclosure requirements of Item 16C of Form 20-F.
2014£m
2013£m
2012£m
Audit fees1 payable to the parent Company’s auditors and their associates in respect of:Audit of the parent Company’s individual and consolidated financial statements 0.9 1.1 1.1The auditing of accounts of any associate of the Company 7.8 6.0 5.2Other services supplied2 2.3 2.7 2.3
11.0 9.8 8.6
Total other services3
Tax fees4
Tax compliance services 0.5 0.5 0.5Tax advisory services 0.3 0.3 0.2
All other fees5
Other assurance services 0.1 0.1 0.3Services relating to corporate finance transactions not covered above – 0.3 0.2Other non-audit services not covered above 0.8 1.1 2.6
1.7 2.3 3.8
Total auditors’ remuneration 12.7 12.1 12.4
1. Audit fees in each year represent fees for the audit of the Company’s financial statements and regulatory reporting for the years ended 31 March 2014, 2013 and 2012, and the review of interim financial statements for the six month periods ended 30 September 2013, 2012 and 2011 respectively.
2. Other services supplied represent fees payable for services in relation to other statutory filings or engagements that are required to be carried out by the auditors. In particular, this includes fees for reports under section 404 of the US Public Company Accounting Reform and Investor Protection Act of 2002 (Sarbanes-Oxley) and audit reports on regulatory returns.
3. There were no audit related fees as described in Item 16C(b) of Form 20-F.
4. Tax fees include amounts charged for tax compliance, tax advice and tax planning. Total tax fees for the year ended 31 March 2014 were £0.8m (2013: £0.8m; 2012: £0.7m).
5. All other fees include amounts relating to the review of US pensions and other post-retirement benefits census data and sundry services, all of which have been subject to approval by the Audit Committee. Total other fees for the year ended 31 March 2014 were £0.9m (2013: £1.5m; 2012: £3.1m).
In addition, fees of £0.1m were incurred in 2014 in relation to the audits of the pension schemes of the Company (2013: £0.1m; 2012: £0.1m).
Subject to the Company’s Articles of Association and the Companies Act 2006, the Audit Committee is solely and directly responsible for the approval of the appointment, reappointment, compensation and oversight of the Company’s independent auditors. It is our policy that the Audit Committee must approve in advance all non-audit work to be performed by the independent auditors to ensure that the service will not compromise auditor independence. Certain services are prohibited from being performed by the external auditors under the Sarbanes-Oxley Act 2002.
Notes to the consolidated financial statements continued
98 National Grid Annual Report and Accounts 2013/14

Strategic Report Corporate Governance Financial Statements Additional Information
4. Exceptional items, remeasurements and stranded cost recoveries
To monitor our financial performance, we use a profit measure that excludes certain income and expenses. We call that measure ‘business performance’. We exclude items from business performance because we think these items are individually important to understanding our financial performance. If included, these items could distort understanding of our performance for the year and the comparability between periods. This note analyses these items, which are included in our results for the year but are excluded from business performance.
Our financial performance is analysed into two components: business performance, which excludes exceptional items, remeasurements and stranded cost recoveries; and exceptional items, remeasurements and stranded cost recoveries. Business performance is used by management to monitor financial performance as it is considered that it improves the comparability of our reported financial performance from year to year. Business performance subtotals are presented on the face of the income statement or in the notes to the financial statements.
Items of income or expense that are considered by management for designation as exceptional items include such items as significant restructurings, write-downs or impairments of non-current assets, significant changes in environmental or decommissioning provisions, integration of acquired businesses, gains or losses on disposals of businesses or investments and debt redemption costs as a consequence of transactions such as significant disposals or issues of equity.
Costs arising from restructuring programmes include redundancy costs. Redundancy costs are charged to the income statement in the year in which a commitment is made to incur the costs and the main features of the restructuring plan have been announced to affected employees.
Remeasurements comprise gains or losses recorded in the income statement arising from changes in the fair value of commodity contracts and of derivative financial instruments to the extent that hedge accounting is not achieved or is not effective. These fair values increase or decrease because of changes in commodity and financial indices and prices over which we have no control.
Stranded cost recoveries represent the recovery, through charges to electricity customers in upstate New York and New England, of historical generation-related costs, related to generation assets that are no longer owned by National Grid. Such costs have been recovered from customers as permitted by regulatory agreements, with substantially all having been recovered by 31 March 2012.
99

4. Exceptional items, remeasurements and stranded cost recoveries continued2014
£m2013
£m2012
£m
Included within operating profitExceptional items
Restructuring costs1 (136) (87) (101)Gas holder demolition costs2 (79) – –LIPA MSA transition3 254 – (64)Other 4 16 – 1Environmental charges – – (55)Net gain on disposal of businesses5 – 3 97
55 (84) (122)Remeasurements – commodity contracts6 16 180 (94)Stranded cost recoveries7 – 14 260
71 110 44
Included within finance costsRemeasurements – net gains/(losses) on derivative financial instruments8 93 68 (70)
93 68 (70)
Total included within profit before tax 164 178 (26)
Included within taxationExceptional credits/(charges) arising on items not included in profit before tax
Deferred tax credit arising on the reduction in the UK corporation tax rate9 398 128 242Deferred tax charge arising from an increase in US state income tax rates10 (8) – –
Tax on exceptional items (57) 31 54Tax on remeasurements6,8 (36) (92) 42Tax on stranded cost recoveries – (5) (104)
297 62 234
Total exceptional items, remeasurements and stranded cost recoveries after tax 461 240 208
Analysis of total exceptional items, remeasurements and stranded cost recoveries after taxExceptional items after tax 388 75 174Remeasurements after tax 73 156 (122)Stranded cost recoveries after tax – 9 156
Total 461 240 208
1. Restructuring costs for the period of £136m related to the continued restructuring of our UK operations in preparedness to deliver RIIO, other transformation-related initiatives in the UK and US and an associated software impairment for licences that will no longer be used.
Restructuring costs for 2013 included: costs related to the restructuring of our UK operations of £66m in preparedness for delivering RIIO; costs for transformation-related initiatives in the UK and US of £31m; and a credit of £10m for the release of restructuring provisions in the UK recognised in prior years. For the year ended 31 March 2012, restructuring costs included: costs for the restructuring of our US operations of £58m, which included severance costs and pension and other post-retirement curtailment gains and losses; costs for transformation-related initiatives of £54m; and a credit of £11m for the release of restructuring provisions in the UK recognised in prior years.
2. A provision of £79m (2013: £nil) has been made for the demolition of certain non-operational gas holders in the UK.
3. A net gain of £254m (2013: £nil) has been recognised in the year ended 31 March 2014. This includes a pension curtailment and settlement gain of £214m for employees who transferred to a new employer following the cessation of the Management Services Agreement (MSA) with LIPA on 31 December 2013. There was also a gain of £142m following the extinguishment of debt obligations of £98m and a £56m cash payment to be received, in compensation for the Company forgiving a historic pension receivable and carrying charges. These gains were offset by transition costs and other provisions incurred to effect the transition. For the year ended 31 March 2012, an impairment charge of £64m was recognised, representing intangibles (originally recognised on the acquisition of KeySpan) related to our LIPA MSA contract. This amount was previously disclosed as impairment charges and related costs.
4. During the year ended 31 March 2014, £16m (2013: £nil) was received following the sale to a third party of a settlement award which arose as a result of a legal ruling in 2008. For the year ended 31 March 2012, an amortisation charge of £5m in relation to acquisition-related intangibles was offset by a release of £6m of unutilised provisions in our UK metering business.
5. For the year ended 31 March 2013, we recognised a gain of £3m on the disposal of two subsidiaries in New Hampshire. During the year ended 31 March 2012, we sold two other subsidiaries resulting in a gain on disposal of £72m. We also recognised gains of £25m in relation to disposals of businesses in prior years, representing the release of various unutilised provisions.
6. Remeasurements – commodity contracts represent mark-to-market movements on certain physical and financial commodity contract obligations in the US. These contracts primarily relate to the forward purchase of energy for supply to customers, or to the economic hedging thereof, that are required to be measured at fair value and that do not qualify for hedge accounting. Under the existing rate plans in the US, commodity costs are recoverable from customers although the timing of recovery may differ from the pattern of costs incurred.
7. For the year ended 31 March 2013, stranded cost recoveries of £14m substantially represented the release of an unutilised provision recognised in a prior period. For the year ended 31 March 2012, stranded cost recoveries on a pre-tax basis consisted of revenue of £279m offset by operating costs of £19m. This represented the recovery of some of our historical investments in generating plants that were divested as part of the restructuring and wholesale power deregulation process in New England and New York during the 1990s.
8. Remeasurements – net gains/(losses) on derivative financial instruments comprise gains/(losses) arising on derivative financial instruments reported in the income statement. These exclude gains and losses for which hedge accounting has been effective, which have been recognised directly in other comprehensive income or which are offset by adjustments to the carrying value of debt. The tax charge in the year includes a credit of £nil (2013: £1m; 2012: £1m) in respect of prior years.
9. The exceptional tax credit arises from reductions in the UK corporation tax rate, from 23% to 21% applicable from 1 April 2014, and a further reduction from 21% to 20% applicable from 1 April 2015. The rate reductions were enacted in the Finance Act 2013. Other UK tax legislation also reduced the UK corporation tax rate in the prior periods (2013: from 24% to 23%; 2012: from 26% to 24%). These reductions have resulted in a decrease in deferred tax liabilities.
10. The exceptional tax charge arises from a net increase in US state income tax rates. Effective from 1 April 2014, the state income tax rate for Massachusetts regulated utilities increased from 6.5% to 8% and, effective from 1 April 2016, the state income tax rate for New York will decrease from 7.1% to 6.5%.
Notes to the consolidated financial statements continued
100 National Grid Annual Report and Accounts 2013/14

Strategic Report Corporate Governance Financial Statements Additional Information
5. Finance income and costs
This note details the interest income generated by our financial assets and interest expense incurred on our financial liabilities. It also includes the expected return on our pension and other post-retirement assets, which is offset by the interest payable on pension and other post-retirement obligations and presented on a net basis. In reporting business performance, we adjust net financing costs to exclude any net gains or losses on derivative financial instruments included in remeasurements.
2014£m
2013(restated)1
£m
2012(restated)1
£m
Finance incomeInterest income on financial instruments
Bank deposits and other financial assets 22 20 19Gains on disposal of available-for-sale investments 14 10 9
Finance income 36 30 28
Finance costsNet interest on pensions and other post-retirement benefit obligations (128) (135) (103)Interest expense on financial liabilities held at amortised cost
Bank loans and overdrafts (61) (65) (84)Other borrowings (1,109) (1,052) (1,105)
Derivatives 79 51 122Unwinding of discounts on provisions (73) (75) (72)Less: interest capitalised2 148 122 124
Finance costs before exceptional items and remeasurements (1,144) (1,154) (1,118)
RemeasurementsNet gains/(losses) on derivative financial instruments included in remeasurements3:Ineffectiveness on derivatives designated as:
Fair value hedges4 22 17 9Cash flow hedges 4 (7) 14Net investment hedges 38 (26) (15)Net investment hedges – undesignated forward rate risk (7) 26 39
Derivatives not designated as hedges or ineligible for hedge accounting 36 58 (117)
Exceptional items and remeasurements included within finance costs (note 4) 93 68 (70)
Finance costs (1,051) (1,086) (1,188)
Net finance costs (1,015) (1,056) (1,160)
1. See note 1 on page 92.
2. Interest on funding attributable to assets in the course of construction was capitalised during the year at a rate of 4.5% (2013: 4.4%; 2012: 5.2%).
3. Includes a net foreign exchange gain on financing activities of £268m (2013: £32m loss; 2012: £280m gain) offset by foreign exchange gains and losses on derivative financial instruments measured at fair value.
4. Includes a net loss on instruments designated as fair value hedges of £183m (2013: £67m gain; 2012: £233m gain) offset by a net gain of £205m (2013: £50m loss; 2012: £224m loss) arising from fair value adjustments to the carrying value of debt.
101

6. Taxation
Tax is payable in the territories where we operate, mainly the UK and US. This note gives further details of the tax charge and tax liabilities, including current and deferred tax. The current tax charge is the tax payable on this year’s taxable profits. Deferred tax is an accounting adjustment to provide for tax that is expected to arise in the future due to differences in accounting and tax bases.
The tax charge for the period is recognised in the income statement, the statement of comprehensive income or directly in equity, according to the accounting treatment of the related transaction. The tax charge comprises both current and deferred tax.
Current tax assets and liabilities are measured at the amounts expected to be recovered from or paid to the taxation authorities. The tax rates and tax laws used to compute the amounts are those that have been enacted or substantively enacted by the reporting date.
The calculation of the Group’s total tax charge involves a degree of estimation and judgement, and management periodically evaluates positions taken in tax returns with respect to situations in which applicable tax regulation is subject to interpretation and establishes provisions where appropriate on the basis of amounts expected to be paid to the tax authorities.
Deferred tax is provided for using the balance sheet liability method and is recognised on temporary differences between the carrying amount of assets and liabilities in the financial statements and the corresponding tax bases used in the computation of taxable profit.
Deferred tax liabilities are generally recognised on all taxable temporary differences and deferred tax assets are recognised to the extent that it is probable that taxable profits will be available against which deductible temporary differences can be utilised. However, deferred tax assets and liabilities are not recognised if the temporary differences arise from the initial recognition of goodwill or from the initial recognition of other assets and liabilities in a transaction (other than a business combination) that affects neither the accounting nor taxable profit or loss.
Deferred tax liabilities are recognised on taxable temporary differences arising on investments in subsidiaries and jointly controlled entities except where the Company is able to control the reversal of the temporary difference and it is probable that the temporary difference will not reverse in the foreseeable future.
Deferred tax is calculated at the tax rates that are expected to apply in the period when the liability is settled or the asset is realised, based on the tax rates and tax laws that have been enacted or substantively enacted by the reporting date.
The carrying amount of deferred tax assets is reviewed at each reporting date and reduced to the extent that it is no longer probable that sufficient taxable profits will be available to allow all or part of the deferred tax asset to be recovered. Unrecognised deferred tax assets are reassessed at each reporting date and are recognised to the extent that it has become probable that future taxable profits will allow the deferred tax asset to be recovered.
Deferred tax assets and liabilities are offset when there is a legally enforceable right to set off current tax assets against current tax liabilities and when they relate to income taxes levied by the same taxation authority and the Company and its subsidiaries intend to settle their current tax assets and liabilities on a net basis.
Notes to the consolidated financial statements continued
102 National Grid Annual Report and Accounts 2013/14

Strategic Report Corporate Governance Financial Statements Additional Information
6. Taxation continuedTax charged/(credited) to the income statement
2014£m
2013(restated)1
£m
2012(restated)1
£m
Tax before exceptional items, remeasurements and stranded cost recoveries 581 619 697
Exceptional tax on items not included in profit before tax (note 4) (390) (128) (242)Tax on other exceptional items, remeasurements and stranded cost recoveries 93 66 8
Tax on total exceptional items, remeasurements and stranded cost recoveries (note 4) (297) (62) (234)
Total tax charge 284 557 463
1. See note 1 on page 92.
Taxation as a percentage of profit before tax
2014%
2013(restated)1
%
2012(restated)1
%
Before exceptional items, remeasurements and stranded cost recoveries 22.5 24.4 28.9
After exceptional items, remeasurements and stranded cost recoveries 10.3 20.5 19.4
1. See note 1 on page 92.
The tax charge for the year can be analysed as follows:
2014£m
2013(restated)1
£m
2012(restated)1
£m
Current taxUK corporation tax at 23% (2013: 24%; 2012: 26%) 355 306 186UK corporation tax adjustment in respect of prior years (9) (17) (5)
346 289 181
Overseas corporation tax 54 50 98Overseas corporation tax adjustment in respect of prior years (88) (222) (144)
(34) (172) (46)
Total current tax 312 117 135
Deferred taxUK deferred tax (292) 35 (12)UK deferred tax adjustment in respect of prior years (3) (17) (18)
(295) 18 (30)
Overseas deferred tax 276 283 191Overseas deferred tax adjustment in respect of prior years (9) 139 167
267 422 358
Total deferred tax (28) 440 328
Total tax charge 284 557 463
1. See note 1 on page 92.
Adjustments in respect of prior years include the following amounts that relate to exceptional items, remeasurements and stranded cost recoveries: £nil (2013: £1m credit; 2012: £1m credit).
103
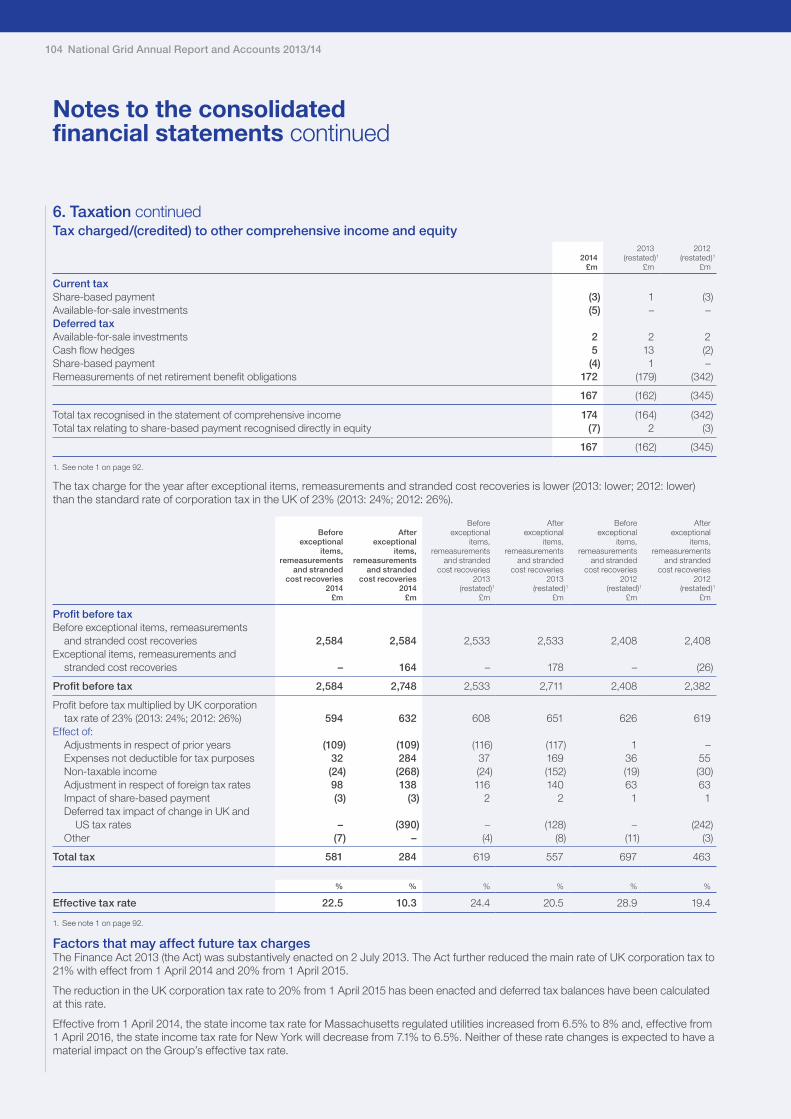
6. Taxation continuedTax charged/(credited) to other comprehensive income and equity
2014£m
2013(restated)1
£m
2012(restated)1
£m
Current taxShare-based payment (3) 1 (3)Available-for-sale investments (5) – –Deferred taxAvailable-for-sale investments 2 2 2Cash flow hedges 5 13 (2)Share-based payment (4) 1 –Remeasurements of net retirement benefit obligations 172 (179) (342)
167 (162) (345)
Total tax recognised in the statement of comprehensive income 174 (164) (342)Total tax relating to share-based payment recognised directly in equity (7) 2 (3)
167 (162) (345)
1. See note 1 on page 92.
The tax charge for the year after exceptional items, remeasurements and stranded cost recoveries is lower (2013: lower; 2012: lower) than the standard rate of corporation tax in the UK of 23% (2013: 24%; 2012: 26%).
Beforeexceptional
items,remeasurements
and strandedcost recoveries
2014£m
Afterexceptional
items,remeasurements
and strandedcost recoveries
2014£m
Beforeexceptional
items,remeasurements
and strandedcost recoveries
2013(restated)1
£m
Afterexceptional
items,remeasurements
and strandedcost recoveries
2013(restated)1
£m
Beforeexceptional
items,remeasurements
and strandedcost recoveries
2012(restated)1
£m
Afterexceptional
items,remeasurements
and strandedcost recoveries
2012(restated)1
£m
Profit before taxBefore exceptional items, remeasurements
and stranded cost recoveries 2,584 2,584 2,533 2,533 2,408 2,408Exceptional items, remeasurements and
stranded cost recoveries – 164 – 178 – (26)
Profit before tax 2,584 2,748 2,533 2,711 2,408 2,382
Profit before tax multiplied by UK corporation tax rate of 23% (2013: 24%; 2012: 26%) 594 632 608 651 626 619
Effect of:Adjustments in respect of prior years (109) (109) (116) (117) 1 –Expenses not deductible for tax purposes 32 284 37 169 36 55Non-taxable income (24) (268) (24) (152) (19) (30)Adjustment in respect of foreign tax rates 98 138 116 140 63 63Impact of share-based payment (3) (3) 2 2 1 1Deferred tax impact of change in UK and
US tax rates – (390) – (128) – (242)Other (7) – (4) (8) (11) (3)
Total tax 581 284 619 557 697 463
% % % % % %
Effective tax rate 22.5 10.3 24.4 20.5 28.9 19.4
1. See note 1 on page 92.
Factors that may affect future tax chargesThe Finance Act 2013 (the Act) was substantively enacted on 2 July 2013. The Act further reduced the main rate of UK corporation tax to 21% with effect from 1 April 2014 and 20% from 1 April 2015.
The reduction in the UK corporation tax rate to 20% from 1 April 2015 has been enacted and deferred tax balances have been calculated at this rate.
Effective from 1 April 2014, the state income tax rate for Massachusetts regulated utilities increased from 6.5% to 8% and, effective from 1 April 2016, the state income tax rate for New York will decrease from 7.1% to 6.5%. Neither of these rate changes is expected to have a material impact on the Group’s effective tax rate.
Notes to the consolidated financial statements continued
104 National Grid Annual Report and Accounts 2013/14
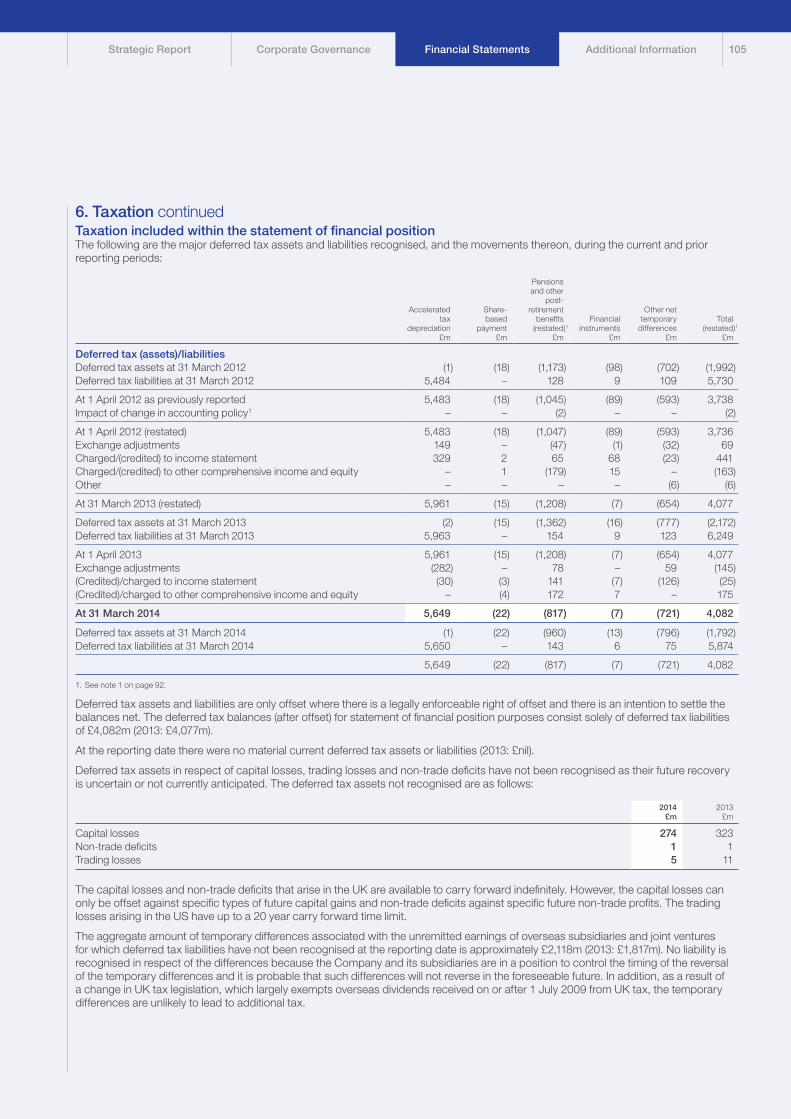
Strategic Report Corporate Governance Financial Statements Additional Information
6. Taxation continuedTaxation included within the statement of financial positionThe following are the major deferred tax assets and liabilities recognised, and the movements thereon, during the current and prior reporting periods:
Acceleratedtax
depreciation£m
Share-based
payment£m
Pensionsand other
post-retirement
benefits(restated)1
£m
Financialinstruments
£m
Other nettemporary
differences£m
Total(restated)1
£m
Deferred tax (assets)/liabilitiesDeferred tax assets at 31 March 2012 (1) (18) (1,173) (98) (702) (1,992)Deferred tax liabilities at 31 March 2012 5,484 – 128 9 109 5,730
At 1 April 2012 as previously reported 5,483 (18) (1,045) (89) (593) 3,738Impact of change in accounting policy1 – – (2) – – (2)
At 1 April 2012 (restated) 5,483 (18) (1,047) (89) (593) 3,736Exchange adjustments 149 – (47) (1) (32) 69Charged/(credited) to income statement 329 2 65 68 (23) 441Charged/(credited) to other comprehensive income and equity – 1 (179) 15 – (163)Other – – – – (6) (6)
At 31 March 2013 (restated) 5,961 (15) (1,208) (7) (654) 4,077
Deferred tax assets at 31 March 2013 (2) (15) (1,362) (16) (777) (2,172)Deferred tax liabilities at 31 March 2013 5,963 – 154 9 123 6,249
At 1 April 2013 5,961 (15) (1,208) (7) (654) 4,077Exchange adjustments (282) – 78 – 59 (145)(Credited)/charged to income statement (30) (3) 141 (7) (126) (25)(Credited)/charged to other comprehensive income and equity – (4) 172 7 – 175
At 31 March 2014 5,649 (22) (817) (7) (721) 4,082
Deferred tax assets at 31 March 2014 (1) (22) (960) (13) (796) (1,792)Deferred tax liabilities at 31 March 2014 5,650 – 143 6 75 5,874
5,649 (22) (817) (7) (721) 4,082
1. See note 1 on page 92.
Deferred tax assets and liabilities are only offset where there is a legally enforceable right of offset and there is an intention to settle the balances net. The deferred tax balances (after offset) for statement of financial position purposes consist solely of deferred tax liabilities of £4,082m (2013: £4,077m).
At the reporting date there were no material current deferred tax assets or liabilities (2013: £nil).
Deferred tax assets in respect of capital losses, trading losses and non-trade deficits have not been recognised as their future recovery is uncertain or not currently anticipated. The deferred tax assets not recognised are as follows:
2014£m
2013£m
Capital losses 274 323Non-trade deficits 1 1Trading losses 5 11
The capital losses and non-trade deficits that arise in the UK are available to carry forward indefinitely. However, the capital losses can only be offset against specific types of future capital gains and non-trade deficits against specific future non-trade profits. The trading losses arising in the US have up to a 20 year carry forward time limit.
The aggregate amount of temporary differences associated with the unremitted earnings of overseas subsidiaries and joint ventures for which deferred tax liabilities have not been recognised at the reporting date is approximately £2,118m (2013: £1,817m). No liability is recognised in respect of the differences because the Company and its subsidiaries are in a position to control the timing of the reversal of the temporary differences and it is probable that such differences will not reverse in the foreseeable future. In addition, as a result of a change in UK tax legislation, which largely exempts overseas dividends received on or after 1 July 2009 from UK tax, the temporary differences are unlikely to lead to additional tax.
105

Notes to the consolidated financial statements continued
Unaudited commentary on taxation
Tax strategyNational Grid manages its tax affairs in a proactive and responsible way in order to comply with all relevant legislation and minimise reputational risk. We have a good working relationship with all relevant tax authorities and actively engage with them in order to ensure that they are fully aware of our view of the tax implications of our business initiatives. Management responsibility and oversight for our tax strategy, which is approved by the Finance Committee, rests with the Finance Director and the Global Tax and Treasury Director who monitor our tax activities and report to the Finance Committee.
Total UK tax contributionNational Grid has taken the decision to provide additional information in respect of its total UK tax contribution and first disclosed this in last year’s annual report. This year we have again disclosed information in respect of our total UK tax contribution for consistency and to aid transparency in an area in which there has been increasing public interest. As was the case in the prior year, the total amount of taxes we pay and collect in the UK year on year is significantly more than just the corporation tax which we pay on our UK profits. Within the total, we again include significant other taxes paid such as business rates and taxes on employment together with employee taxes and other indirect taxes.
For 2013/14 our total tax contribution to the UK Exchequer was £1.4bn (2012/13: £1.2bn). Taxes borne in 2014 were £733m, an 8% increase on taxes borne in 2013 of £678m and primarily due to higher corporation tax payments in the current year. Our 2012/13 total tax contribution of £1.2bn resulted in National Grid being the 17th highest contributor of UK taxes based on the results of the Hundred Group’s 2013 Total Tax Contribution Survey, a position commensurate with the size of our business and capitalisation relative to other contributors to the survey. In 2012 we were in 16th position. In 2013 we ranked 9th in respect of taxes borne.
Of course, National Grid’s contribution to the UK economy is broader than just the taxes it pays over to and collects on behalf of HMRC. The Hundred Group’s 2013 Total Tax Contribution Survey ranks National Grid in 4th place in respect of UK capital expenditure on fixed assets and we also rank highly in respect of investment in research and development. National Grid’s economic contribution also supports a significant number of UK jobs in our supply chain.
The most significant amounts making up the 2013/14 total tax contribution were as follows:
UK total tax contribution 2013/14
Taxes borne £m Taxes collected £m
49
340
329521
129
2 113
Business rates OtherVAT PAYE and NIC UK corporation tax
Tax transparencyThe UK tax charge for the year disclosed in the accounts in accordance with accounting standards and the UK corporation tax paid during the year will differ. For transparency we have included a reconciliation below of the tax charge per the income statement to the UK corporation tax paid in 2013/14.
The tax charge for the Group as reported in the income statement is £284m (2012/13: £557m). The UK tax charge is £51m (2012/13: £307m) and UK corporation tax paid was £329m (2012/13: £243m), with the principal differences between these two measures as follows:
Year ended 31 March
Reconciliation of UK total tax charge to UK corporation tax paid
2014£m
2013(restated)1
£m
Total UK tax charge (current tax £346m (2013: £289m) and deferred tax £295m credit (2013: £18m charge)) 51 307
Adjustment for non-cash deferred tax credit/(charge) 295 (18)
Adjustment for the current tax credit in respect of prior years 9 17
UK current tax charge 355 306UK corporation tax instalment payments
in respect of current year not payable until the following year (179) (155)
UK corporation tax instalment payments in respect of prior years paid in current year 153 92
UK corporation tax paid 329 243
1. All comparatives restated for IAS 19 (revised). See note 1 on page 92.
Tax lossesWe have total unrecognised deferred tax assets in respect of losses of £280m (2012/13: £335m) of which £274m (2012/13: £319m) are capital losses in the UK as set out on page 105. These losses arose as a result of the disposal of certain businesses or assets and may be available to offset against future capital gains in the UK.
Development of future tax policyWe believe that the continued development of a coherent and transparent tax policy in the UK is critical to help drive growth in the economy.
We continue to contribute to research into the structure of business taxation and its economic impact by contributing to the funding of the Oxford University Centre for Business Taxation at the Saïd Business School.
We are a member of a number of industry groups which participate in the development of future tax policy, including the Hundred Group, which represents the views of finance directors of FTSE 100 companies and several other large UK companies. Our Finance Director is Chairman of its Tax Committee. This helps to ensure that we are engaged at the earliest opportunity on taxation issues which affect our business. For example, in the current year we have engaged with and responded to a number of HMRC consultations, the subject matter of which has a direct impact on taxes borne or collected by our business, and reviewed numerous others with a potential impact.
This unaudited commentary does not form part of the financial statements.
106 National Grid Annual Report and Accounts 2013/14

Strategic Report Corporate Governance Financial Statements Additional Information
7. Earnings per share (EPS)
EPS is the amount of post-tax profit attributable to each ordinary share. Basic EPS is calculated on profit for the year attributable to equity shareholders divided by the weighted average number of shares in issue during the year. Diluted EPS shows what the impact would be if all outstanding share options were exercised and treated as ordinary shares at year end.
Adjusted EPS, excluding exceptional items, remeasurements and stranded cost recoveries, are provided to reflect the business performance subtotals used by the Company. For further details of exceptional items, remeasurements and stranded cost recoveries, see note 4.
(a) Basic earnings per share
Earnings2014
£m
Earningsper share
2014pence
Earnings2013
(restated)1
£m
Earningsper share
2013(restated)1,2
pence
Earnings2012
(restated)1
£m
Earningsper share
2012(restated)1,2
pence
Adjusted earnings 2,015 54.0 1,913 51.4 1,709 46.0Exceptional items after tax 388 10.4 75 2.0 174 4.7Remeasurements after tax 73 2.0 156 4.2 (122) (3.3)Stranded cost recoveries after tax – – 9 0.2 156 4.2
Earnings 2,476 66.4 2,153 57.8 1,917 51.6
2014millions
2013millions
2012millions
Weighted average number of shares – basic2 3,729 3,724 3,719
1. See note 1 on page 92.
2. Comparative amounts have been restated to reflect the impact of additional shares issued as scrip dividends.
(b) Diluted earnings per share
Earnings2014
£m
Earningsper share
2014pence
Earnings2013
(restated)1
£m
Earningsper share
2013(restated)1,2
pence
Earnings2012
(restated)1
£m
Earningsper share
2012(restated)1,2
pence
Adjusted earnings 2,015 53.8 1,913 51.1 1,709 45.7Exceptional items after tax 388 10.4 75 2.0 174 4.7Remeasurements after tax 73 1.9 156 4.2 (122) (3.3)Stranded cost recoveries after tax – – 9 0.2 156 4.2
Earnings 2,476 66.1 2,153 57.5 1,917 51.3
2014millions
2013millions
2012millions
Weighted average number of shares – diluted2 3,748 3,742 3,738
1. See note 1 on page 92.
2. Comparative amounts have been restated to reflect the impact of additional shares issued as scrip dividends.
(c) Reconciliation of basic to diluted average number of shares2014
millions2013
millions2012
millions
Weighted average number of ordinary shares – basic 3,729 3,724 3,719Effect of dilutive potential ordinary shares – employee share plans 19 18 19
Weighted average number of ordinary shares – diluted 3,748 3,742 3,738
107

8. Dividends
Dividends represents the return of profits to shareholders. Dividends are paid as an amount per ordinary share held. We retain part of the profits generated in the year to meet future growth plans and pay out the remainder in accordance with our dividend policy.
Interim dividends are recognised when they become payable to the Company’s shareholders. Final dividends are recognised when they are approved by shareholders.
The following table shows the actual dividends paid to equity shareholders:
2014 2013 2012
Penceper share
Total£m
Settledvia scrip
£mPence
per shareTotal
£m
Settledvia scrip
£mPence
per shareTotal
£m
Settledvia scrip
£m
Interim – year ended 31 March 2014 14.49 539 – – – – – – –Final – year ended 31 March 2013 26.36 964 444 – – – – – –Interim – year ended 31 March 2013 – – – 14.49 527 187 – – –Final – year ended 31 March 2012 – – – 25.35 906 436 – – –Interim – year ended 31 March 2012 – – – – – – 13.93 497 34Final – year ended 31 March 2011 – – – – – – 23.47 822 279
40.85 1,503 444 39.84 1,433 623 37.40 1,319 313
The Directors are proposing a final dividend for the year ended 31 March 2014 of 27.54p per share that will absorb approximately £1,028m of shareholders’ equity (assuming all amounts are settled in cash). It will be paid on 20 August 2014 to shareholders who are on the register of members at 6 June 2014 and a scrip dividend will be offered as an alternative, subject to shareholders’ approval at the AGM.
Unaudited commentary on dividendsFollowing the announcement of our new dividend policy in March 2013, we remain confident that our business is able to support a dividend rising at least in line with inflation for the foreseeable future, while continuing to invest as required in our regulated asset bases. The dividend cover chart opposite supports our decision.
With the exception of the 2013/14 interim dividend paid in January this year, a scrip option has been offered for all interim and final dividends in the last three years. The scrip take-up was as follows: 2012/13 final: 46%; 2012/13 interim: 35%; and 2011/12 final: 48%.
1.2
1.5
1.21.4
1.31.5
1.3
1.6
1.3 1.3
2010 2011 2012 2013 2014
Adjusted earnings Earnings
Dividend coverTimes
Notes to the consolidated financial statements continued
This unaudited commentary does not form part of the financial statements.
108 National Grid Annual Report and Accounts 2013/14
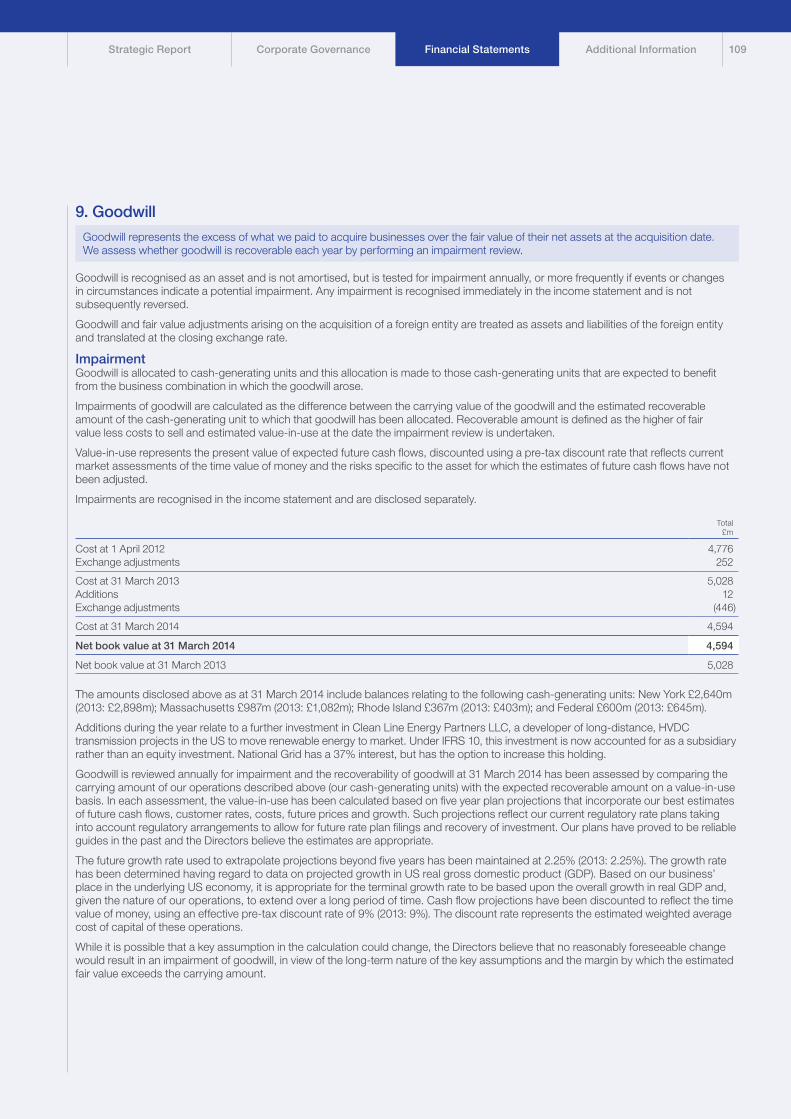
Strategic Report Corporate Governance Financial Statements Additional Information
9. Goodwill
Goodwill represents the excess of what we paid to acquire businesses over the fair value of their net assets at the acquisition date. We assess whether goodwill is recoverable each year by performing an impairment review.
Goodwill is recognised as an asset and is not amortised, but is tested for impairment annually, or more frequently if events or changes in circumstances indicate a potential impairment. Any impairment is recognised immediately in the income statement and is not subsequently reversed.
Goodwill and fair value adjustments arising on the acquisition of a foreign entity are treated as assets and liabilities of the foreign entity and translated at the closing exchange rate.
ImpairmentGoodwill is allocated to cash-generating units and this allocation is made to those cash-generating units that are expected to benefit from the business combination in which the goodwill arose.
Impairments of goodwill are calculated as the difference between the carrying value of the goodwill and the estimated recoverable amount of the cash-generating unit to which that goodwill has been allocated. Recoverable amount is defined as the higher of fair value less costs to sell and estimated value-in-use at the date the impairment review is undertaken.
Value-in-use represents the present value of expected future cash flows, discounted using a pre-tax discount rate that reflects current market assessments of the time value of money and the risks specific to the asset for which the estimates of future cash flows have not been adjusted.
Impairments are recognised in the income statement and are disclosed separately.
Total£m
Cost at 1 April 2012 4,776Exchange adjustments 252
Cost at 31 March 2013 5,028Additions 12Exchange adjustments (446)
Cost at 31 March 2014 4,594
Net book value at 31 March 2014 4,594
Net book value at 31 March 2013 5,028
The amounts disclosed above as at 31 March 2014 include balances relating to the following cash-generating units: New York £2,640m (2013: £2,898m); Massachusetts £987m (2013: £1,082m); Rhode Island £367m (2013: £403m); and Federal £600m (2013: £645m).
Additions during the year relate to a further investment in Clean Line Energy Partners LLC, a developer of long-distance, HVDC transmission projects in the US to move renewable energy to market. Under IFRS 10, this investment is now accounted for as a subsidiary rather than an equity investment. National Grid has a 37% interest, but has the option to increase this holding.
Goodwill is reviewed annually for impairment and the recoverability of goodwill at 31 March 2014 has been assessed by comparing the carrying amount of our operations described above (our cash-generating units) with the expected recoverable amount on a value-in-use basis. In each assessment, the value-in-use has been calculated based on five year plan projections that incorporate our best estimates of future cash flows, customer rates, costs, future prices and growth. Such projections reflect our current regulatory rate plans taking into account regulatory arrangements to allow for future rate plan filings and recovery of investment. Our plans have proved to be reliable guides in the past and the Directors believe the estimates are appropriate.
The future growth rate used to extrapolate projections beyond five years has been maintained at 2.25% (2013: 2.25%). The growth rate has been determined having regard to data on projected growth in US real gross domestic product (GDP). Based on our business’ place in the underlying US economy, it is appropriate for the terminal growth rate to be based upon the overall growth in real GDP and, given the nature of our operations, to extend over a long period of time. Cash flow projections have been discounted to reflect the time value of money, using an effective pre-tax discount rate of 9% (2013: 9%). The discount rate represents the estimated weighted average cost of capital of these operations.
While it is possible that a key assumption in the calculation could change, the Directors believe that no reasonably foreseeable change would result in an impairment of goodwill, in view of the long-term nature of the key assumptions and the margin by which the estimated fair value exceeds the carrying amount.
109

10. Other intangible assets
Other intangible assets includes software and acquisition-related assets (such as brand names and customer relationships), which are written down (amortised) over the period we expect to receive a benefit from the asset.
Identifiable intangible assets are recorded at cost less accumulated amortisation and any provision for impairment. Other intangible assets are tested for impairment only if there is an indication that the carrying value of the assets may have been impaired. Impairments of assets are calculated as the difference between the carrying value of the asset and the recoverable amount, if lower. Where such an asset does not generate cash flows that are independent from other assets, the recoverable amount of the cash-generating unit to which that asset belongs is estimated. Impairments are recognised in the income statement and are disclosed separately. Any assets which suffered impairment in a previous period are reviewed for possible reversal of the impairment at each reporting date.
Internally generated intangible assets, such as software, are recognised only if: an asset is created that can be identified; it is probable that the asset created will generate future economic benefits; and the development cost of the asset can be measured reliably. Where no internally generated intangible asset can be recognised, development expenditure is recorded as an expense in the period in which it is incurred.
On a business combination, as well as recording separable intangible assets possessed by the acquired entity at their fair value, identifiable intangible assets that arise from contractual or other legal rights are also included in the statement of financial position at their fair value. Acquisition-related intangible assets principally comprise customer relationships.
Other intangible assets are amortised on a straight-line basis over their estimated useful economic lives. Amortisation periods for categories of intangible assets are:
Years
Software 3 to 10Acquisition-related intangibles 10 to 25
Software£m
Acquisition-related
£mTotal
£m
Cost at 1 April 2012 899 116 1,015Exchange adjustments 20 6 26Additions 175 – 175Disposals (26) – (26)Reclassifications1 (37) – (37)
Cost at 31 March 2013 1,031 122 1,153Exchange adjustments (38) (7) (45)Additions 179 – 179Disposals (16) (115) (131)Reclassifications1 66 – 66
Cost at 31 March 2014 1,222 – 1,222
Accumulated amortisation at 1 April 2012 (353) (116) (469)Exchange adjustments (6) (6) (12)Amortisation charge for the year (101) – (101)Disposals 9 – 9Reclassifications1 9 – 9
Accumulated amortisation at 31 March 2013 (442) (122) (564)Exchange adjustments 12 7 19Amortisation charge for the year (127) – (127)Impairment charge (5) – (5)Disposals 12 115 127Reclassifications1 (3) – (3)
Accumulated amortisation at 31 March 2014 (553) – (553)
Net book value at 31 March 2014 669 – 669
Net book value at 31 March 2013 589 – 589
1. Reclassifications represents amounts transferred (to)/from property, plant and equipment (see note 11 on page 112).
Notes to the consolidated financial statements continued
110 National Grid Annual Report and Accounts 2013/14
Strategic Report Corporate Governance Financial Statements Additional Information
11. Property, plant and equipment
The following note shows the physical assets controlled by us. The cost of these assets primarily represents the amount initially paid for them. A depreciation expense is charged to the income statement to reflect annual wear and tear and the reduced value of the asset over time. Depreciation is calculated by estimating the number of years we expect the asset to be used (useful economic life) and charging the cost of the asset to the income statement equally over this period.
Our strategy in actionWe operate an energy networks business and therefore have a significant physical asset base. We continue to invest in our networks to maintain reliability, create new customer connections and ensure our networks are flexible and resilient. Our business plan envisages these additional investments will be funded through a mixture of cash generated from operations and the issue of new debt.
Property, plant and equipment is recorded at cost, less accumulated depreciation and any impairment losses.
Cost includes the purchase price of the asset, any payroll and finance costs incurred which are directly attributable to the construction of property, plant and equipment as well as the cost of any associated asset retirement obligations.
Property, plant and equipment includes assets in which the Company’s interest comprises legally protected statutory or contractual rights of use. Additions represent the purchase or construction of new assets, including capital expenditure for safety and environmental assets, and extensions to, enhancements to, or replacement of, existing assets.
Contributions received prior to 1 July 2009 towards the cost of property, plant and equipment are included in trade and other payables as deferred income and credited on a straight-line basis to the income statement over the estimated useful economic lives of the assets to which they relate.
Contributions received post 1 July 2009 are recognised in revenue immediately, except where the contributions are consideration for a future service, in which case they are recognised initially as deferred income, and revenue is subsequently recognised over the period in which the service is provided.
No depreciation is provided on freehold land or assets in the course of construction.
Other items of property, plant and equipment are depreciated, on a straight-line basis, at rates estimated to write off their book values over their estimated useful economic lives. In assessing estimated useful economic lives, consideration is given to any contractual arrangements and operational requirements relating to particular assets. The assessments of estimated useful economic lives and residual values of assets are performed annually. Unless otherwise determined by operational requirements, the depreciation periods for the principal categories of property, plant and equipment are, in general, as shown in the table below:
Years
Freehold and leasehold buildings up to 65Plant and machinery
Electricity transmission plant 15 to 60Electricity distribution plant 15 to 60Electricity generation plant 20 to 40Interconnector plant 15 to 60Gas plant – mains, services and regulating equipment 30 to 100Gas plant – storage 15 to 21Gas plant – meters 10 to 33
Motor vehicles and office equipment up to 10
Gains and losses on disposals are determined by comparing the proceeds with the carrying amount and are, depending on their magnitude, recognised as an exceptional item within operating profit in the income statement.
Items within property, plant and equipment are tested for impairment only if there is some indication that the carrying value of the assets may have been impaired.
Impairments of assets are calculated as the difference between the carrying value of the asset and the recoverable amount, if lower. Where such an asset does not generate cash flows that are independent from other assets, the recoverable amount of the cash-generating unit to which that asset belongs is estimated.
Material impairments are recognised in the income statement and are disclosed separately.
Any assets which suffered impairment in a previous period are reviewed for possible reversal of the impairment at each reporting date.
111

11. Property, plant and equipment continued
Land andbuildings
£m
Plant andmachinery
£m
Assetsin the
course ofconstruction
£m
Motorvehicles
and officeequipment
£mTotal
£m
Cost at 1 April 2012 2,013 42,699 2,975 770 48,457Exchange adjustments 55 803 45 13 916Additions 141 704 2,584 82 3,511Disposals (24) (311) (2) (130) (467)Reclassifications1 140 1,471 (1,642) 68 37
Cost at 31 March 2013 2,325 45,366 3,960 803 52,454Exchange adjustments (99) (1,471) (82) (28) (1,680)Additions 69 623 2,514 56 3,262Disposals (32) (288) (2) (98) (420)Reclassifications1 (15) 2,195 (2,366) 120 (66)
Cost at 31 March 2014 2,248 46,425 4,024 853 53,550
Accumulated depreciation at 1 April 2012 (436) (13,804) (2) (514) (14,756)Exchange adjustments (11) (216) – (9) (236)Depreciation charge for the year2 (75) (1,085) – (121) (1,281)Disposals 23 299 2 96 420Reclassifications1 – – – (9) (9)
Accumulated depreciation at 31 March 2013 (499) (14,806) – (557) (15,862)Exchange adjustments 16 399 – 21 436Depreciation charge for the year2 (84) (1,112) – (103) (1,299)Impairment charge for the year (1) – – – (1)Disposals 25 234 – 93 352Reclassifications1 107 (65) – (39) 3
Accumulated depreciation at 31 March 2014 (436) (15,350) – (585) (16,371)
Net book value at 31 March 2014 1,812 31,075 4,024 268 37,179
Net book value at 31 March 2013 1,826 30,560 3,960 246 36,592
1. Represents amounts transferred between categories and from/(to) other intangible assets (see note 10 on page 110).
2. Includes amounts in respect of capitalised depreciation of £10m (2013: £21m).
2014£m
2013£m
Information in relation to property, plant and equipmentCapitalised interest included within cost 1,409 1,275Net book value of assets held under finance leases (all relating to motor vehicles and office equipment) 170 188Additions to assets held under finance leases (all relating to motor vehicles and office equipment) 25 48Contributions to cost of property, plant and equipment included within:
Trade and other payables 44 43Non-current liabilities 1,526 1,492
12. Other non-current assets
Other non-current assets includes assets that do not fall into any other non-current asset category (such as goodwill or property, plant and equipment) and where the benefit to be received from the asset is not due to be received until after 31 March 2015.
2014£m
2013£m
Commodity contract assets 45 47Other receivables 33 51Prepayments 9 6
87 104
Notes to the consolidated financial statements continued
112 National Grid Annual Report and Accounts 2013/14

Strategic Report Corporate Governance Financial Statements Additional Information
13. Financial and other investments
Financial and other investments includes two main categories. Assets classified as available-for-sale typically represent investments in short-term money funds and quoted investments in equities or bonds of other companies. The second category is loans and receivables which includes bank deposits with a maturity of greater than three months, and cash balances that cannot be readily used in operations, principally collateral pledged for certain borrowings and restricted cash balances relating to our UK pension schemes.
Financial assets, liabilities and equity instruments are classified according to the substance of the contractual arrangements entered into, and recognised on trade date. Available-for-sale financial assets are non-derivatives that are either designated in this category or not classified in any other categories.
Available-for-sale financial investments are recognised at fair value plus directly related incremental transaction costs, and are subsequently carried at fair value in the statement of financial position. Changes in the fair value of available-for-sale investments are recognised directly in equity, until the investment is disposed of or is determined to be impaired. At this time the cumulative gain or loss previously recognised in equity is included in the income statement for the period. Investment income is recognised using the effective interest method and taken through interest income in the income statement.
Loans receivable and other receivables are initially recognised at fair value and subsequently held at amortised cost using the effective interest method. Interest income, together with gains and losses when the loans and receivables are derecognised or impaired, are recognised in the income statement.
Subsequent to initial recognition, the fair values of financial assets measured at fair value that are quoted in active markets are based on bid prices. When independent prices are not available, fair values are determined by using valuation techniques that are consistent with techniques commonly used by the relevant market. The techniques use observable market data.
2014£m
2013£m
Non-currentAvailable-for-sale investments 284 278
CurrentAvailable-for-sale investments 2,716 4,441Loans and receivables 883 990
3,599 5,431
Total financial and other investments 3,883 5,709
Financial and other investments include the following:Investments in short-term money funds 2,165 4,120Managed investments in equity and bonds1 465 453Bank deposits1 355 165Cash surrender value of life insurance policies 140 145Other investments 2 4Restricted balances2 756 822
3,883 5,709
1. Includes £296m (2013: £296m) of current investments which are held by insurance captives and are therefore restricted.
2. Principally comprises collateral placed with counterparties with whom we have entered into a credit support annex to the ISDA Master Agreement £402m (2013: £507m), and assets held within security accounts, with charges in favour of the UK pension schemes Trustees of £234m (2013: £179m).
Available-for-sale investments are recorded at fair value. Due to their short maturities the carrying value of loans and receivables approximates their fair value. The maximum exposure to credit risk at the reporting date is the fair value of the financial investments. For further information on our credit risk, refer to note 30 (a). None of the financial investments are past due or impaired.
113

14. Investments in joint ventures and associates
Investments in joint ventures and associates represents businesses we do not control, but instead exercise joint control or significant influence.
A joint venture is an arrangement established to engage in economic activity, which the Company jointly controls with other parties and has rights to the net assets of the arrangement. An associate is an entity that is neither a subsidiary nor a joint venture, but over which the Company has significant influence.
2014£m
2013£m
Share of net assets at 1 April 371 341Exchange adjustments (16) 9Additions 4 14Share of post-tax results for the year 28 18Dividends received (38) (21)Other movements 2 10
Share of net assets at 31 March 351 371
A list of principal joint ventures and associates including the name, proportion of ownership and principal activity is provided in note 32.
The joint ventures and associates have no significant contingent liabilities to which the Group is exposed, and the Group has no significant contingent liabilities in relation to its interest in the joint ventures and associates.
Outstanding balances with joint ventures and associates are shown in note 28.
15. Derivative financial instruments
Derivatives are financial instruments that derive their value from the price of an underlying item such as interest rates, foreign exchange, credit spreads, commodities, equity or other indices. In accordance with Board approved policies, derivatives are transacted to manage our exposure to fluctuations in interest rate and foreign exchange rate on borrowings and other contractual cash flows. Specifically, we use derivatives to manage these risks from our financing portfolio to optimise the overall cost of accessing the debt capital markets. These derivatives are analysed below. We also use derivatives to manage our operational market risks from commodities. The commodity derivative contracts are detailed in note 30 (e).
Derivative financial instruments are initially recognised at fair value and subsequently remeasured at fair value at each reporting date. Changes in fair values are recorded in the period they arise, either in the income statement or other comprehensive income depending on the applicable accounting standards. Where the fair value of a derivative is positive it is carried as a derivative asset, and where negative as a derivative liability.
We calculate fair value of the financial derivatives by discounting all future cash flows using the market yield curve at the reporting date. The market yield curve for each currency is obtained from external sources for interest and foreign exchange rates. In the absence of sufficient market data, fair values would be based on the quoted market price of similar derivatives. Analysis of these derivatives and the various methods used to calculate their respective fair values is detailed below and in note 30.
For each class of derivative instrument type the fair value amounts are as follows:
2014 2013
Assets£m
Liabilities£m
Total£m
Assets£m
Liabilities£m
Total£m
Interest rate swaps 861 (743) 118 1,282 (1,207) 75Cross-currency interest rate swaps 1,025 (195) 830 900 (160) 740Foreign exchange forward contracts 68 (12) 56 15 (63) (48)Forward rate agreements – – – – (5) (5)Inflation linked swaps 16 (213) (197) 48 (246) (198)
Total 1,970 (1,163) 807 2,245 (1,681) 564
Notes to the consolidated financial statements continued
114 National Grid Annual Report and Accounts 2013/14
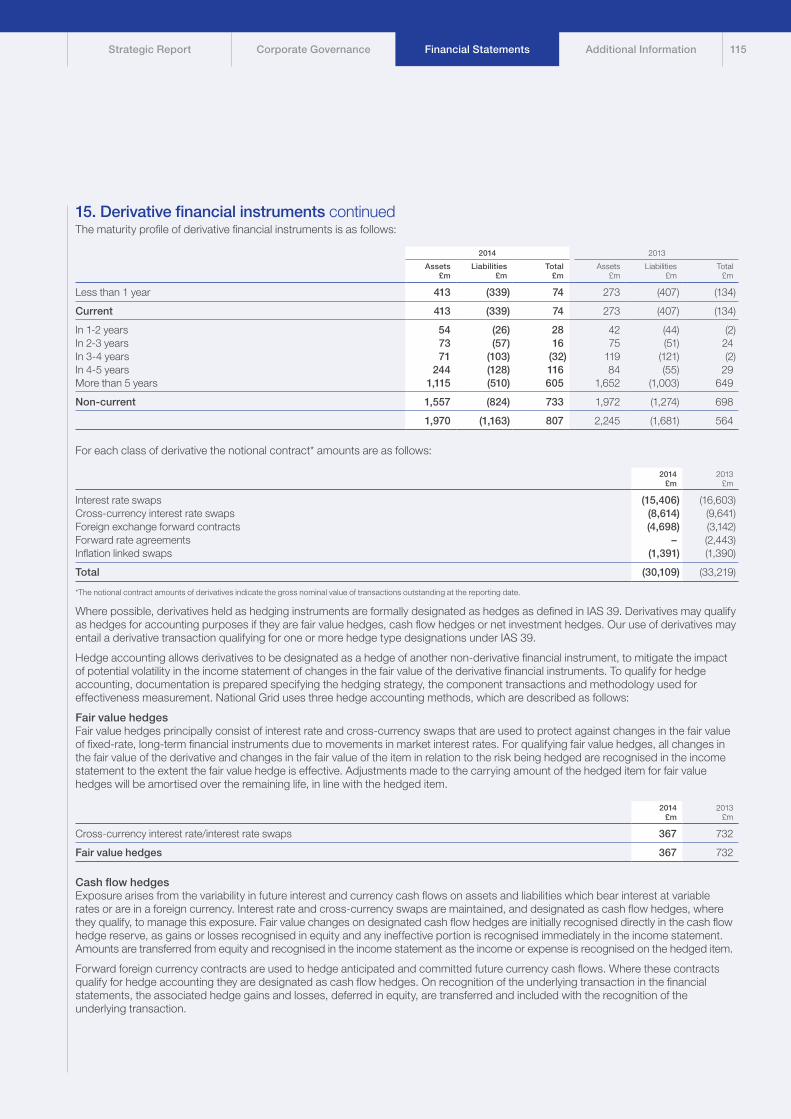
Strategic Report Corporate Governance Financial Statements Additional Information
15. Derivative financial instruments continuedThe maturity profile of derivative financial instruments is as follows:
2014 2013
Assets£m
Liabilities£m
Total£m
Assets£m
Liabilities£m
Total£m
Less than 1 year 413 (339) 74 273 (407) (134)
Current 413 (339) 74 273 (407) (134)
In 1-2 years 54 (26) 28 42 (44) (2)In 2-3 years 73 (57) 16 75 (51) 24In 3-4 years 71 (103) (32) 119 (121) (2)In 4-5 years 244 (128) 116 84 (55) 29More than 5 years 1,115 (510) 605 1,652 (1,003) 649
Non-current 1,557 (824) 733 1,972 (1,274) 698
1,970 (1,163) 807 2,245 (1,681) 564
For each class of derivative the notional contract* amounts are as follows:
2014£m
2013£m
Interest rate swaps (15,406) (16,603)Cross-currency interest rate swaps (8,614) (9,641)Foreign exchange forward contracts (4,698) (3,142)Forward rate agreements – (2,443)Inflation linked swaps (1,391) (1,390)
Total (30,109) (33,219)
*The notional contract amounts of derivatives indicate the gross nominal value of transactions outstanding at the reporting date.
Where possible, derivatives held as hedging instruments are formally designated as hedges as defined in IAS 39. Derivatives may qualify as hedges for accounting purposes if they are fair value hedges, cash flow hedges or net investment hedges. Our use of derivatives may entail a derivative transaction qualifying for one or more hedge type designations under IAS 39.
Hedge accounting allows derivatives to be designated as a hedge of another non-derivative financial instrument, to mitigate the impact of potential volatility in the income statement of changes in the fair value of the derivative financial instruments. To qualify for hedge accounting, documentation is prepared specifying the hedging strategy, the component transactions and methodology used for effectiveness measurement. National Grid uses three hedge accounting methods, which are described as follows:
Fair value hedgesFair value hedges principally consist of interest rate and cross-currency swaps that are used to protect against changes in the fair value of fixed-rate, long-term financial instruments due to movements in market interest rates. For qualifying fair value hedges, all changes in the fair value of the derivative and changes in the fair value of the item in relation to the risk being hedged are recognised in the income statement to the extent the fair value hedge is effective. Adjustments made to the carrying amount of the hedged item for fair value hedges will be amortised over the remaining life, in line with the hedged item.
2014£m
2013£m
Cross-currency interest rate/interest rate swaps 367 732
Fair value hedges 367 732
Cash flow hedgesExposure arises from the variability in future interest and currency cash flows on assets and liabilities which bear interest at variable rates or are in a foreign currency. Interest rate and cross-currency swaps are maintained, and designated as cash flow hedges, where they qualify, to manage this exposure. Fair value changes on designated cash flow hedges are initially recognised directly in the cash flow hedge reserve, as gains or losses recognised in equity and any ineffective portion is recognised immediately in the income statement. Amounts are transferred from equity and recognised in the income statement as the income or expense is recognised on the hedged item.
Forward foreign currency contracts are used to hedge anticipated and committed future currency cash flows. Where these contracts qualify for hedge accounting they are designated as cash flow hedges. On recognition of the underlying transaction in the financial statements, the associated hedge gains and losses, deferred in equity, are transferred and included with the recognition of the underlying transaction.
115

15. Derivative financial instruments continuedCash flow hedges continuedWhen a forecast transaction is no longer expected to occur, the cumulative gain or loss that was reported in equity is transferred to the income statement.
Where a non-financial asset or a non-financial liability results from a forecasted transaction or firm commitment being hedged, the amounts deferred in equity are included in the initial measurement of that non-monetary asset or liability.
2014£m
2013£m
Cross-currency interest rate/interest rate swaps 224 123Foreign exchange forward contracts (11) 1Inflation linked swaps (32) (16)
Cash flow hedges 181 108
Net investment hedgesBorrowings, cross-currency swaps and forward currency contracts are used in the management of the foreign exchange exposure arising from the investment in non-sterling denominated subsidiaries. Where these contracts qualify for hedge accounting they are designated as net investment hedges.
2014£m
2013£m
Cross-currency interest rate swaps 342 (56)Foreign exchange forward contracts 66 (39)
Net investment hedges 408 (95)
The cross-currency swaps and forward foreign currency contracts are hedge accounted using the spot to spot method. The foreign exchange gain or loss on retranslation of the borrowings and the spot to spot movements on the cross-currency swaps and forward currency contracts are transferred to equity to offset gains or losses on translation of the net investment in the non-sterling denominated subsidiaries, with any ineffective portion recognised immediately in the income statement.
Derivatives not in a formal hedge relationshipOur policy is not to use derivatives for trading purposes. However, due to the complex nature of hedge accounting under IAS 39 some derivatives may not qualify for hedge accounting, or are specifically not designated as a hedge where natural offset is more appropriate. Changes in the fair value of any derivative instruments that do not qualify for hedge accounting are recognised in remeasurements within the income statement.
2014£m
2013£m
Cross-currency interest rate/interest rate swaps 15 16Foreign exchange forward contracts 1 (10)Forward rate agreements – (5)Inflation linked swaps (165) (182)
Derivatives not in a formal hedge relationship (149) (181)
Discontinuation of hedge accountingHedge accounting is discontinued when the hedging instrument expires or is sold, terminated, exercised or no longer qualifies for hedge accounting. At that time, any cumulative gains or losses relating to cash flow hedges recognised in equity are initially retained in equity and subsequently recognised in the income statement in the same periods in which the previously hedged item affects net profit or loss. Amounts deferred in equity with respect to net investment hedges are subsequently recognised in the income statement in the event of the disposal of the overseas operations concerned. For fair value hedges, the cumulative adjustment recorded to the carrying value of the hedged item at the date hedge accounting is discontinued is amortised to the income statement using the effective interest method.
Embedded derivativesNo adjustment is made with respect to derivative clauses embedded in financial instruments or other contracts that are defined as closely related to those instruments or contracts. Consequently these embedded derivatives are not accounted for separately from the debt instrument. Where there are embedded derivatives in host contracts not closely related, the embedded derivative is separately accounted for as a derivative financial instrument.
Notes to the consolidated financial statements continued
116 National Grid Annual Report and Accounts 2013/14

Strategic Report Corporate Governance Financial Statements Additional Information
16. Inventories and current intangible assets
Inventories represent assets that we intend to use in order to generate revenue in the short term, either by selling the asset itself (for example fuel stocks) or by using it to fulfil a service to a customer or to maintain our network (consumables).
Inventories are stated at the lower of weighted average cost and net realisable value.
Where applicable, cost comprises direct materials and direct labour costs as well as those overheads that have been incurred in bringing the inventories to their present location and condition.
Emission allowances, principally relating to the emissions of carbon dioxide in the UK and sulphur and nitrous oxides in the US, are recorded as intangible assets within current assets and are initially recorded at cost and subsequently at the lower of cost and net realisable value. Where emission allowances are granted by relevant authorities, cost is deemed to be equal to the fair value at the date of allocation. Receipts of such grants are treated as deferred income, which is recognised in the income statement as the related charges for emissions are recognised or on impairment of the related intangible asset. A provision is recorded in respect of the obligation to deliver emission allowances and emission charges are recognised in the income statement in the period in which emissions are made.
2014£m
2013£m
Fuel stocks 74 114Raw materials and consumables 128 156Work in progress 13 13Current intangible assets – emission allowances 53 8
268 291
There is a provision for obsolescence of £29m against inventories as at 31 March 2014 (2013: £27m).
117

17. Trade and other receivables
Trade and other receivables are amounts which are due from our customers for services (and commodities in the US) we have provided. Other receivables also include prepayments made by us, for example, property lease rentals paid in advance.
Trade, loan and other receivables are initially recognised at fair value and subsequently measured at amortised cost, less any appropriate allowances for estimated irrecoverable amounts. A provision is established for irrecoverable amounts when there is objective evidence that amounts due under the original payment terms will not be collected.
2014£m
2013£m
Trade receivables 1,602 1,325Prepayments and accrued income 1,090 1,421Commodity contract assets 42 42Current tax assets 11 –Other receivables 110 122
2,855 2,910
Trade receivables are non interest-bearing and generally have a 30-90 day term. Due to their short maturities, the fair value of trade and other receivables approximates their book value. Commodity contract assets are recorded at fair value. All other receivables are recorded at amortised cost.
Provision for impairment of receivables2014
£m2013
£m
At 1 April 261 270Exchange adjustments (23) 13Charge for the year, net of recoveries 105 75Uncollectible amounts written off against receivables (94) (97)
At 31 March 249 261
Trade receivables past due but not impaired2014
£m2013
£m
Up to 3 months past due 212 2423 to 6 months past due 69 45Over 6 months past due 65 4
346 291
For further information on our wholesale and retail credit risk, refer to note 30 (a). For further information on our commodity risk, refer to note 30 (e).
Notes to the consolidated financial statements continued
118 National Grid Annual Report and Accounts 2013/14

Strategic Report Corporate Governance Financial Statements Additional Information
18. Cash and cash equivalents
Cash and cash equivalents includes cash balances, together with short-term investments with a maturity of less than three months that are readily convertible to cash.
Net cash and cash equivalents reflected in the cash flow statement are net of bank overdrafts, which are reported in borrowings. The carrying amounts of cash and cash equivalents and bank overdrafts approximate their fair values.
Cash at bank earns interest at floating rates based on daily bank deposit rates. Short-term deposits are made for periods varying between one day and three months, depending on the immediate cash requirements, and earn interest at the respective short-term deposit rates.
Net cash and cash equivalents held in currencies other than sterling have been converted into sterling at year-end exchange rates. For further information on currency exposures, refer to note 30 (d).
2014£m
2013£m
Cash at bank 75 99Short-term deposits 279 572
Cash and cash equivalents excluding bank overdrafts 354 671Bank overdrafts (15) (23)
Net cash and cash equivalents 339 648
At 31 March 2014, £24m (2013: £21m) of cash and cash equivalents were restricted. This primarily relates to cash held in captive insurance companies.
19. Borrowings
We borrow money primarily in the form of bonds and bank loans. These are for a fixed term and may have fixed or floating interest rates or are linked to RPI. As indicated in note 15, we use derivatives to manage risks associated with interest rates and foreign exchange.
Our strategy in actionOur price controls and rate plans require us to fund our networks within a certain ratio of debt to equity and, as a result, we have issued a significant amount of debt. As we continue to invest in our networks, the level of debt is expected to increase over time. To maintain a strong balance sheet and to allow us to access capital markets at commercially acceptable interest rates, we balance the amount of debt we issue with the value of our assets and take account of certain other metrics used by credit rating agencies.
Borrowings, which include interest-bearing and inflation linked debt and overdrafts are recorded at their initial fair value which normally reflects the proceeds received, net of direct issue costs less any repayments. Subsequently these are stated at amortised cost, using the effective interest method. Any difference between the proceeds after direct issue costs and the redemption value is recognised over the term of the borrowing in the income statement using the effective interest method.
The Finance Committee controls refinancing risk by limiting the amount of our debt maturities arising from borrowings in any one year which is demonstrated by our maturity profile.
2014£m
2013£m
CurrentBank loans 1,485 1,194Bonds 1,730 1,761Commercial paper 252 438Finance leases 19 20Other loans 10 12Bank overdrafts 15 23
3,511 3,448
Non-currentBank loans 1,414 1,863Bonds 20,732 22,435Finance leases 151 175Other loans 142 174
22,439 24,647
Total 25,950 28,095
119

19. Borrowings continuedTotal borrowings are repayable as follows:
2014£m
2013£m
Less than 1 year 3,511 3,448In 1-2 years 895 1,872In 2-3 years 1,177 860In 3-4 years 1,661 1,255In 4-5 years 1,509 1,420More than 5 years:
by instalments 175 71other than by instalments 17,022 19,169
25,950 28,095
The fair value of borrowings at 31 March 2014 was £28,131m (2013: £30,792m). Where market values were available, fair value of borrowings (Level 1) was £17,388m (2013: £20,543m). Where market values were not available, fair value of borrowings (Level 2) was £10,743m (2013: £10,249m), calculated by discounting cash flows at prevailing interest rates. The notional amount outstanding of the debt portfolio at 31 March 2014 was £25,539m (2013: £27,391m).
The assets of the Colonial Gas Company and the Niagara Mohawk Power Corporation and certain gas distribution assets of the Narragansett Electric Company are subject to liens and other charges and are provided as collateral over borrowings totalling £438m at 31 March 2014 (2013: £512m).
Collateral is placed with or received from any counterparty where we have entered into a credit support annex to the ISDA Master Agreement once the current mark-to-market valuation of the trades between the parties exceeds an agreed threshold. Included in current bank loans is £843m (2013: £730m) in respect of cash received under collateral agreements. For further details of our borrowing facilities, refer to note 31. For further details of our bonds in issue, please refer to the debt investor section of our website.
Assets held under finance leases are recognised at their fair value or, if lower, the present value of the minimum lease payments on inception. The corresponding liability is recognised as a finance lease obligation within borrowings. Rental payments are apportioned between finance costs and reduction in the finance lease obligation, so as to achieve a constant rate of interest.
Assets held under finance leases are depreciated over the shorter of their useful life and the lease term.
Finance lease obligations2014
£m2013
£m
Gross finance lease liabilities are repayable as follows:Less than 1 year 19 201-5 years 89 109More than 5 years 100 101
208 230
Less: finance charges allocated to future periods (38) (35)
170 195
The present value of finance lease liabilities is as follows:Less than 1 year 19 201-5 years 70 96More than 5 years 81 79
170 195
Notes to the consolidated financial statements continued
120 National Grid Annual Report and Accounts 2013/14

Strategic Report Corporate Governance Financial Statements Additional Information
Unaudited commentary on borrowingsAs at 31 March 2014, total borrowings of £25,950m (2013: £28,095m) including bonds, bank loans, commercial paper, collateral, finance leases and other debt had decreased by £2,145m primarily representing maturity and redemption of debt during the year. We expect to repay £3,511m of our total borrowings in the next 12 months including commercial paper, collateral and interest, and we expect to be able to refinance this borrowing through the capital and money markets.
The maturity profile of long-term debt in our major entities is illustrated below:
National Grid long-term debt maturity profile£m
14/15
15/16
16/17
17/18
18/19
19/20
20/211
21/22
22/23
23/24
24/25
25/261
26/27
27/28
28/29
29/30
30/31
31/32
32/33
33/34
34/35
35/36
36/37
37/38
38/39
39/40
40/41
41/42
42/43
43/44
44/45
45/46
46/47
47/48
48/49
49/50
50/51
51/52
52/53
53/54
54/55
55/56
56/57
57/58
58/59
2000 400 600 800 1,000 1,200 1,400 1,600 1,800 2,000
National Grid Gas Group National Grid Electricity Transmission National Grid plc/NGG Finance National Grid USA/National Grid North America National Grid USA operating companies Grain LNG
1. Includes hybrid bonds at first callable date (euro: 2020; sterling: 2025). Actual maturity of these bonds is euro: 2076; sterling: 2073.
Further information on our bonds can be found in the debt investor section of our website.
This unaudited commentary does not form part of the financial statements.
121

20. Trade and other payables
Trade and other payables includes amounts owed to suppliers, tax authorities and other parties which are due to be settled within 12 months. The total also includes deferred income, which represents monies received from customers but for which we have not yet completed the associated service. These amounts are recognised as revenue when the service is provided.
Trade payables are initially recognised at fair value and subsequently measured at amortised cost.
2014£m
2013£m
Trade payables 1,942 2,033Deferred income 224 155Commodity contract liabilities 77 69Social security and other taxes 146 131Other payables 642 663
3,031 3,051
Due to their short maturities, the fair value of trade and other payables approximates their book value. Commodity contract liabilities are recorded at fair value. All other trade and other payables are recorded at amortised cost.
21. Other non-current liabilities
Other non-current liabilities includes deferred income which will not be recognised as income until after 31 March 2015. It also includes payables that are not due until after that date.
2014£m
2013£m
Deferred income 1,605 1,579Commodity contract liabilities 46 70Other payables 190 235
1,841 1,884
Commodity contract liabilities are recorded at fair value. All other non-current liabilities are recorded at amortised cost. There is no material difference between the fair value and the carrying value of other non-current liabilities.
22. Pensions and other post-retirement benefits
Substantially all our employees are members of either DB or DC pension plans. The principal UK plans are the National Grid UK Pension Scheme, the National Grid Electricity Group of the Electricity Supply Pension Scheme and The National Grid YouPlan. In the US, we have a number of plans and also provide healthcare and life insurance benefits to eligible retired US employees.
The fair value of associated plan assets and present value of DB obligations are updated annually. For further details and the actuarial assumptions used to value the obligations, see note 29.
With the adoption of IAS 19 (revised), we have increased our disclosures by separately presenting our UK and US pension plans to show geographical split.
Below we provide a more detailed analysis of the amounts recorded in the primary financial statements.
For DC plans, the Group pays contributions into separate funds on behalf of the employee and has no further obligations to employees. The risks associated with this type of plan are assumed by the member.
For DB retirement plans, members receive benefits on retirement, the value of which is dependent on factors such as salary and length of pensionable service. The Group underwrites both financial and demographic risks associated with this type of plan.
The cost of providing benefits in a DB plan is determined using the projected unit method, with actuarial valuations being carried out at each reporting date by a qualified actuary. This valuation method is an accrued benefits valuation method that makes allowance for projected earnings.
The Group’s obligation in respect of DB pension plans is calculated separately for each plan by projecting the estimated amount of future benefit payments that employees have earned for their pensionable service in the current and prior periods. These future benefit payments are discounted to determine the present value of the liabilities and the fair value of plan assets and any unrecognised past service cost is then deducted. The discount rate used is the yield at the valuation date on high-quality corporate bonds.
Notes to the consolidated financial statements continued
122 National Grid Annual Report and Accounts 2013/14

Strategic Report Corporate Governance Financial Statements Additional Information
22. Pensions and other post-retirement benefits continuedThe Group takes advice from independent actuaries relating to the appropriateness of any key assumptions applied which include life expectancy of members, expected salary and pension increases, and inflation. It should be noted that comparatively small changes in the assumptions used may have a significant effect on the amounts recognised in the income statement and the statement of other comprehensive income and the net liability recognised in the statement of financial position.
Remeasurements of net retirement obligations are recognised in full in the period in which they occur in the statement of other comprehensive income.
RisksThe DB pension obligations and other post-retirement benefit liabilities are exposed to the primary risks outlined below.
Liabilities are calculated using discount rates set with reference to yields on high-quality corporate bonds prevailing in the US and UK debt markets and will fluctuate as yields change. Plan funds are invested in a variety of asset classes, principally: equities, government securities, corporate bonds and property. Consequently, actual returns will differ from the underlying discount rate adopted and therefore have an impact on the net balance sheet liability.
Changes in inflation will affect both current and future pension payments and are partially mitigated through investment in inflation matching assets and hedging instruments.
Longevity is also a key driver of liabilities and changes in expected mortality will have a direct impact on liabilities. The liabilities are, in aggregate, relatively mature which serves to mitigate this risk to some extent.
Each plan’s investment strategy seeks to balance the level of investment return sought with the aim of reducing volatility and risk. In undertaking this approach reference is made both to the maturity of the liabilities and the funding level of that plan. A number of further strategies are employed to manage underlying risks, including liability matching asset strategies, diversification of asset portfolios, interest rate hedging and active management of foreign exchange exposure.
Amounts recognised in the statement of financial positionUK pensions US pensions US other post-retirement benefits
2014£m
2013(restated)1
£m
2012(restated)1
£m2014
£m
2013(restated)1
£m
2012(restated)1
£m2014
£m
2013(restated)1
£m
2012(restated)1
£m
Present value of funded obligations (18,100) (18,495) (16,719) (4,566) (4,915) (4,424) (2,680) (3,020) (2,630)Fair value of plan assets 17,409 17,392 16,107 4,229 4,378 3,850 1,620 1,515 1,192
(691) (1,103) (612) (337) (537) (574) (1,060) (1,505) (1,438)Present value of unfunded obligations (62) (66) (56) (186) (200) (187) – – –Other post-employment liabilities – – – – (3) (5) (75) (83) (66)
Net defined benefit liability (753) (1,169) (668) (523) (740) (766) (1,135) (1,588) (1,504)
Represented by:Liabilities (753) (1,169) (668) (697) (935) (921) (1,135) (1,588) (1,504)Assets – – – 174 195 155 – – –
(753) (1,169) (668) (523) (740) (766) (1,135) (1,588) (1,504)
1. See note 1 on page 92.
123

Notes to the consolidated financial statements continued
22. Pensions and other post-retirement benefits continuedAmounts recognised in the income statement and the statement of other comprehensive income
UK pensions US pensions US other post-retirement benefits
2014£m
2013(restated)1
£m
2012(restated)1
£m2014
£m
2013(restated)1
£m
2012(restated)1
£m2014
£m
2013(restated)1
£m
2012(restated)1
£m
Included within operating costsAdministration costs 6 6 6 5 4 5 1 2 1
Included within payroll costsDefined contribution scheme costs 19 16 13 21 23 25 – – –Defined benefit scheme costs
Current service cost 96 90 84 85 87 75 44 43 37Past service cost – augmentations 15 2 2 – – – – – –Past service (credit)/cost –
redundancies (19) (7) (6) – – 19 – – 23Past service credit – plan
amendments (11) – – – – – – – –Special termination benefit cost
– redundancies 39 20 19 – – – – – –
139 121 112 106 110 119 44 43 60
Included within exceptional itemsLIPA MSA transition – – – (16) – – (198) – –Net (gain)/loss on disposal
of businesses – – (6) – 3 – – 1 –
– – (6) (16) 3 – (198) 1 –
Included within finance income and costs
Net interest cost 47 31 1 27 34 26 54 70 76
Total included in income statement 192 158 113 122 151 150 (99) 116 137
Remeasurements of net retirement benefit obligations 354 (560) (676) 81 (35) (367) 50 (119) (97)
Exchange adjustments – – – 60 (37) (2) 126 (75) (6)
Total included in the statement of other comprehensive income 354 (560) (676) 141 (72) (369) 176 (194) (103)
1. See note 1 on page 92.
Reconciliation of the net defined benefit liabilityUK pensions US pensions US other post-retirement benefits
2014£m
2013(restated)1
£m
2012(restated)1
£m2014
£m
2013(restated)1
£m
2012(restated)1
£m2014
£m
2013(restated)1
£m
2012(restated)1
£m
Opening net defined benefit liability (1,169) (668) (90) (740) (766) (484) (1,588) (1,504) (1,452)(Cost)/credit recognised in the
income statement (173) (142) (100) (101) (128) (125) 99 (116) (137)Remeasurement effects recognised
in the statement of other comprehensive income 354 (560) (676) 141 (72) (369) 176 (194) (103)
Employer contributions 235 201 198 174 224 217 187 262 198Other movements – – – 3 2 (5) (9) (36) (10)
Closing net defined benefit liability (753) (1,169) (668) (523) (740) (766) (1,135) (1,588) (1,504)
1. See note 1 on page 92.
124 National Grid Annual Report and Accounts 2013/14

Strategic Report Corporate Governance Financial Statements Additional Information
22. Pensions and other post-retirement benefits continuedUK pensions US pensions US other post-retirement benefits
2014£m
2013(restated)1
£m
2012(restated)1
£m2014
£m
2013(restated)1
£m
2012(restated)1
£m2014
£m
2013(restated)1
£m
2012(restated)1
£m
Changes in the present value of defined benefit obligations (including unfunded obligations)
Opening defined benefit obligations (18,561) (16,775) (15,443) (5,115) (4,611) (4,037) (3,020) (2,630) (2,458)Current service cost (96) (90) (84) (85) (87) (75) (44) (43) (37)Interest cost (780) (788) (830) (221) (232) (233) (123) (133) (140)Actuarial gains/(losses) – experience 16 74 (112) (22) 1 (13) 47 60 71Actuarial losses – demographic
assumptions – – – (129) 5 (64) (154) (18) (84)Actuarial gains/(losses) – financial
assumptions 436 (1,765) (1,062) 57 (245) (422) 49 (218) (70)Past service credit/(cost) –
redundancies 19 7 6 16 36 (19) 119 5 (23)Special termination benefit cost –
redundancies (39) (20) (13) – – – – – –Past service cost – augmentations (15) (2) (2) – – – – – –Past service credit – plan amendments 11 – – – – – 19 – –Transfers in – – 1 – – – – – –Medicare subsidy received – – – – – – (17) (19) (6)Liabilities extinguished on settlements – – – – – – 60 – –Employee contributions (2) (3) (3) – – – – – –Benefits paid 849 801 767 291 269 268 117 123 127Transferred to liabilities of businesses
held for sale – – – – – 3 – – 2Exchange adjustments – – – 456 (251) (19) 267 (147) (12)
Closing defined benefit obligations (18,162) (18,561) (16,775) (4,752) (5,115) (4,611) (2,680) (3,020) (2,630)
Changes in the fair value of plan assets
Opening fair value of plan assets 17,392 16,107 15,353 4,378 3,850 3,550 1,515 1,192 1,066Interest income 733 757 829 194 198 207 69 63 64Return on assets (less)/greater
than assumed (98) 1,131 498 175 204 132 108 57 (14)Administration costs (6) (6) (6) (5) (4) (5) (1) (2) (1)Transfers out – – (1) – – – – – –Employer contributions 235 201 198 174 224 217 187 262 198Employee contributions 2 3 3 – – – – – –Benefits paid (849) (801) (767) (291) (269) (268) (117) (123) (127)Assets distributed in settlements
and transfers – – – – (39) – – (6) –Exchange adjustments – – – (396) 214 17 (141) 72 6
Closing fair value of plan assets 17,409 17,392 16,107 4,229 4,378 3,850 1,620 1,515 1,192
Actual return on plan assets 635 1,888 1,327 369 402 339 177 120 50
Expected contributions to plans in the following year 182 181 129 118 183 224 109 196 248
1. See note 1 on page 92.
125

23. Provisions
We make provisions when an obligation exists, resulting from a past event and it is probable that cash will be paid to settle it, but the exact amount of cash required can only be estimated.
The main estimates relate to environmental remediation and decommissioning costs for various sites we own or have owned and other provisions, including restructuring plans and lease contracts we have entered into that are now loss making.
Our strategy in actionWe are committed to the protection and enhancement of the environment. However, we have acquired, owned and operated a number of businesses which have, during the course of their operations, created an environmental impact. Therefore we have a provision that reflects the expected cost to remediate these sites. Current operations will seldom result in new sites with significant expected costs being added to the provision.
Provisions are recognised where a legal or constructive obligation exists at the reporting date, as a result of a past event, where the amount of the obligation can be reliably estimated and where the outflow of economic benefit is probable.
Provision is made for decommissioning and environmental costs, based on future estimated expenditures, discounted to present values. An initial estimate of decommissioning and environmental costs attributable to property, plant and equipment is recorded as part of the original cost of the related property, plant and equipment.
Changes in the provision arising from revised estimates or discount rates or changes in the expected timing of expenditures that relate to property, plant and equipment are recorded as adjustments to their carrying value and depreciated prospectively over their remaining estimated useful economic lives; otherwise such changes are recognised in the income statement.
The unwinding of the discount is included within the income statement as a financing charge.
Environmental£m
Decommissioning£m
Restructuring£m
Emissions£m
Other£m
Totalprovisions
£m
At 1 April 2012 1,158 112 70 23 368 1,731Exchange adjustments 45 5 – 1 14 65Additions 92 – 31 1 83 207Unused amounts reversed (55) (20) (5) (3) (4) (87)Unwinding of discount 59 – – – 16 75Utilised (101) (16) (43) (14) (57) (231)
At 31 March 2013 1,198 81 53 8 420 1,760Exchange adjustments (79) (7) – (1) (25) (112)Additions 11 84 86 7 42 230Unused amounts reversed (14) – (1) – (3) (18)Unwinding of discount 57 – – – 16 73Utilised (101) (14) (59) – (114) (288)
At 31 March 2014 1,072 144 79 14 336 1,645
2014£m
2013£m
Current 282 308Non-current 1,363 1,452
1,645 1,760
Notes to the consolidated financial statements continued
126 National Grid Annual Report and Accounts 2013/14

Strategic Report Corporate Governance Financial Statements Additional Information
23. Provisions continuedEnvironmental provisionThe environmental provision represents the estimated restoration and remediation costs relating to a number of sites owned and managed by subsidiary undertakings, together with certain US sites that National Grid no longer owns. The environmental provision is as follows:
2014 2013
Discounted£m
Undiscounted£m
Realdiscount
rateDiscounted
£mUndiscounted
£m
Realdiscount
rate
UK sites1 286 367 2% 302 397 2%US sites2 786 891 2% 896 1,014 2%
1,072 1,258 1,198 1,411
1. The remediation expenditure in the UK relates to old gas manufacturing sites and also to electricity transmission sites. Cash flows are expected to be incurred between 2014 and 2067. A number of uncertainties affect the calculation of the provision, including the impact of regulation, accuracy of the site surveys, unexpected contaminants, transportation costs, the impact of alternative technologies and changes in the discount rate. This provision incorporates our best estimate of the financial effect of these uncertainties, but future material changes in any of the assumptions could have a material impact on the calculation of the provision. The undiscounted amount is the undiscounted best estimate of the liability having regard to these uncertainties.
2. The remediation expenditure in the US is expected to be incurred between 2014 and 2059. The uncertainties regarding the calculation of this provision are similar to those considered in respect of UK sites. However, unlike the UK, with the exception of immaterial amounts of such costs, this expenditure is expected to be largely recoverable from ratepayers under the terms of various rate agreements in the US.
Decommissioning provisionThe decommissioning provision primarily represents both £55m (2013: £69m) of expenditure relating to asset retirement obligations expected to be incurred until 2058, and £72m (2013: £nil) of expenditure relating to the demolition of gas holders expected to be incurred until 2022. It also includes the net present value of the estimated expenditure (discounted at a real rate of 2%) expected to be incurred until 2038 in respect of the decommissioning of certain US nuclear generating units that National Grid no longer owns.
Restructuring provisionThe restructuring provision principally relates to business reorganisation costs in the UK and the US and is expected to be incurred until 2021.
Emissions provisionThe provision for emission costs is expected to be settled using emission allowances granted.
Other provisionsIncluded within other provisions at 31 March 2014 are amounts provided in respect of onerous lease commitments and rates payable on surplus properties of £117m (2013: £165m) with expenditure expected to be incurred until 2018.
Other provisions also include £160m (2013: £174m) of estimated liabilities in respect of past events insured by insurance subsidiary undertakings, including employer liability claims. In accordance with insurance industry practice, these estimates are based on experience from previous years and there is, therefore, no identifiable payment date. It also includes £13m (2013: £13m) in respect of obligations associated with investments in joint ventures.
127

24. Share capital
Ordinary share capital represents the total number of shares issued which are publicly traded. We also disclose the number of treasury shares the Company holds, which are shares that the Company has bought itself, predominantly to satisfy employee share option plan liabilities.
Share capital is accounted for as an equity instrument. An equity instrument is any contract that includes a residual interest in the consolidated assets of the Company after deducting all its liabilities and is recorded at the proceeds received, net of direct issue costs, with an amount equal to the nominal amount of the shares issued included in the share capital account and the balance recorded in the share premium account.
Allotted, called upand fully paid
millions £m
At 1 April 2012 3,701 422Issued during the year in lieu of dividends1 94 11
At 31 March 2013 3,795 433Issued during the year in lieu of dividends1 59 6
At 31 March 2014 3,854 439
1. The issue of shares in lieu of dividends is considered to be a bonus issue under the terms of the Companies Act 2006 and the nominal value of the shares is charged to the share premium account.
The share capital of the Company consists of ordinary shares of 1117⁄43 pence nominal value each including ADSs. The ordinary and ADSs allow holders to receive dividends and vote at general meetings of the Company. The Company holds treasury shares but may not exercise any rights over these shares including the entitlement to vote or receive dividends. There are no restrictions on the transfer or sale of ordinary shares.
In line with the provisions of the Companies Act 2006, the Company has amended its Articles of Association and ceased to have authorised share capital.
Treasury sharesAt 31 March 2014, the Company held 124m (2013: 129m) of its own shares. The market value of these shares as at 31 March 2014 was £1,019m (2013: £989m).
The maximum number of shares held during the year was 129m ordinary shares (2013: 135m) representing approximately 3.4% (2013: 3.6%) of the ordinary shares in issue as at 31 March 2014 and having a nominal value of £15m (2013: £15m).
Notes to the consolidated financial statements continued
128 National Grid Annual Report and Accounts 2013/14
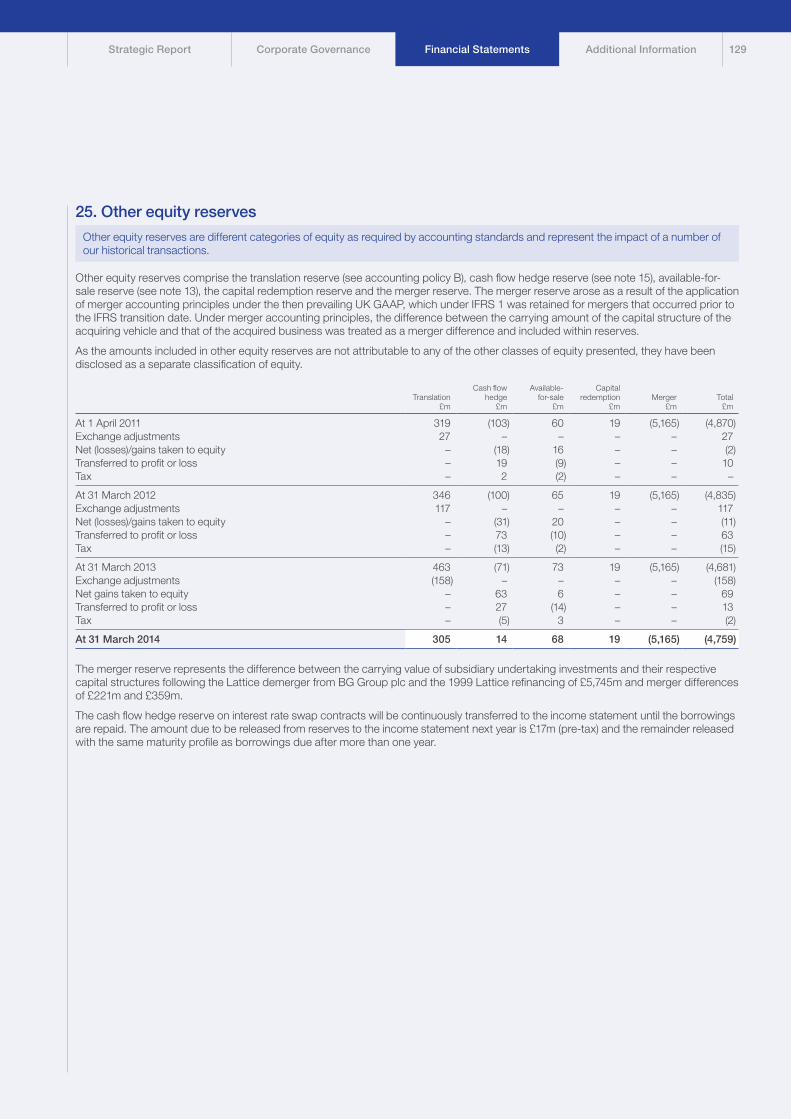
Strategic Report Corporate Governance Financial Statements Additional Information
25. Other equity reserves
Other equity reserves are different categories of equity as required by accounting standards and represent the impact of a number of our historical transactions.
Other equity reserves comprise the translation reserve (see accounting policy B), cash flow hedge reserve (see note 15), available-for-sale reserve (see note 13), the capital redemption reserve and the merger reserve. The merger reserve arose as a result of the application of merger accounting principles under the then prevailing UK GAAP, which under IFRS 1 was retained for mergers that occurred prior to the IFRS transition date. Under merger accounting principles, the difference between the carrying amount of the capital structure of the acquiring vehicle and that of the acquired business was treated as a merger difference and included within reserves.
As the amounts included in other equity reserves are not attributable to any of the other classes of equity presented, they have been disclosed as a separate classification of equity.
Translation£m
Cash flowhedge
£m
Available-for-sale
£m
Capitalredemption
£mMerger
£mTotal
£m
At 1 April 2011 319 (103) 60 19 (5,165) (4,870)Exchange adjustments 27 – – – – 27Net (losses)/gains taken to equity – (18) 16 – – (2)Transferred to profit or loss – 19 (9) – – 10Tax – 2 (2) – – –
At 31 March 2012 346 (100) 65 19 (5,165) (4,835)Exchange adjustments 117 – – – – 117Net (losses)/gains taken to equity – (31) 20 – – (11)Transferred to profit or loss – 73 (10) – – 63Tax – (13) (2) – – (15)
At 31 March 2013 463 (71) 73 19 (5,165) (4,681)Exchange adjustments (158) – – – – (158)Net gains taken to equity – 63 6 – – 69Transferred to profit or loss – 27 (14) – – 13Tax – (5) 3 – – (2)
At 31 March 2014 305 14 68 19 (5,165) (4,759)
The merger reserve represents the difference between the carrying value of subsidiary undertaking investments and their respective capital structures following the Lattice demerger from BG Group plc and the 1999 Lattice refinancing of £5,745m and merger differences of £221m and £359m.
The cash flow hedge reserve on interest rate swap contracts will be continuously transferred to the income statement until the borrowings are repaid. The amount due to be released from reserves to the income statement next year is £17m (pre-tax) and the remainder released with the same maturity profile as borrowings due after more than one year.
129

26. Net debt
Net debt represents the amount of borrowings and overdrafts, less cash, financial investments and related derivatives.
Funding and liquidity risk management is carried out by the treasury function under policies and guidelines approved by the Finance Committee of the Board. The Finance Committee is responsible for the regular review and monitoring of treasury activity and for the approval of specific transactions, the authority for which falls outside the delegation of authority to management.
The primary objective of the treasury function is to manage our funding and liquidity requirements. A secondary objective is to manage the associated financial risks, in the form of interest rate risk and foreign exchange risk, to within pre-authorised parameters. Details of the main risks arising from our financing and commodity hedging activities can be found in the risk factors discussion starting on page 167 and in note 30 to the consolidated financial statements on pages 137 to 144.
Investment of surplus funds, usually in short-term fixed deposits or placements with money market funds that invest in highly liquid instruments of high credit quality, is subject to our counterparty risk management policy.
The movement in cash and cash equivalents is reconciled to movements in net debt.
(a) Reconciliation of net cash flow to movement in net debt2014
£m2013
£m2012
£m
(Decrease)/increase in cash and cash equivalents (283) 335 (43)(Decrease)/increase in financial investments (1,720) 2,992 (553)Decrease/(increase) in borrowings and related derivatives 1,021 (4,304) 154Net interest paid on the components of net debt 841 756 721
Change in debt resulting from cash flows (141) (221) 279Changes in fair value of financial assets and liabilities and exchange movements 1,360 (536) (87)Net interest charge on the components of net debt (1,053) (1,017) (1,042)Reclassified as held for sale – – (2)Extinguishment of debt resulting from LIPA MSA transition (note 4) 98 – –Other non-cash movements (25) (58) (14)
Movement in net debt (net of related derivative financial instruments) in the year 239 (1,832) (866)Net debt (net of related derivative financial instruments) at start of year (21,429) (19,597) (18,731)
Net debt (net of related derivative financial instruments) at end of year (21,190) (21,429) (19,597)
Composition of net debtNet debt is made up as follows:
2014£m
2013£m
2012£m
Cash, cash equivalents and financial investments 3,953 6,102 2,723Borrowings and bank overdrafts (25,950) (28,095) (23,025)Derivatives 807 564 705
Total net debt (21,190) (21,429) (19,597)
Notes to the consolidated financial statements continued
130 National Grid Annual Report and Accounts 2013/14

Strategic Report Corporate Governance Financial Statements Additional Information
26. Net debt continued(b) Analysis of changes in net debt
Cashand cash
equivalents£m
Bankoverdrafts
£m
Net cashand cash
equivalents£m
Financialinvestments
£mBorrowings
£mDerivatives
£mTotal1
£m
At 1 April 2011 384 (42) 342 2,939 (23,156) 1,144 (18,731)Cash flow (52) 9 (43) (577) 1,343 (444) 279Fair value gains and losses and exchange movements – – – 8 22 (117) (87)Interest income/(charges) – – – 23 (1,187) 122 (1,042)Reclassified as held for sale – – – (2) – – (2)Other non-cash movements – – – – (14) – (14)
At 31 March 2012 332 (33) 299 2,391 (22,992) 705 (19,597)Cash flow 325 10 335 2,963 (3,433) (86) (221)Fair value gains and losses and exchange movements 14 – 14 47 (452) (145) (536)Interest income/(charges) – – – 30 (1,137) 90 (1,017)Other non-cash movements – – – – (58) – (58)
At 31 March 2013 671 (23) 648 5,431 (28,072) 564 (21,429)Cash flow (291) 8 (283) (1,755) 2,009 (112) (141)Fair value gains and losses and exchange movements (26) – (26) (113) 1,223 276 1,360Interest income/(charges) – – – 36 (1,168) 79 (1,053)Extinguishment of debt resulting from LIPA MSA transition
(note 4) – – – – 98 – 98Other non-cash movements – – – – (25) – (25)
At 31 March 2014 354 (15) 339 3,599 (25,935) 807 (21,190)
Balances at 31 March 2014 comprise:Non-current assets – – – – – 1,557 1,557Current assets 354 – 354 3,599 – 413 4,366Current liabilities – (15) (15) – (3,496) (339) (3,850)Non-current liabilities – – – – (22,439) (824) (23,263)
354 (15) 339 3,599 (25,935) 807 (21,190)
1. Includes accrued interest at 31 March 2014 of £239m (2013: £250m).
131

This section includes information that is important to enable a full understanding of our financial position, particularly areas of potential risk that could affect us in the future.
We also include specific disclosures for British Transco Finance Inc., Niagara Mohawk Power Corporation and National Grid Gas plc in accordance with various rules including Rule 3-10 of Regulation S-X (a US SEC requirement), as they have issued public debt securities which have been guaranteed by National Grid plc and one of its subsidiary companies, National Grid Gas plc. Additional disclosures have also been included in respect of the two guarantor companies. These disclosures are in lieu of publishing separate financial statements for these companies. See note 34 for further information.
27. Commitments and contingencies
Commitments are those amounts that we are contractually required to pay in the future as long as the other party meets its obligations. These commitments primarily relate to operating lease rentals, energy purchase agreements and contracts for the repurchase of network assets which, in many cases, extend over a long period of time. We also disclose any contingencies, which include guarantees that companies have given, where we pledge assets against obligations that will remain for a specific period.
2014£m
2013£m
Future capital expenditureContracted for but not provided 2,624 3,011
Operating lease commitmentsLess than 1 year 84 109In 1-2 years 76 84In 2-3 years 70 74In 3-4 years 66 72In 4-5 years 56 70More than 5 years 278 333
630 742
Energy purchase commitments1
Less than 1 year 1,103 1,094In 1-2 years 481 535In 2-3 years 356 394In 3-4 years 279 306In 4-5 years 235 263More than 5 years 1,083 1,403
3,537 3,995
Guarantees and letters of creditGuarantee of sublease for US property (expires 2040) 232 293Guarantees of certain obligations of Grain LNG Import Terminal (expire up to 2028) 155 159Guarantee of certain obligations for construction of HVDC West Coast Link (expected expiry 2016) 594 618Other guarantees and letters of credit (various expiry dates) 271 262
1,252 1,332
1. Energy purchase commitments relate to contractual commitments to purchase electricity or gas that are used to satisfy physical delivery requirements to our customers or for energy that we use ourselves (ie normal purchase, sale or usage) and hence are accounted for as ordinary purchase contracts. Details of commodity contracts that do not meet the normal purchase, sale or usage criteria, and hence are accounted for as derivative contracts, are shown in note 30 (e) on page 142.
The total of future minimum sublease payments expected to be received under non-cancellable subleases is £21m (2013: £23m).
Through the ordinary course of our operations, we are party to various litigation, claims and investigations. We do not expect the ultimate resolution of any of these proceedings to have a material adverse effect on our results of operations, cash flows or financial position.
Notes to the consolidated financial statements– supplementary information
132 National Grid Annual Report and Accounts 2013/14
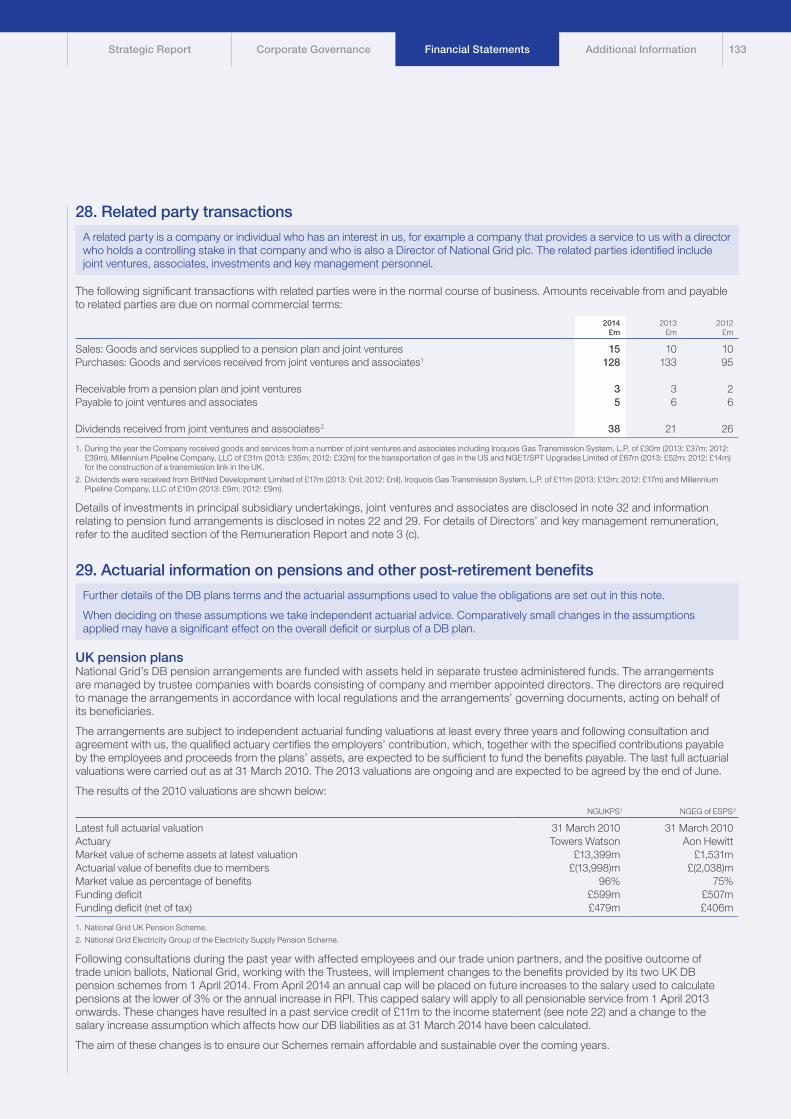
Strategic Report Corporate Governance Financial Statements Additional Information
28. Related party transactions
A related party is a company or individual who has an interest in us, for example a company that provides a service to us with a director who holds a controlling stake in that company and who is also a Director of National Grid plc. The related parties identified include joint ventures, associates, investments and key management personnel.
The following significant transactions with related parties were in the normal course of business. Amounts receivable from and payable to related parties are due on normal commercial terms:
2014£m
2013£m
2012£m
Sales: Goods and services supplied to a pension plan and joint ventures 15 10 10Purchases: Goods and services received from joint ventures and associates1 128 133 95
Receivable from a pension plan and joint ventures 3 3 2Payable to joint ventures and associates 5 6 6
Dividends received from joint ventures and associates2 38 21 26
1. During the year the Company received goods and services from a number of joint ventures and associates including Iroquois Gas Transmission System, L.P. of £30m (2013: £37m; 2012: £39m), Millennium Pipeline Company, LLC of £31m (2013: £35m; 2012: £32m) for the transportation of gas in the US and NGET/SPT Upgrades Limited of £67m (2013: £52m; 2012: £14m) for the construction of a transmission link in the UK.
2. Dividends were received from BritNed Development Limited of £17m (2013: £nil; 2012: £nil), Iroquois Gas Transmission System, L.P. of £11m (2013: £12m; 2012: £17m) and Millennium Pipeline Company, LLC of £10m (2013: £9m; 2012: £9m).
Details of investments in principal subsidiary undertakings, joint ventures and associates are disclosed in note 32 and information relating to pension fund arrangements is disclosed in notes 22 and 29. For details of Directors’ and key management remuneration, refer to the audited section of the Remuneration Report and note 3 (c).
29. Actuarial information on pensions and other post-retirement benefits
Further details of the DB plans terms and the actuarial assumptions used to value the obligations are set out in this note.
When deciding on these assumptions we take independent actuarial advice. Comparatively small changes in the assumptions applied may have a significant effect on the overall deficit or surplus of a DB plan.
UK pension plansNational Grid’s DB pension arrangements are funded with assets held in separate trustee administered funds. The arrangements are managed by trustee companies with boards consisting of company and member appointed directors. The directors are required to manage the arrangements in accordance with local regulations and the arrangements’ governing documents, acting on behalf of its beneficiaries.
The arrangements are subject to independent actuarial funding valuations at least every three years and following consultation and agreement with us, the qualified actuary certifies the employers’ contribution, which, together with the specified contributions payable by the employees and proceeds from the plans’ assets, are expected to be sufficient to fund the benefits payable. The last full actuarial valuations were carried out as at 31 March 2010. The 2013 valuations are ongoing and are expected to be agreed by the end of June.
The results of the 2010 valuations are shown below:
NGUKPS1 NGEG of ESPS2
Latest full actuarial valuation 31 March 2010 31 March 2010Actuary Towers Watson Aon HewittMarket value of scheme assets at latest valuation £13,399m £1,531mActuarial value of benefits due to members £(13,998)m £(2,038)mMarket value as percentage of benefits 96% 75%Funding deficit £599m £507mFunding deficit (net of tax) £479m £406m
1. National Grid UK Pension Scheme.
2. National Grid Electricity Group of the Electricity Supply Pension Scheme.
Following consultations during the past year with affected employees and our trade union partners, and the positive outcome of trade union ballots, National Grid, working with the Trustees, will implement changes to the benefits provided by its two UK DB pension schemes from 1 April 2014. From April 2014 an annual cap will be placed on future increases to the salary used to calculate pensions at the lower of 3% or the annual increase in RPI. This capped salary will apply to all pensionable service from 1 April 2013 onwards. These changes have resulted in a past service credit of £11m to the income statement (see note 22) and a change to the salary increase assumption which affects how our DB liabilities as at 31 March 2014 have been calculated.
The aim of these changes is to ensure our Schemes remain affordable and sustainable over the coming years.
133

29. Actuarial information on pensions and other post-retirement benefits continuedNational Grid UK Pension SchemeThe 2010 actuarial funding valuation showed that, based on long-term financial assumptions, the contribution rate required to meet future benefit accrual was 35% of pensionable earnings (32% by employers and 3% by employees). In addition, National Grid makes payments to the scheme to cover administration costs and the Pension Protection Fund levy. The employer contribution rate and administration costs are being reviewed as part of the 2013 valuation.
Following the 2010 valuation, National Grid and the Trustees agreed a recovery plan which would see the funding deficit repaid by 31 March 2027. Under the schedule of contributions, no deficit contributions were made in 2010/11 or 2011/12. Annual payments of £47m, rising in line with the RPI from March 2010, commenced in 2012/13 and (subject to the current valuation discussions) are due to continue until 2027. As part of the initial 2013 valuation discussions with the Trustees an additional payment of £6m was paid in March 2014.
As part of the 2010 agreement, National Grid has established security account arrangements with a charge in favour of the Trustees. The value of the assets in the security account at 31 March 2014 was approximately £199m. The assets in the security account will be paid to the scheme in the event that National Grid Gas plc (NGG) is subject to an insolvency event, or is given notice of less than 12 months that Ofgem intends to revoke its licence under the Gas Act 1986. The assets in the security account will be released back to National Grid if the scheme moves into surplus.
This scheme ceased to allow new hires to join from 1 April 2002. A DC section of the scheme was offered for employees joining after this date, which closed to future contributions on 31 October 2013 and was replaced by The National Grid YouPlan (see below).
National Grid Electricity Group of the Electricity Supply Pension SchemeThe 2010 actuarial funding valuation showed that, based on long-term financial assumptions, the contribution rate required to meet future benefit accrual was 29.6% of pensionable earnings (23.7% by employers and an average of 5.9% by employees). The employer contribution rate is being reviewed as part of the 2013 valuation.
Following the 2010 valuation, National Grid and the Trustees agreed a recovery plan that would see the funding deficit repaid by 31 March 2027. Under the schedule of contributions, payments of £45m were made in 2010/11 and 2011/12 and a further payment of £38m was made in 2012/13. Thereafter annual payments of £38m rising in line with RPI are due to continue until 2027. The actual payment made in 2013/14 was £45m which included an additional payment of £7m following initial 2013 valuation discussions with the Trustees. A further £35m paid in 2011/12 to support a de-risking initiative has been recognised from a funding perspective during 2013/14.
As part of this agreement, National Grid has established security account arrangements with a charge in favour of the Trustees. The value of the assets in the security account at 31 March 2014 was approximately £35m. The assets in the security account will be paid to the scheme in the event that National Grid Electricity Transmission plc (NGET) is subject to an insolvency event, or ceases to hold a licence granted under the Electricity Act 1989. The assets in the security account will be released back to National Grid if the scheme moves into surplus.
National Grid has also agreed to make a payment in respect of the deficit up to a maximum of £220m should certain triggers be breached; namely if NGET ceases to hold the licence granted under the Electricity Act 1989 or NGET’s credit rating by two out of three specified agencies falls below certain agreed levels for a period of 40 days.
The scheme closed to new members from 1 April 2006.
The National Grid YouPlanFollowing a review of the DC section of the National Grid UK Pension Scheme, National Grid established a new DC trust, The National Grid YouPlan (YouPlan). This was launched on 1 November 2013 and future contributions for active members of the DC section were paid to YouPlan from this date.
Under the rules of the plan, National Grid double matches contributions to YouPlan currently up to a maximum of 5% of employee salary. Member accounts built up in the DC section prior to 1 November 2013 will be transferred to YouPlan in 2014.
YouPlan is the qualifying scheme used for automatic enrolment and National Grid’s staging date was 1 April 2013. All new hires are enrolled into YouPlan.
US pension plansNational Grid’s DB pension plans in the US provide annuity or lump sum payments for vested employees. Non-union employees hired on or after 1 January 2011 are provided with a core contribution into the DC plan, irrespective of the employee’s contribution to the plan. A core contribution in the DC plan is also provided to new hires in ten groups of represented US employees. In addition, an employer match is offered to eligible employees in the DC plan on their elective deferrals into the plan. The assets of the plans are held in separate trusts and administered by the fiduciary committees.
Employees do not contribute to the DB pension plans. Employer contributions are made in accordance with the rules set forth by the US Internal Revenue Code and can vary according to the funded status of the plans and the amounts that are tax deductible. At present, there is some flexibility in the amount that is contributed on an annual basis. In general, the Company’s policy for funding the US pension plans is to contribute amounts collected in rates and capitalised in the rate bases during the year. These contributions will be no less than the amounts needed to meet the requirements of the Pension Protection Act of 2006.
Notes to the consolidated financial statements continued
134 National Grid Annual Report and Accounts 2013/14

Strategic Report Corporate Governance Financial Statements Additional Information
29. Actuarial information on pensions and other post-retirement benefits continuedUS retiree healthcare and life insurance plansNational Grid provides healthcare and life insurance benefits to eligible retired US employees. Eligibility is based on certain age and length of service requirements and in most cases retirees contribute to the cost of their healthcare coverage. In the US, there is no governmental requirement to pre-fund post-retirement health and welfare plans. However, in general, the Company’s policy for funding the US retiree healthcare and life insurance plans is to contribute amounts collected in rates and capitalised in the rate bases during the year.
Asset allocationsWithin the asset allocations below there is significant diversification across regions, asset managers, currencies and bond categories.
UK pensions2014 2013 2012
Quoted£m
Unquoted£m
Total£m
Quoted£m
Unquoted£m
Total£m
Quoted£m
Unquoted£m
Total£m
Equities1 4,045 620 4,665 4,825 546 5,371 4,796 570 5,366Corporate bonds2 5,706 – 5,706 5,804 – 5,804 5,330 – 5,330Government securities 4,161 – 4,161 4,743 – 4,743 3,906 – 3,906Property 33 1,057 1,090 – 1,072 1,072 – 1,160 1,160Diversified alternatives3 – 793 793 – – – – – –Other4 1,031 (37) 994 426 (24) 402 407 (62) 345
Total 14,976 2,433 17,409 15,798 1,594 17,392 14,439 1,668 16,107
1. Included within equities at 31 March 2014 were ordinary shares of National Grid plc with a value of £15m (2013: £16m; 2012: £13m).
2. Included within corporate bonds at 31 March 2014 was an investment in a number of bonds issued by subsidiary undertakings with a value of £72m (2013: £69m; 2012: £50m).
3. Includes return seeking non-conventional asset classes.
4. Includes liability-driven investment vehicles, cash and cash type instruments.
US pensions2014 2013 2012
Quoted£m
Unquoted£m
Total£m
Quoted£m
Unquoted£m
Total£m
Quoted£m
Unquoted£m
Total£m
Equities 508 1,225 1,733 507 1,289 1,796 619 1,025 1,644Corporate bonds 823 336 1,159 863 295 1,158 733 229 962Government securities 632 28 660 707 19 726 649 20 669Property – 189 189 – 175 175 – 148 148Diversified alternatives1 – 434 434 – 465 465 – 411 411Other – 54 54 – 58 58 – 16 16
Total 1,963 2,266 4,229 2,077 2,301 4,378 2,001 1,849 3,850
1. Includes return seeking non-conventional asset classes.
US other post-retirement benefits2014 2013 2012
Quoted£m
Unquoted£m
Total£m
Quoted£m
Unquoted£m
Total£m
Quoted£m
Unquoted£m
Total£m
Equities 245 852 1,097 195 774 969 252 523 775Corporate bonds 2 10 12 2 11 13 1 10 11Government securities 357 1 358 361 2 363 262 4 266Diversified alternatives1 43 110 153 43 127 170 87 53 140
Total 647 973 1,620 601 914 1,515 602 590 1,192
1. Includes return seeking non-conventional asset classes.
Target asset allocationsEach plan’s investment strategy is formulated specifically in order to manage risk, through investment in diversified asset classes, including the use of liability matching assets and where appropriate through the employment of interest rate and inflation hedging instruments. The target asset allocation of the plans as at 31 March 2014 is as follows:
UK pensions%
US pensions%
US otherpost-retirement
benefits%
Equities 31 47 70Other 69 53 30
Total 100 100 100
135

29. Actuarial information on pensions and other post-retirement benefits continuedActuarial assumptionsThe Company has applied the following financial assumptions in assessing DB liabilities:
UK pensions US pensions US other post-retirement benefits
2014%
2013%
2012%
2014%
2013%
2012%
2014%
2013%
2012%
Discount rate1 4.3 4.3 4.8 4.8 4.7 5.1 4.8 4.7 5.1Rate of increase in salaries2 3.6 4.1 4.0 3.5 3.5 3.5 3.5 3.5 3.5Rate of increase in RPI3 3.3 3.4 3.2 n/a n/a n/a n/a n/a n/aInitial healthcare cost trend rate n/a n/a n/a n/a n/a n/a 8.0 8.0 8.0Ultimate healthcare cost trend rate n/a n/a n/a n/a n/a n/a 5.0 5.0 5.0
1. The discount rates for pension liabilities have been determined by reference to appropriate yields on high-quality corporate bonds prevailing in the UK and US debt markets at the reporting date.
2. A promotional scale has also been used where appropriate. The UK assumption stated is that relating to service prior to 1 April 2013. The UK assumption for the rate of increase in salaries for service after this date is 2.5%.
3. This is the key assumption that determines assumed increases in pensions in payment and deferment in the UK only. The assumptions for the UK were 3.3% (2013: 3.4%; 2012: 3.2%) for increases in pensions in payment and 3.3% (2013: 3.4%; 2012: 3.2%) for increases in pensions in deferment.
2014 2013 2012
UKyears
USyears
UKyears
USyears
UKyears
USyears
Assumed life expectations for a retiree age 65Today
Males 22.9 20.6 22.7 19.5 22.5 19.4Females 25.4 22.9 25.2 21.4 25.0 21.3
In 20 yearsMales 25.2 22.8 25.0 21.0 24.9 20.9Females 27.8 24.7 27.6 22.2 27.5 22.2
Maturity profile of defined benefit obligationsThe weighted average duration of the DB obligation for each category of scheme is 16 years for UK pension schemes; 13 years for US pension schemes and 15 years for US other post-retirement benefits. The forecast timing of benefits payable to scheme members for each of these categories is shown on a net present value basis in the chart below.
UK Pensions US Pensions US OPEBs
0
50
100
150
200
250
300
350
500
450
550
400
750
800
700
650
600
850
2015 2025 2035 2045 2055 2065 2075 2085
Maturity profile£m
Notes to the consolidated financial statements continued
136 National Grid Annual Report and Accounts 2013/14

Strategic Report Corporate Governance Financial Statements Additional Information
30. Financial risk management
Our activities expose us to a variety of financial risk including currency risk, interest rate risk, commodity price risk, credit risk, capital risk and liquidity risk. Our risk management programme focuses on the unpredictability of financial markets and seeks to minimise potential volatility of financial performance of these risks. We use financial instruments, including derivative financial instruments, to manage risks of this type.
This note describes our approach to managing risk, including an analysis of assets and liabilities by currency type and an analysis of interest rate category for our net debt. We are required by accounting standards to also include a number of specific disclosures (such as a maturity analysis of contractual undiscounted cash flows) and have included these requirements below.
Risk management related to financing activities is carried out by a central treasury department under policies approved by the Finance Committee of the Board. The objective of the treasury department is to manage funding and liquidity requirements, including managing associated financial risks, to within acceptable boundaries. The Finance Committee provides written principles for overall risk management, as well as written policies covering specific areas such as foreign exchange risk, interest rate risk, credit risk, liquidity risk, use of derivative financial instruments and non-derivative financial instruments, and investment of excess liquidity.
We have exposure to the following risks, which are described in more detail below:
• credit risk;• liquidity risk;• interest rate risk;• currency risk;• commodity risk; and• capital risk
(a) Credit riskWe are exposed to the risk of loss resulting from counterparties’ default on their commitments including failure to pay or make a delivery on a contract. This risk is inherent in our commercial business activities. We are exposed to credit risk on our cash and cash equivalents, derivative financial instruments, deposits with banks and financial institutions, as well as credit exposures to wholesale and retail customers, including outstanding receivables and committed transactions.
Treasury credit riskCounterparty risk arises from the investment of surplus funds and from the use of derivative instruments. As at 31 March 2014, the following limits were in place for investments held with banks and financial institutions:
Maximum limit£m
Long-term limit£m
AAA rated G8 sovereign entities Unlimited UnlimitedTriple ‘A’ vehicles 311 263Triple ‘A’ range institutions (AAA) 1,060 to 1,599 534 to 837Double ‘A’ range institutions (AA) 633 to 797 322 to 398Single ‘A’ range institutions (A) 218 to 311 111 to 159
As at 31 March 2013 and 2014, we had a number of exposures to individual counterparties. In accordance with our treasury policies, counterparty credit exposure utilisations are monitored daily against the counterparty credit limits. Counterparty credit ratings and market conditions are reviewed continually with limits being revised and utilisation adjusted, if appropriate. Management does not expect any significant losses from non performance by these counterparties.
Commodity credit riskThe credit policy for commodity transactions is owned and monitored by the Executive Energy Risk Committee, under authority delegated by the Board and Executive Committee, and establishes controls and procedures to determine, monitor and minimise the credit risk of counterparties.
Wholesale and retail credit riskOur principal commercial exposure in the UK is governed by the credit rules within the regulated codes Uniform Network Code and Connection and Use of System Code. These set out the level of credit relative to the RAV for each credit rating. In the US, we are required to supply electricity and gas under state regulations. Our credit policies and practices are designed to limit credit exposure by collecting security deposits prior to providing utility services, or after utility service has commenced if certain applicable regulatory requirements are met. Collection activities are managed on a daily basis. Sales to retail customers are usually settled in cash, cheques, electronic bank payments or by using major credit cards. We are committed to measuring, monitoring, minimising and recording counterparty credit risk in our wholesale business. The utilisation of credit limits is regularly monitored and collateral is collected against these accounts when necessary. Management does not expect any significant losses of receivables that have not been provided for as shown in note 17.
137

30. Financial risk management continued(a) Credit risk continuedOffsetting financial assets and liabilitiesThe following tables set out our financial assets and liabilities which are subject to offset and to enforceable master netting arrangements or similar agreements. The tables show the amounts which are offset and reported net in the statement of financial position. Amounts which cannot be offset under IFRS, but which could be settled net under terms of master netting agreements if certain conditions arise, and with collateral received or pledged, are shown to present National Grid’s net exposure.
Financial assets and liabilities on different transactions are only reported net if the transactions are with the same counterparty, a legal right of offset exists and the cash flows are intended to be settled on a net basis.
Amounts which do not meet the criteria for offsetting on the statement of financial position but could be settled net in certain circumstances principally relate to derivative transactions under ISDA (International Swaps and Derivatives Association) agreements where each party has the option to settle amounts on a net basis in the event of default of the other party.
Commodity contracts that have not been offset on the balance sheet may be settled net in certain circumstances under ISDA or NAESB (North American Energy Standards Board) agreements.
National Grid has similar arrangements in relation to bank account balances and bank overdrafts; and trade payables and trade receivables which are subject to general terms and conditions. However, these balances are immaterial.
Related amounts availableto be offset but not offset in
statement of financial position
As at 31 March 2014
Grosscarryingamounts
£m
Grossamounts
offset1
£m
Net amountpresented
in statementof financial
position£m
Financialinstruments
£m
Cashcollateralreceived/pledged
£mNet amount
£m
AssetsDerivative financial instruments 1,970 – 1,970 (609) (831) 530Commodity contracts 89 (2) 87 (7) (2) 78
2,059 (2) 2,057 (616) (833) 608
LiabilitiesDerivative financial instruments (1,163) – (1,163) 609 374 (180)Commodity contracts (123) – (123) 7 – (116)
(1,286) – (1,286) 616 374 (296)
Total 773 (2) 771 – (459) 312
Related amounts availableto be offset but not offset in
statement of financial position
As at 31 March 2013
Grosscarrying
amounts £m
Grossamounts
offset1
£m
Net amountpresented
in statementof financial
position£m
Financialinstruments
£m
Cashcollateralreceived/pledged
£mNet amount
£m
AssetsDerivative financial instruments 2,245 – 2,245 (891)2 (709) 645Commodity contracts 91 (2) 89 (1) – 88
2,336 (2) 2,334 (892) (709) 733
LiabilitiesDerivative financial instruments (1,681) – (1,681) 8912 440 (350)Commodity contracts (140) 1 (139) 1 – (138)
(1,821) 1 (1,820) 892 440 (488)
Total 515 (1) 514 – (269) 245
1. The gross financial assets and liabilities offset in the statement of financial position primarily relate to commodity contracts. Offsets relate to margin payments for NYMEX gas futures which are traded on a recognised exchange.
2. Comparatives have been restated to present items on a basis consistent with the current year.
Notes to the consolidated financial statements continued
138 National Grid Annual Report and Accounts 2013/14

Strategic Report Corporate Governance Financial Statements Additional Information
30. Financial risk management continued(b) Liquidity riskOur policy is to determine our liquidity requirements by the use of both short-term and long-term cash flow forecasts. These forecasts are supplemented by a financial headroom analysis which is used to assess funding requirements for at least a 24 month period and maintain adequate liquidity for a continuous 12 month period.
We believe our contractual obligations, including those shown in commitments and contingencies in note 27 can be met from existing cash and investments, operating cash flows and other financings that we reasonably expect to be able to secure in the future, together with the use of committed facilities if required.
Our debt agreements and banking facilities contain covenants, including those relating to the periodic and timely provision of financial information by the issuing entity and financial covenants such as restrictions on the level of subsidiary indebtedness. Failure to comply with these covenants, or to obtain waivers of those requirements, could in some cases trigger a right, at the lender’s discretion, to require repayment of some of our debt and may restrict our ability to draw upon our facilities or access the capital markets.
The following is an analysis of the contractual undiscounted cash flows payable under financial liabilities and derivative assets and liabilities as at the reporting date:
At 31 March 2014
Lessthan
1 year£m
1-2 years£m
2-3 years£m
More than
3 years£m
Total£m
Non-derivative financial liabilitiesBorrowings, excluding finance lease liabilities (3,091) (864) (1,140) (20,275) (25,370)Interest payments on borrowings1 (826) (812) (796) (14,571) (17,005)Finance lease liabilities (18) (19) (20) (112) (169)Other non-interest bearing liabilities (2,584) (190) – – (2,774)
Derivative financial liabilitiesDerivative contracts – receipts 1,068 950 153 1,155 3,326Derivative contracts – payments (556) (861) (144) (1,638) (3,199)Commodity contracts (177) (30) (22) 2 (227)
Total (6,184) (1,826) (1,969) (35,439) (45,418)
At 31 March 2013
Lessthan
1 year£m
1-2 years£m
2-3 years£m
More than
3 years£m
Total£m
Non-derivative financial liabilitiesBorrowings, excluding finance lease liabilities (3,061) (1,836) (790) (21,704) (27,391)Interest payments on borrowings1 (951) (861) (842) (15,775) (18,429)Finance lease liabilities (27) (26) (26) (151) (230)Other non-interest bearing liabilities (2,696) (235) – – (2,931)
Derivative financial liabilitiesDerivative contracts – receipts 1,388 816 1,053 441 3,698Derivative contracts – payments2 (1,309) (469) (969) (1,039) (3,786)Commodity contracts (150) (41) (35) (25) (251)
Total (6,806) (2,652) (1,609) (38,253) (49,320)
1. The interest on borrowings is calculated based on borrowings held at 31 March without taking account of future issues. Floating-rate interest is estimated using a forward interest rate curve as at 31 March. Payments are included on the basis of the earliest date on which the Company can be required to settle.
2. The comparatives have been restated on a basis consistent with the current year.
139

30. Financial risk management continued(c) Interest rate riskNational Grid’s interest rate risk arises from our long-term borrowings. Borrowings issued at variable rates expose National Grid to cash flow interest rate risk, partially offset by cash held at variable rates. Borrowings issued at fixed rates expose National Grid to fair value interest rate risk.
Our interest rate risk management policy is to seek to minimise total financing costs (being interest costs and changes in the market value of debt) subject to constraints. We do this by using fixed and floating rate debt and derivative financial instruments including interest rate swaps, swaptions and forward rate agreements.
We hold some borrowings on issue that are inflation linked. We believe that these provide a partial economic offset to the inflation risk associated with our UK inflation linked revenues.
The table in note 19 sets out the carrying amount, by contractual maturity, of borrowings that are exposed to interest rate risk before taking into account interest rate swaps.
During 2014 and 2013, net debt was managed using derivative instruments to hedge interest rate risk as follows:
2014 2013
Fixedrate£m
Floatingrate£m
Inflationlinked
£mOther1
£mTotal
£m
Fixedrate£m
Floatingrate£m
Inflationlinked
£mOther1
£mTotal
£m
Cash and cash equivalents 175 179 – – 354 577 94 – – 671Financial investments 615 2,979 – 5 3,599 540 4,843 – 48 5,431Borrowings2 (15,585) (3,520) (6,836) (9) (25,950) (17,767) (3,700) (6,617) (11) (28,095)
Pre-derivative position (14,795) (362) (6,836) (4) (21,997) (16,650) 1,237 (6,617) 37 (21,993)Derivative effect3 3,359 (2,743) 191 – 807 1,555 (1,132) 141 – 564
Net debt position (11,436) (3,105) (6,645) (4) (21,190) (15,095) 105 (6,476) 37 (21,429)
1. Represents financial instruments which are not directly affected by interest rate risk, such as investments in equity or other similar financial instruments.
2. Includes bank overdrafts.
3. The impact of 2014/15 (2013: 2013/14) maturing short-dated interest rate derivatives is included.
(d) Currency riskNational Grid operates internationally and is exposed to foreign exchange risk arising from various currency exposures, primarily with respect to the dollar. Foreign exchange risk arises from future commercial transactions, recognised assets and liabilities, and investments in foreign operations.
Our policy for managing foreign exchange transaction risk is to hedge contractually committed foreign currency cash flows over a prescribed minimum size. Where foreign currency cash flow forecasts are less certain, our policy is to hedge a proportion of such cash flows based on the probability of those cash flows occurring. Instruments used to manage foreign exchange transaction risk include foreign exchange forward contracts and foreign exchange swaps.
Our policy for managing foreign exchange translation risk relating to our net investment in foreign operations is to maintain a percentage of net debt and foreign exchange forwards so as to provide an economic offset of our cash flows arising in the foreign currency. The primary managed foreign exchange exposure arises from the dollar denominated assets and liabilities held by our US operations, with a further small euro exposure in respect of a joint venture investment.
During 2014 and 2013, derivative financial instruments were used to manage foreign currency risk as follows:
2014 2013
Sterling£m
Euro£m
Dollar£m
Other£m
Total£m
Sterling£m
Euro£m
Dollar£m
Other£m
Total£m
Cash and cash equivalents 16 – 338 – 354 238 1 432 – 671Financial investments 1,879 111 1,553 56 3,599 3,938 124 1,289 80 5,431Borrowings1 (12,780) (4,479) (7,330) (1,361) (25,950) (12,573) (5,220) (8,678) (1,624) (28,095)
Pre-derivative position (10,885) (4,368) (5,439) (1,305) (21,997) (8,397) (5,095) (6,957) (1,544) (21,993)Derivative effect 3,137 4,670 (8,326) 1,326 807 320 5,368 (6,684) 1,560 564
Net debt position (7,748) 302 (13,765) 21 (21,190) (8,077) 273 (13,641) 16 (21,429)
1. Includes bank overdrafts.
The overall exposure to dollars largely relates to our net investment hedge activities as described in note 15.
Notes to the consolidated financial statements continued
140 National Grid Annual Report and Accounts 2013/14

Strategic Report Corporate Governance Financial Statements Additional Information
30. Financial risk management continued(d) Currency risk continuedThe currency exposure on other financial instruments is as follows:
2014 2013
Sterling£m
Euro£m
Dollar£m
Other£m
Total£m
Sterling£m
Euro£m
Dollar£m
Other£m
Total£m
Trade and other receivables 142 – 1,623 – 1,765 151 – 1,338 – 1,489Trade and other payables (1,370) – (1,291) – (2,661) (1,328) – (1,437) – (2,765)Other non-current liabilities (16) – (220) – (236) (22) – (283) – (305)
The carrying amounts of other financial instruments are denominated in the above currencies, which in most instances are the functional currency of the respective subsidiaries. Our exposure to dollars is due to activities in our US subsidiaries. We do not have any other significant exposure to currency risk on these balances.
(e) Commodity riskWe purchase electricity and gas to supply our customers in the US and to meet our own energy needs. Substantially all our costs of purchasing electricity and gas for supply to customers are recoverable at an amount equal to cost. The timing of recovery of these costs can vary between financial periods leading to an under- or over-recovery within any particular year, that can lead to large fluctuations in the income statement. We follow approved policies to manage price and supply risks for our commodity activities.
Our energy procurement risk management policy and delegations of authority govern our US commodity trading activities for energy transactions. The purpose of this policy is to ensure we transact within pre-defined risk parameters and only in the physical and financial markets where we or our customers have a physical market requirement. In addition, state regulators require National Grid to manage commodity risk and cost volatility prudently through diversified pricing strategies. In some jurisdictions we are required to file a plan outlining our strategy to be approved by regulators. In certain cases we might receive guidance with regard to specific hedging limits.
Energy purchase contracts for the forward purchase of electricity or gas that are used to satisfy physical delivery requirements to customers or for energy that the Company uses itself meet the normal purchase, sale or usage exemption of IAS 39. They are, therefore, not recognised in the financial statements. Disclosure of commitments under such contracts is made in note 27.
We enter into forward contracts for the purchase of commodities, some of which do not meet the own use exemption for accounting purposes and hence are accounted for as derivatives. We also enter into derivative financial instruments linked to commodity prices, including index-linked futures, swaps and options contracts. These derivative financial instruments are used to manage market price volatility and are carried at fair value on the statement of financial position, with the mark-to-market changes reflected through earnings.
141

30. Financial risk management continued(e) Commodity risk continuedThe fair value of our commodity contracts by type can be analysed as follows:
2014 2013
Assets£m
Liabilities£m
Total£m
Assets£m
Liabilities£m
Total£m
Commodity purchase contracts accounted for as derivative contracts
Forward purchases of electricity 1 (49) (48) – (89) (89)Forward purchases of gas 30 (66) (36) 46 (45) 1
Derivative financial instruments linked to commodity pricesElectricity swaps 26 (6) 20 16 (1) 15Electricity options 22 – 22 16 – 16Gas swaps 7 (2) 5 10 (4) 6Gas options 1 – 1 1 – 1
87 (123) (36) 89 (139) (50)
The maturity profile of commodity contracts is as follows:
2014 2013
Assets£m
Liabilities£m
Total£m
Assets£m
Liabilities£m
Total£m
Less than one year 42 (77) (35) 42 (69) (27)
Current 42 (77) (35) 42 (69) (27)
In 1-2 years 13 (22) (9) 13 (23) (10)In 2-3 years 15 (17) (2) 10 (23) (13)In 3-4 years 4 (7) (3) 14 (16) (2)In 4-5 years 3 – 3 2 (8) (6)More than 5 years 10 – 10 8 – 8
Non-current 45 (46) (1) 47 (70) (23)
Total 87 (123) (36) 89 (139) (50)
For each class of commodity contract, our exposure based on the notional quantities is as follows:
2014 2013
Forward purchases of electricity1 1,740 GWh 2,595 GWhForward purchases/sales of gas2 84m Dth 59m DthElectricity swaps 6,603 GWh 6,309 GWhElectricity options 28,760 GWh 32,999 GWhGas swaps 50m Dth 66m DthGas options 23m Dth 4m DthNYMEX gas futures3 20m Dth 17m Dth
1. Forward electricity purchases have terms up to four years. The contractual obligations under these contracts are £106m (2013: £174m).
2. Forward gas purchases have terms up to five years. The contractual obligations under these contracts are £171m (2013: £119m).
3. NYMEX gas futures have been offset with related margin accounts (see note 30 (a) on page 137).
(f) Capital risk managementNational Grid’s objectives when managing capital are: to safeguard our ability to continue as a going concern; to remain within regulatory constraints of our regulated operating companies; and to maintain an efficient mix of debt and equity funding thus achieving an optimal capital structure and cost of capital. We regularly review and maintain or adjust the capital structure as appropriate in order to achieve these objectives.
Maintaining appropriate credit ratings for our regulated companies is an important aspect of our capital risk management strategy and balance sheet efficiency. We monitor our balance sheet efficiency using several metrics including our interest cover. Interest cover for the year ended 31 March 2014 was 4.1 (2013: 3.9). Our long-term target range for interest cover is greater than 3.0, which we believe is consistent with single A range long-term senior unsecured debt credit ratings within our main UK operating companies, NGET and NGG, based on guidance from the rating agencies.
In addition, we monitor the RAV gearing within each of NGET and the regulated transmission and distribution businesses within NGG. This is calculated as net debt expressed as a percentage of RAV, and indicates the level of debt employed to fund our UK regulated businesses. It is compared with the level of RAV gearing indicated by Ofgem as being appropriate for these businesses, at around 60-65%.
Notes to the consolidated financial statements continued
142 National Grid Annual Report and Accounts 2013/14

Strategic Report Corporate Governance Financial Statements Additional Information
30. Financial risk management continued(f) Capital risk management continuedThe majority of our regulated operating companies in the US and the UK (and one intermediate UK holding company), which are all consolidated subsidiaries of National Grid, are subject to certain restrictions on the payment of dividends by administrative order (by regulators relevant to the individual company), contract and/or licence. The types of restrictions that a company may have that would prevent a dividend being declared or paid unless they are met include:
• dividends must be approved in advance by the relevant US state regulatory commission;
• the subsidiary must have at least two recognised rating agency credit ratings of at least investment grade;
• dividends must be limited to cumulative retained earnings, including pre-acquisition retained earnings;
• National Grid plc must maintain an investment grade credit rating and if that rating is the lowest investment grade bond rating it cannot have a negative watch/review downgrade notice by a credit rating agency;
• the subsidiary must not carry on any activities other than those permitted by the licences;
• the subsidiary must not create any cross-default obligations or give or receive any intra-group cross-subsidies; and
• the percentage of equity compared with total capital of the subsidiary must remain above certain levels.
There is a further restriction relating only to the Narragansett Electric Company, which is required to maintain its consolidated net worth above certain levels.
These restrictions are subject to alteration in the US as and when a new rate case or rate plan is agreed with the relevant regulatory bodies for each operating company and in the UK through the normal licence review process.
As most of our business is regulated, at 31 March 2014 the majority of our net assets are subject to some of the restrictions noted above. These restrictions are not considered to be significantly onerous, nor do we currently expect they will prevent the planned payment of dividends in future in line with our dividend policy.
Some of our regulatory and bank loan agreements additionally impose lower limits for the long-term credit ratings that certain companies within the Group must hold. All the above requirements are monitored on a regular basis in order to ensure compliance. The Company has complied with all externally imposed capital requirements to which it is subject.
(g) Fair value analysisThe financial instruments included on the statement of financial position are measured at fair value. These fair values can be categorised into hierarchy levels that are representative of the inputs used in measuring the fair value. The best evidence of fair value is a quoted price in an actively traded market. In the event that the market for a financial instrument is not active, a valuation technique is used.
2014 2013
Level 1£m
Level 2£m
Level 3£m
Total£m
Level 1£m
Level 2£m
Level 3£m
Total£m
AssetsAvailable-for-sale investments 2,786 214 – 3,000 4,510 209 – 4,719Derivative financial instruments – 1,950 20 1,970 – 2,197 48 2,245Commodity contracts – 34 53 87 – 26 63 89
2,786 2,198 73 5,057 4,510 2,432 111 7,053
LiabilitiesDerivative financial instruments – (1,043) (120) (1,163) – (1,529) (152) (1,681)Commodity contracts – (12) (111) (123) – (5) (134) (139)
– (1,055) (231) (1,286) – (1,534) (286) (1,820)
Total 2,786 1,143 (158) 3,771 4,510 898 (175) 5,233
Level 1: Financial instruments with quoted prices for identical instruments in active markets.
Level 2: Financial instruments with quoted prices for similar instruments in active markets or quoted prices for identical or similar instruments in inactive markets and financial instruments valued using models where all significant inputs are based directly or indirectly on observable market data.
Level 3: Financial instruments valued using valuation techniques where one or more significant inputs are based on unobservable market data.
143
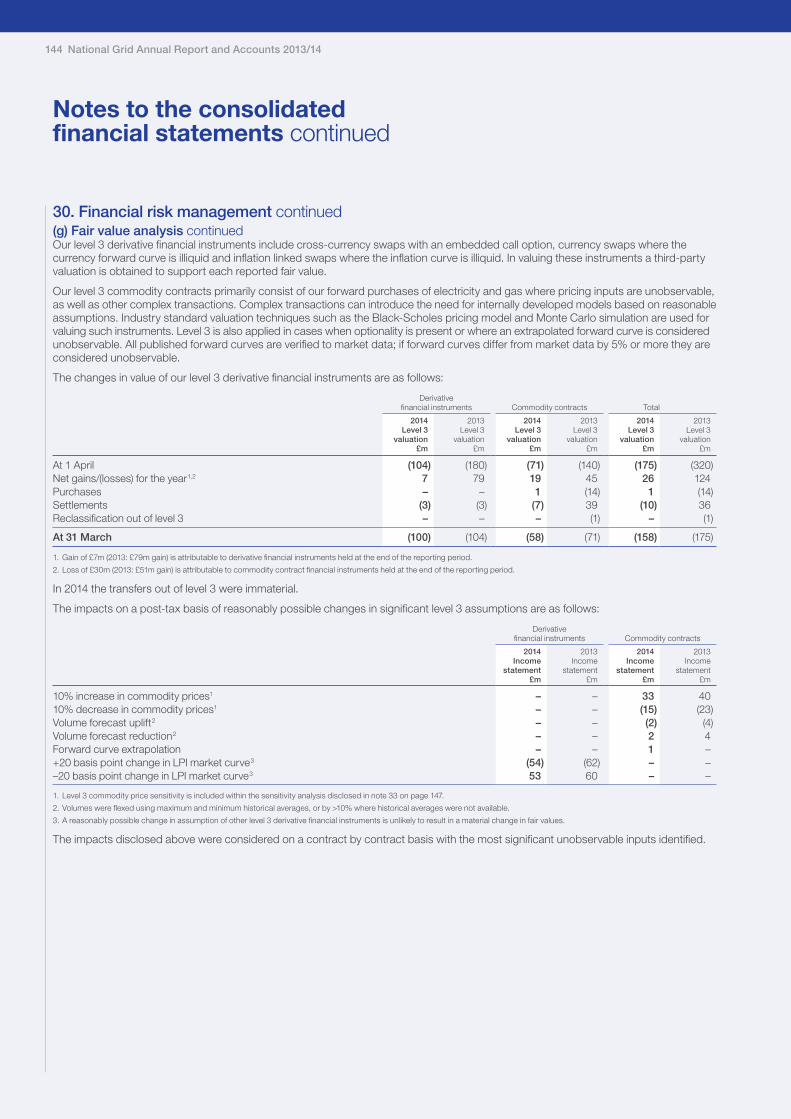
30. Financial risk management continued(g) Fair value analysis continuedOur level 3 derivative financial instruments include cross-currency swaps with an embedded call option, currency swaps where the currency forward curve is illiquid and inflation linked swaps where the inflation curve is illiquid. In valuing these instruments a third-party valuation is obtained to support each reported fair value.
Our level 3 commodity contracts primarily consist of our forward purchases of electricity and gas where pricing inputs are unobservable, as well as other complex transactions. Complex transactions can introduce the need for internally developed models based on reasonable assumptions. Industry standard valuation techniques such as the Black-Scholes pricing model and Monte Carlo simulation are used for valuing such instruments. Level 3 is also applied in cases when optionality is present or where an extrapolated forward curve is considered unobservable. All published forward curves are verified to market data; if forward curves differ from market data by 5% or more they are considered unobservable.
The changes in value of our level 3 derivative financial instruments are as follows:
Derivativefinancial instruments Commodity contracts Total
2014Level 3
valuation£m
2013Level 3
valuation£m
2014Level 3
valuation£m
2013Level 3
valuation£m
2014Level 3
valuation£m
2013Level 3
valuation£m
At 1 April (104) (180) (71) (140) (175) (320)Net gains/(losses) for the year1,2 7 79 19 45 26 124Purchases – – 1 (14) 1 (14)Settlements (3) (3) (7) 39 (10) 36Reclassification out of level 3 – – – (1) – (1)
At 31 March (100) (104) (58) (71) (158) (175)
1. Gain of £7m (2013: £79m gain) is attributable to derivative financial instruments held at the end of the reporting period.
2. Loss of £30m (2013: £51m gain) is attributable to commodity contract financial instruments held at the end of the reporting period.
In 2014 the transfers out of level 3 were immaterial.
The impacts on a post-tax basis of reasonably possible changes in significant level 3 assumptions are as follows:
Derivativefinancial instruments Commodity contracts
2014Income
statement£m
2013Income
statement£m
2014Income
statement£m
2013Income
statement£m
10% increase in commodity prices1 – – 33 4010% decrease in commodity prices1 – – (15) (23)Volume forecast uplift2 – – (2) (4)Volume forecast reduction2 – – 2 4Forward curve extrapolation – – 1 –+20 basis point change in LPI market curve3 (54) (62) – ––20 basis point change in LPI market curve3 53 60 – –
1. Level 3 commodity price sensitivity is included within the sensitivity analysis disclosed in note 33 on page 147.
2. Volumes were flexed using maximum and minimum historical averages, or by >10% where historical averages were not available.
3. A reasonably possible change in assumption of other level 3 derivative financial instruments is unlikely to result in a material change in fair values.
The impacts disclosed above were considered on a contract by contract basis with the most significant unobservable inputs identified.
Notes to the consolidated financial statements continued
144 National Grid Annual Report and Accounts 2013/14

Strategic Report Corporate Governance Financial Statements Additional Information
31. Borrowing facilities
To support our long-term liquidity requirements and provide backup to commercial paper and other borrowings, we agree loan facilities with financial institutions over and above the value of borrowings that may be required. These facilities have never been drawn, and our undrawn amounts are listed below.
At 31 March 2014, we had bilateral committed credit facilities of £2,073m (2013: £2,009m). In addition, we had committed credit facilities from syndicates of banks of £800m at 31 March 2014 (2013: £877m). All committed credit facilities were undrawn in 2014 and 2013. An analysis of the maturity of these undrawn committed facilities is shown below:
2014£m
2013£m
Undrawn committed borrowing facilities expiring:Less than 1 year – –In 1-2 years 800 1,140In 2-3 years – 877In 3-4 years 853 –In 4-5 years 1,220 869
2,873 2,886
Of the unused facilities at 31 March 2014, £2,583m (2013: £2,568m) was held as backup to commercial paper and similar borrowings, while £290m (2013: £318m) is available as backup to specific US borrowings.
Further information on our bonds can be found on the debt investor section of our website.
145

32. Subsidiary undertakings, joint ventures and associates
While we present consolidated results in these financial statements as if we were one company, our legal structure is such that there are a number of different operating and holding companies that contribute to the overall result. This structure has evolved through acquisitions as well as regulatory requirements to have certain activities within separate legal entities.
Principal subsidiary undertakingsThe principal subsidiary undertakings included in the consolidated financial statements at 31 March 2014 are listed below. These undertakings are wholly owned and, unless otherwise indicated, are incorporated in England and Wales.
Principal activity
National Grid Gas plc Transmission and distribution of gasNational Grid Electricity Transmission plc Transmission of electricityNew England Power Company1 Transmission of electricityMassachusetts Electric Company1 Distribution of electricityThe Narragansett Electric Company1 Transmission and distribution of electricityNiagara Mohawk Power Corporation1 Transmission of electricity and distribution of electricity and gasNational Grid Metering Limited Metering servicesNational Grid Grain LNG Limited LNG importation and storageNational Grid Interconnectors Limited Electricity interconnector operatorBoston Gas Company1 Distribution of gasNational Grid Generation LLC1 Generation of electricityKeySpan Gas East Corporation1 Distribution of gasThe Brooklyn Union Gas Company1 Distribution of gasNGG Finance plc FinancingNational Grid Property Holdings Limited Property servicesNational Grid Holdings One plc Holding companyLattice Group plc Holding companyNational Grid USA1 Holding companyNiagara Mohawk Holdings, Inc.1 Holding companyNational Grid Commercial Holdings Limited Holding companyNational Grid Holdings Limited Holding companyKeySpan Corporation1 Holding companyNational Grid North America Inc.1 Holding companyBritish Transco Finance Inc.1 FinancingBritish Transco International Finance BV (incorporated in the Netherlands) Financing
1. Incorporated in the US.
Principal joint ventures and associatesThe principal joint ventures and associated undertakings included in the financial statements at 31 March 2014 are listed below. These undertakings are incorporated in England and Wales (unless otherwise indicated).
% of ordinaryshares held Principal activity
BritNed Development Limited 50 UK-Netherlands interconnectorNGET/SPT Upgrades Limited 50 England-Scotland interconnectorMillennium Pipeline Company, LLC1 26.25 Transmission of gasIroquois Gas Transmission System, L.P.1 20.4 Transmission of gas
1. Incorporated in the US.
The Group comprises a large number of entities and it is not practical to include all of them in this list. This list therefore includes brief details for those principal companies which in the Directors’ opinion have a significant impact on the revenue, profit or assets of the Group. A full list of subsidiaries, joint ventures and associates is annexed to the Company’s Annual Return filed with the Registrar of Companies.
Our interests and activities are held or operated through subsidiaries, branches, joint arrangements or associates established in, and subject to the laws and regulations of, a number of different jurisdictions.
Notes to the consolidated financial statements continued
146 National Grid Annual Report and Accounts 2013/14

Strategic Report Corporate Governance Financial Statements Additional Information
33. Sensitivities on areas of estimation and uncertainty
In order to give a clearer picture of the impact on our results or financial position of potential changes in significant estimates and assumptions, the following sensitivities are presented. These sensitivities are hypothetical, as they are based on assumptions and conditions prevailing at the year end, and should be used with caution. The effects provided are not necessarily indicative of the actual effects that would be experienced because our actual exposures are constantly changing.
The sensitivities in the table below show the potential impact in the income statement (and consequential impact on net assets) for a range of different variables which each have been considered in isolation (ie with all other variables remaining constant). There are a number of these sensitivities which are mutually exclusive and therefore if one were to happen, another would not, meaning a total showing how sensitive our results are to these external factors is not meaningful.
We are further required to show additional sensitivity analysis for changes in interest and exchange rates and these are shown separately in the table below due to the additional assumptions that are made in order to produce meaningful sensitivity disclosures.
The sensitivities included in the table below all have an equal and opposite effect if the sensitivity increases or decreases by the same amount unless otherwise stated. For example a 10% increase in unbilled revenue at 31 March 2014 would result in a decrease in the income statement of £58m and a 10% decrease in unbilled revenue would have the equal but opposite effect.
2014 2013
Incomestatement
£m
Netassets
£m
Incomestatement
£m
Netassets
£m
One year average change in economic useful lives (pre-tax)Depreciation charge on property, plant and equipment 68 68 68 68Amortisation charge on intangible assets 18 18 15 15
Estimated future cash flows in respect of provisions change of 10% (pre-tax) 164 164 176 176
Assets and liabilities carried at fair value change of 10% (pre-tax)Derivative financial instruments1 81 81 56 56Commodity contract liabilities 4 4 5 5
Pensions and other post-retirement benefits2 (pre-tax)UK discount rate change of 0.5%3 13 1,347 12 1,460US discount rate change of 0.5%3 15 473 12 568UK RPI rate change of 0.5%4 12 1,217 12 1,185UK long-term rate of increase in salaries change of 0.5%5 5 95 5 128US long-term rate of increase in salaries change of 0.5%5 4 39 5 43UK change of one year to life expectancy at age 65 3 548 3 597US change of one year to life expectancy at age 65 12 220 11 197Assumed US healthcare cost trend rates change of 1% 28 355 29 416
Unbilled revenue at 31 March change of 10% (post-tax) 58 58 77 77No hedge accounting for our derivative financial instruments (post-tax) 350 (294) (184) 106
Commodity risk6 (post-tax)Commodity prices +10% 50 50 45 45Commodity prices –10% (33) (33) (34) (34)
Financial risk7 (post-tax)UK RPI rate change of 0.5%8 26 – 25 –UK interest rates change of 0.5% 93 68 98 90US interest rates change of 0.5% 70 13 87 16US dollar exchange rate change of 10% 55 641 65 600
1. The effect of a 10% change in fair value assumes no hedge accounting.
2. The changes shown are a change in the annual pension or other post-retirement benefit costs and change in the defined benefits obligations.
3. A change in the discount rate is likely to occur as a result of changes in bond yields and as such would be expected to be offset to a significant degree by a change in the value of the bond assets held by the plans.
4. The projected impact resulting from a change in RPI reflects the underlying effect on pensions in payment, pensions in deferment and resultant increases in salary assumptions.
5. This change has been applied to both the pre 1 April 2013 and post 1 April 2013 rate of increase in salary assumption.
6. Represents potential impact on fair values of commodity contracts only.
7. The impact on net assets does not reflect the exchange translation in our US subsidiary net assets. It is estimated this would change by £781m (2013: £712m) in the opposite direction if the dollar exchange rate changed by 10%.
8. Excludes sensitivities to LPI index. Further details on sensitivities are provided in note 30 (g) on page 143.
With the adoption of IAS 19 (revised), we have reviewed the pension assumptions that we consider key (as shown on page 136), and as a result have changed the sensitivities presented in the table above.
147

33. Sensitivities on areas of estimation and uncertainty continuedPensions and other post-retirement benefits assumptionsSensitivities have been prepared to show how the DB obligations and annual service costs could potentially be impacted by changes in the relevant actuarial assumptions that were reasonably possible as at 31 March 2014. In preparing sensitivities the potential impact has been calculated by applying the change to each assumption in isolation and assuming all other assumptions remain unchanged. This is with the exception of RPI in the UK where the corresponding effect on pensions in payment, pensions in deferment and resultant increases in salary are recognised.
Following the adoption of IAS 19 (revised) the pension sensitivities have been reviewed. The rate of change has been amended in respect of the impact of discount rate, and life expectancy is now shown as at age 65 (as opposed to age 60). A new sensitivity has been introduced for the impact of UK RPI. The impacts of salaries and US healthcare trend rates remain unchanged. Comparatives for each sensitivity have been presented on a consistent basis. The introduction of a new assumption in the UK for increases in salary for service from 1 April 2013 is reflected in the sensitivity analysis.
Financial instruments assumptionsOur financial instruments are sensitive to changes in market variables, being UK and US interest rates, the UK RPI and the dollar to sterling exchange rate. The changes in market variables affect the valuation of our borrowings, deposits, derivative financial instruments and commodity contracts. The analysis illustrates the sensitivity of our financial instruments to the changes in market variables.
The following main assumptions were made in calculating the sensitivity analysis:
• the amount of net debt, the ratio of fixed to floating interest rates of the debt and derivatives portfolio, and the proportion of financial instruments in foreign currencies are all constant and on the basis of the hedge designations in place at 31 March 2014 and 2013 respectively;
• the statement of financial position sensitivity to interest rates relates only to derivative financial instruments and available-for-sale investments, as debt and other deposits are carried at amortised cost and so their carrying value does not change as interest rates move;
• the sensitivity of accrued interest to movements in interest rates is calculated on net floating-rate exposures on debt, deposits and derivative instruments;
• changes in the carrying value of derivatives from movements in interest rates of designated cash flow hedges are assumed to be recorded fully within equity; and
• changes in the carrying value of derivative financial instruments designated as net investment hedges from movements in interest rates are recorded in the income statement as they are designated using the spot rather than the forward translation method. The impact of movements in the dollar to sterling exchange rate are recorded directly in equity.
34. Additional disclosures in respect of guaranteed securities
We have three debt issuances (including preferred shares) that are listed on a US national securities exchange and are guaranteed by other companies in the Group. These guarantors commit to honour any liabilities should the company issuing the debt have any financial difficulties. In order to provide debt holders with information on the financial stability of the companies providing the guarantees, we are required to disclose individual financial information for these companies. We have chosen to include this information in the Group financial statements rather than submitting separate stand-alone financial statements.
The following condensed consolidating financial information, comprising statements of comprehensive income, statements of financial position and cash flow statements, is given in respect of National Grid Gas plc (subsidiary guarantor), which became joint full and unconditional guarantor on 11 May 2004 with National Grid plc (parent guarantor) of the 6.625% Guaranteed Notes due 2018 issued in June 1998 by British Transco Finance Inc., then known as British Gas Finance Inc. (issuer of notes). Condensed consolidating financial information is also provided in respect of Niagara Mohawk Power Corporation as a result of National Grid plc’s guarantee, dated 29 October 2007, of Niagara Mohawk’s 3.6% and 3.9% issued preferred shares. National Grid Gas plc, British Transco Finance Inc., and Niagara Mohawk Power Corporation are wholly-owned subsidiaries of National Grid plc.
The following financial information for National Grid plc, National Grid Gas plc, British Transco Finance Inc., and Niagara Mohawk Power Corporation on a condensed consolidating basis is intended to provide investors with meaningful and comparable financial information and is provided pursuant to various rules including Rule 3-10 of Regulation S-X in lieu of the separate financial statements of each subsidiary issuer of public debt securities.
This financial information should be read in conjunction with the other disclosures in these financial statements.
Notes to the consolidated financial statements continued
148 National Grid Annual Report and Accounts 2013/14

Strategic Report Corporate Governance Financial Statements Additional Information
34. Additional disclosures in respect of guaranteed securities continuedSummary statements of comprehensive income are presented, on a consolidating basis, for the three years ended 31 March 2014. Summary statements of comprehensive income of National Grid plc and National Grid Gas plc are presented under IFRS measurement principles, as modified by the inclusion of the results of subsidiary undertakings on the basis of equity accounting principles.
The summary statements of financial position of National Grid plc and National Grid Gas plc include the investments in subsidiaries recorded on the basis of equity accounting principles for the purposes of presenting condensed consolidating financial information under IFRS. The summary statements of financial position present these investments within non-current financial and other investments.
The consolidation adjustments column includes the necessary amounts to eliminate the intercompany balances and transactions between National Grid plc, National Grid Gas plc, British Transco Finance Inc., Niagara Mohawk Power Corporation and other subsidiaries.
Summary statements of comprehensive income for the year ended 31 March 2014 – IFRSParent
guarantor Issuer of notesSubsidiaryguarantor
NationalGrid plc
£m
NiagaraMohawk
PowerCorporation
£m
BritishTransco
Finance Inc.£m
NationalGrid Gas
plc£m
Othersubsidiaries
£m
Consolidationadjustments
£m
NationalGrid
consolidated£m
Revenue 4 2,185 – 3,141 9,653 (174) 14,809Operating costs
Depreciation and amortisation – (127) – (529) (760) – (1,416)Payroll costs – (278) – (251) (903) – (1,432)Purchases of electricity – (647) – – (817) – (1,464)Purchases of gas – (194) – (112) (1,449) – (1,755)Rates and property tax – (137) – (241) (585) – (963)Balancing Service Incentive Scheme – – – – (872) – (872)Payments to other UK network owners – – – – (630) – (630)Other operating costs 15 (440) – (661) (1,630) 174 (2,542)
15 (1,823) – (1,794) (7,646) 174 (11,074)
Operating profit 19 362 – 1,347 2,007 – 3,735Net finance costs (128) (85) – (285) (517) – (1,015)Dividends receivable – – – – 600 (600) –Interest in equity accounted affiliates 2,550 – – 11 28 (2,561) 28
Profit before tax 2,441 277 – 1,073 2,118 (3,161) 2,748Taxation 35 (97) – 3 (225) – (284)
Profit for the year 2,476 180 –1 1,076 1,893 (3,161) 2,464Amounts recognised in other comprehensive income2 235 (8) – 9 383 (384) 235
Total comprehensive income for the year 2,711 172 – 1,085 2,276 (3,545) 2,699
Attributable to:Equity shareholders 2,711 172 – 1,085 2,288 (3,545) 2,711Non-controlling interests – – – – (12) – (12)
2,711 172 – 1,085 2,276 (3,545) 2,699
1. Profit for the year for British Transco Finance Inc. is £nil as interest payable to external bond holders is offset by interest receivable on loans to National Grid Gas plc.
2. Includes other comprehensive income relating to interest in equity accounted affiliates.
149
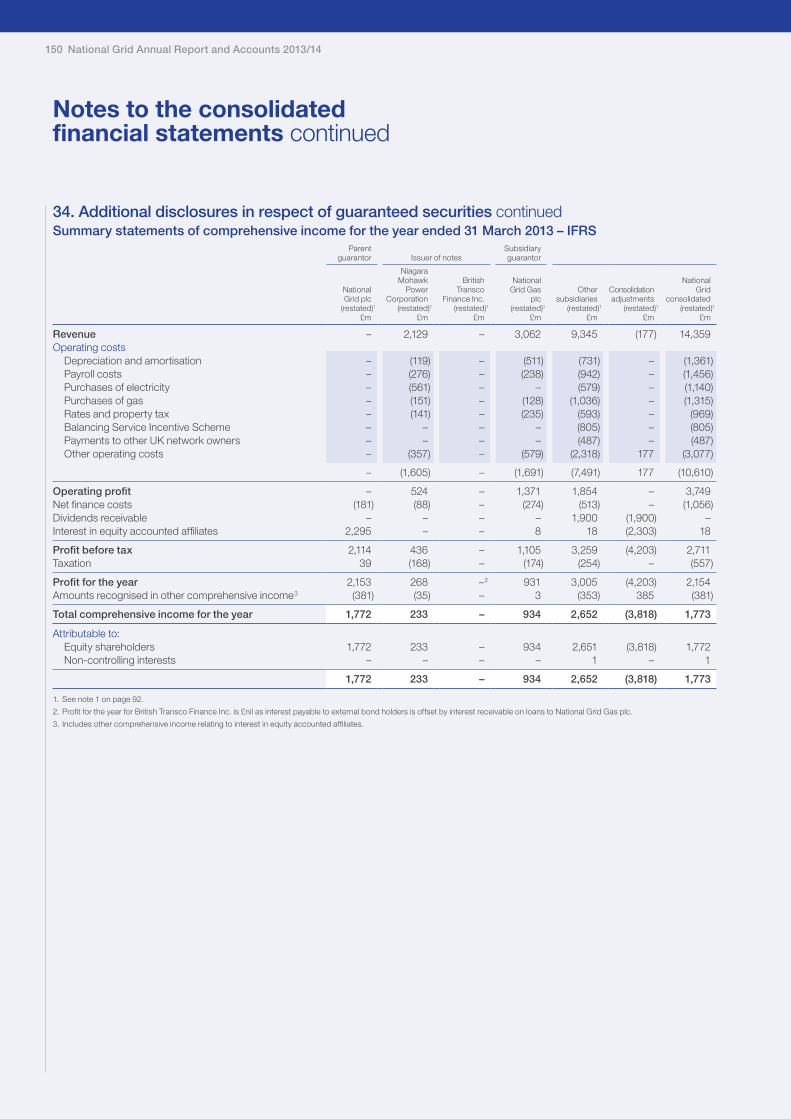
34. Additional disclosures in respect of guaranteed securities continuedSummary statements of comprehensive income for the year ended 31 March 2013 – IFRS
Parentguarantor Issuer of notes
Subsidiaryguarantor
NationalGrid plc
(restated)1
£m
NiagaraMohawk
PowerCorporation
(restated)1
£m
BritishTransco
Finance Inc.(restated)1
£m
NationalGrid Gas
plc(restated)1
£m
Othersubsidiaries
(restated)1
£m
Consolidationadjustments
(restated)1
£m
NationalGrid
consolidated(restated)1
£m
Revenue – 2,129 – 3,062 9,345 (177) 14,359Operating costs
Depreciation and amortisation – (119) – (511) (731) – (1,361)Payroll costs – (276) – (238) (942) – (1,456)Purchases of electricity – (561) – – (579) – (1,140)Purchases of gas – (151) – (128) (1,036) – (1,315)Rates and property tax – (141) – (235) (593) – (969)Balancing Service Incentive Scheme – – – – (805) – (805)Payments to other UK network owners – – – – (487) – (487)Other operating costs – (357) – (579) (2,318) 177 (3,077)
– (1,605) – (1,691) (7,491) 177 (10,610)
Operating profit – 524 – 1,371 1,854 – 3,749Net finance costs (181) (88) – (274) (513) – (1,056)Dividends receivable – – – – 1,900 (1,900) –Interest in equity accounted affiliates 2,295 – – 8 18 (2,303) 18
Profit before tax 2,114 436 – 1,105 3,259 (4,203) 2,711Taxation 39 (168) – (174) (254) – (557)
Profit for the year 2,153 268 –2 931 3,005 (4,203) 2,154Amounts recognised in other comprehensive income3 (381) (35) – 3 (353) 385 (381)
Total comprehensive income for the year 1,772 233 – 934 2,652 (3,818) 1,773
Attributable to:Equity shareholders 1,772 233 – 934 2,651 (3,818) 1,772Non-controlling interests – – – – 1 – 1
1,772 233 – 934 2,652 (3,818) 1,773
1. See note 1 on page 92.
2. Profit for the year for British Transco Finance Inc. is £nil as interest payable to external bond holders is offset by interest receivable on loans to National Grid Gas plc.
3. Includes other comprehensive income relating to interest in equity accounted affiliates.
Notes to the consolidated financial statements continued
150 National Grid Annual Report and Accounts 2013/14

Strategic Report Corporate Governance Financial Statements Additional Information
34. Additional disclosures in respect of guaranteed securities continuedSummary statements of comprehensive income for the year ended 31 March 2012 – IFRS
Parentguarantor Issuer of notes
Subsidiaryguarantor
NationalGrid plc
(restated)1
£m
NiagaraMohawk
PowerCorporation
(restated)1
£m
BritishTransco
Finance Inc.(restated)1
£m
NationalGrid Gas
plc(restated)1
£m
Othersubsidiaries
(restated)1
£m
Consolidationadjustments
(restated)1
£m
NationalGrid
consolidated(restated)1
£m
Revenue – 2,269 – 2,909 8,828 (174) 13,832Operating costs
Depreciation and amortisation – (115) – (491) (666) – (1,272)Payroll costs – (267) – (228) (968) – (1,463)Purchases of electricity – (530) – – (915) – (1,445)Purchases of gas – (169) – (133) (1,221) – (1,523)Rates and property tax – (137) – (236) (582) – (955)Balancing Service Incentive Scheme – – – – (818) – (818)Payments to other UK network owners – – – – (407) – (407)Other operating costs 1 (502) – (492) (1,595) 174 (2,414)
1 (1,720) – (1,580) (7,172) 174 (10,297)
Operating profit 1 549 – 1,329 1,656 – 3,535Net finance costs (133) (97) – (400) (530) – (1,160)Dividends receivable – – – – 350 (350) –Interest in equity accounted affiliates 2,022 – – 5 7 (2,027) 7
Profit before tax 1,890 452 – 934 1,483 (2,377) 2,382Taxation 27 (187) – (102) (201) – (463)
Profit for the year 1,917 265 –2 832 1,282 (2,377) 1,919Amounts recognised in other comprehensive income3 (763) (33) – 9 (773) 797 (763)
Total comprehensive income for the year 1,154 232 – 841 509 (1,580) 1,156
Attributable to:Equity shareholders 1,154 232 – 841 507 (1,580) 1,154Non-controlling interests – – – – 2 – 2
1,154 232 – 841 509 (1,580) 1,156
1. See note 1 on page 92.
2. Profit for the year for British Transco Finance Inc. is £nil as interest payable to external bond holders is offset by interest receivable on loans to National Grid Gas plc.
3. Includes other comprehensive income relating to interest in equity accounted affiliates.
151

34. Additional disclosures in respect of guaranteed securities continuedStatements of financial position as at 31 March 2014 – IFRS
Parentguarantor Issuer of notes
Subsidiaryguarantor
NationalGrid plc
£m
NiagaraMohawk
PowerCorporation
£m
BritishTransco
Finance Inc.£m
NationalGrid Gas
plc£m
Othersubsidiaries
£m
Consolidationadjustments
£m
NationalGrid
consolidated£m
Non-current assetsGoodwill – 581 – – 4,013 – 4,594Other intangible assets – – – 230 439 – 669Property, plant and equipment – 4,266 – 12,259 20,654 – 37,179Other non-current assets – 26 – 15 46 – 87Amounts owed by subsidiary undertakings 305 – 180 5,609 2,676 (8,770) –Pension assets – – – – 174 – 174Financial and other investments 14,520 22 – 50 9,896 (23,853) 635Derivative financial assets 643 – – 642 272 – 1,557
Total non-current assets 15,468 4,895 180 18,805 38,170 (32,623) 44,895
Current assetsInventories and current intangible assets – 27 – 24 217 – 268Trade and other receivables 3 572 – 361 1,855 64 2,855Amounts owed by subsidiary undertakings 9,025 11 5 262 11,100 (20,403) –Financial and other investments 1,481 10 – 420 1,688 – 3,599Derivative financial assets 284 – – 63 174 (108) 413Cash and cash equivalents 24 16 – – 314 – 354
Total current assets 10,817 636 5 1,130 15,348 (20,447) 7,489
Total assets 26,285 5,531 185 19,935 53,518 (53,070) 52,384
Current liabilitiesBorrowings (1,327) (328) (4) (568) (1,284) – (3,511)Derivative financial liabilities (286) – – (99) (62) 108 (339)Trade and other payables (37) (252) – (809) (1,933) – (3,031)Amounts owed to subsidiary undertakings (8,695) (56) – (2,212) (9,440) 20,403 –Current tax liabilities – (64) – (27) (13) (64) (168)Provisions – – – (74) (208) – (282)
Total current liabilities (10,345) (700) (4) (3,789) (12,940) 20,447 (7,331)
Non-current liabilitiesBorrowings (1,850) (1,321) (180) (6,048) (13,040) – (22,439)Derivative financial liabilities (154) – – (279) (391) – (824)Other non-current liabilities – (245) – (1,045) (551) – (1,841)Amounts owed to subsidiary undertakings (2,022) – – (654) (6,094) 8,770 –Deferred tax liabilities (3) (609) – (1,601) (1,869) – (4,082)Pension and other post-retirement benefit obligations – (652) – – (1,933) – (2,585)Provisions – (243) – (158) (962) – (1,363)
Total non-current liabilities (4,029) (3,070) (180) (9,785) (24,840) 8,770 (33,134)
Total liabilities (14,374) (3,770) (184) (13,574) (37,780) 29,217 (40,465)
Net assets 11,911 1,761 1 6,361 15,738 (23,853) 11,919
EquityShare capital 439 112 – 45 182 (339) 439Share premium account 1,336 1,808 – 204 8,032 (10,044) 1,336Retained earnings 14,895 (159) 1 4,814 7,628 (12,284) 14,895Other equity reserves (4,759) – – 1,298 (112) (1,186) (4,759)
Shareholders’ equity 11,911 1,761 1 6,361 15,730 (23,853) 11,911
Non-controlling interests – – – – 8 – 8
Total equity 11,911 1,761 1 6,361 15,738 (23,853) 11,919
Notes to the consolidated financial statements continued
152 National Grid Annual Report and Accounts 2013/14

Strategic Report Corporate Governance Financial Statements Additional Information
34. Additional disclosures in respect of guaranteed securities continuedStatements of financial position as at 31 March 2013 – IFRS
Parentguarantor Issuer of notes
Subsidiaryguarantor
NationalGrid plc
(restated)1
£m
NiagaraMohawk
PowerCorporation
(restated)1
£m
BritishTransco
Finance Inc.£m
NationalGrid Gas
plc£m
Othersubsidiaries
(restated)1
£m
Consolidationadjustments
(restated)1
£m
NationalGrid
consolidated(restated)1
£m
Non-current assetsGoodwill – 737 – – 4,291 – 5,028Other intangible assets – – – 199 390 – 589Property, plant and equipment – 4,441 – 12,122 20,029 – 36,592Other non-current assets – 21 – 12 71 – 104Amounts owed by subsidiary undertakings 295 – – 5,609 2,043 (7,947) –Pension assets – 195 – – – – 195Financial and other investments 12,167 21 – 43 9,896 (21,478) 649Derivative financial assets 585 – – 977 410 – 1,972
Total non-current assets 13,047 5,415 – 18,962 37,130 (29,425) 45,129
Current assetsInventories and current intangible assets – 28 – 22 241 – 291Trade and other receivables 3 428 – 380 2,099 – 2,910Amounts owed by subsidiary undertakings 9,470 18 202 202 12,250 (22,142) –Financial and other investments 2,385 32 – 854 2,160 – 5,431Derivative financial assets 163 – – 119 60 (69) 273Cash and cash equivalents 338 9 – 20 304 – 671
Total current assets 12,359 515 202 1,597 17,114 (22,211) 9,576
Total assets 25,406 5,930 202 20,559 54,244 (51,636) 54,705
Current liabilitiesBorrowings (613) (69) (4) (1,103) (1,659) – (3,448)Derivative financial liabilities (228) – – (86) (162) 69 (407)Trade and other payables (44) (132) – (590) (2,285) – (3,051)Amounts owed to subsidiary undertakings (9,029) (70) – (3,152) (9,891) 22,142 –Current tax liabilities – (59) – (26) (146) – (231)Provisions – – – (63) (245) – (308)
Total current liabilities (9,914) (330) (4) (5,020) (14,388) 22,211 (7,445)
Non-current liabilitiesBorrowings (2,762) (1,798) (198) (6,247) (13,642) – (24,647)Derivative financial liabilities (458) – – (420) (396) – (1,274)Other non-current liabilities – (281) – (1,053) (550) – (1,884)Amounts owed to subsidiary undertakings (2,042) – – – (5,905) 7,947 –Deferred tax liabilities (1) (562) – (1,817) (1,697) – (4,077)Pension and other post-retirement benefit obligations – (980) – – (2,712) – (3,692)Provisions – (268) – (121) (1,063) – (1,452)
Total non-current liabilities (5,263) (3,889) (198) (9,658) (25,965) 7,947 (37,026)
Total liabilities (15,177) (4,219) (202) (14,678) (40,353) 30,158 (44,471)
Net assets 10,229 1,711 – 5,881 13,891 (21,478) 10,234
EquityShare capital 433 123 – 45 182 (350) 433Share premium account 1,344 1,930 – 204 7,426 (9,560) 1,344Retained earnings 13,133 (342) – 4,325 6,471 (10,454) 13,133Other equity reserves (4,681) – – 1,307 (193) (1,114) (4,681)
Shareholders’ equity 10,229 1,711 – 5,881 13,886 (21,478) 10,229
Non-controlling interests – – – – 5 – 5
Total equity 10,229 1,711 – 5,881 13,891 (21,478) 10,234
1. See note 1 on page 92.
153
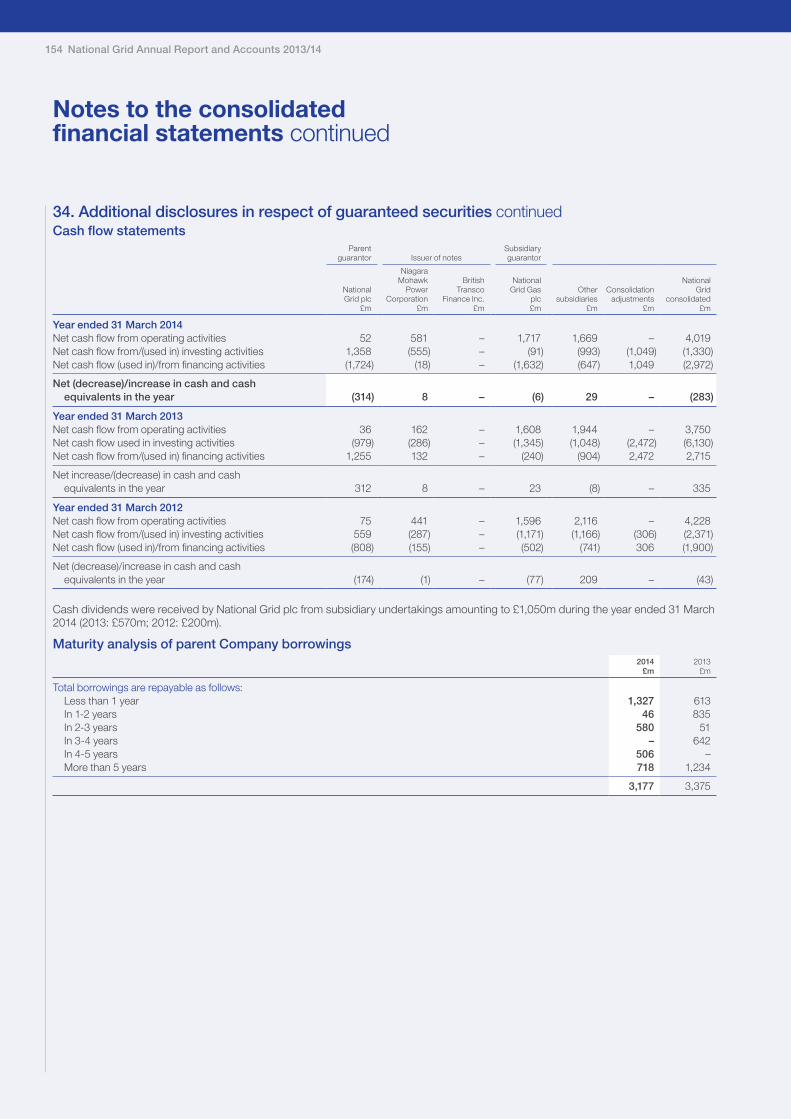
34. Additional disclosures in respect of guaranteed securities continuedCash flow statements
Parentguarantor Issuer of notes
Subsidiaryguarantor
NationalGrid plc
£m
NiagaraMohawk
PowerCorporation
£m
BritishTransco
Finance Inc.£m
NationalGrid Gas
plc£m
Othersubsidiaries
£m
Consolidationadjustments
£m
NationalGrid
consolidated£m
Year ended 31 March 2014Net cash flow from operating activities 52 581 – 1,717 1,669 – 4,019Net cash flow from/(used in) investing activities 1,358 (555) – (91) (993) (1,049) (1,330)Net cash flow (used in)/from financing activities (1,724) (18) – (1,632) (647) 1,049 (2,972)
Net (decrease)/increase in cash and cash equivalents in the year (314) 8 – (6) 29 – (283)
Year ended 31 March 2013Net cash flow from operating activities 36 162 – 1,608 1,944 – 3,750Net cash flow used in investing activities (979) (286) – (1,345) (1,048) (2,472) (6,130)Net cash flow from/(used in) financing activities 1,255 132 – (240) (904) 2,472 2,715
Net increase/(decrease) in cash and cash equivalents in the year 312 8 – 23 (8) – 335
Year ended 31 March 2012Net cash flow from operating activities 75 441 – 1,596 2,116 – 4,228Net cash flow from/(used in) investing activities 559 (287) – (1,171) (1,166) (306) (2,371)Net cash flow (used in)/from financing activities (808) (155) – (502) (741) 306 (1,900)
Net (decrease)/increase in cash and cash equivalents in the year (174) (1) – (77) 209 – (43)
Cash dividends were received by National Grid plc from subsidiary undertakings amounting to £1,050m during the year ended 31 March 2014 (2013: £570m; 2012: £200m).
Maturity analysis of parent Company borrowings2014
£m2013
£m
Total borrowings are repayable as follows:Less than 1 year 1,327 613In 1-2 years 46 835In 2-3 years 580 51In 3-4 years – 642In 4-5 years 506 –More than 5 years 718 1,234
3,177 3,375
Notes to the consolidated financial statements continued
154 National Grid Annual Report and Accounts 2013/14

Strategic Report Corporate Governance Financial Statements Additional Information
We are required to include the stand-alone balance sheet of our ultimate parent Company, National Grid plc, under the Companies Act 2006. This is because the publicly traded shares are those of National Grid plc and the following disclosures provide additional information to shareholders.
A. Basis of preparation of individual financial statements under UK GAAPThese individual financial statements of the Company have been prepared in accordance with applicable UK accounting and financial reporting standards and the Companies Act 2006. They have been prepared on an historical cost basis, except for the revaluation of financial instruments, and are presented in pounds sterling, which is the currency of the primary economic environment in which the Company operates. The 2013 comparative financial information has also been prepared on this basis.
These individual financial statements have been prepared on a going concern basis following the assessment made by the Directors as set out on page 52.
The Company has not presented its own profit and loss account as permitted by section 408 of the Companies Act 2006.
The Company has taken advantage of the exemptions in FRS 8 ‘Related Party Disclosures’ from disclosing transactions with other members of the National Grid plc group of companies.
In accordance with exemptions under FRS 29 ‘Financial Instruments: Disclosures’, the Company has not presented the financial instruments disclosures required by the standard, as disclosures which comply with the standard are included in the consolidated financial statements.
B. Fixed asset investmentsInvestments held as fixed assets are stated at cost less any provisions for impairment. Investments are reviewed for impairment if events or changes in circumstances indicate that the carrying amount may not be recoverable. Impairments are calculated such that the carrying value of the fixed asset investment is the lower of its cost or recoverable amount. Recoverable amount is the higher of its net realisable value and its value-in-use.
C. TaxationCurrent tax for the current and prior periods is provided at the amount expected to be paid or recovered using the tax rates and tax laws that have been enacted or substantively enacted by the balance sheet date.
Deferred tax is provided in full on timing differences which result in an obligation at the balance sheet date to pay more tax, or the right to pay less tax, at a future date, at tax rates expected to apply when the timing differences reverse based on tax rates and tax laws that have been enacted or substantively enacted by the balance sheet date. Timing differences arise from the inclusion of items of income and expenditure in taxation computations in periods different from those in which they are included in the financial statements.
Deferred tax assets are recognised to the extent that it is regarded as more likely than not that they will be recovered. Deferred tax assets and liabilities are not discounted.
D. Foreign currenciesTransactions in currencies other than the functional currency of the Company are recorded at the rates of exchange prevailing on the dates of the transactions. At each balance sheet date, monetary assets and liabilities that are denominated in foreign currencies are retranslated at closing exchange rates. Gains and losses arising on retranslation of monetary assets and liabilities are included in the profit and loss account.
E. Financial instrumentsThe Company’s accounting policies under UK GAAP, namely FRS 25 ‘Financial Instruments: Presentation’, FRS 26 ‘Financial Instruments: Measurement’ and FRS 29 ‘Financial Instruments: Disclosures’, are the same as the Group’s accounting policies under IFRS, namely IAS 32 ‘Financial Instruments: Presentation’, IAS 39 ‘Financial Instruments: Recognition and Measurement’ and IFRS 7 ‘Financial Instruments: Disclosures’. The Company applies these policies only in respect of the financial instruments that it has, namely investments, derivative financial instruments, debtors, cash at bank and in hand, borrowings and creditors.
The policies are set out in notes 13, 15, 17, 18, 19 and 20 to the consolidated financial statements. The Company is taking the exemption for financial instruments disclosures, because IFRS 7 disclosures are given in notes 30 and 33 to the consolidated financial statements.
F. Hedge accountingThe Company applies the same accounting policy as the Group in respect of fair value hedges and cash flow hedges. This policy is set out in note 15 to the consolidated financial statements.
G. Parent Company guaranteesThe Company has guaranteed the repayment of the principal sum, any associated premium and interest on specific loans due by certain subsidiary undertakings primarily to third parties. In the event of default or non performance by the subsidiary, the Company recognises such guarantees as insurance contracts, at fair value with a corresponding increase in the carrying value of the investment.
H. Share awards to employees of subsidiary undertakingsThe issuance by the Company to employees of its subsidiaries of a grant over the Company’s options represents additional capital contributions by the Company to its subsidiaries. An additional investment in subsidiaries results in a corresponding increase in shareholders’ equity. The additional capital contribution is based on the fair value of the option at the date of grant, allocated over the underlying grant’s vesting period. Where payments are subsequently received from subsidiaries, these are accounted for as a return of a capital contribution and credited against the Company’s investments in subsidiaries. The Company has no employees.
I. DividendsInterim dividends are recognised when they are paid to the Company’s shareholders. Final dividends are recognised when they are approved by shareholders.
Company accounting policies
155

Notes2014
£m2013
£m
Fixed assetsInvestments 1 8,803 8,177
Current assetsDebtors (amounts falling due within one year) 2 9,312 9,636Debtors (amounts falling due after more than one year) 2 948 880Investments 5 1,504 2,723Cash at bank and in hand 1 –
Total current assets 11,765 13,239
Creditors (amounts falling due within one year) 3 (10,345) (9,914)
Net current assets 1,420 3,325
Total assets less current liabilities 10,223 11,502
Creditors (amounts falling due after more than one year) 3 (4,029) (5,263)
Net assets 6,194 6,239
Capital and reservesCalled up share capital 7 439 433Share premium account 8 1,336 1,344Cash flow hedge reserve 8 20 12Available-for-sale reserve 8 1 –Other equity reserves 8 260 240Profit and loss account 8 4,138 4,210
Total shareholders’ funds 9 6,194 6,239
The notes on pages 157 to 159 form part of the individual financial statements of the Company, which were approved by the Board of Directors on 18 May 2014 and were signed on its behalf by:
Sir Peter Gershon Chairman Andrew Bonfield Finance Director
Company balance sheetat 31 March
156 National Grid Annual Report and Accounts 2013/14

Strategic Report Corporate Governance Financial Statements Additional Information
Notes to the Company financial statements
1. Fixed asset investmentsShares in
subsidiaryundertakings
£m
At 1 April 2012 8,157Additions 20
At 31 March 2013 8,177Additions 626
At 31 March 2014 8,803
During the year there was a capital contribution of £20m (2013: £20m) which represents the fair value of equity instruments granted to subsidiaries’ employees arising from equity-settled employee share schemes. On 27 March 2014, the Company also acquired a further 98,851 ordinary shares of £1 each in National Grid (US) Holdings Limited for a total consideration of £606m.
The names of the principal subsidiary undertakings, joint ventures and associates are included in note 32 to the consolidated financial statements. The Directors believe that the carrying value of the investments is supported by the fair value of their underlying net assets.
2. Debtors2014
£m2013
£m
Amounts falling due within one yearDerivative financial instruments (note 4) 284 163Amounts owed by subsidiary undertakings 9,025 9,470Prepayments and accrued income 3 3
9,312 9,636
Amounts falling due after more than one yearDerivative financial instruments (note 4) 643 585Amounts owed by subsidiary undertakings 305 295
948 880
The carrying values stated above are considered to represent the fair values of the assets.
3. Creditors2014
£m2013
£m
Amounts falling due within one yearBorrowings (note 6) 1,327 613Derivative financial instruments (note 4) 286 228Amounts owed to subsidiary undertakings 8,695 9,029Other creditors 37 44
10,345 9,914
Amounts falling due after more than one yearBorrowings (note 6) 1,850 2,762Derivative financial instruments (note 4) 154 458Amounts owed to subsidiary undertakings 2,022 2,042Deferred taxation 3 1
4,029 5,263
The carrying values stated above are considered to represent the fair values of the liabilities.
Deferredtaxation
£m
At 1 April 2012 (1)Charged to the profit and loss account 1Charged to equity 1
At 31 March 2013 1Charged to the profit and loss account 1Charged to equity 1
At 31 March 2014 3
157

4. Derivative financial instrumentsThe fair values of derivative financial instruments are:
2014 2013
Assets£m
Liabilities£m
Total£m
Assets£m
Liabilities£m
Total£m
Amounts falling due within one year 284 (286) (2) 163 (228) (65)Amounts falling due after more than one year 643 (154) 489 585 (458) 127
927 (440) 487 748 (686) 62
For each class of derivative the notional contract* amounts are as follows:
2014£m
2013£m
Interest rate swaps (6,531) (8,015)Cross-currency interest rate swaps (4,490) (5,376)Foreign exchange forward contracts (11,626) (9,080)
Total (22,647) (22,471)
*The notional contract amounts of derivatives indicate the gross nominal value of transactions outstanding at the balance sheet date.
5. InvestmentsThe following table sets out the Company’s current asset investments:
2014£m
2013£m
Investments in short-term money funds 1,238 2,113Short-term deposits 245 438Restricted cash balances – collateral 21 172
1,504 2,723
6. BorrowingsThe following table analyses the Company’s total borrowings:
2014£m
2013£m
Amounts falling due within one yearBank loans 423 277Bonds 904 336
1,327 613
Amounts falling due after more than one yearBonds 1,850 2,762
Total borrowings 3,177 3,375
The maturity of total borrowings is disclosed in note 34 to the consolidated financial statements. There are no differences in the maturities as calculated under IFRS or UK GAAP.
The notional amount of borrowings outstanding as at 31 March 2014 was £3,074m (2013: £3,250m). Further information on significant borrowings can be found on the debt investors section of our website.
7. Called up share capitalThe called up share capital amounting to £439m (2013: £433m) consists of 3,854,339,684 (2013: 3,794,575,998) ordinary shares. For further information on share capital, refer to note 24 to the consolidated financial statements.
Notes to the Company financial statements continued
158 National Grid Annual Report and Accounts 2013/14

Strategic Report Corporate Governance Financial Statements Additional Information
8. ReservesShare
premiumaccount
£m
Cash flowhedge
reserve£m
Available-for-salereserve
£m
Other equityreserves
£m
Profit andloss account
£m
At 1 April 2012 1,355 9 – 220 4,579Transferred from equity in respect of cash flow hedges (net of tax) – 3 – – –Shares issued in lieu of dividends (11) – – – –Issue of treasury shares – – – – 19Purchase of own shares – – – – (6)Share awards to employees of subsidiary undertakings – – – 20 –Loss for the financial year – – – – (382)
At 31 March 2013 1,344 12 – 240 4,210Transferred from equity in respect of cash flow hedges (net of tax) – 8 – – –Net gains taken to equity – – 1 – –Shares issued in lieu of dividends (8) – – – –Issue of treasury shares – – – – 14Purchase of own shares – – – – (3)Share awards to employees of subsidiary undertakings – – – 20 –Loss for the financial year – – – – (83)
At 31 March 2014 1,336 20 1 260 4,138
There were no gains and losses, other than losses for the years stated above; therefore no separate statement of total recognised gains and losses has been presented. At 31 March 2014, £86m (2013: £86m) of the profit and loss account reserve relating to gains on intra-group transactions was not distributable to shareholders.
9. Reconciliation of movements in total shareholders’ funds2014
£m2013
£m
Profit for the financial year 976 428Dividends1 (1,059) (810)
Loss for the financial year (83) (382)Issue of treasury shares 14 19Purchase of own shares (3) (6)Shares issued in lieu of dividends2 (2) –Movement on cash flow hedge reserve (net of tax) 8 3Movement on available-for-sale reserve 1 –Share awards to employees of subsidiary undertakings 20 20
Net decrease in shareholders’ funds (45) (346)Opening shareholders’ funds 6,239 6,585
Closing shareholders’ funds 6,194 6,239
1. For further details of dividends paid and payable to shareholders, refer to note 8 to the consolidated financial statements.
2. Included within share premium account are costs associated with scrip dividends.
10. Parent Company guaranteesThe Company has guaranteed the repayment of the principal sum, any associated premium and interest on specific loans due by certain subsidiary undertakings primarily to third parties. At 31 March 2014, the sterling equivalent amounted to £2,713m (2013: £2,767m). The guarantees are for varying terms from less than one year to open-ended.
11. Audit feesThe audit fee in respect of the parent Company was £26,750 (2013: £25,750). Fees payable to PricewaterhouseCoopers LLP for non-audit services to the Company are included within note 3 (e) to the consolidated financial statements.
159

Additional Information
Business information in detail
Contents160 Business information in detail
160 UK regulation162 US regulation166 Where we operate167 Risk factors
170 Internal control170 Information assurance170 Disclosure controls170 Internal control over financial reporting
171 Directors’ Report disclosures171 Articles of Association171 Board biographies173 Capital gains tax (CGT)173 Change of control provisions173 Conflicts of interest173 Directors’ indemnity173 Events after the reporting period174 Material interests in shares174 Political donations and expenditure174 Research and development174 Share capital175 Share price
176 Other disclosures176 Articles of Association177 Code of Ethics177 Corporate governance practices:
differences from New York Stock Exchange (NYSE) listing standards
177 Depositary payments to the Company178 Description of securities other than equity
securities: depositary fees and charges178 Documents on display178 Employees178 Exchange controls178 Exchange rates179 Key milestones179 Material contracts179 Property, plant and equipment179 Shareholder analysis179 Taxation181 The All-employee Share Plans181 The offer and listing181 Unresolved SEC staff comments
182 Other unaudited financial information
186 Summary consolidated financial information
188 Definitions and glossary of terms
192 Want more information or help?
UK regulationOur licences, established under the Gas Act 1986 and Electricity Act 1989, as amended (the Acts), require us to develop, maintain and operate economic and efficient networks and to facilitate competition in the supply of gas and electricity in Great Britain. They also give us statutory powers, such as the right to bury our pipes or cables under public highways and the ability to use compulsory powers to purchase land to enable the conduct of our business.
Our networks are regulated by Ofgem, which has established price control mechanisms that set the amount of revenue that can be earned by our regulated businesses. Price control regulation is designed to ensure our interests, as a monopoly, are balanced with those of our customers. Ofgem allows us to charge reasonable, but not excessive, prices giving us a future level of revenue sufficient to meet our statutory duties and licence obligations, and also to make a reasonable return on our investment.
The price control includes a number of mechanisms to achieve its objectives, including financial incentives designed to encourage us to: continuously improve the cost and effectiveness of our services; manage and operate our networks efficiently; deliver high-quality services to our customers and wider stakeholder community; and invest in the development of the network in a manner that ensures long-term security of supply.
Our UK Electricity Transmission (UK ET), UK Gas Transmission (UK GT) and UK Gas Distribution (UK GD) businesses operate under eight separate price controls in the UK. These comprise two for our UK ET operations, one covering our role as transmission owner (TO) and the other for our role as system operator (SO); two for our UK GT operations, again one as TO and one as SO; and one for each of our four regional gas distribution networks. While each of the eight price controls may have differing terms, they are based on a consistent regulatory framework.
In addition to the eight price controls, our LNG storage business has a price control covering some aspects of its operations. There is also a tariff cap price control applied to certain elements of domestic metering and daily meter reading activities undertaken by National Grid Metering.
Interconnectors derive their revenues from congestion revenues. Congestion revenues are dependent on the existence of price differentials between markets at either end of the interconnector. European legislation governs how capacity is allocated. It requires all interconnection capacity to be allocated to the market via market-based methods, ie auctions.
There are two routes for interconnector investment: a regulated route, where interconnector developers have to comply with all aspects of European legislation on cross-border electricity infrastructure and receive a regulated return for their investment; or a merchant-exempt route, where developers would face the full upside and downside of the investment and typically have an exemption from European legislation.
National Grid’s UK interconnectors earn their revenue by auctioning capacity based on the price difference between the markets at each end of the link and are referred to as merchant interconnectors; this being the typical UK model.
National Grid Annual Report and Accounts 2013/14160

Strategic Report Corporate Governance Financial Statements Additional Information
RIIO price controlsOur UK regulator has introduced a new regulatory framework called RIIO (revenue = incentives + innovation + outputs) that became effective on 1 April 2013 and lasts for eight years. The building blocks of the RIIO price control are broadly similar to the historical price controls used in the UK; however there are some significant differences in the mechanics of the calculations.
How is revenue calculated?Under RIIO the outputs we deliver are clearly articulated and are integrally linked to the calculation of our allowed revenue. These outputs have been determined through an extensive consultation process which has given stakeholders a greater opportunity to input to these decisions. The clarity around outputs should lead to greater transparency of our performance in delivering them.
The six key output categories are:
• Safety: ensuring the provision of a safe energy network. • Reliability (and availability): promoting networks capable of
delivering long-term reliability, as well as minimising the number and duration of interruptions experienced over the price control period, and ensuring adaptation to climate change.
• Environmental impact: encouraging companies to play their role in achieving broader environmental objectives – specifically facilitating the reduction of carbon emissions – as well as minimising their own carbon footprint.
• Customer and stakeholder satisfaction: maintaining high levels of customer satisfaction and stakeholder engagement, and improving service levels.
• Customer connections: encouraging networks to connect customers quickly and efficiently.
• Social obligations (UK GD only): extending the gas network to communities that are fuel poor where it is efficient to do so and introducing measures to address carbon monoxide poisoning incidents.
Within each of these output categories are a number of primary and secondary deliverables, reflecting what our stakeholders want us to deliver over the coming price control period. The nature and number of these deliverables varies according to the output category, with some being linked directly to our allowed revenue, some linked to legislation, and others having only a reputational impact. Ofgem, using information submitted by us along with independent assessments, determines the efficient level of expected costs necessary to deliver them. Under RIIO this is known as totex, short for total expenditure, and is similar to the sum of controllable opex, capex and repex (for UK GD) under the previous price control.
A number of assumptions are necessary in setting these outputs, such as certain prices or the volumes of work that will be needed. As a result, to protect us and our customers from windfall gains and losses, there are a number of uncertainty mechanisms within the RIIO framework that can result in adjustments to totex if actual prices or volumes differ from the assumptions.
Where we under- or over-spend the allowed totex for reasons that are not covered by uncertainty mechanisms, there is a sharing factor, ie the under- or over-spend is shared between us and customers through an adjustment to allowed revenues in a future year. This sharing factor provides an incentive for us to provide the outputs efficiently as we are able to keep a portion of the savings, with the remainder benefiting our customers.
This sharing factor is one of the ways that RIIO has given innovation more prominence. Innovation includes traditional areas such as new technologies, as well as the broader challenge of finding new ways of working to deliver outputs more efficiently. This broader challenge will have an impact on everyone in our business.
Totex is then split between fast and slow money, a new concept under RIIO, based on a specified percentage. Fast money represents the amount of totex that we are able to recover in the current year. Slow money is added to our RAV.
In addition to fast money, in each year we are allowed to collect a depreciation of and a return on our RAV.
This operates in a similar way to the previous price control, although there have been changes to the asset lives for electricity transmission (transition from 20 years to 45 years evenly across the RIIO period) and the depreciation calculation for UK GD (changed from 45 years straight line to 45 years sum of digits for assets added post 2002). We are also allowed to collect additional revenues related to non-controllable costs and incentives.
The incentive mechanisms can increase or decrease our allowed revenue and result from our performance against various measures related to our outputs. RIIO has introduced new incentive mechanisms as a way to provide further incentives to align our objectives with those of our customers and other stakeholders. For example, performance against our customer satisfaction targets can have a positive or negative effect of up to 1% of allowed annual revenues. Incentives will normally affect our revenues two years after the year of performance.
RIIO regulatory building blocks
Revenue
Other costs eg tax
Performance against incentives
Totex (capital invested+ controllableoperating costs)
Allowed return
Depreciation of RAV
RAV (slow money)
Fast money
X
Allowed returnsThe cost of capital allowed under RIIO is as follows:
Transmission Gas Distribution
Gas Electricity
Cost of equity (post-tax real) 6.8% 7.0% 6.7%
Cost of debt (pre-tax real) iBoxx 10 year simple trailing average index (2.92% for 2013/14)
Notional gearing 62.5% 60.0% 65.0%
Vanilla WACC1 4.38% 4.55% 4.24%
1. Vanilla WACC = cost of debt x gearing + cost of equity x (1- gearing).
161

Gas and electricity rates are established from a revenue requirement which comprises the utility’s total cost of providing distribution or delivery service to its customers. It includes operating expenses, depreciation, taxes and a fair and reasonable return on certain components of the utility’s regulated asset base, typically referred to as its rate base.
The rate of return applied to the rate base is the utility’s weighted average cost of capital. This represents its cost of debt and an allowed RoE intended to provide the utility with an opportunity to attract capital from investors and maintain its financial integrity. The total revenue requirement is apportioned among different customer classes and categories of service to establish the prices for service. The final revenue requirement and prices are ultimately approved in the rate case decision.
The revenue requirement is derived from a comprehensive study of the utility’s total costs during a recent 12 month period of operations, referred to as a test year.
Each commission has its own rules and standards for adjustments to the test year. These are intended to arrive at the total costs expected in the first year new rates will be in effect, or the rate year, and may include forecast capital investments in determining rate year rate base. Often, known and measurable adjustments are made to test year data to reflect normal operating conditions. In Massachusetts, only limited adjustments to this test year are allowed, which are required to be both known and measurable. New York and Rhode Island allow more comprehensive adjustments to the test year. In summary, the US regulatory regime is based on a building block approach intended to allow the utility to recover its cost of service and earn a return on its investments.
US regulatory building blocks
A B C D E F G H I J
Capex and RoE Cost of service
A Rate baseB DebtC EquityD ReturnE Controllable costs
F Non-controllable costsG DepreciationH TaxesI Lagged recoveriesJ Allowed revenue
X allowed RoE
X cost of debt
RoE
Interest
Our rate plansEach operating company has a set of rates for service. We have three electric distribution operations (upstate New York, Massachusetts, and Rhode Island) and six gas distribution
The sharing factor means that any over- and under-spend is shared between the businesses and consumers. The shared figures displayed are the sharing factors that apply to UK ET, UK GT and UK GD.
For more information on RIIO, including incentive mechanisms, please see the relevant investor fact sheets on the Investor Relations section of our website.
US regulationRegulatorsIn the US, public utilities’ retail transactions are regulated by state utility commissions, including the NYPSC, the MADPU and the RIPUC.
Utility commissions serve as economic regulators, approving cost recovery and authorised rates of return. The state commissions establish the retail rates to recover the cost of transmission and distribution services, and focus on services and costs within their jurisdictions. FERC regulates the wholesale transactions of public utilities, such as interstate transmission and electricity generation, and provides for the wholesale cost recovery of these services.
Utility commissions are also charged with serving the public interest by ensuring utilities provide safe and reliable service at just and reasonable prices. They establish service standards and approve mergers and acquisitions of public utilities. FERC also regulates public utility holding companies and centralised service companies, including those of our US businesses.
With the exception of residential gas customers in Rhode Island, all of our customers are allowed to select a competitive supplier for the supply component of electricity and gas utility services.
Regulatory processUtilities in the US submit a formal rate filing to the relevant state regulatory body, requesting a revenue adjustment in a proceeding known as a rate case.
The rate case process is conducted in a litigated setting and, in the states in which we operate, it can take 10 to 13 months for the commission to render a final decision. In all states, the utility is required to prove that its requested rate change is prudent and reasonable. The utility may request a rate plan that can span multiple years. Unlike the state processes, the federal regulator has no specified timeline for adjudicating a rate case, but typically makes a final decision retroactive when the case is completed.
During the rate case process, consumer advocates and other intervening parties scrutinise and often file opposing positions to the utility’s rate request. The rate case decision reflects a weighing of the facts in light of the regulator’s policy objectives.
During a rate case, the utility, consumer advocates and intervening parties may agree on the resolution of aspects of a case and file a negotiated settlement with a commission for approval.
Gas Transmission Electricity Transmission Gas Distribution
Transmission Operator
System Operator
Transmission Operator
System Operator
North West
East of England
West Midlands London
1 FastBaseline 35.6%
62.60% 15.00% 72.10%
Repex: Stepped decline from 50% in 2013/14 to 0% in 2020/21 in seven equal instalments of 7.14% per annum
Uncertainty 10% 73.90% 73.37% 75.05% 76.53%
2 SlowBaseline 64.4%
37.40% 85.00% 27.90%
Repex: Stepped increase from 50% in 2013/14 to 100% in 2020/21 in seven equal instalments of 7.14% per annum
Uncertainty 90% 26.10% 26.63% 24.95% 23.47%
3 Sharing 44.36% 46.89% 63.04%
Business information in detail continued
162 National Grid Annual Report and Accounts 2013/14

Strategic Report Corporate Governance Financial Statements Additional Information
networks (upstate New York, New York City, Long Island, Massachusetts (2), and Rhode Island). Distribution and transmission electricity services in upstate New York are recovered with a combined rate billed to end use customers. In New England, retail transmission rates recover wholesale transmission charges assessed to our electric distribution companies from our end use customers.
Our rate plans are designed to a specific allowed RoE, by reference to an allowed operating expense level and rate base. Some rate plans include earnings sharing mechanisms that allow us to retain a proportion of the earnings above our allowed RoE we achieve through improving efficiency, with the balance benefiting customers.
In addition, our performance under certain rate plans is subject to service performance targets. We may be subject to monetary penalties in cases where we do not meet those targets.
Allowed RoE in contextOne measure used to monitor the performance of our regulated businesses is a comparison of achieved RoE to allowed RoE, with a target that the achieved should be equal to or above the allowed. This measure cannot be used in isolation, however, as there are a number of factors that may prevent us from achieving that target in any given year:
• Regulatory lag: in the years following the rate year, costs may increase due to inflation or other factors. If the cost increases cannot be offset by productivity gains, the total cost to deliver will be higher as a proportion of revenue and therefore achieved RoE will be lowered.
• Cost disallowances: a cost disallowance is a decision by the regulator that a certain expense should not be recovered in rates from customers. The regulator may do this for a variety of reasons. We can respond to some disallowances by choosing not to incur those costs; others may be unavoidable. As a result, unless offsetting cost reductions can be found, the achieved RoE will be lowered.
• Market conditions: if a utility files a new rate case, the new allowed RoE may be below the current allowed RoE as financial market conditions may have changed. As such, a utility that appears to be underperforming the allowed RoE and files a new rate case may not succeed in increasing revenues.
We work to increase achieved RoEs through: productivity improvements; positive performance against incentives or earned savings mechanisms such as energy efficiency programmes, where available; and, through filing a new rate case when achieved returns are lower than that which the Company could reasonably expect to attain through a new rate case.
Features of our rate plansWe are responsible for billing our customers for their use of electricity and gas services. Customer bills typically comprise a commodity charge, covering the cost of the electricity or gas delivered, and charges covering our delivery service. Depending on the state, delivery rates are either based upon actual sales volumes and costs incurred in an historical test year, or on estimates of sales volumes and costs, and in both cases may differ from actual amounts. A substantial proportion of our costs, in particular electricity and gas purchases for supply to customers, are pass-through costs, meaning they are fully recoverable from our customers. These pass-through costs are recovered through separate charges to customers that are designed to recover those costs with no profit. Rates are adjusted from time to time to ensure any over- or under-recovery of these costs is returned to,
or recovered from, our customers. There can be timing differences between costs being incurred and rates being adjusted.
Revenue for our wholesale transmission businesses in New England and New York is collected from wholesale transmission customers, who are typically other utilities and include our own New England electricity distribution businesses. With the exception of upstate New York, which continues to combine retail transmission and distribution rates to end use customers, these wholesale transmission costs are incurred by distribution utilities on behalf of their customers and are fully recovered as a pass-through from end use customers as approved by each state commission. Our Long Island generation plants sell capacity to LIPA under a power supply agreement, approved by FERC, which provides a similar economic effect to cost of service rate regulation.
US regulatory filingsThe objectives of our rate case filings are to ensure we have the right cost of service with the ability to earn a fair and reasonable rate of return, while providing a safe and reliable service to our customers. In order to achieve these objectives and to reduce regulatory lag, we have been requesting structural changes, such as revenue decoupling mechanisms, capital trackers, commodity-related bad debt true-ups, and pension and other post-employment benefit (OPEB) true-ups, separately from base rates. These terms are explained below the table on page 165.
Below we summarise significant developments in rate filings and the regulatory environment during the year.
MassachusettsCapital investment programmesOur Massachusetts gas and electricity operating companies have rate mechanisms that allow for the recovery of new capital investment, including a return, outside of base rate proceedings, subject to further review and reconciliation. Most recently, on the gas side, MADPU allowed approximately $11.6 million into rates effective from 1 November 2013, related to incremental additions to the rate base, and on the electricity side it allowed approximately $8.8 million into rates effective from 1 March 2014, related to rate base additions.
Storm fund recoveryThe Massachusetts electricity business collects $4.3 million per year in base rates to credit towards a storm fund devoted to funding storm restoration. The severity and frequency of storms in Massachusetts over the last few years left our storm fund in a deficit position of approximately $212 million. On 3 May 2013, MADPU allowed us to begin collecting $40 million per year for three years towards the replenishment of the storm fund, subject to a review of the prudency of the underlying costs. That review is under way. The funding of the remaining deficit will be addressed as part of the prudency review and in future rate proceedings.
Storm management auditThe MADPU’s December 2012 order regarding our performance during Tropical Storm Irene and the October 2011 snowstorm requires us to undergo an independent audit regarding our storm management. This audit is under way, addressing: emergency management systems, protocols and plans; preparation for and management of restoration efforts with respect to emergency events; the Company’s emergency response resources and allocation of those resources during an emergency event; communications with state, municipal and public safety officials and with the DPU; dissemination of timely information to the public; and identification of management recommendations.
163

increases. The A&RPSA allows both parties a RoE reopener in contract years four to six depending on financial market changes, and National Grid a one-time rate reopener in contract year six.
The A&RPSA also contains new options for modernising the power plants through retirement or repowering existing facilities to reduce energy costs and improve environmental performance.
Rhode IslandRhode Island 2014/15 electricity and gas infrastructure, safety, and reliability plans (ISR)Legislation provides our Rhode Island gas and electricity operating divisions with rate mechanisms that allow for recovery of capital investment, including a return, outside of base rate proceedings through the submission of annual ISR plans.
The electricity plan includes electricity operation expenses for vegetation management and certain inspection and maintenance costs.
In December 2013, we filed annual petitions seeking approval of our 2014/15 ISR plans for the electricity and gas systems. The PUC approved the petitions in March 2014.
The electricity ISR plan encompasses a $74.3 million spending programme for capital investment and $10.7 million for operating and maintenance expenses for vegetation management and inspection and maintenance.
The gas ISR plan encompasses a $71.7 million spending for capital investment and, for the first time, incremental operation and maintenance expense for the hiring, training and supervision of additional personnel to support increases in leak-prone pipe replacement.
FERCComplaint on transmission allowed RoEIn September 2011 and December 2012, complaints were filed with FERC against certain transmission owners, including our New England transmission business, to lower the base RoE from the FERC approved rate of 11.14% to 9.2% and 8.7% respectively. The transmission owners argued that the complainants have not proven the existing rate is unjust and unreasonable and that the 11.14% base RoE should remain in effect. Non-binding preliminary findings by a FERC administrative law judge, suggested a 10.6% base RoE for a 15 month refund and a 9.7% base RoE prospectively.
Short-term borrowing extensionIn October 2013, National Grid filed an application with FERC on behalf of its electricity public utility subsidiaries seeking an extension of the Commission’s prior authorisation to issue short-term debt, as required by Section 204 of the Federal Power Act. National Grid explained in its extension request that challenges associated with the implementation of the US enterprise resource system had delayed the production of certain FERC financial reports that are required in any Section 204 filing. FERC denied the extension request on the grounds that the lack of current FERC financial reports rendered the Commission unable to make the required findings under Section 204 as to the Company’s ability to perform certain public utility functions. As a result, National Grid implemented a contingency plan aimed at ensuring that each impacted public utility subsidiary would have sufficient cash resources pending a new short-term borrowing authorisation. This contingency plan included the receipt of open account advances and/or capital contributions permitted under the existing FERC borrowing authorisation. National Grid intends to file its Section 204 renewal applications as soon as practicable this year.
New YorkUpstate New York 2012 rate plan filingEffective from 1 April 2013, the upstate New York electricity and gas businesses began the first year of their new three year rate plan. The new rate plan provides an increase in electricity delivery revenue of $43.4 million, $51.4 million and $28.3 million for rate years one to three respectively. For the gas operations, the rate plan provides a decrease in delivery revenue of $3.3 million in rate year one and an increase of $5.9 million and $6.3 million in rate years two and three respectively. The revenue requirements for Niagara Mohawk’s electricity and gas businesses are based on a RoE of 9.3%, which includes a stay out premium for the three year term, and a capital structure that includes a 48% common equity component. The final agreement also includes annual reconciliation mechanisms for certain non-controllable costs.
Downstate New York rate plan extensionIn 2013, The Brooklyn Union Gas Company (also known as KeySpan Energy Delivery New York or KEDNY) received approval from the PSC to extend its existing five year rate plan by two years. The extension provides a 9.4% RoE, with a 48% equity structure. Under the agreement, 80% of any earnings over 9.4% will fund recovery of prior environmental deferrals with the remaining 20% being retained by KEDNY. The agreement increased capital expenditure allowances to $320.1 million in 2013 and $293.7 million in 2014 as compared with the prior capital allowances of $155.4 million per year. The agreement also proposed updates to various customer service and other performance metrics.
2013 New York gas management auditOn 13 February 2013, the PSC announced a comprehensive management and operations audit of National Grid’s three New York gas distribution utilities. New York law requires periodic management audits of all utilities at least once every five years. We last underwent a management audit in 2009 when the PSC audited Niagara Mohawk’s electricity business.
The final report is expected to be filed with the PSC this summer. The report will make recommendations regarding the operation and management of our New York gas utilities, and will specify costs and savings associated with each recommendation. In our next major gas rate proceeding, the Commission will consider our effectiveness in implementing the audit recommendations and seek to reflect the costs and savings associated with the recommendations in rates.
Long IslandLIPA Amended and Restated Power Supply Agreement (A&RPSA)We own and manage a number of power plants on Long Island, with a generation capacity of 3.8 GW. We supply wholesale capacity and energy to LIPA under an agreement with LIPA that was renewed in May 2013. LIPA in turn provides retail electricity to communities and businesses on Long Island.
On 23 May 2013, FERC approved the A&RPSA which expires on 30 April 2028 and replaces the original Power Supply Agreement that was effective from May of 1998 to May of 2013. LIPA may terminate the agreement as early as 30 April 2025 upon two years’ advance notice. The A&RPSA became effective on 28 May 2013.
The agreement resulted in a rate decrease of $27.4 million annually compared with the rate in effect for the final year of the previous PSA. The agreement sets a RoE of 9.75% and a capital structure with an equity component of 50%. The A&RPSA continues certain annual rate adjustments, such as pension and other post-retirement benefit expenses, property tax true-up, adjustments for new plant in service, and certain inflationary
Business information in detail continued
164 National Grid Annual Report and Accounts 2013/14

Strategic Report Corporate Governance Financial Statements Additional Information
Rate plan 2011
2012
2013
2014
2015
2016
Rat
e ba
se
(31
Mar
201
4)
Eq
uity
to
deb
t rat
io
Allo
wed
retu
rn
on e
qui
ty
Ach
ieve
d re
turn
on
eq
uity
(3
1 D
ec 2
013)
Rev
enue
d
ecou
plin
g†
Cap
ital t
rack
er‡
Com
mod
ity-r
elat
ed
bad
deb
t tru
e-up
§
Pen
sion
/
OP
EB
true
-up◊
New York Public Service Commission
Niagara Mohawk1 (upstate, electricity) $4,248m 48 : 52 9.3% 8.0% ✓ ✗ P ✓
Niagara Mohawk (upstate, gas) $1,013m 48 : 52 9.3% 10.3% ✓ ✗ P ✓
KEDNY (downstate)2 $2,390m 48 : 52 9.4% 9.5% P P P ✓
KEDLI (downstate)3 $2,094m 45 : 55 9.8% 8.8% P P P ✓
Massachusetts Department of Public Utilities
Massachusetts Electric/Nantucket Electric $1,812m 50 : 50 10.35% 6.4% ✓ P ✓ ✓
Boston Gas $1,237m 50 : 50 9.75% 8.0% ✓ P ✓ ✓
Colonial Gas $278m 50 : 50 9.75% 10.8% ✓ P ✓ ✓
Rhode Island Public Utilities Commission
Narragansett Electric $567m 49 : 51 9.5% 10.1% ✓ ✓ P ✓
Narragansett Gas $466m 49 : 51 9.5% 9.9% ✓ ✓ P ✓
Federal Energy Regulatory Commission
Narragansett $499m 50 : 50 11.14% 12.0% n/a ✓ n/a ✓
Canadian Interconnector $27m 40 : 60 13.0% 13.0% n/a ✓ n/a ✓
New England Power $1,277m 65 : 35 11.14% 11.7% n/a ✓ n/a ✓
Long Island Generation $433m 46 : 54 10.0% 11.9% n/a ✓ n/a ✓
1. Both transmission and distribution, excluding stranded costs.
2. KeySpan Energy Delivery New York (The Brooklyn Union Gas Company).
3. KeySpan Energy Delivery Long Island (KeySpan Gas East Corporation).
†Revenue decouplingA mechanism that removes the link between a utility’s revenue and sales volume so that the utility is indifferent to changes in usage. Revenues are reconciled to a revenue target, with differences billed or credited to customers. Allows the utility to support energy efficiency.
‡Capital trackerA mechanism that allows for the recovery of the revenue requirement of incremental capital investment above that embedded in base rates, including depreciation, property taxes and a return on the incremental investment.
§Commodity-related bad debt true-upA mechanism that allows a utility to reconcile commodity-related bad debt to either actual commodity-related bad debt or to a specified commodity-related bad debt write-off percentage. For electricity utilities, this mechanism also includes working capital.
◊Pension/OPEB true-upA mechanism that reconciles the actual non-capitalised costs of pension and OPEB and the actual amount recovered in base rates. The difference may be amortised and recovered over a period or deferred for a future rate case.
Summary of US price controls and rate plans
Rate filing made
New rates effective
Rate plan ends
Rates continue indefinitely
✓Feature in place
✗ Feature not in current rate plan
P Feature partially in place
165

Connecticut
Rhode Island
New York
New Jersey
Vermont
Maine
Pennsylvania
Massachusetts
New Hampshire
Canada
Business information in detail continued
Grain LNG
to/fromFrance
BritNed to/fromthe Netherlands
from theNetherlands
to/fromBelgium
to Dublinto Ballylumford Teesside
St. Fergus
Easington
Theddlethorpe
Bacton
Barrow
Burton Point
South HookDragon
Our US network
Where we operateOur UK network
UK Gas Distribution* Gas distribution operating area
Approximately 131,000 kilometres (81,000 miles) of gas distribution pipeline owned and operated by National Grid.
Principal offices Owned office space:
Hinckley, Warwick and Wokingham
Leased office space: Solihull and London
Leased office space totalling 40,100 square metres (431,600 square feet) with remaining terms of two to nine years.
UK Transmission* Scottish electricity
transmission system
English and Welsh electricity transmission system
Approximately 7,200 kilometres (4,470 miles) of overhead line, 1,400 kilometres (870 miles) of underground cable and 335 substations.
Gas transmission system
Approximately 7,660 kilometres (4,760 miles) of high pressure pipe and 23 compressor stations connecting to eight distribution networks and third-party independent systems.
Terminal
LNG terminal owned by National Grid
LNG terminal
Electricity interconnector
Gas interconnector
US Regulated* Electricity transmission network
Gas distribution operating area
Electricity distribution area
Gas and electricity distribution area overlap
An electricity distribution network of approximately 116,250 circuit kilometres (72,235 miles) in New England and upstate New York.
A network of approximately 56,630 kilometres (35,190 miles) of gas pipeline serving an area of approximately 25,545 square kilometres (9,863 square miles).
LIPA
Generation
Principal offices Owned office space:
Syracuse, New York
Leased office space: Brooklyn, New York and Waltham, Massachusetts
Leased office space totalling approximately 55,100 square metres (593,000 square feet) with remaining terms of 11 to 16 years.
At present, environmental issues are not preventing our UK and US businesses from utilising any material operating assets in the course of their operations.
*Access to electricity and gas transmission and distribution assets on property owned by others is controlled through various agreements.
166 National Grid Annual Report and Accounts 2013/14

Strategic Report Corporate Governance Financial Statements Additional Information
Risk factorsManagement of our risks is an important part of our internal control environment, as we describe on pages 22 to 25. In addition to the principal risks listed we face a number of inherent risks that could have a material adverse effect on our business, financial condition, results of operations and reputation, as well as the value and liquidity of our securities. Any investment decision regarding our securities and any forward-looking statements made by us should be considered in the light of these risk factors and the cautionary statement set out on the inside back cover. An overview of the key inherent risks we face is provided below.
Risk factors
Potentially harmful activities
Aspects of the work we do could potentially harm employees, contractors, members of the public or the environment.
Potentially hazardous activities that arise in connection with our business include the operation and maintenance of electricity generation facilities, electricity lines and substations and the storage, transmission and distribution of gas. Electricity and gas utilities also typically use and generate hazardous and potentially hazardous products and by-products. In addition, there may be other aspects of our operations that are not currently regarded or proved to have adverse effects but could become so, such as the effects of electric and magnetic fields.
A significant safety or environmental incident, or the failure of our safety processes or of our occupational health plans, as well as the breach of our regulatory or contractual obligations or our climate change targets, could materially adversely affect our results of operations and our reputation.
We commit significant resources and expenditure to process safety and to monitoring safety and occupational health, as well as environmental risks, and to meeting our obligations under negotiated settlements.
We are also subject to laws and regulations in the UK and US governing health and safety matters to protect the public and our employees and contractors, who could potentially be harmed by these activities as well as laws and regulations relating to pollution, the protection of the environment, and the use and disposal of hazardous substances and waste materials. These expose us to costs and liabilities relating to our operations and properties whether current, including those inherited from predecessor bodies, or formerly owned by us, and sites used for the disposal of our waste. The cost of future environmental remediation obligations is often inherently difficult to estimate and uncertainties can include the extent of contamination, the appropriate corrective actions and our share of the liability. We are increasingly subject to regulation in relation to climate change and are affected by requirements to reduce our own carbon emissions as well as reduction in energy use by our customers.
If more onerous requirements are imposed or our ability to recover these costs under regulatory frameworks changes, this could have a material adverse impact on our business, reputation, results of operations and financial position.
For more information about environmental, climate change and health and safety matters relating to our business, see the corporate responsibility section of our website.
Infrastructure and IT systems
We may suffer a major network failure or interruption, or may not be able to carry out critical non-network operations due to the failure of technology supporting our business-critical processes.
Operational performance could be materially adversely affected by a failure to maintain the health of the system or network, inadequate forecasting of demand, inadequate record keeping or control of data or failure of information systems and supporting technology. This could cause us to fail to meet agreed standards of service, incentive and reliability targets, or be in breach of a licence, approval, regulatory requirement or contractual obligation. Even incidents that do not amount to a breach could result in adverse regulatory and financial consequences, as well as harming our reputation.
In addition to these risks, we may be affected by other potential events that are largely outside our control, such as the impact of weather (including as a result of climate change and major storms), unlawful or unintentional acts of third parties, insufficient or unreliable supply or force majeure. Weather conditions can affect financial performance and severe weather that causes outages or damages infrastructure together with our actual or perceived response will materially adversely affect operational and potentially business performance and our reputation.
Malicious attack, sabotage or other intentional acts, including breaches of our cyber security, may also damage our assets (which include critical national infrastructure) or otherwise significantly affect corporate activities and, as a consequence, have a material adverse impact on our reputation, business, results of operations and financial condition. Unauthorised access to, or deliberate breaches of, our IT systems may also lead to manipulation of our proprietary business data or customer information.
Unauthorised access to private customer information may make us liable for a violation of data privacy regulations. Even where we establish business continuity controls and security against threats against our systems, these may not be sufficient.
Due to control weaknesses occurring from the implementation of the US business’s new enterprise resource system, associated controls over financial reporting and related system programme conversion difficulties, we may be unable to provide accurate financial reporting and regulatory compliance reporting in a timely manner, which may include the provision of financial statements. This could result in regulatory fines, penalties, and other sanctions and adversely impact our operations, our reputation and our relationship with our regulators and other stakeholders.
167
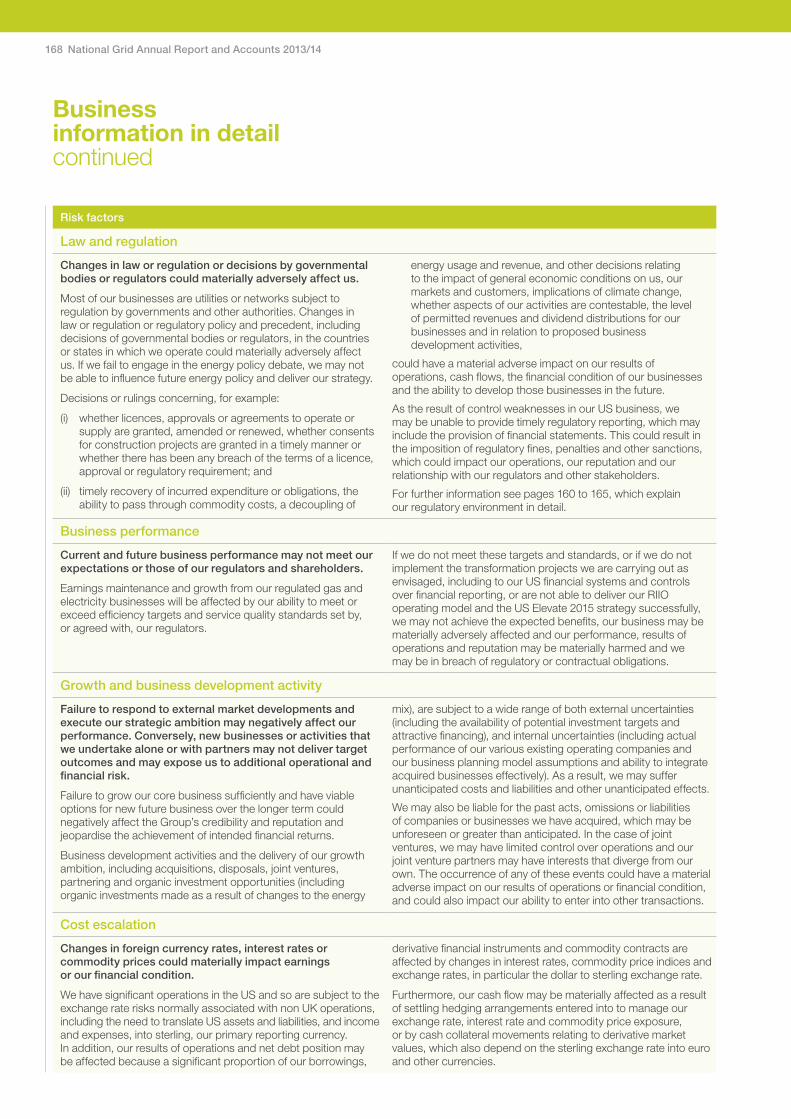
Business information in detail continued
Risk factors
Law and regulation
Changes in law or regulation or decisions by governmental bodies or regulators could materially adversely affect us.
Most of our businesses are utilities or networks subject to regulation by governments and other authorities. Changes in law or regulation or regulatory policy and precedent, including decisions of governmental bodies or regulators, in the countries or states in which we operate could materially adversely affect us. If we fail to engage in the energy policy debate, we may not be able to influence future energy policy and deliver our strategy.
Decisions or rulings concerning, for example:
(i) whether licences, approvals or agreements to operate or supply are granted, amended or renewed, whether consents for construction projects are granted in a timely manner or whether there has been any breach of the terms of a licence, approval or regulatory requirement; and
(ii) timely recovery of incurred expenditure or obligations, the ability to pass through commodity costs, a decoupling of
energy usage and revenue, and other decisions relating to the impact of general economic conditions on us, our markets and customers, implications of climate change, whether aspects of our activities are contestable, the level of permitted revenues and dividend distributions for our businesses and in relation to proposed business development activities,
could have a material adverse impact on our results of operations, cash flows, the financial condition of our businesses and the ability to develop those businesses in the future.
As the result of control weaknesses in our US business, we may be unable to provide timely regulatory reporting, which may include the provision of financial statements. This could result in the imposition of regulatory fines, penalties and other sanctions, which could impact our operations, our reputation and our relationship with our regulators and other stakeholders.
For further information see pages 160 to 165, which explain our regulatory environment in detail.
Business performance
Current and future business performance may not meet our expectations or those of our regulators and shareholders.
Earnings maintenance and growth from our regulated gas and electricity businesses will be affected by our ability to meet or exceed efficiency targets and service quality standards set by, or agreed with, our regulators.
If we do not meet these targets and standards, or if we do not implement the transformation projects we are carrying out as envisaged, including to our US financial systems and controls over financial reporting, or are not able to deliver our RIIO operating model and the US Elevate 2015 strategy successfully, we may not achieve the expected benefits, our business may be materially adversely affected and our performance, results of operations and reputation may be materially harmed and we may be in breach of regulatory or contractual obligations.
Growth and business development activity
Failure to respond to external market developments and execute our strategic ambition may negatively affect our performance. Conversely, new businesses or activities that we undertake alone or with partners may not deliver target outcomes and may expose us to additional operational and financial risk.
Failure to grow our core business sufficiently and have viable options for new future business over the longer term could negatively affect the Group’s credibility and reputation and jeopardise the achievement of intended financial returns.
Business development activities and the delivery of our growth ambition, including acquisitions, disposals, joint ventures, partnering and organic investment opportunities (including organic investments made as a result of changes to the energy
mix), are subject to a wide range of both external uncertainties (including the availability of potential investment targets and attractive financing), and internal uncertainties (including actual performance of our various existing operating companies and our business planning model assumptions and ability to integrate acquired businesses effectively). As a result, we may suffer unanticipated costs and liabilities and other unanticipated effects.
We may also be liable for the past acts, omissions or liabilities of companies or businesses we have acquired, which may be unforeseen or greater than anticipated. In the case of joint ventures, we may have limited control over operations and our joint venture partners may have interests that diverge from our own. The occurrence of any of these events could have a material adverse impact on our results of operations or financial condition, and could also impact our ability to enter into other transactions.
Cost escalation
Changes in foreign currency rates, interest rates or commodity prices could materially impact earnings or our financial condition.
We have significant operations in the US and so are subject to the exchange rate risks normally associated with non UK operations, including the need to translate US assets and liabilities, and income and expenses, into sterling, our primary reporting currency. In addition, our results of operations and net debt position may be affected because a significant proportion of our borrowings,
derivative financial instruments and commodity contracts are affected by changes in interest rates, commodity price indices and exchange rates, in particular the dollar to sterling exchange rate.
Furthermore, our cash flow may be materially affected as a result of settling hedging arrangements entered into to manage our exchange rate, interest rate and commodity price exposure, or by cash collateral movements relating to derivative market values, which also depend on the sterling exchange rate into euro and other currencies.
168 National Grid Annual Report and Accounts 2013/14

Strategic Report Corporate Governance Financial Statements Additional Information
Risk factors
Operating costs may increase faster than revenues.
Income under our price controls in the UK is linked to the RPI. Our operating costs may increase without a corresponding increase in the RPI and therefore without a corresponding increase in UK revenues. Our income under our rate plans in the US is not typically linked to inflation.
In periods of inflation in the US, our operating costs may increase by more than our revenues. In both the UK and US such increased costs may materially adversely affect the results of our operations.
We may be required to make significant contributions to fund pension and other post-retirement benefits.
We participate in a number of pension schemes that together cover substantially all our employees. In both the UK and US, the principal schemes are DB schemes where the scheme assets are held independently of our own financial resources. In the US, we also have other post-retirement benefit schemes. Estimates of the amount and timing of future funding for the UK and US schemes are based on actuarial assumptions
and other factors including: the actual and projected market performance of the scheme assets, future long-term bond yields, average life expectancies and relevant legal requirements.
Actual performance of scheme assets may be affected by volatility in debt and equity markets. Changes in these assumptions or other factors may require us to make additional contributions to these pension schemes which, to the extent they are not recoverable under our price controls or state rate plans, could materially adversely affect the results of our operations and financial condition.
Financing and liquidity
An inability to access capital markets at commercially acceptable interest rates could affect how we maintain and grow our businesses.
Our businesses are financed through cash generated from our ongoing operations, bank lending facilities and the capital markets, particularly the long-term debt capital markets. Some of the debt we issue is rated by credit rating agencies and changes to these ratings may affect both our borrowing capacity and borrowing costs. In addition, restrictions imposed by regulators may also limit how we service the financial requirements of our current businesses or the financing of newly acquired or developing businesses.
Financial markets can be subject to periods of volatility and shortages of liquidity. If we were unable to access the capital markets or other sources of finance at competitive rates for a prolonged period, our cost of financing may increase, the discretionary and uncommitted elements of our proposed capital investment programme may need to be reconsidered and the manner in which we implement our strategy may need to be reassessed.
Such events could have a material adverse impact on our business, results of operations and prospects.
Some of our regulatory agreements impose lower limits for the long-term senior unsecured debt credit ratings that certain
companies within the Group must hold or the amount of equity within their capital structures. One of the principal limits requires National Grid plc to hold an investment grade long-term senior unsecured debt credit rating. In addition, some of our regulatory arrangements impose restrictions on the way we can operate. These include regulatory requirements for us to maintain adequate financial resources within certain parts of our operating businesses and may restrict the ability of National Grid plc and some of our subsidiaries to engage in certain transactions, including paying dividends, lending cash and levying charges. The inability to meet such requirements or the occurrence of any such restrictions may have a material adverse impact on our business and financial condition.
Due to control weaknesses in our US business, we may be unable to provide accurate financial information to our debt investors in a timely manner. Our debt agreements and banking facilities contain covenants, including those relating to the periodic and timely provision of financial information by the issuing entity and financial covenants, such as restrictions on the level of subsidiary indebtedness. Failure to comply with these covenants, or to obtain waivers of those requirements, could in some cases trigger a right, at the lender’s discretion, to require repayment of some of our debt and may restrict our ability to draw upon our facilities or access the capital markets.
Customers and counterparties
Customers and counterparties may not perform their obligations.
Our operations are exposed to the risk that customers, suppliers, banks and other financial institutions and others with whom we do business will not satisfy their obligations, which could materially adversely affect our financial position.
This risk is significant where our subsidiaries have concentrations of receivables from gas and electricity utilities and their affiliates, as well as industrial customers and other purchasers, and may also arise where customers are unable to pay us as a result of increasing commodity prices or adverse economic conditions. There is also a risk to us where we invest excess cash, enter into derivatives and other financial contracts with banks or other financial institutions. Banks who provide us with credit facilities may also fail to perform under those contracts.
Employees and others
We may fail to attract, develop and retain employees with the competencies, including leadership and business capabilities, values and behaviours required to deliver our strategy and vision and ensure they are engaged to act in our best interests.
Our ability to implement our strategy depends on the capabilities and performance of our employees and leadership at all levels of the business. Our ability to implement our strategy and vision may be negatively affected by the loss of key personnel or an inability to attract, integrate, engage and retain appropriately
qualified personnel, or if significant disputes arise with our employees. As a result, there may be a material adverse effect on our business, financial condition, results of operations and prospects.
There is a risk that an employee or someone acting on our behalf may breach our internal controls or internal governance framework or may contravene applicable laws and regulations. This could have an impact on the results of our operations, our reputation and our relationship with our regulators and other stakeholders.
169

Internal control
Internal control over financial reportingOur management, including the Chief Executive and Finance Director, has carried out an evaluation of our internal control over financial reporting pursuant to the Disclosure and Transparency Rules and Section 404 of the Sarbanes-Oxley Act 2002. As required by Section 404, management is responsible for establishing and maintaining an adequate system of internal control over financial reporting (as defined in Rules 13a-15(f) and 15d-15(f) under the Exchange Act). Our internal control over financial reporting is designed to provide reasonable assurance regarding the reliability of financial reporting and the preparation of financial statements for external purposes in accordance with generally accepted accounting principles. Because of its inherent limitations, internal control over financial reporting may not prevent or detect misstatements. Also, projections of any evaluation of effectiveness to future periods are subject to risk that controls may become inadequate because of changes in conditions, or that the degree of compliance with the policies or procedures may deteriorate.
Management evaluation of the effectiveness of the Company’s internal control over financial reporting was based on the Internal Control-Integrated Framework 1992 issued by the Committee of Sponsoring Organizations of the Treadway Commission. Based on this evaluation, management concluded that our internal control over financial reporting was effective as at 31 March 2014.
PricewaterhouseCoopers LLP, which has audited our consolidated financial statements for the year ended 31 March 2014, has also audited the effectiveness of our internal control over financial reporting. Their attestation report can be found on page 81.
During the year, there were no changes in our internal control over financial reporting that have materially affected, or are reasonably likely to materially affect, it.
Information assuranceThe Board considers that it is imperative to have accurate and reliable information to enable informed and timely decisions to be taken that further our objectives, and to ensure continued focus and quality of non-financial data that we supply to external third parties.
Key elements in managing information assurance risks include education, training, awareness and ongoing transformation initiatives.
In line with ongoing transformation initiatives, we also continue to monitor and evolve our control processes, which is supported by the Certificate of Assurance process in which managers affirm, among other things, they have control frameworks in place to assist in the accurate reporting of data and other information. These initiatives emphasise the importance of information security, the quality of data collection and the affirmation process that supports our business transactions, evidencing our decisions and actions.
All communication channels, including training for ‘Doing the Right Thing’, make it clear that the accurate and honest reporting of data and other information must never be compromised.
Disclosure controlsWorking with management, including the Chief Executive and Finance Director, we have evaluated the effectiveness of the design and operation of our disclosure controls and procedures as at 31 March 2014. Our disclosure controls and procedures are designed to provide reasonable assurance of achieving their objectives, however the effectiveness of any system of disclosure controls and procedures has limitations including the possibility of human error and the circumvention or overriding of the controls and procedures. Even effective disclosure controls and procedures provide only reasonable assurance of achieving their objectives. Based on the evaluation, the Chief Executive and Finance Director concluded that the disclosure controls and procedures are effective to provide reasonable assurance that information required to be disclosed in the reports that we file and submit under the Exchange Act is recorded, processed, summarised and reported as and when required and that such information is accumulated and communicated to our management, including the Chief Executive and Finance Director, as appropriate, to allow timely decisions regarding disclosure.
170 National Grid Annual Report and Accounts 2013/14

Strategic Report Corporate Governance Financial Statements Additional Information
Directors’ Report disclosures
Articles of AssociationA summary of the material terms of our Articles of Association (the Articles) and applicable English Law is set out on page 176.
Board biographiesSir Peter Gershon CBE FREng, ChairmanAppointment to the Board: August 2011 as Deputy Chairman, Chairman with effect from January 2012 Committee membership: N (ch)Previous appointments: Chairman of Premier Farnell plc, Chief Executive of the Office of Government Commerce, Managing Director of Marconi Electronic Systems and member of the UK Defence Academy Advisory Board.External appointments: Chairman of Tate & Lyle plc and the Aircraft Carrier Alliance and member of the HM Government Efficiency and Reform Board and The Sutton Trust Board.Experience:• Chairman• Engineer• Government• Partnering/JV/contract management• City• High tech industry• US• International• General management
Steve Holliday FREng, Chief ExecutiveAppointment to the Board: October 2002, appointed to National Grid Group plc 2001, Chief Executive with effect from January 2007.Committee membership: FPrevious appointments: Executive Director of British Borneo Oil and Gas; he also spent 19 years within the Exxon Group, where he held senior positions in the international gas business and managed major operational areas such as refining and shipping. Most recently Chairman of UK Business Council for Sustainable Energy and the Technician Council.External appointments: Non-executive Director of Marks and Spencer Group plc, Chairman of Crisis UK, the Prince’s National Ambassador, Vice Chair for Business in the Community and Chair of the Energy and Efficiency Industrial Partnership.Experience:• Chief Executive• Engineer• Government/regulatory• Partnering/JV/contract management• City• Utilities – energy• Customer• Oil and gas• US• International
Philip Aiken AM, Non-executive DirectorAppointment to the Board: May 2008Committee membership: A, N, S (ch)Previous appointments: Group President of BHP Billiton’s Energy business, Executive Director of BTR plc, held senior roles in BOC Group plc, senior advisor to Macquarie Capital (Europe) Limited, Chairman of Robert Walters plc, Non-executive and Senior Independent Director of Kazakhmys PLC and Non-executive Director of Miclyn Express Offshore Limited.External appointments: Chairman of AVEVA Group plc, Non-executive and Senior Independent Director of Essar Energy plc and Non-executive Director of Essar Oil Limited and Newcrest Mining Limited.Experience:• Chairman• Partnering/JV/contract management• Emerging markets• Natural resources• International
Andrew Bonfield, Finance DirectorAppointment to the Board: November 2010Committee membership: F, SPrevious appointments: Chief Financial Officer at Cadbury plc until March 2010; he also spent five years as Executive Vice President & Chief Financial Officer of Bristol-Myers Squibb Company and has previous experience in the energy sector as Finance Director of BG Group plc.External appointments: Non-executive Director of Kingfisher plc.Experience:• Finance Director• Accountant• Government/regulatory• Partnering/JV/contract management• City• Utilities – energy• Customer• US• International
Nora Mead Brownell, Non-executive DirectorAppointment to the Board: 1 June 2012Committee membership: N, R, SPrevious appointments: Commissioner of the Pennsylvania Public Utility Commission from 1997 to 2001, Commissioner for the Federal Energy Regulatory Commission from 2001 to 2006 and former President of the National Association of Regulatory Utility Commissioners. Board member of ONCOR Electric Delivery Holding Company LLC.External appointments: Board member of Comverge, Inc. and Spectra Energy Partners LP and partner in ESPY Energy Solutions, LLC.Experience:• US Government/regulatory• US utilities – energy• FERC• Various non-executive directorships• US
171

Ruth Kelly, Non-executive DirectorAppointment to the Board: October 2011Committee membership: A, F, NPrevious appointments: Various senior roles in Government from 2001 to 2008, including Secretary of State for Transport, Secretary of State for Communities and Local Government, Secretary of State for Education and Skills and Financial Secretary to the Treasury.External appointments: Senior Executive at HSBC and Governor for the National Institute of Economic and Social Research.Experience:• Government/regulatory• Partnering/JV/contract management• Financial and economic• Infrastructure projects
Tom King, Executive Director, USAppointment to the Board: August 2007Previous appointments: President of PG&E Corporation and Chairman and CEO of Pacific Gas and Electric Company from 2003 to 2007, having held a number of senior positions within the PG&E group since joining in 1998. Senior management positions with Kinder Morgan Energy Partners and Enron Corporation.Experience:• Government/regulatory• Partnering/JV/contract management• Utilities – energy• Customer• FERC• Generation• US
John Pettigrew, Executive Director, UKAppointment to the Board: 1 April 2014Previous appointments: Joined The National Grid Company plc in 1991 and held various senior management roles, becoming Director of Engineering in 2003. He went on to become Chief Operating Officer and Executive Vice President for the US Electricity Distribution & Generation business between 2007 and 2010; Chief Operating Officer for UK Gas Distribution between 2010 and 2012; and UK Chief Operating Officer from 2012 to 2014. Currently UK Chief Operating Officer.Experience:• Government/regulatory• Partnering/JV/contract management• Utilities – energy• US
Maria Richter, Non-executive DirectorAppointment to the Board: October 2003Committee membership: A, F (ch), NPrevious appointments: Morgan Stanley from 1993 to 2002, latterly as Managing Director of its Corporate Finance Retail Group. Vice President of Independent Power Group for Salomon Brothers and Vice President of Prudential Capital Corporation and Power Funding Associates. Most recently Non-executive Director of The Pantry, Inc. and The Vitec Group plc.External appointments: Non-executive Chairman of Pro Mujer UK and Non-executive Director of The Bessemer Group, Inc.Experience:• City• Financial services• Emerging markets• US• International
Jonathan Dawson, Non-executive DirectorAppointment to the Board: 4 March 2013Committee membership: F, N, R (ch)Previous appointments: Various roles within the Ministry of Defence before joining Lazard where he spent over 20 years. Non-executive Director of Galliford Try plc 2004 to 2008, National Australia Group Europe Limited 2005 to 2012 and Standard Life Investments (Holdings) Limited 2010 to 2013.External appointments: Non-executive and Senior Independent Director of Next plc, Non-executive Director of Jardine Lloyd Thompson Group plc and Chairman of Penfida Limited.Experience:• City• Corporate finance• Banking• Pensions
Therese Esperdy, Non-executive DirectorAppointment to the Board: 18 March 2014Committee membership: F, NPrevious appointments: Joined Chase Securities in 1997, having started her banking career with Lehman Brothers. Various senior roles at JPMorgan Chase & Co. including Head of US Debt Capital Markets and Global Head of Debt Capital Markets at JPMorgan. External appointments: Co head of Banking, Asia Pacific for JPMorgan Chase & Co.Experience:• City• Corporate finance• Banking• US• International
Paul Golby CBE FREng, Non-executive DirectorAppointment to the Board: February 2012Committee membership: N, R, SPrevious appointments: Executive Director of Clayhithe plc before joining East Midlands Electricity plc in 1998 as Managing Director, Chief Executive of E.ON UK plc in 2002, and later additionally as Chairman, stepping down from the E.ON board in December 2011 and most recently Non-executive Chairman of AEA Technology Group plc.External appointments: Chairman of EngineeringUK, Chair of the Engineering and Physical Sciences Research Council and a member of the Council for Science and Technology.Experience:• Chairman and chief executive• Engineer• Government/regulatory• City• Utilities – energy
Directors’ Report disclosures continued
172 National Grid Annual Report and Accounts 2013/14

Strategic Report Corporate Governance Financial Statements Additional Information
Mark Williamson, Non-executive DirectorAppointment to the Board: 3 September 2012Committee membership: A (ch), N, RPrevious appointments: Chief Accountant then Group Financial Controller of Simon Group plc before joining International Power plc as Group Financial Controller in 2000 and appointed as Chief Financial Officer in 2003.External appointments: Non-executive, Chairman of the Audit Committee and Senior Independent Director of Alent plc, and Chairman of Imperial Tobacco Group PLC.Experience:• Finance director• Accountant• Government/regulatory• City• Utilities – energy• International
Nick Winser CBE FREng, Executive Director, UKAppointment to the Board: April 2003Previous appointments: Chief Operating Officer of the US transmission business for National Grid Transco plc having joined The National Grid Company plc in 1993, becoming Director of Engineering in 2001. Prior to this, with Powergen since 1991 as principal negotiator on commercial matters. Most recently co-Chair of the Energy Research Partnership.External appointments: Non-executive Director of Kier Group plc, Chair of CIGRE UK, Vice President and Trustee of The Institution of Engineering and Technology and President of the European Network of Transmission System Operators for Electricity.Experience:• Engineer• Government/regulatory• Partnering/JV/contract management• City• Utilities – energy• Customer• US
Alison Kay, Group General Counsel & Company SecretaryAppointment as Company Secretary: 24 January 2013Previous appointments: Various roles since joining National Grid in 1996 including UK General Counsel and Company Secretary from 2000 to 2008 and Commercial Director, UK Transmission from 2008 to 2012.
Capital gains tax (CGT)CGT information relating to National Grid shares for UK resident shareholders can be found on our website under Investors, Shareholder Services. Share prices on specific dates can also be found on our website.
Change of control provisionsNo compensation would be paid for loss of office of Directors on a change of control of the Company. As at 31 March 2014, the Company had undrawn borrowing facilities with a number of its banks of £1.7 billion available to it and a further £1.1 billion of drawn bank loans which, on a change of control of the Company following a takeover bid, may alter or terminate. All the Company’s share plans contain provisions relating to a change of control. Outstanding awards and options would normally vest and become exercisable on a change of control, subject to the satisfaction of any performance conditions at that time. In the event of a change of control of the Company, a number of governmental and regulatory consents or approvals are likely to be required arising from laws or regulations of the UK, US or the EU.
No other agreements that take effect, alter or terminate upon a change of control of the Company following a takeover bid are considered to be significant in terms of their potential impact on the business as a whole.
Conflicts of interestThe Board continues to monitor and note possible conflicts of interest that each Director may have and Directors are reminded of their continuing obligations in relation to conflicts at each Board meeting. Potential conflicts are considered and, if appropriate, approved and noted. During the year ended 31 March 2014, the Board has been advised by the Directors of a number of situations in relation to which no actual conflict of interest was identified and has therefore authorised such situations in accordance with its powers as set out in the Articles.
Directors’ indemnityThe Company has arranged, in accordance with the Companies Act 2006 and the Articles, qualifying third-party indemnities against financial exposure that Directors may incur in the course of their professional duties. Equivalent qualifying third-party indemnities were, and remain, in force for the benefit of those Directors who stood down from the Board during the year ended 31 March 2014. Alongside these indemnities, the Company places Directors’ and Officers’ liability insurance cover for each Director.
Events after the reporting periodThere have been no material events affecting the Company since the year end.
KeyA Audit CommitteeF Finance CommitteeN Nominations CommitteeR Remuneration CommitteeS Safety, Environment and
Health Committee(ch) Chairman of committee
173

Share capitalThe share capital of the Company consists of ordinary shares of 1117⁄43 pence nominal value each and ADSs, which represent five ordinary shares.
Authority to purchase sharesShareholder approval was given at the 2013 AGM to purchase up to 10% of the Company’s share capital. The Directors intend to seek shareholder approval to renew this authority at this year’s AGM.
In some circumstances, the Company may find it advantageous to have the authority to purchase its own shares in the market. The Directors believe that it is an important part of the financial management of the Company to have the flexibility to repurchase issued shares in order to manage its capital base.
The Company will only purchase shares where the Directors believe this would be in the best interests of shareholders generally, for example to manage the excess share dilution created by a large take-up through the scrip dividend scheme. The authority will only be used after careful consideration, taking into account market conditions prevailing at the time, other investment opportunities, appropriate gearing levels and the overall financial position of the Company.
Share issuance arising from the operation of the scrip dividend scheme may be actively managed through the repurchase of the Company’s shares. It is expected that such repurchases will not exceed 1% of the issued share capital (excluding treasury shares) per annum. For further details in relation to the management of the scrip dividend scheme, see page 02.
Repurchased shares may be held as treasury shares by the Company, and resold for cash, cancelled, either immediately or at some point in the future, or used for the purposes of employee share schemes.
No shares were repurchased during the year. Of the shares repurchased in prior years and held as treasury shares, 7,578,281 have been transferred to employees under the employee share plans, leaving a balance as at the date of this report of 119,565,599 ordinary shares held as treasury shares.
Material interests in sharesAs at 31 March 2014, National Grid had been notified of the following holdings in voting rights of 3% or more in the issued share capital of the Company:
Number of ordinary shares
% of voting rights1
The Capital Group Companies, Inc. 414,173,676 11.103Black Rock, Inc. 182,630,798 5.21Crescent Holding GmbH 149,414,285 4.07
1. This number is calculated in relation to the issued share capital at the time the holding was disclosed.
As at 18 May 2014, no further notifications have been received.
The rights attached to ordinary shares are detailed on page 175. All ordinary shares carry the same voting rights.
Political donations and expenditureNational Grid made no donations in the UK or EU during the year, including donations as defined for the purposes of the Political Parties, Elections and Referendums Act 2000. National Grid USA and its affiliated New York and federal political action committees (each, a PAC) made political donations in the US totalling $100,325 (£61,929) during the year. National Grid USA’s affiliated New York PAC was funded partly by contributions from National Grid USA and certain of its subsidiaries and partly by voluntary employee contributions. National Grid USA’s affiliated federal PAC was funded wholly by voluntary employee contributions.
Research and developmentExpenditure on research and development during the year was £12 million (2012/13: £15 million; 2011/12: £15 million). RIIO has strengthened the incentives and provided additional innovation funding support to stimulate innovation so that we deliver increased benefits for our stakeholders.
During 2013/14, collaboration has been a key focus for a number of National Grid’s innovation projects in all three of our UK Regulated business areas: UK ET, UK GT and UK GD. Innovation in UK ET has focused on technologies and approaches for enhancing the capacity and the reliability of the electricity transmission network. UK GT has focused innovation on safety and alternative material while incorporating commercial, operation and process-led innovation to complement the preceding focus on asset management. Innovation in UK GD has centred around life extension and emission reduction, looking to robotic technologies that can remediate our assets while having the minimum of impact on our customers through street works. Focus has also been on understanding the potential of alternative fuel sources to support a low carbon economy.
Directors’ Report disclosures continued
174 National Grid Annual Report and Accounts 2013/14

Strategic Report Corporate Governance Financial Statements Additional Information
Authority to allot sharesShareholder approval was given at the 2013 AGM to allot shares of up to one third of the Company’s share capital and a further third in connection with an offer by way of a rights issue.
This year the Directors are seeking a lower level of authority than in recent years, where an equivalent of two thirds of the issued share capital of the Company, exclusive of treasury shares, was sought. The Directors consider that the Company will have sufficient flexibility with the lower level of authority to respond to market developments. This authority is in line with investor guidelines.
The Directors currently have no intention of issuing new shares, or of granting rights to subscribe for or convert any security into shares, except in relation to, or in connection with, the operation and management of the Company’s scrip dividend scheme and the exercise of options under the Company’s share plans. No issue of shares will be made which would effectively alter control of the Company without the sanction of shareholders in general meeting.
The Company intends to actively manage the share issuance arising from the operation of the scrip dividend scheme. In some circumstances, additional shares may be allotted to the market under the authority provided by this resolution. Under these unlikely circumstances, it is expected that the allotment of new shares (or rights to subscribe for or convert any security into shares) will not exceed 1% of the issued share capital (excluding treasury shares) per annum. For further details in relation to the management of the scrip dividend scheme, see page 02.
Rights attached to sharesOrdinary shareholders and ADS holders receive dividends and can vote at general meetings. Treasury shares do not attract a vote or dividends. There are no restrictions on the transfer or sale of ordinary shares. Some of the Company’s employee share plans, details of which are contained in the Remuneration Report, include restrictions on the transfer of shares while the shares are subject to the plan. Where, under an employee share plan operated by the Company, participants are the beneficial owners of the shares but not the registered owner, the voting rights may be exercised by the registered owner at the direction of the participant.
Share priceThe following graph represents the movement of National Grid’s share price during 2013/14. A graph showing the total shareholder return over the last five years is available on page 72.
50
60
70
Apr 2013 Aug 2013 Dec 2013 Mar 2014
80
600
700
900
800
Ordinary share price
Source: Datastream
ADS priceUS$ pence
National Grid ordinary shares are listed on the London Stock Exchange under the symbol NG and the ADSs are listed on the New York Stock Exchange under the symbol NGG.
175

by the UK Corporate Governance Code, all Directors wishing to continue in office currently offer themselves for re-election annually. No person is disqualified from being a Director or is required to vacate that office by reason of attaining a maximum age.
A Director is not required to hold shares in National Grid in order to qualify as a Director.
Rights, preferences and restrictions(i) Dividend rightsNational Grid may not pay any dividend otherwise than out of profits available for distribution under the Companies Act 2006 and other applicable provisions of English law. In addition, as a public company, National Grid may only make a distribution if, at the time of the distribution, the amount of its net assets is not less than the aggregate of its called up share capital and undistributable reserves (as defined in the Companies Act 2006) and to the extent that the distribution does not reduce the amount of those assets to less than that aggregate. Subject to the foregoing, shareholders may, by ordinary resolution, declare dividends in accordance with the respective rights of the shareholders, but not exceeding the amount recommended by the Board. The Board may pay interim dividends if it considers that National Grid’s financial position justifies the payment. Any dividend or interest unclaimed for 12 years from the date when it was declared or became due for payment will be forfeited and revert to National Grid.
(ii) Voting rightsSubject to any rights or restrictions attached to any shares and to any other provisions of the Articles, at any general meeting on a show of hands, every shareholder who is present in person will have one vote and on a poll, every shareholder will have one vote for every share which they hold. On a show of hands or poll, shareholders may cast votes either personally or by proxy and a proxy need not be a shareholder. Under the Articles, all substantive resolutions at a general meeting must be decided on a poll, and resolutions of a procedural nature are decided by a show of hands, unless a poll is demanded in accordance with the Articles.
(iii) Liquidation rightsIn a winding up, a liquidator may, in each case with the sanction of a special resolution passed by the shareholders and any other sanction required under English law, (a) divide among the shareholders the whole or any part of National Grid’s assets (whether the assets are of the same kind or not) and may, for this purpose, value any assets and determine how the division should be carried out as between shareholders or different classes of shareholders, or (b) transfer any part of the assets to trustees on trust for the benefit of the shareholders as the liquidator determines, but in neither case will a shareholder be compelled to accept assets upon which there is a liability.
Variation of rightsSubject to applicable provisions of English law, the rights attached to any class of shares of National Grid may be varied or cancelled with the written consent of the holders of three quarters in nominal value of the issued shares of that class, or with the sanction of a special resolution passed at a separate meeting of the holders of the shares of that class.
Articles of AssociationThe following description is a summary of the material terms of our Articles and applicable English law. The following description is a summary only and is qualified in its entirety by reference to the Articles.
SummaryThe Articles set out the internal regulations of the Company and cover such matters as the rights of shareholders and the conduct of the Board and general meetings. Copies are available upon request and are displayed on the Company’s website. Amendments to the Articles have to be approved by at least 75% of those voting in person or by proxy at a general meeting of the Company. Subject to company law and the Articles, the Directors may exercise all the powers of the Company, and may delegate authorities to committees and day-to-day management and decision-making to individual Executive Directors. The committee structure is set out on page 48.
GeneralThe Company is incorporated under the name National Grid plc and is registered in England and Wales with registered number 4031152. Under the Companies Act 2006, the Company’s objects are unrestricted.
DirectorsUnder the Articles, a Director must disclose any personal interest in a matter and may not vote in respect of that matter, subject to certain limited exceptions. As permitted under the Companies Act 2006, the Articles provide that the non conflicted Directors of the Company may authorise a conflict or potential conflict for a particular matter. In doing so, the non conflicted Directors must act in a way they consider, in good faith, will be most likely to promote the success of the Company for the benefit of the shareholders as a whole.
The Directors (other than a Director acting in an executive capacity) are paid fees for their services, which in total must not exceed £2,000,000 a year or any higher sum as decided by an ordinary resolution at a general meeting of shareholders. In addition, special pay may be awarded to a Director who acts in an executive capacity, serves on a committee, performs services which the Directors consider to extend beyond the ordinary duties of a Director, devotes special attention to the business of National Grid or goes or lives abroad on the Company’s behalf. Directors may also receive reimbursement for expenses properly incurred, and may be awarded pensions and other benefits. The compensation awarded to the Executive Directors is determined by the Remuneration Committee and further details of Directors’ remuneration are set out in the Remuneration Report (see pages 58 to 73).
The Directors are empowered to exercise all the powers of National Grid to borrow money, subject to the limitation that the aggregate principal amount of all borrowings of its Group outstanding at any time must not exceed £35 billion or any other amount approved by shareholders by an ordinary resolution at a general meeting.
Directors can be appointed or removed by the Board or shareholders in a general meeting. Directors must stand for election at the first AGM following their appointment to the Board. Each Director must retire at least every three years but will be eligible for re-election. In accordance with best practice introduced
Other disclosures
176 National Grid Annual Report and Accounts 2013/14

Strategic Report Corporate Governance Financial Statements Additional Information
General meetingsAGMs must be convened each year within six months of the Company’s accounting reference date upon advance written notice of 21 clear days. Any other general meeting may be convened provided at least 14 clear days’ written notice is given, subject to annual approval of shareholders. In certain limited circumstances, the Company can convene a general meeting by shorter notice. The notice must specify, among other things, the nature of the business to be transacted, the place, the date and the time of the meeting.
Rights of non residentsThere are no restrictions under National Grid’s Articles that would limit the rights of persons not resident in the UK to vote in relation to ordinary shares.
Disclosure of interestsUnder the Companies Act 2006, National Grid may, by written notice, require a person whom it has reasonable cause to believe to be or to have been in the last three years interested in its shares to provide additional information relating to that interest. Under the Articles, failure to provide such information may result in a shareholder losing their rights to attend, vote or exercise any other right in relation to shareholders’ meetings.
Under the UK Disclosure and Transparency Rules, there is also an obligation on a person who acquires or ceases to have a notifiable interest in shares in National Grid to notify the Company of that fact. The disclosure threshold is 3% and disclosure is required each time the person’s direct and indirect holdings reach, exceed or fall below each 1% threshold thereafter.
The UK City Code on Takeovers and Mergers imposes strict disclosure requirements with regard to dealings in the securities of an offeror or offeree company, and also on their respective associates, during the course of an offer period. Other regulators in the UK, US and elsewhere may have, or assert, notification or approval rights over acquisitions or transfers of shares.
Code of EthicsIn accordance with US legal requirements, the Board has adopted a Code of Ethics for senior financial professionals. This code is available on our website (where any amendments or waivers will also be posted). There were no amendments to, or waivers of, our Code of Ethics during the year.
Corporate governance practices: differences from New York Stock Exchange (NYSE) listing standardsThe Company is listed on the NYSE and is therefore required to disclose differences in its corporate governance practices adopted as a UK listed company, compared with those of a US company.
The corporate governance practices of the Company are primarily based on the requirements of the UK Corporate Governance Code (the Code) but substantially conform to those required of US companies listed on the NYSE. The following is a summary of the significant ways in which the Company’s corporate governance practices differ from those followed by US companies under Section 303A Corporate Governance Standards of the NYSE.
• The NYSE rules and the Code apply different tests for the independence of board members.
• The NYSE rules require a separate nominating/corporate governance committee composed entirely of independent directors. There is, however, no requirement for a separate
corporate governance committee in the UK. Under the Company’s corporate governance policies, all Directors on the Board discuss and decide upon governance issues and the Nominations Committee makes recommendations to the Board with regard to certain of the responsibilities of a corporate governance committee.
• The NYSE rules require listed companies to adopt and disclose corporate governance guidelines. While the Company reports compliance with the Code in each Annual Report and Accounts, the UK requirements do not require the Company to adopt and disclose separate corporate governance guidelines.
• The NYSE rules require a separate audit committee composed of at least three independent members. While the Company’s Audit Committee exceeds the NYSE’s minimum independent non-executive director membership requirements, it should be noted that the quorum for a meeting of the Audit Committee, of two independent non-executive directors, is less than the minimum membership requirements under the NYSE rules.
• The NYSE rules require a compensation committee composed entirely of independent directors, and prescribe criteria to evaluate the independence of the committee’s members and its ability to engage external compensation advisors. While the Code prescribes different independence criteria, the Non-executive Directors on the Remuneration Committee have each been deemed independent by the Board under the NYSE rules. Although the evaluation criteria for appointment of external advisors differ under the Code, the Remuneration Committee is solely responsible for appointment, retention and termination of such advisors.
Depositary payments to the CompanyThe Depositary has agreed to reimburse the Company for expenses it incurs that are related maintenance expenses of the ADS programme. The Depositary has also agreed to pay the standard out-of-pocket maintenance costs for the ADSs, which consist of the expenses of postage and envelopes for mailing annual and interim financial reports, printing and distributing dividend cheques, electronic filing of US federal tax information, mailing required tax forms, stationery, postage, facsimile and telephone calls. It has also agreed to reimburse the Company annually for certain investor relationship programmes or special investor relations promotional activities. There are limits on the amount of expenses for which the Depositary will reimburse the Company, but the amount of reimbursement available to the Company is not necessarily tied to the amount of fees the Depositary collects from investors. For the period 1 April 2013 to 16 May 2014, the Company received a total of $1,955,464 in reimbursements from the Depositary consisting of $1,215,766 and $739,698 received in September 2013 and March 2014 respectively. Fees that are charged on cash dividends will be apportioned between the Depositary and the Company, see page 178.
Any questions from ADS holders should be directed to:
The Bank of New York MellonDepositary ReceiptsPO Box 30170College Station, Texas 77842-3170Telephone: 1-800-466-7215 (International +1-201-680-6825)Email: [email protected]
177

Documents on displayNational Grid is subject to the filing requirements of the Exchange Act, as amended. In accordance with these requirements, we file reports and other information with the SEC. These materials, including this document, may be inspected during normal business hours at our registered office 1-3 Strand, London WC2N 5EH or at the SEC’s Public Reference Room at 100 F Street, NE, Washington, DC 20549. For further information about the Public Reference Room, please call the SEC at 1-800-SEC-0330. Some of our filings are also available on the SEC’s website at www.sec.gov.
EmployeesWe negotiate with recognised unions. It is our policy to maintain well-developed communications and consultation programmes and there have been no material disruptions to our operations from labour disputes during the past five years. National Grid believes that it can conduct its relationships with trade unions and employees in a satisfactory manner.
Exchange controlsThere are currently no UK laws, decrees or regulations that restrict the export or import of capital, including, but not limited to, foreign exchange control restrictions, or that affect the remittance of dividends, interest or other payments to non UK resident holders of ordinary shares except as otherwise set out in Taxation on page 179 and except in respect of the governments of and/or certain citizens, residents or bodies of certain countries (described in applicable Bank of England Notices or European Union Council Regulations in force as at the date of this document).
Exchange ratesThe following table shows the history of the exchange rates of one pound sterling to dollars for the periods indicated.
Dollar equivalent of £1 sterling
High Low
April 2014 1.6885 1.6586March 2014 1.6730 1.6489February 2014 1.6758 1.6296January 2014 1.6631 1.6345December 2013 1.6528 1.6242
Average1
2013/14 1.602012/13 1.572011/12 1.602010/11 1.572009/10 1.58
1. The average for each period is calculated by using the average of the exchange rates on the last day of each month during the period. See weighted average exchange rate on page 85.
Description of securities other than equity securities: depositary fees and chargesThe Bank of New York Mellon, as Depositary, collects its fees for delivery and surrender of ADSs directly from investors depositing shares or surrendering ADSs for the purpose of withdrawal or from intermediaries acting for them. The Depositary collects fees for making distributions to investors (including, it is expected going forward, in respect of cash dividends) by deducting those fees from the amounts distributed or by selling a portion of distributable property to pay the fees. The Depositary may generally refuse to provide fee attracting services until its fees for those services are paid.
Persons depositing or withdrawing shares must pay: For
$5.00 per 100 ADSs (or portion of 100 ADSs)
Issuance of ADSs, including issuances resulting from a distribution of shares or rights or other property; cancellation of ADSs for the purpose of withdrawal, including if the deposit agreement terminates; distribution of securities distributed to holders of deposited securities that are distributed by the Depositary to ADS registered holders.
Registration or transfer fees Transfer and registration of shares on our share register to or from the name of the Depositary or its agent when they deposit or withdraw shares.
Expenses of the Depositary Cable, telex and facsimile transmissions (when expressly provided in the deposit agreement); converting foreign currency to dollars.
Taxes and other governmental charges the Depositary or the Custodian has to pay on any ADS or share underlying an ADS, for example, stock transfer taxes, stamp duty or withholding taxes
As necessary.
The Company amended the deposit agreement under which the ADS representing its ordinary shares are issued to allow a fee of up to $0.05 per ADS to be charged for any cash distribution made to ADS holders, including cash dividends. ADS holders who receive cash in relation to the 2013/14 final dividend will be charged a fee of $0.02 per ADS by the Depositary prior to distribution of the cash dividend.
Other disclosures continued
178 National Grid Annual Report and Accounts 2013/14

Strategic Report Corporate Governance Financial Statements Additional Information
Key milestonesSome of the key dates and actions in the corporate history of National Grid are listed below. The full history goes back much further.
1986 British Gas (BG) privatisation
1990 Electricity transmission network in England and Wales transferred to National Grid on electricity privatisation
1995 National Grid listed on the London Stock Exchange
1997 Centrica demerged from BG
1997 Energis demerged from National Grid
2000 Lattice Group demerged from BG and listed separately
2000 New England Electric System and Eastern Utilities Associates acquired
2002 Niagara Mohawk Power Corporation merged with National Grid in US
2002 National Grid and Lattice Group merged to form National Grid Transco
2004 UK wireless infrastructure network acquired from Crown Castle International Corp
2005 Four UK regional gas distribution networks sold and National Grid adopted as our name
2006 Rhode Island gas distribution network acquired
2007 UK and US wireless infrastructure operations and the Basslink electricity interconnector in Australia sold
2007 KeySpan Corporation acquired
2008 Ravenswood generation station sold
2010 Rights issue raised £3.2 billion
2012 New Hampshire electricity and gas distribution businesses sold
Material contractsEach of our Executive Directors has a service agreement and each Non-executive Director has a letter of appointment. No contract (other than contracts entered into in the ordinary course of business) has been entered into by National Grid within the two years immediately preceding the date of this report which is, or may be, material; or which contains any provision under which any member of National Grid has any obligation or entitlement which is material to National Grid at the date of this report.
Property, plant and equipmentThis information can be found under the heading note 11 property, plant and equipment on page 111, note 19 Borrowings on pages 119 to 121, Strategic Report pages 12 to 20, where we operate on page 166 and principal operations on pages 29 to 38.
Shareholder analysisThe following table includes a brief analysis of shareholder numbers and shareholdings as at 31 March 2014.
Size of shareholdingNumber of
shareholders% of
shareholdersNumber
of shares% of
shares
1–50 174,219 17.6366 5,070,597 0.131651–100 269,540 27.2862 19,092,359 0.4953101–500 427,082 43.2345 89,577,097 2.3241501–1,000 58,849 5.9574 41,182,963 1.06851,001–10,000 55,016 5.5694 135,292,646 3.510110,001–50,000 2,079 0.2105 37,261,484 0.966750,001–100,000 203 0.0206 14,546,599 0.3774100,001–500,000 429 0.0434 104,413,484 2.709500,001–1,000,000 122 0.0124 85,852,431 2.22741,000,001+ 287 0.029 3,322,050,361 86.1899
Total 987,826 100 3,854,340,021 100
TaxationThis section discusses certain US federal income tax and UK tax consequences of the ownership of ADSs and ordinary shares by certain beneficial holders thereof. This discussion applies to holders who qualify for benefits under the income tax convention between the US and the UK (the Tax Convention) and are a resident of the US for the purposes of the Tax Convention and are not resident or ordinarily resident in the UK for UK tax purposes at any material time (a US Holder).
US Holders generally will be entitled to benefits under the Tax Convention if they are:
• the beneficial owner of the ADSs or ordinary shares, as applicable, and of any dividends that they receive;
• an individual resident or citizen of the US, a US corporation, or a US partnership, estate, or trust (but only to the extent the income of the partnership, estate, or trust is subject to US taxation in the hands of a US resident person); and
• not also a resident of the UK for UK tax purposes.
If a US Holder holds ADSs or ordinary shares in connection with the conduct of business or the performance of personal services in the UK or otherwise in connection with a branch, agency or permanent establishment in the UK, then the US Holder will not be entitled to benefits under the Tax Convention. Special rules, including a limitation of benefits provision, apply in limited circumstances to ADSs or ordinary shares owned by an investment or holding company. This section does not discuss the treatment of holders described in the preceding two sentences. This section does not purport to be a comprehensive description of all the tax considerations that may be relevant to any particular investor. National Grid has assumed that shareholders, including US Holders, are familiar with the tax rules applicable to investments in securities generally and with any special rules to which they may be subject. In particular, the discussion deals only with investors that will beneficially hold ADSs or ordinary shares as capital assets and does not address the tax treatment of investors that are subject to special rules, such as banks, insurance companies, dealers in securities or currencies, partnerships or other entities classified as partnerships for US federal income tax purposes, persons that control (directly or indirectly) 10% or more of our voting stock, persons that elect mark-to-market treatment, persons that hold ADSs or ordinary shares as a position in a straddle, conversion transaction, synthetic security, or other integrated financial transaction, persons who are liable for the alternative minimum tax, or the Medicare tax on net investment income, and persons whose functional currency is not the dollar.
179

Taxation of capital gainsUS Holders will not be liable for UK taxation on any capital gain realised on the disposal of ADSs or ordinary shares.
Sales or other taxable dispositions of ADSs or ordinary shares by a US Holder generally will give rise to US source capital gain or loss equal to the difference between the dollar value of the amount realised on the disposition and the US Holder’s dollar basis in the shares or ADSs. Any such capital gain or loss generally will be long-term capital gain or loss, currently subject to taxation at reduced rates for non corporate taxpayers, if the ordinary shares or ADSs were held for more than one year. The deductibility of capital losses is subject to limitations.
UK stamp duty and stamp duty reserve tax (SDRT)Transfers of ordinary shares – SDRT at the rate of 0.5% of the amount of value of the consideration will generally be payable on any agreement to transfer ordinary shares that is not completed by the execution of a duly stamped instrument of transfer to the transferee. Where an instrument of transfer is executed and duly stamped before the expiry of the period of six years beginning with the date on which the agreement is made, the SDRT liability will be cancelled, and, if a claim is made within the specified period, any SDRT which has been paid will be refunded. SDRT is due whether or not the agreement or transfer of such chargeable securities is made or carried out in the UK and whether or not any party to that agreement or transfer is a UK resident. Purchases of ordinary shares completed by execution of a stock transfer form will generally give rise to a liability to UK stamp duty at the rate of 0.5% (rounded up to the nearest £5) of the amount or value of the consideration. Paperless transfers under the CREST paperless settlement system will generally be liable to SDRT at the rate of 0.5%, and not stamp duty. SDRT is generally the liability of the purchaser and UK stamp duty is usually paid by the purchaser or transferee.
Transfers of ADSs – No UK stamp duty will be payable on the acquisition or transfer of existing ADSs or beneficial ownership of ADSs, provided that any instrument of transfer or written agreement to transfer is executed outside the UK and remains at all times outside the UK. An agreement for the transfer of ADSs in the form of ADRs will not give rise to a liability for SDRT. A charge to stamp duty or SDRT may arise on the transfer of ordinary shares to the Depositary or The Bank of New York Mellon as agent of the Depositary (the Custodian). The rate of stamp duty or SDRT will generally be 1.5% of the value of the consideration or, in some circumstances, the value of the ordinary shares concerned. However, following a ruling in 2012 by the First-Tier Tax Tribunal in the UK, there is no 1.5% SDRT charge on the issue of ordinary shares (or, where it is integral to the raising of new capital, the transfer of ordinary shares) to the Depositary or the Custodian. The Depositary will generally be liable for the stamp duty or SDRT. In accordance with the terms of the Depositary Agreement, the Depositary will charge any tax payable by the Depositary or the Custodian (or their nominees) on the deposit of ordinary shares to the party to whom the ADSs are delivered against such deposits. If the stamp duty is not a multiple of £5, the duty will be rounded up to the nearest multiple of £5.
The statements regarding US and UK tax laws and administrative practices set forth below are based on laws, treaties, judicial decisions and regulatory interpretations in effect on the date of this document. These laws and practices are subject to change without notice, possibly with retrospective effect. In addition, the US statements set forth below are based on the representations of The Bank of New York Mellon as depositary (the Depositary). These statements assume that each obligation provided for in, or otherwise contemplated by, the deposit agreement entered into between National Grid Transco plc (now National Grid plc), the Depositary and the registered holders of ADRs, pursuant to which ADSs have been issued, dated as of 21 November 1995 and amended and restated as of 1 August 2005, and any related agreement, will be performed in accordance with its terms. Beneficial owners of ADSs who are residents or citizens of the US will be treated as the owners of the underlying ordinary shares for the purposes of the US Internal Revenue Code.
For the purposes of the Tax Convention, the Estate Tax Convention and UK tax considerations, we have assumed that a holder of ADRs will be treated as the owner of the ordinary shares represented by those ADSs and this section is based on that assumption. Despite a ruling in 2012 by the First-Tier Tax Tribunal in the UK that has cast doubt on this view, HMRC has stated that it will continue to apply its long-standing practice of treating such an ADR holder as holding the beneficial interest in the underlying shares. As such, this is an area of some uncertainty that may be subject to further developments.
A US Holder should consult their own advisor as to the tax consequences of the purchase, ownership and disposition of ADSs or ordinary shares in light of their particular circumstances, including the effect of any state, local or other national laws.
Taxation of dividendsUnder the Tax Convention, the UK is allowed to impose a 15% withholding tax on dividends paid to US shareholders controlling less than 10% of the voting capital of National Grid. The UK does not, however, currently impose a withholding tax on such dividends.
Cash distributions received by a US Holder with respect to their ADSs or ordinary shares generally will be treated as foreign source dividend income subject to US federal income taxation as ordinary income, to the extent paid out of National Grid’s current or accumulated earnings and profits, as determined under US federal income tax principles. The dollar amount of dividends received by certain non corporate US Holders with respect to ADSs or ordinary shares will generally be subject to taxation at the special reduced rate normally applicable to long-term capital gains, provided National Grid (i) is eligible for the benefits of the Tax Convention and (ii) was not, in the year prior to the year in which the dividend was paid, and is not, in the year in which the dividend is paid, a passive foreign investment company (PFIC).
Based on National Grid’s audited financial statements and relevant market and shareholder data, National Grid believes that it was not treated as a PFIC for US federal income tax purposes with respect to its taxable years ending 31 March 2013 and 2014. In addition, based on its current expectations regarding the value and nature of its assets, the sources and nature of its income, and relevant market and shareholder data, National Grid does not anticipate becoming a PFIC in the foreseeable future. Dividends paid by National Grid to corporate US Holders will not be eligible for the dividends received deduction generally allowed to corporations.
Other disclosures continued
180 National Grid Annual Report and Accounts 2013/14

Strategic Report Corporate Governance Financial Statements Additional Information
US information reporting and backup withholding taxDividend payments made to US Holders and proceeds paid from the sale, exchange, redemption or disposal of ADSs or ordinary shares to US Holders may be subject to information reporting to the US Internal Revenue Service (IRS). Such payments may be subject to backup withholding taxes unless the holder (i) is a corporation or other exempt recipient or (ii) provides a taxpayer identification number on a properly completed IRS Form W-9 and certifies that no loss of exemption from backup withholding has occurred.
US Holders should consult their tax advisors regarding these rules and any other reporting obligations that may apply to the ownership or disposition of ADSs or ordinary shares, including reporting requirements related to the holding of certain foreign financial assets.
UK inheritance taxAn individual who is domiciled in the US for the purposes of the Estate Tax Convention and who is not a national of the UK for the purposes of the Estate Tax Convention will generally not be subject to UK inheritance tax in respect of the ADSs or ordinary shares on the individual’s death or on a gift of the ADSs or ordinary shares during the individual’s lifetime, unless the ADSs or ordinary shares are part of the business property of a permanent establishment of the individual in the UK or pertain to a fixed base in the UK of an individual who performs independent personal services.
Special rules apply to ADSs or ordinary shares held in trust. In the exceptional case where the ADSs or shares are subject both to UK inheritance tax and to US federal gift or estate tax, the Estate Tax Convention generally provides for the tax paid in the UK to be credited against tax paid in the US.
The All-employee Share PlansThe all-employee share plans allow UK- or US-based employees to participate in either HMRC (UK) or Internal Revenue Service (US) approved plans. We believe by offering participation in such plans, it encourages all employees (including Executive Directors) to become shareholders in National Grid.
SharesaveEmployees resident in the UK are eligible to participate in the Sharesave plan. Under this plan, participants may contribute between £5 and £250 in total each month, for a fixed period of three years, five years or both. Contributions are taken from net salary.
SIPEmployees resident in the UK are eligible to participate in the SIP. Contributions up to £125 are deducted from participants’ gross salary and used to purchase ordinary shares in National Grid each month. The shares are placed in trust.
US Incentive Thrift PlansEmployees of National Grid’s US companies are eligible to participate in the Thrift Plans, which are tax-advantaged savings plans (commonly referred to as 401(k) plans). They are DC pension plans that give participants the opportunity to invest up to applicable federal salary limits. The federal limits for calendar year 2013 are: for pre-tax contributions a maximum of 50% of salary limited to $17,500 for those under the age of 50 and $23,000 for those over 50; for post-tax contributions, up to 15% of salary. The total contributions (pre-tax and post-tax) are limited to the
lesser of 50% of compensation or $51,000. For calendar year 2014, participants may invest up to the applicable federal salary limits: for pre-tax contributions a maximum of 50% of salary limited to $17,500 for those under the age of 50 and $23,000 for those over 50; for post-tax contributions up to 15% of salary. The total contributions (pre-tax and post-tax) are limited to the lesser of 50% of compensation or $52,000.
ESPPEmployees of National Grid’s US companies are eligible to participate in the ESPP (commonly referred to as a 423(b) plan). Eligible employees have the opportunity to purchase ADSs on a monthly basis at a 15% discounted price. Under the plan employees may contribute up to 20% of base pay each year up to a maximum annual contribution of $18,888 to purchase ADSs in National Grid.
The offer and listingPrice historyThe following table shows the highest and lowest intraday market prices for our ordinary shares and ADSs for the periods indicated:
Ordinary share (pence) ADS ($)
High Low High Low
2013/14 849.50 711.00 70.07 55.162012/13 770.00 627.00 58.33 49.552011/12 660.50 545.50 52.18 45.802010/111 666.00 474.80 51.00 36.722009/10 685.50 511.00 56.59 38.252013/14 Q4 842.50 769.00 70.07 63.19Q3 797.50 725.16 65.39 58.85Q2 817.75 727.45 61.59 55.30Q1 849.50 711.00 64.56 55.162012/13 Q4 770.00 678.00 58.33 52.81Q3 724.97 679.59 58.03 54.28Q2 706.13 635.56 56.72 49.55Q1 689.50 627.00 55.00 49.85April 2014 844.50 806.22 71.23 67.62March 2014 839.50 808.00 69.86 67.02February 2014 842.50 777.50 70.07 63.24January 2014 809.50 769.00 66.40 63.19December 2013 797.50 742.50 65.39 60.67
1. On 20 May 2010, we announced a 2 for 5 rights issue of 990,439,017 ordinary shares at 355 pence per share.
Unresolved SEC staff commentsThere are no unresolved staff comments required to be reported.
181

Reconciliation of adjusted operating profit to adjusted earnings and earningsAdjusted earnings is presented in note 7 to the consolidated financial statements on page 107.
Year ended 31 March
2014£m
2013(restated)1
£m
2012(restated)1
£m
Adjusted operating profit 3,664 3,639 3,491Adjusted net finance costs (1,108) (1,124) (1,090)Share of post-tax results of joint ventures 28 18 7
Adjusted profit before tax 2,584 2,533 2,408Adjusted taxation (581) (619) (697)
Adjusted profit after tax 2,003 1,914 1,711Attributable to non-controlling interests 12 (1) (2)
Adjusted earnings 2,015 1,913 1,709Exceptional items after tax 388 75 174Remeasurements after tax 73 156 (122)Stranded cost recoveries after tax – 9 156
Earnings 2,476 2,153 1,917
1. See note 1 on page 92.
Reconciliation of adjusted basic EPS to EPSAdjusted basic EPS is presented in note 7 to the consolidated financial statements on page 107.
Year ended 31 March
2014pence
2013(restated)1
pence
2012(restated)1
pence
Adjusted EPS 54.0 51.4 46.0Exceptional items after tax 10.4 2.0 4.7Remeasurements after tax 2.0 4.2 (3.3)Stranded cost recoveries after tax – 0.2 4.2
Earnings per share 66.4 57.8 51.6
1. See note 1 on page 92.
Reconciliation of adjusted operating profit excluding timing differences and major storms to total operating profitAdjusted operating profit excluding timing differences and major storms is discussed on page 09.
Year ended 31 March
2014£m
2013(restated)1
£m
2012(restated)1
£m
Adjusted operating profit excluding timing differences and major storms 3,706 3,759 3,589Major storms – (136) (116)
Adjusted operating profit excluding timing differences 3,706 3,623 3,473Timing differences (42) 16 18
Adjusted operating profit 3,664 3,639 3,491Exceptional items, remeasurements and stranded cost recoveries 71 110 44
Total operating profit 3,735 3,749 3,535
1. See note 1 on page 92.
Use of adjusted profit measuresIn considering the financial performance of our businesses and segments, we analyse each of our primary financial measures of operating profit, profit before tax, profit for the year attributable to equity shareholders and EPS into two components.
The first of these components is referred to as an adjusted profit measure, also known as a business performance measure. This is the principal measure used by management to assess the performance of the underlying business.
Adjusted results exclude exceptional items, remeasurements and stranded cost recoveries. These items are reported collectively as the second component of the financial measures. Note 4 on page 99 explains in detail the items which are excluded from our adjusted profit measures.
Adjusted profit measures have limitations in their usefulness compared with the comparable total profit measures as they exclude important elements of our financial performance. However, we believe that by presenting our financial performance in two components it is easier to read and interpret financial performance between periods, as adjusted profit measures are more comparable having removed the distorting effect of the excluded items. Those items are more clearly understood if separately identified and analysed.
The presentation of these two components of financial performance is additional to, and not a substitute for, the comparable total profit measures presented.
Management uses adjusted profit measures as the basis for monitoring financial performance and in communicating financial performance to investors in external presentations and announcements of financial results.
Internal financial reports, budgets and forecasts are primarily prepared on the basis of adjusted profit measures, although planned exceptional items, such as significant restructuring, are also reflected in budgets and forecasts. We separately monitor and disclose the excluded items as a component of our overall financial performance.
Reconciliation of adjusted operating profit to total operating profitAdjusted operating profit is presented on the face of the income statement under the heading operating profit before exceptional items, remeasurements and stranded cost recoveries.
Year ended 31 March
2014£m
2013(restated)1
£m
2012(restated)1
£m
Adjusted operating profit 3,664 3,639 3,491Exceptional items 55 (84) (122)Remeasurements – commodity contracts 16 180 (94)Stranded cost recoveries – 14 260
Total operating profit 3,735 3,749 3,535
1. See note 1 on page 92.
Other unaudited financial informationReconciliations of adjusted profit measures
182 National Grid Annual Report and Accounts 2013/14

Strategic Report Corporate Governance Financial Statements Additional Information
Analysis of the income statement for the years ended 31 March 2013 and 31 March 2012RevenueRevenue for the year ended 31 March 2013 increased by £527 million to £14,359 million driven by the UK ET business, which increased by £300 million principally due to inflationary increases in allowable revenue and higher pass-through costs. The UK GD segment also delivered an additional £114 million primarily for the same reason. Finally, US Regulated revenue was £123 million higher due to the recovery of Niagara Mohawk deferral revenues and higher FERC rate bases.
For the year ended 31 March 2012, revenue decreased £511 million compared with the year ended 31 March 2011 to £13,832 million. Increased UK ET revenue of £275 million under the regulatory RPI-X pricing formula was offset by reduced US revenues as a result of warmer winter weather leading to lower gas and electricity volumes supplied.
Operating costsOperating costs for the year ended 31 March 2013 of £10,610 million were £313 million (3%) higher than prior year. The increase in costs was predominantly due to increases in pass-through costs due to the colder winter in the US and inflationary increases in our controllable costs. Additional costs of £91 million were incurred in the stabilisation of our new US enterprise resource system.
Exceptional items included in operating profit of £110 million in 2012/13 consisted of restructuring costs of £87 million, less a gain on sale of our EnergyNorth gas business and Granite State electricity business in New Hampshire of £3 million. There were also gains of £180 million on commodity contract remeasurements.
Operating costs for the year ended 31 March 2012 of £10,297 million were £320 million (3%) lower than the prior year. This was primarily due to adverse timing differences of £256 million and higher storm costs in the US of £116 million due to Tropical Storm Irene and the October snowstorm in Massachusetts. Other operating costs were relatively flat year on year, reflecting reduced costs in our US Regulated segment as a result of the restructuring, offset by higher costs within the UK due to inflation and additional employment costs to support both the GDFO system implementation in our UK GD business and the ongoing increase in our capital investment programme in UK ET.
Exceptional items included in operating profit of £44 million in 2011/12 consisted of restructuring charges of £101 million, environmental charges of £55 million, impairment charges of £64 million and commodity contract remeasurements of £94 million. These were offset by net gains on disposals of subsidiaries of £97 million and stranded cost recoveries of £260 million.
In 2012/13, two major storms in the US, Superstorm Sandy and Storm Nemo, had a material effect on the results of National Grid. These two major storms reduced operating profit by £136 million. In 2011/12, results were also affected by two major storm events,
Tropical Storm Irene and the October snowstorm in Massachusetts, which reduced operating profit by £116 million. Adjusted operating profit excluding the impact of timing differences and major storms was £3,759 million in 2012/13 (2011/12: £3,589 million). Operating profit including the impact of timing differences and major storms was £3,869 million in 2012/13 (2011/12: £3,633 million).
Total finance costsTotal finance costs for the year ended 31 March 2013 were slightly down compared with 2012 at £1,086 million, due to the reduction in the cost of our index-linked debt, offset by the cost of carrying higher debt levels and loss on disposal of financial instruments.
For the year ended 31 March 2012, total finance costs were £1,188 million, down 11% on the prior year primarily due to lower interest rates on short-term instruments; lower debt repurchase costs that had peaked in the prior year due to the use of surplus funds from the rights issue; the benefit of lower average net debt as a result of those buy backs; and a favourable variance in pension interest primarily due to a higher than expected rate of return on US pension assets.
Financial remeasurements relate to net gains and losses on derivative financial instruments. The year ended 31 March 2013 included a gain of £68 million (2011/12: £70 million loss).
TaxationFor the year ended 31 March 2013, our adjusted tax charge was £78 million lower than 2011/12, mainly due to changes in tax provisions in respect of prior years and a 2% decrease in the UK statutory corporation tax rate in the year, partially offset by increased taxes on higher taxable profits. As a result of this, our effective tax rate for 2012/13 was 24.4% (2011/12: 28.9%).
The 2011/12 effective tax rate before exceptional items, remeasurements and stranded cost recoveries did not change from 2010/11 because a fall in prior period tax credits was offset, primarily by a 2% reduction in the UK corporation tax rate and a change in the UK/US profit mix where higher UK profits were taxed at UK tax rates, which are lower than those in the US.
Exceptional tax from 2012/13 included an exceptional deferred tax credit of £128 million arising from a reduction in the UK corporation tax rate from 24% to 23% applicable from 1 April 2013. A similar reduction in the UK corporation tax rate in 2011/12 from 26% to 24% resulted in a deferred tax credit of £242 million.
Adjusted earnings and EPSAs a result of the variances described above, adjusted earnings for the year ended 31 March 2013 was £1,913 million. For the year ended 31 March 2012, adjusted earnings was £1,709 million.
The above earnings performance translated into adjusted EPS growth in 2012/13 of 5.4 pence (12%). For the year ended 31 March 2012, adjusted EPS growth was 0.6 pence (1%).
Commentary on consolidated financial statements for the year ended 31 March 2013
In compliance with SEC rules, we present a summarised analysis of movements in the income statement, an analysis of movements in adjusted operating profit by operating segment and a summarised analysis of movements in the statement of financial position for the year ended 31 March 2013. This analysis reflects restated numbers presented as a result of changes to accounting standards in the year ended 31 March 2014, in particular IAS 19 (revised) ‘Employee benefits’. This should be read in conjunction with the 31 March 2014 unaudited commentary included on pages 85, 89, 91 and 96.
183
US RegulatedOur US Regulated business was affected by a reduction in timing differences of £37 million due to in year under-recoveries of £20 million compared with a prior year over-recovery of £17 million (after adjusting for foreign exchange movements).
The estimated closing over-recovered value at 31 March 2013 was £110 million. This was offset by a year-on-year reduction in major storm costs of £33 million, as the financial impact of Superstorm Sandy and Storm Nemo was lower than that from Hurricane Irene and the Massachusetts October snowstorm in 2011/12.
Net costs incurred in the US after insurance proceeds were £33 million lower than 2011/12 (after adjusting for foreign exchange movements).
An increase of £135 million in net regulated income reflects deferral recoveries in our upstate New York businesses together with higher revenues from our capital tracker regulatory arrangements.
Regulated controllable operating costs increased by £19 million reflecting inflation and higher spend on IS outsourcing and security. Post-retirement costs increased by £29 million primarily due to reductions in discount rates. Bad debt expense reduced by £33 million in the year due to improving economic conditions and improved collections.
Depreciation and amortisation increased by £17 million as a result of our capital expenditure programme in the year. Finally, other costs increased by £58 million due to increased property tax rates and assessed values, together with higher environmental costs in 2012/13. As a result, adjusted operating profit for the year was £1,254 million.
Other activitiesOur Other activities were significantly affected by the cost of major storms in the year, with an additional £51 million cost incurred compared with the prior year. This was as a result of insurance costs for Superstorm Sandy incurred in our insurance captive. Some of these costs are expected to be recovered from the reinsurance market.
Our metering business made £24 million lower operating profit than the prior year as a result of the disposal of OnStream in 2012, together with the impact of third-party disputes on legacy meter pricing in our regulated metering business.
Other costs increased by £126 million, primarily representing spend on the implementation of the new US information systems and financial procedures, offset by increased revenues from the French interconnector. As a result of these movements, Other activities recorded an adjusted operating profit of £11 million for the year.
Analysis of the adjusted operating profit by segment for the year ended 31 March 2013UK Electricity TransmissionNet regulated revenue increased by £235 million due to an increase in regulated revenues under UK price control allowances partly offset by a £10 million increase in charges under the balancing services incentive scheme. Timing increased by £67 million, with in year over-recovery of £29 million compared with a prior year under-recovery of £38 million.
Our controllable costs increased by £8 million driven by inflation, recruitment and training costs associated with our capital investment programme and increases in contribution rates for our DB pension schemes.
Depreciation and amortisation increased by £42 million as a result of higher asset values due to our capital investment programme.
UK Gas TransmissionGas Transmission net regulated revenue increased by £112 million driven by increased price control revenues partly offset by lower incentive scheme performance and reduced auction revenues in our LNG storage business. There was no year-on-year timing movement due to an in year over-recovery of £17 million compared with a £17 million over-recovery in 2012/13.
Controllable costs increased by £21 million driven by inflation, an increase in our environmental provisions and increases in contribution rates for our DB pension schemes.
Depreciation and amortisation increased by £16 million due to an increase in the underlying asset base and some one-time asset write-offs.
UK Gas DistributionNet regulated revenue increased by £85 million driven by our regulatory RPI-X pricing formula and improved performance under incentive programmes. Timing reduced adjusted operating profit by £32 million driven by in year under-recoveries of £10 million compared with an over-recovery in the prior year of £22 million. The estimated closing under-recovered value at 31 March 2013 was £8 million.
Regulated controllable costs increased by £13 million due to: inflation, system maintenance costs and one-off contract strategy costs, partially offset by efficiencies enabled by our new front office systems. Post-retirement costs increased by £2 million as a result of increased contribution rates for our DB pension schemes.
Depreciation and amortisation increased by £10 million driven by higher average asset values due to the capital investment programme and new front office systems. Finally, other costs decreased by £3 million, resulting in an adjusted operating profit of £794 million for the year.
Other unaudited financial information continued
184 National Grid Annual Report and Accounts 2013/14

Strategic Report Corporate Governance Financial Statements Additional Information
Analysis of the statement of financial position for the year ended 31 March 2013 Goodwill and other intangible assetsGoodwill and intangibles increased by £295 million to £5,617 million as at 31 March 2013. This increase primarily related to foreign exchange movements of £266 million and software additions of £175 million offset by amortisation of £101 million.
Property, plant and equipmentProperty, plant and equipment increased by £2,891 million to £36,592 million as at 31 March 2013. This was principally due to capital expenditure of £3,511 million on the extension of our regulated networks and foreign exchange movements of £680 million, offset by £1,281 million of depreciation in the year.
Capital expenditure increased in each of the three regulated businesses including record amounts in our UK Transmission and US Regulated businesses.
Investments and other non-current assetsInvestments in joint ventures and associates, financial and other investments and other non-current assets increased by £66 million to £753 million. This was principally due to changes in the fair value of our US commodity contract assets and available-for-sale investments, and an equity investment in Clean Line Energy Partners LLC of $12.5 million by 31 March 2013.
Inventories and current intangible assets, and trade and other receivablesInventories and current intangible assets, and trade and other receivables increased by £854 million to £3,201 million at 31 March 2013. Driven by the US, this primarily reflected the timing of cost recoveries from LIPA relating to Superstorm Sandy and an increase in trade receivables due to colder weather in February and March 2013 compared with 2012, which also led to an offsetting decrease in inventories which were £85 million lower.
Trade and other payablesTrade and other payables increased by £366 million to £3,051 million due to increased payables and accruals relating to Superstorm Sandy and Storm Nemo.
Current tax liabilitiesCurrent tax liabilities of £231 million at 31 March 2013 were £152 million lower primarily due to higher tax payments made in 2012/13 and larger prior year tax credits arising in 2012/13, although these were partially offset by a larger current year tax charge.
Deferred tax liabilitiesThe net deferred tax liability increased by £341 million to £4,077 million. The main reasons for this movement were the £441 million deferred tax charge, including the impact of the reduction in the statutory tax rate for future periods of £128 million, partially offset by the deferred tax credit on actuarial losses on pensions and other post-retirement benefits.
Provisions and other non-current liabilitiesProvisions (both current and non-current) increased by £29 million to £1,760 million as at 31 March 2013. The underlying movements included additions of £92 million and £83 million to the environmental and other provisions respectively, as well as foreign exchange movements of £65 million. The other provisions additions included £33 million of increased liabilities insured by our insurance subsidiaries. These were offset by payments of £231 million in relation to all classes of provisions.
Other non-current liabilities decreased by £37 million to £1,884 million, reflecting changes in the fair value of US commodity contract liabilities.
Net debtNet debt is the aggregate of cash and cash equivalents, current financial and other investments, borrowings, and derivative financial assets and liability. At 31 March 2013, net debt had increased by £1,832 million to £21,429 million as a result of debt issuances in the year, including the hybrid bonds of £2.1 billion.
Net pension and other post-retirement obligationsA summary of the total UK and US assets and liabilities and the overall net IAS 19 accounting deficit (as restated for IAS 19 (revised)) is shown below:
Net plan liabilityUK£m
US£m
Total£m
As at 1 April 2012 (as restated) (668) (2,270) (2,938)
Exchange movements – (112) (112)Current service cost (90) (130) (220)Net interest cost (31) (104) (135)Curtailments and settlements (21) (44) (65)Actuarial gains/(losses)– on plan assets 1,131 261 1,392– on plan liabilities (1,691) (415) (2,106)Employer contributions 201 486 687
As at 31 March 2013 (1,169) (2,328) (3,497)
Represented by:Plan assets – 195 195Plan liabilities (1,169) (2,523) (3,692)
Net plan liability (1,169) (2,328) (3,497)
The principal movements in net obligations during the year arose as a consequence of a decrease in the discount rate following declines in corporate bond yields. Actuarial gains on plan assets reflected improvements in financial markets.
Commitments and contingenciesCapital expenditure contracted but not provided for increased by £283 million to £3,011 million a result of the continued ramp up in our capital investment programme.
Off balance sheet itemsThere were no significant off balance sheet items other than the contractual obligations shown in note 30 (b) on page 139.
185

Financial summary (unaudited)The financial summary set out below has been derived from the audited consolidated financial statements of National Grid for the five financial years ended 31 March 2014. It should be read in conjunction with the consolidated financial statements and related notes, together with the Strategic Review. The information presented below for the years ended 31 March 2010, 2011, 2012, 2013 and 2014 has been prepared under IFRS issued by the IASB and as adopted by the EU1.
31 March 2014
£m
31 March2013
(restated)1
£m
31 March2012
(restated)1
£m
31 March2011
(restated)1
£m
31 March2010
(restated)1
£m
Summary income statementRevenue 2 14,809 14,359 13,832 14,343 14,007Operating profit
Before exceptional items, remeasurements and stranded cost recoveries 3,664 3,639 3,491 3,619 3,134Exceptional items, remeasurements and stranded cost recoveries 71 110 44 145 172
3,735 3,749 3,535 3,764 3,306Profit before tax
Before exceptional items, remeasurements and stranded cost recoveries 2,584 2,533 2,408 2,283 1,999Exceptional items, remeasurements and stranded cost recoveries 164 178 (26) 151 219
2,748 2,711 2,382 2,434 2,218
Profit for the year 2,464 2,154 1,919 2,043 1,418Profit for the year attributable to equity shareholders
Before exceptional items, remeasurements and stranded cost recoveries 2,015 1,913 1,709 1,627 1,447Exceptional items, remeasurements and stranded cost recoveries 461 240 208 412 (32)
2,476 2,153 1,917 2,039 1,415
Earnings per shareBasic – continuing operations (pence)3 66.4 57.8 51.6 56.9 46.1Diluted – continuing operations (pence)3 66.1 57.5 51.3 56.6 45.9Basic (pence)3 66.4 57.8 51.6 56.9 46.1Diluted (pence)3 66.1 57.5 51.3 56.6 45.9
Number of shares – basic (millions)4 3,729 3,724 3,719 3,585 3,071Number of shares – diluted (millions)4 3,748 3,742 3,738 3,604 3,084
Dividends per ordinary sharePaid during the year (pence) 40.85 39.84 37.40 37.74 36.65Approved or proposed during the year (pence) 42.03 40.85 39.28 36.37 38.49Paid during the year ($) 0.636 0.633 0.599 0.592 0.579Approved or proposed during the year ($) 0.696 0.632 0.623 0.571 0.608
Summary consolidated financial information
186 National Grid Annual Report and Accounts 2013/14

Strategic Report Corporate Governance Financial Statements Additional Information
31 March 2014
£m
31 March2013
(restated)1
£m
31 March2012
(restated)1
£m
31 March2011
(restated)1
£m
31 March2010
(restated)1
£m
Summary statement of net assetsNon-current assets 44,895 45,129 41,684 39,787 38,488Current assets 7,489 9,576 5,387 6,323 5,065Assets of businesses held for sale – – 264 290 –Total assets 52,384 54,705 47,335 46,400 43,553Current liabilities (7,331) (7,445) (6,004) (6,826) (6,559)Non-current liabilities (33,134) (37,026) (32,001) (30,403) (32,800)Liabilities of businesses held for sale – – (87) (110) –Total liabilities (40,465) (44,471) (38,092) (37,339) (39,359)Net assets 11,919 10,234 9,243 9,061 4,194
Shareholders’ equity 11,911 10,229 9,236 9,052 4,182
Summary cash flow statementCash generated from continuing operations 4,419 4,037 4,487 4,854 4,372
Tax (paid)/received (400) (287) (259) 4 144
Net cash inflow from operating activities 4,019 3,750 4,228 4,858 4,516Net cash flows used in investing activities (1,330) (6,130) (2,371) (4,774) (2,332)Net cash flows from/(used in) financing activities (2,972) 2,715 (1,900) (430) (2,212)Net increase/(decrease) in cash and cash equivalents (283) 335 (43) (346) (28)
1. For the year ended 31 March 2014, the adoption of IAS 19 (revised) ‘Employee benefits’ has resulted in a significant change in how we account for pensions and employee benefits. The numbers included in the selected financial data above for the years 31 March 2010, 2011, 2012 and 2013 have been restated to show the impact of IAS 19 (revised) had it been adopted since 2010. There have been no other significant changes in accounting standards, interpretations or policies that have a material financial impact on the selected financial data.
2. Items previously reported for 2010 separately as other operating income have been included within revenue.
3. Items previously reported for 2010 – 2013 have been restated to reflect the impact of the bonus element of the rights issue and the additional shares issued as scrip dividends.
4. Number of shares previously reported for 2010 – 2013 have been restated to reflect the impact of the additional shares issued as scrip dividends.
187

Definitions and glossary of terms
DDthDecatherm, being an amount of energy equal to 1 million British thermal units (BTUs), equivalent to approximately 293 kWh.
DBDefined benefit, relating to our UK or US (as the context requires) final salary pension schemes.
DCDefined contribution, relating to our UK or US (as the context requires) pension schemes to which National Grid, as an employer, pays contributions based on a percentage of employees’ salaries.
DECCThe Department of Energy & Climate Change, the UK Government ministry responsible for energy and climate change.
decouplingSee revenue decoupling.
deferred taxFor most assets and liabilities, deferred tax is the amount of tax that will be payable or receivable in respect of that asset or liability in future tax returns as a result of a difference between the carrying value for accounting purposes in the statement of financial position or balance sheet and the value for tax purposes of the same asset or liability.
delivery bodyUnder the Energy Act 2013, and subject to secondary legislation due to be in force in summer 2014 (which will set out detailed roles and responsibilities for all market participants), National Grid’s electricity system operator function will provide independent evidence and analysis to the UK Government to inform its decisions on the key rules and parameters to achieve the Government’s policy objectives under EMR. As proposed, National Grid will administer the capacity mechanism, including running the annual capacity auctions, manage the allocation of contracts for difference to low carbon generators and report to the Government annually on performance against the Government’s delivery plan.
derivativeA financial instrument or other contract where the value is linked to an underlying index, such as exchange rates, interest rates or commodity prices. In most cases, contracts for the sale or purchase of commodities that are used to supply customers or for our own needs are excluded from this definition.
Directors/Executive Directors/Non-executive DirectorsThe Directors/Executive Directors and Non-executive Directors of the Company whose names are set out on page 43 of this document.
dollars or $Except as otherwise noted all references to dollars or $ in this Annual Report and Accounts relate to the US currency.
Our aim is to use plain English in this Annual Report and Accounts. However, where necessary, we do use a number of technical terms and/or abbreviations and we summarise the principal ones below, together with an explanation of their meanings. The descriptions below are not formal legal definitions.
AAmerican Depositary Shares (ADSs)Securities of National Grid listed on the New York Stock Exchange, each of which represents five ordinary shares. They are evidenced by American Depositary Receipts or ADRs.
Annual General Meeting (AGM) Meeting of shareholders of the Company held each year to consider ordinary and special business as provided in the Notice of AGM.
BBoardThe Board of Directors of the Company (for more information see pages 43 and 171 to 173).
bps Basis point (bps) is a unit that is equal to 1/100th of 1% and is typically used to denote the movement in a percentage based metric such as interest rates or RoE. A 0.1% change in a percentage represents 10 basis points.
BritNedBritNed Development Limited.
Ccalled up share capitalShares (common stock) that have been issued and have been fully paid for.
carrying valueThe amount at which an asset or a liability is recorded in the Group’s statement of financial position and the Company’s balance sheet.
circuitSee route length.
the Company, the Group, National Grid, we, our or us We use the terms ‘the Company’, ‘the Group’, ‘National Grid’, ‘we’, ‘our’ or ‘us’ to refer to either National Grid plc itself or to National Grid plc and/or all or certain of its subsidiaries, depending on context.
consolidated financial statements Financial statements that include the results and financial position of the Company and its subsidiaries together as if they were a single entity.
contingent liabilitiesPossible obligations or potential liabilities arising from past events for which no provision has been recorded, but for which disclosure in the financial statements is made.
188 National Grid Annual Report and Accounts 2013/14

Strategic Report Corporate Governance Financial Statements Additional Information
Eearnings per share (EPS)Profit for the year attributable to equity shareholders of the parent allocated to each ordinary share.
Electricity Market Reform (EMR)An energy policy initiative, introduced by the Energy Act 2013, designed to provide greater financial certainty to investors in both low carbon and conventional generation in order to meet environmental targets and maintain security of supply, and to do so at the lowest cost to consumers.
employee engagementA key performance indicator, based on the percentage of favourable responses to certain indicator questions repeated in each employee survey, which provides a measure of how employees think, feel and act in relation to National Grid. Research shows that a highly engaged workforce leads to increased productivity and employee retention, therefore we use employee engagement as a measure of organisational health in relation to business performance.
equityIn financial statements, the amount of net assets attributable to shareholders.
Estate Tax ConventionThe Estate Tax Convention is the convention between the US and the UK for the avoidance of double taxation with respect to estate and gift taxes.
EUThe European Union, being the economic and political union of 27 member states located in Europe.
Exchange ActThe Securities Exchange Act 1934, as amended.
FFERCThe US Federal Energy Regulatory Commission.
finance lease A lease where the asset is treated as if it was owned for the period of the lease and the obligation to pay future rentals is treated as if they were borrowings. Also known as a capital lease.
financial year For National Grid this is an accounting year ending on 31 March. Also known as a fiscal year.
FRSA UK Financial Reporting Standard as issued by the UK Financial Reporting Council (FRC). These apply to the Company’s individual financial statements on pages 155 to 159, which are prepared in accordance with UK GAAP.
GGrain LNGNational Grid Grain LNG Limited.
Great BritainEngland, Wales and Scotland.
GWGigawatt, being an amount of power equal to 1 billion watts (109 watts).
HHMRCHM Revenue & Customs. The UK tax authority.
HVDCHigh voltage, direct current electric power transmission which uses direct current for the bulk transmission of electrical power, in contrast with the more common alternating current systems.
IIAS or IFRSAn International Accounting Standard or International Financial Reporting Standard, as issued by the International Accounting Standards Board (IASB). IFRS is also used as the term to describe international generally accepted accounting principles as a whole.
individual financial statements Financial statements of a company on its own, not including its subsidiaries or joint ventures.
Jjoint ventureA company or other entity which is controlled jointly with other parties.
KkVKilovolt, being an amount of electric force equal to 1,000 volts.
LLIPAThe Long Island Power Authority.
LNGLiquefied natural gas, being natural gas that has been condensed into a liquid form, typically at temperatures at or below -161°C (-258°F).
lost time injuryAn incident arising out of National Grid’s operations which leads to an injury where the employee or contractor normally has time off the following day or shift following the incident. It relates to one specific (acute) identifiable incident which arises as a result of National Grid’s premises, plant or activities, which was reported to the supervisor at the time and was subject to appropriate investigation.
lost time injury frequency rate (IFR)The number of lost time injuries per 100,000 hours worked in a 12 month period.
MMADPUThe Massachusetts Department of Public Utilities.
MSAThe managed services agreement, under which the Company maintained and operated the electricity transmission and distribution system on Long Island owned by LIPA, which was transitioned to a third party with effect from 31 December 2013.
MWMegawatt, being an amount of power equal to 1 million watts.
MWhMegawatt hours, being an amount of energy equivalent to delivering 1 million watts of power for a period of one hour.
189
Definitions and glossary of terms continued
regulatory asset value (RAV)The value ascribed by Ofgem to the capital employed in the relevant licensed business. It is an estimate of the initial market value of the regulated asset base at privatisation, plus subsequent allowed additions at historical cost, less the deduction of annual regulatory depreciation. Deductions are also made to reflect the value realised from the disposal of certain assets that formed part of the regulatory asset base. It is also indexed to the RPI to allow for the effects of inflation.
return on capital employed (RoCE)The return on capital employed metric is designed to give an alternative comparison between the UK and US businesses showing the overall return on capital provided by both debt and equity. The calculation reflects regulatory treatments of costs.
return on equity (RoE)A performance metric measuring returns from the investment of shareholders’ funds. It is a financial ratio of a measure of earnings divided by an equity base.
Group return on equity (Group RoE) The Group return on equity calculation provides a measure of the performance of the whole Group compared with the amounts invested by the Group in assets attributable to equity shareholders. The Group return on equity measure is calculated using the Group capital employed in accordance with the definition used in the RoCE measures, adjusted for Group net debt and goodwill.
US regulated return on equity (US RoE)US regulated return on equity is a measure of how a business is performing operationally against the assumptions used by the relevant regulator. This US operational return measure is calculated using the assumption that the businesses are financed in line with the regulatory adjudicated capital structure. This is a post-tax US GAAP metric as calculated annually (on a calendar year to 31 December).
UK regulated return on equity (UK RoE)UK regulated return on equity is a measure of how a business is performing operationally against the assumptions used by Ofgem. These returns are calculated using the assumption that the businesses are financed in line with the regulatory adjudicated capital structure, at the assumed cost of debt and that UK taxation paid is at the level assumed by Ofgem.
revenue decouplingRevenue decoupling is the term given to the elimination of the dependency of a utility’s revenue on the volume of gas or electricity transported. The purpose of decoupling is to eliminate the disincentive a utility otherwise has to encourage energy efficiency programmes.
RIIOThe revised regulatory framework issued by Ofgem which was implemented in the eight year price controls which started on 1 April 2013.
RIPUCThe Rhode Island Public Utilities Commission.
route lengthThe route length of an electricity transmission line is the geographical distance from the start tower to the end tower. In most cases in the UK, and in many cases in the US, the transmission line consists of a double circuit for additional reliability. In such cases, the circuit length is twice the route length.
NNational Grid Metering (NGM)National Grid Metering Limited, National Grid’s UK regulated metering business.
New EnglandThe term refers to a region within the northeastern US that includes the states of Connecticut, Maine, Massachusetts, New Hampshire, Rhode Island and Vermont. National Grid’s New England operations are primarily in the states of Massachusetts and Rhode Island.
northeastern USThe northeastern region of the US, comprising the states of Connecticut, Maine, Massachusetts, New Hampshire, New Jersey, New York, Pennsylvania, Rhode Island and Vermont.
NYPSCThe New York Public Service Commission.
OOfgemThe UK Office of Gas and Electricity Markets, part of the UK Gas and Electricity Markets Authority (GEMA), which regulates the energy markets in the UK.
OnStreamUtility Metering Services Limited, an unregulated UK metering business, sold by National Grid on 24 October 2011.
ordinary sharesVoting shares entitling the holder to part ownership of a company. Also known as common stock. National Grid’s ordinary shares have a nominal value of 1117⁄43 pence.
Pprice controlThe mechanism by which Ofgem sets restrictions on the amounts of revenue we are allowed to collect from customers in our UK businesses. The allowed revenues are intended to cover efficiently incurred operational expenditure, capital expenditure and financing costs, including a return on equity invested.
PSAThe 15 year power supply agreement with LIPA which came into effect on 28 May 2013, under which the Company supplies electricity to communities and businesses across Long Island.
Rrate baseThe base investment on which the utility is authorised to earn a cash return. It includes the original cost of facilities, minus depreciation, an allowance for working capital and other accounts.
rate planThe term given to the mechanism by which a US utility regulator sets terms and conditions for utility service including, in particular, tariffs and rate schedules. The term can mean a multi-year plan that is approved for a specified period, or an order approving tariffs and rate schedules that remain in effect until changed as a result of future regulatory proceedings. Such proceedings can be commenced through a filing by the utility or on the regulator’s own initiative.
regulated controllable operating costsTotal operating costs under IFRS less depreciation and certain regulatory costs where, under our regulatory agreements, mechanisms are in place to recover such costs in current or future periods.
190 National Grid Annual Report and Accounts 2013/14

Strategic Report Corporate Governance Financial Statements Additional Information
RPIThe UK retail price index as published by the Office for National Statistics.
SScope 1 emissionsScope 1 emissions are direct greenhouse gas emissions that occur from sources that are owned or controlled by the Company, for example, emissions from combustion in owned or controlled boilers, furnaces, vehicles, etc.
Scope 2 emissionsScope 2 emissions are greenhouse gas emissions from the generation of purchased electricity consumed by the Company. Purchased electricity is defined as electricity that is purchased or otherwise brought into the organisational boundary of the Company. Scope 2 emissions physically occur at the facility where electricity is generated.
SECThe US Securities and Exchange Commission, the financial regulator for companies with registered securities in the US, including National Grid and certain of its subsidiaries.
SF6
Sulphur hexafluoride, an inorganic, colourless, odourless and non-flammable greenhouse gas. SF6 is used in the electrical industry as a gaseous dielectric medium for high voltage circuit breakers, switchgear and other electrical equipment. The Kyoto protocol estimated that the global warming potential over 100 years of SF6 is 23,900 times more potent than that of CO2.
share premiumThe difference between the amount shares are issued for and the nominal value of those shares.
standard cubic metreA quantity of gas which at 15°C and atmospheric pressure (1.013 bar) occupies the volume of 1m3.
stranded cost recoveriesThe recovery of historical generation-related costs in the US, related to generation assets that are no longer owned by us.
STEMScience, technology, engineering and mathematics; the Company is currently looking to recruit people with skills in these subjects.
subsidiaryA company or other entity that is controlled by National Grid.
swaptionA swaption gives the buyer, in exchange for an option premium, the right, but not the obligation, to enter into an interest rate swap at some specified date in the future. The terms of the swap are specified on the trade date of the swaption.
Ttaxes borneThose taxes that represent a cost to the Company and which are reflected in our results.
taxes collectedThose taxes that are generated by our operations but which do not affect our results; we generate the commercial activity giving rise to these taxes and then collect and administer them on behalf of HMRC.
tonneA unit of mass equal to 1,000 kilogrammes, equivalent to approximately 2,205 pounds.
tonnes carbon dioxide equivalent (CO2e)A measure of greenhouse gas emissions in terms of the equivalent amount of carbon dioxide.
treasury sharesShares that have been repurchased but not cancelled. These shares can then be allotted to meet obligations under the Company’s employee share schemes.
TWhTerawatt hours, being an amount of energy equivalent to delivering 1 billion watts of power for a period of 1,000 hours.
UUKThe United Kingdom, comprising England, Wales, Scotland and Northern Ireland.
UK Corporate Governance Code 2012 (the Code)Guidance, issued by the Financial Reporting Council, on how companies should be governed, applicable to UK listed companies including National Grid.
UK GAAPGenerally accepted accounting principles in the UK. These differ from IFRS and from US GAAP.
USThe United States of America, its territories and possessions, any state of the United States and the District of Columbia.
US GAAPGenerally accepted accounting principles in the US. These differ from IFRS and from UK GAAP.
US state regulators (state utility commissions)In the US, public utilities’ retail transactions are regulated by state utility commissions, including the New York Public Service Commission (NYPSC), the Massachusetts Department of Public Utilities (MADPU) and the Rhode Island Public Utilities Commission (RIPUC).
value addedValue added is a measure to capture the value created through investment attributable to equity holders, being the change in total regulated and non-regulated assets including goodwill (both at constant currency) plus the cash dividend paid in the year less the growth in net debt (at constant currency). This is then presented on an absolute and a per share basis.
value growthValue growth is the growth in the value of our regulated and non-regulated assets including goodwill plus dividend less net debt, on a per share basis.
191

Want more information or help?
Financial calendarThe following dates have been announced or are indicative:
4 June 2014 Ordinary shares go ex-dividend for 2013/14
6 June 2014 Record date for 2013/14 final dividend
11 June 2014 Scrip reference price announced
27 June 2014 Scrip election date
28 July 2014 2014 AGM and interim management statement
20 August 2014 2013/14 final dividend paid to qualifying shareholders
7 November 2014 2014/15 half-year results
19 November 2014 Ordinary shares go ex-dividend
21 November 2014 Record date for 2014/15 interim dividend
7 January 2015 2014/15 interim dividend paid to qualifying shareholders
January/February 2015 Interim management statement
May 2015 2014/15 preliminary results
DividendsThe Directors are recommending a final dividend of 27.54 pence per ordinary share ($2.3107 per ADS) to be paid on 20 August 2014 to shareholders on the register as at 6 June 2014. Further details in respect of dividend payments can be found on page 07. If you live outside the UK, you may be able to request that your dividend payments be converted into your local currency.
Have your dividends paid directly into your bank or building society account:• Your dividend reaches your account on the payment day• It is more secure – cheques do sometimes get lost in the post• No more trips to the bank
Elect to receive your dividends as additional shares:• Join our scrip dividend scheme• No stamp duty or commission to pay
Capita Asset ServicesFor queries about ordinary shares:
0871 402 3344Calls cost 8 pence per minute plus network extras. Lines are open 8.30am to 5.30pm, Monday to Friday, excluding public holidays.If calling from outside the UK: +44 (0)20 7098 1198Textphone: 18001 0871 664 0532
Visit the National Grid share portal www.nationalgridshareholders.com Email: [email protected]
National Grid Share Register Capita Asset Services The Registry 34 Beckenham Road Beckenham, Kent BR3 4TU
The Bank of New York MellonFor queries about AmericanDepositary Shares:
1-800-466-7215 If calling from outside the US: +1-201-680-6825
www.mybnymdr.com Email: shrrelations@ cpushareownerservices.com
The Bank of New York Mellon Depositary Receipts PO Box 30170 College Station, Texas 77842-3170
Further information about National Grid including share price and interactive tools can be found on our website:www.nationalgrid.com
Have you received unsolicited investment advice?Shareholders are advised to be wary of any unsolicited advice or offers, whether over the telephone, through the post or by email. If you receive any such unsolicited communication please check the company or person contacting you is properly authorised by the Financial Conduct Authority (FCA) before getting involved.You can check at www.fca.org.uk/consumers/protect-yourself and can report calls from unauthorised firms to the FCA by calling 0800 111 6768.
American Depositary SharesThe Company has amended the deposit agreement under which the ADS representing its ordinary shares are issued to allow a fee of up to $0.05 per ADS to be charged for any cash distribution made to ADS holders, including cash dividends. ADS holders who receive cash in relation to the 2013/14 final dividend will be charged a fee of $0.02 per ADS by the Depositary prior to the distribution of the cash dividend.
Electronic communicationsTo receive an email notifying you as soon as new shareholder information is available to view online, including your electronic tax voucher, sign up for electronic communications. Simply go to the National Grid share portal www.nationalgridshareholders.com and once you have registered, click on the ‘manage your account’ link and follow the on screen instructions to change your communication preference.
Manage your shareholding online via the National Grid share portal:
• Have your dividends paid direct to your bank account instead of receiving cheques
• Choose to receive your dividends in shares, via our scrip dividend scheme
• Register your AGM votes
• Get copies of your dividend tax vouchers and view your dividend payment history
• Update your address details
192 National Grid Annual Report and Accounts 2013/14
Share dealingCapita Share Dealing Services offer our European Economic Area resident shareholders a range of quick and easy share dealing services by post, online or telephone from 10p per share (plus stamp duty as applicable). Dealing at live prices is available online or by telephone, different fees apply.
Visit www.capitadeal.com/nationalgrid or call Capita Share Dealing free on 0800 022 3374 for details and terms and conditions. This is not a recommendation to take any action. High street banks may also offer share dealing services. If you have any doubt as to what action you should take, please contact an authorised financial advisor.
ShareGift: If you only have a small number of shares which would cost more for you to sell than they are worth, you may wish to consider donating them to the charity.
ShareGift is a registered charity (no. 1052686) which specialises in accepting such shares as donations. For more information visit www.sharegift.org.uk or contact Capita Asset Services.
Individual Savings Accounts (ISAs): Corporate ISAs for National Grid shares are available from Stocktrade. For more information, call Stocktrade on 0131 240 0443, email [email protected] or write to Stocktrade, 6th floor, Atria One, 144 Morrison Street, Edinburgh EH3 8BR.
National Grid plc was incorporated on 11 July 2000. The Company is registered in England and Wales No. 4031152, with its registered office at 1-3 Strand, London WC2N 5EH.
The Company’s agent in the United States is National Grid USA, Attn: General Counsel, 40 Sylvan Road, Waltham, MA 02451.
Cautionary statementThis document comprises the Annual Report and Accounts for the year ending 31 March 2014 for National Grid and its subsidiaries. It contains the Directors’ Report and Financial Statements, together with the independent auditors’ report thereon, as required by the Companies Act 2006. The Directors’ Report, comprising pages 06 to 73 and 160 to 187, has been drawn up in accordance with the requirements of English law, and liability in respect thereof is also governed by English law. In particular, the liability of the Directors for these reports is solely to National Grid.
This document contains certain statements that are neither reported financial results nor other historical information. These statements are forward-looking statements within the meaning of Section 27A of the Securities Act of 1933, as amended, and Section 21E of the Securities Exchange Act of 1934, as amended. These statements include information with respect to our financial condition, our results of operations and businesses, strategy, plans and objectives. Words such as ‘anticipates’, ‘expects’, ‘should’, ‘intends’, ‘plans’, ‘believes’, ‘outlook’, ‘seeks’, ‘estimates’, ‘targets’, ‘may’, ‘will’, ‘continue’, ‘project’ and similar expressions, as well as statements in the future tense, identify forward-looking statements. These forward-looking statements are not guarantees of our future performance and are subject to assumptions, risks and uncertainties that could cause actual future results to differ materially from those expressed in or implied by such forward-looking statements. Many of these assumptions, risks and uncertainties relate to factors that are beyond our ability to control or estimate precisely, such as changes in laws or regulations, announcements from and decisions by governmental bodies or regulators (including the timeliness of consents for construction projects); the timing of construction and delivery by third parties of new generation projects requiring connection; breaches of, or changes in, environmental, climate change and health and safety laws or regulations, including breaches or other incidents arising
from the potentially harmful nature of our activities; network failure or interruption, the inability to carry out critical non network operations and damage to infrastructure, due to adverse weather conditions including the impact of major storms as well as the results of climate change or due to the failure of or unauthorised access to or deliberate breaches of our IT systems and supporting technology; performance against regulatory targets and standards and against our peers with the aim of delivering stakeholder expectations regarding costs and efficiency savings, including those related to investment programmes and internal transformation projects (including our US financial systems and our controls over financial reporting); and customers and counterparties (including financial institutions) failing to perform their obligations to the Company. Other factors that could cause actual results to differ materially from those described in this document include fluctuations in exchange rates, interest rates and commodity price indices; restrictions and conditions (including filing requirements) in our borrowing and debt arrangements, funding costs and access to financing; regulatory requirements for us to maintain financial resources in certain parts of our business and restrictions on some subsidiaries’ transactions such as paying dividends, lending or levying charges; inflation; the delayed timing of recoveries and payments in our regulated businesses and whether aspects of our activities are contestable; the funding requirements and performance of our pension schemes and other post-retirement benefit schemes; the failure to attract, train or retain employees with the necessary competencies, including leadership skills, and any significant disputes arising with our employees or the breach of laws or regulations by our employees; and the failure to respond to market developments and grow our business to deliver our strategy, as well as incorrect or unforeseen assumptions or conclusions (including unanticipated costs and liabilities) relating to business development activity, including assumptions in connection with joint ventures.
For further details regarding these and other assumptions, risks and uncertainties that may affect National Grid, please read the Strategic Report and the Risk factors on pages 167 to 169 of this document. In addition, new factors emerge from time to time and we cannot assess the potential impact of any such factor on our activities or the extent to which any factor, or combination of factors, may cause actual future results to differ materially from those contained in any forward-looking statement. Except as may be required by law or regulation, the Company undertakes no obligation to update any of its forward-looking statements, which speak only as of the date of this document.
The contents of any website references in this document do not form part of this document.
Printed on Amadeus 100% Recycled Offset paper. The paper is independently certified according to the rules of the Forest Stewardship Council® (FSC). The manufacturing mill holds the ISO 14001 environmental certification and the EU Eco-label (EMAS).
Printed by Pureprint Group, ISO 14001, FSC® certified and CarbonNeutral®.
Designed and produced by