Embed Size (px)
Citation preview
1
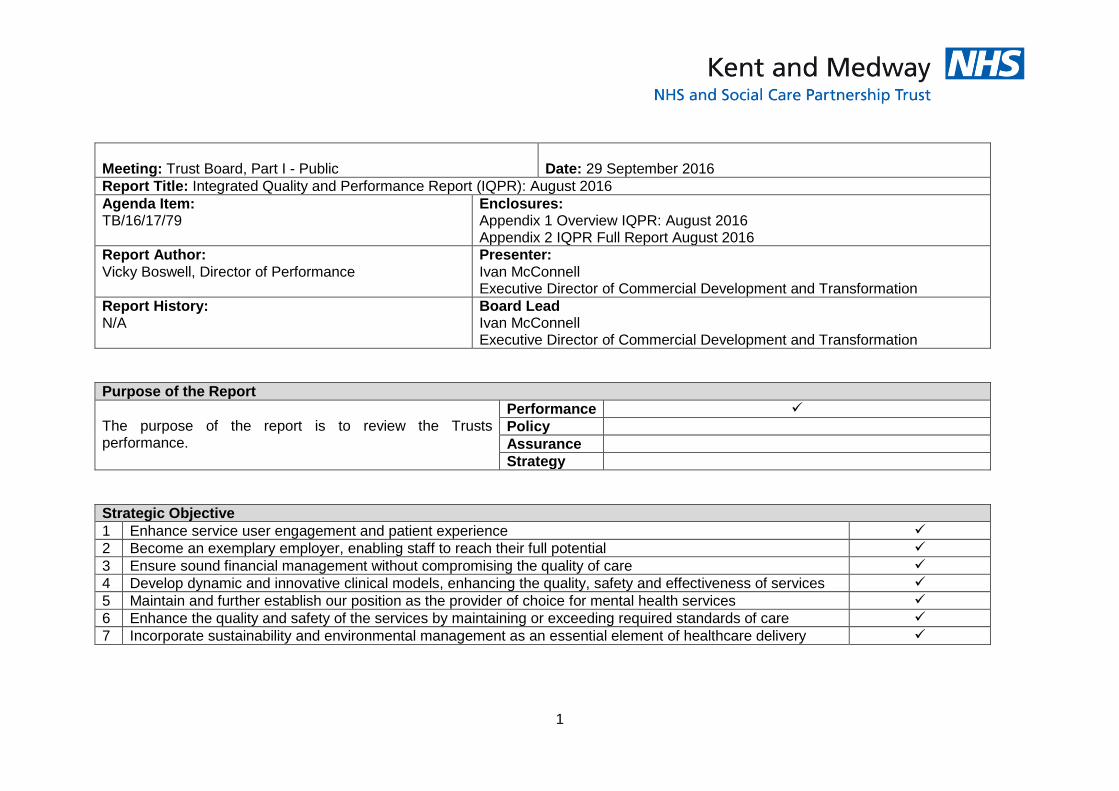
Meeting: Trust Board, Part I - Public
Date: 29 September 2016
Report Title: Integrated Quality and Performance Report (IQPR): August 2016
Agenda Item: TB/16/17/79
Enclosures: Appendix 1 Overview IQPR: August 2016 Appendix 2 IQPR Full Report August 2016
Report Author: Vicky Boswell, Director of Performance
Presenter: Ivan McConnell Executive Director of Commercial Development and Transformation
Report History: N/A
Board Lead Ivan McConnell Executive Director of Commercial Development and Transformation
Purpose of the Report
The purpose of the report is to review the Trusts performance.
Performance
Policy
Assurance
Strategy
Strategic Objective
1 Enhance service user engagement and patient experience
2 Become an exemplary employer, enabling staff to reach their full potential
3 Ensure sound financial management without compromising the quality of care
4 Develop dynamic and innovative clinical models, enhancing the quality, safety and effectiveness of services
5 Maintain and further establish our position as the provider of choice for mental health services
6 Enhance the quality and safety of the services by maintaining or exceeding required standards of care
7 Incorporate sustainability and environmental management as an essential element of healthcare delivery

2
Seven
Legal or regulatory implications
The Trust has achieved 6 of the 8 Regulatory targets in May, with the exceptions of CPA 12 month review and Delayed Transfer of Care (DToC). Early Intervention in Psychosis waiting time target achieved compliance in June for the second consecutive month.
Financial or resource implications
There is a continued pressure on out of area placements due to levels of demand and capacity. Management actions are in place which aim to minimise the use of out of area beds. KMPT continues to manage the allocation of the costs to the health economy of placing K&M clients into private acute units when there is no capacity in the Trust with Kent and Medway CCGs.
Engagement / Consultation
The IQPR forms the basis of discussions with Service Lines at the monthly performance management meetings. There is a particular focus on progress against financial and CRES plans and reduction in temporary staff spend, and for Service Lines, CQC QIP implementation and performance against trajectories for IQPR priorities and waiting time targets.
Risks identified Performance review arrangements have been strengthened to ensure that actions are being taken to minimise identified risks in achieving performance standards. Risk management is through the Service Line Performance Management meetings and the Operations Board.
Links to the Board Assurance Framework or Risk Register
The Board Assurance Framework (BAF) identifies risks to the strategic objectives to the Trust. The main risks associated with the IQPR are:
ID 4190 Financial control and delivery of CRES (current rating 20)
ID 4211 Ensuring all service users has a person centred and effective care plan (current rating 9)
ID 3746 Recruitment, retention and development of staff with suitable skills and competencies (current rating 6); and
ID 3808 Recruitment and retention to safe clinical staffing levels to enable adequate shift cover, including NHSP/Agency cover (current rating 16).
Impact on Quality
A balanced scorecard of indicators will highlight areas where quality improvement is required, and help direct efforts in areas where there may be a cause for concern.
Equality & Diversity
Access to IQPR data at service and team level may help to identify areas of inequality to be addressed.
Recommendation / Action required
The Board is asked to discuss the report.
Approval
Discussion
Consideration
Noting
Information

3
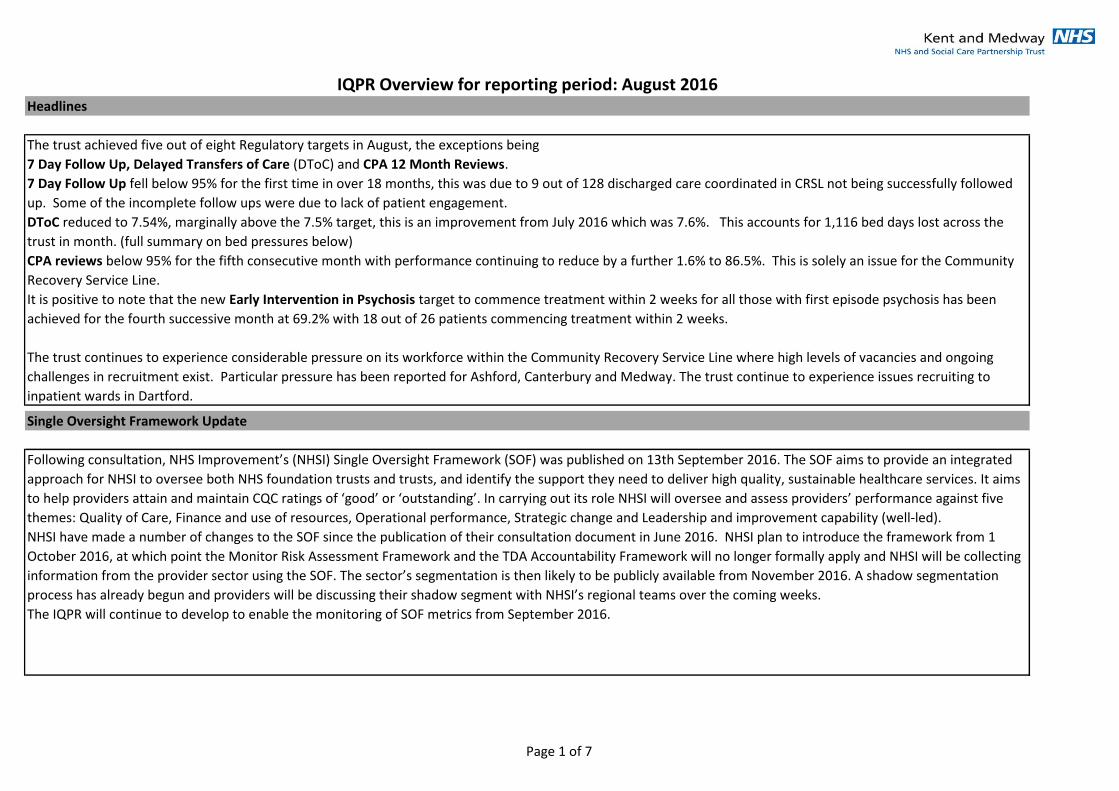
IQPR Overview for reporting period: August 2016
The trust achieved five out of eight Regulatory targets in August, the exceptions being
7 Day Follow Up, Delayed Transfers of Care (DToC) and CPA 12 Month Reviews.
7 Day Follow Up fell below 95% for the first time in over 18 months, this was due to 9 out of 128 discharged care coordinated in CRSL not being successfully followed
up. Some of the incomplete follow ups were due to lack of patient engagement.
DToC reduced to 7.54%, marginally above the 7.5% target, this is an improvement from July 2016 which was 7.6%. This accounts for 1,116 bed days lost across the
trust in month. (full summary on bed pressures below)
CPA reviews below 95% for the fifth consecutive month with performance continuing to reduce by a further 1.6% to 86.5%. This is solely an issue for the Community
Recovery Service Line.
It is positive to note that the new Early Intervention in Psychosis target to commence treatment within 2 weeks for all those with first episode psychosis has been
achieved for the fourth successive month at 69.2% with 18 out of 26 patients commencing treatment within 2 weeks.
The trust continues to experience considerable pressure on its workforce within the Community Recovery Service Line where high levels of vacancies and ongoing
challenges in recruitment exist. Particular pressure has been reported for Ashford, Canterbury and Medway. The trust continue to experience issues recruiting to
inpatient wards in Dartford.
Following consultation, NHS Improvement’s (NHSI) Single Oversight Framework (SOF) was published on 13th September 2016. The SOF aims to provide an integrated
approach for NHSI to oversee both NHS foundation trusts and trusts, and identify the support they need to deliver high quality, sustainable healthcare services. It aims
to help providers attain and maintain CQC ratings of ‘good’ or ‘outstanding’. In carrying out its role NHSI will oversee and assess providers’ performance against five
themes: Quality of Care, Finance and use of resources, Operational performance, Strategic change and Leadership and improvement capability (well-led).
NHSI have made a number of changes to the SOF since the publication of their consultation document in June 2016. NHSI plan to introduce the framework from 1
October 2016, at which point the Monitor Risk Assessment Framework and the TDA Accountability Framework will no longer formally apply and NHSI will be collecting
information from the provider sector using the SOF. The sector’s segmentation is then likely to be publicly available from November 2016. A shadow segmentation
process has already begun and providers will be discussing their shadow segment with NHSI’s regional teams over the coming weeks.
The IQPR will continue to develop to enable the monitoring of SOF metrics from September 2016.
Single Oversight Framework Update
Headlines
Page 1 of 7
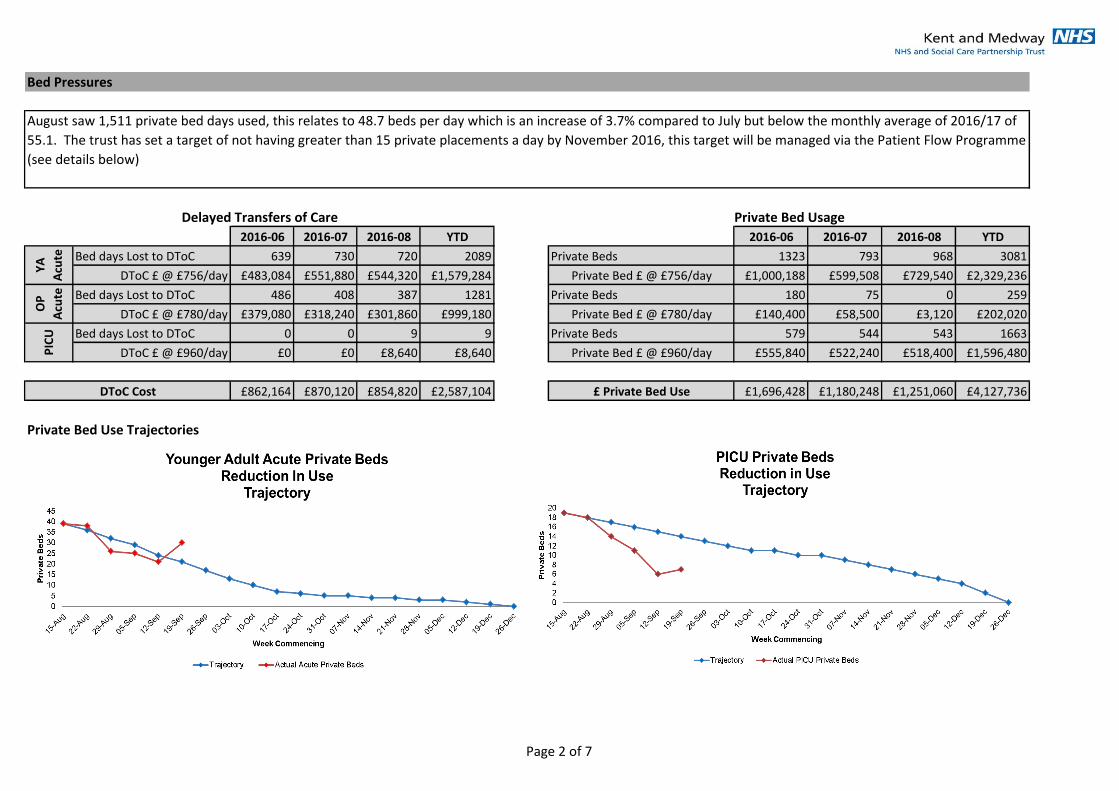
2016-06 2016-07 2016-08 YTD 2016-06 2016-07 2016-08 YTD
Bed days Lost to DToC 639 730 720 2089 1323 793 968 3081
DToC £ @ £756/day £483,084 £551,880 £544,320 £1,579,284 £1,000,188 £599,508 £729,540 £2,329,236
Bed days Lost to DToC 486 408 387 1281 180 75 0 259
DToC £ @ £780/day £379,080 £318,240 £301,860 £999,180 £140,400 £58,500 £3,120 £202,020
Bed days Lost to DToC 0 0 9 9 579 544 543 1663
DToC £ @ £960/day £0 £0 £8,640 £8,640 £555,840 £522,240 £518,400 £1,596,480
£862,164 £870,120 £854,820 £2,587,104 £1,696,428 £1,180,248 £1,251,060 £4,127,736
Private Bed Use Trajectories
Delayed Transfers of Care Private Bed Usage
Bed Pressures
£ Private Bed Use
YA
Acu
teP
ICU
OP
Acu
te
DToC Cost
Private Bed £ @ £756/day
Private Bed £ @ £960/day
Private Bed £ @ £780/day
Private Beds
Private Beds
Private Beds
August saw 1,511 private bed days used, this relates to 48.7 beds per day which is an increase of 3.7% compared to July but below the monthly average of 2016/17 of
55.1. The trust has set a target of not having greater than 15 private placements a day by November 2016, this target will be managed via the Patient Flow Programme
(see details below)
Page 2 of 7

The trust has now implemented the new waiting time measures within the IQPR. This brings the trust in line with other nationally reported metrics. The change
fundamentally reflects the need for the initial assessment to be a face to face contact and no clock restarts are allowed within the national approach.
As expected and previously measured in shadow form within previous reports this has led to a reduction in reported performance levels with CRSL undergoing the
greatest reduction.
Waiting Times
Patient Flow Programme
The Patient Flow Programme has been established to achieve, with the opening of Pinewood, a reduction in private bed usage to a maximum of 15 beds by end
October 2016 and a further reduction in private bed usage to 0 by end December 2016 for acute mental health and psychiatric intensive care unit [PICU] beds.
Governance of the programme is provided by the Patient Flow Programme Board [PFPB] which was established on 3 August 2016 and meets weekly. It is chaired
jointly by the Executive Medical Director and Executive Director Operations, with clinical leadership provided by the Associate Medical Director Acute, and with cross
service line (acute, community recovery and older adult) representation at a senior level. The PFPB reports in to the Operations and Transformation Board. A number
of work streams have been established to reflect the whole system approach needed to deliver change and achieve the objectives.
CRSL Target Operating Model
The CRSL Target Operating Model (TOM) will be developed to reduce unwarranted variation in the standard of care and support staff who feel overwhelmed and under
pressure. An initial plan has been developed to articulate vision, description, outcomes, impact, delivery plan and milestones, key risks as well as resourcing. This draft
plan will be discussed when the group meets for the 1st time on September 21st.
As part of this work a review of performance trends has been carried out that can be found in appendix A.
Page 3 of 7

Balanced Scorecard
Measure Target 2016-08 MovementNext Month
Forecast
Trend
(Last 12 months where available, left to right)
7 Day Follow Up 95% 94.4%
CPA Review 95% 86.5%
DToC 7.5% 7.54%
EIP Wait Times 50% 69.2%
Sickness Absence 3.9% 4.0%
Staff Vacancies 15% 10.4%
Staff Turnover 14% 16.0%
Agency Spend 5% 6.1%
% in Employment 13% 14.2%
% in Settled Accommodation 75% 83.7%
4 week Referral to Assessment 95% 80.2%
18 Week Referral to Treatment 95% 88.9%
Serious Incidents N/A 8 N/A
Never Events 0 0 0 Never events in last 12 months
Complaints N/A 43 N/A
Care Plans Distributed to Service
User75% 39.3%
* See full IQPR report for full measure descriptions
Car
ing
The new waiting time measures introduced in August 2016 has had a detrimental impact on
performance levels as anticipated. No Service line achieved the waiting time standards for
assessment and treatment. Forensic and Specialist Services have not achieved this target due to
lack of commissioned capacity in specialist services, although 4 week wait compliance improved
by 15.7%. CRSL compliance with the 4 week wait has reduced to 62% from 82.7% in August, 294
out of 774 who underwent initial assessment in CRSL were not seen within 4 weeks.
Re
gula
tory
Issues / Risks and Mitigating Actions
Org
anis
atio
nal
He
alth Service Lines are supporting Health and Wellbeing initiatives to reduce absence, improve staff
engagement and reduce turnover.
Long term sickness absence is reducing in Service Lines and is being proactively managed by
line managers, supported by HR. The Trust has implemented a number of recent actions to
improve recruitment and retention. Cohesion are supporting recruitment in North Kent to
improve the staffing situation.
Agency spend has increased Trust-wide by 0.1% in August
Effe
ctiv
eSa
fe
7 day follow up - OPMH achieved the target and in CRSL 9 breached
CPA review - CPA Reviews fell by a further 1.6% overall with CRSL at 85.4%. 337 reviews
outstanding in the service line - close monitoring and risk review in place.
DToC - Performance continues to improve with ongoing productive liaison with partners to
facilitate appropriate discharge. This is having a positive impact on private beds
EIP wait times - NHS(E) project with CCGs to provide whole system focus
Serious incidents reduced from a 12 monthly high of 22 in May to 8 in August which is
considerably below the average of 15 per month.
Care plan distribution increased 3.2% in month and improved in each Service Line, with the
Forensic and Specialist Service Line at 91.4%. The new RiO Care Plan has been added to open
RiO and the old care plan template will be switched off on October 1st. This will improve
compliance and quality.
Page 4 of 7

Trust Wide Financial Position
Ref Measure Target Aug-16 Jul-16 MovementAnnual
Plan
Annual
Forecast
1.1 Income (£000) (15,440) (15,350) (15,638) (185,279) (179,146)
1.2 Pay Expenditure (£000) 11,396 11,660 11,462 136,750 138,127
1.3 Non Pay Expenditure (£000) 4,458 4,118 4,377 52,859 45,349
1.4 Retained (Surplus) / Deficit (£000) 414 428 201 4,330 4,330
1.5 CRES achieved in month (£000) 406 354 622 5,559 5,559
1.6 Capital spend (£000) 390 257 596 4,357 4,357
1.7 Month end cash balance (£000) 653 2,853 3,276 116 116
The Trust continues to report a deficit in line with the improved control total. In month the deficit was £0.4m after technical adjustments and year to date the deficit is
£2.2m after technical adjustments.
The Trust continues to recognise Sustainability and Transformation Funding based on performance being on plan year to date, and is forecasting to receive the full £1.1m
in 2016/17.
The cash position has remained favourable, with the month end balance £2.2m better than planned. However the Trust has received a cash advance in June on block
contract for March 2017 which means that the underlying cash position continues to be monitored closely to ensure that this can be maintained in the latter quarter of
the year.
The forecast position for year end is to deliver the planned deficit of £4.1m after technical adjustments.
Page 5 of 7

Trajectories
Measure Target CurrentPeriod not met
(months)
Proposed date of
achievementTrajectory Owner Actions
DToC 7.5% 12.8% 22 November 2016Service Line
Director
As part of the Patient Flow Programme, the Acute Service Line have established a daily internal bed
management call to review all delayed transfers of care. Each barrier to discharge is discussed with the
Community and Recovery Service Line to ensure discharge takes place at the earliest possible time to
improved patient experience / carer satisfaction and reduce time in inpatient care.
Emergency
Readmissions5% 13.6% >24 November 2016
Business
Manager
There has been a continued issue with data quality on the recording of emergency readmissions as
currently there are 12 national codes available, 8 of which relate to emergency readmissions. National
reporting has been reviewed to ensure any changes to Rio to simplify process have no negative impact and
as a result the service line is reviewing how best this may work on RiO to support operational process
Target Ave Daily
Private Beds 15 48.5 >24
15 beds by end of
October 2016, 0
by end December
2016
Service Line
Director
The Patient Flow Programme Board has been established, with the opening of Pinewood, a reduction in
private bed usage of 15 beds by end October 2016 and a further reduction in private bed usage to 0 by end
December 2016 for acute mental health and psychiatric intensive care beds (PICU)
The Programme has put trajectories in place in order to meet these targets.
Agency 5% 9.3% >6 Dec-16Service Line
Director
Agency usage in the Acute Service Line continues to be an issue due to an increasing number of vacancies.
A recruitment and retention group has been set up to focus specifically on Acute Service Line issues in
order to see the number of vacancies decrease and to help to retain the current workforce.
Measure Target CurrentPeriod not met
(months)
Proposed date of
achievementTrajectory Owner Actions
CPA Review 95% 85.4% 8 November 2016Service
Managers
The Service Managers are reviewing processes in teams to ensure that there is a designated administrator
who monitors and books all CPA reviews in advance to avoid breaching and provide weekly reminders to
staff. It is worth noting that DGS CMHT has been able to sustain the compliance and remains in excess of
97%.
4 Week Referral to
Assessment95% 62.0% >24 March 2017
Service
Managers
The change in the waiting time methodology has had an impact on the overall compliance and Service
managers are working with the Senior Management Team on local action plans to support the teams.
Admin staff monitor the waiting list and highlight potential breaches to clinical staff. The CMHTs have a
number of vacancies, which are high in Ashford and Medway. The SMT and HR have put an action plan
together to support teams with the recruitment process.
18 Week Referral to
Treatment95% 85.4% 1 December 2016
Service
Managers
CRSL was previously compliant; however due to the change in the waiting time methodology the overall
compliance has dropped below 95%. Its is also worth adding that the staffing issues have had an impact on
performance. The Service Managers have reviewed processes to ensure more robust systems. Admin staff
monitor the waiting list and highlight potential breaches to clinical staff.
% Care Plans 95% 86.7% 8 March 2017Service
Managers
There has been a dip in performance following the introduction of the new care plan due to a recording
issue; however staff have been reminded of the correct procedure and an improvement is expected.
Staffing issues have also affected the teams' performance and the Service Managers and HR have put
together an action plan to support the recruitment process. It is worth noting that Ashford is expecting to
have 2 new staff by the end of October.
% Crisis Plans 95% 93.6% 9 March 2017Service
Managers
Performance is improving and it is expected that the service will be compliant by November. The new Care
Plans incorporate Crisis Plans, and therefore it will be easier for the staff to complete them concurrently.
EIS waits 50% 69.2% 0 N/AService
ManagersIt is anticipated that the national waiting time target will be reached each month.
The trajectories shown here have been reset since the last report, this is partly due to the new measurement of waiting time metrics as well as to reflect the refreshed approach developed within the
Patient Flow Programme and the CRSL Target Operating Model Programme
Community Recovery Service Line
Acute Service Line
Page 6 of 7

Trajectories
Measure Target CurrentPeriod not met
(months)
Proposed date of
achievementTrajectory Owner Actions
4 Week Referral to
Assessment95% 82.0% >24 March 2017
Service
Managers
18 Week Referral to
Treatment95% 76.6% >24 March 2017
Service
Managers
Turnover 14% 17.2% >12 March 2017 SLD
Turnover within the service line has decreased since January 2016 with further reductions expected due to
ongoing actions aimed at improving staff engagement:
• Staff exit questionnaires
• Recruitment open days
• Monitoring recruitment
• Review skill mixing
Measure Target CurrentPeriod not met
(months)
Proposed date of
achievementTrajectory Owner Actions
DToC 7.5% 9.3% 20 January 2017
Assistant
Director -
inpatient
Increase in therapeutic revised banding will enable increase in recovery model thus reducing overall
delayed discharges. OPMH Remain at 0 for Private Placements.
• Weekly Conference calls including KCC and CCGs
• All requests for beds have clear treatment plan
• Reviews of Crisis plans and ensuring that all CMHT options including CRHT are pursued
4 Week Referral to
Assessment95% 86.1% 1 January 2017
Assistant
Director -
community
Demand and capacity model implemented to support patient flows across community teams. All teams are
aware of the number of referrals received each week and job plan assessment slots accordingly. The
revised waiting time measurement, which now includes DNA and cancelled by client has had an impact on
the compliance and the service line is currently developing plans to address this issue and reduce DNAs
further.
18 Week Referral to
Treatment95% 88.9% 2 January 2017
Assistant
Director -
community
Demand and capacity model implemented to support patient flows across community teams. As above the
teams are aware of the number of appointments needed to ensure the timely throughput of patients.
When full compliance is not achieved, issues with medical staffing and diagnostic procedures are causing
delays and are being addressed.
% Care Plans 95% 96.0% 0 N/A
Assistant
Director -
community
Administrative and clinical processes in place to support all patients receiving a care plan from the first
appointment.
Agency 5% 7.7% >6 January 2017
Assistant
Director -
inpatient
• Therapeutic staffing is being e-rostered with new rules to improve control
• Increase in NHSP and reduction in Agency month on month 1-4
• Sickness on all acute wards monitored via dashboard monthly
• Use of Observation Policy being reviewed daily to reduce observations and increase group therapy
Graph key
Target
Actual
Trajectory
Older Persons Service Line
Forensics and Specialist Service Line
Because of the way that specialist services are commissioned, it is unlikely that they will be able to achieve
the 95% target during 2016/17. However, we do expect to see some improvement in staffing, funding and
strategy due to:
• Consistent monitoring and reporting of the IQPR and the prioritisation of booking appointments for
clients close to breach.
• The ongoing Trust wide Personality Disorder review
• Bids for service uplift for the Primary Eating Disorder and MIMHS services.
• The imminent start of consultant posts within the Personality Disorder and Neuropsychiatry services.
• The Personality Disorder team have reduced the maximum time in outreach groups from 24 months to
18 months (with an expectation that after 12 months patients will be considered for transfer into the 3 day
per week programme at Brenchley).
Page 7 of 7
Monthly
Integrated Quality and Performance Report
August 2016

OPMH Service Line 17
Service Line Summaries
CONTENTS
Trust Summary 3
Finance Summary by Service Line 7
Acute Service Line 8
Community Recovery Service Line 11
Forensic & Specialist Service Line 14
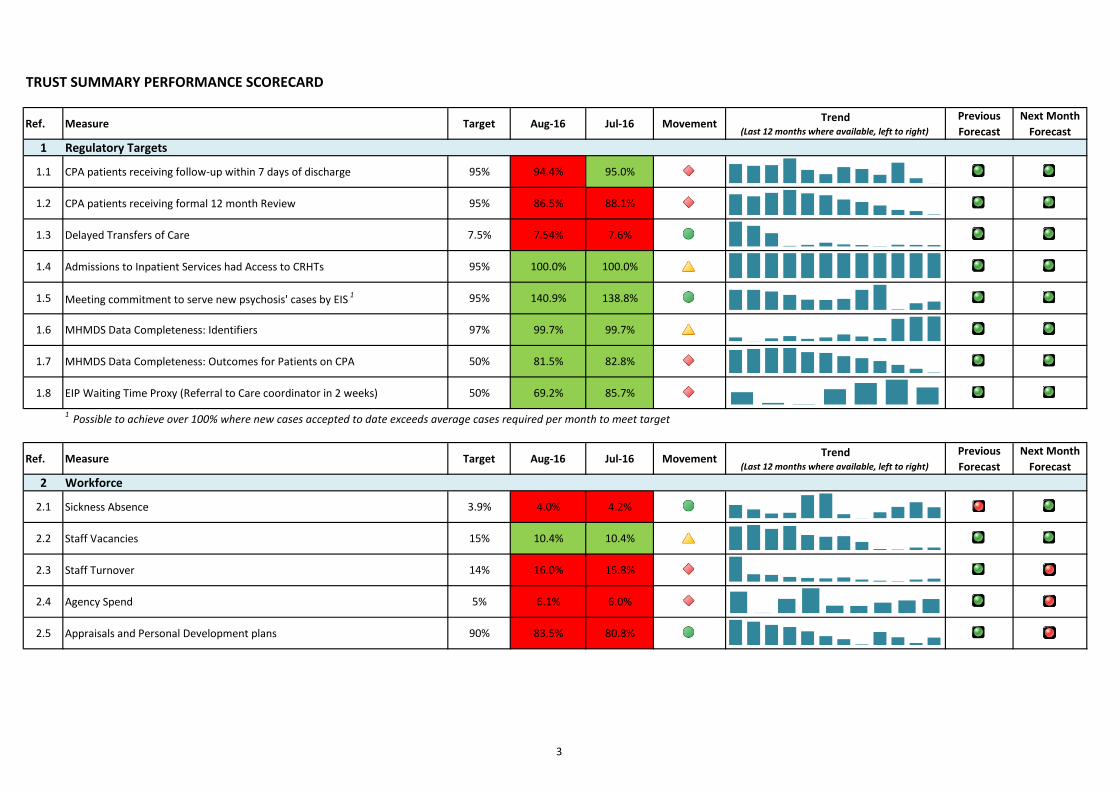
TRUST SUMMARY PERFORMANCE SCORECARD
Ref. Measure Target Aug-16 Jul-16 MovementTrend
(Last 12 months where available, left to right)
Previous
Forecast
Next Month
Forecast
1 Regulatory Targets
1.1 CPA patients receiving follow-up within 7 days of discharge 95% 94.4% 95.0%
1.2 CPA patients receiving formal 12 month Review 95% 86.5% 88.1%
1.3 Delayed Transfers of Care 7.5% 7.54% 7.6%
1.4 Admissions to Inpatient Services had Access to CRHTs 95% 100.0% 100.0%
1.5 Meeting commitment to serve new psychosis' cases by EIS 1 95% 140.9% 138.8%
1.6 MHMDS Data Completeness: Identifiers 97% 99.7% 99.7%
1.7 MHMDS Data Completeness: Outcomes for Patients on CPA 50% 81.5% 82.8%
1.8 EIP Waiting Time Proxy (Referral to Care coordinator in 2 weeks) 50% 69.2% 85.7%
1 Possible to achieve over 100% where new cases accepted to date exceeds average cases required per month to meet target
Ref. Measure Target Aug-16 Jul-16 MovementTrend
(Last 12 months where available, left to right)
Previous
Forecast
Next Month
Forecast
2 Workforce
2.1 Sickness Absence 3.9% 4.0% 4.2%
2.2 Staff Vacancies 15% 10.4% 10.4%
2.3 Staff Turnover 14% 16.0% 15.8%
2.4 Agency Spend 5% 6.1% 6.0%
2.5 Appraisals and Personal Development plans 90% 83.5% 80.8%
3

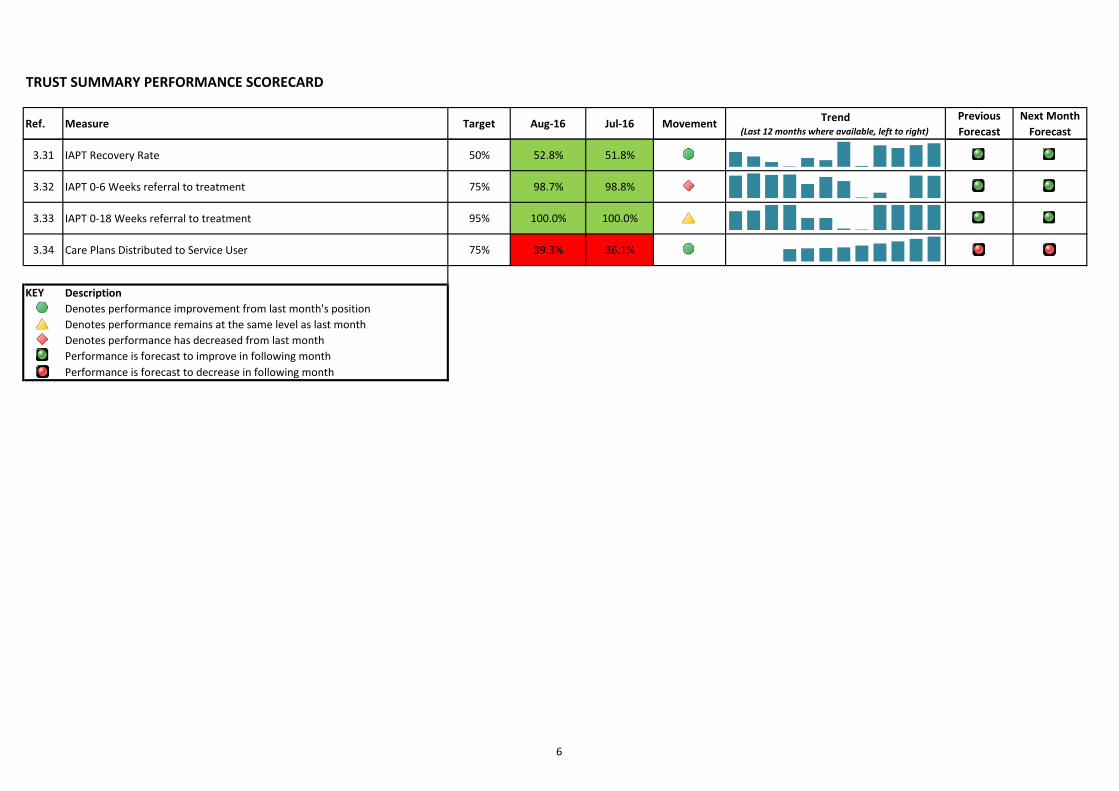
TRUST SUMMARY PERFORMANCE SCORECARD
Ref. Measure Target Aug-16 Jul-16 MovementTrend
(Last 12 months where available, left to right)
Previous
Forecast
Next Month
Forecast
2.6 % mandatory training 85% 91.4% 90.9%
2.7 % Eligible staff with enhanced CRB check 100% 100.0% 100.0%
Ref. Measure Target Aug-16 Jul-16 MovementTrend
(Last 12 months where available, left to right)
Previous
Forecast
Next Month
Forecast
3 Quality
3.1 Referral to assessment within 4 weeks 95% 80.2% 87.7%
3.2 18 Weeks referral to treatment 95% 88.9% 94.9%
3.3 % of patients with valid CPA care plan or plan of care 95% 91.2% 91.5%
3.4 Crisis Plans (all patients) 95% 95.7% 95.9%
3.5 % of Service users in employment 13% 14.2% 14.0%
3.6 % of Service Users in Settled Accommodation 75% 83.7% 83.9%
3.7 % Reviews undertaken within the maximum cluster review period 95% 73.8% 71.5%
3.8 % of service users assessed with cluster assigned 95% 94.5% 93.2%
3.9 % inpatients with a physical health check within 72 hours 100% 73.3% 76.2%
3.10 Number of Home Treatment Episodes 224 326 298
3.11 Emergency Readmission within 28 days 5% 13.4% 10.7%
3.12 Average Length of stay(Younger Adults) 25 30.5 25.1
3.13 Bed Occupancy: Internal Usage v's Internal Capacity (YA Acute) 98.4% 97.4% N/A N/A
Act
ual
s R
epo
rted
4

TRUST SUMMARY PERFORMANCE SCORECARD
Ref. Measure Target Aug-16 Jul-16 MovementTrend
(Last 12 months where available, left to right)
Previous
Forecast
Next Month
Forecast
3.14 Bed Occupancy: Internal & External Usage v's Internal Capacity (YA Acute) 116.8% 112.5% N/A N/A
3.15Bed Occupancy: Internal & External Usage v's Proposed 174 Capacity (YA
Acute)113.3% 109.2% N/A N/A
3.16 Bed Occupancy: Internal Usage v's Internal Capacity (YA PICU) 97.8% 98.9% N/A N/A
3.17 Bed Occupancy: Internal & External Usage v's Internal Capacity (YA PICU) 242.2% 245.2% N/A N/A
3.18 Average Length of stay(Older Adults) 52 86.8 107.7
3.19 Bed Occupancy: Internal Usage v's Internal Capacity (OP Acute) 96.0% 94.6% N/A N/A
3.20 Bed Occupancy: Internal & External Usage v's Internal Capacity (OP Acute) 96.1% 97.3% N/A N/A
3.21 Number of unplanned absences (AWOL and absconds on MHA) 0 0 0
3.22 Serious Incidents 8 11 N/A N/A
3.23 Number of Grade 1&2 Sis confirmed breached over 60 days 0 0 0 Grade 1&2 Sis breached in last 12 months N/A N/A
3.25 Complaints (level2-4 , MP enquiries & MP Complaints) 43 34 N/A N/A
3.26 Never Events 0 0 0 0 Never events in last 12 months
3.27 Information Governance Breaches 0 0 0
3.28 Safeguarding training Adult - Basic Introduction 85% 98.8% 98.2%
3.29 Safeguarding training - Children 85% 98.7% 97.9%
3.30 Safeguarding training - Children Level 2 85% 93.4% 92.7%
Act
ual
s R
epo
rted
Act
ual
s R
epo
rted
Act
ual
s
Rep
ort
ed
5
TRUST SUMMARY PERFORMANCE SCORECARD
Ref. Measure Target Aug-16 Jul-16 MovementTrend
(Last 12 months where available, left to right)
Previous
Forecast
Next Month
Forecast
3.31 IAPT Recovery Rate 50% 52.8% 51.8%
3.32 IAPT 0-6 Weeks referral to treatment 75% 98.7% 98.8%
3.33 IAPT 0-18 Weeks referral to treatment 95% 100.0% 100.0%
3.34 Care Plans Distributed to Service User 75% 39.3% 36.1%
KEY Description
Denotes performance improvement from last month's position
Denotes performance remains at the same level as last month
Denotes performance has decreased from last month
Performance is forecast to improve in following month
Performance is forecast to decrease in following month
6

TRUST SUMMARY PERFORMANCE SCRORECARD
Ref Measure Target Aug-16 Jul-16 MovementAnnual
Plan
Annual
Forecast
1.1 Income (£000) (15,440) (15,350) (15,638) (185,279) (179,146)
1.2 Pay Expenditure (£000) 11,396 11,660 11,462 136,750 138,127
1.3 Non Pay Expenditure (£000) 4,458 4,118 4,377 52,859 45,349
1.4Retained (Surplus) / Deficit (£000)
(Pre Technical Adjustments) 414 428 201 4,330 4,330
1.5 CRES achieved in month (£000) 406 354 622 5,559 5,559
1.6 Capital spend (£000) 390 257 596 4,357 4,357
1.7 Month end cash balance (£000) 653 2,853 3,276 116 116
Acute Forensic & Spec Services
Ref Measure Target Aug-16 Jul-16 MovementAnnual
Plan
Annual
ForecastRef Measure Target Aug-16 Jul-16 Movement
Annual
Plan
Annual
Forecast
1.1 Income (£000) (792) (1,106) (855) (9,505) (13,190) 1.1 Income (£000) (166) (226) (247) (2,359) (2,392)
1.2 Pay Expenditure (£000) 2,177 2,474 2,481 26,337 30,833 1.2 Pay Expenditure (£000) 1,837 1,918 1,873 22,503 22,184
1.3 Non Pay Expenditure (£000) 1,045 1,400 1,119 12,366 12,581 1.3 Non Pay Expenditure (£000) 452 361 439 5,153 5,343
1.4 Net Position (£000) 2,429 2,768 2,744 29,198 30,224 1.4 Net Position (£000) 2,123 2,052 2,065 25,297 25,135
0 0 0 0
CRSL & PCPTS OPMH Services
Ref Measure Target Aug-16 Jul-16 MovementAnnual
Plan
Annual
ForecastRef Measure Target Aug-16 Jul-16 Movement
Annual
Plan
Annual
Forecast
1.1 Income (£000) (228) (134) (126) (2,738) (2,192) 1.1 Income (£000) (411) (231) (468) (4,937) (5,090)
1.2 Pay Expenditure (£000) 2,556 2,657 2,647 30,751 31,670 1.2 Pay Expenditure (£000) 2,104 2,252 2,247 25,117 26,890
1.3 Non Pay Expenditure (£000) 348 329 334 4,107 4,058 1.3 Non Pay Expenditure (£000) 309 356 266 3,824 4,335
1.4 Net Position (£000) 2,676 2,852 2,855 32,120 33,536 1.4 Net Position (£000) 2,002 2,378 2,045 24,004 26,135
7

ACUTE SERVICE LINE SUMMARY PERFORMANCE SCORECARD
Ref. Measure Target Aug-16 Jul-16 MovementNext Month
ForecastAsh
Cant &
Coast
South
Kent
Coast
Thanet DGS Med SwaleWest
Kent
1 Regulatory Targets
1.3 Delayed Transfers of Care 7.5% 12.8% 12.9% 19.1% 19.0% 0.0% 5.3% 5.0% 21.8% 7.5% 14.9%
1.4Admissions to Inpatient Services had
Access to CRHTs 95% 100.0% 100.0% 100.0% 100.0% 100.0% 100.0% 100.0% 100.0% 100.0% 100.0%
1.6MHMDS Data Completeness:
Identifiers97% 99.7% 99.7% 99.9% 99.8% 99.8% 99.6% 99.7% 99.6% 99.7% 99.8%
Ref. Measure Target Aug-16 Jul-16 MovementNext Month
ForecastAsh
Cant &
Coast
South
Kent
Coast
Thanet DGS Med SwaleWest
Kent
2 Workforce
2.1 Sickness Absence 3.9% 3.7% 5.5% 4.5% 1.8% 6.4% 3.8% 2.3%
2.2 Staff Vacancies 15% 10.3% 9.3% 7.2% 4.8% 18.4% 13.5% 7.2%
2.3 Staff Turnover 14% 17.9% 17.5% 15.2% 15.7% 20.2% 25.7% 19.1%
2.4 Agency Spend 5% 9.3% 9.3% 0.5% 7.4% 7.1% 15.1% 12.2%
2.5Appraisals and Personal
Development plans90% 80.3% 78.7% 92.9% 90.4% 77.0% 72.1% 73.6%
2.6 % mandatory training 85% 89.8% 88.6% 91.9% 89.6% 92.3% 86.1% 87.4%
2.7% Eligible staff with enhanced CRB
check100% 100.0% 100.0% 100.0% 100.0% 100.0% 100.0% 100.0%
8

ACUTE SERVICE LINE SUMMARY PERFORMANCE SCORECARD
Ref. Measure Target Aug-16 Jul-16 MovementNext Month
ForecastAsh
Cant &
Coast
South
Kent
Coast
Thanet DGS Med SwaleWest
Kent
3 Quality
3.1Referral to assessment within 4
weeks95% 99.2% 98.9% 95.8% 100.0% 97.7% 100.0% 100.0% 100.0% 100.0% 98.2%
3.2 18 Weeks referral to treatment 95% 100.0% 99.3% 100.0% 100.0% 100.0% 100.0% 100.0% 100.0% 100.0% 100.0%
3.7% Reviews undertaken within the
maximum cluster review period95% 82.8% 76.0% 91.3% 78.7% 82.2% 86.0% 91.4% 86.1% 81.5% 65.6%
3.8% of service users assessed with
cluster assigned95% 75.0% 55.6% 100.0% 100.0% 50.0%
3.9% inpatients with a physical health
check within 72 hours 100% 73.7% 77.4% 72.7% 81.5% 92.3% 89.3% 53.8% 58.1% 60.0% 83.3%
3.10Number of Home Treatment
Episodes224 326 298 20 43 38 37 47 49 25 60
3.11Emergency Readmission within 28
days5% 13.6% 11.5% 16.7% 3.4% 0.0% 16.1% 20.0% 26.5% 18.2% 7.1%
3.12Average Length of stay(Younger
Adults)25 30.5 25.1 61.6 28.5 30.1 20.0 19.0 29.5 25.1 40.7
3.13Bed Occupancy: Internal Usage v's
Internal Capacity (YA Acute)98.4% 97.4% N/A
3.14Bed Occupancy: Internal & External
Usage v's Internal Capacity (YA 116.8% 112.5% N/A
3.15Bed Occupancy: Internal & External
Usage v's Proposed 174 Capacity (YA 113.3% 109.2% N/A
3.16Bed Occupancy: Internal Usage v's
Internal Capacity (YA PICU)97.8% 98.9% N/A
3.17Bed Occupancy: Internal & External
Usage v's Internal Capacity (YA PICU)242.2% 211.3% N/A
Act
ual
s R
epo
rted
Occupancy levels not reportable by CCG as specific beds are not assigned to a
particular CCG.
9

ACUTE SERVICE LINE SUMMARY PERFORMANCE SCORECARD
Ref. Measure Target Aug-16 Jul-16 MovementNext Month
ForecastAsh
Cant &
Coast
South
Kent
Coast
Thanet DGS Med SwaleWest
Kent
3.21Number of unplanned absences
(AWOL and absconds on MHA)0 0 0
3.22 Serious Incidents 2 2 N/A
3.23Number of Grade 1&2 Sis confirmed
breached over 60 days0 0 N/A
3.25Complaints (level2-4 , MP enquiries &
MP Complaints)9 10 N/A
3.26 Never Events 0 0 0
3.27 Information Governance Breaches 0 0 0
3.28Safeguarding training Adult - Basic
Introduction85% 99.6% 98.4% 100.0% 100.0% 100.0% 97.6% 100.0%
3.29 Safeguarding training - Children 85% 99.6% 98.4% 100.0% 100.0% 100.0% 97.6% 100.0%
3.30Safeguarding training - Children Level
285% 93.9% 93.0% 95.6% 93.0% 97.3% 95.9% 89.2%
Act
ual
s R
epo
rted
It is not currently possible to provide breakdowns to team/CCG level, work in
progress to identify a solution to allow granularity of reporting
10
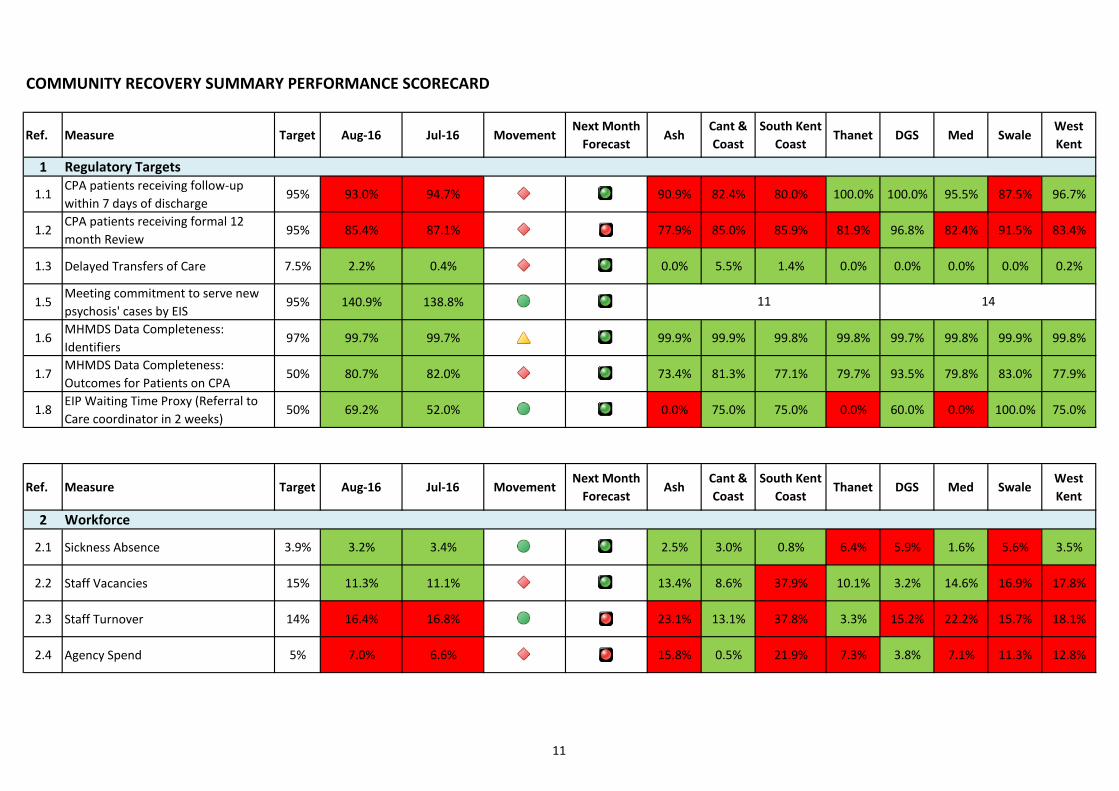
COMMUNITY RECOVERY SUMMARY PERFORMANCE SCORECARD
Ref. Measure Target Aug-16 Jul-16 MovementNext Month
ForecastAsh
Cant &
Coast
South Kent
CoastThanet DGS Med Swale
West
Kent
1 Regulatory Targets
1.1CPA patients receiving follow-up
within 7 days of discharge95% 93.0% 94.7% 90.9% 82.4% 80.0% 100.0% 100.0% 95.5% 87.5% 96.7%
1.2CPA patients receiving formal 12
month Review95% 85.4% 87.1% 77.9% 85.0% 85.9% 81.9% 96.8% 82.4% 91.5% 83.4%
1.3 Delayed Transfers of Care 7.5% 2.2% 0.4% 0.0% 5.5% 1.4% 0.0% 0.0% 0.0% 0.0% 0.2%
1.5Meeting commitment to serve new
psychosis' cases by EIS95% 140.9% 138.8%
1.6MHMDS Data Completeness:
Identifiers97% 99.7% 99.7% 99.9% 99.9% 99.8% 99.8% 99.7% 99.8% 99.9% 99.8%
1.7MHMDS Data Completeness:
Outcomes for Patients on CPA50% 80.7% 82.0% 73.4% 81.3% 77.1% 79.7% 93.5% 79.8% 83.0% 77.9%
1.8EIP Waiting Time Proxy (Referral to
Care coordinator in 2 weeks)50% 69.2% 52.0% 0.0% 75.0% 75.0% 0.0% 60.0% 0.0% 100.0% 75.0%
Ref. Measure Target Aug-16 Jul-16 MovementNext Month
ForecastAsh
Cant &
Coast
South Kent
CoastThanet DGS Med Swale
West
Kent
2 Workforce
2.1 Sickness Absence 3.9% 3.2% 3.4% 2.5% 3.0% 0.8% 6.4% 5.9% 1.6% 5.6% 3.5%
2.2 Staff Vacancies 15% 11.3% 11.1% 13.4% 8.6% 37.9% 10.1% 3.2% 14.6% 16.9% 17.8%
2.3 Staff Turnover 14% 16.4% 16.8% 23.1% 13.1% 37.8% 3.3% 15.2% 22.2% 15.7% 18.1%
2.4 Agency Spend 5% 7.0% 6.6% 15.8% 0.5% 21.9% 7.3% 3.8% 7.1% 11.3% 12.8%
11 14
11

COMMUNITY RECOVERY SUMMARY PERFORMANCE SCORECARD
Ref. Measure Target Aug-16 Jul-16 MovementNext Month
ForecastAsh
Cant &
Coast
South Kent
CoastThanet DGS Med Swale
West
Kent
2.5Appraisals and Personal
Development plans90% 76.8% 73.9% 73.3% 78.6% 84.4% 39.2% 76.7% 77.0% 86.4% 78.0%
2.6 % mandatory training 85% 88.2% 87.6% 86.7% 86.5% 81.9% 85.5% 89.0% 89.1% 89.9% 88.6%
2.7% Eligible staff with enhanced CRB
check100% 100.0% 100.0% 100% 100% 100% 100% 100% 100% 100% 100%
Ref. Measure Target Aug-16 Jul-16 MovementNext Month
ForecastAsh
Cant &
Coast
South Kent
CoastThanet DGS Med Swale
West
Kent
3 Quality
3.1Referral to assessment within 4
weeks95% 62.0% 80.7% 66.7% 61.4% 57.4% 66.2% 62.5% 51.7% 82.8% 58.2%
3.2 18 Weeks referral to treatment 95% 85.4% 95.0% 83.3% 91.2% 79.5% 87.1% 92.6% 83.6% 96.4% 80.5%
3.3% of patients with valid CPA care
plan or plan of care95% 86.7% 87.7% 83.5% 84.7% 90.1% 84.5% 92.4% 89.1% 84.7% 84.2%
3.4 Crisis Plans (all patients) 95% 93.6% 93.9% 97.6% 98.6% 95.9% 91.2% 95.0% 87.7% 98.9% 90.6%
3.5 % of Service users in employment 13% 14.1% 13.8% 19.4% 15.4% 9.9% 9.4% 16.0% 13.9% 15.3% 16.5%
3.6% of Service Users in Settled
Accommodation75% 82.7% 82.8% 84.8% 83.4% 83.8% 85.2% 84.0% 83.7% 88.3% 78.9%
3.7% Reviews undertaken within the
maximum cluster review period95% 65.1% 64.1% 66.7% 84.8% 65.9% 58.0% 75.0% 73.8% 57.1% 51.8%
3.8% of service users assessed with
cluster assigned95% 91.8% 89.4% 93.8% 94.7% 91.7% 90.1% 91.1% 90.8% 94.1% 90.7%
3.9% inpatients with a physical health
check within 72 hours 100% 0.0% 0.0% 0.0% 0.0%
12
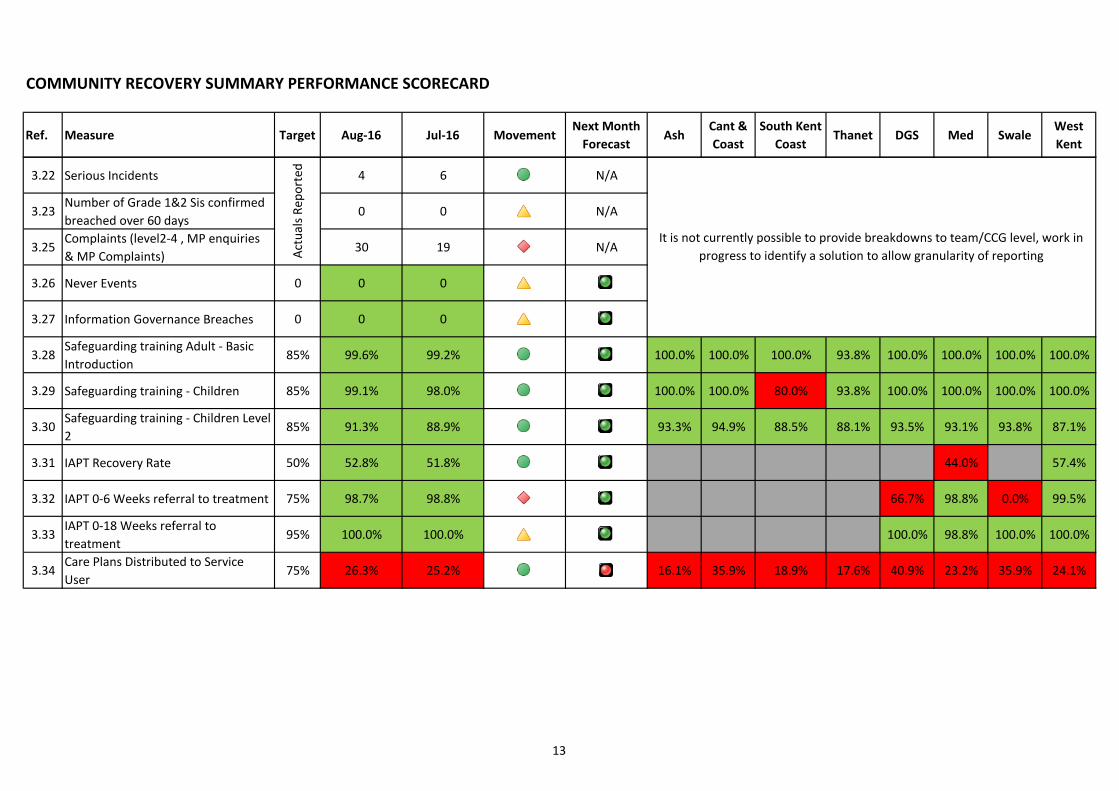
COMMUNITY RECOVERY SUMMARY PERFORMANCE SCORECARD
Ref. Measure Target Aug-16 Jul-16 MovementNext Month
ForecastAsh
Cant &
Coast
South Kent
CoastThanet DGS Med Swale
West
Kent
3.22 Serious Incidents 4 6 N/A
3.23Number of Grade 1&2 Sis confirmed
breached over 60 days0 0 N/A
3.25Complaints (level2-4 , MP enquiries
& MP Complaints)30 19 N/A
3.26 Never Events 0 0 0
3.27 Information Governance Breaches 0 0 0
3.28Safeguarding training Adult - Basic
Introduction85% 99.6% 99.2% 100.0% 100.0% 100.0% 93.8% 100.0% 100.0% 100.0% 100.0%
3.29 Safeguarding training - Children 85% 99.1% 98.0% 100.0% 100.0% 80.0% 93.8% 100.0% 100.0% 100.0% 100.0%
3.30Safeguarding training - Children Level
285% 91.3% 88.9% 93.3% 94.9% 88.5% 88.1% 93.5% 93.1% 93.8% 87.1%
3.31 IAPT Recovery Rate 50% 52.8% 51.8% 44.0% 57.4%
3.32 IAPT 0-6 Weeks referral to treatment 75% 98.7% 98.8% 66.7% 98.8% 0.0% 99.5%
3.33IAPT 0-18 Weeks referral to
treatment95% 100.0% 100.0% 100.0% 98.8% 100.0% 100.0%
3.34Care Plans Distributed to Service
User75% 26.3% 25.2% 16.1% 35.9% 18.9% 17.6% 40.9% 23.2% 35.9% 24.1%
Act
ual
s R
epo
rted
It is not currently possible to provide breakdowns to team/CCG level, work in
progress to identify a solution to allow granularity of reporting
13
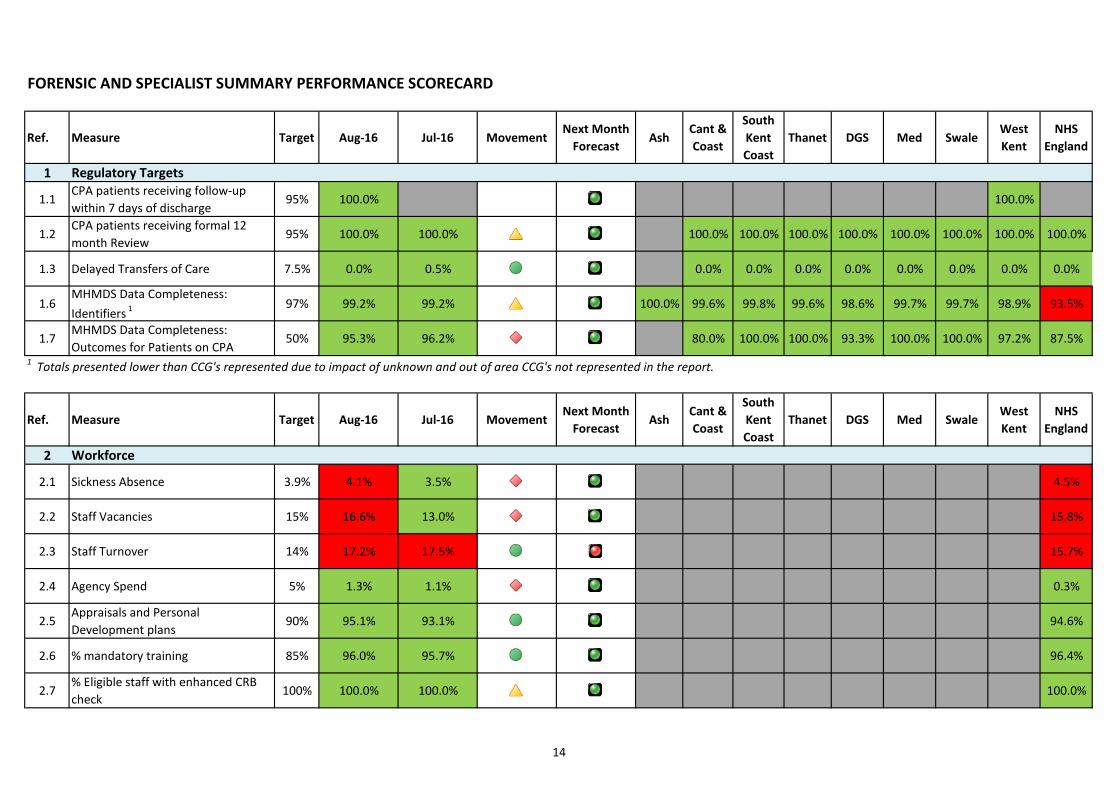
FORENSIC AND SPECIALIST SUMMARY PERFORMANCE SCORECARD
Ref. Measure Target Aug-16 Jul-16 MovementNext Month
ForecastAsh
Cant &
Coast
South
Kent
Coast
Thanet DGS Med SwaleWest
Kent
NHS
England
1 Regulatory Targets
1.1CPA patients receiving follow-up
within 7 days of discharge95% 100.0% 100.0%
1.2CPA patients receiving formal 12
month Review95% 100.0% 100.0% 100.0% 100.0% 100.0% 100.0% 100.0% 100.0% 100.0% 100.0%
1.3 Delayed Transfers of Care 7.5% 0.0% 0.5% 0.0% 0.0% 0.0% 0.0% 0.0% 0.0% 0.0% 0.0%
1.6MHMDS Data Completeness:
Identifiers 1 97% 99.2% 99.2% 100.0% 99.6% 99.8% 99.6% 98.6% 99.7% 99.7% 98.9% 93.5%
1.7MHMDS Data Completeness:
Outcomes for Patients on CPA50% 95.3% 96.2% 80.0% 100.0% 100.0% 93.3% 100.0% 100.0% 97.2% 87.5%
1 Totals presented lower than CCG's represented due to impact of unknown and out of area CCG's not represented in the report.
Ref. Measure Target Aug-16 Jul-16 MovementNext Month
ForecastAsh
Cant &
Coast
South
Kent
Coast
Thanet DGS Med SwaleWest
Kent
NHS
England
2 Workforce
2.1 Sickness Absence 3.9% 4.1% 3.5% 4.5%
2.2 Staff Vacancies 15% 16.6% 13.0% 15.8%
2.3 Staff Turnover 14% 17.2% 17.5% 15.7%
2.4 Agency Spend 5% 1.3% 1.1% 0.3%
2.5Appraisals and Personal
Development plans90% 95.1% 93.1% 94.6%
2.6 % mandatory training 85% 96.0% 95.7% 96.4%
2.7% Eligible staff with enhanced CRB
check100% 100.0% 100.0% 100.0%
14

FORENSIC AND SPECIALIST SUMMARY PERFORMANCE SCORECARD
Ref. Measure Target Aug-16 Jul-16 MovementNext Month
ForecastAsh
Cant &
Coast
South
Kent
Coast
Thanet DGS Med SwaleWest
Kent
NHS
England
3 Quality
3.1Referral to assessment within 4
weeks95% 82.0% 66.3% 66.7% 86.7% 83.8% 86.7% 90.7% 81.8% 80.8% 65.6%
3.2 18 Weeks referral to treatment 95% 76.6% 80.0% 60.0% 81.8% 77.8% 84.6% 80.0% 57.1% 66.7% 76.7%
3.3% of patients with valid CPA care
plan or plan of care95% 95.2% 91.5% 96.6% 96.9% 94.6% 91.2% 86.3% 100.0% 83.9% 98.3%
3.4 Crisis Plans (all patients) 95% 94.9% 94.0% 57.1% 100.0% 100.0% 100.0% 100.0% 50.0% 98.1%
3.21Number of unplanned absences
(AWOL and absconds on MHA)0 0 0
3.22 Serious Incidents 0 0 N/A
3.23Number of Grade 1&2 Sis confirmed
breached over 60 days0 0 N/A
3.25Complaints (level2-4 , MP enquiries
& MP Complaints)2 3 N/A
3.26 Never Events 0 0 0
3.27 Information Governance Breaches 0 0 0
3.28Safeguarding training Adult - Basic
Introduction85% 100.0% 98.7% 100.0%
3.29 Safeguarding training - Children 85% 100.0% 98.3% 100%
3.30Safeguarding training - Children
Level 285% 96.8% 95.6% 96.1%
3.34Care Plans Distributed to Service
User75% 91.4% 90.5% 80.0% 100.0% 100.0% 100.0% 75.0% 100.0% 92.2%
It is not currently possible to provide breakdowns to team/CCG level, work in
progress to identify a solution to allow granularity of reporting
Act
ual
s R
epo
rted
15

OLDER PERSONS PERFORMANCE SCORECARD
Ref. Measure Target Aug-16 Jul-16 MovementNext Month
ForecastAsh
Cant &
Coast
South
Kent
Coast
Thanet DGS Med SwaleWest
Kent
1 Regulatory Targets
1.1CPA patients receiving follow-up
within 7 days of discharge95% 100.0% 96.6% 100.0% 100.0% 100.0% 100.0% 100.0% 100.0% 100.0%
1.2CPA patients receiving formal 12
month Review95% 94.4% 96.2% 100.0% 100.0% 97.6% 94.1% 90.9% 100.0% 87.9% 93.5%
1.3 Delayed Transfers of Care 7.5% 9.3% 9.6% 10.4% 6.5% 11.3% 16.6% 4.9% 20.5% 2.6% 15.0%
1.6MHMDS Data Completeness:
Identifiers97% 99.88% 99.86% 99.9% 99.9% 99.9% 99.9% 99.7% 99.9% 99.9% 99.8%
1.7MHMDS Data Completeness:
Outcomes for Patients on CPA50% 90.0% 90.2% 96.7% 87.5% 93.5% 95.2% 75.4% 92.6% 68.7% 97.1%
Ref. Measure Target Aug-16 Jul-16 MovementNext Month
ForecastAsh
Cant &
Coast
South
Kent
Coast
Thanet DGS Med SwaleWest
Kent
2 Workforce
2.1 Sickness Absence 3.9% 5.7% 5.8% 10.5% 5.9% 2.0% 1.2% 9.4% 9.9% 6.9% 7.4%
2.2 Staff Vacancies 15% 4.0% 4.6% 4.6% 0.3% 4.7% 9.2% 5.6% 12.5% 6.1%
2.3 Staff Turnover 14% 13.6% 13.0% 12.2% 17.3% 7.5% 14.0% 18.9% 6.9% 14.9% 10.8%
2.4 Agency Spend 5% 7.7% 7.7% 0.0% 10.6% 0.0% 9.2% 9.4% 2.3% 11.7% 7.1%
2.5Appraisals and Personal
Development plans90% 79.6% 75.8% 100.0% 91.1% 90.6% 77.2% 74.2% 73.7% 65.9% 86.1%
16
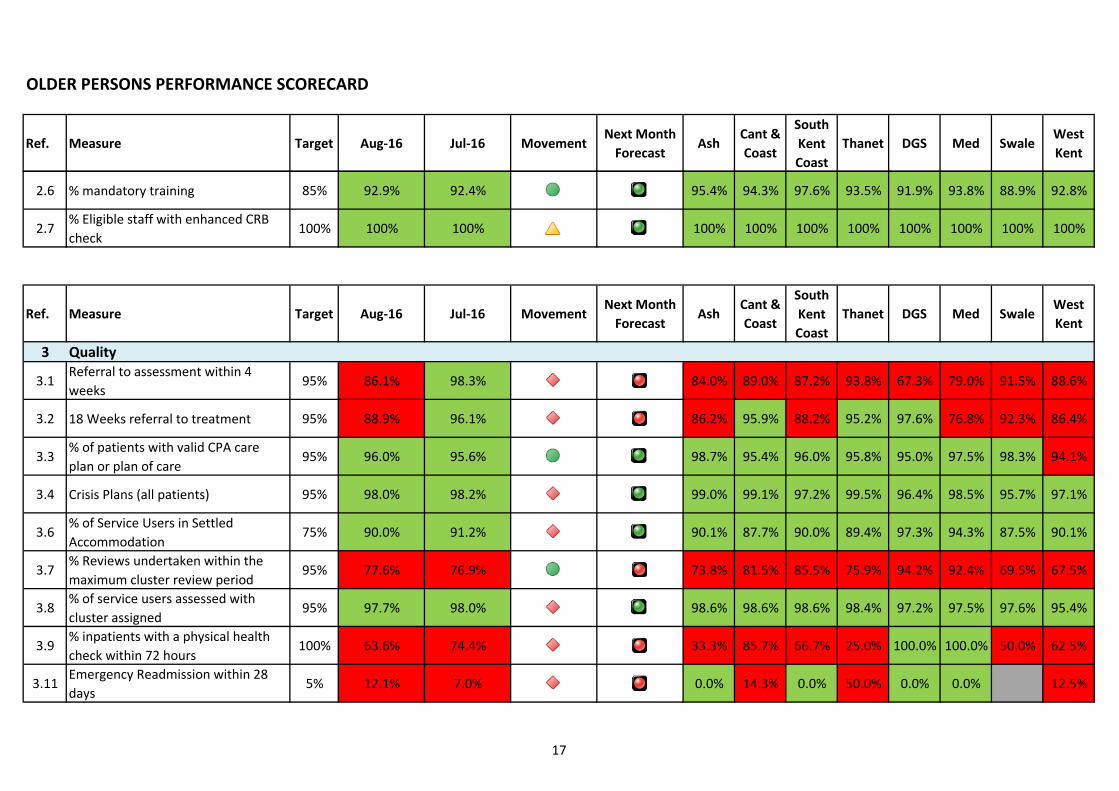
OLDER PERSONS PERFORMANCE SCORECARD
Ref. Measure Target Aug-16 Jul-16 MovementNext Month
ForecastAsh
Cant &
Coast
South
Kent
Coast
Thanet DGS Med SwaleWest
Kent
2.6 % mandatory training 85% 92.9% 92.4% 95.4% 94.3% 97.6% 93.5% 91.9% 93.8% 88.9% 92.8%
2.7% Eligible staff with enhanced CRB
check100% 100% 100% 100% 100% 100% 100% 100% 100% 100% 100%
Ref. Measure Target Aug-16 Jul-16 MovementNext Month
ForecastAsh
Cant &
Coast
South
Kent
Coast
Thanet DGS Med SwaleWest
Kent
3 Quality
3.1Referral to assessment within 4
weeks95% 86.1% 98.3% 84.0% 89.0% 87.2% 93.8% 67.3% 79.0% 91.5% 88.6%
3.2 18 Weeks referral to treatment 95% 88.9% 96.1% 86.2% 95.9% 88.2% 95.2% 97.6% 76.8% 92.3% 86.4%
3.3% of patients with valid CPA care
plan or plan of care95% 96.0% 95.6% 98.7% 95.4% 96.0% 95.8% 95.0% 97.5% 98.3% 94.1%
3.4 Crisis Plans (all patients) 95% 98.0% 98.2% 99.0% 99.1% 97.2% 99.5% 96.4% 98.5% 95.7% 97.1%
3.6% of Service Users in Settled
Accommodation75% 90.0% 91.2% 90.1% 87.7% 90.0% 89.4% 97.3% 94.3% 87.5% 90.1%
3.7% Reviews undertaken within the
maximum cluster review period95% 77.6% 76.9% 73.8% 81.5% 85.5% 75.9% 94.2% 92.4% 69.5% 67.5%
3.8% of service users assessed with
cluster assigned95% 97.7% 98.0% 98.6% 98.6% 98.6% 98.4% 97.2% 97.5% 97.6% 95.4%
3.9% inpatients with a physical health
check within 72 hours 100% 63.6% 74.4% 33.3% 85.7% 66.7% 25.0% 100.0% 100.0% 50.0% 62.5%
3.11Emergency Readmission within 28
days5% 12.1% 7.0% 0.0% 14.3% 0.0% 50.0% 0.0% 0.0% 12.5%
17

OLDER PERSONS PERFORMANCE SCORECARD
Ref. Measure Target Aug-16 Jul-16 MovementNext Month
ForecastAsh
Cant &
Coast
South
Kent
Coast
Thanet DGS Med SwaleWest
Kent
3.18 Average Length of stay(Older Adults) 52 86.8 107.7 34.0 95.1 257.0 52.4 30.6 53.0 98.5
3.19Bed Occupancy: Internal Usage v's
Internal Capacity (OP Acute)96.0% 94.6% N/A
3.20Bed Occupancy: Internal & External
Usage v's Internal Capacity (OP 96.1% 97.3% N/A
3.21Number of unplanned absences
(AWOL and absconds on MHA)0 0 0
3.22 Serious Incidents 2 3 N/A
3.23Number of Grade 1&2 Sis confirmed
breached over 60 days0 0 N/A
3.25Complaints (level2-4 , MP enquiries
& MP Complaints)2 2 N/A
3.26 Never Events 0 0 0
3.27 Information Governance Breaches 0 0 0
3.28Safeguarding training Adult - Basic
Introduction85% 98.8% 98.5% 100.0% 100.0% 100.0% 100.0% 100.0% 100.0% 96.4% 100.0%
3.29 Safeguarding training - Children 85% 98.5% 98.2% 100.0% 100.0% 100.0% 100.0% 100.0% 100.0% 96.4% 100.0%
3.30Safeguarding training - Children Level
285% 96.0% 96.6% 94.1% 96.9% 100.0% 94.6% 94.7% 100.0% 94.7% 95.0%
3.34Care Plans Distributed to Service
User75% 51.7% 46.6% 45.7% 49.9% 58.0% 50.3% 55.1% 45.8% 45.0% 56.6%
Act
ual
s R
epo
rted
Act
ual
s
Rep
ort
ed
It is not currently possible to provide breakdowns to team/CCG level,
work in progress to identify a solution to allow granularity of
reporting
18